Embed Size (px)
Citation preview
Molecular and Biochemical Studies of Astaxanthin Biosynthesis in
Haematococcus pluvialis
The thesis submitted to the Department of Studies in Biotechnology of
University of Mysore in fulfillment of the requirements for the degree of
Doctor of Philosophy in
BIOTECHNOLOGY
By
R. Vidhyavathi, M.Sc. (Agri.)
Under the supervision of
Dr. R. Sarada Scientist
Plant Cell Biotechnology Department
CENTRAL FOOD TECHNOLOGICAL RESEARCH INSTITUTE (A constituent Laboratory of Council of Scientific and Industrial Research, New Delhi)
MYSORE - 570 020, INDIA
December 2008

Dedicated….. To My Family,Friends & Guide
R. Vidhyavathi Research Fellow Department of Plant Cell Biotechnology CFTRI, Mysore-570 020
DECLARATION
I, R. Vidhyavathi, certify that this thesis entitled “Molecular and biochemical
studies of astaxanthin biosynthesis in Haematococcus pluvialis” is the result of
research work done by me under the supervision of Dr. R. Sarada at Plant Cell
Biotechnology Department of Central Food Technological Research Institute,
Mysore- 570 020, India during the period 2003 - 2008. I am submitting this thesis for
possible award of Doctor of Philosophy (Ph.D.) degree in BIOTECHNOLOGY of
the University of Mysore.
I further certify that this thesis has not been submitted by me for award of any other
degree / diploma of this or any other University.
Place : Mysore R.Vidhyavathi Date : (Candidate)
Dr. R. Sarada Scientist Department of Plant Cell Biotechnology E-mail: [email protected]
CERTIFICATE
This is to certify that the thesis entitled “Molecular and biochemical studies
of astaxanthin biosynthesis in Haematococcus pluvialis” submitted by
Ms. R. Vidhyavathi to the University of Mysore for the award of the degree of
Doctor of Philosophy in Biotechnology is the result of research work carried out by
her under my guidance in Plant Cell Biotechnology Department, Central Food
Technological Research Institute, Mysore during the period September 2003 to
December 2008.
Place: Mysore R. Sarada Date: (Research Supervisor)
Abstract Haematococcus pluvialis is a commercially promising source of astaxanthin (3,3'-
dihydroxy-β,β-carotene-4,4'-dione) which is mainly used as a pigmentation source in
the aquaculture and poultry industries. The present work is focused on molecular and
biochemical studies of astaxanthin biosynthesis in H. pluvialis. Nutrient stress
(modified autotrophic medium containing 1/10th of N and P) and higher light intensity
(60 µmol m-2 s-1) in combination with 17.1 mM NaCl / 4.4 mM sodium acetate
enhanced total carotenoid and total astaxanthin content to 32.0 and 24.5 mg g–1 of dry
biomass, respectively. Expression of carotenoid biosynthetic genes revealed that they
are up-regulated and maximum transcript levels of phytoene synthase, phytoene
desaturase, lycopene cyclase, -carotene ketolase and -carotene hydroxylase genes
were found to be 158–277, 5–9, 470–674, 28–40, and 451–673-fold higher,
respectively, than that in green vegetative cells under stress conditions. The
maximum content of astaxanthin recorded in cells grown in medium with sodium
acetate and NaCl/sodium acetate correlated with the expression profile of the
astaxanthin biosynthetic genes. Both general carotenogenesis and secondary
carotenoid induction were regulated at transcriptional and cytoplasmic translational
levels. This study also suggested a possible involvement of acetate in the post-
transcriptional modifications of carotenoid genes. Experiments using inhibitors of
carotenoid and fatty acid synthesis indicated the involvement of other regulatory
factors besides transcriptional regulation of carotenogenesis in H. pluvialis.
Studies using photosynthetic inhibitors showed that the expression of
photosynthetic genes, cabL1818, lhcbm9, psaB and rbcL were under redox control of
plastoquinone pool and atpB gene expression may be regulated at cytochrome b6/f
complex. The nuclear genes cabL1818 and lhcbm9 are coding for the chlorophyll a/b
binding protein L1818 and major light-harvesting complex II m9 protein respectively.
The chloroplast encoded psaB gene codes for PSI reaction centre protein PsaB. The
chloroplast genes rbcL and atpB are coding for large subunit of Ribulose bisphosphate
carboxylase oxygenase (Rubisco) and ATP synthase -subunit respectively.
Expression of all five photosynthetic genes studied was regulated at transcriptional
and cytoplasmic translational levels, and their expressions were reduced by
norflurazon induced photo oxidative stress. Acetate modulates the high light induced
expression of photosynthetic genes and it depends on redox state of cytochrome b6/f
complex and cytoplasmic protein synthesis.
The genes differentially expressed under the stress conditions were analysed
by mRNA differential display RT PCR and 34 differentially expressed transcripts
have been identified. These transcripts are having homology to molecules related to
general metabolism, photosynthesis, carotenoid synthesis, lipid synthesis, tetrapyrrole
synthesis, transporter proteins, defense signaling, genetic information processing and
unknown function or shared no apparent homology to any expressed sequences in the
GenBank/EMBL databases. A partial transcript homologue to psaB gene coding D1
protein of photosystem II has been identified for the first time in H. pluvialis. LCY
and BKT activities were found to increase under stress condition. Maximum activity
of BKT was observed in lipid globules of stress induced cultures. Pigment
composition of cell fractions revealed that chloroplast fraction is having lutein, β-
carotene and chlorophyll as pigments while lipid fraction is having β-carotene,
astaxanthin, canthaxanthin and echinenone as pigments. Under the influence of HL,
exposure of cells to nutrient deficiency enhanced carotenoid accumulation which was
further enhanced by exposure to CO2 enriched environment and/or NaCl and sodium
acetate addition. Changing the carbonate buffer in the lower compartment of 2-tier
vessel to provide constant CO2 environment was found to be efficient in enhancing
carotenoid content. Influence of phytohormones such as salicylic acid and methyl
jasmonate on pigment production and antioxidant revealed that at lower
concentrations these phytohormones could be used for elicitation of secondary
carotenoid production.
Influence of few cultural parameters and temperature treatments on
regeneration efficiency of red cysts along with changes in pigment profile and
expression of carotenogenic genes during regeneration were investigated.
Regeneration efficiency has been improved by incubating less aged cyst cells in
medium containing ammonium carbonate, 16:8 light dark cycles with light intensity
of 30 µmol m-2 s-1. During regeneration there was decrease in total astaxanthin, total
carotenoids and carotenoid to chlorophyll ratio, and increase in -carotene, lutein,
total chlorophyll and chlorophyll a to b ratio. Expression analysis of carotenogenic
genes during regeneration of H. pluvialis cysts showed these transcripts were
transiently up-regulated upon transfer to favorable conditions and later reached basal

expression levels of green motile vegetative cells. In addition, this is the first report of
detection of carotenogenic gene transcripts in red cysts and their differential
expression during regeneration. It is evident from the results that acetate has a role in
regulation of both carotenogenic and photosynthetic gene expression. The results
from the present studies will be helpful in understanding the regulation of
carotenogenesis and metabolic engineering of carotenoid pathway.
Acknowledgements
I wish to offer my sincere gratitude and appreciation to Dr. R. Sarada, supervisor for my doctoral research, who’s ever encouraging and highly positive approach has influenced and benefited me a lot. I would also like to thank her for helpful guidance and invaluable advice for my research,
I wish to express my heartfelt gratitude to Dr. V. Prakash, Director, CFTRI, Mysore, for granting me the opportunity to utilize the excellent facilities available at CFTRI and submit the results of my work in the form of a thesis.
I am ever grateful to Dr. G.A. Ravishankar, Head, Department of Plant Cell Biotechnology, CFTRI, for his constant encouragement and support during the pursuit of my research work.
I wish to extend my gratitude to Dr. N. Bhagyalakshmi and Dr. M.S. Narayan a lot by way of scientific discussions, who were more than willing to lend their helping hand during the needy hours. I sincerely thank Dr. B.P.R. Narasimha Rao for his constant encouragement and valuable suggestions. Dr. Richard Joseph for his kind help and valuable suggestions.
My special thanks to the staff of PCBT Dr. M. Mahadevaswamy, Dr. Arun Chandrasekar, Dr. T. Rajasekharan, Dr. P. Giridhar, Srinivas Yella, Karuna, Shivanna, Palaksha, Shashi and Channe Gowda who have always been so helpful. I enjoyed the friendly environment at PCBT which is because of all these senior colleagues.
Deepest thanks to all my dear seniors, colleagues and dear friends, Brinda, Sandu, Raju, Vinod, Murthy, Danny, Guru, Sreedhar, Lokesh, Kumudha, Kathir, Anila, Ganapati, Gurudatt, Padma, Kavitha, Shibin, Rama, Mahe, Harsha, Shakthi, Ramesh, MIK, Sridevi and many others. I would like to thank all my friends in IHM especially Kumaresan, Desai, Ravi, Gangadhar and Reddy for their moral support, affection and encouragement.
I acknowledge the timely help and cooperation of staff of supporting departments- Stores and Purchase section, CIFS, FOSTIS, HRD, Photography, Computer Center and administration.
I sincerely acknowledge the Council of Scientific and Industrial Research (CSIR), New Delhi for the research fellowship, which enabled me to undertake the research as career.
On a personal note, I wish to express my heartfelt thanks to my Parents for their love, guidance and for encouraging me to take research as career and for giving me just the right amount of freedom and responsibility. I thank my brother, Karthi and all other family members for their boundless love, encouragement and support. Without their moral support and continuous encouragement, it would not have been possible to accomplish the task. Lastly, but most importantly I thank my dear husband Venki for his love, compassion, understanding and support.
To all others, who had helped me knowing or unknowing wherever they are, goes my thanks and with them the assurance that their assistance not be forgotten.
(R.Vidhyavathi)
CONTENTS
Chapters Topic Page no.
List of tables i List of figures ii-iii List of Abbreviations iv-v
Introduction G1 Introduction 1 G2 Scope and objectives of the present investigation 1 Chapter I Review of Literature
1.0. Carotenoids 3 1.1. Plant carotenoids 4 1.2. Carotenoids in animals 7 1.3. Carotenoids from microalgae 8 1.4. Astaxanthin 9 1.5. The advantage of natural astaxanthin over synthetic
astaxanthin 10
1.6. Sources of astaxanthin 10 1.7. Biotechnological significance of astaxanthin 12 1.7.1. Chemistry of astaxanthin 12 1.7.2. Biological functions of astaxanthin 12 1.7.3. Industrial applications of astaxanthin 14 1.8. Haematococcus pluvialis 15 1.8.1. Occurrence and distribution of Haematococcus pluvialis 15 1.8.2. Cellular morphology, ultrastructure, physiology and lifecycle
of Haematococcus pluvialis 15
1.8.3. Stress conditions and accumulation of astaxanthin 18 1.8.4. Physiological and biochemical changes during astaxanthin
accumulation 19
1.8.5. Biosynthesis of astaxanthin in H. pluvialis 21 1.8.6. Regulation of carotenogenesis in H. pluvialis 23 1.8.7. Differential expression of genes and proteins under conditions
inducing secondary carotenoid production 25
1.9. Metabolic engineering of astaxanthin biosynthesis 27
Chapter II Expression of carotenoid biosynthetic genes and carotenoid accumulation
Summary 30 2.1. Introduction 31 2.2. Materials and Methods 33 2.2.1. Green alga Haematococcus pluvialis 33 2.2.2. Maintenance of stock culture 33 2.2.3. Growth of H. pluvialis 34 2.2.4. Stress conditions and inhibitors 34 2.2.5. Growth measurement 35 2.2.5.1. Cell number 35 2.2.5.2. Dry weight 35
2.2.6. Extraction and estimation of pigments 35 2.2.6.1. Pigment extraction 35 2.2.6.2. Spectrophotometric estimation of pigments 35 2.2.6.3. Separation of carotenoids by thin-layer chromatography (TLC) 36 2.2.6.4. High Performance Liquid Chromatograph (HPLC) of pigments 36 2.2.7. RNA isolation and Reverse Transcription-Polymerase Chain
Reaction (RT-PCR) 37
2.2.8. Experimental design and data analysis 38 2.3. Results 39 2.3.1. Haematococcus pluvialis growth under nutrient stress and
continuous high light 39
2.3.2. Changes in pigment profile during stress induction 40 2.3.3. Expression analysis of carotenoid genes during stress
induction 43
2.3.4. Effect of transcriptional and translational inhibitors on carotenoid formation and carotenoid biosynthesis genes expression under nutrient stress conditions
44
2.4. Discussion 50
Chapter III Regulation of carotenogenic and photosynthetic genes expression
Summary 53 3.1. Introduction 54 3.2. Materials and methods 58 3.2.1. Algal culture, growth and stress conditions 58 3.2.2. Inhibitors 58 3.2.3. Growth and pigment analyses 58 3.2.4. Chlorophyll fluorescence measurements 59 3.2.5. Reverse transcription-polymerase chain reaction (RT-PCR) 59 3.2.6. Experimental design and data analysis 60 3.3. Results 61 3.3.1. Analysis of carotenoids biosynthetic genes expression 61 3.3.1.1. Changes in pigments under the influence of carotenoid and
fatty acid synthesis inhibitors 61
3.3.1.2. Changes in carotenoid synthesis genes expression 62 3.3.2. Analysis of photosynthetic genes expression 66 3.3.2.1. Changes in pigment profile and chlorophyll fluorescence under
stress conditions 66
3.3.2.2. Differential expression of photosynthetic genes under stress conditions
67
3.3.2.3. Expression of photosynthetic genes and pigment production under stress conditions in the presence of photosynthetic inhibitors
68
3.3.2.4. Influence of transcriptional, translational and carotenoid synthesis inhibitors on photosynthetic genes expression and pigment production
69
3.3.2.5. Acetate and high light induced changes in expression of photosynthetic genes
72
3.4. Discussion 73 3.4.1. Regulation of carotenoid biosynthetic genes expression 73
3.4.2. Regulation of photosynthetic genes expression 75 Chapter IV Molecular and biochemical changes associated with
carotenogenesis
Summary 81 4.1. Introduction 82 4.2. Materials and Methods 84 4.2.1. Differential display of light regulated transcripts in H. pluvialis 84 4.2.1.1. Culture growth 84 4.2.1.2. Growth and pigment analyses 84 4.2.1.3. RNA isolation and removal of genomic DNA contamination 84 4.2.1.4. mRNA differential display 84 4.2.1.5. Sequencing and homology search 86 4.2.1.6. RNA dot blot 86 4.2.1.7. Northern blot 87 4.2.1.8. Reverse transcription-polymerase chain reaction (RT-PCR) 88 4.2.2. Biochemical changes associated with carotenogenesis 88 4.2.2.1. Carotenoid enzyme activities 88 4.2.2.1.1. Culture growth 88 4.2.2.1.2. Determination of β-carotene ketolase activity 88 4.2.2.1.3. Determination of lycopene cyclase activity 89 4.2.2.2. Carotenoid content of H. pluvialis cells and cell fractions 90 4.2.2.3. Qualitative analysis of proteins at different stages of
H. pluvialis 90
4.2.2.4. Antioxidant enzyme activities 90 4.2.2.4.1. Preparation of extracts for enzyme assays 90 4.2.2.4.2. Enzyme assays 90 4.2.3. Influence of CO2 enrichment on carotenoid accumulation 91 4.2.3.1. Algal culture growth 91 4.2.3.2. Growth and pigment analyses 91 4.2.4. Influence of salicylic acid and methyl jasmonate on
antioxidant systems of H. pluvialis 92
4.2.4.1. Culture conditions 92 4.2.4.2. Growth and pigment analyses 92 4.2.4.3. Antioxidant enzyme activities 92 4.2.5. Experimental design and data analysis 92 4.3. Results 93 4.3.1. Differential display of light regulated transcripts in H. pluvialis 93 4.3.1.1. Pigment profile of H. pluvialis under stress conditions 93 4.3.1.2. Identification of differentially expressed transcripts under
stress conditions 93
4.3.1.3. Confirmation of a set of high light stress regulated genes 97 4.3.1.4. Differential expression of stress regulated genes 97 4.3.2. Biochemical changes associated with carotenogenesis in
H. pluvialis 99
4.3.2.1. Carotenoid enzyme activities 99 4.3.2.2. Carotenoid content of H. pluvialis cells and cell fractions 100 4.3.2.3. Qualitative analysis of proteins at different stages of
H. pluvialis 102
4.3.2.4. Antioxidant enzyme activities 102
4.3.2.5. Influence of CO2 enrichment on carotenoid accumulation 103 4.3.2.6. Influence of salicylic acid and methyl jasmonate on
antioxidant systems of H. pluvialis 105
4.3.2.6.1. Effect of salicylic acid and methyl jasmonate on the growth and encystment
105
4.3.2.6.2. Effect of salicylic acid and methyl jasmonate on pigments 107 4.3.2.6.3. Effect of salicylic acid and methyl jasmonate on the activities
of antioxidant enzymes 109
4.4. Discussion 111 4.4.1. Differential display of light regulated transcripts in H. pluvialis 111 4.4.2. Biochemical changes associated with carotenogenesis in
H. pluvialis 114
4.4.3. CO2 enrichment 114 4.4.4. Influence of salicylic acid and methyl jasmonate on
antioxidant systems of H. pluvialis 115
Chapter V Expression of carotenogenic genes and associated changes in pigment profile during regeneration of Haematococcus pluvialis cysts
Summary 117 5.1. Introduction 118 5.2. Materials and methods 119 5.2.1. Algal culture conditions 119 5.2.2. Effect of N source, light cycle, age of cyst cells, and
temperature treatment on regeneration 119
5.2.3. Growth and pigment changes during regeneration 119 5.2.4. Extractability of carotenoids 119 5.2.5. RNA isolation and Reverse Transcription-Polymerase Chain
Reaction (RT-PCR) 120
5.2.6. Experimental design and data analysis 120 5.3. Results 121 5.3.1. Regeneration efficiency of Haematococcus cysts under the
influence of cultural parameters and temperature treatments 121
5.3.2. Growth and pigment changes during regeneration 122 5.3.3. Extractability of carotenoids 126 5.3.4. Changes in transcripts of carotenogenic genes during
regeneration 126
5.4. Discussion 128 Chapter VI Summary and Conclusions 130-137
Bibliography 138-159
Publications 160-161
Appendix 162-165
i
LIST OF TABLES
Table No. Title Page No.
1.1. Microalgal carotenoids of biotechnological importance 9 1.2. Natural sources of astaxanthin 11 2.1. Composition of media for H. pluvialis growth 33 2.2. Composition of trace elements for H. pluvialis growth 34 2.3. Specific primers, annealing temperatures, and total
numbers of amplification cycles used for RT-PCR 37
3.1. Gene-specific primers and annealing temperatures used for RT–PCR 60
3.2. Pigment contents under the influence of carotenoid and fatty acid synthesis inhibitors 61
3.3. Pigment and chlorophyll fluorescence characteristics under stress conditions 66
3.4. Pigment contents and biomass under the influence of inhibitors 70
4.1. Different anchored Oligo dT primers and arbitrary primers used for differential display 85
4.2. Oligonucleotide primer sequences and PCR conditions used for the confirmation of differentially displayed products with quantitative RT-PCR
87
4.3. Pigment contents of H. pluvialis cells under stress conditions 93
4.4. Sequence homologies of the clones detected by Differential Display 95
4.5. Clones showing unknown and hypothetical proteins and no similarity detected by Differential Display 96
4.6. Lycopene cyclase activity of H. pluvialis cells 99 4.7. β–carotene ketolase activity of H. pluvialis cells 100 4.8. Effects of salicylic acid and methyl jasmonate on growth
and encystment of H. pluvialis 106
5.1. Influence of nitrogen source, light dark cycle and age of cyst cells on regeneration 121
5.2. Influence of temperature treatments on regeneration 122
ii
LIST OF FIGURES
Figure No. Title Page No.
1.1. Isoprenoid biosynthesis pathways in the plant cell 6 1.2. Overview of the biosynthesis of carotenoids in plastids 7 1.3. Structure of astaxanthin 10 1.4. Life cycle of H. pluvialis 18 1.5. Biosynthetic pathway of astaxanthin in H pluvialis 22 2.1. Biomass and pigment contents of H. pluvialis cultures
under stress conditions. 39
2.2. Spectrophotometric analysis of carotenoid extracts from H. pluvialis
40
2.3. TLC analysis of carotenoid extracts from H. pluvialis 40 2.4. HPLC profile of carotenoid extracts from H. pluvialis 41 2.5. Photodiode array spectra of carotenoids 42 2.6. Expression of carotenoid biosynthetic genes in H. pluvialis
under stress conditions 45
2.7. Changes in total carotenoid content and total astaxanthin content of H. pluvialis cells under the influence of transcriptional and translational inhibitors
46
2.8. Changes in total carotenoid content and total astaxanthin content of H. pluvialis cells under the influence of transcriptional and translational inhibitors
47
2.9. Influence of transcriptional and translational inhibitors upon the expression of carotenoid biosynthesis genes
48
2.10. Influence of actinomycin D on the expression of carotenoid biosynthesis genes
49
3.1. Factors in photosynthetic redox chemistry that influence photosynthesis gene expression
57
3.2. Simplified astaxanthin biosynthetic pathway showing enzymes of carotenoid biosynthesis and sites of inhibitors action
63
3.3. Analysis of influence of carotenoid and fatty acid synthesis inhibitors on carotenogenic genes using RT-PCR
64
3.4. Influence of carotenoid and fatty acid synthesis inhibitors upon carotenogenic genes using RT-PCR in NS condition
64
3.5. Effect of ND upon carotenogenic genes expression in comparison with NS using RT-PCR
65
3.6. Influence of carotenoid and fatty acid synthesis inhibitors upon carotenogenic genes using RT-PCR in ND condition in comparison with NS
65
3.7. Expression of photosynthetic genes in H. pluvialis under stress conditions
67
3.8. Influence of photosynthetic electron transport inhibitors, DCMU and DBMIB upon the expression of photosynthetic genes under stress conditions
69
3.9. Influence of transcriptional, translational and carotenoids synthesis inhibitors upon the expression of photosynthetic genes under stress conditions
70
iii
3.10. Influence of photosynthetic electron transport inhibitors, DCMU and DBMIB upon the expression of photosynthetic genes under stress induction by sodium acetate and high light
71
3.11. Influence of transcriptional and translational inhibitors on the expression of photosynthetic genes under stress induction by sodium acetate and high light
71
4.1. Differential display of mRNAs from green vegetative and high light exposed cells of H. pluvialis
94
4.2. RNA dot blot and northern blot analysis of differentially expressed cDNA clone H97.1 isolated from differential display
97
4.3. Differential expression of stress regulated transcripts identified by DD RT-PCR
98
4.4. Pigment composition of chloroplast fraction of H. pluvialis cells
100
4.5. Pigment composition of lipid fraction of H. pluvialis cells 101 4.6. Composition of total astaxanthin of H. pluvialis cells 101 4.7. Total protein content of H. pluvialis cultures 102 4.8. Ascorbic peroxidase activity of H. pluvialis cells 102 4.9. Superoxide dismutase activity of H. pluvialis cells 103 4.10. Effect of CO2 enrichment and salinity on growth and
carotenoid production of H. pluvialis under high light condition for 10 days
103
4.11. Effect of CO2 enrichment on growth and carotenoid production of H. pluvialis under high light and salinity stress for 10 days
104
4.12. Effect of CO2 enrichment on growth and carotenoid production of H. pluvialis under high light and salinity stress for 20 days
104
4.13. Effects of salicylic acid and methyl jasmonate on pigment contents of H. pluvialis under low light and high light intensity
108
4.14. HPLC separation of carotenoids extracted from H. pluvialis cells exposed to high light for 8 days
108
4.15. Effects of salicylic acid and methyl jasmonate on composition of carotenoids of H. pluvialis under low light and high light intensity
109
4.16. Salicylic acid and methyl jasmonate induced changes in activities of superoxide dismutase, catalase and ascorbate peroxidase in H. pluvialis cells exposed to low light and high light
110
5.1. Growth changes during regeneration of H. pluvialis cysts 123 5.2. Pigment changes during regeneration of H. pluvialis cysts 124 5.3. Changes in carotenoid composition during regeneration of
H. pluvialis cysts 125
5.4. Extractability of carotenoids during regeneration of H. pluvialis cysts
126
5.5. Transcripts of carotenogenic genes were up-regulated transiently during regeneration of H. pluvialis cysts
127
iv
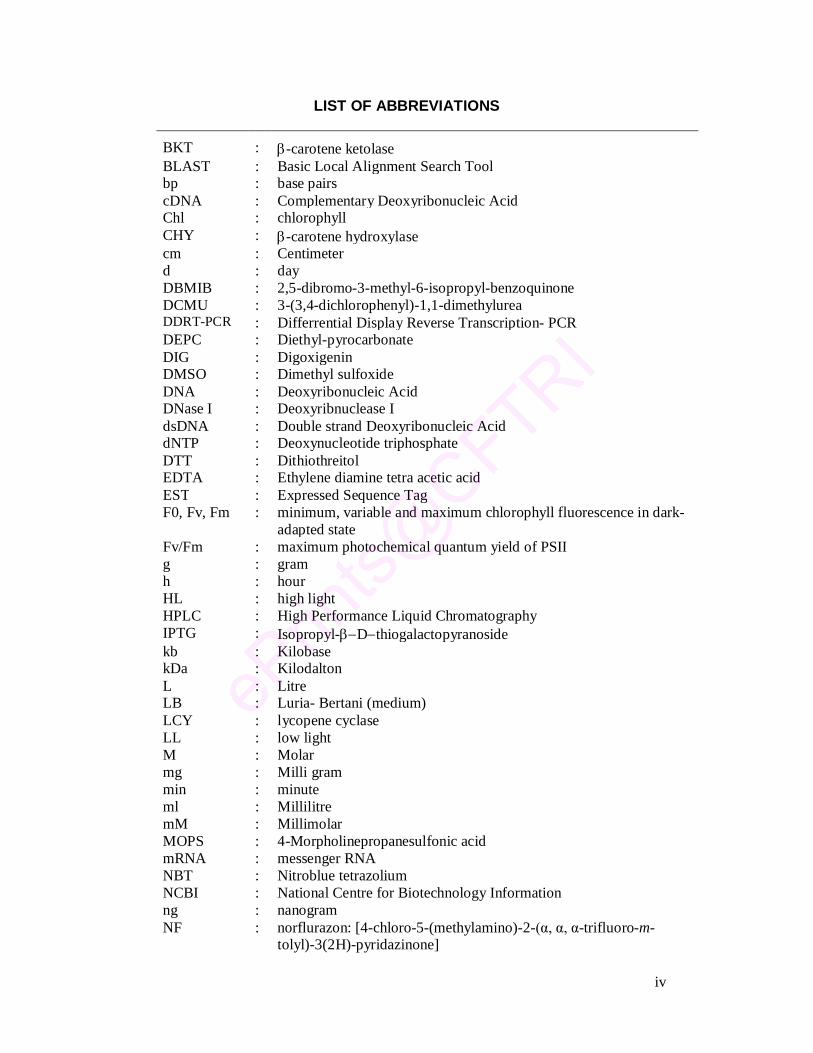
LIST OF ABBREVIATIONS
BKT : -carotene ketolase BLAST : Basic Local Alignment Search Tool bp : base pairs cDNA : Complementary Deoxyribonucleic Acid Chl : chlorophyll CHY : -carotene hydroxylase cm : Centimeter d : day DBMIB : 2,5-dibromo-3-methyl-6-isopropyl-benzoquinone DCMU : 3-(3,4-dichlorophenyl)-1,1-dimethylurea DDRT-PCR : Differrential Display Reverse Transcription- PCR DEPC : Diethyl-pyrocarbonate DIG : Digoxigenin DMSO : Dimethyl sulfoxide DNA : Deoxyribonucleic Acid DNase I : Deoxyribnuclease I dsDNA : Double strand Deoxyribonucleic Acid dNTP : Deoxynucleotide triphosphate DTT : Dithiothreitol EDTA : Ethylene diamine tetra acetic acid EST : Expressed Sequence Tag F0, Fv, Fm : minimum, variable and maximum chlorophyll fluorescence in dark-
adapted state Fv/Fm : maximum photochemical quantum yield of PSII g : gram h : hour HL : high light HPLC : High Performance Liquid Chromatography IPTG : Isopropyl-Dthiogalactopyranoside kb : Kilobase kDa : Kilodalton L : Litre LB : Luria- Bertani (medium) LCY : lycopene cyclase LL : low light M : Molar mg : Milli gram min : minute ml : Millilitre mM : Millimolar MOPS : 4-Morpholinepropanesulfonic acid mRNA : messenger RNA NBT : Nitroblue tetrazolium NCBI : National Centre for Biotechnology Information ng : nanogram NF : norflurazon: [4-chloro-5-(methylamino)-2-(α, α, α-trifluoro-m-
tolyl)-3(2H)-pyridazinone]
v
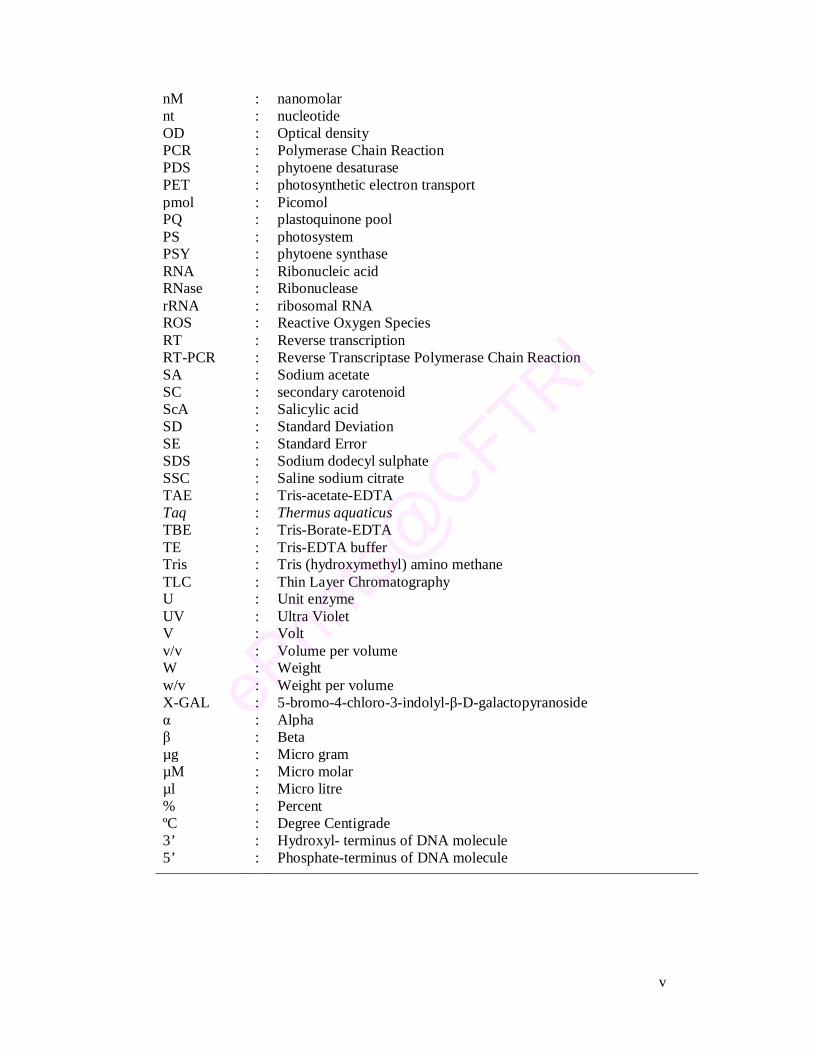
nM : nanomolar nt : nucleotide OD : Optical density PCR : Polymerase Chain Reaction PDS : phytoene desaturase PET : photosynthetic electron transport pmol : Picomol PQ : plastoquinone pool PS : photosystem PSY : phytoene synthase RNA : Ribonucleic acid RNase : Ribonuclease rRNA : ribosomal RNA ROS : Reactive Oxygen Species RT : Reverse transcription RT-PCR : Reverse Transcriptase Polymerase Chain Reaction SA : Sodium acetate SC : secondary carotenoid ScA : Salicylic acid SD : Standard Deviation SE : Standard Error SDS : Sodium dodecyl sulphate SSC : Saline sodium citrate TAE : Tris-acetate-EDTA Taq : Thermus aquaticus TBE : Tris-Borate-EDTA TE : Tris-EDTA buffer Tris : Tris (hydroxymethyl) amino methane TLC : Thin Layer Chromatography U : Unit enzyme UV : Ultra Violet V : Volt v/v : Volume per volume W : Weight w/v : Weight per volume X-GAL : 5-bromo-4-chloro-3-indolyl-β-D-galactopyranoside α : Alpha β : Beta µg : Micro gram µM : Micro molar µl : Micro litre % : Percent ºC : Degree Centigrade 3’ : Hydroxyl- terminus of DNA molecule 5’ : Phosphate-terminus of DNA molecule

Introduction
Introduction
1
G1. Introduction Pigments are compounds that absorb light in the wavelength range of the visible
region. They are widely distributed in living organisms and a large number of
structures have been reported. Chlorophylls and carotenoids are the most abundant
pigments in nature. They are involved in fundamental processes, and life on earth
depends on them. Carotenoids provide many fruits and flowers with distinct red,
orange and yellow colors and a number of carotenoid-derived aroma, and they are
ubiquitous component of all photosynthetic organisms as they are required for
assembly and function of the photosynthetic apparatus. In plants carotenoids
participate in the light harvesting process as accessory pigments and protect the
photosynthetic apparatus from photo-oxidative damage besides acting as membrane
stabilizers. Animals do not synthesize carotenoids de novo and get it through diet. In
animals, besides being as precursors for vitamin A and retinoids, carotenoids act as
quenchers of singlet oxygen, free radical scavengers and antioxidants. They also play
a protective role against some cancers, macular degenerative diseases etc.
Microalgal species are being exploited for large scale production of
carotenoids. They produce wide spectrum of carotenoids viz., lutein, zeaxanthin,
astaxanthin, canthaxanthin and β-carotene. Among the commercially important
carotenoids, astaxanthin is used as a pigmentation source in the aquaculture and
poultry industries and has found applications in the nutraceutical, pharmaceutical, and
cosmetic industries. Haematococcus pluvialis is a commercially promising source of
astaxanthin. It accumulates astaxanthin in extra plastidic lipid vesicles in response to
stress conditions. In the past most of the work on H. pluvialis are related to cultural
parameters, and morphological and physiological changes associated with
carotenogenesis. With this background, H. pluvialis was selected as model organism
to study the expression and regulation of carotenogenic genes.
G2. Scope and objectives of the present investigation Secondary carotenoids are accumulated by very few organisms mainly to protect from
photo-inhibition. The two distinct phases of life cycle, green motile vegetative phase
and astaxanthin accumulating cyst phase, each with distinct carotenoid profile favors
the use of H. pluvialis as a model system to study the regulation of carotenogenesis.
Carotenoid biosynthetic genes of H. pluvialis are transcriptionally up-regulated and
Introduction
2
are photosynthetic redox state regulated. Expression of carotenogenic genes has been
studied in several plants including green algae, and transcription of carotenogenic
genes were shown to be up-regulated by light (Bohne and Linden 2002; Simkin et al.
2003; Steinbrenner and Linden 2003; Romer and Fraser 2005) or a combination of
light with N-deprivation (Grünewald et al. 2000). Although there are reports available
on the influence of light on the expression of carotenogenic genes in Haematococcus,
studies on the influences of other stress factors which are important for enhancing
astaxanthin production on the expression of carotenogenic genes are limited
(Grünewald et al. 2000; Huang et al. 2006a). Likewise, proteome and transcriptome
studies to understand the molecular processes associated with carotenogenesis are
mainly focused on effect of combination of stresses (Eom et al. 2006; Wang et al.
2004a, 2004b). Reports on molecular basis of carotenogenesis are limited in
H. pluvialis. In addition, H. pluvialis cyst cells have remarkable ability to germinate
or regenerate and produce large number of flagellated cells. Studies on this
regeneration process of H. pluvialis cysts have been focused mainly on nutrient
availability and interaction with light. There are no reports on regulation of
carotenogenesis during regeneration. Understanding the molecular basis of stress-
induced astaxanthin accumulation in H. pluvialis will be useful for the optimization of
astaxanthin production. With this background knowledge, the objectives of the present
research work were laid as follows:
1. To study the differential expression of the enzymes involved in astaxanthin
biosynthesis in Haematococcus pluvialis
2. To study the biochemical changes associated with carotenogenesis
The results of the research work done systematically on the above objectives are
compiled in the thesis, under the following chapters,
Chapter I: Review of literature
Chapter II: Expression of carotenoid biosynthetic genes and carotenoid
accumulation
Chapter III: Regulation of carotenogenic and photosynthetic genes expression
Chapter IV: Molecular and biochemical changes associated with carotenogenesis
Chapter V: Expression of carotenogenic genes and associated changes in pigment
profile during regeneration of Haematococcus pluvialis cysts
Chapter VI: Summary and Conclusions

Chapter I
Review of Literature
Chapter I Review of Literature
3
1.0. Carotenoids Carotenoids are the most widespread group of pigments found in nature. They provide
many fruits and flowers with distinct red, orange and yellow colors and a number of
carotenoid-derived aroma, making them commercially important in agriculture, food
manufacturing and cosmetic industries (Armstrong 1994; Ben-Amotz and Fishler
1998; Cuttriss and Pogson 2004). Carotenoids impart pigmentation to organisms as
diverse as fish, crustaceans and birds. However, it is their role in photosynthesis and
nutrition that make them essential for the survival of plants, animals and mammals
alike. Specifically, carotenoids are ubiquitous component of all photosynthetic
organisms as they are required for assembly and function of the photosynthetic
apparatus. Carotenoids are also a vital part of our diet as antioxidants and precursors
to vitamim A (Goodwin 1980; Cuttriss and Pogson 2004). Their distinctive colors,
typically in the yellow to red spectrum, are due to a series of conjugated double
bonds. The range of colors is expanded by diverse modifications to the simple
polyene chain structure. Interactions of certain carotenoids with apoproteins, such as
astaxanthin with the crustacyanin protein from shellfish, can result in blue
pigmentation that shifts back to red during cooking as the proteins are denatured
(Cuttriss and Pogson 2004). Although commonly thought of as plant pigments,
carotenoids are also encountered in some animal foods. Animals are incapable of
carotenoid biosynthesis, thus their carotenoids are diet derived, selectively or
unselectively absorbed, and accumulated unchanged or modified slightly into typical
animal carotenoids (Rodriguez-Amaya 2001).
So far, over 600 carotenoids have been characterized, of which about 50 are
provitamin-A, which includes β-carotene, α-carotene, -carotene and β-cryptoxanthin
(Pfander 1987; Straub 1987; Faure et al. 1999). Carotenoids are a large family of
lipophilic isoprenoids. They are usually C40 tetraterpenoids built from eight C5
isoprenoid units, joined by the head-to-head linkages so that the sequence is reversed
at the center (Cunningham and Gantt 1998). The basic linear and symmetrical
skeleton, which can be cyclized at one or both ends, has lateral methyl groups
separated by six C atoms at the center and five C atoms elsewhere. Cyclization and
other modifications, such as hydrogenation, dehydrogenation, double-bond migration,
chain shortening or extension, rearrangement, isomerization, introduction of oxygen
Chapter I Review of Literature
4
functions, or combinations of these processes, result in a myriad of structures. A
distinctive characteristic of carotenoid is an extensive conjugated double-bond
system, which serves as the light-absorbing chromophore responsible for the yellow,
orange, or red color that these compounds impart to many foods (Sapozhnikov 1967;
Cunningham and Gantt 1998; Rodriguez-Amaya 2001). Lycopene shows the acyclic
hydrocarbon chain. This compound is regarded as the prototype of the family
(Weeden and Moss 1995). Structural modifications of lycopene lead to the diverse
nature of the carotenoids present in the plant kingdom. -carotene is the most
significant of the provitamin A carotenoids, characterized by the cyclicized β-ionone
rings on both ends of the hydrocarbon chain. Carotenoids are synthesized as
hydrocarbon carotenoids (i.e., carotenoids made up of only carbon and hydrogen and
are collectively called as carotenes; e.g., lycopene, α-carotene, and β-carotene) or
their oxygenated derivatives (xanthophylls e.g., lutein, α-cryptoxanthin, β-
cryptoxanthin, and zeaxanthin) by all photosynthetic organisms including plants,
algae, and cyanobacteria as well as by some non-photosynthetic bacteria and fungi
(Armstrong 1994). Oxygen functions include hydroxylation at the 3- or 4- position
(lutein and β-cryptoxanthin) and ketolation (canthaxanthin) as well as formation of
the aldehydes, epoxy, carboxy, methoxy, and other oxygenated forms. Hydrocarbon
carotenoids, carotenoid esters, and carotenoid fatty acid esters are frequently found in
plant materials (Weeden and Moss 1995).The existence of uncommon or species-
specific carotenoid has also been demonstrated. The most prominent examples are
capsanthin and capsorubin, the predominant pigments of red pepper. Other classical
examples of unique carotenoids are bixin, the major pigment of the food colorant
annatto, and crocetin, the main coloring component of saffron (Rodriguez-Amaya
2001). In nature, carotenoids exist primarily in more stable all-trans isomeric form
(Zechmeister 1962). The first two C40 carotenoids formed in the biosynthetic pathway
have the 15-cis configuration in plants. The presence of small amounts of cis isomers
of other carotenoids in natural sources has been increasingly reported (Rodriguez-
Amaya 2001).
1.1. Plant carotenoids Plant chloroplasts have a remarkably similar carotenoid composition with lutein (45%
of the total), -carotene (25–30%), violaxanthin (10–15%), and neoxanthin (10–15%)
Chapter I Review of Literature
5
as the most abundant carotenoids (Britton 1993). Most carotenoids are located,
together with chlorophylls, in functional pigment-binding protein structures
embedded in photosynthetic (thylakoid) membranes. While -carotene is more
abundant in the reaction centres of photosystems I and II, xanthophylls are
preferentially distributed in the light-harvesting complexes that transfer excitation
energy to the reaction centres (Demmig-Adams et al. 1996). Plant carotenoids are
synthesized in chloroplasts. Biosynthesis of isoprenoid compounds and carotenoids
are shown in Figures 1.1 and 1.2. Plants use both the methylerythritol phosphate
(MEP) or 1-deoxy-d-xylulose-5-phopsphate (DOXP) pathway and the mevalonic acid
(MVA) pathway for isoprenoid biosynthesis, although they are localized in different
compartments. The MEP pathway synthesizes isopentenyl diphosphate (IPP) and
dimethylallyl diphosphate (DMAPP) in plastids, whereas the MVA pathway produces
cytosolic IPP. Mitochondrial isoprenoids are synthesized from MVA-derived IPP that
is imported from the cytosol. Some exchange of IPP or a common downstream
intermediate does also appear to take place between the plastids and the cytoplasm
(Figure 1.1; Lichtenthaler et al. 1997; Lichtenthaler 1999; Rohmer 1999). Plant
carotenoids have been classified as primary or secondary carotenoids. Primary
carotenoids are the compounds required by plants in photosynthesis and function
within the photosynthetic machinery (neoxanthin, violaxanthin, lutein, zeaxanthin and
-carotene). Secondary carotenoids are those carotenoids that are not exclusively
required for photosynthesis and are not localized in the thylakoid membranes of the
chloroplast. They almost exclusively accumulate under stress conditions (e.g. nutrient
starvation, salinity, high temperature etc.) and this process is species specific. The
physiological function of secondary carotenoid remains to be clarified (Boussiba
2000). However, it is generally believed that they function as passive photoprotectants
(i.e., as a filter) reducing the amount of light which can reach the light-harvesting
pigment complex of PSII (Hagen et al. 1994).
Carotenoids serve at least two important functions in photosynthesis besides
acting as membrane stabilizers. First, they participate in the light-harvesting process
as accessory light-harvesting pigments that absorb light in the range of 450-470 nm
and transfer the energy to chlorophyll. And second, they protect the photosynthetic
apparatus from photo-oxidation by channeling excess energy away from chlorophyll
(Bartley and Scolnik 1995). Carotenoids are essential for the efficient quenching of
Chapter I Review of Literature
6
chlorophyll triplets formed by an excess of light, preventing the generation of photo-
oxidative species such as oxygen singlets that can react with lipids, proteins, and other
macromolecules causing irreparable damage (Demmig-Adams et al. 1996). In
addition, carotenoids dissipate excess light energy in a process known as thermal
dissipation or non-photochemical quenching (NPQ) of chlorophyll fluorescence
(Baroli and Niyogi 2000; Muller et al. 2001). Oxidative cleavage of carotenoids leads
to the production of apocarotenoids, a structurally diverse class of compounds widely
distributed in nature (Giuliano et al. 2003). Carotenoids have many industrial
applications as natural food colorants (use of β-carotene in margarines), and used in
cosmetic and pharmaceutical industries (Hirschberg 2001; Fraser and Bramley 2004).
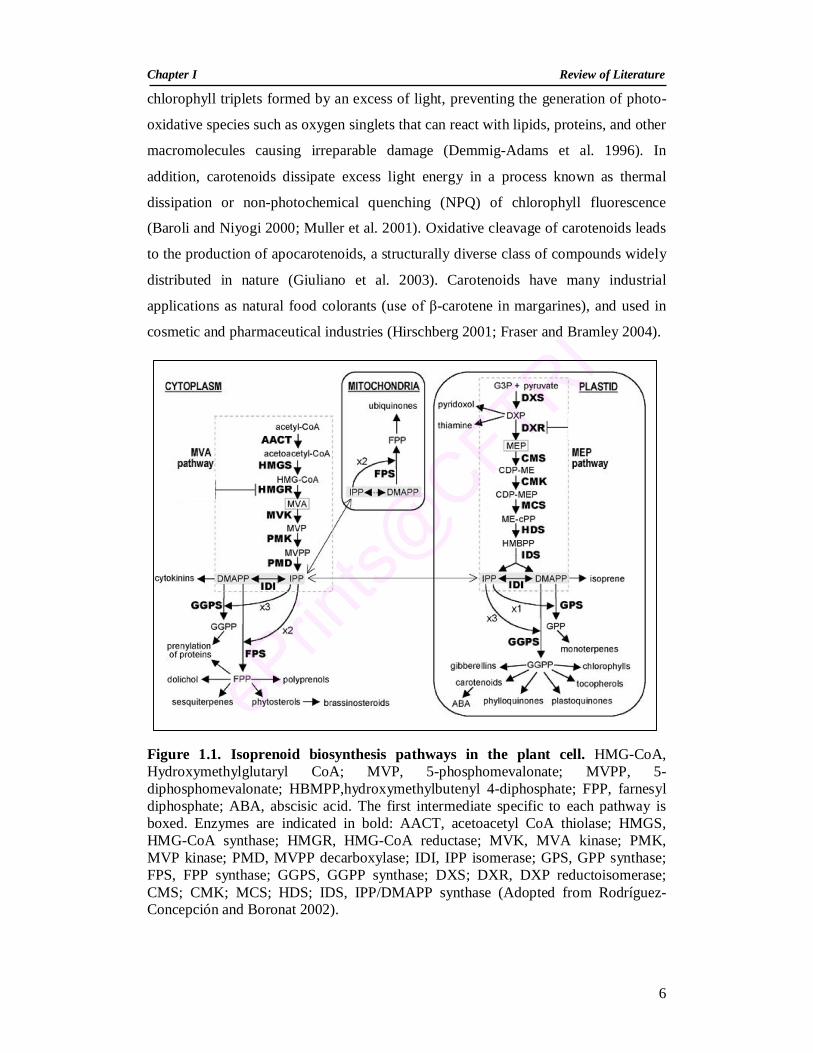
Figure 1.1. Isoprenoid biosynthesis pathways in the plant cell. HMG-CoA, Hydroxymethylglutaryl CoA; MVP, 5-phosphomevalonate; MVPP, 5-diphosphomevalonate; HBMPP,hydroxymethylbutenyl 4-diphosphate; FPP, farnesyl diphosphate; ABA, abscisic acid. The first intermediate specific to each pathway is boxed. Enzymes are indicated in bold: AACT, acetoacetyl CoA thiolase; HMGS, HMG-CoA synthase; HMGR, HMG-CoA reductase; MVK, MVA kinase; PMK, MVP kinase; PMD, MVPP decarboxylase; IDI, IPP isomerase; GPS, GPP synthase; FPS, FPP synthase; GGPS, GGPP synthase; DXS; DXR, DXP reductoisomerase; CMS; CMK; MCS; HDS; IDS, IPP/DMAPP synthase (Adopted from Rodríguez-Concepción and Boronat 2002).
Chapter I Review of Literature
7
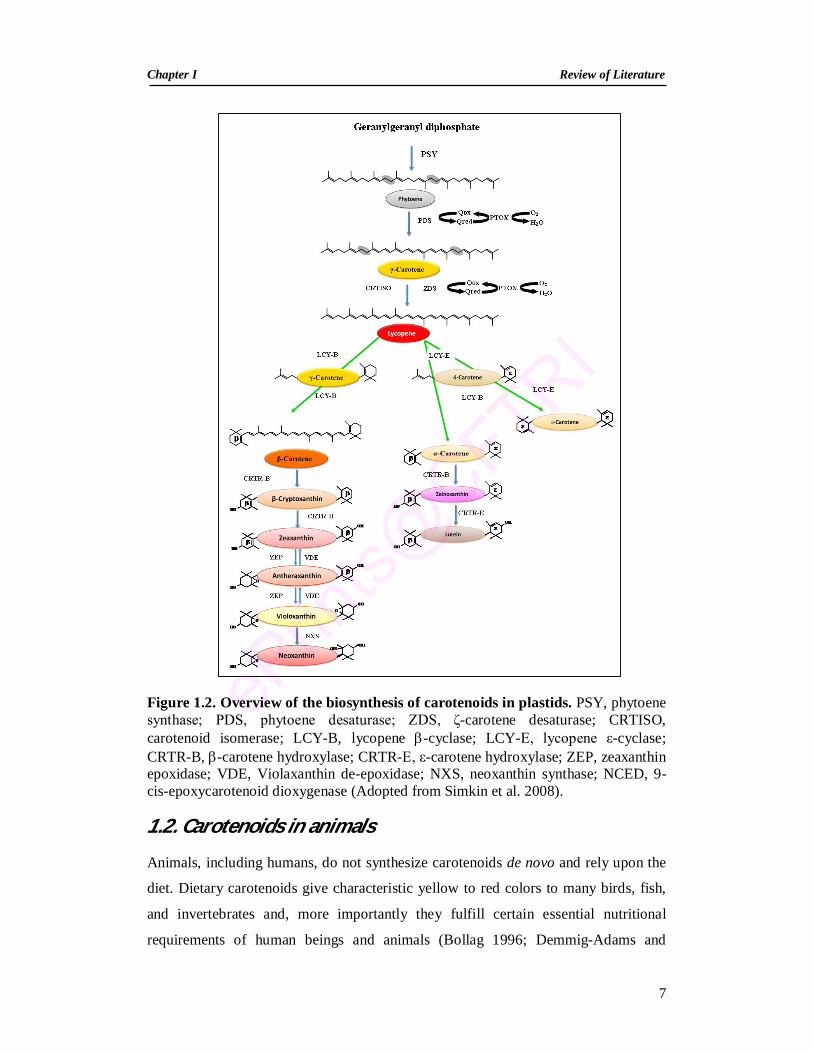
Figure 1.2. Overview of the biosynthesis of carotenoids in plastids. PSY, phytoene synthase; PDS, phytoene desaturase; ZDS, ζ-carotene desaturase; CRTISO, carotenoid isomerase; LCY-B, lycopene -cyclase; LCY-E, lycopene ε-cyclase; CRTR-B, -carotene hydroxylase; CRTR-E, ε-carotene hydroxylase; ZEP, zeaxanthin epoxidase; VDE, Violaxanthin de-epoxidase; NXS, neoxanthin synthase; NCED, 9-cis-epoxycarotenoid dioxygenase (Adopted from Simkin et al. 2008).
1.2. Carotenoids in animals Animals, including humans, do not synthesize carotenoids de novo and rely upon the
diet. Dietary carotenoids give characteristic yellow to red colors to many birds, fish,
and invertebrates and, more importantly they fulfill certain essential nutritional
requirements of human beings and animals (Bollag 1996; Demmig-Adams and
Chapter I Review of Literature
8
Adams 2002; Fraser and Bramley 2004). Carotenoids act as precursors for the
production of retinoids, and apocarotenoids synthesized in animal cells from
carotenoids with -ring end groups are taken from the diet (Bollag 1996). Retinoids
such as retinol (vitamin A), retinal (the main visual pigment), and retinoic acid (which
controls morphogenesis) play important functions as visual pigments and signaling
molecules. The most potent dietary precursor of vitamin A is -carotene. Its
deficiency, reported as the most common dietary problem affecting children
worldwide, leads to xerophthalmia, blindness, and premature death (Fraser and
Bramley 2004). Although the major value of carotenoids in human nutrition is their
role as provitamin A, recent studies support that their capacity of quenching singlet
oxygen and acting as free radical scavengers and antioxidants in vivo can provide
additional health benefits such as protection against macular degeneration,
cardiovascular diseases and cancers (Handelman 2001; Demmig-Adams and Adams
2002; Johnson 2002; Fraser and Bramley 2004; Stahl and Sies 2005).
1.3. Carotenoids from microalgae Microalgae produce wide spectrum of carotenoids. These carotenoids are associated
with light capture in addition to chlorophyll. Carotenoids protect the microalgae
against solar radiation and related effects. β-carotene from the alga Dunaliella salina
is the first high value algal product commercialized which is now being produced in
Australia, USA and Israel (Spolaore et al. 2006). Most of the chlorophycean members
contains multitude of carotenoids- neoxanthin, violaxanthin, lutein, zeaxanthin, and
antheraxanthin (Jin et al. 2003b). Due to its carotenoid rich nature, Chlorella vulgaris
is being used as natural colour ingredient in animal feed (Gouveia et al. 1996). Few
green algae like Haematococcus, Chlorococcum, Neochloris produce carotenoid
astaxanthin along with other carotenoids. In Rhodophyta, the predominant carotenes
are lutein, zeaxanthin, and -carotenes, while in Pheophyta, the main pigments are
-carotene, violaxanthin and fucoxanthin (Shahidi et al. 1998). Several carotenoids
have been recognized as biotechnologically important (Table 1.1).
Chapter I Review of Literature
9
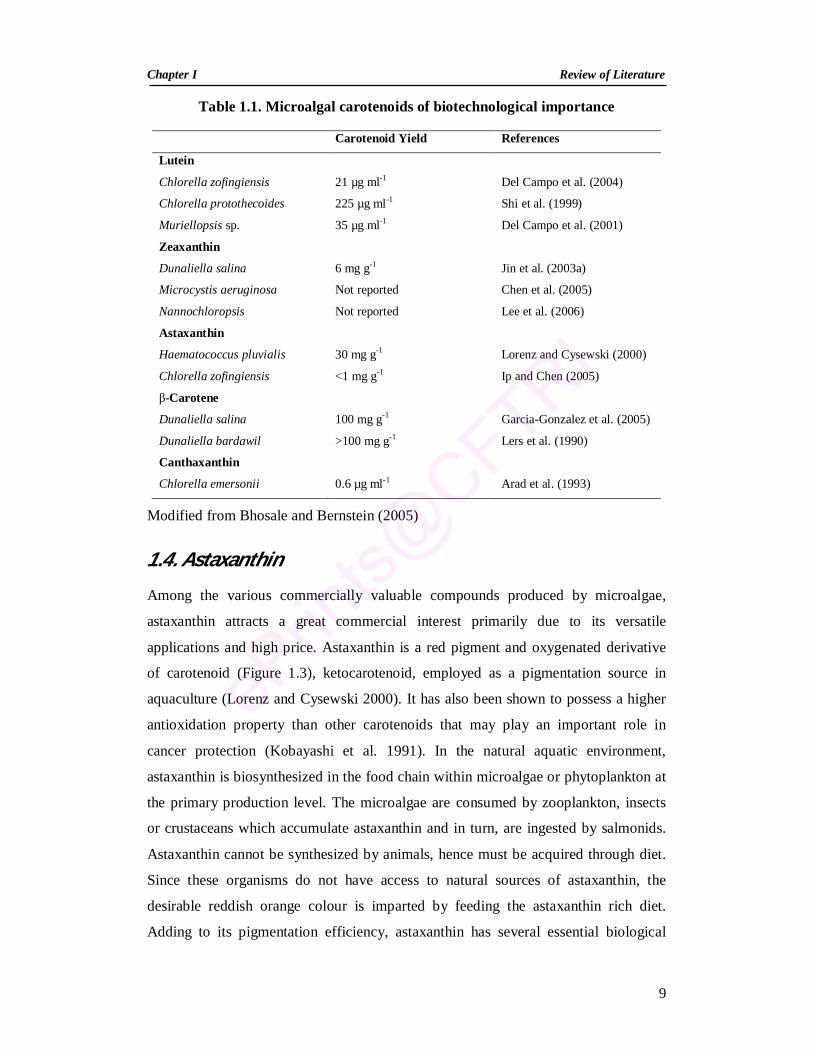
Table 1.1. Microalgal carotenoids of biotechnological importance
Carotenoid Yield References
Lutein
Chlorella zofingiensis 21 µg ml-1 Del Campo et al. (2004)
Chlorella protothecoides 225 µg ml-1 Shi et al. (1999)
Muriellopsis sp. 35 µg ml-1 Del Campo et al. (2001)
Zeaxanthin
Dunaliella salina 6 mg g-1 Jin et al. (2003a)
Microcystis aeruginosa Not reported Chen et al. (2005)
Nannochloropsis Not reported Lee et al. (2006)
Astaxanthin
Haematococcus pluvialis 30 mg g-1 Lorenz and Cysewski (2000)
Chlorella zofingiensis <1 mg g-1 Ip and Chen (2005)
β-Carotene
Dunaliella salina 100 mg g-1 Garcia-Gonzalez et al. (2005)
Dunaliella bardawil >100 mg g-1 Lers et al. (1990)
Canthaxanthin
Chlorella emersonii 0.6 µg ml-1 Arad et al. (1993)
Modified from Bhosale and Bernstein (2005)
1.4. Astaxanthin Among the various commercially valuable compounds produced by microalgae,
astaxanthin attracts a great commercial interest primarily due to its versatile
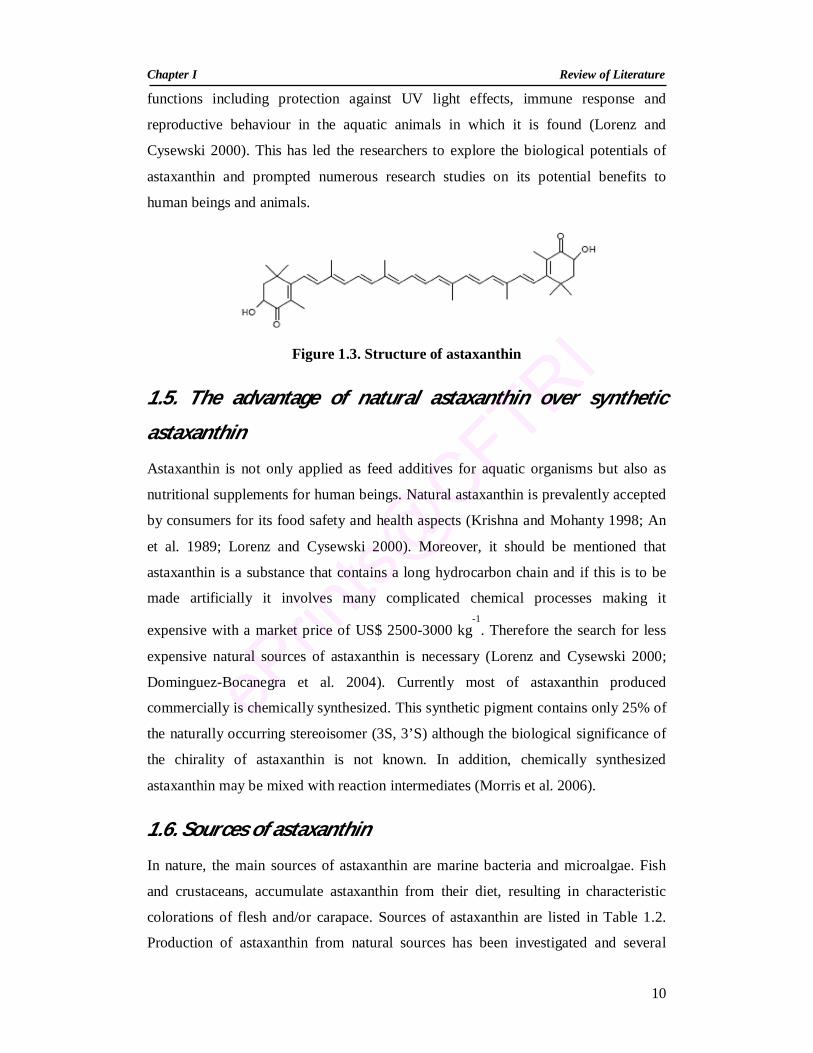
applications and high price. Astaxanthin is a red pigment and oxygenated derivative
of carotenoid (Figure 1.3), ketocarotenoid, employed as a pigmentation source in
aquaculture (Lorenz and Cysewski 2000). It has also been shown to possess a higher
antioxidation property than other carotenoids that may play an important role in
cancer protection (Kobayashi et al. 1991). In the natural aquatic environment,
astaxanthin is biosynthesized in the food chain within microalgae or phytoplankton at
the primary production level. The microalgae are consumed by zooplankton, insects
or crustaceans which accumulate astaxanthin and in turn, are ingested by salmonids.
Astaxanthin cannot be synthesized by animals, hence must be acquired through diet.
Since these organisms do not have access to natural sources of astaxanthin, the
desirable reddish orange colour is imparted by feeding the astaxanthin rich diet.
Adding to its pigmentation efficiency, astaxanthin has several essential biological
Chapter I Review of Literature
10
functions including protection against UV light effects, immune response and
reproductive behaviour in the aquatic animals in which it is found (Lorenz and
Cysewski 2000). This has led the researchers to explore the biological potentials of
astaxanthin and prompted numerous research studies on its potential benefits to
human beings and animals.
Figure 1.3. Structure of astaxanthin
1.5. The advantage of natural astaxanthin over synthetic
astaxanthin Astaxanthin is not only applied as feed additives for aquatic organisms but also as
nutritional supplements for human beings. Natural astaxanthin is prevalently accepted
by consumers for its food safety and health aspects (Krishna and Mohanty 1998; An
et al. 1989; Lorenz and Cysewski 2000). Moreover, it should be mentioned that
astaxanthin is a substance that contains a long hydrocarbon chain and if this is to be
made artificially it involves many complicated chemical processes making it
expensive with a market price of US$ 2500-3000 kg-1
. Therefore the search for less
expensive natural sources of astaxanthin is necessary (Lorenz and Cysewski 2000;
Dominguez-Bocanegra et al. 2004). Currently most of astaxanthin produced
commercially is chemically synthesized. This synthetic pigment contains only 25% of
the naturally occurring stereoisomer (3S, 3’S) although the biological significance of
the chirality of astaxanthin is not known. In addition, chemically synthesized
astaxanthin may be mixed with reaction intermediates (Morris et al. 2006).
1.6. Sources of astaxanthin In nature, the main sources of astaxanthin are marine bacteria and microalgae. Fish
and crustaceans, accumulate astaxanthin from their diet, resulting in characteristic
colorations of flesh and/or carapace. Sources of astaxanthin are listed in Table 1.2.
Production of astaxanthin from natural sources has been investigated and several
Chapter I Review of Literature
11
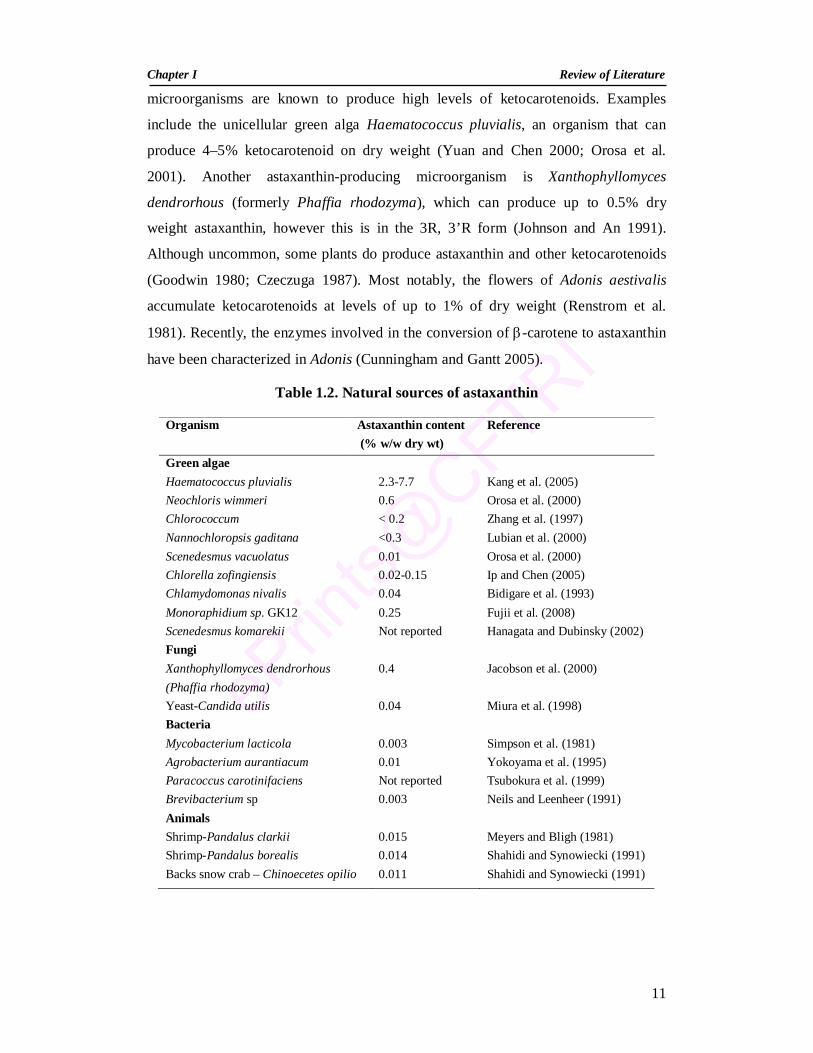
microorganisms are known to produce high levels of ketocarotenoids. Examples
include the unicellular green alga Haematococcus pluvialis, an organism that can
produce 4–5% ketocarotenoid on dry weight (Yuan and Chen 2000; Orosa et al.
2001). Another astaxanthin-producing microorganism is Xanthophyllomyces
dendrorhous (formerly Phaffia rhodozyma), which can produce up to 0.5% dry
weight astaxanthin, however this is in the 3R, 3’R form (Johnson and An 1991).
Although uncommon, some plants do produce astaxanthin and other ketocarotenoids
(Goodwin 1980; Czeczuga 1987). Most notably, the flowers of Adonis aestivalis
accumulate ketocarotenoids at levels of up to 1% of dry weight (Renstrom et al.
1981). Recently, the enzymes involved in the conversion of -carotene to astaxanthin
have been characterized in Adonis (Cunningham and Gantt 2005).
Table 1.2. Natural sources of astaxanthin
Organism Astaxanthin content (% w/w dry wt)
Reference
Green algae Haematococcus pluvialis 2.3-7.7 Kang et al. (2005) Neochloris wimmeri 0.6 Orosa et al. (2000) Chlorococcum < 0.2 Zhang et al. (1997) Nannochloropsis gaditana <0.3 Lubian et al. (2000) Scenedesmus vacuolatus 0.01 Orosa et al. (2000) Chlorella zofingiensis 0.02-0.15 Ip and Chen (2005) Chlamydomonas nivalis 0.04 Bidigare et al. (1993) Monoraphidium sp. GK12 0.25 Fujii et al. (2008) Scenedesmus komarekii Not reported Hanagata and Dubinsky (2002) Fungi Xanthophyllomyces dendrorhous (Phaffia rhodozyma)
0.4
Jacobson et al. (2000)
Yeast-Candida utilis 0.04 Miura et al. (1998) Bacteria Mycobacterium lacticola 0.003 Simpson et al. (1981) Agrobacterium aurantiacum 0.01 Yokoyama et al. (1995) Paracoccus carotinifaciens Not reported Tsubokura et al. (1999) Brevibacterium sp 0.003 Neils and Leenheer (1991) Animals Shrimp-Pandalus clarkii 0.015 Meyers and Bligh (1981) Shrimp-Pandalus borealis 0.014 Shahidi and Synowiecki (1991) Backs snow crab – Chinoecetes opilio 0.011 Shahidi and Synowiecki (1991)
Chapter I Review of Literature
12
Apart from these sources, some minor sources of astaxanthin include Coalastrella
striolata (Abe et al. 2007) and Chlamydomonas nivalis where astaxanthin existed as
glucoside esters (Řezanka et al. 2008).
1.7. Biotechnological significance of astaxanthin
1.7.1. Chemistry of astaxanthin
In nature, algae synthesize the carotenoid pigment astaxanthin which gets
concentrated in the food chain through zooplankton and crustaceans, which are prey
for salmon, trout and other aquatic animals (Steven 1948; Kitahara 1984; Foss et al.
1987). The astaxanthin molecule has two asymmetric carbons located at the 3 and 3’
positions of the benzenoid rings on either end of the molecule. Different enantiomers
of the molecule result from the way that the hydroxyl groups are attached to the
carbon atoms at these centres of asymmetry. When the hydroxyl group is attached so
that it projects above the plane of the molecule, it is said to be in the ‘R
configuration’, and when the hydroxyl group is attached to project below the plane of
the molecule, it is said to be in the ‘S configuration’. Thus, the three possible
enantiomers are designated: 3R,3R’; 3S,3S’; and 3R,3S’ (meso) (Lorenz and
Cysewski 2000).
Haematococcus primarily contains monoesters of astaxanthin linked to 16:0,
18:1 and 18:2 fatty acids. All of the free astaxanthin and its monoesters and diesters in
Haematococcus have optically pure (3S, 3’S) chirality (Grung et al. 1992; Chien
1996). Fatty acids are esterified onto the 3’ hydroxyl group(s) of astaxanthin after
biosynthesis of the carotenoid, thereby increasing its solubility and stability in the
cellular lipid environment. Studies now support a major role of astaxanthin in
protecting H. pluvialis from oxidative stress (Kobayashi 2000; Li et al. 2008b). The
composition of astaxanthin esters in Haematococcus is similar to that of crustaceans,
the natural dietary source of salmonids (Storebakken et al. 1985).
1.7.2. Biological functions of astaxanthin
There is an increasing amount of evidence to suggest that astaxanthin
surpasses the antioxidant benefits of β-carotene, zeaxanthin, canthaxanthin, vitamin C
and vitamin E. Studies have also shown that astaxanthin can protect skin from the
damaging effects of ultraviolet radiation, ameliorate age-related macular
Chapter I Review of Literature
13
degeneration, protect against chemically induced cancers, increase high-density
lipoproteins and enhance the immune system. Epidemiological studies have
demonstrated a correlation between increased carotenoid intake and reduced
incidence of coronary heart disease and certain cancers, macular degeneration and
increased resistance to viral, bacterial, fungal and parasitic infections. Studies indicate
that the mechanism for this protective attribute is partly owing to the direct
enhancement of the immune response by carotenoids. Anti-carcinogenic effects of
carotenoids are likely to be attributable to its antioxidant effect, in so much as oxygen
radicals are related to the process of cancer initiation and propagation (see Lorenz and
Cysewski 2000).
Numerous studies have demonstrated the potent radical scavenging and singlet
oxygen quenching properties of astaxanthin. As a result of its particular molecular
structure, astaxanthin has a potent neutralizing or ‘quenching’ effect against singlet
oxygen, as well as a powerful scavenging ability for free radicals, and it serves as an
extremely potent antioxidant against these reactive species. Within the cell, it can
effectively scavenge lipid radicals and destroys peroxide chain reactions to protect
fatty acids and sensitive membranes (Terao 1989; Kurashige et al. 1990; Miki 1991).
It has been demonstrated that astaxanthin is significantly more effective than β-
carotene in neutralizing free radicals and gives better protection against the
peroxidation of unsaturated fatty acid methyl esters than canthaxanthin, β-carotene or
zeaxanthin (Lee et al. 1986; Jorgensen and Skibsted 1993). The antioxidant activities
of astaxanthin have been shown to be approximately ten times greater than other
carotenoids, such as zeaxanthin, lutein, canthaxanthin and β-carotene, over 500 times
greater than alpha-tocopherol, and astaxanthin has been proposed to be the ‘super
vitamin E’ (Ranby and Rabek 1978; Miki 1991; Shimidzu et al. 1996).
Astaxanthin might also be useful in preventing age related macular
degeneration (AMD), which causes irreversible blindness. When high-energy blue
light waves interact with the retina, they can cause peroxide damage of the lipids
through photo-oxidation, which in turn creates singlet oxygen and free radicals.
Carotenoids within the macula absorb the high-energy blue light thereby quenching
these damaging oxygen species. Clinical studies have indicated that light injury is a
cause of AMD because of the cumulative insult leading to a gradual loss of
photoreceptor cells. Unlike β -carotene, astaxanthin is able to readily cross the blood-
retinal–brain barrier and can protect the retina against photo-oxidation and loss of
Chapter I Review of Literature
14
photoreceptor cells. Furthermore, astaxanthin has the ability to protect the neurons of
the retina, as well as the central nervous system, especially the brain and spinal cord,
from damage caused by free radicals.
It appears that astaxanthin can also decrease the oxidation of lipid carriers and
thereby reduce the risk of atherosclerosis (Murillo 1992). In rat kidney fibroblasts, the
addition of astaxanthin confers greater protection against ultraviolet (UV-A)-light-
induced oxidative stress compared with lutein and -carotene. When cell cultures
were grown in carotenoid-supplemented media and exposed to UV-A light, β-
carotene at a level of 1000 nM and lutein at 100 nM returned catalase activity to
control levels, whereas it only required 5 nM of astaxanthin (O’Connor and O’Brien
1998).
1.7.3. Industrial applications of astaxanthin
Industrial applications of carotenoids include their use as colorants for human food, as
feed additives to enhance the pigmentation of fish, eggs, cosmetics, and
pharmaceutical products. The major market for astaxanthin is its use as a
pigmentation source in aquaculture and poultry industries (Lorenz and Cysewski
2000). It specifically provides a characteristic pink color to salmonoids, trout and
shrimp (Jin et al. 2006). Astaxanthin sells for around U.S. $2500/kg with an annual
worldwide market estimated at over U.S. $200 million. The astaxanthin used by the
fish farmers represents 10 to 20% of the feed cost. Although more than 95% of this
market consumes synthetically derived astaxanthin, consumer demand for natural
products makes the synthetic pigments less desirable and provides an opportunity for
the production of natural astaxanthin by the alga Haematococcus. Haematococcus is a
potential source producing 1.5 to 3.0% astaxanthin. It has already gained acceptance
in aquaculture and other markets as a concentrated form of natural astaxanthin. The
Canadian Food Inspection Agency and the U.S. FDA have approved the use of this
alga as a color additive in salmonoid feeds. Astaxanthin is used in aquaculture as it
has functions such as antioxidant, hormone precursor, immune enhancement,
provitamin A, reproduction, growth, maturation, and photoprotection (Margalith
1999; Lorenz and Cysewski 2000). In general, astaxanthin is used as a nutraceutical
ingredient. The algal meal has been approved as a natural red food color in Japan and
some European countries as well as a dietary supplement ingredient in the United
States (Lorenz and Cysewski 2000). Because of the ability of H. pluvialis to
Chapter I Review of Literature
15
accumulate higher amounts of astaxanthin and its multidimensional applications in
various industries, it is recognized as a potential candidate for the production of
astaxanthin.
1.8. Haematococcus pluvialis
1.8.1. Occurrence and distribution of Haematococcus pluvialis
The fresh-water unicellular green alga Haematococcus pluvialis Flotow, also referred
to as Haematococcus lacustris or Sphaerellla lacustris, belongs to the Division
Chlorophyta, Class Chlorophyceae, Order Volvocales, Family Haematococcaceae,
Genus Haematococcus and Species pluvialis (Bold and Wynne 1985).
Haematococcus is widely distributed and occurs primarily in ephemeral rain pools
and birdbaths (Czygan 1970). It has been isolated across Europe, Africa and North
America (Pringsheim 1966). Recent reports show its existence in small artificial pool
in poland (Burchardt et al. 2006) and natural and man-made ponds in Himachal
Pradesh, India (Suseela and Toppo 2006). The widespread occurrence of
Haematococcus in temporary water bodies rather than permanent water bodies is in
part due to the fact that such pools are usually free of other competing algae, and not
to any inherent characteristic of the pools (Proctor 1957). Haematococcus is
considerably well suited for survival under conditions of expeditious and extreme
fluctuations in light, temperature and salt concentration than many other microalgae,
due to its ability to encyst in a rapid manner (Proctor 1957).
1.8.2. Cellular morphology, ultrastructure, physiology and lifecycle of
Haematococcus pluvialis
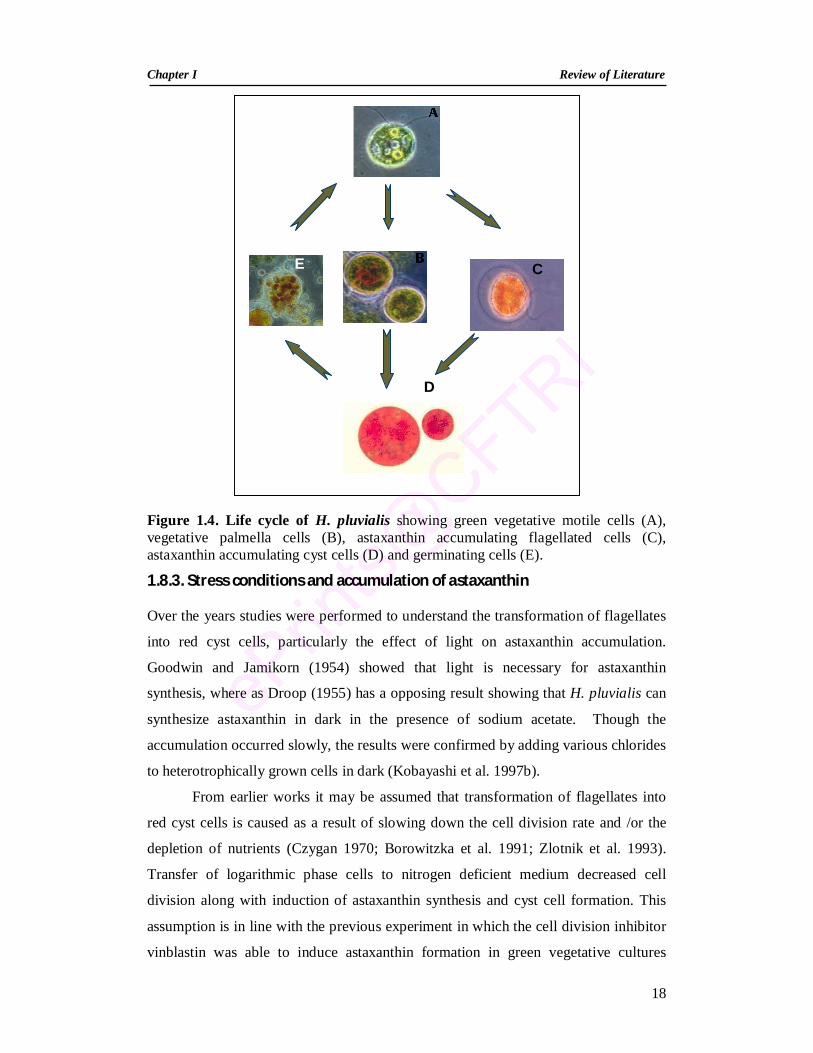
The life cycle of H. pluvialis consists of two phases – vegetative phase and
astaxanthin accumulating phase (Kobayashi et al. 1991; Triki et al. 1997; Hagen et al.
2002; Sarada et al. 2002), and these phases can be divided into 5 stages namely, green
vegetative flagellate cells, green resting vegetative cells, red flagellate cells, red cysts
and germination of red cysts to vegetative cells (Figure 1.4). Motile vegetative
flagellate cells along with resting vegetative cells are predominant in the culture under
favorable conditions. The green flagellate cells are spherical to ellipsoid with a size
between 8 to 20 µm and have two equal-length flagella emerging from anterior end.
The cells contain a single cup-shaped chloroplast with several scattered pyrenoids.
Chapter I Review of Literature
16
The cells are characterized by a remarkable and distinct gelatinous extracellular
matrix of variable thickness (Hagen et al. 2002). In its non-motile stage i.e., palmella
stage, motile cells lose their flagella and become resting vegetative cells,
accompanied by formation of an amorphous multilayered structure in the inner
regions of the extracellular matrix or the primary wall (Hagen et al. 2002). Despite the
loss of the flagella and the formation of the palmella membrane, the cellular structure
remains the same as its motile form. When environmental conditions become adverse,
i.e., nutrient deprivation, high light irradiance or high salinity, both motile and
nonmotile vegetative cells transform into cysts or aplanospores (Santos and Mesquita
1984) and become resistant to prevailing extreme environmental conditions (Boussiba
and Vonshak 1991). During the transformation, the algal cell quickly rounds up,
looses its flagella, rendering the cyst cells immotile. The cell size increases up to
40µm in diameter and a trilaminar sheath and acetolysis resistant material-based
secondary wall is formed and thickened. It also coincides with expansion of cell
volume (Montsant et al. 2001) and massive accumulation of astaxanthin in lipid
globules in the cytoplasm (Hagen et al. 2002). Under nutrient deficient and high light
condition, the cells start accumulating astaxanthin without losing their flagella and not
forming cysts. This cultivation scheme is having advantages, since fragile cell
boundary of flagellates are more accessible to biochemical investigations including
cell fractionation and electron microscopy as compared to cyst cells (Grünewald and
Hagen 2000).
Vegetative phase cells possess chlorophyll a and b and primary carotenoids, -
carotene, lutein, violaxanthin, neoxanthin and zeaxanthin as found in Chlorophyta and
in the chloroplasts of higher plants (Harker et al. 1996). Under stress conditions,
accumulation of astaxanthin is accompanied by a decrease in chlorophylls and
primary carotenoids (Harker et al. 1996). Light and electron microscopic studies
revealed that, in motile cells, astaxanthin first appears in small spherical inclusions
(with no true limiting biomembrane) in the perinuclear cytoplasm, the pigment
granules are not within any specific organelle or vesicle (Lang 1968; Santos and
Mesquita 1984). In maturing cysts the pigment deposit increase in number and take on
a variety of shapes. Coalescence of the globular granules result from increasing
quantities of astaxanthin formed as the cell ages. In mature cysts the cytoplasm is
almost uniformly red with reduced amounts of pigments in the chloroplast.
Chapter I Review of Literature
17
Astaxanthin disperses towards the periphery of Haematococcus cells under light
induction and moves back towards the center after illumination is discontinued (Yong
and Lee 1991).
Light microscopic studies of astaxanthin accumulation process in the
flagellates of H. pluvialis cells revealed the occurrence of small orange red
cytoplasmic vesicles in the perinuclear region (Grünewald and Hagen 2000). As the
accumulation process progressed, the size and number of secondary carotenoid (SC)
vesicles increased markedly and vesicles were found accumulated all over the
cytoplasm. Changes in flagellates ultrastructure were visible. Besides reduction in
number of thylakoids, a marked accumulation of starch in the chloroplast was notable
two days after the onset of induction of astaxanthin biosynthesis. In following stages
the amount of starch decreased quickly. Throughout the SC accumulation period the
chloroplast envelope remained intact. Budding or release of vesicles from chloroplast
envelope was not observed. However, numerous cases of budding and extrusion of
large carotenoid containing lipid vesicles across the plasma membrane into the
extracellular matrix with all intermediate stages were observed. Light microscopic
observations also showed vesicles in and peripheral of the extracellular matrix of
flagellates during massive accumulation of SC, about 4 days after the onset of
carotenogenic conditions. Electron microscopic studies showed bulging of the
plasmalemma and subsequent release of the large electron dense vesicles from the
cytoplasm into the extracellular matrix, and extrusion of vesicles out of the
extracellular matrix was never observed (Grünewald and Hagen 2000).
However, the process of cyst formation is reversible, i.e., when mature cysts
are transferred to fresh medium and exposed to a low light, intracellular daughter cells
are released from the mature cyst cells into the medium, and vegetative cells
regenerated from daughter cells grow mixotrophically. Germination of cysts coincides
with chlorophyll and protein synthesis, and carotenoid degradation (Fabregas et al.
2003).
Chapter I Review of Literature
18
C E
D
Figure 1.4. Life cycle of H. pluvialis showing green vegetative motile cells (A), vegetative palmella cells (B), astaxanthin accumulating flagellated cells (C), astaxanthin accumulating cyst cells (D) and germinating cells (E).
1.8.3. Stress conditions and accumulation of astaxanthin
Over the years studies were performed to understand the transformation of flagellates
into red cyst cells, particularly the effect of light on astaxanthin accumulation.
Goodwin and Jamikorn (1954) showed that light is necessary for astaxanthin
synthesis, where as Droop (1955) has a opposing result showing that H. pluvialis can
synthesize astaxanthin in dark in the presence of sodium acetate. Though the
accumulation occurred slowly, the results were confirmed by adding various chlorides
to heterotrophically grown cells in dark (Kobayashi et al. 1997b).
From earlier works it may be assumed that transformation of flagellates into
red cyst cells is caused as a result of slowing down the cell division rate and /or the
depletion of nutrients (Czygan 1970; Borowitzka et al. 1991; Zlotnik et al. 1993).
Transfer of logarithmic phase cells to nitrogen deficient medium decreased cell
division along with induction of astaxanthin synthesis and cyst cell formation. This
assumption is in line with the previous experiment in which the cell division inhibitor
vinblastin was able to induce astaxanthin formation in green vegetative cultures
Chapter I Review of Literature
19
(Boussiba and Vonshak 1991). The induction of astaxanthin accumulation is not
necessarily a process associated with the cyst cell formation (Lee and Ding 1994;
Hagen et al. 2000). The role of several environmental stress conditions on the
induction and accumulation of astaxanthin has also been demonstrated by a number of
researchers. Formation of reddish palmella cells and cysts can be induced in
autotrophic growth condition under low nitrate or high phosphate concentrations
(Borowitzka et al. 1991). Mixotrophic growth with acetate improves growth rate and
final cell yield, and also stimulates the formation of the astaxanthin containing
palmella cells and cysts (Borowitzka et al. 1991; Kobayashi et al. 1992). Formation
of palmella cells and aplanospores can also be stimulated by increasing the
temperature or by the addition of NaCl (Borowitzka et al. 1991). Boussiba et al.
(1992) summarized the effect of higher light intensities, nitrogen limitation, phosphate
or sulfate starvation or salt stress (0.8% NaCl) on the accumulation and cyst cell
formation. The inhibition of the glutamine synthase by the herbicide BASTA (sodium
glufosinate) also led to the accumulation of astaxanthin similar to the effect of
nitrogen starvation (Aflalo et al. 1999).
1.8.4. Physiological and biochemical changes during astaxanthin
accumulation
Research on the physiological changes occurring during astaxanthin accumulation in
H. pluvialis is less. One of the important aspects studied was changes in lipid content.
It is observed that increase in lipid content (Boussiba and Vonshak 1991) and oleic
acid rich triacylglycerol (Zhekisheva et al. 2002) has a direct association with
astaxanthin accumulation. In support of this, a steep increase in the content of all the
three lipid classes viz., glycolipids, phospholipids and neutral lipids was reported in
the cultures which accumulate astaxanthin after exposure to high light intensities.
Especially the neutral lipids triacylglycerols were accumulated in high amounts, with
oleic acid predominating. It is also observed that Inhibition of fatty acid synthesis has
significant effect on astaxanthin biosynthesis, whereas the inhibition of carotenoid
biosynthesis by norflurazon or diphenylamine (DPA) has only little effect on lipid
synthesis (Zhekisheva et al. 2005). This suggests that the accumulation of astaxanthin
is closely related to the synthesis of fatty acids. It is possible that the accumulated
fatty acids serve as a matrix for solubilizing astaxanthin esters. The free non-esterified
form of astaxanthin is found only in small amounts of 1% (Grung et al. 1992).
Chapter I Review of Literature
20
Vegetative green cells are dominated by chlorophyll a and b followed by the
carotenoids lutein (59% of total carotenoids) and β-carotene (13.5 % of total
carotenoids) and the xanthophyll violaxanthin (14.5% of total carotenoids) (Orset et
al. 1995). Astaxanthin increases from few picogram per cell to a few hundreds when
encystment is induced, at this stage astaxanthin esters constitute up to 98% of the total
carotenoids and reach up to 4% of total cellular dry weight (Boussiba et al. 1999). The
astaxanthin pool consist approximately 70% monoesters, 25% diesters and 5% free
form (Lorenz and Cysewski 2000).
Contrary results were reported about the photosynthetic activity measured in
terms of oxygen evolution rates during astaxanthin accumulation and encystment of
H. pluvialis induced by nutrient deprivation under high light intensities. When
vegetative cells were grown in nitrogen deficient medium and high light, the cyst cell
formation was accompanied by massive accumulation of astaxanthin and a slight
decrease in chlorophyll content from 16 to 14.8 pg cell-1 (Zlotnik et al. 1993). The
cyst cell formation was characterized by a gradual reduction in the maximal
photosynthetic rate and increase in the photosynthetic quantum requirement and
minimal turnover time for photosynthetic O2 evolution. Respiration rate increased 4
times during aplanospore formation. Measurements of the cellular content of
photosystem II (PSII) reaction centers suggest that the photosynthetic complex
remains relatively stable during the formation process and in the mature aplanospore.
High light coupled with phosphate deficiency induced aplanospore formation
showed significantly decreased level of cytochrome f, which impairs the linear
electron flow from photosystem II to photosystem I. The respiration rate of red cells
was higher than that of green cells, but the level of apoproteins, CPI, D2, CP47, LHCI
were decreased in the red cells. Conversely the O2 evolution was positive in green
cells whereas it was negative in aplanospores. However, the activity of the
photosynthetic electron transport was functional in red aplanospores (Tan et al. 1995).
In earlier studies, astaxanthin accumulation in Haematococcus cells were
induced either by nutrient deficiency or by the use of aged cultures, in which the cell
division slowed down or stopped with the reduction in photosynthetic activity and
decomposition of photosynthetic apparatus. So the damage to the photosynthetic
apparatus may be a side effect of the conditions used for the induction of astaxanthin
accumulation but not directly related to this process (Wang et al. 2003b). To avoid the
side effects by other stress conditions, only high light was applied for astaxanthin
Chapter I Review of Literature
21
induction and the induction process was accompanied by significant reduction in D1
protein (Wang et al. 2003b). However the decline in D1 content stopped after one day
and recovered to normal after 5 days. The photosynthetic rates remained high and
hence formation of astaxanthin seems to prevent further photo-oxidative damage. This
in turn helps to maintain the PSII function and the structural integrity of photosystems
and enables the cell to cope with high light condition.
Accumulation of a number of protease-resistant, heat-stable proteins with
apparent molecular masses of 38 kDa, 50 kDa, 62 kDa and 63 kDa was reported in
astaxanthin accumulating red cyst cells (Pelah et al. 2004). This protein fraction was
effective in the protection of horseradish peroxidase from inactivation, suggesting a
role for these proteins in H. pluvialis subjected to a stress event (Pelah et al. 2004).
1.8.5. Biosynthesis of astaxanthin in H. pluvialis
Structurally, carotenoids are tetraterpenes, derived from the 5-carbon units IPP and its
isomer DMAPP (Cunningham and Gantt 1998). Plants synthesize IPP and DMAPP
via two different pathways: the cytosolic MVA pathway and the MEP pathway that is
localized within the chloroplast (Lichtenthaler 1999; Eisenreich et al. 2001). The
inhibition by fosmidomycin of 1-deoxy-D-xylulose-5-phosphate reductoisomerase
(DXR), an enzyme of the plastidial MEP pathway, suppressed the synthesis of
astaxanthin in H.pluvialis flagellates (Hagen and Grünewald 2000). This finding
indicates that the MEP pathway provides IPP precursors for carotenoid biosynthesis
in H. pluvialis.
Figure 1.5 schematically depicts the key steps in carotenoid biosynthesis
pathway in H. pluvialis. The reversible isomerization reaction between IPP, a key
building block of carotenoids, and its allylic isomer DMAPP is carried out by the
enzyme isopentenyl pyrophosphate isomerase (IPI) (Figure 1.1). Two cDNAs for IPI
gene have been identified in H. pluvialis (Sun et al. 1998). The first committed step in
the biosynthesis of carotenoids, the head-to-head condensation of two 20-carbon
geranylgeranyl diphosphate (GGPP) to 40-carbon molecule phytoene, is mediated by
the soluble enzyme phytoene synthase (PSY) The subsequent steps of the pathway
leading to the synthesis of colored carotenoids are carried out by desaturation and β-
cyclization reactions catalyzed by membrane-localized enzymes such as phytoene
desaturase (PDS) and lycopene β-cyclase (LCY) respectively (Figure 1.5;
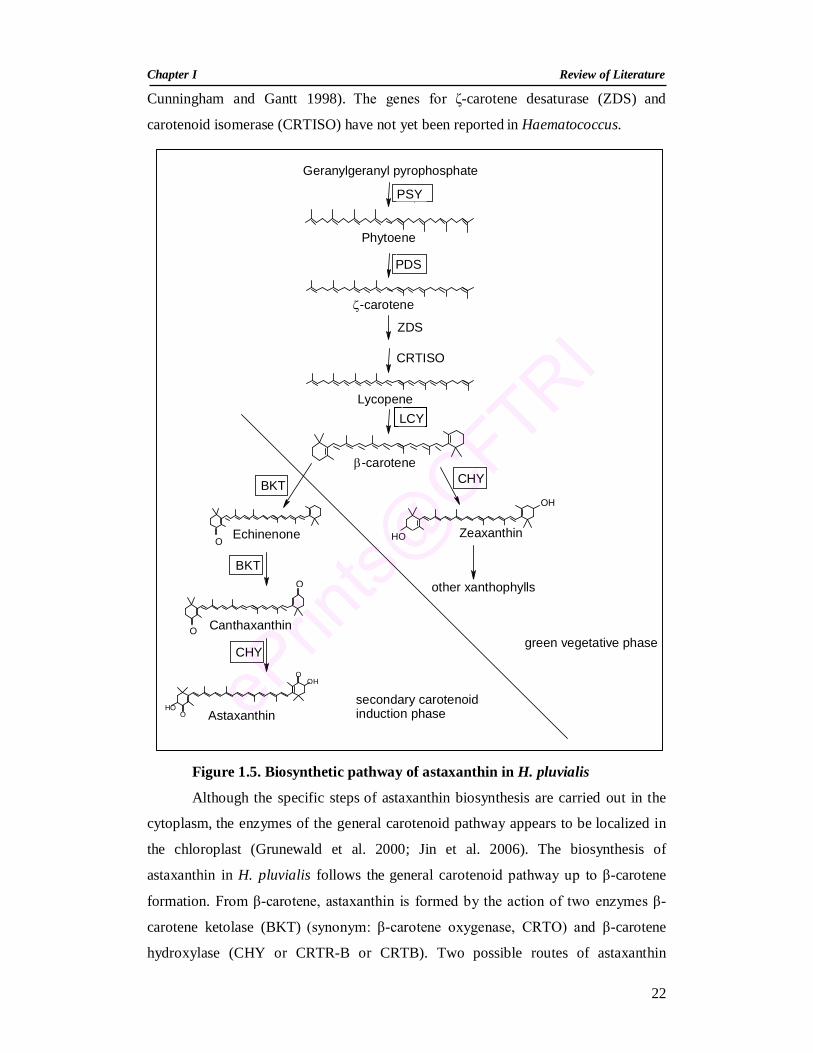
Chapter I Review of Literature
22
OHO
OOH
Phytoene
Geranylgeranyl pyrophosphate
Lycopene
-carotene
EchinenoneO
O
O
Canthaxanthin
OH
HO Zeaxanthin
Astaxanthin
CHY
BKT
BKT
other xanthophylls
-carotene
LCY
PSY
ZDS
CHY
PDS
green vegetative phase
secondary carotenoid induction phase
CRTISO
Cunningham and Gantt 1998). The genes for ζ-carotene desaturase (ZDS) and
carotenoid isomerase (CRTISO) have not yet been reported in Haematococcus.
Figure 1.5. Biosynthetic pathway of astaxanthin in H. pluvialis
Although the specific steps of astaxanthin biosynthesis are carried out in the
cytoplasm, the enzymes of the general carotenoid pathway appears to be localized in
the chloroplast (Grunewald et al. 2000; Jin et al. 2006). The biosynthesis of
astaxanthin in H. pluvialis follows the general carotenoid pathway up to β-carotene
formation. From β-carotene, astaxanthin is formed by the action of two enzymes β-
carotene ketolase (BKT) (synonym: β-carotene oxygenase, CRTO) and β-carotene
hydroxylase (CHY or CRTR-B or CRTB). Two possible routes of astaxanthin
Chapter I Review of Literature
23
formation have been postulated: the first one follows formation of echinenone,
canthaxanthin and adonirubin, whereas the second follows formation of β-
cryptoxanthin, zeaxanthin and adonixanthin (Fraser et al. 1997; Grünewald et al.
2001). Studies using carotenogenic inhibitors and in vitro and in vivo analyses of
astaxanthin synthesis in Haematococcus confirmed that astaxanthin is produced via
formation of canthaxanthin. BKT converts β-carotene to canthaxanthin via echinenone
which is further acted upon by CHY resulting in the formation of astaxanthin (Fan et
al. 1995; Fraser et al. 1998; Schoefs et al. 2001).
1.8.6. Regulation of carotenogenesis in H. pluvialis
Regulation of carotenogenesis in vivo is not studied in detail, though the nucleus
encoded genes for enzymes of the carotenoid biosynthetic pathway have been
identified in several organisms including algae (Cunningham and Gantt 2000;
Steinbrenner and Linden 2003; Yan et al. 2005; Zhu et al. 2005). However, studies on
expression of several genes involved in carotenoid biosynthesis indicate that
Haematococcus carotenoid biosynthesis genes are up-regulated at either mRNA and
protein level, or both (Sun et al. 1998; Grünewald et al. 2000; Steinbrenner and
Linden 2001). In general, all Haematococcus genes studied coding for enzymes
involved in carotenoid biosynthesis were shown to be up-regulated at the mRNA level
in response to environmental stress conditions. Regarding genes coding for enzymes
involved in biosynthesis of carotenoid precursors, Sun et al. (1998) showed that both
isopentenyl pyrophosphate isomerase (IPI) genes – IPI1 and IPI2 are up-regulated at
mRNA level, and IPI2 was found only in the cytosol which is enhanced at protein
level also, suggesting that biosynthesis of carotenoid precursors are regulated at
different levels – transcriptional, translational and post-translational.
PSY catalyzes the initial step in the carotenoid biosynthesis pathway, hence
makes it a target for possible regulation of metabolic flux into the pathway. The
mRNA of the PSY were up-regulated in response to various stress conditions
(Steinbrenner and Linden 2001; Pulz and Gross 2004) and sodium acetate, Fe2+ and
high light stress (Steinbrenner and Linden 2001), though the regulation of PSY at the
protein level is unknown. Under SC inducing conditions, the enzyme PDS was
induced at mRNA and protein level and PDS was found exclusively in the chloroplast
(Grunewald et al. 2000), suggesting that the carotenoid precursors of astaxanthin are
made in the chloroplast. Since astaxanthin accumulation occurs in lipid vesicles of the
Chapter I Review of Literature
24
cytoplasm, the transfer of carotenoids from chloroplast to cytoplasm must occur. The
exposure of Haematococcus cells to stress conditions caused increase in mRNA levels
of lycopene β-cyclase (LYCB) but the protein level of LYCB remained constant (Sun
et al. 1996; Steinbrenner and Linden 2003). This has lead to the speculation that the
LYCB enzyme present in non-stressed cells becomes more active when cells were
exposed to stress conditions.
Astaxanthin was postulated to be biosynthesized by two slightly different
pathways with both pathways involving the enzymes BKT and CHY. BKT was up-
regulated both at mRNA level and protein level (Sun et al. 1996; Grünewald et al.
2000; Grünewald et al. 2001), but for CHY, up-regulation was demonstrated only at
mRNA level (Linden 1999; Steinbrenner and Linden 2001; Steinbrenner and Linden
2003). Grunewald et al. (2001) showed that BKT is located both in chloroplast and
cytosolic lipid vesicles. Moreover, BKT activity is demonstrated in vitro in the lipid
vesicles, indicating that BKT acts not only in the chloroplast, but also in the cytosol.
Multiple forms of BKT have been recently identified and found to be differentially
expressed in response to stress conditions (Huang et al. 2006a).
Recent report showed that the regulation of gene expression under stress
condition is linked to the redox state of the plastoquinone pool (Steinbrenner and
Linden 2003). Blocking the photosynthetic electron transport chain at the level of
plastoquinone reduction will either completely prevent or diminish the light stress
induced up-regulation of carotenoid genes expression. The hypothesis that the stress
response in H. pluvialis may be mediated by ROS is based on the report which
showed that ROS generating compounds such as Fe2+, methyl viologen and methylene
blue resulted in increased astaxanthin accumulation (Kobayashi et al. 1993; Fan et al.
1998; Boussiba 2000). But Steinbrenner and Linden (2001) suggested that ROS
generators are not involved in the transcriptional regulation of PSY and carotenoid
hydroxylase. In corroboration with this finding, previous reports showed that the
effect of Fe2+ on astaxanthin accumulation is independent of de novo protein
biosynthesis and it is suggested that there is a function of ROS at the post-
translational level (Kobayashi et al. 1993).
Some reports on kinetic analysis of enzymes involved in H. pluvialis
astaxanthin biosynthesis suggested the requirement of oxygen, NADPH and Fe2+ for
astaxanthin synthesis (Fraser et al. 1997; Cunningham and Gantt 1998; Fraser et al.
1998). It was proposed that cytochrome P450-dependent enzyme is involved in the
Chapter I Review of Literature
25
transformation of β-carotene to astaxanthin. The hydroxylase activity appears to be
cytochrome P450 dependent, as evidenced by the accumulation of canthaxanthin
when cytochrome P450 enzyme activity was inhibited by a specific inhibitor ellipticin
(Schoefs et al. 2001). The BKT enzymes are not so defined in their substrate
preference. However, the enzymes are strictly oxygen-requiring; and a cofactor
mixture of 2-oxoglutarate, ascorbic acid, and Fe2+ is beneficial to activity.
The gene β-carotene oxygenase (CRTO) of Chlorella zofingiensis has been
cloned and characterized and found to be transiently up-regulated upon glucose
treatment (Huang et al. 2006b). In dark-grown C. zofingiensis, the transcription of
BKT and CHY genes are differently regulated by the metabolism of glucose, through
which the biosynthesis of astaxanthin is regulated. Phosphorylation of glucose
(glucose sensing) was essential to the increased transcription of BKT and CHY genes
and the accumulation of astaxanthin in the dark grown cells. However,
phosphorylation of glucose per se only up-regulated the transcription of CHY and
stimulated the synthesis of zeaxanthin. Blockage of the mitochondrial alternative
pathway eliminated the glucose effects on the increased transcription of BKT and
astaxanthin accumulation, suggesting that signals from alternative pathway was
involved in the up-regulation of BKT transcription. In addition, citrate was shown to
up-regulate the transcription of BKT independent of reactive oxygen species
formation (Li et al. 2008a). Since glucose induced the expression of the BKT, effect of
different sugars in regulation of carotenogenic genes expression was studied. The
various sugars differentially regulated the transcription of the genes. Glucose and
mannose, which supported the best growth and astaxanthin production of the algal
cells, also resulted in the highest transcript levels of all the genes. Fructose, galactose,
and sucrose only moderately enhanced the transcription of the genes; while lactose
which was poorly metabolized by the cells did not up-regulate the transcription of the
carotenogenic genes (Sun et al. 2008).
1.8.7. Differential expression of genes and proteins under conditions
inducing secondary carotenoid production
Recent genomic and proteomic studies in H. pluvialis to investigate global gene and
protein expression revealed that many genes and proteins related to growth,
photosynthesis, and respiration are differentially expressed in addition to up-
regulation of carotenoid genes and enzymes, during secondary carotenogenesis (Hu et
Chapter I Review of Literature
26
al. 2003; Wang et al. 2004a; 2004b; Eom et al. 2005). Such global analysis of
carotenogenesis process will be helpful for identification of differentially expressed
novel genes and gene products since it is possible that some of the gene products may
be involved in regulation of the stress response mechanisms in H. pluvialis.
The protocol optimized by Wang et al. (2003a) for isolation of soluble
proteins from microalgae using H. pluvialis as a model system was successfully
applied to profiling protein expression and cell wall proteins under oxidative stress
condition using two-dimensional gel electrophoresis. Seventy proteins with altered
expression pattern were identified following stress induction to green flagellated cells
by addition of acetate, Fe2+ and high light intensity exposure. Among these
differentially expressed proteins, some key proteins involved in photosynthesis and
nitrogen assimilation were down-regulated, whereas some mitochondrial respiratory
proteins were transiently up-regulated after the onset of stress. Most of the identified
proteins, particularly those from the families of superoxide dismutase, catalase, and
peroxidase, were transiently up-regulated, but reverted to down-regulation during the
6 days of stress (Wang et al. 2004a). Kim et al. (2006) found up-regulation of 22
proteins over two-fold in red cyst cells when compared with the green vegetative
cells. Further analysis of these proteins showed several key enzymes specific to the
carotenoid pathway, including isopentenyl pyrophosphate isomerase and lycopene-β-
cyclase appeared after exposure to high light intensity, which suggested involvement
of these enzymes with carotenoid accumulation in the cytoplasm.
Analysis of cell wall proteins revealed that majority of identified cell wall
proteins are differentially expressed at specific stages of the cell cycle along with a
number of common wall-associated housekeeping proteins. Accumulation of cellulose
synthase orthologue in the vegetative cells and putative cytokinin oxidase at the early
stage of encystment were reported (Wang et al. 2004b). Proteomic analysis of cell
wall-deficient mutants which were developed by chemical mutagenesis revealed that a
majority of the cell wall proteins were present in the wild type and mutant cell walls
throughout the cell cycle. Peptide mass fingerprinting (PMF) identified 55 wall
protein orthologs from these mutants, including a subset of induced proteins known to
be involved in wall construction, remodeling, and defense. Down-regulation of certain
wall proteins in the two mutants was associated with the wall defects, whereas over
expression of other proteins may have compensated for the defective walls in the two
mutants (Wang et al. 2005).
Chapter I Review of Literature
27
Expressed sequence tags (ESTs) generated from a library constructed from
astaxanthin-induced H. pluvialis revealed 63% of the EST sequences showed
similarity to previously described sequences in public databases (Eom et al. 2005).
H. pluvialis was found to consist of relatively high percentage of genes involved in
genetic information processing (15%) and metabolism (11%), and low percentage of
sequences were involved in the signal transduction (3%), structure (2%), and
environmental information process (3%). In addition, a relatively large fraction of
H. pluvialis sequences was classified as genes involved in photosynthesis (9%) and
cellular process (9%). Based on this EST analysis, the full length cDNA sequence for
superoxide dismutase was cloned, and the expression of this gene was changed
substantially in response to different culture conditions, indicating the possible
regulation of this gene in H. pluvialis (Eom et al. 2005). Analysis of cDNA
microarray revealed differential expression of over 144 genes with a minimum of
two-fold changes in red cyst cells produced by exposure of green vegetative cells to
high irradiance and nutrient deprivation. There is a significant decrease in the
expression of photosynthesis-related genes in cyst cells while the expression of
defense or stress related genes and signal transduction genes were induced (Eom et al.
2006).
Differential display technique of Liang and Pardee (1992) was applied to
identify genes that are specifically expressed under stress in Haematococcus. Isolation
and characterization of one such RNA sequence was coding for Haematococcus htrA,
a member of a heat shock serine protease family previously described only in
prokaryotes. In H. pluvialis, transcripts of htrA were found to be differentially spliced,
and the different splice products were differentially expressed during the
developmental process. These transcripts were not detectable in vegetative cells, but
were found at higher levels in developing aplanospores (Hershkovits et al. 1997).
1.9. Metabolic engineering of astaxanthin biosynthesis
Cloning of carotenoid biosynthetic genes is proved to be an essential tool for genetic
manipulation of the pathway in plants to achieve higher carotenoid content or better
carotenoid composition. The prospects of accomplishing these goals through gene
transfer techniques seem to be high in view of the fact that transcriptional regulation
of the biosynthetic genes is the major mechanism that regulates the pathway. A
Chapter I Review of Literature
28
significant accomplishment in the metabolic engineering of carotenoids towards
improving the nutritional value of a major crop has been achieved in rice (Oryza
sativa) and canola (Brassica napus) (Shewmaker et al. 1999; Ye et al. 2000;
Sandmann 2001). In vivo production of astaxanthin and other ketocarotenoids by
organisms that do not synthesize it in a natural way has been achieved by metabolic
engineering in Escherichia coli (Lotan and Hirschberg 1995; Breitenbach et al. 1996),
cyanobacteria (Harker and Hirschberg 1997) and several higher plants (Mann et al.
2000; Stalberg et al. 2003; Ralley and Fraser 2004; Gerjets and Sandmann 2006;
Morris et al. 2006). All these transgenic hosts expressed bkt or BKT genes from
H. pluvialis, crtW genes from several strains of bacteria or CrtO gene from
cyanobacteria.
The gene crtO, which encodes -C-4-oxygenase, a key enzyme in keto-
carotenoid synthesis, was cloned from the alga H. pluvialis. Expression of the algal
CrtO gene in the Synechococcus PCC7942, which normally synthesizes -carotene
and zeaxanthin, enabled the cyanobacterial cells to produce astaxanthin along with
other keto-carotenoids (Harker and Hirschberg 1997). This result confirmed that crtO
can function in conjunction with the intrinsic -carotene hydroxylase that exists in all
plants and algae to produce novel carotenoid species. Transformed tobacco plants that
expressed CrtO in a regulated manner accumulated a high concentration of
ketocarotenoids, including astaxanthin, in the chromoplasts of the nectary tissue in the
flowers, changing their colour from yellow to red (Mann et al. 2000). As expected, the
astaxanthin molecule that is synthesized artificially in the nectary occurs in the
“natural” molecular configuration of the stereoisomer 3S,3'S. This feature
distinguishes the astaxanthin produced in plants from the synthetic pigment, which is
obtained as a mixture of molecules where 75% have different chiralities than the
natural (3S,3'S) astaxanthin (Mann et al. 2000). The biological significance of the
chirality of astaxanthin is not known. In the nectarines of transgenic plants,
canthaxanthin and adonirubin are more abundant than zeaxanthin and adonixanthin,
suggesting that the β-carotene ketolase (CRTO) preferentially uses β-carotene as a
substrate and is more active than the hydroxylase. Trace amounts of ketocarotenoids
found in the leaves of transgenic plants can be explained by the relatively low
expression of CRTO, driven by the tomato PDS promoter, as indicated from the GUS
assay. Unavailability of proper substrates for the β-carotene ketolase in chloroplasts
Chapter I Review of Literature
29
and lack of the ketocarotenoid-accumulating mechanism, i.e. binding proteins and
lipid globules, could also affect astaxanthin formation in plant cells.
Transformation of Arabidopsis with an algal -carotene oxygenase also leads
to the accumulation of ketocarotenoids (Stalberg et al. 2003). In this case the major
ketocarotenoids were 4-keto-lutein, adonirubin and canthaxanthin. In order to enhance
the levels of ketocarotenoids, crosses were made with transgenic Arabidopsis over-
expressing an endogenous phytoene synthase gene (Lindgren et al. 2003), resulting in
an increase in ketocarotenoid content of up to 13-fold over that measured in the single
-carotene oxygenase transgenics. Recent studies demonstrated the accumulation of
astaxanthin in plant storage organs. H. pluvialis bkt1 encoding -carotene ketolase
was expressed in potato tubers (both Solanum tuberosum and S. phureja). In the
transgenic tubers, two major ketocarotenoids, ketolutein and astaxanthin were
detected and the level of unesterified astaxanthin reached ca. 14 µg g-1 DW in some
bkt1 expressing lines of S. phureja but was much lower in the less -carotene
producing S. tuberosum background (Morris et al. 2006). Transgenic carrot plants
which are engineered for ketocarotenoid biosynthetic pathway are produced by
introducing H. pluvialis -carotene ketolase gene. Transgenic lines showed up-
regulation of endogenous -carotene hydroxylase expression in transgenic leaves and
roots, and up to 70% of total carotenoids was converted to novel ketocarotenoids,
with accumulation up to 2,400 µg g-1 root DW. Astaxanthin, adonirubin, and
canthaxanthin were most prevalent, followed by echinenone, adonixanthin and -
cryptoxanthin (Jayaraj et al. 2008). The unicellular chlorophyte Chlamydomonas
reinhardtii has been engineered with bkt1 of H. pluvialis. A typical ketocarotenoid, 4-
ketolutein was observed in all transformants, and no astaxanthin or canthaxanthin was
observed (Leon et al. 2007). The gene coding for phytoene desaturase of H. pluvialis
was modified by site-directed mutagenesis, by changing the leucine codon at position
504 to an arginine codon. Modified PDS was integrated into nuclear genome of
H. pluvialis. One of the transformants showed accelerated accumulation of
astaxanthin compared to wild type upon stress induction (Steinbrenner and Sandmann
2006). These results demonstrate the prospect and potential of genetic engineering of
ketocarotenoid biosynthesis for the production of commercially valuable compound,
astaxanthin in plants.
Chapter II
Expression of Carotenoid Biosynthetic Genes and Carotenoid Accumulation
Chapter II Expression of carotenoid biosynthetic genes and carotenoid accumulation
30
Summary Haematococcus pluvialis, a green alga, accumulates carotenoids, predominantly astaxanthin, when exposed to stress conditions. In the present work, changes in the pigment profile and expression of carotenogenic genes under various nutrient stress conditions and their regulation were studied. Nutrient stress (modified BBM containing 1/10th of N and P) and higher light intensity (60 µmol m-2 s-1) in combination with NaCl/sodium acetate (SA) enhanced total carotenoid and total astaxanthin content to 32.0 and 24.5 mg g–1 of dry biomass, respectively. Expression
of carotenogenic genes, phytoene synthase (PSY), phytoene desaturase (PDS), lycopene cyclase (LCY), β-carotene ketolase (BKT) and β-carotene hydroxylase (CHY) were up-regulated under all the stress conditions studied. However, the extent of expression of carotenogenic genes varied with stress conditions. Nutrient stress and high light intensity induced expression of BKT and CHY, astaxanthin biosynthetic genes transiently. Enhanced expression of these genes was observed with SA and NaCl/SA, while expression was delayed with NaCl. Maximum transcript levels of PSY, PDS, LCY, BKT, and CHY were found to be 158–277, 5–9, 470–674, 28–40 and 451–673-fold higher, respectively, than green vegetative cells. The maximum content of astaxanthin recorded in cells grown in medium with SA and NaCl/SA correlated with the expression profile of the astaxanthin biosynthetic genes. Studies using various inhibitors indicated that general carotenogenesis and secondary carotenoid induction were regulated at both the transcriptional and the cytoplasmic translational levels. The
induction of general carotenoid synthesis genes was independent of cytoplasmic protein synthesis while BKT gene expression was dependent on de novo protein synthesis. The present study also suggests a possible involvement of acetate in the post-transcriptional modifications of carotenoid genes.
Chapter II Expression of carotenoid biosynthetic genes and carotenoid accumulation
31
2.1. Introduction Astaxanthin (3,3'-dihydroxy-β,β-carotene-4,4'-dione), is a commercially important,
high value ketocarotenoid, used as a pigmentation source in the aquaculture and
poultry industries. It has also found applications in the nutraceutical, pharmaceutical,
and cosmetic industries (Guerin et al. 2003; Jin et al. 2006). Haematococcus pluvialis
is a commercially promising source among the astaxanthin-producing organisms,
owing to its ability to accumulate astaxanthin up to 4% (w/w) on a dry weight basis
(Boussiba 2000). It accumulates astaxanthin in response to stress conditions such as
high light intensity, salinity, acetate addition, nutrient depletion, influence of reactive
oxygen species (ROS), and increased C/N ratio (Kobayashi et al. 1993; Sarada et al.
2002).
Carotenoids are ubiquitous and essential components of the photosynthetic
tissues in plants, algae, and cyanobacteria wherein they participate in the light-
harvesting process and protect the photosynthetic apparatus from photo-oxidative
damage (Bartley and Scolnik 1995). In Haematococcus, astaxanthin accumulation
occurs in extra-plastidic lipid globules as a secondary carotenoid (Grünewald et al.
2001). In the biosynthesis of carotenoids, the first committed step, the head-to-head
condensation of geranylgeranyl diphosphate (GGPP) to phytoene, is mediated by the
soluble enzyme phytoene synthase (PSY) (Figure 1.5). The subsequent steps of the
pathway leading to the synthesis of colored carotenoids are carried out by membrane-
localized enzymes such as phytoene desaturase (PDS) and lycopene β-cyclase (LCY)
(Cunningham and Gantt 1998). The biosynthesis of astaxanthin in Haematococcus
follows the general carotenoid pathway up to β-carotene formation. Studies using
carotenogenic inhibitors and in vitro and in vivo analyses of astaxanthin synthesis in
Haematococcus revealed the involvement of two enzymes β-carotene ketolase (BKT)
(synonym: β-carotene oxygenase, CRTO) and β-carotene hydroxylase (CHY or
CRTR-B) in the conversion of β-carotene to astaxanthin. BKT converts β-carotene to
canthaxanthin via echinenone which is further acted upon by CHY resulting in the
formation of astaxanthin (Fan et al. 1995; Lotan and Hirschberg 1995; Fraser et al.
1998). The genes for ζ-carotene desaturase (ZDS) and carotenoid isomerase
(CRTISO) have not been reported in Haematococcus. Although the specific steps of
astaxanthin biosynthesis are carried out in the cytoplasm, the enzymes of the general
Chapter II Expression of carotenoid biosynthetic genes and carotenoid accumulation
32
carotenoid pathway appear to be localized in the chloroplast (Grünewald et al. 2000;
Jin et al. 2006).
Expression of carotenogenic genes has been studied in several plants including
green algae, and transcription of carotenogenic genes were shown to be up-regulated
by light (Bohne and Linden 2002; Simkin et al. 2003; Steinbrenner and Linden 2003;
Romer and Fraser 2005) or a combination of light with N-deprivation (Grünewald et
al. 2000). Although there are reports available on the influence of light on the
expression of carotenogenic genes in Haematococcus, studies on the influences of
other stresses on the expression of carotenogenic genes are limited (Grünewald et al.
2000; Huang et al. 2006a). The life cycle of H. pluvialis contains two distinct phases,
namely a green motile vegetative phase and a non-motile astaxanthin-accumulating
cyst phase (Sarada et al. 2002). This favours the use of Haematococcus as a model
system to study the regulation of secondary carotenogenesis. Under nutrient-limiting
conditions, the induction of astaxanthin accumulation occurs in flagellated cell
(Brinda et al. 2004) which is more advantageous for biochemical analysis and the
extraction of pigments as the cells are fragile. Understanding the molecular basis of
stress-induced astaxanthin accumulation in Haematococcus will be useful for the
optimization of astaxanthin production. Therefore, the present work focused on
establishing a relationship between pigment profile and the corresponding expression
profile of carotenogenic genes under the influence of nutrient depletion combined
with high light intensity, and sodium acetate and NaCl. In order to understand the
regulation of formation of general and secondary carotenoids, transcriptional and
translational inhibitors were used.
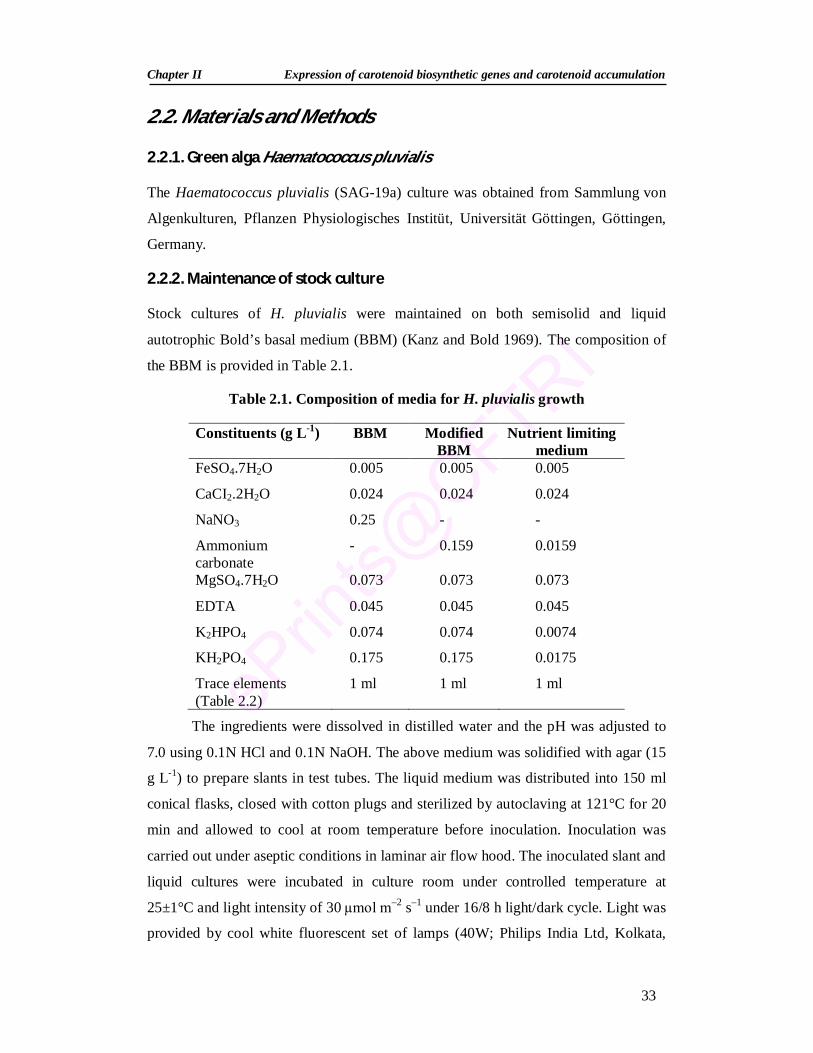
Chapter II Expression of carotenoid biosynthetic genes and carotenoid accumulation
33
2.2. Materials and Methods
2.2.1. Green alga Haematococcus pluvialis
The Haematococcus pluvialis (SAG-19a) culture was obtained from Sammlung von
Algenkulturen, Pflanzen Physiologisches Institüt, Universität Göttingen, Göttingen,
Germany.
2.2.2. Maintenance of stock culture
Stock cultures of H. pluvialis were maintained on both semisolid and liquid
autotrophic Bold’s basal medium (BBM) (Kanz and Bold 1969). The composition of
the BBM is provided in Table 2.1.
Table 2.1. Composition of media for H. pluvialis growth
Constituents (g L-1) BBM Modified BBM
Nutrient limiting medium
FeSO4.7H2O 0.005 0.005 0.005
CaCI2.2H2O 0.024 0.024 0.024
NaNO3 0.25 - -
Ammonium carbonate
- 0.159 0.0159
MgSO4.7H2O 0.073 0.073 0.073
EDTA 0.045 0.045 0.045
K2HPO4 0.074 0.074 0.0074
KH2PO4 0.175 0.175 0.0175
Trace elements (Table 2.2)
1 ml 1 ml 1 ml
The ingredients were dissolved in distilled water and the pH was adjusted to
7.0 using 0.1N HCl and 0.1N NaOH. The above medium was solidified with agar (15
g L-1) to prepare slants in test tubes. The liquid medium was distributed into 150 ml
conical flasks, closed with cotton plugs and sterilized by autoclaving at 121°C for 20
min and allowed to cool at room temperature before inoculation. Inoculation was
carried out under aseptic conditions in laminar air flow hood. The inoculated slant and
liquid cultures were incubated in culture room under controlled temperature at
25±1°C and light intensity of 30 µmol m–2 s–1 under 16/8 h light/dark cycle. Light was
provided by cool white fluorescent set of lamps (40W; Philips India Ltd, Kolkata,
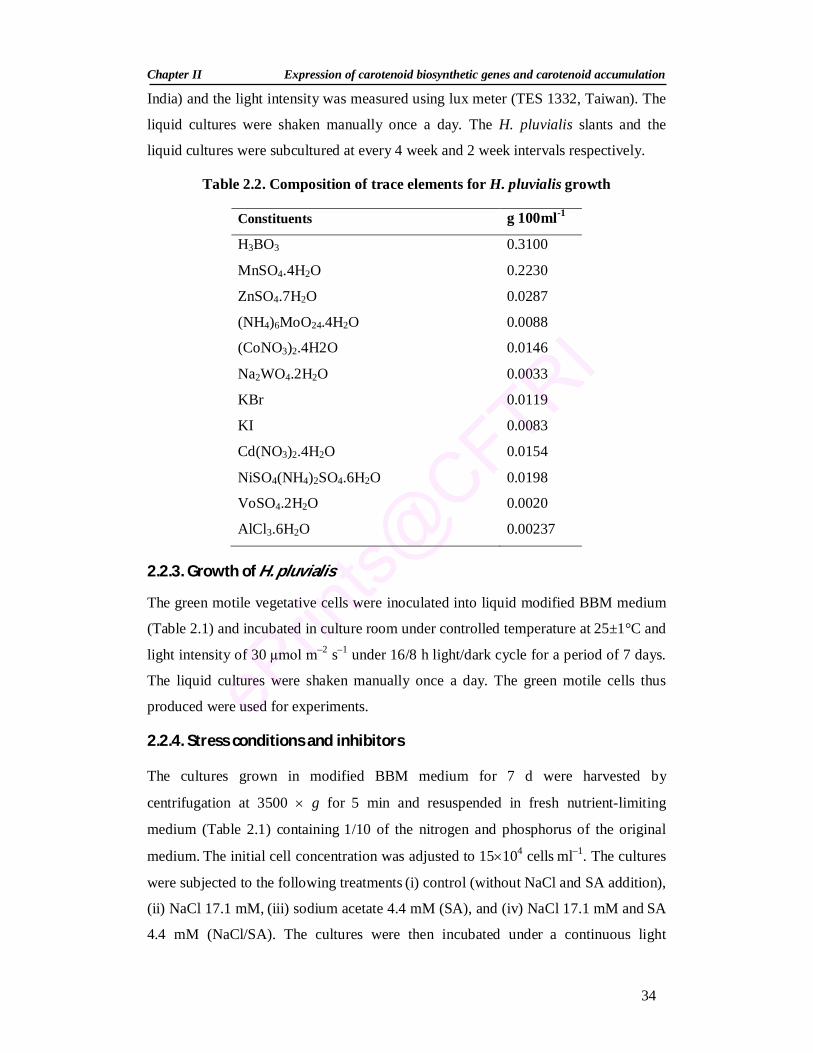
Chapter II Expression of carotenoid biosynthetic genes and carotenoid accumulation
34
India) and the light intensity was measured using lux meter (TES 1332, Taiwan). The
liquid cultures were shaken manually once a day. The H. pluvialis slants and the
liquid cultures were subcultured at every 4 week and 2 week intervals respectively.
Table 2.2. Composition of trace elements for H. pluvialis growth
Constituents g 100ml-1
H3BO3 0.3100
MnSO4.4H2O 0.2230
ZnSO4.7H2O 0.0287
(NH4)6MoO24.4H2O 0.0088
(CoNO3)2.4H2O 0.0146
Na2WO4.2H2O 0.0033
KBr 0.0119
KI 0.0083
Cd(NO3)2.4H2O 0.0154
NiSO4(NH4)2SO4.6H2O 0.0198
VoSO4.2H2O 0.0020
AlCl3.6H2O 0.00237
2.2.3. Growth of H. pluvialis
The green motile vegetative cells were inoculated into liquid modified BBM medium
(Table 2.1) and incubated in culture room under controlled temperature at 25±1°C and
light intensity of 30 µmol m–2 s–1 under 16/8 h light/dark cycle for a period of 7 days.
The liquid cultures were shaken manually once a day. The green motile cells thus
produced were used for experiments.
2.2.4. Stress conditions and inhibitors
The cultures grown in modified BBM medium for 7 d were harvested by
centrifugation at 3500 g for 5 min and resuspended in fresh nutrient-limiting
medium (Table 2.1) containing 1/10 of the nitrogen and phosphorus of the original
medium. The initial cell concentration was adjusted to 15104 cells ml–1. The cultures
were subjected to the following treatments (i) control (without NaCl and SA addition),
(ii) NaCl 17.1 mM, (iii) sodium acetate 4.4 mM (SA), and (iv) NaCl 17.1 mM and SA
4.4 mM (NaCl/SA). The cultures were then incubated under a continuous light
Chapter II Expression of carotenoid biosynthetic genes and carotenoid accumulation
35
intensity of 60 µmol m–2 s–1. The transcriptional inhibitor actinomycin D (SRL,
Mumbai, India), the cytoplasmic translational inhibitor, cycloheximide (Sigma-
Aldrich, Bangalore, India), and the organellar translational inhibitor, chloramphenicol
(HiMedia, Mumbai, India) were added at concentrations of 10 µg ml–1, 300 ng ml–1,
and 50 µg ml–1, respectively at the time of stress induction.
2.2.5. Growth measurement
2.2.5.1. Cell number
Algal cell number was determined by counting algal cells using Neubauer
haemacytometer (Thoma neu, Germany) and expressed as number of cells ml-1.
2.2.5.2. Dry weight
Known volume of culture was centrifuged at 3000 g for 10 min and the algal
biomass was washed with distilled water and dried in a hot air oven (Sanyo, Electrical
Biomedical Co. Ltd., Japan) at 60°C till constant weight was obtained. Biomass
weight was expressed as g L-1.
2.2.6. Extraction and estimation of pigments
2.2.6.1. Pigment extraction
For pigment analysis, an aliquot of culture was harvested by centrifugation at 3000
g for 10 min and freeze-dried. A known quantity of biomass was extracted with 90%
acetone in a mortar and pestle using neutralized sand. The extraction was repeated till
the pellet became colorless. The extracts were centrifuged at 8800 g for 5 min and
the supernatants were pooled. Aliquot of extract is flushed with N2 gas and stored at -
20C preferably at -80C for spectrophotometric analysis, and another aliquot of
extract was evaporated to dryness using N2 gas and stored at -20C or -80C for TLC
and HPLC analysis. All operations were carried out under dim light
2.2.6.2. Spectrophotometric estimation of pigments
The acetone extracts absorbance was recorded at 470, 480, 645 and 661.5 nm using
spectrophotometer (Shimadzu 160A). Chlorophyll and total carotenoid contents were
calculated using following Lichtenthaler (1987) equations.
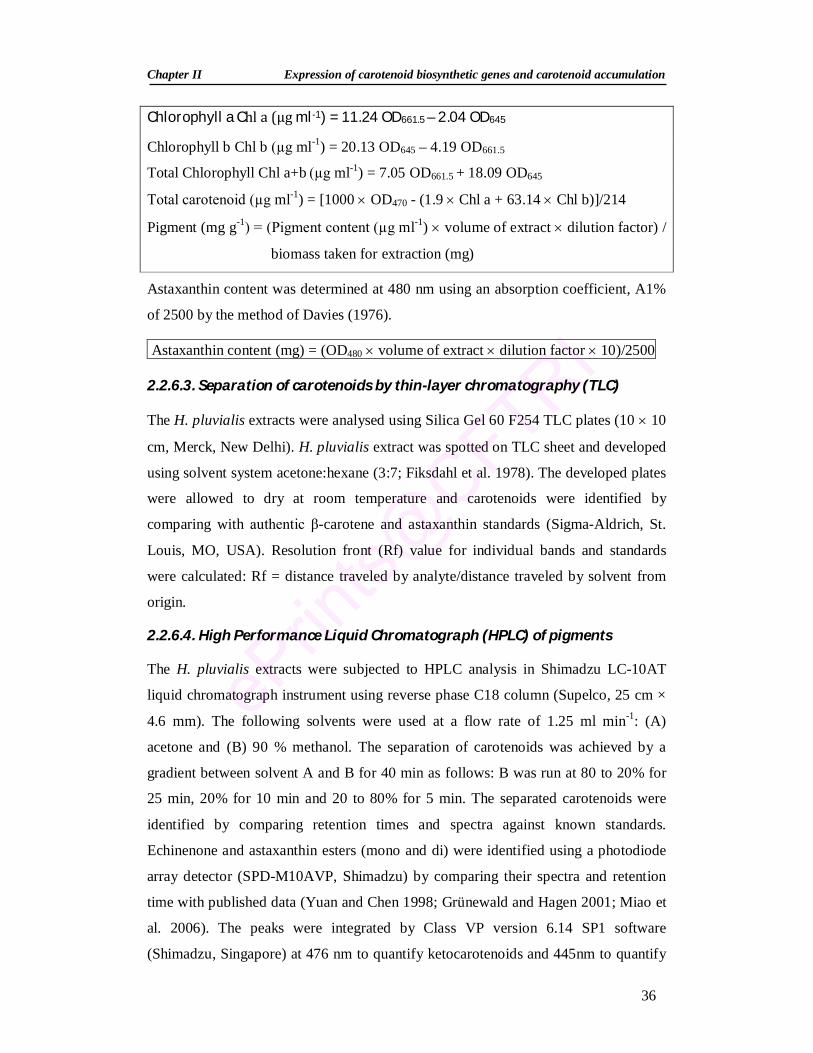
Chapter II Expression of carotenoid biosynthetic genes and carotenoid accumulation
36
Chlorophyll a Chl a (µg ml-1) = 11.24 OD661.5 – 2.04 OD645
Chlorophyll b Chl b (µg ml-1) = 20.13 OD645 – 4.19 OD661.5
Total Chlorophyll Chl a+b (µg ml-1) = 7.05 OD661.5 + 18.09 OD645
Total carotenoid (µg ml-1) = [1000 OD470 - (1.9 Chl a + 63.14 Chl b)]/214
Pigment (mg g-1) = (Pigment content (µg ml-1) volume of extract dilution factor) /
biomass taken for extraction (mg)
Astaxanthin content was determined at 480 nm using an absorption coefficient, A1%
of 2500 by the method of Davies (1976).
Astaxanthin content (mg) = (OD480 volume of extract dilution factor 10)/2500
2.2.6.3. Separation of carotenoids by thin-layer chromatography (TLC)
The H. pluvialis extracts were analysed using Silica Gel 60 F254 TLC plates (10 10
cm, Merck, New Delhi). H. pluvialis extract was spotted on TLC sheet and developed
using solvent system acetone:hexane (3:7; Fiksdahl et al. 1978). The developed plates
were allowed to dry at room temperature and carotenoids were identified by
comparing with authentic β-carotene and astaxanthin standards (Sigma-Aldrich, St.
Louis, MO, USA). Resolution front (Rf) value for individual bands and standards
were calculated: Rf = distance traveled by analyte/distance traveled by solvent from
origin.
2.2.6.4. High Performance Liquid Chromatograph (HPLC) of pigments
The H. pluvialis extracts were subjected to HPLC analysis in Shimadzu LC-10AT
liquid chromatograph instrument using reverse phase C18 column (Supelco, 25 cm ×
4.6 mm). The following solvents were used at a flow rate of 1.25 ml min-1: (A)
acetone and (B) 90 % methanol. The separation of carotenoids was achieved by a
gradient between solvent A and B for 40 min as follows: B was run at 80 to 20% for
25 min, 20% for 10 min and 20 to 80% for 5 min. The separated carotenoids were
identified by comparing retention times and spectra against known standards.
Echinenone and astaxanthin esters (mono and di) were identified using a photodiode
array detector (SPD-M10AVP, Shimadzu) by comparing their spectra and retention
time with published data (Yuan and Chen 1998; Grünewald and Hagen 2001; Miao et
al. 2006). The peaks were integrated by Class VP version 6.14 SP1 software
(Shimadzu, Singapore) at 476 nm to quantify ketocarotenoids and 445nm to quantify
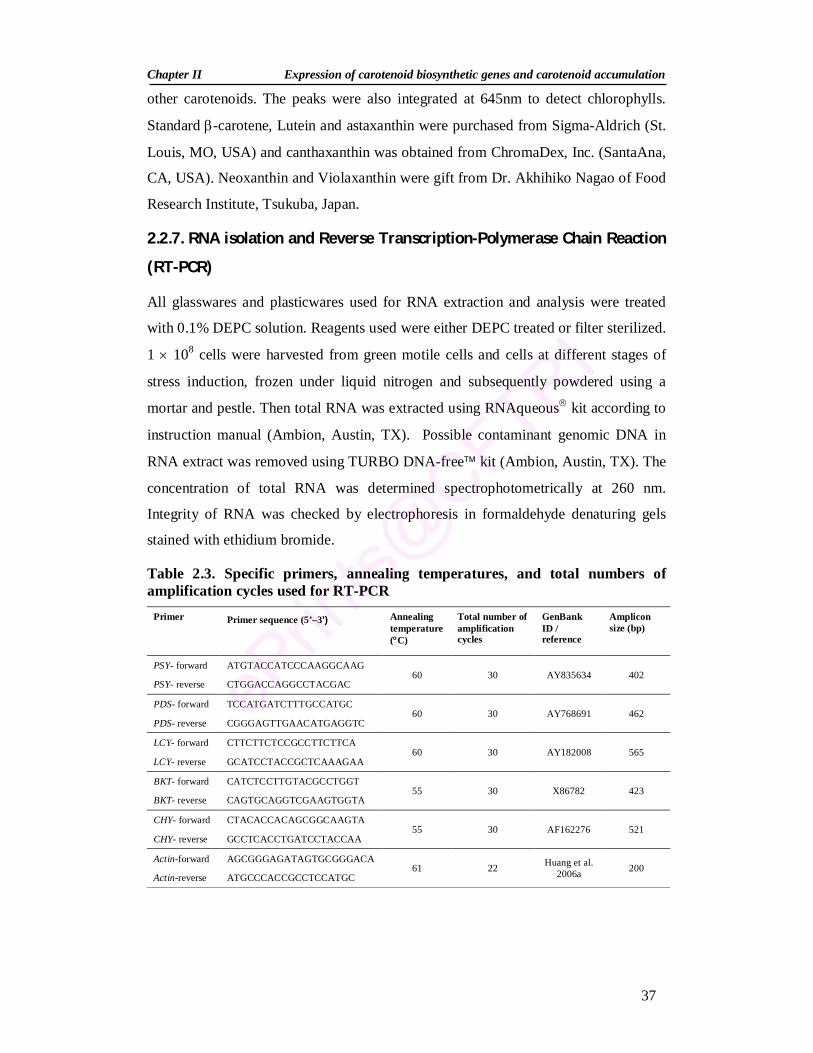
Chapter II Expression of carotenoid biosynthetic genes and carotenoid accumulation
37
other carotenoids. The peaks were also integrated at 645nm to detect chlorophylls.
Standard -carotene, Lutein and astaxanthin were purchased from Sigma-Aldrich (St.
Louis, MO, USA) and canthaxanthin was obtained from ChromaDex, Inc. (SantaAna,
CA, USA). Neoxanthin and Violaxanthin were gift from Dr. Akhihiko Nagao of Food
Research Institute, Tsukuba, Japan.
2.2.7. RNA isolation and Reverse Transcription-Polymerase Chain Reaction
(RT-PCR)
All glasswares and plasticwares used for RNA extraction and analysis were treated
with 0.1% DEPC solution. Reagents used were either DEPC treated or filter sterilized.
1 108 cells were harvested from green motile cells and cells at different stages of
stress induction, frozen under liquid nitrogen and subsequently powdered using a
mortar and pestle. Then total RNA was extracted using RNAqueous kit according to
instruction manual (Ambion, Austin, TX). Possible contaminant genomic DNA in
RNA extract was removed using TURBO DNA-free kit (Ambion, Austin, TX). The
concentration of total RNA was determined spectrophotometrically at 260 nm.
Integrity of RNA was checked by electrophoresis in formaldehyde denaturing gels
stained with ethidium bromide.
Table 2.3. Specific primers, annealing temperatures, and total numbers of amplification cycles used for RT-PCR
Primer Primer sequence (5’–3’) Annealing temperature (C)
Total number of amplification cycles
GenBank ID / reference
Amplicon size (bp)
PSY- forward ATGTACCATCCCAAGGCAAG 60 30 AY835634 402
PSY- reverse CTGGACCAGGCCTACGAC
PDS- forward TCCATGATCTTTGCCATGC 60 30 AY768691 462
PDS- reverse CGGGAGTTGAACATGAGGTC
LCY- forward CTTCTTCTCCGCCTTCTTCA 60 30 AY182008 565
LCY- reverse GCATCCTACCGCTCAAAGAA
BKT- forward CATCTCCTTGTACGCCTGGT 55 30 X86782 423
BKT- reverse CAGTGCAGGTCGAAGTGGTA
CHY- forward CTACACCACAGCGGCAAGTA 55 30 AF162276 521
CHY- reverse GCCTCACCTGATCCTACCAA
Actin-forward AGCGGGAGATAGTGCGGGACA 61 22 Huang et al.
2006a 200 Actin-reverse ATGCCCACCGCCTCCATGC
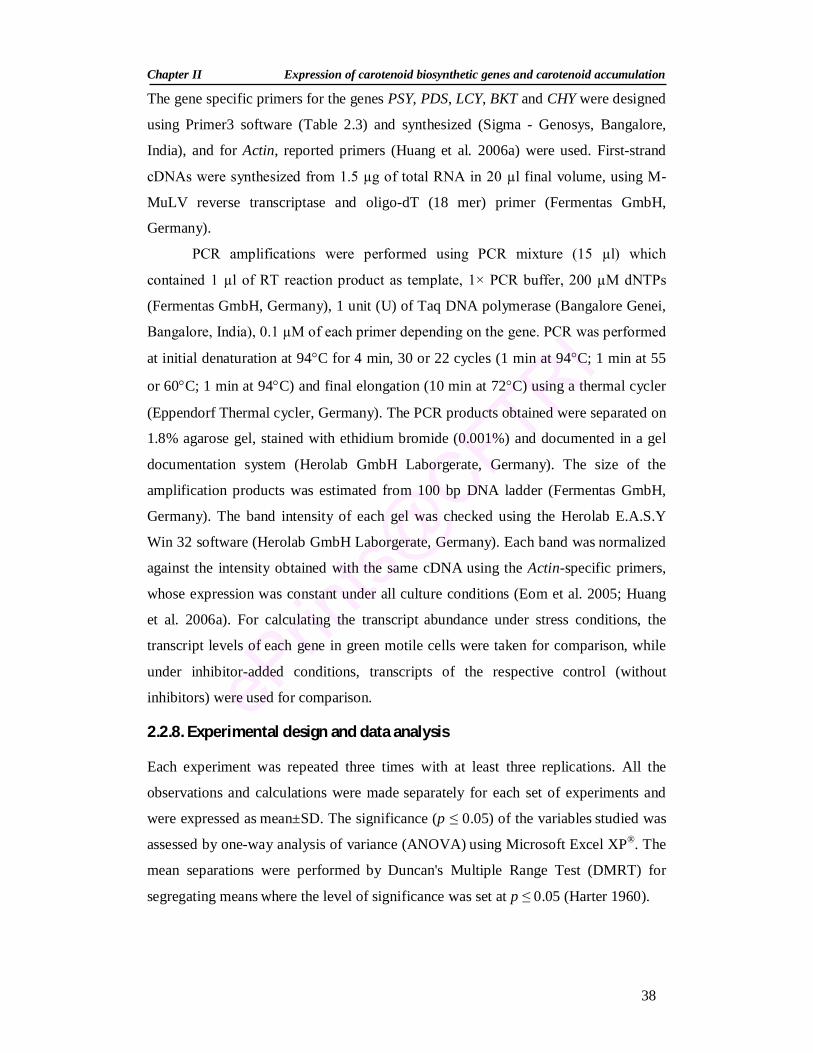
Chapter II Expression of carotenoid biosynthetic genes and carotenoid accumulation
38
The gene specific primers for the genes PSY, PDS, LCY, BKT and CHY were designed
using Primer3 software (Table 2.3) and synthesized (Sigma - Genosys, Bangalore,
India), and for Actin, reported primers (Huang et al. 2006a) were used. First-strand
cDNAs were synthesized from 1.5 µg of total RNA in 20 µl final volume, using M-
MuLV reverse transcriptase and oligo-dT (18 mer) primer (Fermentas GmbH,
Germany).
PCR amplifications were performed using PCR mixture (15 µl) which
contained 1 µl of RT reaction product as template, 1× PCR buffer, 200 µM dNTPs
(Fermentas GmbH, Germany), 1 unit (U) of Taq DNA polymerase (Bangalore Genei,
Bangalore, India), 0.1 µM of each primer depending on the gene. PCR was performed
at initial denaturation at 94C for 4 min, 30 or 22 cycles (1 min at 94C; 1 min at 55
or 60C; 1 min at 94C) and final elongation (10 min at 72C) using a thermal cycler
(Eppendorf Thermal cycler, Germany). The PCR products obtained were separated on
1.8% agarose gel, stained with ethidium bromide (0.001%) and documented in a gel
documentation system (Herolab GmbH Laborgerate, Germany). The size of the
amplification products was estimated from 100 bp DNA ladder (Fermentas GmbH,
Germany). The band intensity of each gel was checked using the Herolab E.A.S.Y
Win 32 software (Herolab GmbH Laborgerate, Germany). Each band was normalized
against the intensity obtained with the same cDNA using the Actin-specific primers,
whose expression was constant under all culture conditions (Eom et al. 2005; Huang
et al. 2006a). For calculating the transcript abundance under stress conditions, the
transcript levels of each gene in green motile cells were taken for comparison, while
under inhibitor-added conditions, transcripts of the respective control (without
inhibitors) were used for comparison.
2.2.8. Experimental design and data analysis
Each experiment was repeated three times with at least three replications. All the
observations and calculations were made separately for each set of experiments and
were expressed as mean±SD. The significance (p ≤ 0.05) of the variables studied was
assessed by one-way analysis of variance (ANOVA) using Microsoft Excel XP®. The
mean separations were performed by Duncan's Multiple Range Test (DMRT) for
segregating means where the level of significance was set at p ≤ 0.05 (Harter 1960).
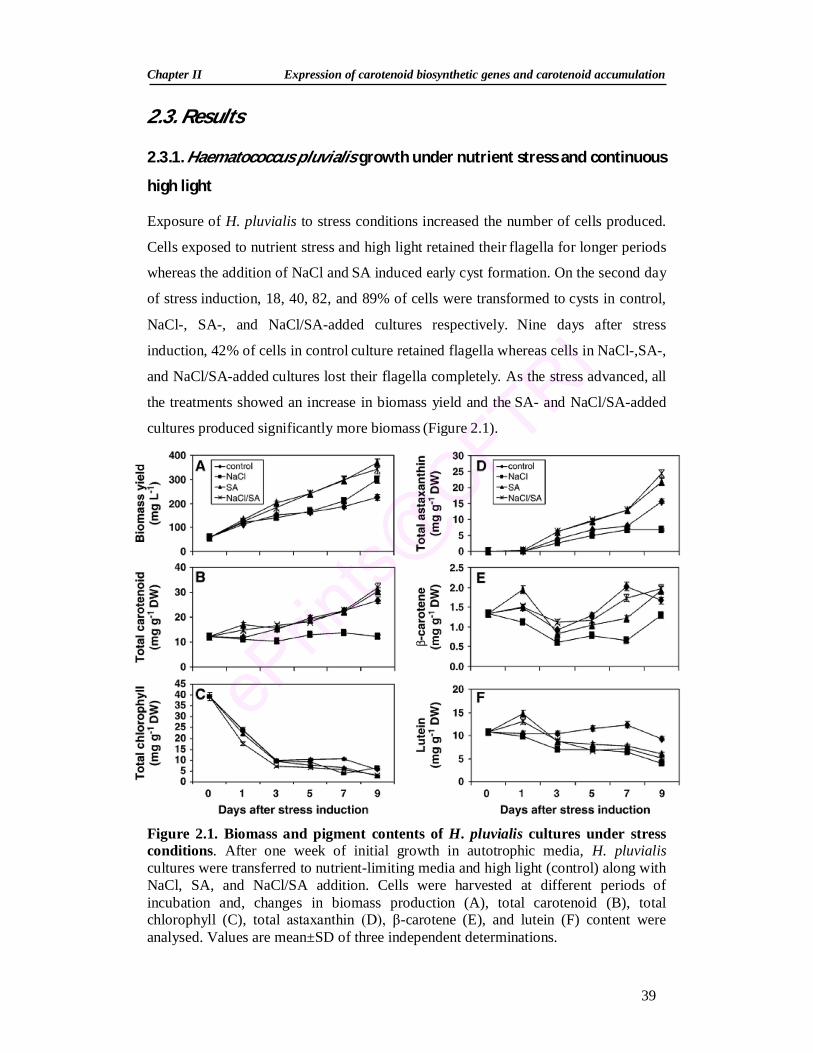
Chapter II Expression of carotenoid biosynthetic genes and carotenoid accumulation
39
2.3. Results
2.3.1. Haematococcus pluvialis growth under nutrient stress and continuous
high light
Exposure of H. pluvialis to stress conditions increased the number of cells produced.
Cells exposed to nutrient stress and high light retained their flagella for longer periods
whereas the addition of NaCl and SA induced early cyst formation. On the second day
of stress induction, 18, 40, 82, and 89% of cells were transformed to cysts in control,
NaCl-, SA-, and NaCl/SA-added cultures respectively. Nine days after stress
induction, 42% of cells in control culture retained flagella whereas cells in NaCl-,SA-,
and NaCl/SA-added cultures lost their flagella completely. As the stress advanced, all
the treatments showed an increase in biomass yield and the SA- and NaCl/SA-added
cultures produced significantly more biomass (Figure 2.1).
Figure 2.1. Biomass and pigment contents of H. pluvialis cultures under stress conditions. After one week of initial growth in autotrophic media, H. pluvialis cultures were transferred to nutrient-limiting media and high light (control) along with NaCl, SA, and NaCl/SA addition. Cells were harvested at different periods of incubation and, changes in biomass production (A), total carotenoid (B), total chlorophyll (C), total astaxanthin (D), β-carotene (E), and lutein (F) content were analysed. Values are mean±SD of three independent determinations.
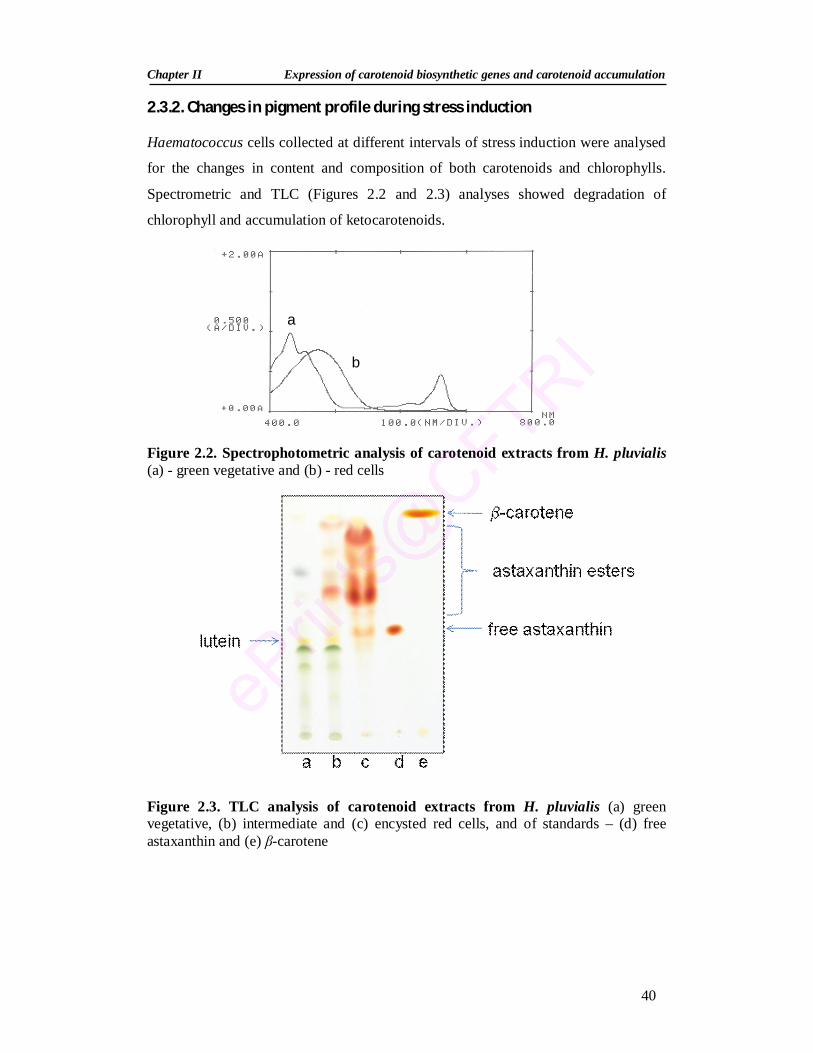
Chapter II Expression of carotenoid biosynthetic genes and carotenoid accumulation
40
2.3.2. Changes in pigment profile during stress induction
Haematococcus cells collected at different intervals of stress induction were analysed
for the changes in content and composition of both carotenoids and chlorophylls.
Spectrometric and TLC (Figures 2.2 and 2.3) analyses showed degradation of
chlorophyll and accumulation of ketocarotenoids.
Figure 2.2. Spectrophotometric analysis of carotenoid extracts from H. pluvialis (a) - green vegetative and (b) - red cells
Figure 2.3. TLC analysis of carotenoid extracts from H. pluvialis (a) green vegetative, (b) intermediate and (c) encysted red cells, and of standards – (d) free astaxanthin and (e) β-carotene
a
b
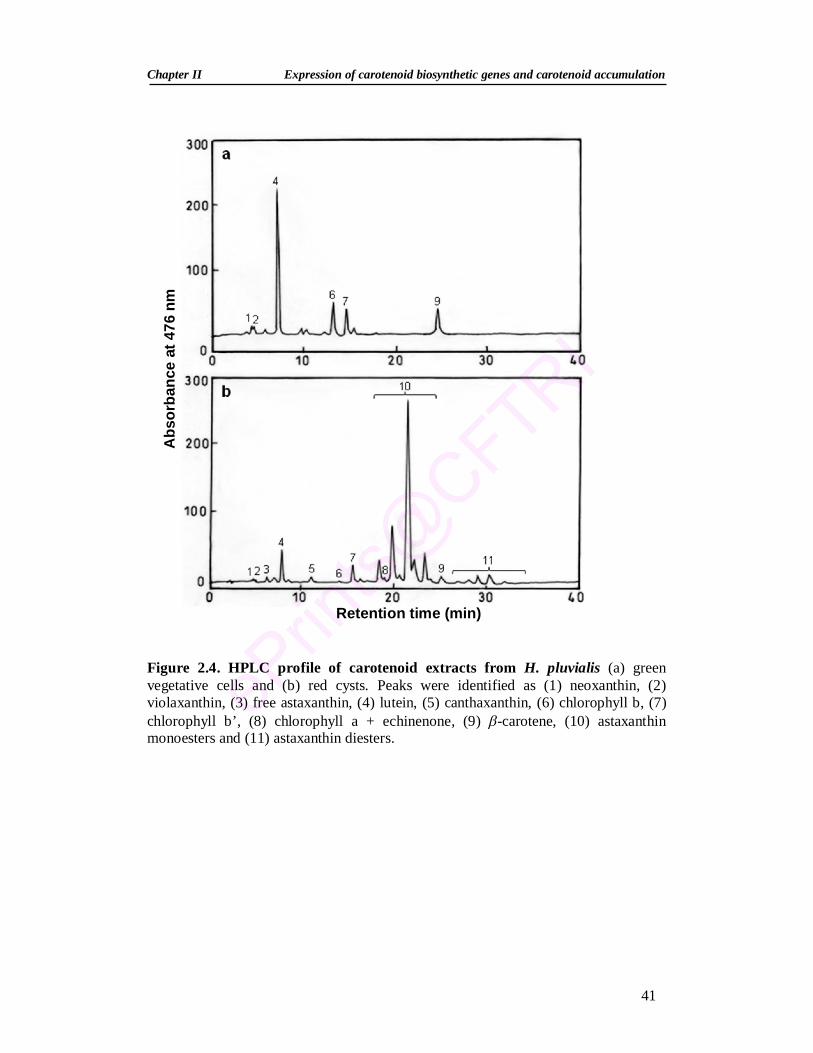
Chapter II Expression of carotenoid biosynthetic genes and carotenoid accumulation
41
Abs
orba
nce
at 4
76 n
m
Figure 2.4. HPLC profile of carotenoid extracts from H. pluvialis (a) green vegetative cells and (b) red cysts. Peaks were identified as (1) neoxanthin, (2) violaxanthin, (3) free astaxanthin, (4) lutein, (5) canthaxanthin, (6) chlorophyll b, (7) chlorophyll b’, (8) chlorophyll a + echinenone, (9) -carotene, (10) astaxanthin monoesters and (11) astaxanthin diesters.
Retention time (min)
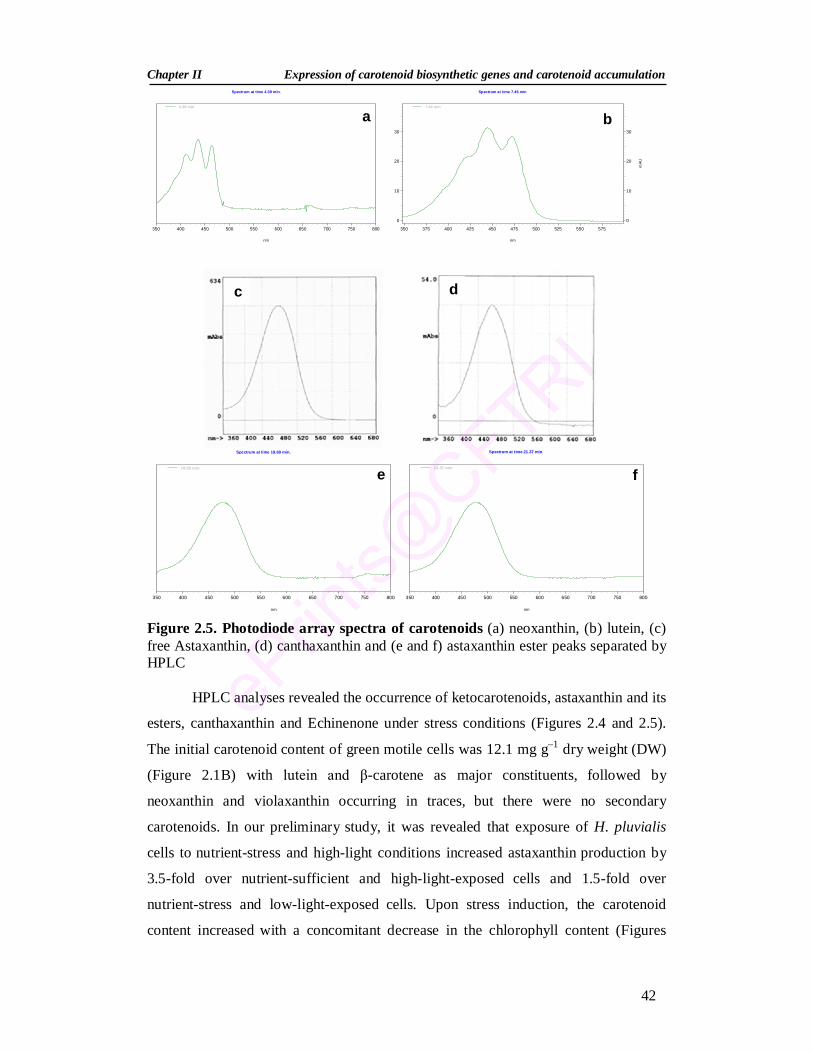
Chapter II Expression of carotenoid biosynthetic genes and carotenoid accumulation
42
Spectrum at time 4.39 min.
nm
350 400 450 500 550 600 650 700 750 800
4.39 min
Spectrum at time 7.46 min.
nm
350 375 400 425 450 475 500 525 550 575
0
10
20
30
mAU
0
10
20
30
7.46 min
Spectrum at time 19.69 min.
nm
350 400 450 500 550 600 650 700 750 800
19.69 min
Spectrum at time 21.37 min.
nm
350 400 450 500 550 600 650 700 750 800
21.37 min
Figure 2.5. Photodiode array spectra of carotenoids (a) neoxanthin, (b) lutein, (c) free Astaxanthin, (d) canthaxanthin and (e and f) astaxanthin ester peaks separated by HPLC
HPLC analyses revealed the occurrence of ketocarotenoids, astaxanthin and its
esters, canthaxanthin and Echinenone under stress conditions (Figures 2.4 and 2.5).
The initial carotenoid content of green motile cells was 12.1 mg g–1 dry weight (DW)
(Figure 2.1B) with lutein and β-carotene as major constituents, followed by
neoxanthin and violaxanthin occurring in traces, but there were no secondary
carotenoids. In our preliminary study, it was revealed that exposure of H. pluvialis
cells to nutrient-stress and high-light conditions increased astaxanthin production by
3.5-fold over nutrient-sufficient and high-light-exposed cells and 1.5-fold over
nutrient-stress and low-light-exposed cells. Upon stress induction, the carotenoid
content increased with a concomitant decrease in the chlorophyll content (Figures
b a
c d
e f
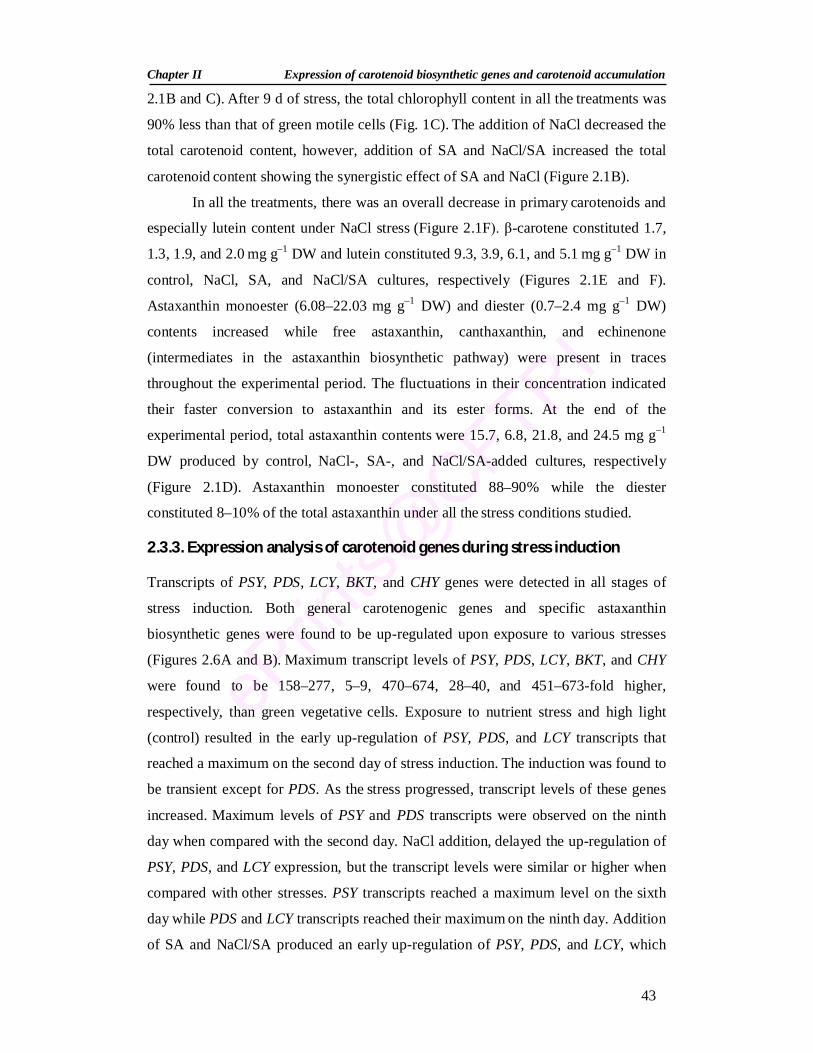
Chapter II Expression of carotenoid biosynthetic genes and carotenoid accumulation
43
2.1B and C). After 9 d of stress, the total chlorophyll content in all the treatments was
90% less than that of green motile cells (Fig. 1C). The addition of NaCl decreased the
total carotenoid content, however, addition of SA and NaCl/SA increased the total
carotenoid content showing the synergistic effect of SA and NaCl (Figure 2.1B).
In all the treatments, there was an overall decrease in primary carotenoids and
especially lutein content under NaCl stress (Figure 2.1F). β-carotene constituted 1.7,
1.3, 1.9, and 2.0 mg g–1 DW and lutein constituted 9.3, 3.9, 6.1, and 5.1 mg g–1 DW in
control, NaCl, SA, and NaCl/SA cultures, respectively (Figures 2.1E and F).
Astaxanthin monoester (6.08–22.03 mg g–1 DW) and diester (0.7–2.4 mg g–1 DW)
contents increased while free astaxanthin, canthaxanthin, and echinenone
(intermediates in the astaxanthin biosynthetic pathway) were present in traces
throughout the experimental period. The fluctuations in their concentration indicated
their faster conversion to astaxanthin and its ester forms. At the end of the
experimental period, total astaxanthin contents were 15.7, 6.8, 21.8, and 24.5 mg g–1
DW produced by control, NaCl-, SA-, and NaCl/SA-added cultures, respectively
(Figure 2.1D). Astaxanthin monoester constituted 88–90% while the diester
constituted 8–10% of the total astaxanthin under all the stress conditions studied.
2.3.3. Expression analysis of carotenoid genes during stress induction
Transcripts of PSY, PDS, LCY, BKT, and CHY genes were detected in all stages of
stress induction. Both general carotenogenic genes and specific astaxanthin
biosynthetic genes were found to be up-regulated upon exposure to various stresses
(Figures 2.6A and B). Maximum transcript levels of PSY, PDS, LCY, BKT, and CHY
were found to be 158–277, 5–9, 470–674, 28–40, and 451–673-fold higher,
respectively, than green vegetative cells. Exposure to nutrient stress and high light
(control) resulted in the early up-regulation of PSY, PDS, and LCY transcripts that
reached a maximum on the second day of stress induction. The induction was found to
be transient except for PDS. As the stress progressed, transcript levels of these genes
increased. Maximum levels of PSY and PDS transcripts were observed on the ninth
day when compared with the second day. NaCl addition, delayed the up-regulation of
PSY, PDS, and LCY expression, but the transcript levels were similar or higher when
compared with other stresses. PSY transcripts reached a maximum level on the sixth
day while PDS and LCY transcripts reached their maximum on the ninth day. Addition
of SA and NaCl/SA produced an early up-regulation of PSY, PDS, and LCY, which
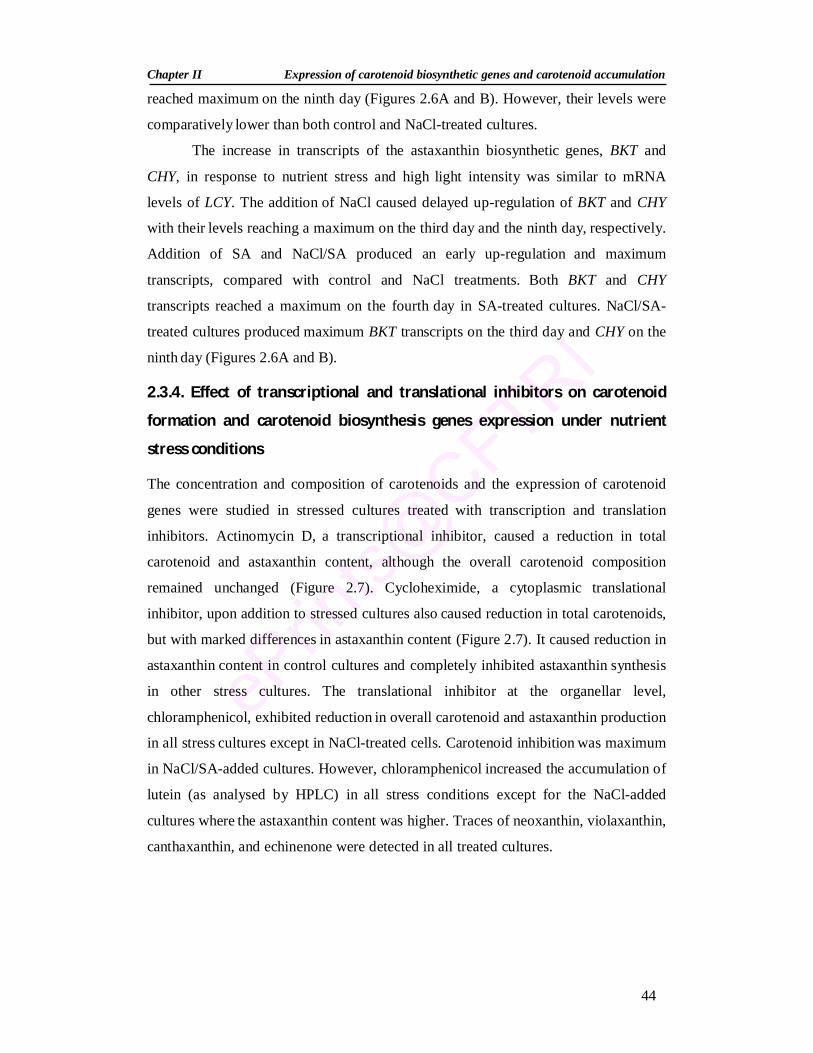
Chapter II Expression of carotenoid biosynthetic genes and carotenoid accumulation
44
reached maximum on the ninth day (Figures 2.6A and B). However, their levels were
comparatively lower than both control and NaCl-treated cultures.
The increase in transcripts of the astaxanthin biosynthetic genes, BKT and
CHY, in response to nutrient stress and high light intensity was similar to mRNA
levels of LCY. The addition of NaCl caused delayed up-regulation of BKT and CHY
with their levels reaching a maximum on the third day and the ninth day, respectively.
Addition of SA and NaCl/SA produced an early up-regulation and maximum
transcripts, compared with control and NaCl treatments. Both BKT and CHY
transcripts reached a maximum on the fourth day in SA-treated cultures. NaCl/SA-
treated cultures produced maximum BKT transcripts on the third day and CHY on the
ninth day (Figures 2.6A and B).
2.3.4. Effect of transcriptional and translational inhibitors on carotenoid
formation and carotenoid biosynthesis genes expression under nutrient
stress conditions
The concentration and composition of carotenoids and the expression of carotenoid
genes were studied in stressed cultures treated with transcription and translation
inhibitors. Actinomycin D, a transcriptional inhibitor, caused a reduction in total
carotenoid and astaxanthin content, although the overall carotenoid composition
remained unchanged (Figure 2.7). Cycloheximide, a cytoplasmic translational
inhibitor, upon addition to stressed cultures also caused reduction in total carotenoids,
but with marked differences in astaxanthin content (Figure 2.7). It caused reduction in
astaxanthin content in control cultures and completely inhibited astaxanthin synthesis
in other stress cultures. The translational inhibitor at the organellar level,
chloramphenicol, exhibited reduction in overall carotenoid and astaxanthin production
in all stress cultures except in NaCl-treated cells. Carotenoid inhibition was maximum
in NaCl/SA-added cultures. However, chloramphenicol increased the accumulation of
lutein (as analysed by HPLC) in all stress conditions except for the NaCl-added
cultures where the astaxanthin content was higher. Traces of neoxanthin, violaxanthin,
canthaxanthin, and echinenone were detected in all treated cultures.
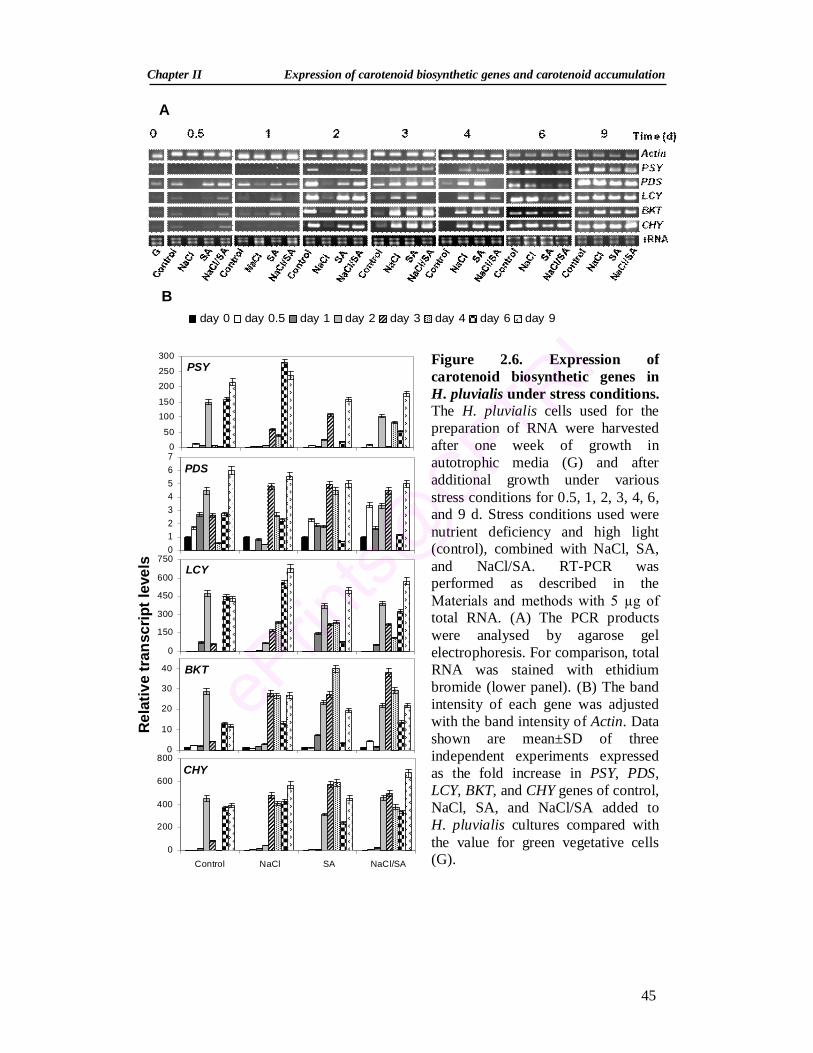
Chapter II Expression of carotenoid biosynthetic genes and carotenoid accumulation
45
A
0
10
20
30
40
0
200
400
600
800
Control NaCl SA NaCl/SA
0
150
300
450
600
750012345670
50
100150
200
250
300
Rel
ativ
e tr
ansc
ript l
evel
s
PSY
PDS
LCY
BKT
CHY
Figure 2.6. Expression of carotenoid biosynthetic genes in H. pluvialis under stress conditions. The H. pluvialis cells used for the preparation of RNA were harvested after one week of growth in autotrophic media (G) and after additional growth under various stress conditions for 0.5, 1, 2, 3, 4, 6, and 9 d. Stress conditions used were nutrient deficiency and high light (control), combined with NaCl, SA, and NaCl/SA. RT-PCR was performed as described in the Materials and methods with 5 µg of total RNA. (A) The PCR products were analysed by agarose gel electrophoresis. For comparison, total RNA was stained with ethidium bromide (lower panel). (B) The band intensity of each gene was adjusted with the band intensity of Actin. Data shown are mean±SD of three independent experiments expressed as the fold increase in PSY, PDS, LCY, BKT, and CHY genes of control, NaCl, SA, and NaCl/SA added to H. pluvialis cultures compared with the value for green vegetative cells (G).
B day 0 day 0.5 day 1 day 2 day 3 day 4 day 6 day 9
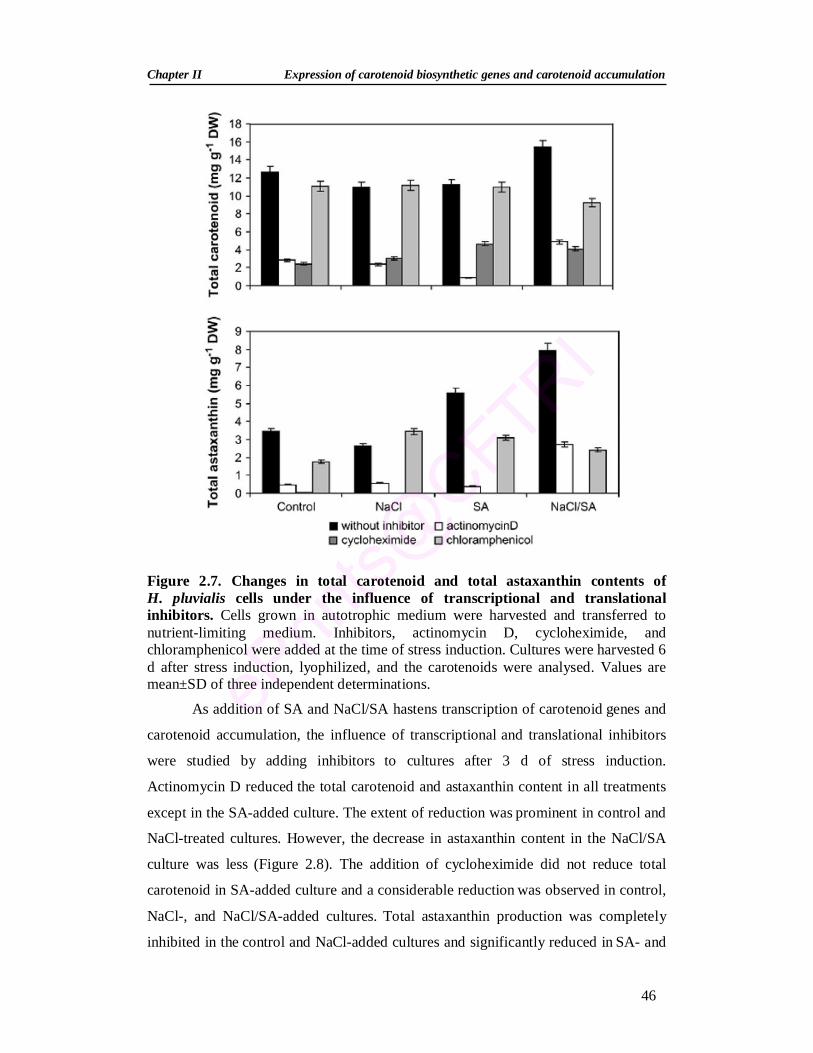
Chapter II Expression of carotenoid biosynthetic genes and carotenoid accumulation
46
Figure 2.7. Changes in total carotenoid and total astaxanthin contents of H. pluvialis cells under the influence of transcriptional and translational inhibitors. Cells grown in autotrophic medium were harvested and transferred to nutrient-limiting medium. Inhibitors, actinomycin D, cycloheximide, and chloramphenicol were added at the time of stress induction. Cultures were harvested 6 d after stress induction, lyophilized, and the carotenoids were analysed. Values are mean±SD of three independent determinations.
As addition of SA and NaCl/SA hastens transcription of carotenoid genes and
carotenoid accumulation, the influence of transcriptional and translational inhibitors
were studied by adding inhibitors to cultures after 3 d of stress induction.
Actinomycin D reduced the total carotenoid and astaxanthin content in all treatments
except in the SA-added culture. The extent of reduction was prominent in control and
NaCl-treated cultures. However, the decrease in astaxanthin content in the NaCl/SA
culture was less (Figure 2.8). The addition of cycloheximide did not reduce total
carotenoid in SA-added culture and a considerable reduction was observed in control,
NaCl-, and NaCl/SA-added cultures. Total astaxanthin production was completely
inhibited in the control and NaCl-added cultures and significantly reduced in SA- and
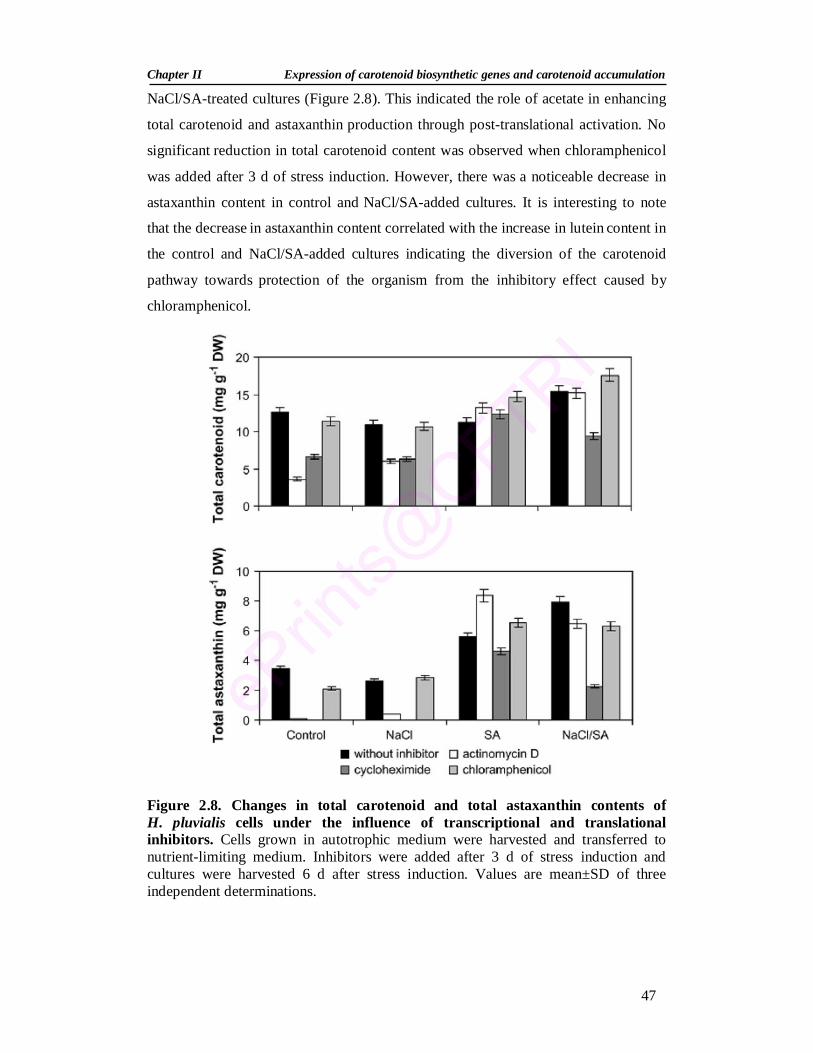
Chapter II Expression of carotenoid biosynthetic genes and carotenoid accumulation
47
NaCl/SA-treated cultures (Figure 2.8). This indicated the role of acetate in enhancing
total carotenoid and astaxanthin production through post-translational activation. No
significant reduction in total carotenoid content was observed when chloramphenicol
was added after 3 d of stress induction. However, there was a noticeable decrease in
astaxanthin content in control and NaCl/SA-added cultures. It is interesting to note
that the decrease in astaxanthin content correlated with the increase in lutein content in
the control and NaCl/SA-added cultures indicating the diversion of the carotenoid
pathway towards protection of the organism from the inhibitory effect caused by
chloramphenicol.
Figure 2.8. Changes in total carotenoid and total astaxanthin contents of H. pluvialis cells under the influence of transcriptional and translational inhibitors. Cells grown in autotrophic medium were harvested and transferred to nutrient-limiting medium. Inhibitors were added after 3 d of stress induction and cultures were harvested 6 d after stress induction. Values are mean±SD of three independent determinations.
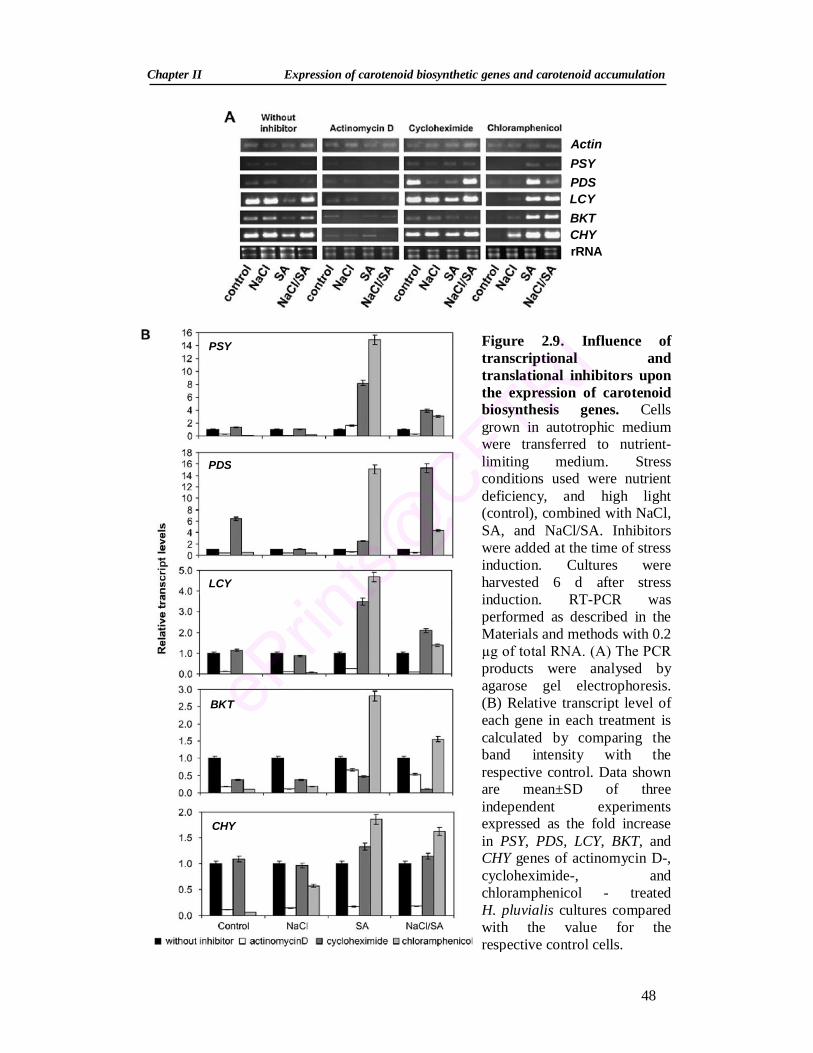
Chapter II Expression of carotenoid biosynthetic genes and carotenoid accumulation
48
Actin PSY PDS LCY BKT CHY rRNA
PSY
PDS
LCY
BKT
CHY
Figure 2.9. Influence of transcriptional and translational inhibitors upon the expression of carotenoid biosynthesis genes. Cells grown in autotrophic medium were transferred to nutrient-limiting medium. Stress conditions used were nutrient deficiency, and high light (control), combined with NaCl, SA, and NaCl/SA. Inhibitors were added at the time of stress induction. Cultures were harvested 6 d after stress induction. RT-PCR was performed as described in the Materials and methods with 0.2 µg of total RNA. (A) The PCR products were analysed by agarose gel electrophoresis. (B) Relative transcript level of each gene in each treatment is calculated by comparing the band intensity with the respective control. Data shown are mean±SD of three independent experiments expressed as the fold increase in PSY, PDS, LCY, BKT, and CHY genes of actinomycin D-, cycloheximide-, and chloramphenicol - treated H. pluvialis cultures compared with the value for the respective control cells.
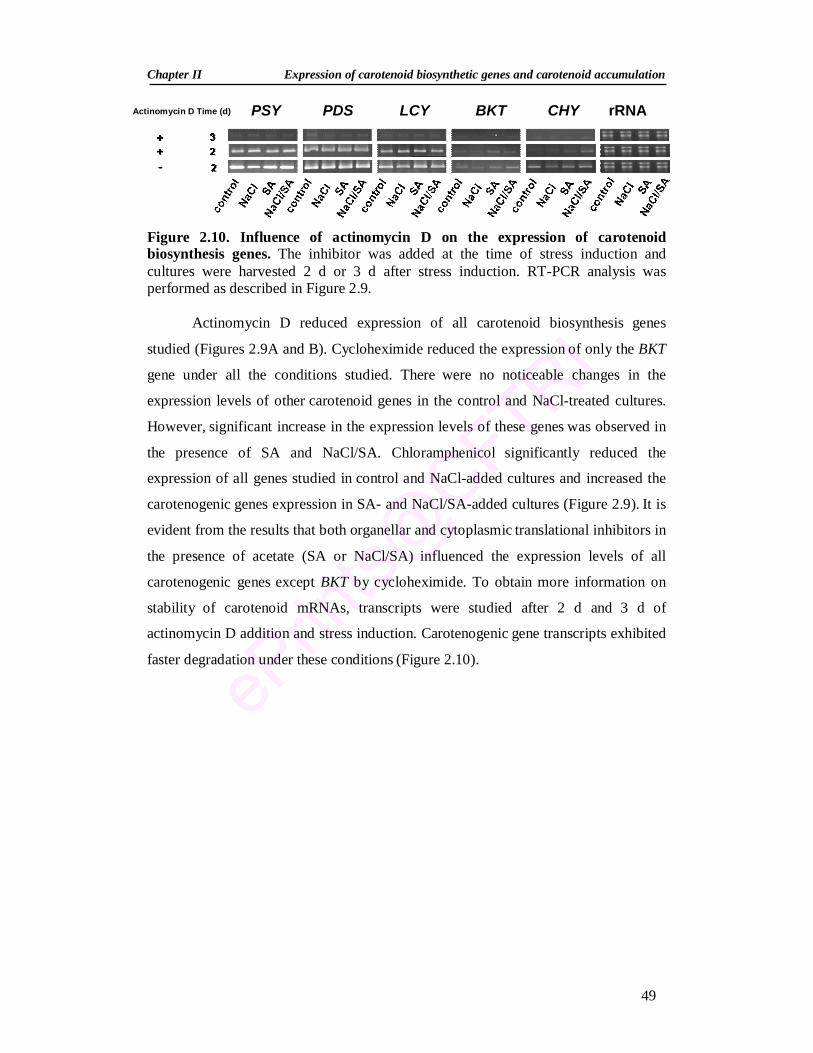
Chapter II Expression of carotenoid biosynthetic genes and carotenoid accumulation
49
Figure 2.10. Influence of actinomycin D on the expression of carotenoid biosynthesis genes. The inhibitor was added at the time of stress induction and cultures were harvested 2 d or 3 d after stress induction. RT-PCR analysis was performed as described in Figure 2.9.
Actinomycin D reduced expression of all carotenoid biosynthesis genes
studied (Figures 2.9A and B). Cycloheximide reduced the expression of only the BKT
gene under all the conditions studied. There were no noticeable changes in the
expression levels of other carotenoid genes in the control and NaCl-treated cultures.
However, significant increase in the expression levels of these genes was observed in
the presence of SA and NaCl/SA. Chloramphenicol significantly reduced the
expression of all genes studied in control and NaCl-added cultures and increased the
carotenogenic genes expression in SA- and NaCl/SA-added cultures (Figure 2.9). It is
evident from the results that both organellar and cytoplasmic translational inhibitors in
the presence of acetate (SA or NaCl/SA) influenced the expression levels of all
carotenogenic genes except BKT by cycloheximide. To obtain more information on
stability of carotenoid mRNAs, transcripts were studied after 2 d and 3 d of
actinomycin D addition and stress induction. Carotenogenic gene transcripts exhibited
faster degradation under these conditions (Figure 2.10).
PSY PDS LCY BKT CHY rRNA Actinomycin D Time (d)
Chapter II Expression of carotenoid biosynthetic genes and carotenoid accumulation
50
2.4. Discussion In the present work, attempts were made to compare the changes in pigment profile
with expression of carotenogenic genes under various stress conditions in H. pluvialis.
The influence of transcriptional and translational inhibitors on carotenoid
accumulation and carotenogenic genes expression was also studied in order to
understand the regulation of carotenogenesis. Enhanced cyst formation and
astaxanthin accumulation by acetate addition (Figure 2.1D), indicated the role of
acetate in increasing C/N ratio thereby enhancing astaxanthin accumulation, as
suggested by Kakizono et al. (1992). The addition of NaCl resulted in the reduction of
total carotenoid content and astaxanthin content when compared with the control.
However, addition of NaCl/SA enhanced the astaxanthin content. Another significant
feature observed during stress-induced astaxanthin formation was the decrease in the
chlorophyll content (Figure 2.1C), which may be due to nutrient deficiency-induced
chlorophyll breakdown (Boussiba et al. 1999).
Generally, secondary carotenoids, namely astaxanthin, canthaxanthin, and
echinenone, were detected only after stress induction. However, in the present study,
genes for astaxanthin biosynthesis, BKT and CHY, were found to be expressed at a
basal level even in green flagellated cells. During stress, these genes were found to be
up-regulated along with other carotenoid genes, namely, PSY, PDS, and LCY (Figures
2.6A and B) and these carotenogenic gene transcripts were detected even in 3-month-
old cysts (Vidhyavathi et al. 2007). Differential expression of carotenoid genes during
carotenogenesis indicates their probable regulation at different stages of carotenoid
accumulation. Among the treatments studied, the addition of SA and NaCl/SA showed
the maximum up-regulation of carotenogenic genes. Although NaCl addition favoured
up-regulation of carotenogenic genes, expressions were delayed (Figure 2.6). In
contrast to this, Steinbrenner and Linden (2001) reported a high level of expression for
PSY and CHY genes, when cells were exposed to high light and NaCl. This difference
in expression by NaCl may be due to the difference in mode of cultivation
(heterotrophic and autotrophic) and stress induction (nutrient sufficient and deficient).
It was also reported that NaCl had a similar effect as SA in inducing the expression of
PSY, CHY, and BKT, interpreting that SA initiates a salt stress as does NaCl
(Steinbrenner and Linden 2001; Huang et al. 2006a). But the contrasting result
Chapter II Expression of carotenoid biosynthetic genes and carotenoid accumulation
51
revealed in the present study suggests the involvement of a mechanism other than salt
stress in SA-induced transcription of carotenogenic genes. Kovacs et al. (2000)
reported that, in Chlamydobotrys stellata, the involvement of acetate in the regulation
of the redox state of photosystem components thereby affected transcription of nuclear
and chloroplast genes. Endo and Asada (1996) also reported plastoquinone reduction
stimulated by acetate, thereby affecting photosynthetic activity. These effects of
acetate have considerable importance since both general carotenogenic and specific
astaxanthin biosynthetic genes were reported to be under photosynthetic redox control
(Steinbrenner and Linden 2003). Based on the results from the present study and
previous reports, it may be suggested that acetate has a role in enhancing astaxanthin
accumulation through photosynthetic redox control.
Increased production of astaxanthin by the addition of SA and NaCl/SA is
correlated with early up-regulation and higher expression of astaxanthin biosynthetic
genes (Figures 2.1D, 2.6A and B). It may therefore be suggested that enhanced
astaxanthin accumulation is correlated with early up-regulation and higher expression
of astaxanthin synthesis genes. This is further supported by the absence or less
inhibitory effect on carotenoid and astaxanthin accumulation by actinomycin D when
added 3 d after SA and NaCl/SA stress induction (Figure 2.8). The absence or reduced
inhibition of total carotenoid and astaxanthin production by later addition of
cycloheximide in SA and NaCl/SA cultures (Figure 2.8) indicated post-translational
activation of carotenoid biosynthesis by acetate. Similar to this, post-translational
activation of carotenoid biosynthesis by oxidative stress was reported in acetate-
induced cyst cells of H. pluvialis (Kobayashi et al. 1993).
The reduction in total carotenoid and astaxanthin contents by transcriptional
and cytoplasmic translational inhibitors (Figure 2.7) indicates the regulation of
primary and secondary carotenoid formation at both the transcriptional and the
cytoplasmic translational levels. Carotenoid genes expression in response to high light
and nutrient stress combined with NaCl and SA additions were found to be related to
transcriptional activation rather than to the stability of mRNAs as indicated by
actinomycin D treatment (Figure 2.10). Inhibition of astaxanthin by cycloheximide
substantiates the cytoplasmic translational regulation of secondary carotenogenesis.
Cycloheximide addition did not affect the transcription of PSY, PDS, LCY, and CHY
genes (Figure 2.9). Therefore induction of carotenogenic genes expression in response
to stress conditions may be independent of cytoplasmic protein synthesis, at least for
Chapter II Expression of carotenoid biosynthetic genes and carotenoid accumulation
52
general carotenoid synthesis genes. Similar to this, induction of a higher expression of
PSY and CHY genes of Haematococcus by sodium acetate, Fe2+ and high light
(Steinbrenner and Linden 2001), and mRNA levels of PSY gene in corollas of
Cucumis sativus were shown to be independent of de novo protein synthesis
(Vishnevetsky et al. 1997). Significant reduction in the expression of BKT by
cycloheximide showed that regulation of this gene expression differs from other
carotenoid genes and induction is dependent on de novo protein synthesis in the
cytosol. The decrease in BKT gene expression by cycloheximide is also reflected in
the significant reduction in astaxanthin content. The enhanced expression of some
carotenoid genes transcripts upon cycloheximide treatment suggests the involvement
of post-transcriptional modifications and stabilization of mRNAs by a translational
arrest linked process or by preventing the synthesis of labile nucleases (Price et al.
2004). Although the role of acetate (SA and NaCl/SA) in further enhancing the
expression of carotenoid genes (except BKT) in the presence of cycloheximide and
chloramphenicol is not clear, it suggests a possible involvement of acetate in the post-
transcriptional modifications of carotenoid genes. Chloramphenicol reduced
astaxanthin production except in NaCl-added cultures (Figure 2.7), which is similar to
the report of Brinda et al. (2004). This indicates the involvement of the translation of
organellar genes for the enhanced production of secondary carotenoids. This is the
first report of its kind where regulation of carotenogenesis, both general and
astaxanthin-specific, under the influence of nutrient and other stress conditions has
been studied at the expression level and the metabolite level using transcriptional and
translational inhibitors. It is evident from this study that acetate plays a crucial role in
the enhancement of astaxanthin accumulation. This study will be helpful in
understanding the regulation of carotenogenesis and expression of these genes in other
organisms.
Chapter III
Regulation of Carotenogenic and Photosynthetic Genes Expression
Chapter III Regulation of carotenogenic and photosynthetic genes expression
53
Summary Regulation of carotenogenesis in Haematococcus pluvialis was studied using various carotenoid and fatty acid synthesis inhibitors under high light in nutrient sufficient (NS/HL) and nutrient deficient (ND/HL) condition. The results showed inhibition of astaxanthin by all inhibitors studied except cerulenin in ND/HL. Total carotenoids were reduced by inhibitors except diphenylamine (DPA) in ND/HL. Lycopene accumulation was observed with nicotine treatment while β-carotene accumulation was observed with DPA. Under NS/HL condition, expression of carotenogenic gene PSY was enhanced by all inhibitors studied except DPA while PDS expression was reduced by all inhibitors tested except nicotine. Expression of LCY was enhanced by inhibitors. Reduced expression of BKT and CHY were observed under DPA and NF treatment while enhanced expression for BKT was observed under nicotine treatment and CHY expression under nicotine and cerulenin. ND/HL exposure enhanced carotenogenic genes expression when compared to respective inhibitors of NS/HL in most cases. Reduced expression of LCY by nicotine resulted in increased lycopene accumulation while PSY and LCY by cerulenin resulted in decreased β-carotene and lutein. The results indicate the involvement of other regulatory factors besides transcriptional regulation of carotenogenesis in H. pluvialis. Photosynthetic genes, cabL1818, lhcbm9, psaB, rbcL and atpB transcripts were up-regulated during stress-induced accumulation of astaxanthin with the maximum of 3.75, 1.66, 1.50, 11.63 and 1.26-fold increase respectively over non-stressed green motile cells. Transcripts of these genes were detected even in cyst cells with the transcript levels of cabL1818, psaB and atpB at reduced level. The nuclear genes cabL1818 and lhcbm9 are coding for the chlorophyll a/b binding protein L1818 and major light-harvesting complex II m9 protein respectively. The chloroplast encoded psaB gene codes for PSI reaction centre protein PsaB. Studies using photosynthetic inhibitors, 3-(3,4-dichlorophenyl)-1,1-dimethylurea (DCMU) and 2,5-dibromo-3-methyl-6-isopropyl-benzoquinone (DBMIB) showed expression of cabL1818, lhcbm9, psaB and rbcL were under redox control of plastoquinone pool and atpB gene expression may be regulated at cytochrome b6/f complex. Expression of all five photosynthetic genes studied was regulated at transcriptional and cytoplasmic translational levels, and their expressions were reduced by norflurazon induced photo-oxidative stress. Acetate modulates the HL induced expression of photosynthetic genes and it depends on redox state of cytochrome b6/f complex and cytoplasmic protein synthesis.
Chapter III Regulation of carotenogenic and photosynthetic genes expression
54
3.1. Introduction In photosynthetic organisms, changes in environmental conditions, such as light
quality and quantity, temperature or the availability of nutrients and water, modulates
the function of the photosynthetic apparatus. The major proteins of the photosynthetic
apparatus in the chloroplast are multi subunit protein complexes that comprise
subunits encoded by both the chloroplast and nuclear genomes. The enormous
difference in gene copy number between nuclear and chloroplast compartments
require a highly coordinated regulation in their expression during development and
acclimation of the organisms to environmental cues. This coordination is controlled
by the nucleus at many levels (Leon et al. 1998) but also involves signals from the
plastids, which influence the expression of nuclear genes for plastid proteins
(Pfannschmidt et al. 2001; Leister 2005).
Carotenoids and chlorophylls (Chls) are essential components of
photosynthetic apparatus. They are present in functional pigment-binding protein
structures embedded in photosynthetic membranes. -carotene is more abundant in
the reaction centres of photosystems I and II, and xanthophylls are preferentially
distributed in the light-harvesting complexes (Demmig-Adams et al. 1996).
Carotenoids serve at least two important functions in photosynthesis. They participate
in the light-harvesting process and protect the photosynthetic apparatus from photo-
oxidative damage (Bartley and Scolnik 1995). They are essential for the efficient
quenching of Chl triplets formed by an excess of light and they dissipate excess light
energy through non-photochemical quenching (NPQ) of Chl fluorescence (Muller et
al. 2001). Carotenoid biosynthesis takes place in the plastid, but all known enzymes in
the pathway are nuclear-encoded and post-translationally imported into the organelle
(Lichtenthaler 1999). Microalgal cells possess carotenoids normally found in the
chloroplast of higher plants, namely neoxanthin, violaxanthin, lutein, zeaxanthin and
-carotene, also referred to as primary carotenoids. The secondary carotenoids almost
exclusively accumulate under stress conditions (e.g. nutrient starvation, salinity, high
temperature etc.) and this process is species specific. The physiological function of
secondary carotenoid remains to be clarified (Boussiba 2000). However, it is
generally believed that they function as passive photoprotectants (i.e. as a filter)
Chapter III Regulation of carotenogenic and photosynthetic genes expression
55
reducing the amount of light which can reach the light-harvesting pigment complex of
PS II (Hagen et al. 1994).
Astaxanthin accumulation in H. pluvialis is accompanied by loss of flagella,
formation of cysts, and reduction in photosynthetic activity etc. The decline in
photosynthesis is attributed to the damage to the PS II complex (Zlotnik et al. 1993),
lack of cytochrome f and the expected absence of linear electron flow from PSII to
PSI and the decrease of some of the PSI and PSII components (Tan et al. 1995).
Under stress conditions, astaxanthin is accumulated in extra-plastidic lipid vesicles
(Grünewald et al. 2001) predominantly in an ester form and astaxanthin accumulation
is accompanied by triacylglycerol accumulation (Zhekisheva et al. 2005). General
carotenoid and astaxanthin specific genes are up-regulated during stress-induced
secondary carotenoid formation and these genes are regulated at transcriptional, post-
transcriptional and translational levels (Sun et al. 1998; Grünewald et al. 2000;
Steinbrenner and Linden 2001; Vidhyavathi et al. 2008), and they are under the
control of photosynthetic redox status (Steinbrenner and Linden 2003). Apart from
cultivation parameters, understanding the molecular basis of stress-induced
astaxanthin accumulation in H. pluvialis will be useful for the optimization of
astaxanthin formation.
In photosynthetic organisms, the carotenoid levels reflect a steady state
governed by biosynthesis and degradation. The role of pigments in the regulation of
carotenoid pathway, either at the level of gene expression or of allosteric feedback
control on the enzymatic steps, still remains to be elucidated. Earlier studies on
expression of carotenogenic genes under the influence of inhibitors of carotenogenesis
and fatty acid synthesis in plant systems are mostly limited to PSY or PDS. It is
demonstrated that carotenoid content and/or composition could influence the
expression of some carotenogenic genes. For example, in sunflower phytoene
accumulation decreases the transcript levels of the PSY gene (Campisi et al. 2006). It
has been found that in Arabidopsis thaliana, PDS expression is independent of leaf
pigment content (Wetzel and Rodermel 1998). In daffodil flowers inhibition of
lycopene cyclase leads to up-regulation of PSY, PDS and LCY (Al-Babili et al. 1999).
In H. pluvialis also, it has been found that accumulation of canthaxanthin and/or
echinenone depresses the enzyme -carotene oxygenase activity through a feedback
mechanism. Moreover active synthesis of fatty acid is required for astaxanthin
Chapter III Regulation of carotenogenic and photosynthetic genes expression
56
synthesis (Schoefs et al. 2001), which raised a question whether the fatty acid
synthesis is required for the esterification of the astaxanthin molecules and/or for the
formation of the astaxanthin droplets. Recent findings showed triacylglycerol
accumulation is not tightly coupled with astaxanthin accumulation but accumulation
of certain amount of triacylglycerol is a prerequisite for the initiation of fatty acid-
esterified astaxanthin accumulation in lipid globules (Zhekisheva et al. 2005). The
application of various inhibitors blocking specific reactions in the carotenoid
biosynthesis pathway would either increase or decrease the pool sizes of particular
carotenoids, which in turn would be helpful in studying biochemical and molecular
mechanisms behind carotenogenesis. In Haematococcus, carotenoid synthesis
inhibitors were used to elucidate the pathway of astaxanthin production, and these
inhibitors can also be used to analyze the effect of carotenoids on carotenoid genes
expression. Diphenylamine (DPA) inhibits β-carotene ketolase and nicotine inhibits
lycopene cyclase (Harker and Young 1995). Bleaching herbicide norflurazon (NF) is
an inhibitor of phytoene desaturase, which is the first enzyme responsible for
introduction of the conjugated double bonds (Boger and Sandmann 1983). Fatty acid
synthesis inhibitor cerulenin inhibits β-ketoacyl-(acyl carrier protein) synthase I
(Walsh et al. 1990).
Expression of photosynthetic genes and their regulation has been studied in
many organisms including Arabidopsis, Chlamydomonas and Dunaliella. Sequences
of few of photosynthetic genes of Haematococcus are available in NCBI GenBank.
Among these, genes which are having important photosynthetic function are selected
for the present study. Unfortunately, to our knowledge, genes of photosystem II (PSII)
of Haematococcus are not available in database. Our previous study had shown,
H. pluvialis carotenoid synthesis genes are up-regulated during stress induction by
high light and nutrient deficiency and are regulated at transcriptional, post-
transcriptional and translational levels (Vidhyavathi et al. 2008). It has been reported
that H. pluvialis carotenoid biosynthetic genes are regulated at photosynthetic redox
control (Steinbrenner and Linden 2003).
Hence the present study has been undertaken to study the regulation of
carotenogenic and photosynthetic genes expression. Expression of carotenogenic
genes such as PSY, PDS, LCY, BKT and CHY were studied using inhibitors of
carotenoid and fatty acid synthesis. Expression of photosynthetic genes such as
cabL1818, lhcbm9, rbcL, psaB and atpB of H. pluvialis and their regulation using
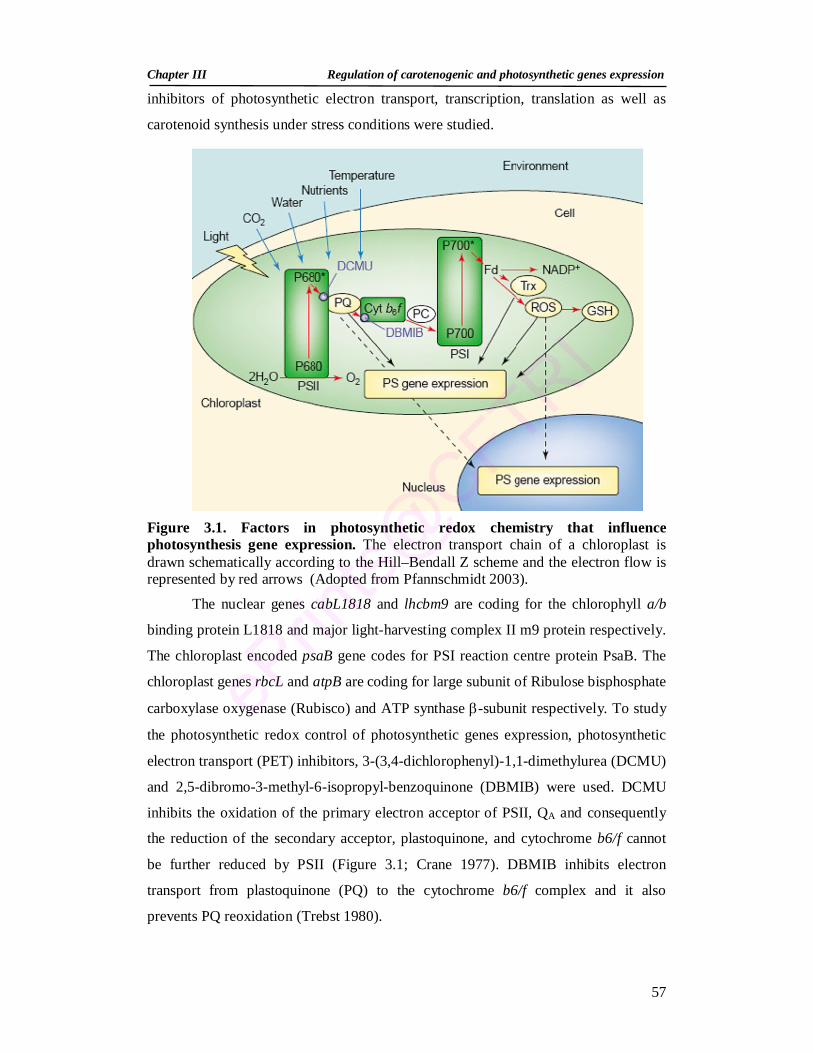
Chapter III Regulation of carotenogenic and photosynthetic genes expression
57
inhibitors of photosynthetic electron transport, transcription, translation as well as
carotenoid synthesis under stress conditions were studied.
Figure 3.1. Factors in photosynthetic redox chemistry that influence photosynthesis gene expression. The electron transport chain of a chloroplast is drawn schematically according to the Hill–Bendall Z scheme and the electron flow is represented by red arrows (Adopted from Pfannschmidt 2003).
The nuclear genes cabL1818 and lhcbm9 are coding for the chlorophyll a/b
binding protein L1818 and major light-harvesting complex II m9 protein respectively.
The chloroplast encoded psaB gene codes for PSI reaction centre protein PsaB. The
chloroplast genes rbcL and atpB are coding for large subunit of Ribulose bisphosphate
carboxylase oxygenase (Rubisco) and ATP synthase -subunit respectively. To study
the photosynthetic redox control of photosynthetic genes expression, photosynthetic
electron transport (PET) inhibitors, 3-(3,4-dichlorophenyl)-1,1-dimethylurea (DCMU)
and 2,5-dibromo-3-methyl-6-isopropyl-benzoquinone (DBMIB) were used. DCMU
inhibits the oxidation of the primary electron acceptor of PSII, QA and consequently
the reduction of the secondary acceptor, plastoquinone, and cytochrome b6/f cannot
be further reduced by PSII (Figure 3.1; Crane 1977). DBMIB inhibits electron
transport from plastoquinone (PQ) to the cytochrome b6/f complex and it also
prevents PQ reoxidation (Trebst 1980).
Chapter III Regulation of carotenogenic and photosynthetic genes expression
58
3.2. Materials and Methods
3.2.1. Algal culture, growth and stress conditions
Haematococcus pluvialis motile vegetative cells are grown in modified BBM medium
as described in section 2.2.3 and harvested by centrifugation at 3500 × g for 5 min and
resuspended in fresh media (complete and nutrient deficient - containing 1/10 of the
nitrogen and phosphorus of the original medium). The initial cell concentration was
adjusted to 15 × 104 cells ml–1. The cultures were subjected to the following stress
conditions (i) high light intensity (HL), (ii) nutrient deficiency and high light
(ND/HL), (iii) sodium acetate 4.4 mM and high light (SA/HL). High light intensity
refers continuous light intensity of 97 µmol m–2 s–1. Cyst cells used for comparative
study were produced by exposing green motile vegetative cells to HL for three
months.
3.2.2. Inhibitors
DPA (Sigma) stock was prepared in 70% basic ethanol (pH 9.0) and used at final
concentration of 45 µM. (-)-Nicotine (Fluka) was added to the cultures at a final
concentration of 9.8 mM. NF (AccuStandard, USA) stock was prepared in methanol
and added to cultures at a final concentration of 8.5 µM. Cerulenin (Sigma) stock
prepared in methanol was added to cultures at a final concentration of 3.4 µM. The
photosynthetic electron transport inhibitors, DCMU (sigma) and DBMIB (sigma)
were prepared as stock solutions in DMSO and methanol respectively and added to
cultures at a final concentration of 20 µM and 1 µM respectively. DBMIB was re-
supplied every 5-6 h because of its photo-labile nature (Steinbrenner and Linden
2003). The transcriptional inhibitor actinomycin D (SRL, Mumbai, India), the
cytoplasmic translational inhibitor, cycloheximide (Sigma-Aldrich, Bangalore, India),
and the organellar translational inhibitor, chloramphenicol (HiMedia, Mumbai, India)
were added at concentrations of 10 µg ml–1, 300 ng ml–1, and 50 µg ml–1, respectively.
After the addition of inhibitors cultures were exposed to continuous high light
intensity of 97 µmol m-2 s-1 for two days for secondary carotenoid induction.
Chapter III Regulation of carotenogenic and photosynthetic genes expression
59
3.2.3. Growth and pigment analyses
Algal cell number was determined by counting algal cells using Neubauer
haemacytometer. Known volume of culture was centrifuged at 3000 g for 10 min
and dry weight of the biomass was estimated as described in section 2.2.5.2. An
aliquot of culture was harvested and freeze dried. Pigment extraction and analyses
were carried out as per the procedure given in section 2.2.6.
3.2.4. Chlorophyll fluorescence measurements
Cell suspensions were normalized to about 3 µg chlorophyll ml-1 and dark adapted for
30 min. The Chlorophyll fluorescence measurements were carried out using
Shimadzu RF-5301PC spectrofluorophotometer (excitation, 450 nm; emission, 690
nm). The initial (F0) and maximum (Fm) fluorescence were measured before and
after adding DCMU to a final concentration of 10 µM. Maximum photochemical
quantum yield of PSII was determined as the ratio of Fv/Fm (Fv=Fm–F0) (van
Kooten and Snel 1990).
3.2.5. Reverse transcription-polymerase chain reaction (RT-PCR)
RNA extraction and removal of genomic DNA were done as per the procedure given
in section 2.2.7. First strand cDNA synthesis was performed in a 20-µl reaction
volume using 1.5 µg of total RNA, oligo dT18 and M-MLV reverse transcriptase
(Ambion) according to manufacturer’s protocol. The reaction was allowed to proceed
for 60 min at 42C before being terminated by treatment at 92C for 10 min. The
primers used for amplification of PSY, PDS, LCY, BKT, CHY and Actin and
amplification conditions are described in section 2.2.7. The primers used for
amplification of photosynthetic genes cabL1818, lhcbm9, rbcL, psaB, atpB and
amplification conditions are listed in Table 3.1. Following the separation of the PCR
products on ethidium bromide-stained 1.4% agarose gels, the bands were quantified.
Each band was normalized against the intensity obtained with the same cDNA using
the Actin-specific primers. For calculating the transcript abundance under stress
conditions, the transcript levels of each gene in green motile cells were taken for
comparison, while under inhibitor-added conditions, transcripts of the respective
control (without inhibitors) were used for comparison.
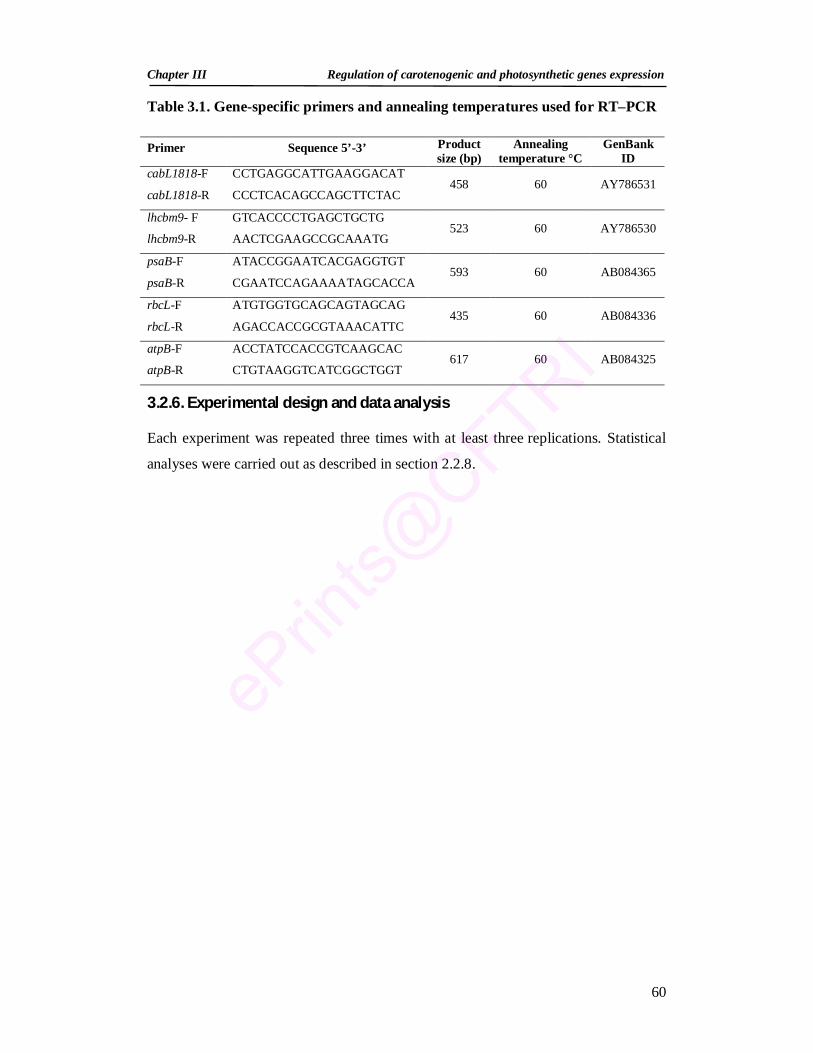
Chapter III Regulation of carotenogenic and photosynthetic genes expression
60
Table 3.1. Gene-specific primers and annealing temperatures used for RT–PCR
3.2.6. Experimental design and data analysis
Each experiment was repeated three times with at least three replications. Statistical
analyses were carried out as described in section 2.2.8.
Primer Sequence 5’-3’ Product size (bp)
Annealing temperature °C
GenBank ID
cabL1818-F CCTGAGGCATTGAAGGACAT 458 60 AY786531
cabL1818-R CCCTCACAGCCAGCTTCTAC
lhcbm9- F GTCACCCCTGAGCTGCTG 523 60 AY786530
lhcbm9-R AACTCGAAGCCGCAAATG
psaB-F ATACCGGAATCACGAGGTGT 593 60 AB084365
psaB-R CGAATCCAGAAAATAGCACCA
rbcL-F ATGTGGTGCAGCAGTAGCAG 435 60 AB084336
rbcL-R AGACCACCGCGTAAACATTC
atpB-F ACCTATCCACCGTCAAGCAC 617 60 AB084325
atpB-R CTGTAAGGTCATCGGCTGGT
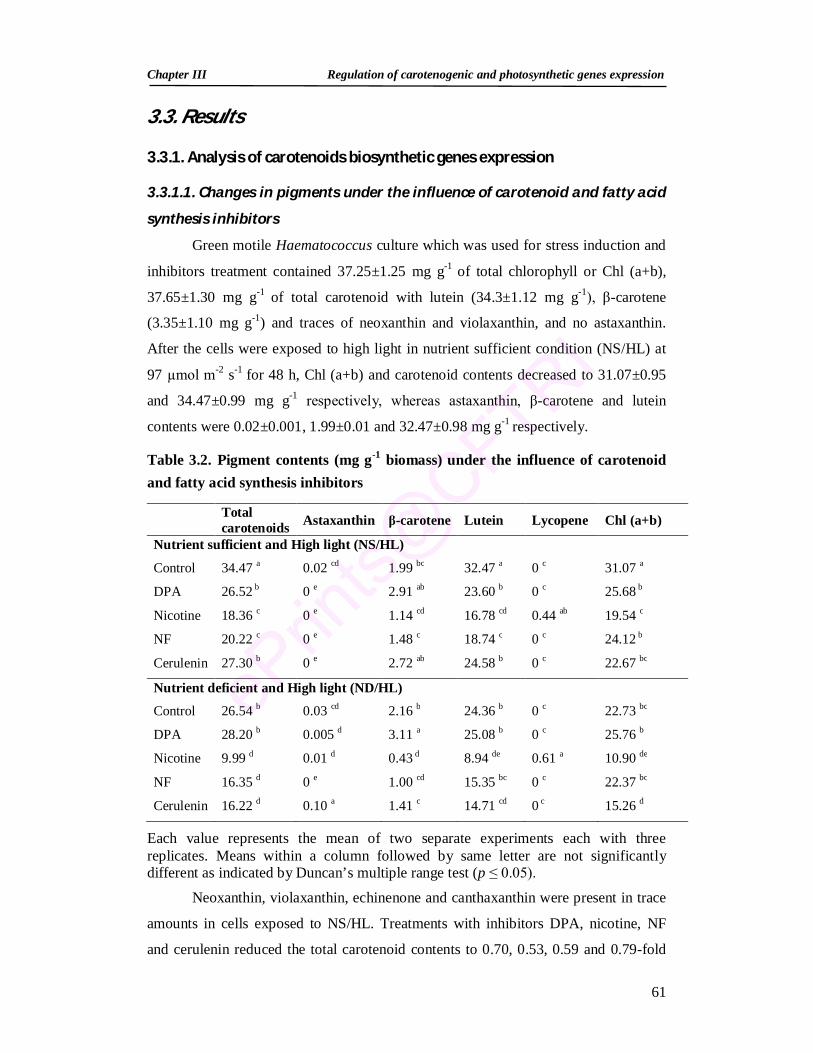
Chapter III Regulation of carotenogenic and photosynthetic genes expression
61
3.3. Results
3.3.1. Analysis of carotenoids biosynthetic genes expression
3.3.1.1. Changes in pigments under the influence of carotenoid and fatty acid
synthesis inhibitors
Green motile Haematococcus culture which was used for stress induction and
inhibitors treatment contained 37.25±1.25 mg g-1 of total chlorophyll or Chl (a+b),
37.65±1.30 mg g-1 of total carotenoid with lutein (34.3±1.12 mg g-1), β-carotene
(3.35±1.10 mg g-1) and traces of neoxanthin and violaxanthin, and no astaxanthin.
After the cells were exposed to high light in nutrient sufficient condition (NS/HL) at
97 µmol m-2 s-1 for 48 h, Chl (a+b) and carotenoid contents decreased to 31.07±0.95
and 34.47±0.99 mg g-1 respectively, whereas astaxanthin, β-carotene and lutein
contents were 0.02±0.001, 1.99±0.01 and 32.47±0.98 mg g-1 respectively.
Table 3.2. Pigment contents (mg g-1 biomass) under the influence of carotenoid and fatty acid synthesis inhibitors
Total carotenoids Astaxanthin β-carotene Lutein Lycopene Chl (a+b)
Nutrient sufficient and High light (NS/HL)
Control 34.47 a 0.02 cd 1.99 bc 32.47 a 0 c 31.07 a
DPA 26.52 b 0 e 2.91 ab 23.60 b 0 c 25.68 b
Nicotine 18.36 c 0 e 1.14 cd 16.78 cd 0.44 ab 19.54 c
NF 20.22 c 0 e 1.48 c 18.74 c 0 c 24.12 b
Cerulenin 27.30 b 0 e 2.72 ab 24.58 b 0 c 22.67 bc
Nutrient deficient and High light (ND/HL)
Control 26.54 b 0.03 cd 2.16 b 24.36 b 0 c 22.73 bc
DPA 28.20 b 0.005 d 3.11 a 25.08 b 0 c 25.76 b
Nicotine 9.99 d 0.01 d 0.43 d 8.94 de 0.61 a 10.90 de
NF 16.35 d 0 e 1.00 cd 15.35 bc 0 c 22.37 bc
Cerulenin 16.22 d 0.10 a 1.41 c 14.71 cd 0 c 15.26 d
Each value represents the mean of two separate experiments each with three replicates. Means within a column followed by same letter are not significantly different as indicated by Duncan’s multiple range test (p ≤ 0.05).
Neoxanthin, violaxanthin, echinenone and canthaxanthin were present in trace
amounts in cells exposed to NS/HL. Treatments with inhibitors DPA, nicotine, NF
and cerulenin reduced the total carotenoid contents to 0.70, 0.53, 0.59 and 0.79-fold
Chapter III Regulation of carotenogenic and photosynthetic genes expression
62
respectively of control – HL exposed cells (Table 3.2). Similarly Chl (a+b) contents
also showed a decline in inhibitor treated cells (Table 3.2). The inhibitor treated
cultures resulted in a reduction in lutein content to 0.73, 0.52, 0.58 and 0.76-fold of
control cells in DPA, nicotine, NF and cerulenin treatments respectively. Both DPA
and cerulenin enhanced β-carotene accumulation to 1.46 and 1.37-fold (Table 3.2).
Neoxanthin and violaxanthin were present in trace amounts in all treated cultures. The
accumulation of astaxanthin was inhibited completely in treatments with all inhibitors
studied. Lycopene accumulation was observed only with nicotine treatment (0.44 mg
g-1). The accumulation of lycopene observed in the present study, by nicotine
treatment, was confirmed by exposure of inhibitor treated cultures to HL for another 2
days which resulted in enhanced accumulation of lycopene (1.45 mg g-1).
Under nutrient deficient high light (ND/HL) conditions, decrease in total
carotenoids and Chl (a+b) contents were observed when compared to NS (Table 3.2).
This decrease in total carotenoids could be attributed to the rapid degradation of lutein
and β-carotene during initial stages of secondary carotenoid synthesis in ND/HL.
When individual carotenoids were analysed, higher astaxanthin and β-carotene
accumulation and reduction in lutein were observed under ND/HL condition (Table
3.2). This indicated the diversion of carotenoid biosynthetic pathway more towards
secondary carotenoid synthesis. Under the influence of inhibitors, reduction in total
carotenoids and Chls was observed for all inhibitors studied but for DPA, which
showed accumulation of β-carotene and lutein compared to control – ND/HL cells.
This substantiates the effect of DPA on BKT (astaxanthin specific enzyme) and in turn
secondary carotenogenesis but not on general carotenoid synthesis. Drastic reduction
in lutein content by nicotine, NF and cerulenin treatments reflected in decreased total
carotenoid content. Inhibition of astaxanthin accumulation was observed under DPA,
nicotine and NF with NF having complete inhibition on astaxanthin accumulation. On
the contrary, increased astaxanthin accumulation was observed under cerulenin
treatment (Table 3.2).The accumulation of lycopene found in nicotine treated cells
indicates the inhibition of lycopene cyclase.
3.3.1.2. Changes in carotenoid synthesis genes expression
To study further the effect of inhibitors on carotenogenic genes expression, RNA was
extracted from inhibitor treated samples and transcript levels were compared by RT-
PCR. The RT-PCR method was chosen considering the low abundance of many
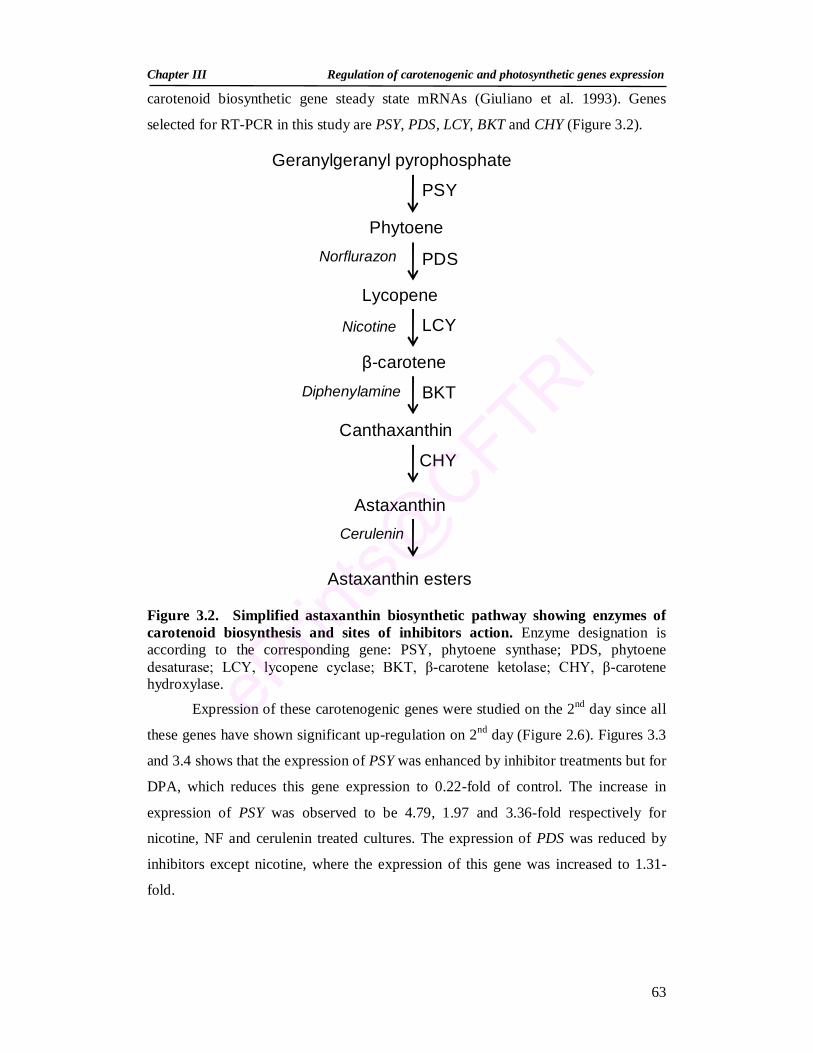
Chapter III Regulation of carotenogenic and photosynthetic genes expression
63
Phytoene
Lycopene
β-carotene
Geranylgeranyl pyrophosphate
Canthaxanthin
Astaxanthin
Astaxanthin esters
PSY
PDS
CHY
LCY
BKT
Norflurazon
Nicotine
Diphenylamine
Cerulenin
carotenoid biosynthetic gene steady state mRNAs (Giuliano et al. 1993). Genes
selected for RT-PCR in this study are PSY, PDS, LCY, BKT and CHY (Figure 3.2).
Figure 3.2. Simplified astaxanthin biosynthetic pathway showing enzymes of carotenoid biosynthesis and sites of inhibitors action. Enzyme designation is according to the corresponding gene: PSY, phytoene synthase; PDS, phytoene desaturase; LCY, lycopene cyclase; BKT, β-carotene ketolase; CHY, β-carotene hydroxylase.
Expression of these carotenogenic genes were studied on the 2nd day since all
these genes have shown significant up-regulation on 2nd day (Figure 2.6). Figures 3.3
and 3.4 shows that the expression of PSY was enhanced by inhibitor treatments but for
DPA, which reduces this gene expression to 0.22-fold of control. The increase in
expression of PSY was observed to be 4.79, 1.97 and 3.36-fold respectively for
nicotine, NF and cerulenin treated cultures. The expression of PDS was reduced by
inhibitors except nicotine, where the expression of this gene was increased to 1.31-
fold.
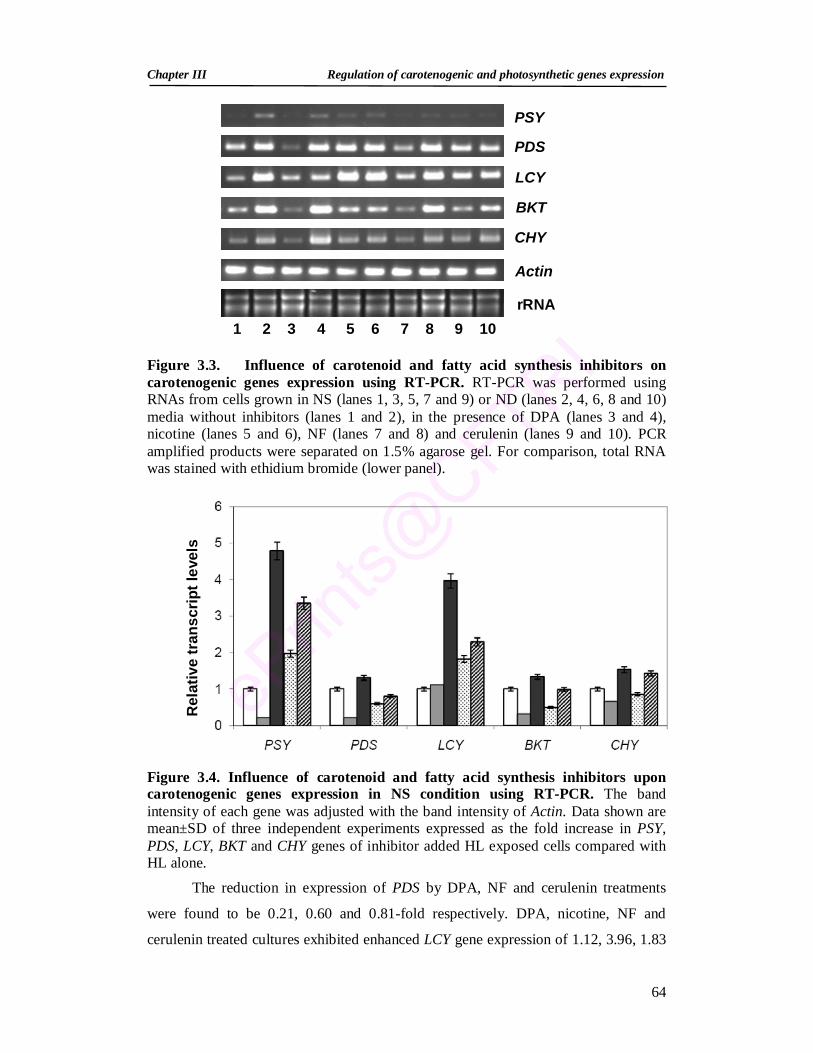
Chapter III Regulation of carotenogenic and photosynthetic genes expression
64
PSY
PDS
LCY
BKT
CHY
Actin
rRNA 1 2 3 4 5 6 7 8 9 10
Figure 3.3. Influence of carotenoid and fatty acid synthesis inhibitors on carotenogenic genes expression using RT-PCR. RT-PCR was performed using RNAs from cells grown in NS (lanes 1, 3, 5, 7 and 9) or ND (lanes 2, 4, 6, 8 and 10) media without inhibitors (lanes 1 and 2), in the presence of DPA (lanes 3 and 4), nicotine (lanes 5 and 6), NF (lanes 7 and 8) and cerulenin (lanes 9 and 10). PCR amplified products were separated on 1.5% agarose gel. For comparison, total RNA was stained with ethidium bromide (lower panel).
Figure 3.4. Influence of carotenoid and fatty acid synthesis inhibitors upon carotenogenic genes expression in NS condition using RT-PCR. The band intensity of each gene was adjusted with the band intensity of Actin. Data shown are mean±SD of three independent experiments expressed as the fold increase in PSY, PDS, LCY, BKT and CHY genes of inhibitor added HL exposed cells compared with HL alone.
The reduction in expression of PDS by DPA, NF and cerulenin treatments
were found to be 0.21, 0.60 and 0.81-fold respectively. DPA, nicotine, NF and
cerulenin treated cultures exhibited enhanced LCY gene expression of 1.12, 3.96, 1.83
Control DPA Nicotine NF Cerulenin
Rel
ativ
e tr
ansc
ript l
evel
s
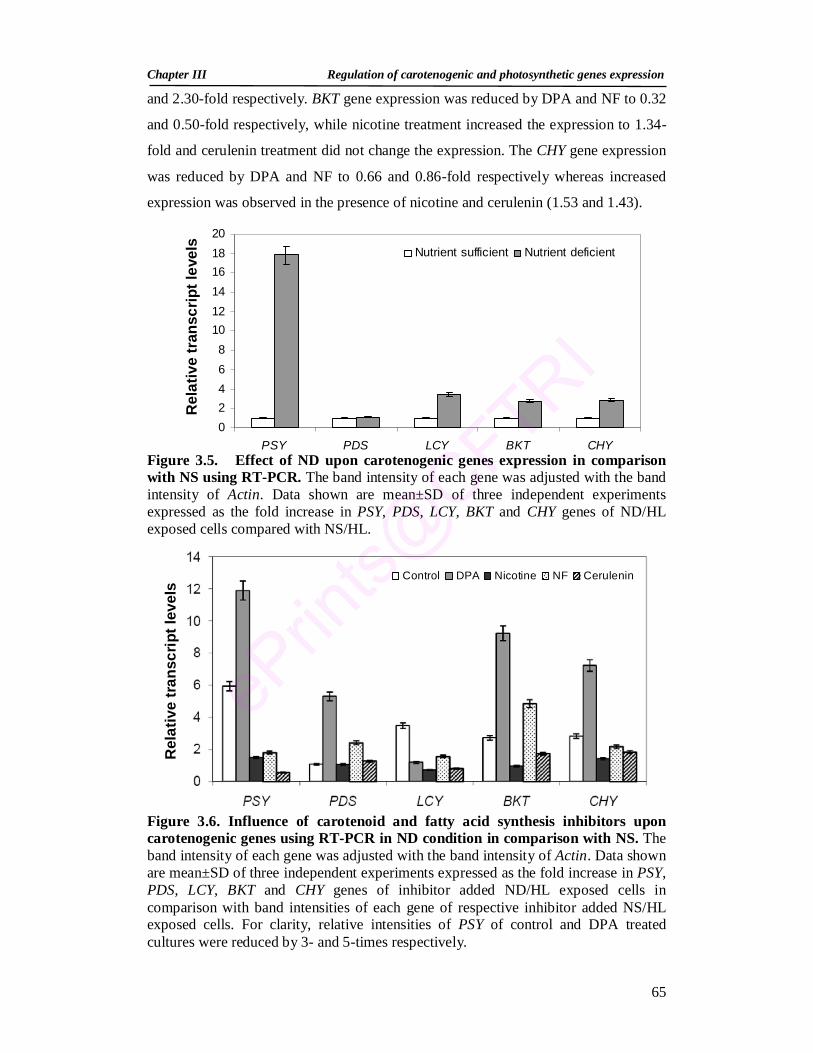
Chapter III Regulation of carotenogenic and photosynthetic genes expression
65
and 2.30-fold respectively. BKT gene expression was reduced by DPA and NF to 0.32
and 0.50-fold respectively, while nicotine treatment increased the expression to 1.34-
fold and cerulenin treatment did not change the expression. The CHY gene expression
was reduced by DPA and NF to 0.66 and 0.86-fold respectively whereas increased
expression was observed in the presence of nicotine and cerulenin (1.53 and 1.43).
Figure 3.5. Effect of ND upon carotenogenic genes expression in comparison with NS using RT-PCR. The band intensity of each gene was adjusted with the band intensity of Actin. Data shown are mean±SD of three independent experiments expressed as the fold increase in PSY, PDS, LCY, BKT and CHY genes of ND/HL exposed cells compared with NS/HL.
Figure 3.6. Influence of carotenoid and fatty acid synthesis inhibitors upon carotenogenic genes using RT-PCR in ND condition in comparison with NS. The band intensity of each gene was adjusted with the band intensity of Actin. Data shown are mean±SD of three independent experiments expressed as the fold increase in PSY, PDS, LCY, BKT and CHY genes of inhibitor added ND/HL exposed cells in comparison with band intensities of each gene of respective inhibitor added NS/HL exposed cells. For clarity, relative intensities of PSY of control and DPA treated cultures were reduced by 3- and 5-times respectively.
Rel
ativ
e tr
ansc
ript l
evel
s
02468
101214161820
PSY PDS LCY BKT CHY
Nutrient sufficient Nutrient deficient
Rel
ativ
e tr
ansc
ript l
evel
s
Control DPA Nicotine NF Cerulenin
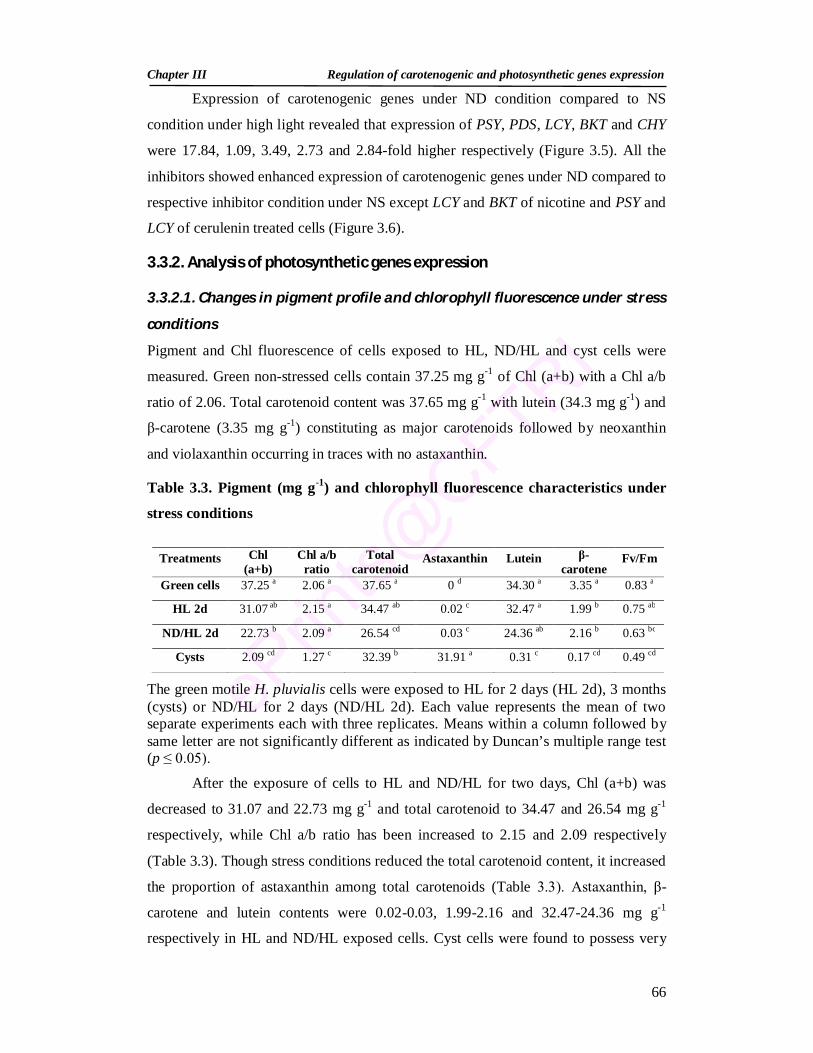
Chapter III Regulation of carotenogenic and photosynthetic genes expression
66
Expression of carotenogenic genes under ND condition compared to NS
condition under high light revealed that expression of PSY, PDS, LCY, BKT and CHY
were 17.84, 1.09, 3.49, 2.73 and 2.84-fold higher respectively (Figure 3.5). All the
inhibitors showed enhanced expression of carotenogenic genes under ND compared to
respective inhibitor condition under NS except LCY and BKT of nicotine and PSY and
LCY of cerulenin treated cells (Figure 3.6).
3.3.2. Analysis of photosynthetic genes expression
3.3.2.1. Changes in pigment profile and chlorophyll fluorescence under stress
conditions
Pigment and Chl fluorescence of cells exposed to HL, ND/HL and cyst cells were
measured. Green non-stressed cells contain 37.25 mg g-1 of Chl (a+b) with a Chl a/b
ratio of 2.06. Total carotenoid content was 37.65 mg g-1 with lutein (34.3 mg g-1) and
β-carotene (3.35 mg g-1) constituting as major carotenoids followed by neoxanthin
and violaxanthin occurring in traces with no astaxanthin.
Table 3.3. Pigment (mg g-1) and chlorophyll fluorescence characteristics under
stress conditions
The green motile H. pluvialis cells were exposed to HL for 2 days (HL 2d), 3 months (cysts) or ND/HL for 2 days (ND/HL 2d). Each value represents the mean of two separate experiments each with three replicates. Means within a column followed by same letter are not significantly different as indicated by Duncan’s multiple range test (p ≤ 0.05).
After the exposure of cells to HL and ND/HL for two days, Chl (a+b) was
decreased to 31.07 and 22.73 mg g-1 and total carotenoid to 34.47 and 26.54 mg g-1
respectively, while Chl a/b ratio has been increased to 2.15 and 2.09 respectively
(Table 3.3). Though stress conditions reduced the total carotenoid content, it increased
the proportion of astaxanthin among total carotenoids (Table 3.3). Astaxanthin, β-
carotene and lutein contents were 0.02-0.03, 1.99-2.16 and 32.47-24.36 mg g-1
respectively in HL and ND/HL exposed cells. Cyst cells were found to possess very
Treatments Chl (a+b)
Chl a/b ratio
Total carotenoid
Astaxanthin Lutein β-carotene
Fv/Fm
Green cells 37.25 a 2.06 a 37.65 a 0 d 34.30 a 3.35 a 0.83 a
HL 2d 31.07 ab 2.15 a 34.47 ab 0.02 c 32.47 a 1.99 b 0.75 ab
ND/HL 2d 22.73 b 2.09 a 26.54 cd 0.03 c 24.36 ab 2.16 b 0.63 bc
Cysts 2.09 cd 1.27 c 32.39 b 31.91 a 0.31 c 0.17 cd 0.49 cd
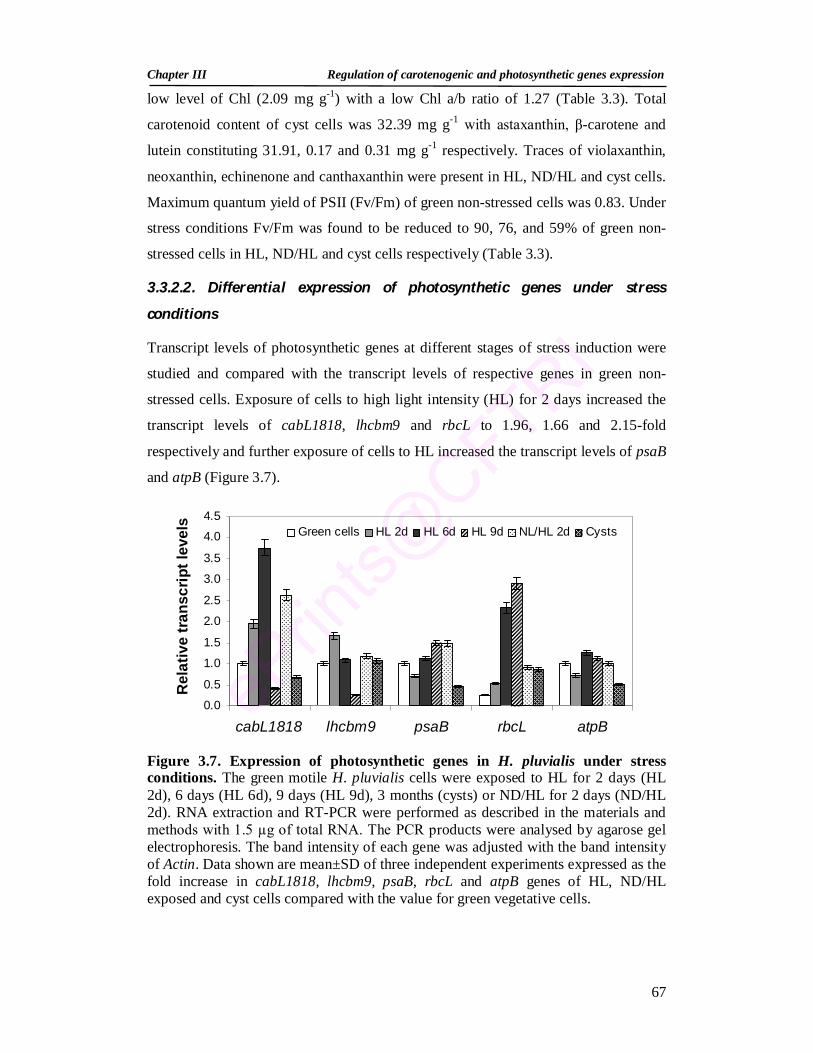
Chapter III Regulation of carotenogenic and photosynthetic genes expression
67
low level of Chl (2.09 mg g-1) with a low Chl a/b ratio of 1.27 (Table 3.3). Total
carotenoid content of cyst cells was 32.39 mg g-1 with astaxanthin, β-carotene and
lutein constituting 31.91, 0.17 and 0.31 mg g-1 respectively. Traces of violaxanthin,
neoxanthin, echinenone and canthaxanthin were present in HL, ND/HL and cyst cells.
Maximum quantum yield of PSII (Fv/Fm) of green non-stressed cells was 0.83. Under
stress conditions Fv/Fm was found to be reduced to 90, 76, and 59% of green non-
stressed cells in HL, ND/HL and cyst cells respectively (Table 3.3).
3.3.2.2. Differential expression of photosynthetic genes under stress
conditions
Transcript levels of photosynthetic genes at different stages of stress induction were
studied and compared with the transcript levels of respective genes in green non-
stressed cells. Exposure of cells to high light intensity (HL) for 2 days increased the
transcript levels of cabL1818, lhcbm9 and rbcL to 1.96, 1.66 and 2.15-fold
respectively and further exposure of cells to HL increased the transcript levels of psaB
and atpB (Figure 3.7).
Figure 3.7. Expression of photosynthetic genes in H. pluvialis under stress conditions. The green motile H. pluvialis cells were exposed to HL for 2 days (HL 2d), 6 days (HL 6d), 9 days (HL 9d), 3 months (cysts) or ND/HL for 2 days (ND/HL 2d). RNA extraction and RT-PCR were performed as described in the materials and methods with 1.5 µg of total RNA. The PCR products were analysed by agarose gel electrophoresis. The band intensity of each gene was adjusted with the band intensity of Actin. Data shown are mean±SD of three independent experiments expressed as the fold increase in cabL1818, lhcbm9, psaB, rbcL and atpB genes of HL, ND/HL exposed and cyst cells compared with the value for green vegetative cells.
0.0
0.5
1.0
1.5
2.0
2.5
3.0
3.5
4.0
4.5
cabL1818 lhcbm9 psaB rbcL atpB
Green cells HL 2d HL 6d HL 9d NL/HL 2d Cysts
Rel
ativ
e tr
ansc
ript l
evel
s
Chapter III Regulation of carotenogenic and photosynthetic genes expression
68
HL induced expression was most prominent for rbcL among the genes tested.
Maximum transcript levels for lhcbm9 was found to be on 2nd day (1.66-fold) while
psaB and rbcL produced maximum transcripts on 9th day (1.50 and 11.63-fold) and
cabL1818 and atpB on 6th day (3.75 and 1.26-fold). Nutrient deficiency along with
high light intensity (ND/HL) for 2 days increased the transcript levels of
photosynthetic genes studied except rbcL and the up-regulation of atpB is not
significant compared to green motile cells. Transcripts of photosynthetic genes
studied were found to be present in 3 months old cyst cells also with the transcript
levels of cabL1818, psaB and atpB reduced to 0.68, 0.47 and 0.51-fold respectively of
green vegetative cells. While transcript level of lhcbm9 was being equal, rbcL was
3.46-fold more than that of non-stressed green cells (Figure 3.7).
3.3.2.3. Expression of photosynthetic genes and pigment production under
stress conditions in the presence of photosynthetic inhibitors
The electron transport inhibitors DCMU and DBMIB were used to generate oxidizing
and reducing states of the PQ pool. The cells were grown under HL for 2 days in the
presence of these compounds. Since DBMIB is photosensitive, it is re-supplied at
every 5-6 h. RT-PCR analyses showed the expression of cabL1818 was increased to
1.73-fold when the PQ pool was oxidized by DCMU and reduced to 0.73-fold when
PQ pool was reduced by DBMIB, whereas the expression of lhcbm9 was reduced to
0.50-fold by DCMU and was equal to control when treated with DBMIB. Expression
of psaB was up-regulated to 1.63-fold by DCMU and was equal to control by DBMIB
treatment (Figure 3.8). The gene rbcL expression was reduced to 0.54-fold of control
by DCMU while DBMIB addition partially recovered the reduction in expression to
0.74-fold of control. These results suggested that the expression of nuclear encoded
photosynthetic genes, cabL1818 and lhcbm9, and chloroplast encoded photosynthetic
genes, psaB and rbcL are under the control of redox state of PQ pool.
The atpB gene expression was reduced to 0.51-fold by DCMU which was
further reduced to 0.49-fold by DBMIB unlike other photosynthetic genes (Figure
3.8), indicating that the regulation of atpB gene expression may be mediated by other
photosynthesis-derived signals. Both DCMU and DBMIB reduced the biomass
production and Chl (a+b), while Chl a/b ratio was increased by DCMU and decreased
by DBMIB. Total carotenoid, β-carotene and violaxanthin contents were increased
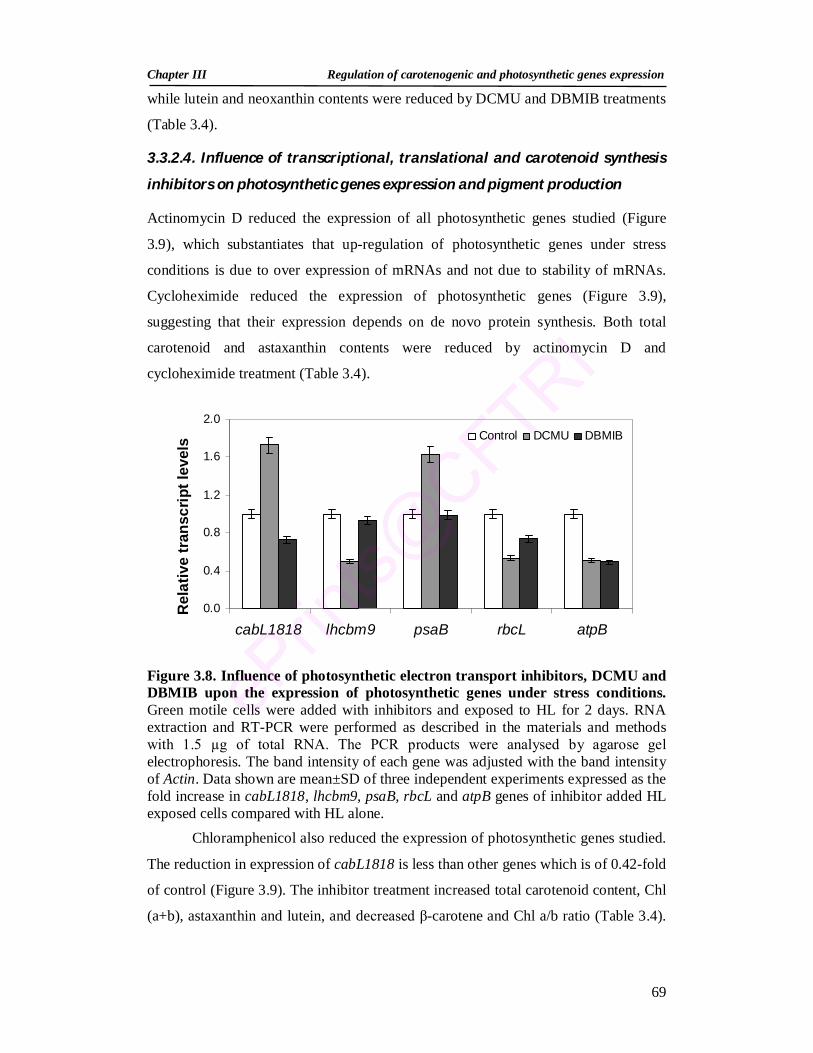
Chapter III Regulation of carotenogenic and photosynthetic genes expression
69
while lutein and neoxanthin contents were reduced by DCMU and DBMIB treatments
(Table 3.4).
3.3.2.4. Influence of transcriptional, translational and carotenoid synthesis
inhibitors on photosynthetic genes expression and pigment production
Actinomycin D reduced the expression of all photosynthetic genes studied (Figure
3.9), which substantiates that up-regulation of photosynthetic genes under stress
conditions is due to over expression of mRNAs and not due to stability of mRNAs.
Cycloheximide reduced the expression of photosynthetic genes (Figure 3.9),
suggesting that their expression depends on de novo protein synthesis. Both total
carotenoid and astaxanthin contents were reduced by actinomycin D and
cycloheximide treatment (Table 3.4).
Figure 3.8. Influence of photosynthetic electron transport inhibitors, DCMU and DBMIB upon the expression of photosynthetic genes under stress conditions. Green motile cells were added with inhibitors and exposed to HL for 2 days. RNA extraction and RT-PCR were performed as described in the materials and methods with 1.5 µg of total RNA. The PCR products were analysed by agarose gel electrophoresis. The band intensity of each gene was adjusted with the band intensity of Actin. Data shown are mean±SD of three independent experiments expressed as the fold increase in cabL1818, lhcbm9, psaB, rbcL and atpB genes of inhibitor added HL exposed cells compared with HL alone.
Chloramphenicol also reduced the expression of photosynthetic genes studied.
The reduction in expression of cabL1818 is less than other genes which is of 0.42-fold
of control (Figure 3.9). The inhibitor treatment increased total carotenoid content, Chl
(a+b), astaxanthin and lutein, and decreased β-carotene and Chl a/b ratio (Table 3.4).
0.0
0.4
0.8
1.2
1.6
2.0
cabL1818 lhcbm9 psaB rbcL atpB
Control DCMU DBMIB
Rel
ativ
e tr
ansc
ript l
evel
s
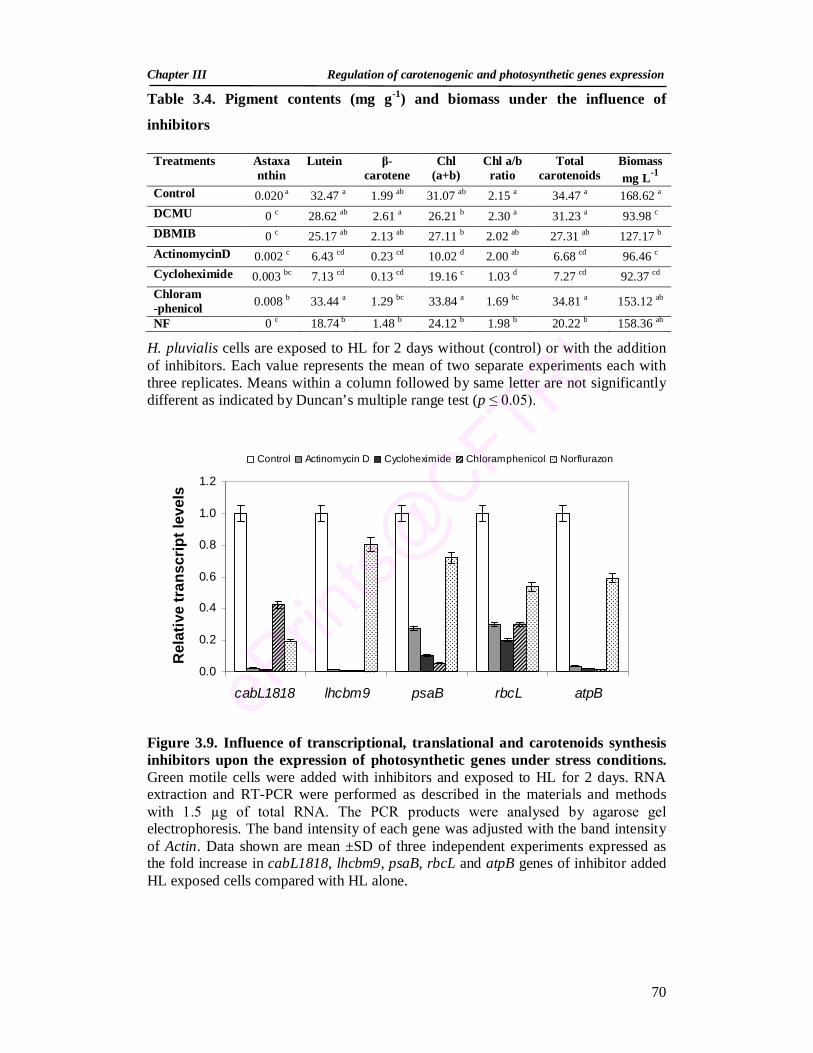
Chapter III Regulation of carotenogenic and photosynthetic genes expression
70
Table 3.4. Pigment contents (mg g-1) and biomass under the influence of
inhibitors
H. pluvialis cells are exposed to HL for 2 days without (control) or with the addition of inhibitors. Each value represents the mean of two separate experiments each with three replicates. Means within a column followed by same letter are not significantly different as indicated by Duncan’s multiple range test (p ≤ 0.05).
Figure 3.9. Influence of transcriptional, translational and carotenoids synthesis inhibitors upon the expression of photosynthetic genes under stress conditions. Green motile cells were added with inhibitors and exposed to HL for 2 days. RNA extraction and RT-PCR were performed as described in the materials and methods with 1.5 µg of total RNA. The PCR products were analysed by agarose gel electrophoresis. The band intensity of each gene was adjusted with the band intensity of Actin. Data shown are mean ±SD of three independent experiments expressed as the fold increase in cabL1818, lhcbm9, psaB, rbcL and atpB genes of inhibitor added HL exposed cells compared with HL alone.
Treatments Astaxanthin
Lutein β-carotene
Chl (a+b)
Chl a/b ratio
Total carotenoids
Biomass mg L-1
Control 0.020 a 32.47 a 1.99 ab 31.07 ab 2.15 a 34.47 a 168.62 a DCMU 0 c 28.62 ab 2.61 a 26.21 b 2.30 a 31.23 a 93.98 c DBMIB 0 c 25.17 ab 2.13 ab 27.11 b 2.02 ab 27.31 ab 127.17 b ActinomycinD 0.002 c 6.43 cd 0.23 cd 10.02 d 2.00 ab 6.68 cd 96.46 c Cycloheximide 0.003 bc 7.13 cd 0.13 cd 19.16 c 1.03 d 7.27 cd 92.37 cd Chloram -phenicol 0.008 b 33.44 a 1.29 bc 33.84 a 1.69 bc 34.81 a 153.12 ab
NF 0 c 18.74 b 1.48 b 24.12 b 1.98 b 20.22 b 158.36 ab
Control Actinomycin D Cycloheximide Chloramphenicol Norflurazon
0.0
0.2
0.4
0.6
0.8
1.0
1.2
cabL1818 lhcbm9 psaB rbcL atpB
Rel
ativ
e tr
ansc
ript l
evel
s
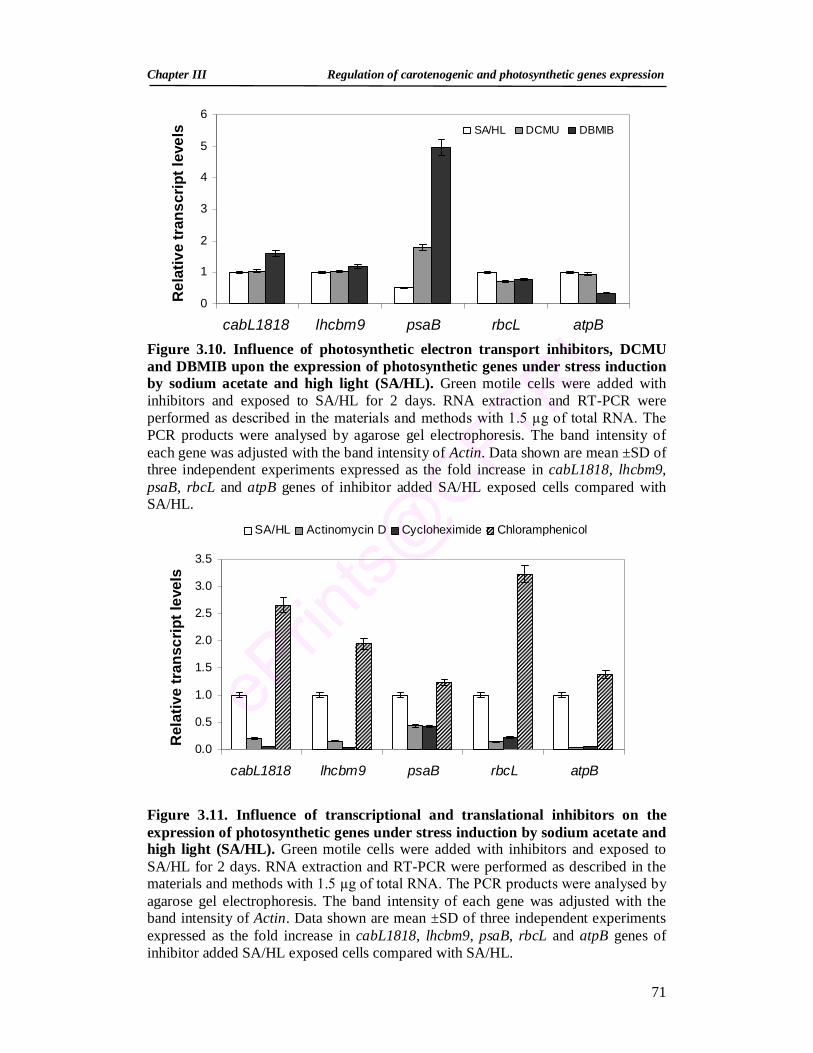
Chapter III Regulation of carotenogenic and photosynthetic genes expression
71
Figure 3.10. Influence of photosynthetic electron transport inhibitors, DCMU and DBMIB upon the expression of photosynthetic genes under stress induction by sodium acetate and high light (SA/HL). Green motile cells were added with inhibitors and exposed to SA/HL for 2 days. RNA extraction and RT-PCR were performed as described in the materials and methods with 1.5 µg of total RNA. The PCR products were analysed by agarose gel electrophoresis. The band intensity of each gene was adjusted with the band intensity of Actin. Data shown are mean ±SD of three independent experiments expressed as the fold increase in cabL1818, lhcbm9, psaB, rbcL and atpB genes of inhibitor added SA/HL exposed cells compared with SA/HL. Figure 3.11. Influence of transcriptional and translational inhibitors on the expression of photosynthetic genes under stress induction by sodium acetate and high light (SA/HL). Green motile cells were added with inhibitors and exposed to SA/HL for 2 days. RNA extraction and RT-PCR were performed as described in the materials and methods with 1.5 µg of total RNA. The PCR products were analysed by agarose gel electrophoresis. The band intensity of each gene was adjusted with the band intensity of Actin. Data shown are mean ±SD of three independent experiments expressed as the fold increase in cabL1818, lhcbm9, psaB, rbcL and atpB genes of inhibitor added SA/HL exposed cells compared with SA/HL.
0
1
2
3
4
5
6
cabL1818 lhcbm9 psaB rbcL atpB
SA/HL DCMU DBMIB
Rel
ativ
e tr
ansc
ript l
evel
s
SA/HL Actinomycin D Cycloheximide Chloramphenicol
0.0
0.5
1.0
1.5
2.0
2.5
3.0
3.5
cabL1818 lhcbm9 psaB rbcL atpB
Rel
ativ
e tr
ansc
ript l
evel
s
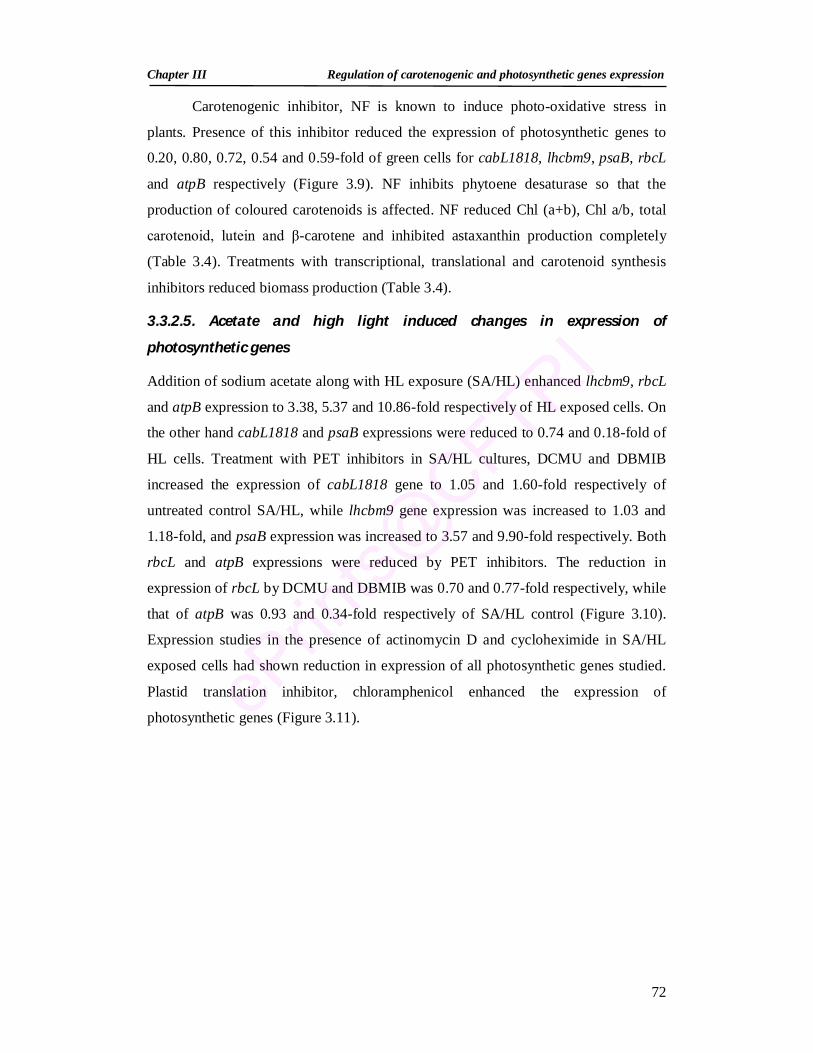
Chapter III Regulation of carotenogenic and photosynthetic genes expression
72
Carotenogenic inhibitor, NF is known to induce photo-oxidative stress in
plants. Presence of this inhibitor reduced the expression of photosynthetic genes to
0.20, 0.80, 0.72, 0.54 and 0.59-fold of green cells for cabL1818, lhcbm9, psaB, rbcL
and atpB respectively (Figure 3.9). NF inhibits phytoene desaturase so that the
production of coloured carotenoids is affected. NF reduced Chl (a+b), Chl a/b, total
carotenoid, lutein and β-carotene and inhibited astaxanthin production completely
(Table 3.4). Treatments with transcriptional, translational and carotenoid synthesis
inhibitors reduced biomass production (Table 3.4).
3.3.2.5. Acetate and high light induced changes in expression of
photosynthetic genes
Addition of sodium acetate along with HL exposure (SA/HL) enhanced lhcbm9, rbcL
and atpB expression to 3.38, 5.37 and 10.86-fold respectively of HL exposed cells. On
the other hand cabL1818 and psaB expressions were reduced to 0.74 and 0.18-fold of
HL cells. Treatment with PET inhibitors in SA/HL cultures, DCMU and DBMIB
increased the expression of cabL1818 gene to 1.05 and 1.60-fold respectively of
untreated control SA/HL, while lhcbm9 gene expression was increased to 1.03 and
1.18-fold, and psaB expression was increased to 3.57 and 9.90-fold respectively. Both
rbcL and atpB expressions were reduced by PET inhibitors. The reduction in
expression of rbcL by DCMU and DBMIB was 0.70 and 0.77-fold respectively, while
that of atpB was 0.93 and 0.34-fold respectively of SA/HL control (Figure 3.10).
Expression studies in the presence of actinomycin D and cycloheximide in SA/HL
exposed cells had shown reduction in expression of all photosynthetic genes studied.
Plastid translation inhibitor, chloramphenicol enhanced the expression of
photosynthetic genes (Figure 3.11).
Chapter III Regulation of carotenogenic and photosynthetic genes expression
73
3.4. Discussion
3.4.1. Regulation of carotenoid biosynthetic genes expression
The inhibition of astaxanthin and accumulation of β-carotene by DPA
treatment observed in the present study is in accordance with the reports of Harker
and Young (1995) and Grunewald and Hagen (2001). It has been found that the
accumulated β-carotene is present in lipid vesicles (Grünewald and Hagen 2001). The
reduction in β-carotene (0.57-fold of control) and lutein (0.51-fold) contents by
nicotine suggests that lycopene -cyclase which is a key enzyme in conversion of
lycopene to -carotene and -carotene is affected by nicotine. The accumulation of
lycopene by nicotine observed in the present study under NS/HL and ND/HL is in
correlation with the report of Harker and Young (1995), who also observed the
accumulation of lycopene under the influence of CPTA (2-(4-chlorophenylthio)-
triethylamine HCl), a lycopene cyclase inhibitor. Similarly, the accumulation of
lycopene by nicotine treatment was reported in other organisms. Eg. Chlorella
(Ishikawa and Abe 2004) and Xanthophyllomyces dendrorhous (Ducrey Sanpietro and
Kula 1998).
Cerulenin treatment inhibited astaxanthin synthesis and enhanced β-carotene
accumulation in NS/HL condition (Figure 3.4). Similar to this, Schoefs et al. (2001)
observed inhibition of astaxanthin without repressing de novo β-carotene synthesis
under cerulenin treatment. Lipid biosynthesis inhibitor sethoxydim, which inhibits
acetyl-CoA carboxylase, significantly decreased de novo fatty acid synthesis along
with drastic inhibition of astaxanthin formation (Zhekisheva et al. 2005). Similarly, in
Dunaliella bardawil which accumulates β-carotene as secondary carotenoid in lipid
droplets of chloroplasts under stress condition, both lipid accumulation and β-carotene
biosynthesis was inhibited under cerulenin and sethoxydim treatments (Rabbani et al.
1998). However under nutrient deficiency, astaxanthin accumulation increased in
cerulenin treated cultures. This may be due to induction of TAG synthesis under
nitrogen deficiency as reported by Zhekisheva et al. (2002).
Nicotine treatment reduced total carotenoid but it increased the accumulation
of lycopene and enhanced the expression of all carotenoid genes studied. Similarly,
up-regulation of the transcript levels of PSY, PDS and LCY were observed when
daffodil flowers were treated with CPTA (Al-Babili et al. 1999). In contrast to our
Chapter III Regulation of carotenogenic and photosynthetic genes expression
74
study, they observed substantial increase in total carotenoids. Accumulation of
phytoene was observed under NF treatment in H. pluvialis – both SC induced and
non-induced (Harker and Young 1995) and in pepper (Simkin et al. 2000). Unlike the
difference in expression of carotenogenic genes in the presence of NF observed in the
present study, expression of ZDS (-carotene desaturase), PDS and PSY genes were
not affected by a decrease in colored carotenoids or by an accumulation of the
precursors, phytoene or ζ-carotene in pepper leaves and seedlings due to a block in
carotenoid biosynthesis (Simkin et al. 2000), and increase in total carotenoids appears
to be independent of the regulation of the carotenoid genes transcript levels (Simkin et
al. 2000). Inhibition of carotenoid synthesis in tomato seedlings by bleaching
herbicides was accompanied by an increase in PSY and PDS mRNA levels (Giuliano
et al. 1993). Decreased transcript levels of the PSY gene with phytoene accumulation
was observed in sunflower (Campisi et al. 2006) and in Arabidopsis thaliana, PDS
expression was found to be independent of leaf pigment content (Wetzel and
Rodermel 1998).
Expression of carotenogenic genes under ND condition compared to NS
condition under high light revealed that expression of PSY, PDS, LCY, BKT and CHY
were 17.84, 1.09, 3.49, 2.73 and 2.84-fold higher respectively (Figure 3.5). Earlier
studies on analysis of carotenoid gene transcripts in H. pluvialis indicated the up-
regulation of PSY and CHY transcripts by HL, sodium acetate and NaCl (Steinbrenner
and Linden 2001), PSY, PDS, LCY and CHY under HL (Steinbrenner and Linden
2003) in heterotrophic grown cultures, PDS and BKT by nitrate deprivation
(Grünewald et al. 2000), CHY in cyst cells (Linden 1999) and BKT genes by HL,
sodium acetate and, sodium acetate and Fe2+ (Huang et al. 2006a). All the inhibitors
showed enhanced expression of carotenogenic genes under ND compared to
respective inhibitor condition under NS except LCY and BKT of nicotine and PSY and
LCY of cerulenin treated cells (Figure 3.6). The decrease in BKT expression by
nicotine was not significant. Reduced expression of LCY in nicotine treated cultures
was reflected in increased lycopene accumulation in ND compared to NS. Moreover
the decreased PSY and LCY in cerulenin treatment correlated well with decreased β-
carotene and lutein, and corresponding increase in astaxanthin by increased BKT and
CHY expression (Figure 3.6).
Chapter III Regulation of carotenogenic and photosynthetic genes expression
75
In the present study all the inhibitors studied resulted in decreased carotenoid
content in H. pluvialis cells under secondary carotenoid inducing conditions. There
was no correlation observed between the enhanced transcript levels of carotenogenic
genes and decreased total carotenoids which may be explained as follows. The
decreased translation might have increased the stability of these genes as observed for
chloroplast genes in the presence of chloramphenicol (Kato et al. 2006). Among the
inhibitors studied nicotine enhanced all the carotenogenic genes expression while
DPA and NF decreased the expression of PDS, BKT and CHY. PDS was inhibited by
cerulenin while PSY was inhibited only by DPA. However, all the inhibitors
decreased the total carotenoid content. It is also interesting to note that total
carotenoid content was significantly less in nicotine treated cultures (0.53%) in which
all the carotenogenic genes exhibited enhanced levels of expression (Table 3.3). This
clearly states that these inhibitors are likely to act at post translational or enzyme level
in addition to their action at transcriptional level in the carotenoid biosynthesis
pathway. Lycopene accumulation in the nicotine treated cultures further substantiates
the above statement. The increase in total carotenoids was reported in higher plants in
the presence of inhibitors due to accumulation of precursors (Al-Babili et al. 1999).
However in the present study the decrease in total carotenoids observed in spite of the
accumulation of precursors, may be due to the higher rate of degradation of
carotenoids in H. pluvialis upon exposure to high light in the absence of astaxanthin
which is likely to have photo-protective role. The detailed study of carotenoid gene
transcripts and carotenoid content described in this article indicates that, in addition to
the transcriptional regulation of carotenoid biosynthesis, regulation at other levels
appear to be operational.
3.4.2. Regulation of photosynthetic genes expression
Photosynthesis plays an important regulatory role in the acclimation of photosynthetic
organisms to light conditions (Allen and Pfannschmidt 2000; Steinbrenner and Linden
2003). This acclimation involves changes in the redox state of the components of the
photosynthetic electron transport that leads to the adjustment of photosystem
stoichiometry and to balance electron transport rates. Redox control was also reported
to be involved in the post-translational modification of the photosynthetic proteins,
and regulation of transcription of chloroplast and nuclear genes for photosynthesis
(Escoubas et al. 1995; Pfannschmidt et al. 1999), post-transcriptional regulation of
Chapter III Regulation of carotenogenic and photosynthetic genes expression
76
chloroplast genes (Alexciev and Tullberg 1997) and other genes (Kujat and Owttrim
2000). Our previous study has shown, H. pluvialis carotenoid synthesis genes are up-
regulated during stress induction by high light and nutrient deficiency and are
regulated at transcriptional, post-transcriptional and translational levels (Vidhyavathi
et al. 2008). Light induction of H. pluvialis carotenoid genes is also reported to be
under photosynthetic redox control (Steinbrenner and Linden 2003).
In H. pluvialis, exposure to high light intensities induces decreased Chl
(a+b) and increased Chl a/b ratio (Table 3.3). The increased Chl a/b ratio upon
exposure to high light and high light/nitrogen deficiency was reported by Kitajima
and Hogan (2003), and reduced Chl a/b ratio was observed by Zlotnik et al. (1993) in
H. pluvialis during aplanospore formation in nitrogen deficient medium. In addition,
the loss of Chls and reduction in Fv/Fm ratio (variable to maximum fluorescence,
maximum photochemical yield of PSII) observed in the present study under stress
conditions (Table 3.3) indicated the stress response leads to photo inhibition (Torzillo
et al. 2005), but further reduction in Fv/Fm of cysts (Table 3.3) indicated that cyst
cells are photosynthetically competent but they operate at photosynthetically reduced
level (Vidhyavathi et al. 2007), which may be due to impaired linear electron flow
from PSII to PSI (Tan et al. 1995). In H. pluvialis, quenching of excess light under
secondary carotenoid inducing conditions are done by xanthophyll-dependent
quenching for first few hours of exposure to high light and later light is filtered by
bright red color of astaxanthin (Masojidek et al. 2004). This photo-protective nature
of astaxanthin might be protecting the photosynthetic apparatus from excess light and
maintaining reduced photosynthetic activity in cysts.
Figure 3.7 shows photosynthetic genes, cabL1818, lhcbm9, psaB, rbcL and
atpB were up-regulated by HL and ND/HL induced stress with each gene following
different kinetics of up-regulation. This indicated that expressions of these genes are
transcriptionally regulated, and transcripts of these genes were found even in cyst
cells. Li and Sherman (2000) also reported enhanced accumulation of psbA and
psbDII transcripts in Synechocystis sp. strain PCC 6803, by a shift to high light
conditions, to compensate for the loss of D1 and D2 proteins and to maintain a
functional PSII. The up-regulation of photosynthetic genes observed in the present
study, were correlated well with the observations of Wang et al. (2004a) and Kim et
al. (2006) in the proteomics studies of H. pluvialis. Wang et al. (2004a) reported that
Rubisco large subunit, ATP synthase α-subunit and ATP β-subunit proteins are
Chapter III Regulation of carotenogenic and photosynthetic genes expression
77
transiently down-regulated, then up-regulated under oxidative stress induced by 45
µM Sodium acetate, 450 µM ferrous sulfate and continuous illumination of 150 µmol
photons m-2 s-1. Kim et al. (2006) observed that light harvesting Chl a/b binding
protein associated with PS I, and ATP synthase α-subunit proteins are induced in red
cyst cells of H. pluvialis under high light stress. In contrast to our results, most of the
photosynthetic genes of H. pluvialis are down-regulated under nitrogen deficiency
and high light stress (Eom et al. 2006). Expression of Lhcb genes in Chlamydomonas
(Teramoto et al. 2002) and LhcII genes of Dunaliella salina (Wei et al. 2007) are
down-regulated by high light. In Chlamydomonas reinhardtii, the abundance of Lhcb,
Lhcb4 and Lhca transcripts were reduced within 1-2 h of high light exposure, and they
recovered to their low light concentrations within 6-8 h (Dunford et al. 2003).
Figure 3.8 shows the opposite effects of DCMU and DBMIB on the
expression of nuclear encoded photosynthetic genes, cabL1818 and lhcbm9, and
chloroplast encoded photosynthetic genes, psaB and rbcL, suggesting that these genes
are under the control of redox state of PQ pool. In many organisms expression of
photosynthetic genes are under photosynthetic redox control. For example, in
Dunaliella spp., the down-regulation of cab by high light is under redox control
(Escoubas et al. 1995; Maxwell et al. 1995), like wise the transcription of cab and
rbcS genes of Arabidopsis (Oswald et al. 2001), psaB gene of pea (Tullberg et al.
2000), psaA/B and psbA of mustard (Pfannschmidt et al. 1999) are also under redox
control. Inhibition of high light induced expression of atpB mRNAs by both DCMU
and DBMIB (Figure 3.8), shows that the redox state of the PQ pool is not involved in
this situation. As suggested by Alfonso et al. (2000), cytochrome b6/f complex may
be involved in the regulation of atpB gene expression. In Synechocystis sp. 6803, the
redox state of the cytochrome b6/f complex appeared to regulate the transcription of a
PSI gene, psaE (El Bissati and Kirilovsky 2001).
Studies using actinomycin D, a transcriptional inhibitor, had shown reduction
in expression of photosynthetic genes, cabL1818, lhcbm9, psaB, rbcL and atpB upon
exposure to inhibitor (Figure 3.9). This substantiates that the high light induced up-
regulation of these genes is due to active transcription and not due to stability of their
mRNAs. This is similar to earlier reports on low stability of photosynthetic genes
(Brinker et al. 2001). Likewise, transcripts of these genes were reduced in the
presence of cycloheximide, a cytoplasmic translational inhibitor (Figure 3.9),
suggesting these genes expressions were dependent on de novo protein synthesis in
Chapter III Regulation of carotenogenic and photosynthetic genes expression
78
the cytosol. This is in concordance with the report of Teramoto et al. (2004), that HL-
induced expression of Lhl4 required de novo protein synthesis in the cytosol. The
reduction in expression of photosynthetic genes under the influence of transcription
and cytoplasmic translation inhibitors (Figure 3.9) was correlated well with the
reduction in photosynthetic pigments (Table 3.4). In contrast to our observation of
decreased expression of photosynthetic genes in the presence of chloramphenicol,
increased accumulation of psaB and psaA, and normal accumulation of rbcL and atpB
transcripts were observed in Chlamydomonas (Xu et al. 1993). Similar to our results,
the increased accumulation of Chl and lutein, and decreased accumulation of lhcp
mRNAs in chloramphenicol treated wheat chlorina mutant (Mogen et al. 1990) and
loss of β-carotene and increased xanthophyll cycle pool pigments in C. reinhardtii
(Depka et al. 1998) were observed.
Blocking of carotenoid biosynthesis either through mutation or by growth in
the presence of bleaching herbicide NF, a noncompetitive inhibitor of carotenoid
biosynthesis, would be useful in generating carotenoid deficient condition for
studying biochemical and molecular changes. Under these conditions, high light
intensities cause bleaching and photo-oxidation (Sagar et al. 1988). Growth of H.
pluvialis in the presence of NF under high light showed decreased expression of
photosynthetic genes, affecting chloroplast genes more than nuclear genes (Figure
3.11). Similar to our results, reduction in expression of atpB and psaA genes were
observed in NF treated young spinach leaves (Tonkyn et al. 1992) and complete
absence of Lhcb1 mRNA in NF-treated maize leaves (La Rocca et al. 2000). Like
DCMU and chloramphenicol or lincomycin, NF also has primary effects on plastid-
located processes (Polle et al. 2000). The decreased expression of photosynthetic
genes in the presence of NF observed in the present study (Figure 3.9) indicated the
role of some other plastid signal in the regulation of photosynthetic genes expression.
It was reported that Mg-protoporphyrin and its monomethylester may act as plastid
signal for reducing photosynthetic genes expression under NF treated condition (La
Rocca et al. 2001).
Acetate enhances astaxanthin production in H. pluvialis through
transcriptional up-regulation and post-transcriptional modification of carotenogenic
genes (Vidhyavathi et al. 2008). To find out the effect of acetate on the expression of
photosynthetic genes, cells were exposed to HL for 48 h after the addition of acetate
with or without the addition of PET inhibitors. Acetate modulates HL induced
Chapter III Regulation of carotenogenic and photosynthetic genes expression
79
expression of photosynthetic genes. Similar to our results, decreased psbA and slightly
increased psaA transcripts were observed in Chlamydobotrys stellata in the presence
of acetate (Kovacs et al. 2000). In contrast to our observation on up-regulation of
lhcbm9 by acetate, the down regulation of lhcb was observed by Kindle (1987).
Acetate induced up-regulation of lhcbm9 was further enhanced by PET inhibitors,
while the reduction in psaB expression was recovered by inhibitors addition. For both
rbcL and atpB, acetate induced enhancement in transcript levels were reduced by PET
inhibitors (Figure 3.10). Since DCMU and DBMIB have opposite effects on the redox
state of the PQ pool, it can be concluded from the present study that redox state of PQ
pool is not involved in acetate induced differential expression of photosynthetic
genes, and they may be regulated at redox state of cytochrome b6/f complex. It was
reported that, acetate is involved in influencing photosynthetic activity by reducing
PQ (Endo and Asada 1996) and is involved in regulation of the redox state of
photosystem components thereby affecting transcription of nuclear and chloroplast
photosynthetic genes (Kovacs et al. 2000). Results from the present study suggested
acetate is involved in the regulation of photosynthetic genes transcription mainly
through the redox state of the cytochrome b6/f complex. Both actinomycin D and
cycloheximide, reduced SA/HL induced expression of photosynthetic genes, suggests
acetate induced expression is not due to increased mRNA stability and it depends on
de novo protein synthesis. Though the reason is not clear, chloramphenicol treatment
in SA/HL exposed cells not only increased the expression of chloroplast genes but
also nuclear genes of photosynthesis (Figure 3.11). The reason may be increased
stabilization of photosynthetic gene transcripts by reduced translation (Kato et al.
2006) in the presence of acetate. Our previous study also suggested involvement of
acetate in the post-transcriptional modification of carotenoid genes in H. pluvialis
(Vidhyavathi et al. 2008).
Present study is a first report of its kind in H. pluvialis, where photosynthetic
genes were studied under stress conditions which induce secondary carotenoid
synthesis and their regulation was also studied at PET, transcriptional and
translational levels and under photo-oxidative stress condition. The results showed
photosynthetic genes were regulated at transcriptional level and high light induced
differential expression of photosynthetic genes were regulated by redox state of PQ
pool but for atpB which was regulated by cytochrome b6/f complex. Enhanced
expression observed for few genes are due to enhanced transcription not due to
Chapter III Regulation of carotenogenic and photosynthetic genes expression
80
stability, and expression of these photosynthetic genes depends on cytoplasmic and
plastid protein synthesis. Acetate modulates the HL induced expression of
photosynthetic genes and this depends on redox state of cytochrome b6/f complex and
cytoplasmic protein synthesis. Blocking of plastid translation enhanced stability of
photosynthetic genes in acetate treated cultures. From the present study, it may be
inferred the involvement of multiple signals in modulating the expression of
photosynthetic genes under secondary carotenoid inducing conditions. Moreover,
from our previous study (Vidhyavathi et al. 2008) and present results, it can be
suggested that both photosynthetic genes and carotenoid genes are coordinately
regulated in H. pluvialis under stress conditions. In addition, H. pluvialis would be a
model organism to study the mechanism of light-harvesting and photo-protection
under secondary carotenoid inducing conditions.
Chapter IV
Molecular and biochemical changes associated with carotenogenesis
Chapter IV Molecular and biochemical changes associated with carotenogenesis
81
Summary
The genes differentially expressed under the stress conditions were analyzed using the mRNA differential display-RT PCR (DD-RT PCR) technique. From two populations of mRNA (green vegetative cells and cells exposed to high light intensity 97 µmol m-2 s-1), a total of 109 transcripts which were differentially expressed under stress conditions have been identified. After removal of false positives by re-amplification, 34 partial cDNAs were cloned, sequenced and analyzed in silico. Almost 50% of the DD cDNAs were either of unknown function or shared no apparent homology to any expressed sequences in the GenBank/EMBL databases. And about 50% of DD clones were similar to molecules related to general metabolism, photosynthesis, carotenoid synthesis, lipid synthesis, tetrapyrrole synthesis, transporter proteins, defense signaling and genetic information processing. The differential expression patterns were confirmed by RNA dot blot, northern blot and semi-quantitative RT-PCR analyses. RNA analyses of 6 DD clones revealed that 4 genes were induced under high light stress and two genes exhibited reduced expression. Changes in pigment profile with reference to carotenoid composition in different cell fractions, activities of carotenoid enzymes such as LCY and BKT, antioxidant enzymes, protein content and influence of phytohormones salicylic acid (ScA) and methyl jasmonate (MJ) were studied. LCY and BKT activities were found to increase under stress condition. Maximum activity of BKT was observed in lipid globules of stress induced cultures. Analysis of astaxanthin composition revealed decrease in free astaxanthin and increase in astaxanthin mono and diesters. Influence of CO2 enrichment (2%) along with other stress conditions like high light, nutrient deficiency, NaCl and sodium acetate addition on carotenoid accumulation was studied. Under the influence of high light, exposure of cells to nutrient deficiency enhanced carotenoid accumulation which was further enhanced by exposure to CO2 enriched environment and/or NaCl and sodium acetate addition. Changing the carbonate buffer in the lower compartment of 2-tier vessel to provide constant CO2 environment was found to be efficient in enhancing carotenoid content. A maximum of 30.61 mg g-1 of total carotenoid with 87% astaxanthin was achieved by exposing cells to high light, NaCl and CO2. ScA and MJ are exerting varied response in antioxidant systems of H. pluvialis, possibly due to different mechanisms of induction of antioxidant components against signaling molecule induced oxidative stress. Higher concentrations of ScA and MJ inhibited astaxanthin accumulation but each is having different mechanism of inhibition either by scavenging the free radicals or by increasing primary carotenoids production.
Chapter IV Molecular and biochemical changes associated with carotenogenesis
82
4.1. Introduction Astaxanthin functions as an antioxidant agent against oxidative stress (Kobayashi
2000; Li et al. 2008b) and offers protection against photo-oxidative damage and
photoinhibition (Wang et al. 2003b). Recent genomic and proteomic studies in
H. pluvialis to investigate global gene and protein expression revealed that many
genes and proteins related to growth, photosynthesis and respiration are differentially
expressed in addition to up-regulation of carotenoid genes and enzymes, during
secondary carotenogenesis (Hu et al. 2003; Wang et al. 2004a, 2004b; Eom et al.
2005). Such global analysis of carotenogenesis process would be helpful for
identification of differentially expressed novel genes and gene products since it is
possible that some of the gene products may be involved in regulation of the stress
response mechanisms in H. pluvialis.
Transcriptome profiling of plants to environmental stresses can be studied
using different techniques, which include differential display reverse transcription
PCR (DDRT-PCR), serial analysis of gene expression (SAGE), subtractive
hybridization, DNA-chip, and cDNA microarray. mRNA differential display is a
powerful tool for identifying and cloning genes whose expression levels have been
altered under different environmental conditions because of its technical simplicity
and lack of requirement for previous genomic information of the species of interest
(Liang and Pardee 1992; Carginale et al. 2004). Differential display involves the
random amplification of cDNA transcripts to identify particular mRNA species that
are expressed under defined conditions, and it enables very small differences in
transcription patterns to be detected. DD has been used by many people to find
differentially expressed transctripts under stress conditions (Im and Grossman 2001;
Vranová et al. 2002). Even in H. pluvialis using DD technique, a transcript which is
homologue to prokaryotic htrA was identified which is reported to be differentially
expressed during different development stages. This mRNA is not detectable in
vegetative cells, but was found at high levels in developing aplanospores (Hershkovits
et al. 1997).
Under normal condition, reactive oxygen species (ROS) are inevitably
generated through the electron transport activities in chloroplasts, mitochondria and
plasma membrane. Detoxification of ROS involves antioxidant defense mechanisms
Chapter IV Molecular and biochemical changes associated with carotenogenesis
83
which include several enzymatic and non-enzymatic antioxidants such as superoxide
dismutase (SOD), catalase (CAT), ascorbate peroxidase (APX), glutathione
peroxidase (GPX), carotenoids, flavonoids, phycocyanin and ascorbate etc (Mallick
2004). Phytohormones such as abscisic acid (ABA), jasmonic acid (JA), ethylene and
salicylic acid (ScA) appear to be critical components of complex signaling networks
in defense responses (Tarakhovskaya et al. 2007; Walia et al. 2007) and have diverse
functions in plant systems. Essentially all known phytohormones of higher plants
were found in algae but the information about the hormone metabolism and action
mechanisms is scarce (Tarakhovskaya et al. 2007). Involvement of both ScA and
methyl jasmonate (MJ) on growth and biochemical activity of Chlorella vulgaris was
observed (Czerpak et al. 2002; Czerpak et al. 2006). In Scenedesmus incrassatulus,
MJ is involved in changing the response of organism to salt stress (Fedina and
Benderliev 2000). Effects of methyl jasmonate (MJ) have also been seen on Euglena
gracilis Klebs and in red and brown macroalgae (Ueda et al. 1991), suggesting a
widespread use of this signaling molecule in photosynthetic organisms. In Fucus
(Phaeophyta), JA and MJ are reported to be important components of the signaling
pathway resulting in the development of defensive responses after plant damage with
phytophages (Arnold et al. 2001). In plant cell cultures, ScA and MJ are reported to
enhance secondary metabolite production (Sudha and Ravishankar 2003) through
influence of transcription of some nuclear genes (Stockigt et al. 1995).
Hence the present study has been taken to study the molecular and
biochemical changes associated with carotenogenesis in H. pluvialis. Differentially
expressed cDNA transcripts under stress conditions were identified by using DDRT-
PCR technique. Expression analyses of selected transcripts were carried out. In
addition to biochemical changes, effect of CO2 enrichment and phytohormones were
studied.
Chapter IV Molecular and biochemical changes associated with carotenogenesis
84
4.2. Materials and Methods
4.2.1. Differential display of light regulated transcripts in H. pluvialis
4.2.1.1. Culture growth
H. pluvialis cells grown for 7 days (green motile cells) and cells exposed to high light
intensity (HL) of 97 µmol m-2 s-1, nutrient deficiency and high light (ND/HL), nutrient
deficiency, high light and 0.1% NaCl (ND/HL/NC), nutrient deficiency, high light
and 4.4 mM sodium acetate (ND/HL/SA), and nutrient deficiency, high light, NaCl
and sodium acetate (ND/HL/NC/SA) were used for analysis.
4.2.1.2. Growth and pigment analyses
Algal cell number was determined by counting algal cells using Neubauer
haemacytometer. Known volume of culture was centrifuged at 3000 g for 10 min
and dry weight of the biomass was estimated as described in section 2.2.5.2. An
aliquot of culture was harvested and freeze dried. Pigment extraction and analyses
were carried out as per the procedure given in section 2.2.6.
4.2.1.3. RNA isolation and removal of genomic DNA contamination
Total RNA extraction and possible genomic DNA contamination removal was carried
out as described in section 2.2.7.
4.2.1.4. mRNA differential display
The mRNA Differential Display was conducted in two RNA samples namely RNA
isolated from green vegetative cells and cells exposed to HL stress. For cDNA
synthesis 0.2 g of total RNA was used. Briefly, RNA (0.2 g) was heated at 70C
for 5 min and immediately chilled on ice. First-strand cDNA synthesis was performed
in a reaction mixture containing 50 mM Tris–HCl (pH 8.5), 50 mM KCl, 4 mM
MgCl2, 10 mM DTT, 1mM each dNTP, 40 units of RiboLock Ribonuclease
Inhibitor (MBI Fermentas GmbH, St. Leon-Rot) and 40 units of H-minus M-MuLV
Reverse Transcriptase (MBI Fermentas) and 50 mM of different anchor primer (Table
4.1) for 1 h at 42C. The reaction was stopped by heating the mixture at 70C for 10
min and immediately chilled on ice. Later, second strand cDNA amplifications were
performed using total of 5 arbitrary primers in all 35 combinations with 7 different
anchored primers. PCR mixture (25 l) contained 2 l of reverse transcribed cDNA,
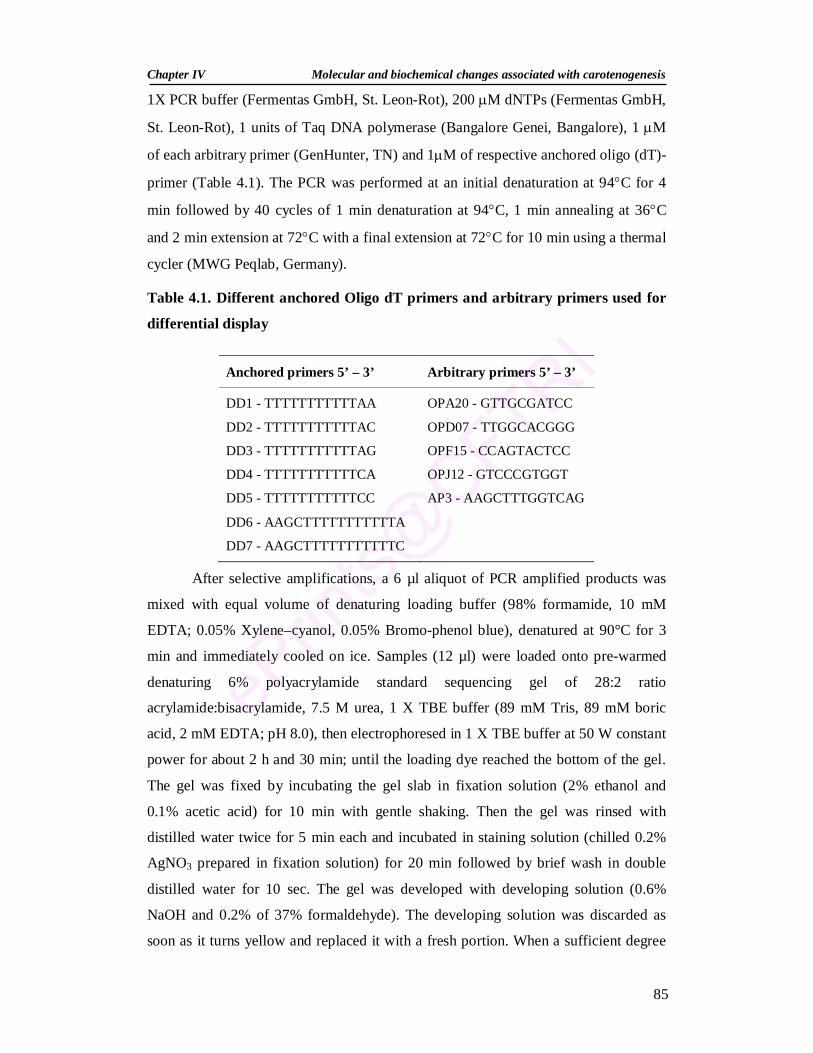
Chapter IV Molecular and biochemical changes associated with carotenogenesis
85
1X PCR buffer (Fermentas GmbH, St. Leon-Rot), 200 M dNTPs (Fermentas GmbH,
St. Leon-Rot), 1 units of Taq DNA polymerase (Bangalore Genei, Bangalore), 1 M
of each arbitrary primer (GenHunter, TN) and 1M of respective anchored oligo (dT)-
primer (Table 4.1). The PCR was performed at an initial denaturation at 94C for 4
min followed by 40 cycles of 1 min denaturation at 94C, 1 min annealing at 36C
and 2 min extension at 72C with a final extension at 72C for 10 min using a thermal
cycler (MWG Peqlab, Germany).
Table 4.1. Different anchored Oligo dT primers and arbitrary primers used for
differential display
Anchored primers 5’ – 3’ Arbitrary primers 5’ – 3’
DD1 - TTTTTTTTTTTAA OPA20 - GTTGCGATCC
DD2 - TTTTTTTTTTTAC OPD07 - TTGGCACGGG
DD3 - TTTTTTTTTTTAG OPF15 - CCAGTACTCC
DD4 - TTTTTTTTTTTCA OPJ12 - GTCCCGTGGT
DD5 - TTTTTTTTTTTCC AP3 - AAGCTTTGGTCAG
DD6 - AAGCTTTTTTTTTTTA
DD7 - AAGCTTTTTTTTTTTC
After selective amplifications, a 6 µl aliquot of PCR amplified products was
mixed with equal volume of denaturing loading buffer (98% formamide, 10 mM
EDTA; 0.05% Xylene–cyanol, 0.05% Bromo-phenol blue), denatured at 90°C for 3
min and immediately cooled on ice. Samples (12 µl) were loaded onto pre-warmed
denaturing 6% polyacrylamide standard sequencing gel of 28:2 ratio
acrylamide:bisacrylamide, 7.5 M urea, 1 X TBE buffer (89 mM Tris, 89 mM boric
acid, 2 mM EDTA; pH 8.0), then electrophoresed in 1 X TBE buffer at 50 W constant
power for about 2 h and 30 min; until the loading dye reached the bottom of the gel.
The gel was fixed by incubating the gel slab in fixation solution (2% ethanol and
0.1% acetic acid) for 10 min with gentle shaking. Then the gel was rinsed with
distilled water twice for 5 min each and incubated in staining solution (chilled 0.2%
AgNO3 prepared in fixation solution) for 20 min followed by brief wash in double
distilled water for 10 sec. The gel was developed with developing solution (0.6%
NaOH and 0.2% of 37% formaldehyde). The developing solution was discarded as
soon as it turns yellow and replaced it with a fresh portion. When a sufficient degree
Chapter IV Molecular and biochemical changes associated with carotenogenesis
86
of staining has been obtained, developing solution was replaced with 5% acetic acid
and then the gel was washed with distilled water.
4.2.1.5. Sequencing and homology search
Differentially expressed bands were excised from the gel and extracted using QIAEX
II polyacrylamide gel extraction kit (Qiagen) according to manufacturer’s
instructions. For reamplification, 2 µl of this solution was used in standard PCR
reactions using the same primer pair used in the Differential Display of the
correspondent reaction. PCR reactions were prepared in a final volume of 20 µl
containing 1 X Taq buffer (50 mM KCl, 1.5 mM MgCl2, 10 mM Tris–HCl pH 9.0),
0.25 mM dNTPs, 0.5 µM each primer and 1 unit of Taq DNA polymerase enzyme
(Biotools, Spain). The cycle program consisted of an initial step of 4 min at 94°C, 35
cycles of 30 s at 94°C, 60 s at 40°C and 45 s at 72°C, followed by a final extension
step of 8 min at 72°C. Directly after PCR amplification, the reaction mixture was
heated at 95○C for 20 min. Then 1 µl of 2 mM dATP/ 10 µl of PCR product was
added and incubated at 70○C for 15 min. Then the PCR products were purified using
HiPura PCR clean-up kit (HiMedia, India). A-addition was performed using A-
addition kit from Qiagen according to the manufacturer’s instructions and cloned into
pKRX-T vector following the cloning methodology (SBS Biotech, Beijing, China)
according to the supplied protocol. Ligated products were transformed into competent
cells of Escherichia coli strain DH5α. Plasmids from recombinant clones were
isolated with the Qiagen mini prep Plasmid Mini Kit and sequenced using universal
primers with commercial services (MWG Biotech, Bangalore, India and Bioserve,
Hyderabad, India). Homology search was carried out using the NCBI BLASTX and
BLASTN program with amino acid and nonredundant nucleotide sequences
respectively.
4.2.1.6. RNA dot blot
The total RNA was precipitated overnight at 4°C by the addition of 0.3 volumes of 10
mM LiCl and then precipitated in ethanol. The quality and quantity of the RNA was
checked by electrophoresis as described in the earlier section. One µl of total RNA
(RNA from the stock 1 µg µl-1) was denatured with 2 volumes of denaturing buffer
(1X MOPS containing formamide and formaldehyde) by boiling for 5 min and
immediately chilled on ice and spotted to a Hybond-N nylon membranes (Ambion).
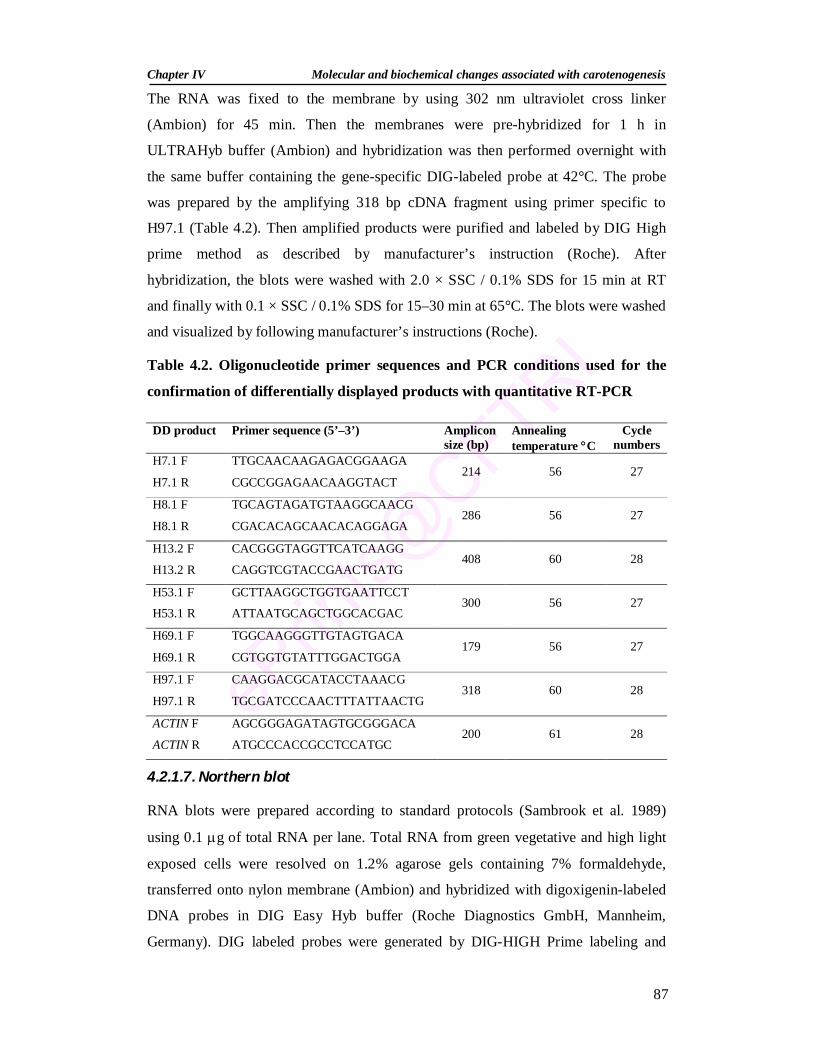
Chapter IV Molecular and biochemical changes associated with carotenogenesis
87
The RNA was fixed to the membrane by using 302 nm ultraviolet cross linker
(Ambion) for 45 min. Then the membranes were pre-hybridized for 1 h in
ULTRAHyb buffer (Ambion) and hybridization was then performed overnight with
the same buffer containing the gene-specific DIG-labeled probe at 42°C. The probe
was prepared by the amplifying 318 bp cDNA fragment using primer specific to
H97.1 (Table 4.2). Then amplified products were purified and labeled by DIG High
prime method as described by manufacturer’s instruction (Roche). After
hybridization, the blots were washed with 2.0 × SSC / 0.1% SDS for 15 min at RT
and finally with 0.1 × SSC / 0.1% SDS for 15–30 min at 65°C. The blots were washed
and visualized by following manufacturer’s instructions (Roche).
Table 4.2. Oligonucleotide primer sequences and PCR conditions used for the
confirmation of differentially displayed products with quantitative RT-PCR
DD product Primer sequence (5’–3’) Amplicon size (bp)
Annealing temperature C
Cycle numbers
H7.1 F TTGCAACAAGAGACGGAAGA 214 56 27
H7.1 R CGCCGGAGAACAAGGTACT
H8.1 F TGCAGTAGATGTAAGGCAACG 286 56 27
H8.1 R CGACACAGCAACACAGGAGA
H13.2 F CACGGGTAGGTTCATCAAGG 408 60 28
H13.2 R CAGGTCGTACCGAACTGATG
H53.1 F GCTTAAGGCTGGTGAATTCCT 300 56 27
H53.1 R ATTAATGCAGCTGGCACGAC
H69.1 F TGGCAAGGGTTGTAGTGACA 179 56 27
H69.1 R CGTGGTGTATTTGGACTGGA
H97.1 F CAAGGACGCATACCTAAACG 318 60 28
H97.1 R TGCGATCCCAACTTTATTAACTG
ACTIN F AGCGGGAGATAGTGCGGGACA 200 61 28
ACTIN R ATGCCCACCGCCTCCATGC
4.2.1.7. Northern blot
RNA blots were prepared according to standard protocols (Sambrook et al. 1989)
using 0.1 g of total RNA per lane. Total RNA from green vegetative and high light
exposed cells were resolved on 1.2% agarose gels containing 7% formaldehyde,
transferred onto nylon membrane (Ambion) and hybridized with digoxigenin-labeled
DNA probes in DIG Easy Hyb buffer (Roche Diagnostics GmbH, Mannheim,
Germany). DIG labeled probes were generated by DIG-HIGH Prime labeling and
Chapter IV Molecular and biochemical changes associated with carotenogenesis
88
detection starter kit I. After hybridization, the blot were washed with 2.0 × SSC /
0.1% SDS for 15 min at RT and finally with 0.1 × SSC / 0.1% SDS for 15–30 min at
65°C. Then the blots were washed and visualized by following manufacturer’s
instructions.
4.2.1.8. Reverse transcription-polymerase chain reaction (RT-PCR)
First strand cDNA synthesis was performed in a 20-µl reaction volume using 1.5 µg
of total RNA, oligo dT18 and M-MLV reverse transcriptase (Ambion) according to
manufacturer’s protocol. The reaction was allowed to proceed for 60 min at 42C
before being terminated by treatment at 92C for 10 min. The primers used for
amplification and amplification conditions are listed in Table 4.2. RT-PCR was
carried out as described in section 2.2.7. Following the separation of the PCR products
on ethidium bromide-stained 1.4% agarose gels, the bands were quantified. Each band
was normalized against the intensity obtained with the same cDNA using the ACTIN-
specific primers. For calculating the transcript abundance under stress conditions, the
transcript levels of each gene in green motile cells were taken for comparison.
4.2.2. Biochemical changes associated with carotenogenesis
4.2.2.1. Carotenoid enzyme activities
4.2.2.1.1. Culture growth
H. pluvialis green motile cells and cells exposed to high light (HL) for 2 days were
harvested for enzyme assays.
4.2.2.1.2. Determination of β-carotene ketolase activity
Preparation of Cell Fractions. Aliquots of cells were harvested by centrifugation at
1,400 g for 2 min and re-suspended in break buffer (0.1 M Tris-HCl pH 6.8, 5 mM
MgCl2, 10 mM NaCl, 10 mM KCl, 5 mM Na2-EDTA, 0.3 M sorbitol, and 0.1 mM
phenylmethylsulfonyl fluoride). The suspension was sonicated for 20 s in a
homogenizer (Sonopuls Ultrasonic Homogenizer HD 2200, Bandelin electronic
GmbH and Co. KG) and then centrifuged for 10 min at 16,000 g to yield chloroplast
and cell debris pellet. The supernatant was centrifuged at 16,000 g for 10 min to
yield chloroplast fraction. The supernatant was transferred to a fresh tube and
centrifuged at 90,000 g (Beckman L7-65 ultracentrifuge, USA) for 1 h and the lipid
Chapter IV Molecular and biochemical changes associated with carotenogenesis
89
vesicles floating on top were separated. The chloroplast and lipid fractions were
stored at -20°C and used for β-carotene ketolase activity and pigment estimation.
Enzyme assay. β-carotene ketolase activity was determined by the method of Fraser
et al. (1998). Lipid suspension was prepared by resuspending 10 mg of soybean oil in
1 ml of chloroform and centrifuged at 12000 g for 5 min. The clarified solution was
placed in a clear round-bottomed test tube and the lipid was dried onto the surface of
the glass tube under nitrogen. 100 mM Tris-HCL pH 8.0, containing 1 mM
dithiothreitol (0.5 ml) was placed onto the residue. Sonication (32-s bursts, full
power) was done to yield a suitable lipid suspension. Lipid vesicles were prepared
freshly prior to incubations. The final volume of the reaction mixture used was
typically 600 l. The cofactor solution (295 l) contained dithiothreitol (1 mM),
FeSO4 (0.5 mM), ascorbic acid (5 mM), 2-oxoglutarate (0.5 mM), and deoxycholate
(0.1% mass/vol.). Lipid suspension (20 l) and cell extract (300 l) were added to the
cofactor solution, mixed and then equilibrated at 30C for 5 min. Finally the reaction
was initiated by the addition of 6 l of β-carotene in chloroform (1.0% by vol.).
Control incubations with buffer (0.4 M Tris-HCl, pH 8.0) alone and boiled (3 min)
cell extracts were also performed. The mixture was incubated by shaking in the dark
for 4 h at 30C. Incubations were terminated by the addition of methanol and stored at
-70C.
Products and substrates from the in vitro incubations were extracted with 3
volumes of 10% (v/v) diethyl ether in petroleum ether 40-60C. After mixing a
partition was formed by centrifugation at 3000 g for 5 min at 4C. The organic
phase was removed and the aqueous phase re-extracted with the same solvent. The
remaining aqueous phase was further re-extracted with chloroform (2 volumes). The
organic extracts were pooled and brought to dryness under a stream of nitrogen, and
stored in -70C. HPLC analysis was performed as described in section 2.2.6.4.
4.2.2.1.3. Determination of lycopene cyclase activity
Lycopene cyclase activity in the H. pluvialis cells was determined by the method of
Schnurr et al. (1996). The culture was centrifuged and the wet biomass was extracted
with 0.2 M Tris-Maleate buffer (pH 6.8). The extract was centrifuged and supernatant
was used for enzyme assay. The reaction mixture (final volume 0.5 ml) contained 50
µl of 5 mM NADH and 150 µl of lycopene in soybean oil (as substrate) and 300 µl of
Chapter IV Molecular and biochemical changes associated with carotenogenesis
90
enzyme. The incubation was done in dark at 30°C for 4 h. Reaction was terminated by
adding methanolic KOH. The mixture was extracted with diethyl ether and petroleum
ether (1:1) mixture. Reaction products were analyzed by HPLC as explained in the
section 2.2.6.4. Lycopene cyclase activity was calculated in terms of β-carotene
formed and was expressed as nM of β- carotene formed mg protein-1 h-1.
4.2.2.2. Carotenoid content of H. pluvialis cells and cell fractions
Cell fractions were prepared as described in the section 4.2.2.1.2. Carotenoid
extraction and analyses were done as explained in section 2.2.6.
4.2.2.3. Qualitative analysis of proteins at different stages of H. pluvialis
Ten ml of H. pluvialis culture grown to different stages were centrifuged and pellets
were suspended in 2 M NaOH for 1 h in ice as described by Whitelam and Codd
(1982) and the alkaline solubilized protein was determined by Lowry’s method
(Lowry et al. 1951) using bovine serum albumin as the standard. The protein content
was expressed in mg per litre of culture.
4.2.2.4. Antioxidant enzyme activities
4.2.2.4.1. Preparation of extracts for enzyme assays
Cells were harvested at 1,400 g for 5 min and resuspended in 50 mM potassium
phosphate buffer (pH 7.0) containing 1 mM EDTA, 0.1% PVP, 0.25% Triton X-100
and 1 mM PMSF for SOD analysis. For APX analysis extraction buffer also contained
0.5 mM ascorbate. The cells were ground with a mortar and pestle under liquid
nitrogen. The suspensions were centrifuged again for 20 min at 4C and supernatants
were used for enzyme assays.
4.2.2.4.2. Enzyme assays
SOD (EC 1.15.1.1) was measured spectrophotometrically, based on the reduction of
nitro blue tetrazolium (NBT) to water insoluble blue formazan. The reaction mixture
contains 0.5 ml of enzyme extract, 1 ml of 50 mM sodium carbonate, 0.4 ml of 24 M
NBT and 0.2 ml of EDTA. The reaction was initiated by adding 0.4 ml of 1 mM
hydroxylamine hydrochloride. Zero time absorbance was taken at 560 nm followed by
recording the absorbance after 30 min at 25C. Control was simultaneously run
without enzyme extract. Units of SOD activity were expressed as the amount of
enzyme required to inhibit the reduction of NBT to 50%. The specific activity was
Chapter IV Molecular and biochemical changes associated with carotenogenesis
91
expressed in terms of units per mg protein (Murthy et al. 2002). APX (EC 1.11.1.11)
activity was assayed according to Choo et al. (2004). Briefly, the reaction mixture
consisted of 100 µl sample extract and 50 mM phosphate buffer (pH 7.0) containing
0.5 mM ascorbic acid (ASC) and 0.1 mM H2O2 in a total volume of 1 ml. The
consumption of ASC by APX was measured by the decrease in absorbance at 290 nm
( = 2.8 mM cm-1) at 25C.
4.2.3. Influence of CO2 enrichment on carotenoid accumulation
4.2.3.1. Algal culture growth
One week old green vegetative cells were harvested by centrifugation at 1,400 g for
5 min and resuspended either in complete medium (Bold’s Basal medium) or in
nutrient limiting medium (similar to complete medium except that it contains 1/10th of
N and P). Forty five ml of media (complete medium or nutrient limiting medium) was
inoculated with 5 ml of stock culture in respective media in the upper chamber of two
tier flask. Initial cell density was adjusted to 15 104 cells ml-1 by counting cell
number using haemacytometer. Then cultures were kept in 250 ml normal Erlenmeyer
flask or two-tier flask (Usha et al. 2001). 100 ml of 3M potassium carbonate buffer
(KHCO3-73 ml plus K2CO3-27 ml) was added to lower chamber of two-tier flask to
generate 2% CO2 for CO2 supplementation treatments, and for other treatments lower
chamber was filled with 100 ml of sterile water. Later, cultures were added with NaCl
17.1 mM plus SA 4.4 mM or without any addition, and exposed to continuous high
light intensity of 60 µmol m-2 s-1 at 25 1C for 10 days. All the treatments were
carried out in triplicate.
4.2.3.2. Growth and pigment analyses
Algal cell number was determined by counting algal cells using Neubauer
haemacytometer. Known volume of culture was centrifuged at 3000 g for 10 min
and dry weight of the biomass was estimated as described in section 2.2.5.2. An
aliquot of culture was harvested and freeze dried. Pigment extraction and analyses
were carried out as per the procedure given in section 2.2.6.
Chapter IV Molecular and biochemical changes associated with carotenogenesis
92
4.2.4. Influence of salicylic acid and methyl jasmonate on antioxidant
systems of H. pluvialis
4.2.4.1. Culture conditions
One week old green vegetative cells were transferred to either low light (30 µmol m-2
s-1) or high light intensity (60 µmol m-2 s-1) and different concentrations of ScA and
MJ were added. 100mM ScA stock was prepared in 70% ethanol and 424 mM MJ
stock in DMSO.
4.2.4.2. Growth and pigment analyses
Growth and pigment analyses were done as described in section 2.2.5 and 2.2.6.
4.2.4.3. Antioxidant enzyme activities
Six hours after exposure to required treatments cells were harvested. Enzyme
extraction and assays for SOD and APX were done as explained in section 4.2.2.4.
For CAT assay, enzyme extract preparation was similar to SOD. CAT (EC 1.11.1.6)
activity was determined according to the method of Beers and Sizer (1952). The
reaction mixture consisted of 100 µl sample extract and 50 mM phosphate buffer (pH
7.0) containing 18 mM H2O2 in a total volume of 3 ml. The consumption of H2O2 by
CAT was measured by the decrease in absorbance at 240 nm ( = 39.4 mM cm-1) at
25C.
4.2.5. Experimental design and data analysis
Each experiment was carried out with three replications. The data were analyzed by
one way analysis of variance and post-hoc mean separations were performed by
Duncan’s multiple range test at p ≤ 0.05 (Duncan 1955).
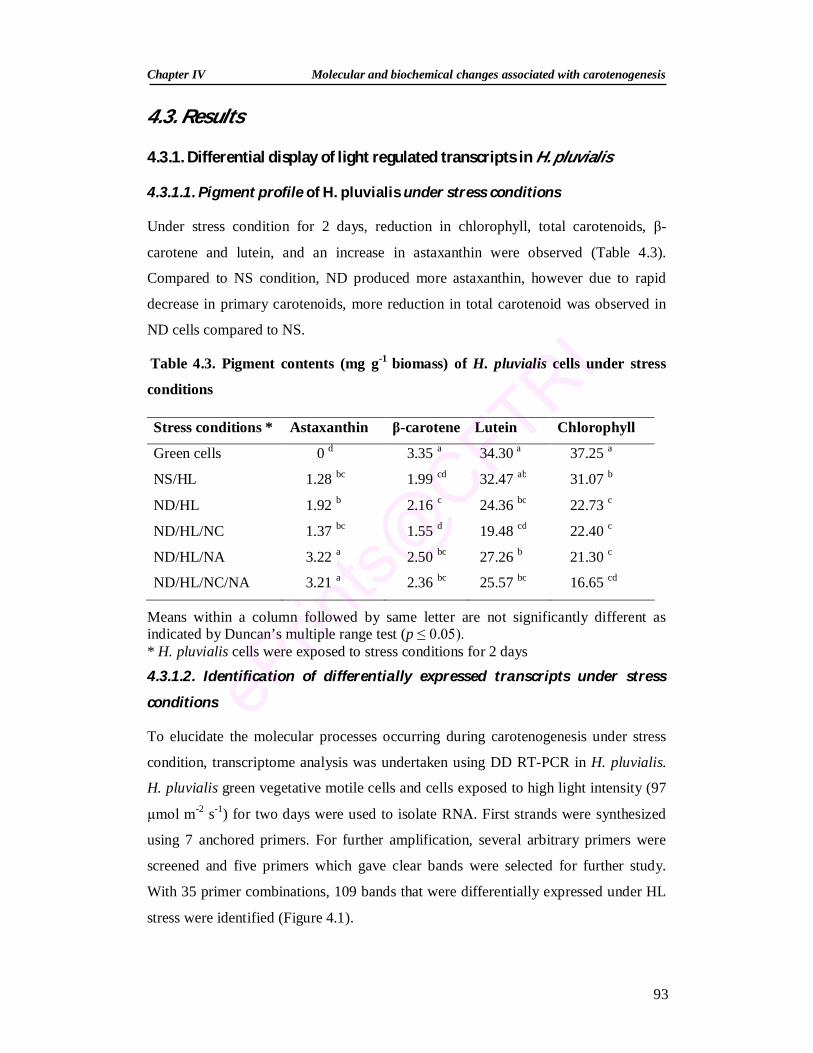
Chapter IV Molecular and biochemical changes associated with carotenogenesis
93
4.3. Results
4.3.1. Differential display of light regulated transcripts in H. pluvialis
4.3.1.1. Pigment profile of H. pluvialis under stress conditions
Under stress condition for 2 days, reduction in chlorophyll, total carotenoids, β-
carotene and lutein, and an increase in astaxanthin were observed (Table 4.3).
Compared to NS condition, ND produced more astaxanthin, however due to rapid
decrease in primary carotenoids, more reduction in total carotenoid was observed in
ND cells compared to NS.
Table 4.3. Pigment contents (mg g-1 biomass) of H. pluvialis cells under stress
conditions
Means within a column followed by same letter are not significantly different as indicated by Duncan’s multiple range test (p ≤ 0.05). * H. pluvialis cells were exposed to stress conditions for 2 days
4.3.1.2. Identification of differentially expressed transcripts under stress
conditions
To elucidate the molecular processes occurring during carotenogenesis under stress
condition, transcriptome analysis was undertaken using DD RT-PCR in H. pluvialis.
H. pluvialis green vegetative motile cells and cells exposed to high light intensity (97
µmol m-2 s-1) for two days were used to isolate RNA. First strands were synthesized
using 7 anchored primers. For further amplification, several arbitrary primers were
screened and five primers which gave clear bands were selected for further study.
With 35 primer combinations, 109 bands that were differentially expressed under HL
stress were identified (Figure 4.1).
Stress conditions * Astaxanthin β-carotene Lutein Chlorophyll
Green cells 0 d 3.35 a 34.30 a 37.25 a
NS/HL 1.28 bc 1.99 cd 32.47 ab 31.07 b
ND/HL 1.92 b 2.16 c 24.36 bc 22.73 c
ND/HL/NC 1.37 bc 1.55 d 19.48 cd 22.40 c
ND/HL/NA 3.22 a 2.50 bc 27.26 b 21.30 c
ND/HL/NC/NA 3.21 a 2.36 bc 25.57 bc 16.65 cd
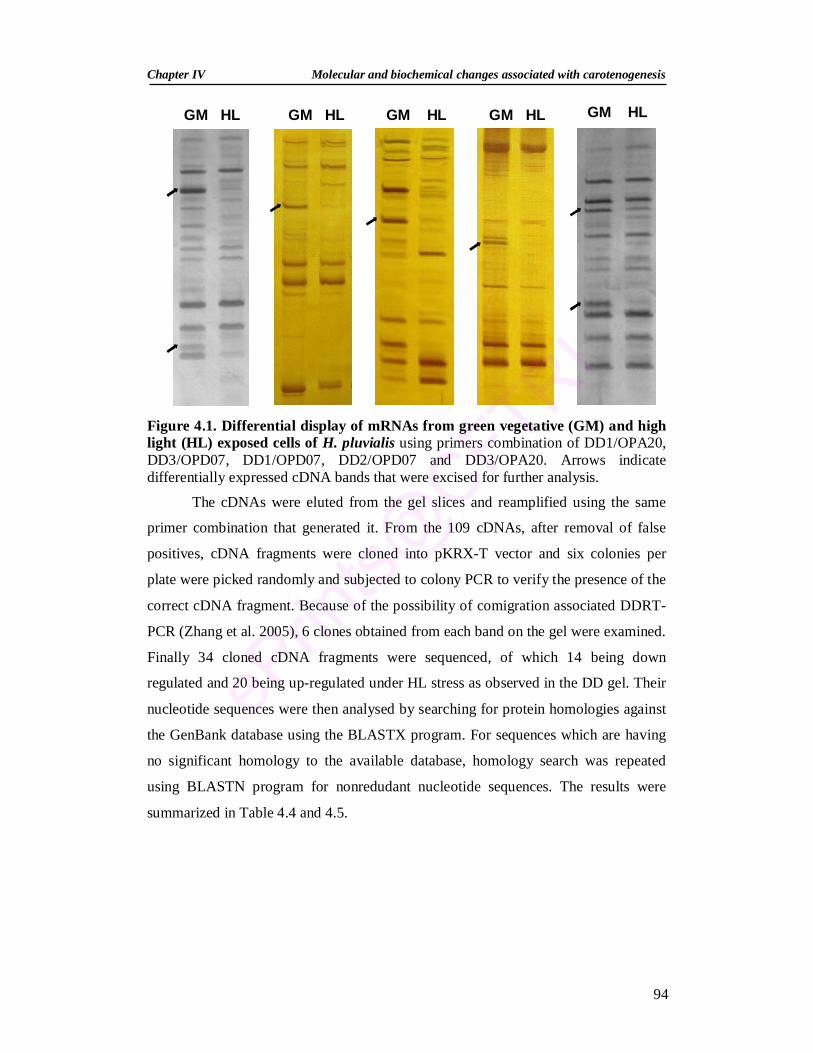
Chapter IV Molecular and biochemical changes associated with carotenogenesis
94
Figure 4.1. Differential display of mRNAs from green vegetative (GM) and high light (HL) exposed cells of H. pluvialis using primers combination of DD1/OPA20, DD3/OPD07, DD1/OPD07, DD2/OPD07 and DD3/OPA20. Arrows indicate differentially expressed cDNA bands that were excised for further analysis.
The cDNAs were eluted from the gel slices and reamplified using the same
primer combination that generated it. From the 109 cDNAs, after removal of false
positives, cDNA fragments were cloned into pKRX-T vector and six colonies per
plate were picked randomly and subjected to colony PCR to verify the presence of the
correct cDNA fragment. Because of the possibility of comigration associated DDRT-
PCR (Zhang et al. 2005), 6 clones obtained from each band on the gel were examined.
Finally 34 cloned cDNA fragments were sequenced, of which 14 being down
regulated and 20 being up-regulated under HL stress as observed in the DD gel. Their
nucleotide sequences were then analysed by searching for protein homologies against
the GenBank database using the BLASTX program. For sequences which are having
no significant homology to the available database, homology search was repeated
using BLASTN program for nonredudant nucleotide sequences. The results were
summarized in Table 4.4 and 4.5.
GM HL GM HL GM HL GM HL GM HL
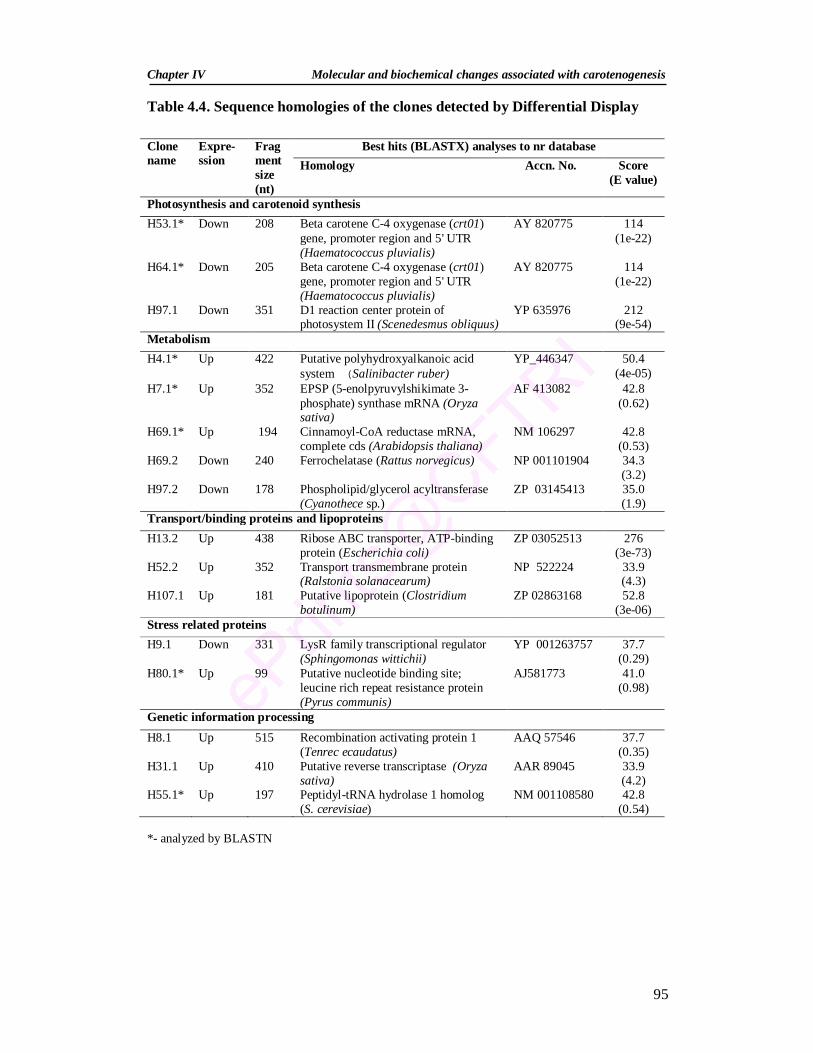
Chapter IV Molecular and biochemical changes associated with carotenogenesis
95
Table 4.4. Sequence homologies of the clones detected by Differential Display
*- analyzed by BLASTN
Clone name
Expre-ssion
Fragment size (nt)
Best hits (BLASTX) analyses to nr database Homology Accn. No. Score
(E value)
Photosynthesis and carotenoid synthesis H53.1* Down 208 Beta carotene C-4 oxygenase (crt01)
gene, promoter region and 5' UTR (Haematococcus pluvialis)
AY 820775 114 (1e-22)
H64.1* Down 205 Beta carotene C-4 oxygenase (crt01) gene, promoter region and 5' UTR (Haematococcus pluvialis)
AY 820775 114 (1e-22)
H97.1 Down 351 D1 reaction center protein of photosystem II (Scenedesmus obliquus)
YP 635976 212 (9e-54)
Metabolism H4.1* Up 422 Putative polyhydroxyalkanoic acid
system (Salinibacter ruber) YP_446347 50.4
(4e-05) H7.1* Up 352 EPSP (5-enolpyruvylshikimate 3-
phosphate) synthase mRNA (Oryza sativa)
AF 413082 42.8 (0.62)
H69.1* Up 194 Cinnamoyl-CoA reductase mRNA, complete cds (Arabidopsis thaliana)
NM 106297 42.8 (0.53)
H69.2 Down 240 Ferrochelatase (Rattus norvegicus) NP 001101904 34.3 (3.2)
H97.2 Down 178 Phospholipid/glycerol acyltransferase (Cyanothece sp.)
ZP 03145413 35.0 (1.9)
Transport/binding proteins and lipoproteins H13.2 Up 438 Ribose ABC transporter, ATP-binding
protein (Escherichia coli) ZP 03052513 276
(3e-73) H52.2 Up 352 Transport transmembrane protein
(Ralstonia solanacearum) NP 522224 33.9
(4.3) H107.1 Up 181 Putative lipoprotein (Clostridium
botulinum) ZP 02863168 52.8
(3e-06) Stress related proteins H9.1 Down 331 LysR family transcriptional regulator
(Sphingomonas wittichii) YP 001263757 37.7
(0.29) H80.1* Up 99 Putative nucleotide binding site;
leucine rich repeat resistance protein (Pyrus communis)
AJ581773 41.0 (0.98)
Genetic information processing H8.1 Up 515 Recombination activating protein 1
(Tenrec ecaudatus) AAQ 57546 37.7
(0.35) H31.1 Up 410 Putative reverse transcriptase (Oryza
sativa) AAR 89045 33.9
(4.2) H55.1* Up 197 Peptidyl-tRNA hydrolase 1 homolog
(S. cerevisiae) NM 001108580 42.8
(0.54)

Chapter IV Molecular and biochemical changes associated with carotenogenesis
96
Table 4.5. Clones showing unknown and hypothetical proteins and no similarity
detected by Differential Display
These differentially expressed transcripts include transcripts coding for
proteins related to general metabolism, photosynthesis, carotenoid synthesis, lipid
synthesis, tetrapyrrole synthesis, transporter proteins, defense signaling and genetic
information processing (Table 4.4). About 17 transcripts were having homology to
unknown and hypothetical proteins and 2 were having no significant similarity to
available database (Table 4.5).
Clone name
Expre-ssion
Fragment size (nt)
Best hits (BLASTX) analyses to nr database Homology Accn. No. Score
(E value) H2.1 Up 428 Orf122 (Chlorobium tepidum) AF 287482 69.3 (9e-11) H7.2 Up 707 Hypothetical protein (Vitis
vinifera) CAN 70790.1 135 (3e-30)
H13.1 Up 181 Hypothetical protein (Chlamydomonas reinhardtii)
XP 001698950 77.4 (3e-13)
H22.1 Up 146 Hypothetical protein (Bacteroides capillosus)
ZP 02038205 37.4 (0.39)
H22.2 Up 303 Unnamed protein product (Kluyveromyces lactis)
XP 453846 55.1 (5e-16)
H25.1 Down 155 Predicted protein (Trichoplax adhaerens)
XP 002118239 51.2 (3e-05)
H25.2 Down 245 Hypothetical protein (Trichoplax adhaerens)
XP 002118239 65.1 (2e-09)
H31.2 Up 179 Hypothetical protein (Chlamydomonas reinhardtii)
XP 001698950 75.9 (1e-12)
H32.1 Down 428 Unnamed protein product (Kluyveromyces lactis)
XP 453846 67.4 (1e-19)
H32.2 Down 180 Hypothetical protein (Chlamydomonas reinhardtii)
XP 001698950 77.4 (3e-13)
H32.3 Down 558 Hypothetical protein (Aspergillus clavatus)
XP 001269594 109 (1e-22)
H77.1 Up 267 Hypothetical protein (Nematostella vectensis)
XP 001618098 72.4 (6e-16)
H77.2 Up 122 ORF64d (Pinus koraiensis) YP 001152204 38.9 (0.13) H88.3 Down 363 GK18251 (Drosophila willistoni ) XP 002066362 35.0 (1.9) H97.3 Down 428 Hypothetical protein (Aspergillus
clavatus) XP 001269594 95.5 (1e-18)
H109.1 Down 250 Hypothetical protein (Bacillus megaterium)
AAO 52807 92.8 (8e-18)
H34.1 Up 434 No significant similarity H80.2 Up 168 No significant similarity
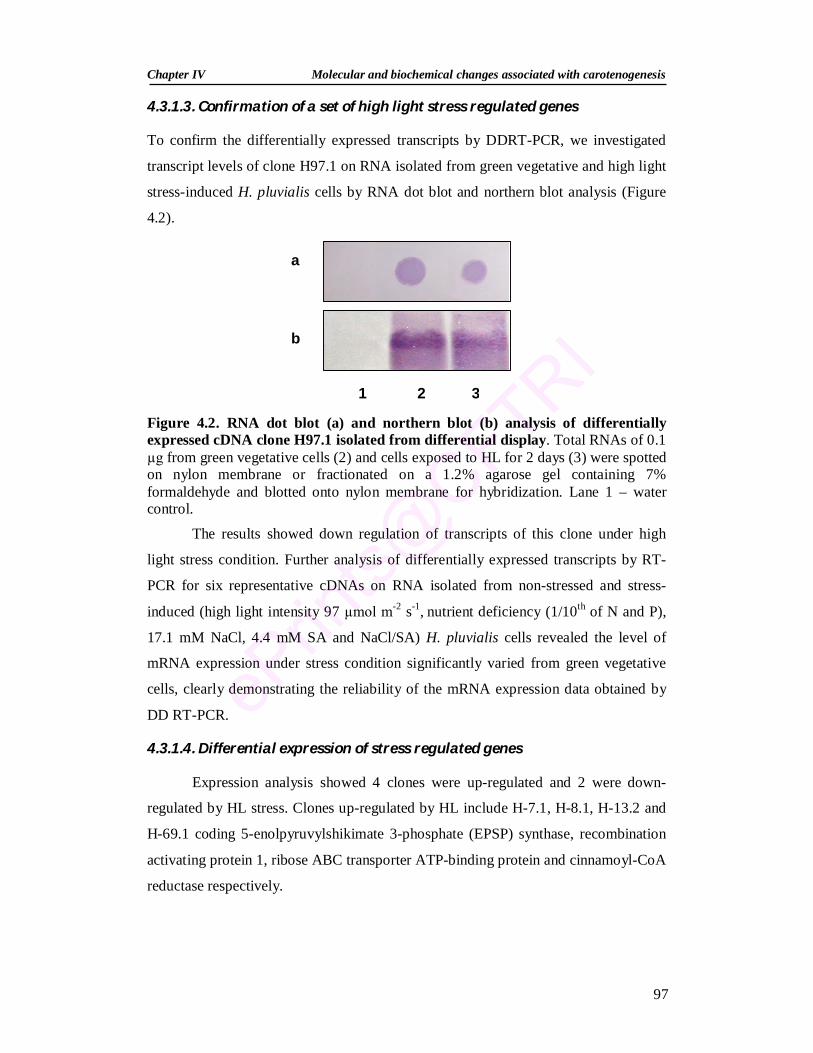
Chapter IV Molecular and biochemical changes associated with carotenogenesis
97
4.3.1.3. Confirmation of a set of high light stress regulated genes
To confirm the differentially expressed transcripts by DDRT-PCR, we investigated
transcript levels of clone H97.1 on RNA isolated from green vegetative and high light
stress-induced H. pluvialis cells by RNA dot blot and northern blot analysis (Figure
4.2).
Figure 4.2. RNA dot blot (a) and northern blot (b) analysis of differentially expressed cDNA clone H97.1 isolated from differential display. Total RNAs of 0.1 µg from green vegetative cells (2) and cells exposed to HL for 2 days (3) were spotted on nylon membrane or fractionated on a 1.2% agarose gel containing 7% formaldehyde and blotted onto nylon membrane for hybridization. Lane 1 – water control.
The results showed down regulation of transcripts of this clone under high
light stress condition. Further analysis of differentially expressed transcripts by RT-
PCR for six representative cDNAs on RNA isolated from non-stressed and stress-
induced (high light intensity 97 µmol m-2 s-1, nutrient deficiency (1/10th of N and P),
17.1 mM NaCl, 4.4 mM SA and NaCl/SA) H. pluvialis cells revealed the level of
mRNA expression under stress condition significantly varied from green vegetative
cells, clearly demonstrating the reliability of the mRNA expression data obtained by
DD RT-PCR.
4.3.1.4. Differential expression of stress regulated genes
Expression analysis showed 4 clones were up-regulated and 2 were down-
regulated by HL stress. Clones up-regulated by HL include H-7.1, H-8.1, H-13.2 and
H-69.1 coding 5-enolpyruvylshikimate 3-phosphate (EPSP) synthase, recombination
activating protein 1, ribose ABC transporter ATP-binding protein and cinnamoyl-CoA
reductase respectively.
1 2 3
a
b
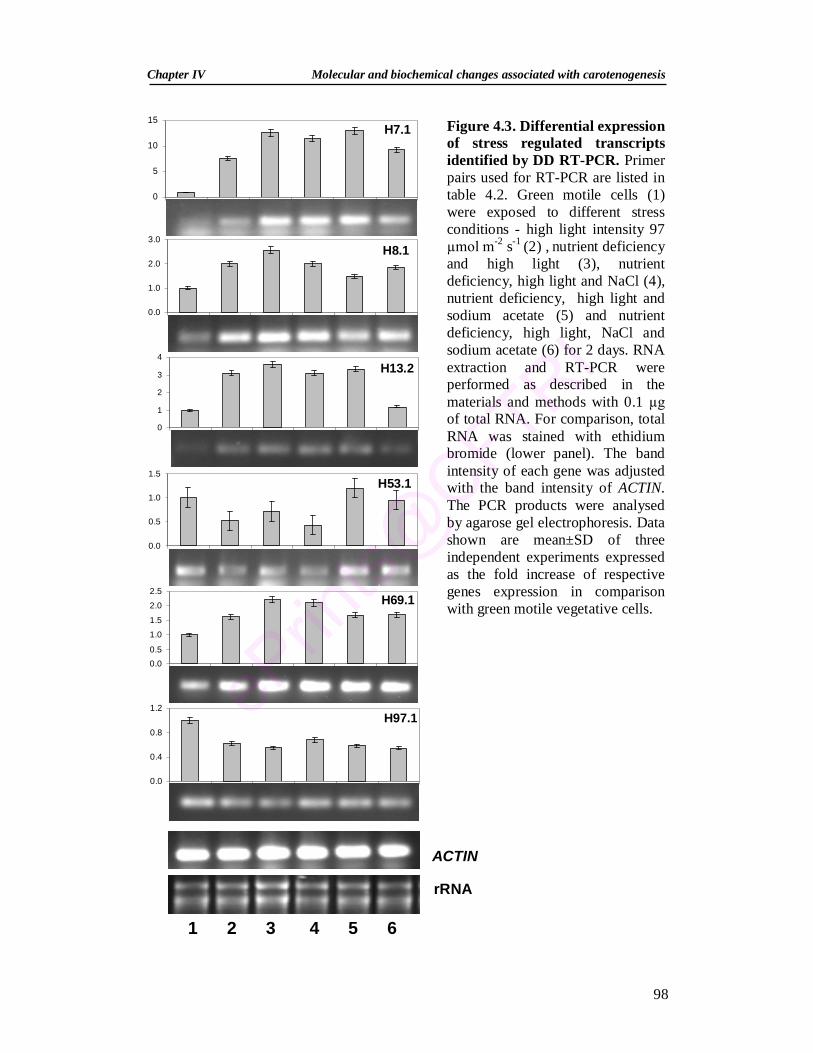
Chapter IV Molecular and biochemical changes associated with carotenogenesis
98
Figure 4.3. Differential expression of stress regulated transcripts identified by DD RT-PCR. Primer pairs used for RT-PCR are listed in table 4.2. Green motile cells (1) were exposed to different stress conditions - high light intensity 97 µmol m-2 s-1 (2) , nutrient deficiency and high light (3), nutrient deficiency, high light and NaCl (4), nutrient deficiency, high light and sodium acetate (5) and nutrient deficiency, high light, NaCl and sodium acetate (6) for 2 days. RNA extraction and RT-PCR were performed as described in the materials and methods with 0.1 µg of total RNA. For comparison, total RNA was stained with ethidium bromide (lower panel). The band intensity of each gene was adjusted with the band intensity of ACTIN. The PCR products were analysed by agarose gel electrophoresis. Data shown are mean±SD of three independent experiments expressed as the fold increase of respective genes expression in comparison with green motile vegetative cells.
0.0
1.0
2.0
3.0
1 2 3 4 5 6
H8.1
0
5
10
15H7.1
0
1
2
3
4H13.2
ACTIN
rRNA
0.0
0.5
1.0
1.5H53.1
0.0
0.4
0.8
1.2H97.1
0.00.5
1.0
1.5
2.0
2.5H69.1
1 2 3 4 5 6
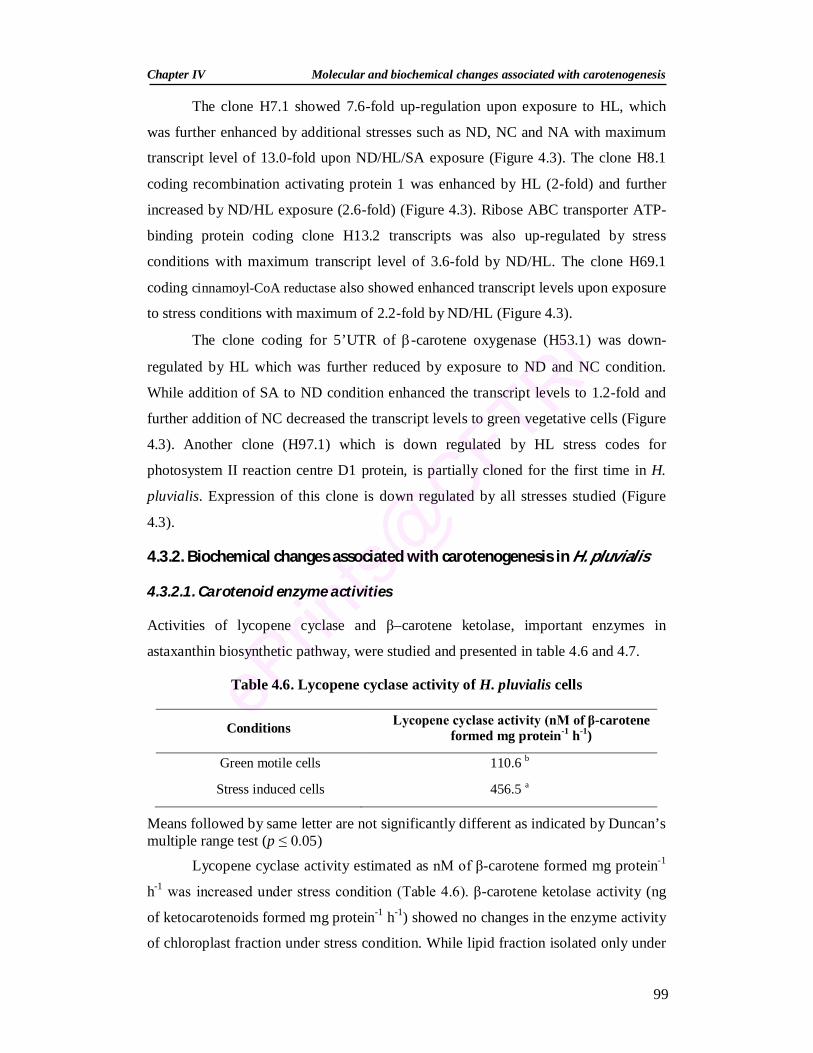
Chapter IV Molecular and biochemical changes associated with carotenogenesis
99
The clone H7.1 showed 7.6-fold up-regulation upon exposure to HL, which
was further enhanced by additional stresses such as ND, NC and NA with maximum
transcript level of 13.0-fold upon ND/HL/SA exposure (Figure 4.3). The clone H8.1
coding recombination activating protein 1 was enhanced by HL (2-fold) and further
increased by ND/HL exposure (2.6-fold) (Figure 4.3). Ribose ABC transporter ATP-
binding protein coding clone H13.2 transcripts was also up-regulated by stress
conditions with maximum transcript level of 3.6-fold by ND/HL. The clone H69.1
coding cinnamoyl-CoA reductase also showed enhanced transcript levels upon exposure
to stress conditions with maximum of 2.2-fold by ND/HL (Figure 4.3).
The clone coding for 5’UTR of -carotene oxygenase (H53.1) was down-
regulated by HL which was further reduced by exposure to ND and NC condition.
While addition of SA to ND condition enhanced the transcript levels to 1.2-fold and
further addition of NC decreased the transcript levels to green vegetative cells (Figure
4.3). Another clone (H97.1) which is down regulated by HL stress codes for
photosystem II reaction centre D1 protein, is partially cloned for the first time in H.
pluvialis. Expression of this clone is down regulated by all stresses studied (Figure
4.3).
4.3.2. Biochemical changes associated with carotenogenesis in H. pluvialis
4.3.2.1. Carotenoid enzyme activities
Activities of lycopene cyclase and β–carotene ketolase, important enzymes in
astaxanthin biosynthetic pathway, were studied and presented in table 4.6 and 4.7.
Table 4.6. Lycopene cyclase activity of H. pluvialis cells
Conditions Lycopene cyclase activity (nM of β-carotene formed mg protein-1 h-1)
Green motile cells 110.6 b
Stress induced cells 456.5 a
Means followed by same letter are not significantly different as indicated by Duncan’s multiple range test (p ≤ 0.05)
Lycopene cyclase activity estimated as nM of β-carotene formed mg protein-1
h-1 was increased under stress condition (Table 4.6). β-carotene ketolase activity (ng
of ketocarotenoids formed mg protein-1 h-1) showed no changes in the enzyme activity
of chloroplast fraction under stress condition. While lipid fraction isolated only under
Chapter IV Molecular and biochemical changes associated with carotenogenesis
100
stress condition showed increased activity compared to chloroplast fraction (Table
4.7).
Table 4.7. β–carotene ketolase activity of H. pluvialis cells
Means followed by same letter are not significantly different as indicated by Duncan’s multiple range test (p ≤ 0.05)
4.3.2.2. Carotenoid content of H. pluvialis cells and cell fractions
In the present study, it was observed that green motile H. pluvialis cells did not yield
lipid fraction when it was fractionated. Figure 4.4 showed that chloroplast fraction is
having lutein, β-carotene and chlorophyll as pigments while lipid fraction is having β-
carotene, astaxanthin, canthaxanthin and echinenone as pigments.
Figure 4.4. Pigment composition of chloroplast fraction of H. pluvialis cells
In the chloroplast fraction, proportion of chlorophyll increases and proportion
of lutein and β-carotene decreases over a period of time (Figure 4.4). While in the
lipid fraction, proportion of astaxanthin was increased, the proportion of β-carotene,
canthaxanthin and echinenone was decreased (Figure 4.5).
Conditions Fraction β–carotene ketolase activity (ng of
ketocarotenoids formed mg protein-1 h-1)
Green motile cells chloroplast 606.5 b
Stress induced cells chloroplast 606.9 b
Stress induced cells lipid 2523.9 a
Days after stress induction
Lutein Beta-carotene Chlorophyll
0
10
20
30
40
50
60
70
80
90
100
0 1 2 3 4
Perc
enta
ge o
f tot
al p
igm
ents
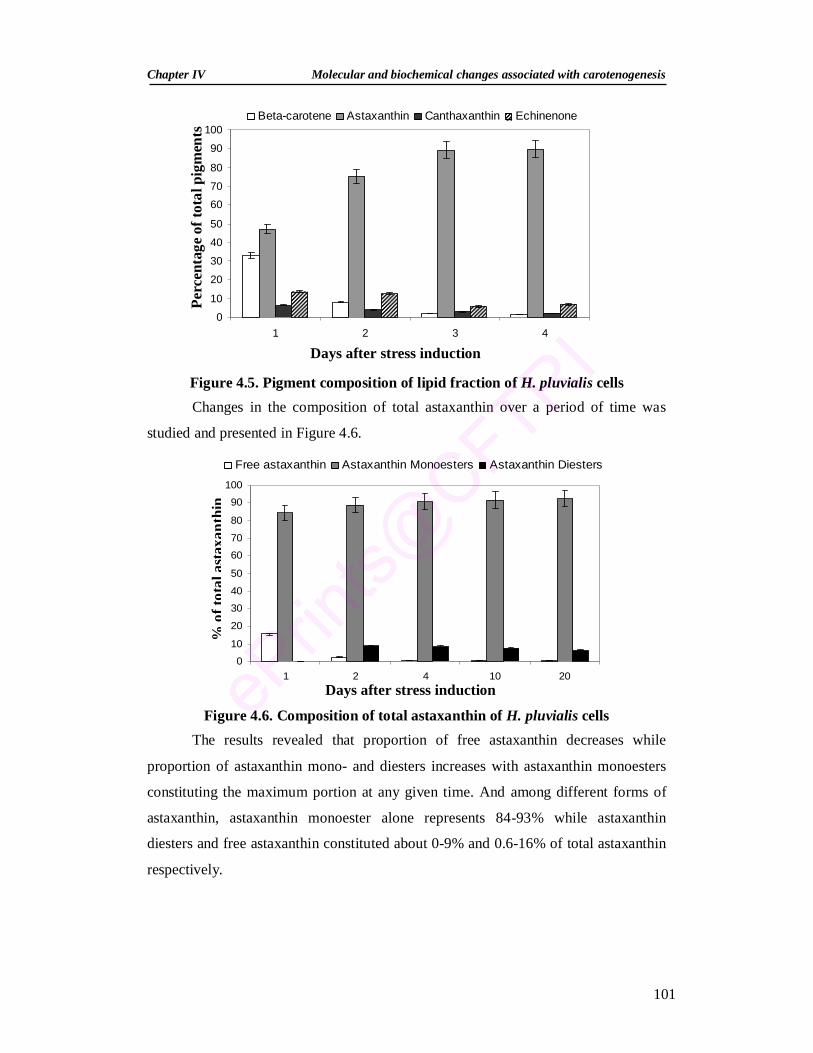
Chapter IV Molecular and biochemical changes associated with carotenogenesis
101
Figure 4.5. Pigment composition of lipid fraction of H. pluvialis cells Changes in the composition of total astaxanthin over a period of time was
studied and presented in Figure 4.6.
Figure 4.6. Composition of total astaxanthin of H. pluvialis cells The results revealed that proportion of free astaxanthin decreases while
proportion of astaxanthin mono- and diesters increases with astaxanthin monoesters
constituting the maximum portion at any given time. And among different forms of
astaxanthin, astaxanthin monoester alone represents 84-93% while astaxanthin
diesters and free astaxanthin constituted about 0-9% and 0.6-16% of total astaxanthin
respectively.
Days after stress induction
% o
f tot
al a
stax
anth
in
0
10
20
30
40
50
60
70
80
90
100
1 2 4 10 20
Free astaxanthin Astaxanthin Monoesters Astaxanthin Diesters
Days after stress induction
Beta-carotene Astaxanthin Canthaxanthin Echinenone
0
10
20
30
40
50
60
70
80
90
100
1 2 3 4
Perc
enta
ge o
f tot
al p
igm
ents
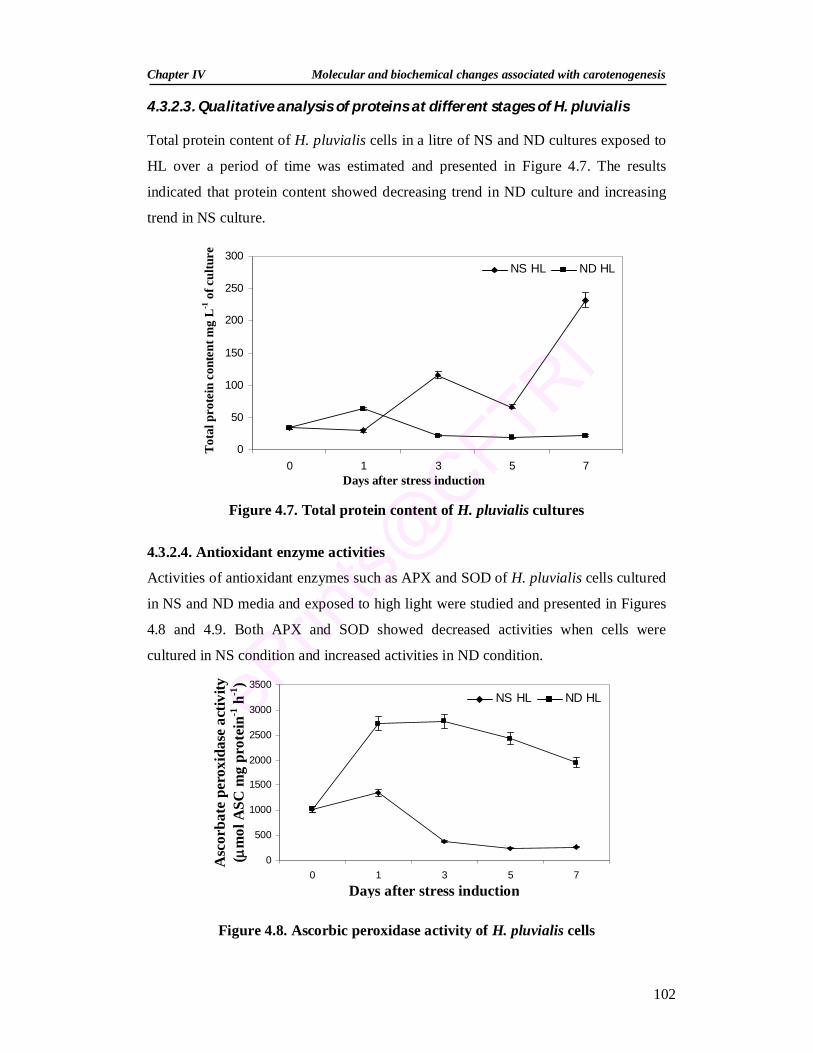
Chapter IV Molecular and biochemical changes associated with carotenogenesis
102
4.3.2.3. Qualitative analysis of proteins at different stages of H. pluvialis
Total protein content of H. pluvialis cells in a litre of NS and ND cultures exposed to
HL over a period of time was estimated and presented in Figure 4.7. The results
indicated that protein content showed decreasing trend in ND culture and increasing
trend in NS culture.
Figure 4.7. Total protein content of H. pluvialis cultures 4.3.2.4. Antioxidant enzyme activities
Activities of antioxidant enzymes such as APX and SOD of H. pluvialis cells cultured
in NS and ND media and exposed to high light were studied and presented in Figures
4.8 and 4.9. Both APX and SOD showed decreased activities when cells were
cultured in NS condition and increased activities in ND condition.
Figure 4.8. Ascorbic peroxidase activity of H. pluvialis cells
0
50
100
150
200
250
300
0 1 3 5 7
NS HL ND HL
Days after stress induction
Tota
l pro
tein
con
tent
mg
L-1 o
f cul
ture
0
500
1000
1500
2000
2500
3000
3500
0 1 3 5 7
NS HL ND HL
Days after stress induction
Asc
orba
te p
erox
idas
e ac
tivity
(
mol
ASC
mg
prot
ein-1
h-1
)
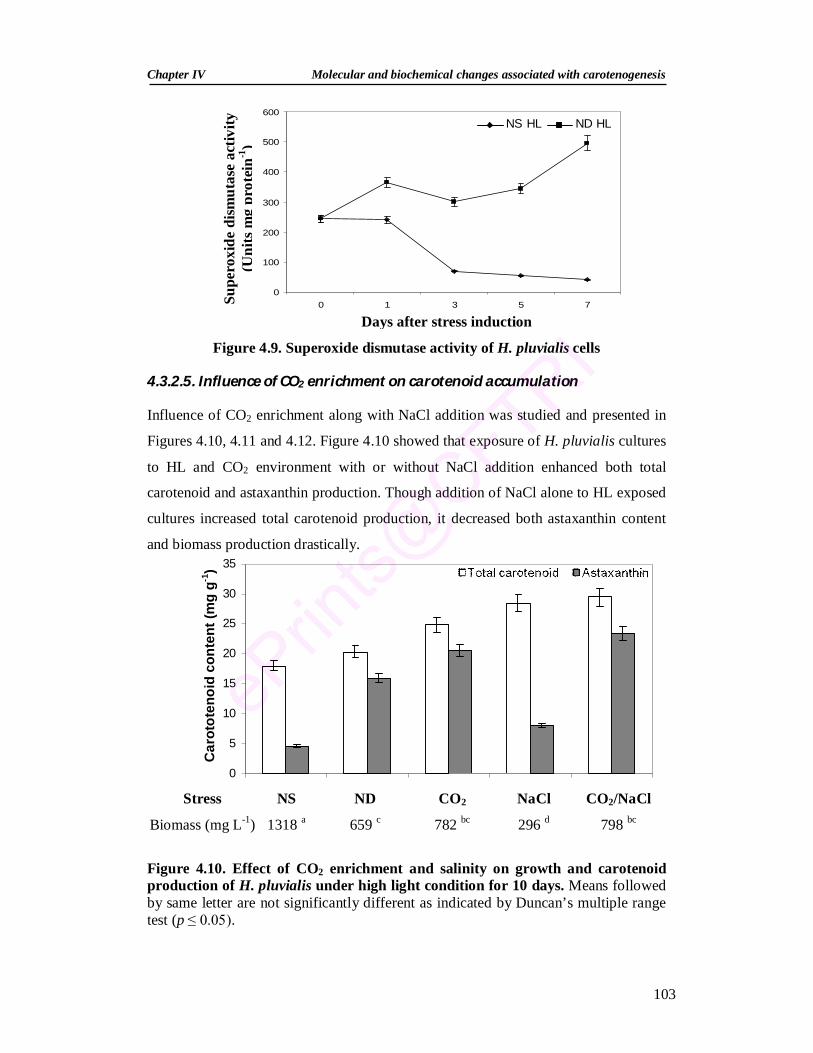
Chapter IV Molecular and biochemical changes associated with carotenogenesis
103
Figure 4.9. Superoxide dismutase activity of H. pluvialis cells
4.3.2.5. Influence of CO2 enrichment on carotenoid accumulation
Influence of CO2 enrichment along with NaCl addition was studied and presented in
Figures 4.10, 4.11 and 4.12. Figure 4.10 showed that exposure of H. pluvialis cultures
to HL and CO2 environment with or without NaCl addition enhanced both total
carotenoid and astaxanthin production. Though addition of NaCl alone to HL exposed
cultures increased total carotenoid production, it decreased both astaxanthin content
and biomass production drastically.
Figure 4.10. Effect of CO2 enrichment and salinity on growth and carotenoid production of H. pluvialis under high light condition for 10 days. Means followed by same letter are not significantly different as indicated by Duncan’s multiple range test (p ≤ 0.05).
Stress NS ND CO2 NaCl CO2/NaCl
Biomass (mg L-1) 1318 a 659 c 782 bc 296 d 798 bc
0
100
200
300
400
500
600
0 1 3 5 7
NS HL ND HL
Days after stress induction
Supe
roxi
de d
ismut
ase
activ
ity
(Uni
ts m
g pr
otei
n-1)
0
5
10
15
20
25
30
35
Car
otot
enoi
d co
nten
t (m
g g-1
)
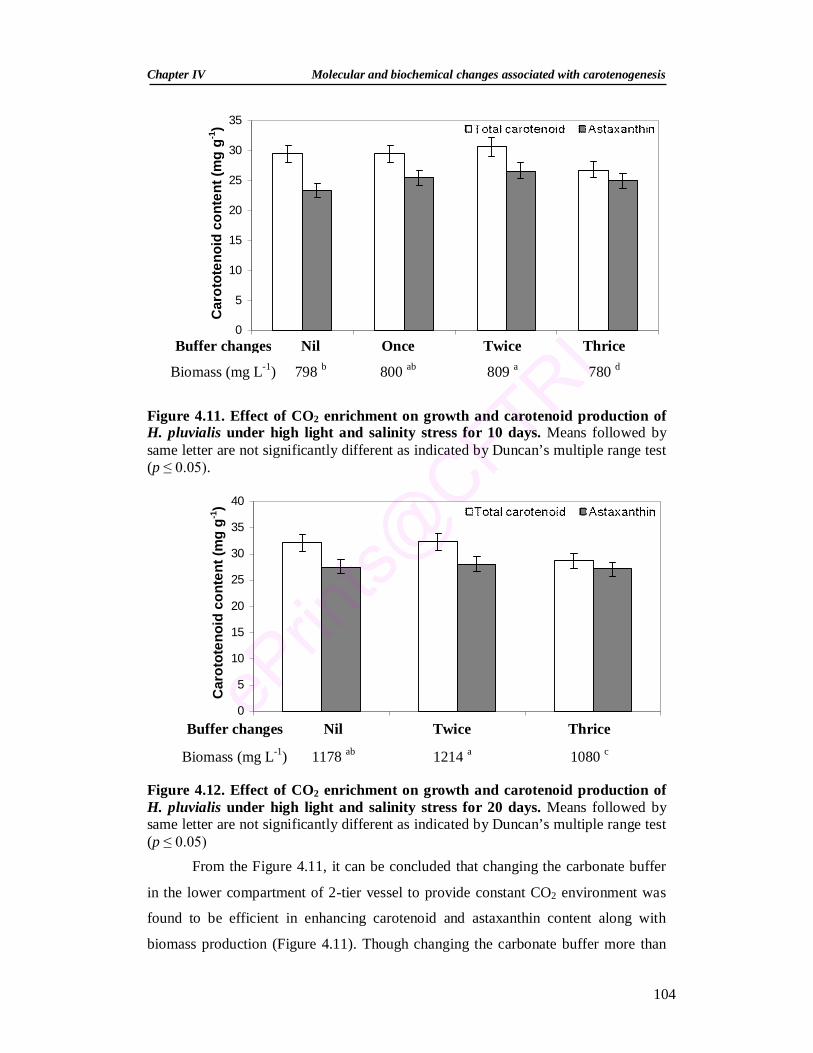
Chapter IV Molecular and biochemical changes associated with carotenogenesis
104
Figure 4.11. Effect of CO2 enrichment on growth and carotenoid production of H. pluvialis under high light and salinity stress for 10 days. Means followed by same letter are not significantly different as indicated by Duncan’s multiple range test (p ≤ 0.05).
Figure 4.12. Effect of CO2 enrichment on growth and carotenoid production of H. pluvialis under high light and salinity stress for 20 days. Means followed by same letter are not significantly different as indicated by Duncan’s multiple range test (p ≤ 0.05)
From the Figure 4.11, it can be concluded that changing the carbonate buffer
in the lower compartment of 2-tier vessel to provide constant CO2 environment was
found to be efficient in enhancing carotenoid and astaxanthin content along with
biomass production (Figure 4.11). Though changing the carbonate buffer more than
Buffer changes Nil Once Twice Thrice
Biomass (mg L-1) 798 b 800 ab 809 a 780 d
Buffer changes Nil Twice Thrice
Biomass (mg L-1) 1178 ab 1214 a 1080 c
0
5
10
15
20
25
30
35
40
1 2 3
Car
otot
enoi
d co
nten
t (m
g g-1
)
0
5
10
15
20
25
30
35
1 2 3 4
Car
otot
enoi
d co
nten
t (m
g g-1
)
Chapter IV Molecular and biochemical changes associated with carotenogenesis
105
twice affected biomass, carotenoid and astaxanthin production (Figure 4.11). Similar
trend was observed when H. pluvialis cultures were exposed to stress conditions for
20 days (Figure 4.12).
4.3.2.6. Influence of salicylic acid (ScA) and methyl jasmonate (MJ) on
antioxidant systems of H. pluvialis
4.3.2.6.1. Effect of ScA and MJ on the growth and encystment
To study the influence of ScA and MJ on H. pluvialis, cultures were exposed to
different concentrations (10-500 µM) of ScA and MJ incubated in either low (30
µmol m-2 s-1) or high (60 µmol m-2 s-1) light intensities for 8 days. At the time of ScA
and MJ addition, number of cells in the culture was 32.5 104 cells per ml and among
them 1.0 104 cells per ml were cysts.
ScA treatment increased the biomass in concentration dependent manner (up
to 100 µM) irrespective of the light condition used (Table 4.8). ScA at 500 µM
concentration reduced the biomass under low light and resulted in bleaching of cells
under high light. Similar trend was observed for cell count (Table 4.8). Lowest
concentration of MJ (10 µM) produced comparatively high DW both under low and
high light conditions (Table 4.8). However, the biomass decreased with increased MJ
concentration and reached below that of the control at 500 µM concentration. Similar
trend was observed for cell number also and 100 µM of MJ produced maximum
number of cells under high light conditions. Growth inhibition by high concentration
of MJ is not pronounced like ScA. Both ScA and MJ, increased the % of cyst cells
formed under low light, whereas under high light, they reversed the effect of high
light stress by decreasing the % of cyst cells formed.
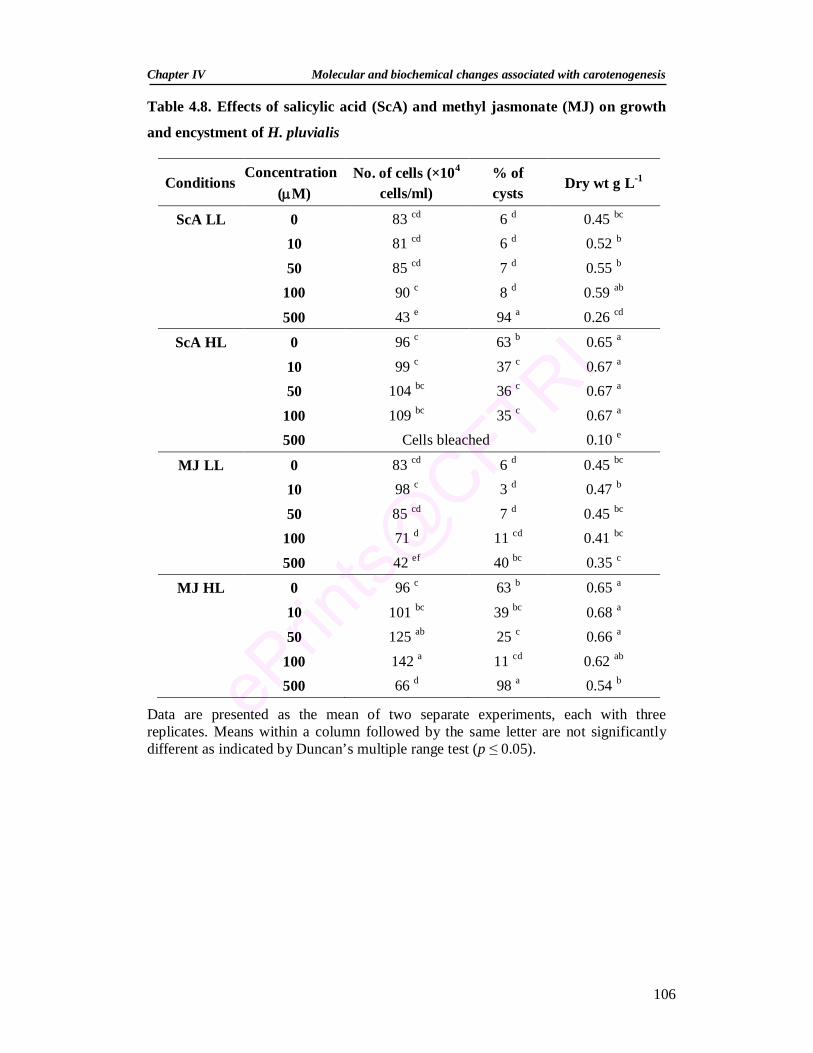
Chapter IV Molecular and biochemical changes associated with carotenogenesis
106
Table 4.8. Effects of salicylic acid (ScA) and methyl jasmonate (MJ) on growth
and encystment of H. pluvialis
Data are presented as the mean of two separate experiments, each with three replicates. Means within a column followed by the same letter are not significantly different as indicated by Duncan’s multiple range test (p ≤ 0.05).
Conditions Concentration
(M) No. of cells (×104
cells/ml) % of cysts
Dry wt g L-1
ScA LL 0 83 cd 6 d 0.45 bc 10 81 cd 6 d 0.52 b
50 85 cd 7 d 0.55 b 100 90 c 8 d 0.59 ab
500 43 e 94 a 0.26 cd
ScA HL 0 96 c 63 b 0.65 a
10 99 c 37 c 0.67 a 50 104 bc 36 c 0.67 a
100 109 bc 35 c 0.67 a 500 Cells bleached 0.10 e
MJ LL 0 83 cd 6 d 0.45 bc 10 98 c 3 d 0.47 b
50 85 cd 7 d 0.45 bc 100 71 d 11 cd 0.41 bc
500 42 ef 40 bc 0.35 c
MJ HL 0 96 c 63 b 0.65 a
10 101 bc 39 bc 0.68 a 50 125 ab 25 c 0.66 a
100 142 a 11 cd 0.62 ab 500 66 d 98 a 0.54 b
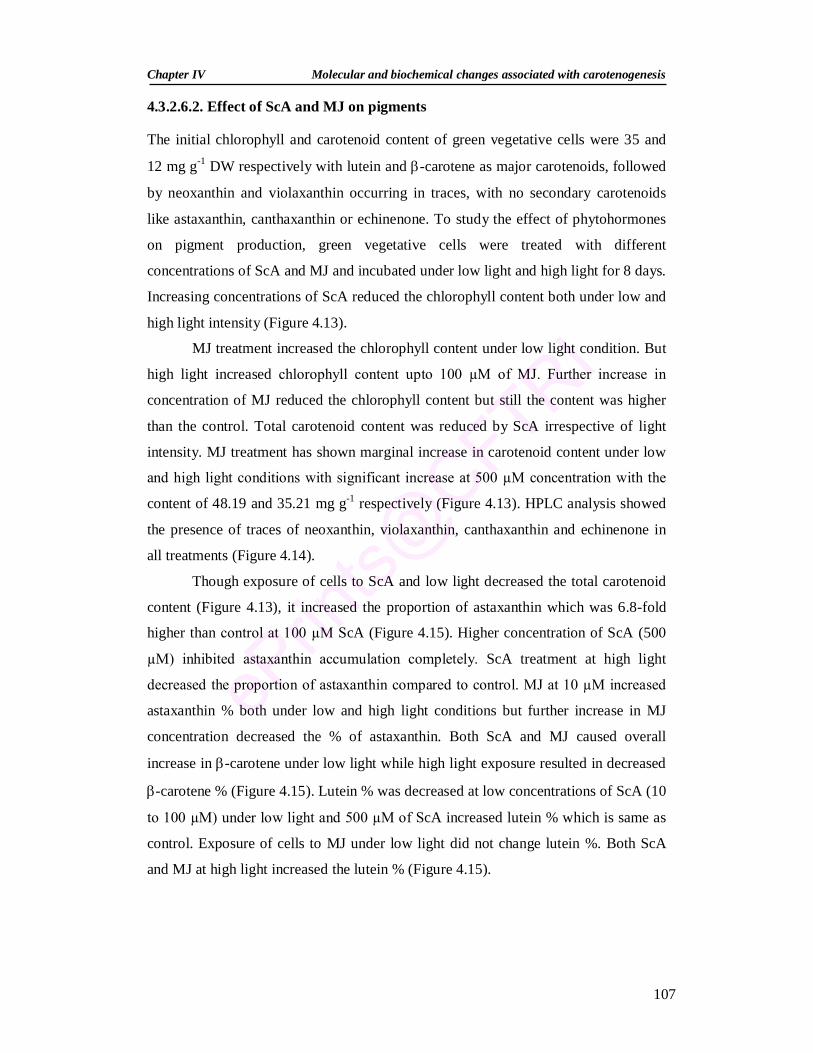
Chapter IV Molecular and biochemical changes associated with carotenogenesis
107
4.3.2.6.2. Effect of ScA and MJ on pigments
The initial chlorophyll and carotenoid content of green vegetative cells were 35 and
12 mg g-1 DW respectively with lutein and -carotene as major carotenoids, followed
by neoxanthin and violaxanthin occurring in traces, with no secondary carotenoids
like astaxanthin, canthaxanthin or echinenone. To study the effect of phytohormones
on pigment production, green vegetative cells were treated with different
concentrations of ScA and MJ and incubated under low light and high light for 8 days.
Increasing concentrations of ScA reduced the chlorophyll content both under low and
high light intensity (Figure 4.13).
MJ treatment increased the chlorophyll content under low light condition. But
high light increased chlorophyll content upto 100 µM of MJ. Further increase in
concentration of MJ reduced the chlorophyll content but still the content was higher
than the control. Total carotenoid content was reduced by ScA irrespective of light
intensity. MJ treatment has shown marginal increase in carotenoid content under low
and high light conditions with significant increase at 500 µM concentration with the
content of 48.19 and 35.21 mg g-1 respectively (Figure 4.13). HPLC analysis showed
the presence of traces of neoxanthin, violaxanthin, canthaxanthin and echinenone in
all treatments (Figure 4.14).
Though exposure of cells to ScA and low light decreased the total carotenoid
content (Figure 4.13), it increased the proportion of astaxanthin which was 6.8-fold
higher than control at 100 µM ScA (Figure 4.15). Higher concentration of ScA (500
µM) inhibited astaxanthin accumulation completely. ScA treatment at high light
decreased the proportion of astaxanthin compared to control. MJ at 10 µM increased
astaxanthin % both under low and high light conditions but further increase in MJ
concentration decreased the % of astaxanthin. Both ScA and MJ caused overall
increase in -carotene under low light while high light exposure resulted in decreased
-carotene % (Figure 4.15). Lutein % was decreased at low concentrations of ScA (10
to 100 µM) under low light and 500 µM of ScA increased lutein % which is same as
control. Exposure of cells to MJ under low light did not change lutein %. Both ScA
and MJ at high light increased the lutein % (Figure 4.15).
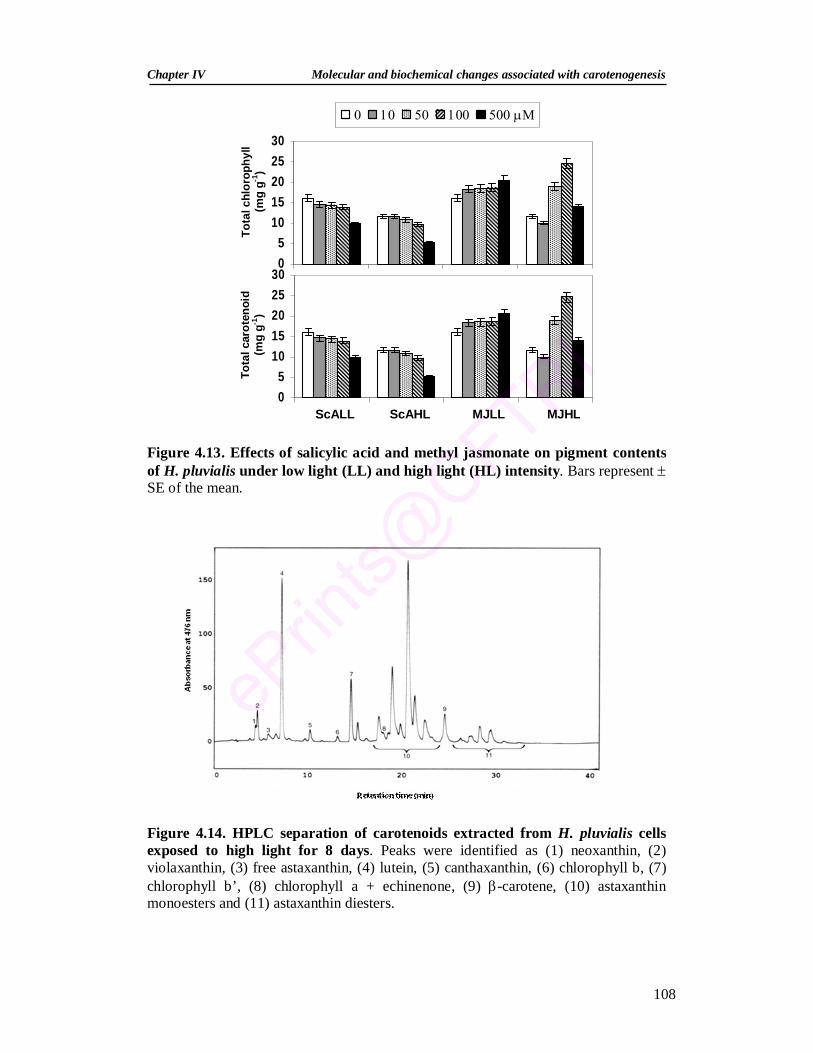
Chapter IV Molecular and biochemical changes associated with carotenogenesis
108
05
1015202530
05
1015202530
ScALL ScAHL MJLL MJHL
Tota
l car
oten
oid
(mg
g-1)
Tota
l chl
orop
hyll
(mg
g-1)
Figure 4.13. Effects of salicylic acid and methyl jasmonate on pigment contents of H. pluvialis under low light (LL) and high light (HL) intensity. Bars represent SE of the mean. Figure 4.14. HPLC separation of carotenoids extracted from H. pluvialis cells exposed to high light for 8 days. Peaks were identified as (1) neoxanthin, (2) violaxanthin, (3) free astaxanthin, (4) lutein, (5) canthaxanthin, (6) chlorophyll b, (7) chlorophyll b’, (8) chlorophyll a + echinenone, (9) -carotene, (10) astaxanthin monoesters and (11) astaxanthin diesters.
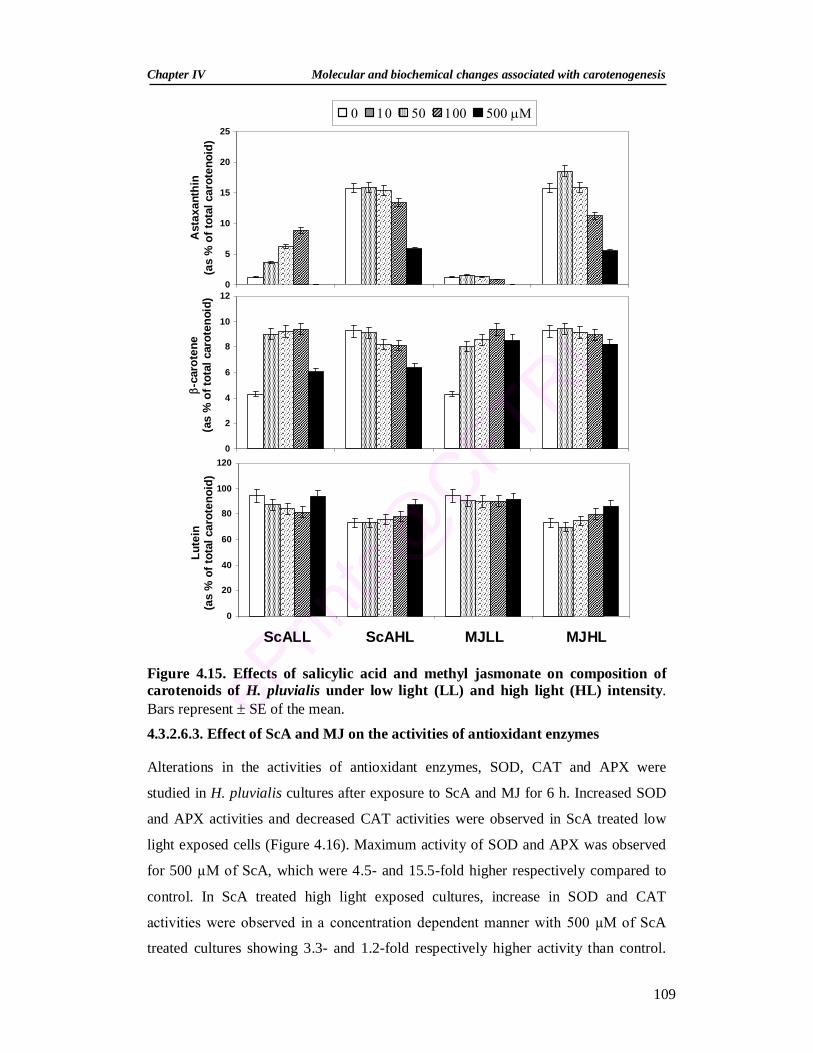
Chapter IV Molecular and biochemical changes associated with carotenogenesis
109
0
20
40
60
80
100
1200
2
4
6
8
10
120
5
10
15
20
25
Lute
in
(as
% o
f tot
al c
arot
enoi
d)
-ca
rote
ne
(as
% o
f tot
al c
arot
enoi
d)
Ast
axan
thin
(a
s %
of t
otal
car
oten
oid)
ScALL ScAHL MJLL MJHL
Figure 4.15. Effects of salicylic acid and methyl jasmonate on composition of carotenoids of H. pluvialis under low light (LL) and high light (HL) intensity. Bars represent SE of the mean.
4.3.2.6.3. Effect of ScA and MJ on the activities of antioxidant enzymes
Alterations in the activities of antioxidant enzymes, SOD, CAT and APX were
studied in H. pluvialis cultures after exposure to ScA and MJ for 6 h. Increased SOD
and APX activities and decreased CAT activities were observed in ScA treated low
light exposed cells (Figure 4.16). Maximum activity of SOD and APX was observed
for 500 µM of ScA, which were 4.5- and 15.5-fold higher respectively compared to
control. In ScA treated high light exposed cultures, increase in SOD and CAT
activities were observed in a concentration dependent manner with 500 µM of ScA
treated cultures showing 3.3- and 1.2-fold respectively higher activity than control.
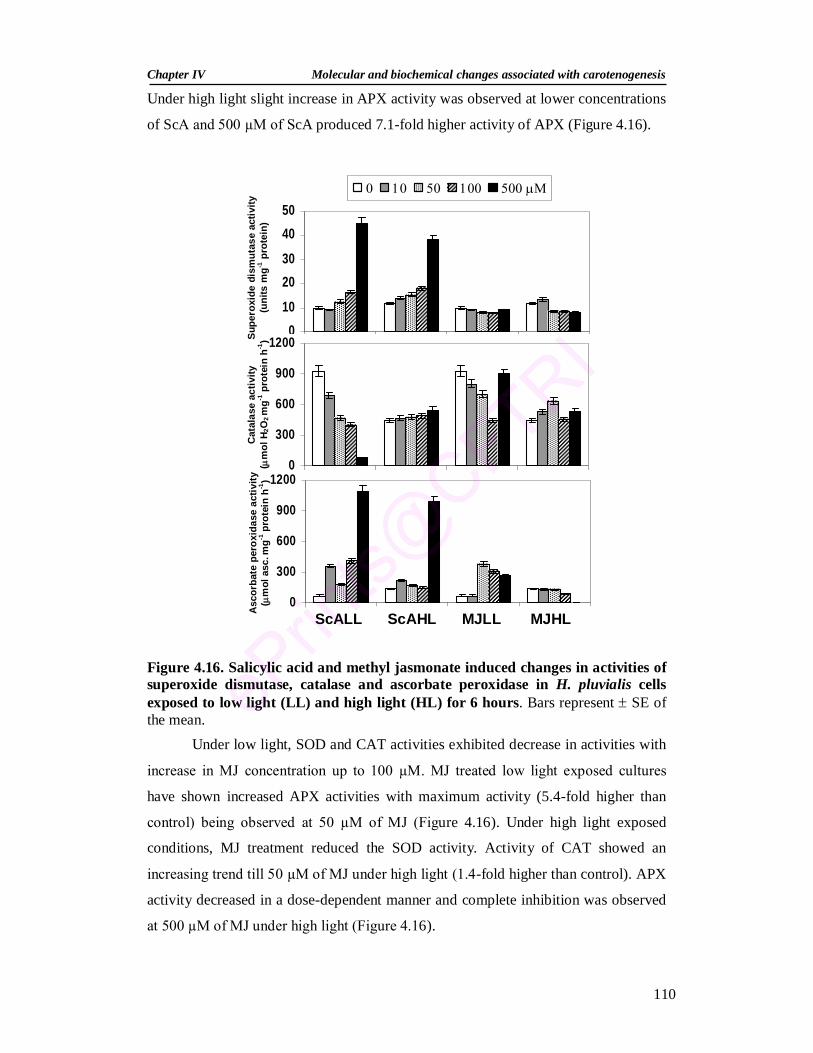
Chapter IV Molecular and biochemical changes associated with carotenogenesis
110
010
2030
4050
0
300
600
900
1200
0
300
600
900
1200
ScALL ScAHL MJLL MJHL Asc
orba
te p
erox
idas
e ac
tivity
(
mol
asc
. mg-1
pro
tein
h-1
) C
atal
ase
activ
ity
(m
ol H
2O2 m
g-1 p
rote
in h
-1) Su
pero
xide
dis
mut
ase
activ
ity
(uni
ts m
g-1 p
rote
in)
Under high light slight increase in APX activity was observed at lower concentrations
of ScA and 500 µM of ScA produced 7.1-fold higher activity of APX (Figure 4.16).
Figure 4.16. Salicylic acid and methyl jasmonate induced changes in activities of superoxide dismutase, catalase and ascorbate peroxidase in H. pluvialis cells exposed to low light (LL) and high light (HL) for 6 hours. Bars represent SE of the mean.
Under low light, SOD and CAT activities exhibited decrease in activities with
increase in MJ concentration up to 100 µM. MJ treated low light exposed cultures
have shown increased APX activities with maximum activity (5.4-fold higher than
control) being observed at 50 µM of MJ (Figure 4.16). Under high light exposed
conditions, MJ treatment reduced the SOD activity. Activity of CAT showed an
increasing trend till 50 µM of MJ under high light (1.4-fold higher than control). APX
activity decreased in a dose-dependent manner and complete inhibition was observed
at 500 µM of MJ under high light (Figure 4.16).
Chapter IV Molecular and biochemical changes associated with carotenogenesis
111
4.4. Discussion
4.4.1. Differential display of light regulated transcripts in H. pluvialis
DD technique has been used to identify genes differentially expressed upon HL
exposure of H. pluvialis cells. Knowledge of the functions of such genes will lead to
better understanding of molecular mechanisms of astaxanthin biosynthesis and photo-
protection. In the present study we have used DD technique since it can identify
weakly expressed transcripts. Unlike earlier studies in H. pluvialis, in this study high
light alone was used to identify differentially expressed genes to exclude the effects of
other stress conditions.
Of the 109 differentially expressed transcripts obtained using 35 primer
combinations, false positives were removed after re-amplification. About 34 clones
have been sequenced and analysed in silico. Among the differentially expressed
transcripts, three were having homology for photosynthesis and carotenoid synthesis
related proteins. The clone H97.1 is having homology for D1 reaction center protein
of photosystem II. Clone H97.1 is the first isolated H. pluvialis transcript that had
homology to psab gene coding members of photosystem II reaction center protein D1.
The decreased expression of this clone under high light stress (Table 4.4) is similar to
the results obtained from other green algae and higher plants (Alfonso et al. 2000) and
correlated with reduction in the amount of D1 protein of photosystem II during initial
stages of exposure of H. pluvialis cells to stress (Wang et al. 2003b). Later reduction
in D1 protein level was prevented by deposition of astaxanthin thus enabling the cell
to maintain PS I function and structural integrity (Wang et al. 2003b). Expression
analysis of H97.1 by RNA dot blot and northern blot analysis on RNA samples from
green vegetative cells and high light stressed cells exhibited down regulation of H97.1
under high light stress, suggested reliability of DD RT-PCR for mRNA expression
data. The reduction in expression of H97.1 transcript under various stress conditions
(Figure 4.3) is correlated well with the reduction in photosynthetic pigments,
chlorophyll, β-carotene and lutein (Table 4.3). Two clones, H34.1 and H53.1 down
regulated by high light stress (Table 4.4) showed no significant homology when
analyased by BLASTX but were found similarity with 5’UTR of H. pluvialis -
carotene oxygenase (crt01) (synonym: -carotene ketolase) when analysed by
BLASTN. Further analysis of H53.1 by RT-PCR showed that reduced expression of
Chapter IV Molecular and biochemical changes associated with carotenogenesis
112
this high light regulated transcript could be recovered and up-regulated when cells
were exposed to HL/ND/SA (Figure 3.3). Though there are reports of up-regulation of
-carotene oxygenase under stress (Sun et al. 1998; Grünewald et al. 2000;
Steinbrenner and Linden 2003), multiple forms of this gene with each responding
differently to different stress conditions is reported (Huang et al. 2006a). Differential
expression of this clone (Figure 4.3) is correlated well with the production of
astaxanthin under stress condition (Table 4.3). The result from the present study
suggested that cultural parameters and stress factors could be manipulated to achieve
maximum astaxanthin production.
Five differentially expressed clones were identified to be involved in
metabolism. Among them, three clones such as H97.2, H4.1 and H69.2 were down
regulated while clones H69.1 and H7.1 having similarity to cinnamoyl-CoA reductase
and EPSP synthase were up-regulated under high light stress (Table 4.4). EPSP
synthase catalyses the sixth step of the shikimate pathway that is responsible for
synthesizing aromatic compounds (Julio et al. 2006). The clone H69.2 was having
similarity to ferrochelatase. Ferrochelatase catalyses crucial branch point of the
tetrapyrrole synthesis pathway, insertion of Fe2+ into the tetrapyrrole ring of
protoporphyrin IX to generate protohaem (Miyamoto et al. 1994). The phytochrome
chromophore phytochrobilin is synthesized from haem (Gray 2003). Both H69.1 and
H7.1 showed enhanced expression under all stress conditions studied (Figure 4.3).
Transcripts which are having homology to transport proteins identified from
the present study were ribose ABC transport ATP-binding protein and transport
transmembrane protein (Table 4.4). And both were up-regulated under HL stress
(Table 4.4). Further analysis showed clone H13.2 was further up-regulated by
additional stresses (Figure 4.3). In E. coli ribose ABC transport ATP-binding protein
is involved in transporting D-ribose sugar, so that D-ribose can be used as a sole
carbon source (Oh et al. 1999). In H. pluvialis, carotenoids are produced through
methylerythritol phosphate (MEP) pathway where IPP, precursor for carotenoids is
produced from pentose sugars (Lichtenthaler 1999; Hagen and Grünewald 2000).
Moreover in dark grown Chlorella zofingiensis cells, various sugars have reported to
be differentially regulating the transcription of the carotenoid biosynthetic genes.
Glucose and mannose, which supported the best growth and astaxanthin production of
the algal cells, also resulted in the highest transcript levels of all the genes (Sun et al.
Chapter IV Molecular and biochemical changes associated with carotenogenesis
113
2008). The gene β-carotene oxygenase have been found to be transiently up-regulated
upon glucose treatment (Huang et al. 2006b) and the transcription of β-carotene
oxygenase and β-carotene hydroxylase are differently regulated by the metabolism of
glucose, through which the biosynthesis of astaxanthin is regulated (Li et al. 2008a).
Clone H9.1, having similarity for defense signaling molecule, LysR family
transcriptional regulator (LTTR), was down regulated under high light stress in H.
pluvialis. The LysR family is composed of more than 50 similar-sized, autoregulatory
transcriptional regulators (LTTRs) and are present in diverse bacterial genera, archaea
and algal chloroplasts (Schell 1993). In response to different coinducers, LTTRs
activate divergent transcription of linked target genes or unlinked regulons encoding
extremely diverse functions. They activate the transcription of operons and regulons
involved in extremely diverse cellular functions including nitrogen fixation, oxidative
stress response and bacterial virulence (Schell 1993). Most LTTRs, while activating
expression of target genes, repress their own expression, frequently by the use of
divergent promoters (Zaim and Kierzek 2003).
Two clones – H8.1 and H31.1 were identified to be involved in genetic
information processing and were up-regulated under high light stress (Table 4.4). The
clone H8.1 is coding for recombination activating protein 1 and clone H31.1 is coding
for reverse transcriptase. Transcripts of H8.1 were up-regulated by different stress
conditions (Figure 4.3). The high light induced clone H80.1 is having similarity for
nucleotide binding site (NBS)-leucine rich repeat (LRR) resistance protein. The NBS-
LRR gene family accounts for the largest number of known disease resistance genes,
and is one of the largest gene families in plant genomes (Ameline-Torregrosa et al.
2008). Two clones H55.1 and H107.1 were having similarity for peptidyl-tRNA
hydrolase 1 and lipoprotein respectively and were up-regulated under high light stress.
In lipoprotein, the lipids or their derivatives may be covalently or non-covalently
bound to the proteins. Many enzymes, transporters, structural proteins, antigens,
adhesins and toxins are lipoproteins. Examples include the high density and low
density lipoproteins which enable fats to be carried in the blood stream, the
transmembrane proteins of the mitochondria and the chloroplast, and bacterial
lipoproteins (Garrett and Grisham 1995). Seventeen clones were having homology to
unknown and hypothetical proteins. There were two clones which had no significant
homology in the database (Table 4.5). It is possible that these cDNAs may encode
potentially novel proteins or belong to 5’ or 3’ specific ends of some known genes.
Chapter IV Molecular and biochemical changes associated with carotenogenesis
114
This analysis indicated that response to high light stress is a complex process,
involving differential expression of functionally different groups of genes. A partial
characterization of light regulated transcripts of H. pluvialis can be helpful for better
understanding of regulation of carotenogenesis. Identification of these stress-regulated
transcripts is an initial step towards cloning and characterization of full-length cDNAs
and promoter regions. Such studies should identify common and/or unique regulatory
elements and, thus, provide insight into the mechanism of a gene’s individual
expression, as well as its potential role in stress response. This information will in turn
help us to understand better signaling and interactions between the major stress-
response pathways.
4.4.2. Biochemical changes associated with carotenogenesis in H. pluvialis
The increased LCY activity under stress condition (Table 4.6) is similar to the
observation of Usha (2000). It suggested increased precursor requirement for
increased production of astaxanthin under stress condition. The observation of
increased BKT activity in lipid fraction compared to chloroplast fraction is in line
with the observation of Grünewald et al. (2001), confirming that BKT enzyme is more
active in lipid vesicles compared to chloroplast.
Analysis of carotenoids of chloroplast and lipid fractions (Figures 4.4 and 4.5)
revealed the presence of β-carotene in lipid globules. This substantiates the hypothesis
that β-carotene might be exported from chloroplast to lipid globules (Grünewald and
Hagen 2001) where it may be converted into canthaxanthin, echinenone and
astaxanthin. Studies on composition of total astaxanthin revealed that proportion of
free astaxanthin is decreased as stress progressed. This suggested that immediately
after synthesis free astaxanthin is converted into mono- and diesters.
Increased antioxidant enzyme activities observed under ND condition (Figures
4.8 and 4.9) suggested that nutrient deficiency imposes an additional stress on the
organism, so that more antioxidant enzymes along with astaxanthin are produced to
protect the organism. Similar to the present study increased SOD activity was
observed during Cu induced oxidative stress in Chlorella vulgaris (Mallick 2004).
4.4.3. CO2 enrichment
In the present study it was observed that CO2 enrichment with or without salinity
stress enhanced carotenoid and astaxanthin production. Similar to this, enhanced
Chapter IV Molecular and biochemical changes associated with carotenogenesis
115
growth and carotenoid contents in H. pluvialis, Chlorella vulgaris and Scenedesmus
obliquus wer observed under CO2 supplemented condition (Usha et al. 2001). The
increase in astaxanthin content by CO2 enrichment (Figure 4.10) may be due to
increased C/N ratio as suggested by Kakizono et al. (1992). The reduction in biomass
and astaxanthin content by more times of buffer change may be induced by the toxic
effect of more amount of CO2 generated on biomass and astaxanthin content. Reduced
biomass in NaCl added cultures showed the increased susceptibility of H. pluvialis
cells to salinity under ND conditions.
4.4.4. Influence of salicylic acid and methyl jasmonate on antioxidant
systems of H. pluvialis
ScA and MJ are naturally occurring signal molecules, and are involved in plant
response to several environmental stress factors and reported to affect growth and
development of plants. Similar to the present study Fung (2005) reported decreased
biomass in Chlorella zofingiensis, when heterotrophically dark grown cells were
exposed to 10-3 M of ScA, and further increase in ScA concentration resulted in
bleaching of cells and cell death. ABA is reported to have morphogenetic effect on
the cells of H. pluvialis, stimulating their transition to cyst formation (Kobayashi et al.
1997c). The decrease in cell number was also observed in C. vulgaris with JA
treatment (Czerpak et al. 2006).
On contrary to the observation of the present study, ScA at 10-4 M had
stimulating effect on chlorophylls and carotenoids in Chlorella vulgaris and at 10-6 M
it showed slight decrease in carotenoid content (Czerpak et al. 2002). In Arabidopsis
thaliana leaves, 1 mM ScA increased violaxanthin, neoxanthin, antheraxanthin,
zeaxanthin and -carotene, and further increase in ScA concentration to 5 mM,
decreased the levels of these pigments (Rao et al. 1997). But in the present study,
increased levels of astaxanthin and -carotene was observed in low light ScA treated
cells and decreased levels of these pigments were observed under high light (Figure
4.15). Jasmonic acid over the concentration range of 10-5 to 10-4 M inhibited
chlorophylls and carotenoids in Chlorella vulgaris (Czerpak et al. 2006). Decreased
chlorophyll, carotenoid, neoxanthin, violaxanthin, lutein and -carotene were
observed in MJ treated Arabidopsis thaliana (Jung 2004). But the present study
showed an increase in chlorophyll, carotenoid and -carotene in MJ treated low light
exposed H. pluvialis cells (Figures 4.13 and 4.14). It is evident from the results that
Chapter IV Molecular and biochemical changes associated with carotenogenesis
116
response to ScA and MJ varies with organisms, concentration of phytohormones and
light intensity.
The higher concentration of ScA caused a permanent change at the level of
membrane organization of the cells that proved injurious for plant metabolism and
growth (Uzunova and Popova 2000). This may be the possible reason for reduced
growth and bleaching of cells at higher concentrations of ScA observed in the present
study.
Treatment with signaling molecules may induce H2O2 production, which in
turn may induce the synthesis or activate various transcription factors, which are
associated with the induction of different antioxidant enzymes (Agarwal et al. 2005).
Photooxidative stress also triggers other components of the dissipative process,
enzymatic antioxidants. Various antioxidant enzymes appear to play an essential part
of defense mechanisms against MJ and ScA induced oxidative stress. MJ treated
cultures were having more carotenoid and chlorophyll while ScA treated cultures
were having more antioxidant enzyme activities. The increase in ScA and MJ
concentration may induce oxidative stress, which in turn may develop different
defense mechanisms in the organism. The response to ScA and MJ may vary with
organisms, concentration of phytohormones and light intensity. In addition, ScA and
MJ may be acting as a stress modulator by changing the stress response of H. pluvialis
to high light stress.
Both phytohormones, ScA and MJ at higher concentrations affected the
production of secondary carotenoids but each with different mechanism of inhibition.
ScA affected the secondary carotenogenesis mainly by scavenging the free radicals
necessary for secondary carotenoid induction. While MJ increased the production of
primary carotenoids especially -carotene and lutein, thereby secondary carotenoid
production is affected. At low concentrations these phytohormones could be used as
elicitors for secondary carotenoid production.
Chapter V
Expression of carotenogenic genes and associated changes in pigment profile during
regeneration of Haematococcus pluvialis cysts
Chapter V Carotenogenesis during regeneration of Haematococcus pluvialis cysts
117
Summary Haematococcus pluvialis is a green alga known to accumulate astaxanthin in cyst cells under stress conditions which have the ability to regenerate under favorable conditions. The present study revealed the influence of few cultural parameters and temperature treatments on regeneration efficiency of red cysts along with changes in pigment profile and expression of carotenogenic genes during regeneration. Regeneration efficiency has been improved by incubating less aged cyst cells in medium containing ammonium carbonate, 16:8 light dark cycle with light intensity of 30 µmol m-2 s-1. During regeneration there was decrease in total astaxanthin, total carotenoids and carotenoid to chlorophyll ratio, and increase in -carotene, lutein, total chlorophyll and chlorophyll a to b ratio. Expression analysis revealed the presence of transcripts of carotenogenic genes, PSY, PDS, LCY, BKT and CHY in cyst cells and these transcripts were up-regulated transiently upon transfer to favorable conditions. As the culture growth progressed, carotenogenic genes expression were decreased and reached basal expression levels of green motile vegetative cells. In addition, this is the first report of detection of carotenogenic gene transcripts in red cysts and their differential expression during regeneration. The present study suggests the use of red cysts as an alternate inoculum for mass cultivation to combat protozoan predation.
Chapter V Carotenogenesis during regeneration of Haematococcus pluvialis cysts
118
5.1. Introduction
Green motile cells of H. pluvialis dominate under optimal growth conditions
and their growth and multiplication are limited to few divisions followed by formation
of non-motile vegetative cells (palmella). Under stress conditions, such as nutrient
deprivation, high light intensity, salinity and acetate addition, both motile and non-
motile vegetative cells transform into cysts (Margalith 1999; Jin et al. 2006). During
the transformation, a trilaminar sheath and acetolysis resistant material is formed and
thickened, coinciding with massive accumulation of astaxanthin in extra-plastidic
lipid vesicles and expansion of cell volume (Montsant et al. 2001). The cyst wall is
composed of an outer primary wall, a trilaminar sheath, secondary wall and a tertiary
wall. After maturation, transfer of cysts to non-stressed conditions, released many
flagellated cells by germination (Triki et al. 1997; Hagen et al. 2001) and astaxanthin
in these cells are degraded slowly (Fabregas et al. 2001). The major problem in
outdoor cultivation is susceptibility of vegetative cells to protozoan predation while
cyst cells are resistant to predation. Therefore regeneration of cyst cells to large
number of flagellated cells has been explored in the present study under different
conditions. Possibility of using germinated flagellated cells as starting material for
cultivation scheme has been suggested by Hagen et al. (2001).
For better understanding of astaxanthin biosynthesis, knowledge on
accumulation and degradation of carotenoids and their relation with expression of
carotenogenic genes are necessary. Information on carotenogenesis during stress
induced accumulation of astaxanthin is well documented (Sun et al. 1998; Grunewald
et al. 2000; Steinbrenner and Linden 2001; Steinbrenner and Linden 2003) whereas
information on changes during cyst germination is limited to astaxanthin, chlorophyll
and protein contents (Kobayashi et al. 1997a; Fabregas et al. 2003). Information
regarding transcriptional changes is completely lacking. So the present study has been
taken up to understand the changes occurring at pigment level and expression of
carotenoid genes during germination of cysts along with influence of cultural
parameters and temperature treatments on regeneration of cyst cells.
Chapter V Carotenogenesis during regeneration of Haematococcus pluvialis cysts
119
5.2. Materials and methods
5.2.1. Algal culture conditions
The green motile H. pluvialis cells were grown in modified BBM medium as
described in section 2.2.3 and were incubated at 60 µmol m-2 s-1 with addition of 0.2%
NaCl and 4.4 mM sodium acetate for 3, 5 and 7 months to induce secondary
carotenoids. Encysted red cyst cells were harvested by centrifugation and these cells
were taken for regeneration studies.
5.2.2. Effect of N source, light cycle, age of cyst cells, and temperature
treatment on regeneration
The effect of culture parameters on regeneration was tested. For regeneration, freshly
harvested red cysts were inoculated into autotrophic media to a cell density of 15 ×
104 cells ml-1 and exposed to the light intensity of 30 µmol m-2 s-1 at 251C, and
observed for their regeneration efficiency under the influence of N source (sodium
nitrate - 0.24 g l-1, ammonium carbonate - 0.16 g l-1 and potassium nitrate - 0.41 g l-1
in autotrophic bold basal medium), light cycle (alternate light and dark for 18:6 h or
continuous light), age of cyst cells (3, 5 and 7 months old), and temperature treatment
of cyst cells (0C and 4C for varying periods of time). Initial cyst cell count and
number of cyst cells after 3 days of incubation were counted using haemacytometer to
calculate regeneration efficiency. Regeneration efficiency was calculated using the
formula: (Initial cell count - Final cell count)/Initial cell count 100.
5.2.3. Growth and pigment changes during regeneration
A time course study on changes in growth and pigment profile was carried out. Three
months old cyst cells were exposed to favorable conditions. Aliquots of culture were
harvested at different intervals, lyophilized and weight was estimated gravimetrically.
Lyophilized cells were extracted with 90% acetone repeatedly until the pellet
becomes colorless and pigment contents were estimated as described in 2.2.6.
5.2.4. Extractability of carotenoids
Extractability of carotenoids from regenerating cells under favourable conditions at
different intervals was studied to evaluate the fragility of cell wall. Extractable
carotenoid content was estimated by treating the lyophilized cells with 90% acetone
Chapter V Carotenogenesis during regeneration of Haematococcus pluvialis cysts
120
for 1 h without any homogenization. For each sample, extraction with 90% acetone
by homogenization was served as total carotenoid and carotenoid content was
calculated as per Lichtenthaler (1987). Extractability was calculated by using the
formula modified from Kobayashi et al. (1997a): Extractability % = extractable
carotenoids % (w/w)/ total carotenoids % (w/w) 100.
5.2.5. RNA isolation and Reverse Transcription-Polymerase Chain Reaction
(RT-PCR)
Cyst cells were exposed to favorable conditions for regeneration. At different
intervals, 1 108 cells were harvested, frozen under liquid nitrogen and subsequently
powdered using a mortar and pestle. RNA extraction, reverse transcription, and PCR
were carried out as described in section 2.2.7. Transcript levels of each gene in green
motile cells were taken for comparison in calculating the transcript abundance of
respective genes during regeneration.
5.2.6. Experimental design and data analysis
Each experiment was repeated twice with three replications. The data were analyzed
by one way analysis of variance and post-hoc mean separations were performed by
Duncan’s multiple range test at p ≤ 0.05 (Duncan 1955).
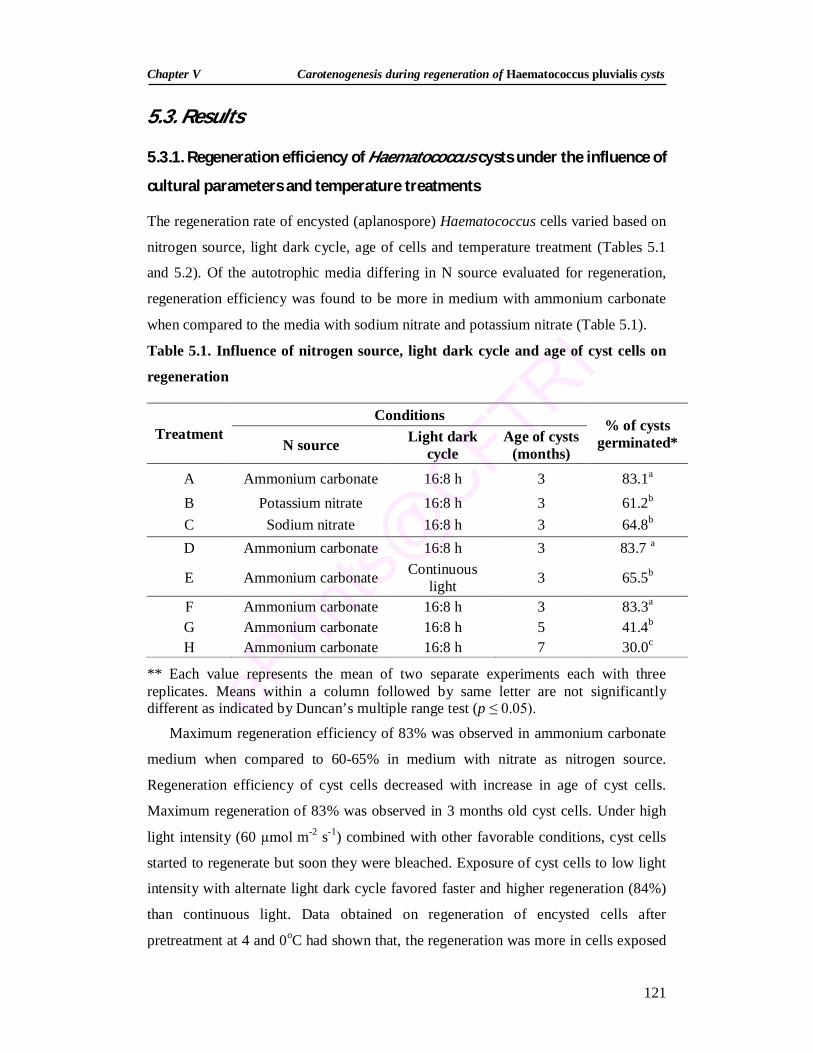
Chapter V Carotenogenesis during regeneration of Haematococcus pluvialis cysts
121
5.3. Results
5.3.1. Regeneration efficiency of Haematococcus cysts under the influence of
cultural parameters and temperature treatments
The regeneration rate of encysted (aplanospore) Haematococcus cells varied based on
nitrogen source, light dark cycle, age of cells and temperature treatment (Tables 5.1
and 5.2). Of the autotrophic media differing in N source evaluated for regeneration,
regeneration efficiency was found to be more in medium with ammonium carbonate
when compared to the media with sodium nitrate and potassium nitrate (Table 5.1).
Table 5.1. Influence of nitrogen source, light dark cycle and age of cyst cells on
regeneration
** Each value represents the mean of two separate experiments each with three replicates. Means within a column followed by same letter are not significantly different as indicated by Duncan’s multiple range test (p ≤ 0.05).
Maximum regeneration efficiency of 83% was observed in ammonium carbonate
medium when compared to 60-65% in medium with nitrate as nitrogen source.
Regeneration efficiency of cyst cells decreased with increase in age of cyst cells.
Maximum regeneration of 83% was observed in 3 months old cyst cells. Under high
light intensity (60 µmol m-2 s-1) combined with other favorable conditions, cyst cells
started to regenerate but soon they were bleached. Exposure of cyst cells to low light
intensity with alternate light dark cycle favored faster and higher regeneration (84%)
than continuous light. Data obtained on regeneration of encysted cells after
pretreatment at 4 and 0oC had shown that, the regeneration was more in cells exposed
Treatment Conditions
% of cysts germinated* N source Light dark
cycle Age of cysts
(months) A Ammonium carbonate 16:8 h 3 83.1a B Potassium nitrate 16:8 h 3 61.2b C Sodium nitrate 16:8 h 3 64.8b D Ammonium carbonate 16:8 h 3 83.7 a
E Ammonium carbonate Continuous light 3 65.5b
F Ammonium carbonate 16:8 h 3 83.3a G Ammonium carbonate 16:8 h 5 41.4b H Ammonium carbonate 16:8 h 7 30.0c
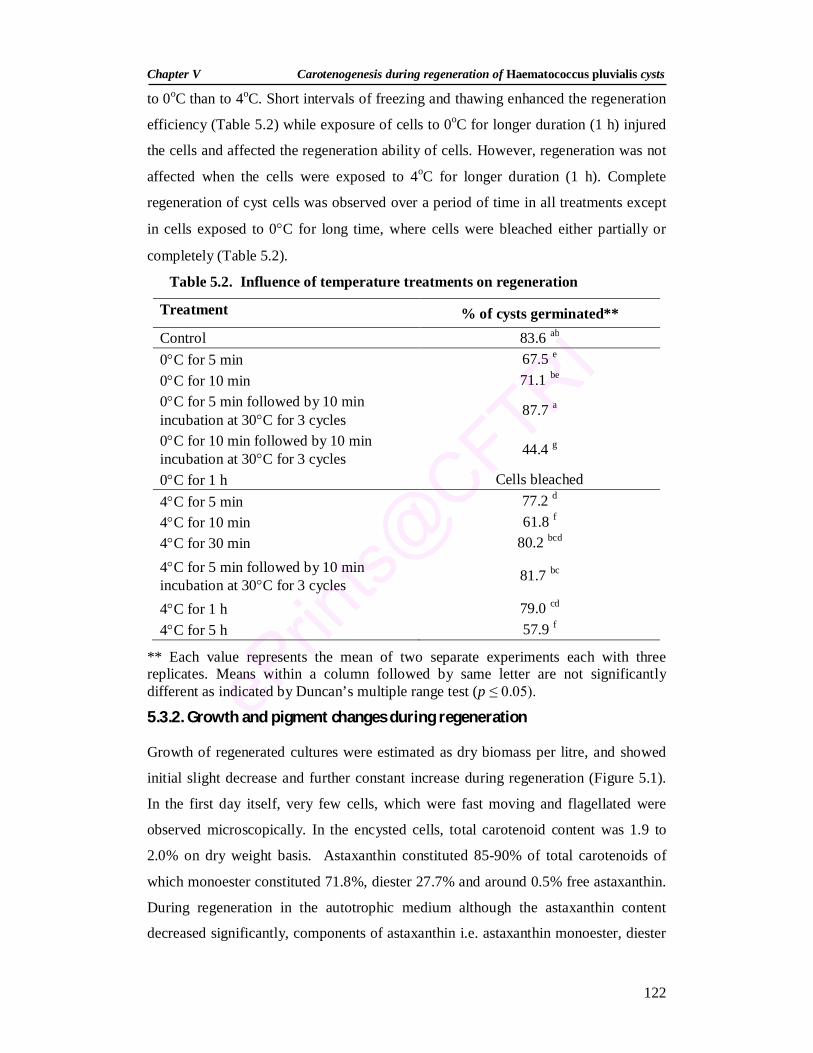
Chapter V Carotenogenesis during regeneration of Haematococcus pluvialis cysts
122
to 0oC than to 4oC. Short intervals of freezing and thawing enhanced the regeneration
efficiency (Table 5.2) while exposure of cells to 0oC for longer duration (1 h) injured
the cells and affected the regeneration ability of cells. However, regeneration was not
affected when the cells were exposed to 4oC for longer duration (1 h). Complete
regeneration of cyst cells was observed over a period of time in all treatments except
in cells exposed to 0C for long time, where cells were bleached either partially or
completely (Table 5.2).
Table 5.2. Influence of temperature treatments on regeneration
Treatment % of cysts germinated** Control 83.6 ab 0C for 5 min 67.5 e 0C for 10 min 71.1 be 0C for 5 min followed by 10 min incubation at 30C for 3 cycles
87.7 a
0C for 10 min followed by 10 min incubation at 30C for 3 cycles 44.4 g
0C for 1 h Cells bleached 4C for 5 min 77.2 d 4C for 10 min 61.8 f 4C for 30 min 80.2 bcd 4C for 5 min followed by 10 min incubation at 30C for 3 cycles
81.7 bc
4C for 1 h 79.0 cd 4C for 5 h 57.9 f
** Each value represents the mean of two separate experiments each with three replicates. Means within a column followed by same letter are not significantly different as indicated by Duncan’s multiple range test (p ≤ 0.05).
5.3.2. Growth and pigment changes during regeneration
Growth of regenerated cultures were estimated as dry biomass per litre, and showed
initial slight decrease and further constant increase during regeneration (Figure 5.1).
In the first day itself, very few cells, which were fast moving and flagellated were
observed microscopically. In the encysted cells, total carotenoid content was 1.9 to
2.0% on dry weight basis. Astaxanthin constituted 85-90% of total carotenoids of
which monoester constituted 71.8%, diester 27.7% and around 0.5% free astaxanthin.
During regeneration in the autotrophic medium although the astaxanthin content
decreased significantly, components of astaxanthin i.e. astaxanthin monoester, diester
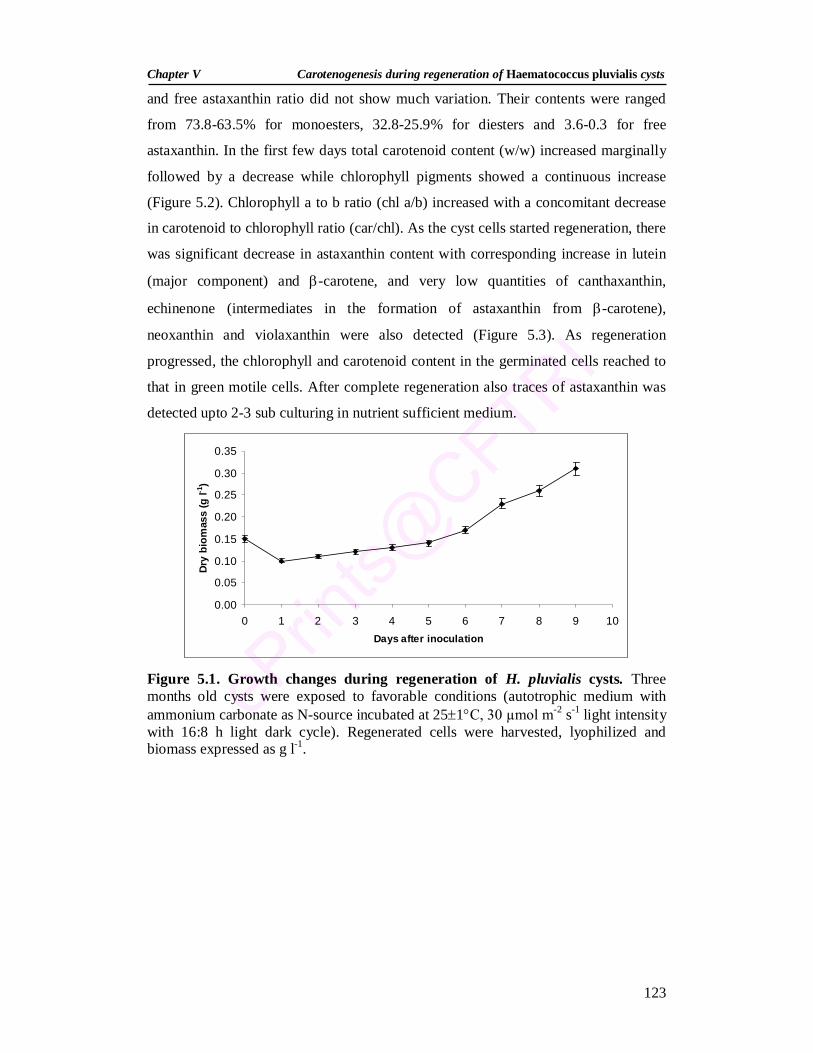
Chapter V Carotenogenesis during regeneration of Haematococcus pluvialis cysts
123
0.00
0.05
0.10
0.15
0.20
0.25
0.30
0.35
0 1 2 3 4 5 6 7 8 9 10Days after inoculation
Dry
biom
ass
(g l-1
)
and free astaxanthin ratio did not show much variation. Their contents were ranged
from 73.8-63.5% for monoesters, 32.8-25.9% for diesters and 3.6-0.3 for free
astaxanthin. In the first few days total carotenoid content (w/w) increased marginally
followed by a decrease while chlorophyll pigments showed a continuous increase
(Figure 5.2). Chlorophyll a to b ratio (chl a/b) increased with a concomitant decrease
in carotenoid to chlorophyll ratio (car/chl). As the cyst cells started regeneration, there
was significant decrease in astaxanthin content with corresponding increase in lutein
(major component) and -carotene, and very low quantities of canthaxanthin,
echinenone (intermediates in the formation of astaxanthin from -carotene),
neoxanthin and violaxanthin were also detected (Figure 5.3). As regeneration
progressed, the chlorophyll and carotenoid content in the germinated cells reached to
that in green motile cells. After complete regeneration also traces of astaxanthin was
detected upto 2-3 sub culturing in nutrient sufficient medium.
Figure 5.1. Growth changes during regeneration of H. pluvialis cysts. Three months old cysts were exposed to favorable conditions (autotrophic medium with ammonium carbonate as N-source incubated at 251C, 30 µmol m-2 s-1 light intensity with 16:8 h light dark cycle). Regenerated cells were harvested, lyophilized and biomass expressed as g l-1.
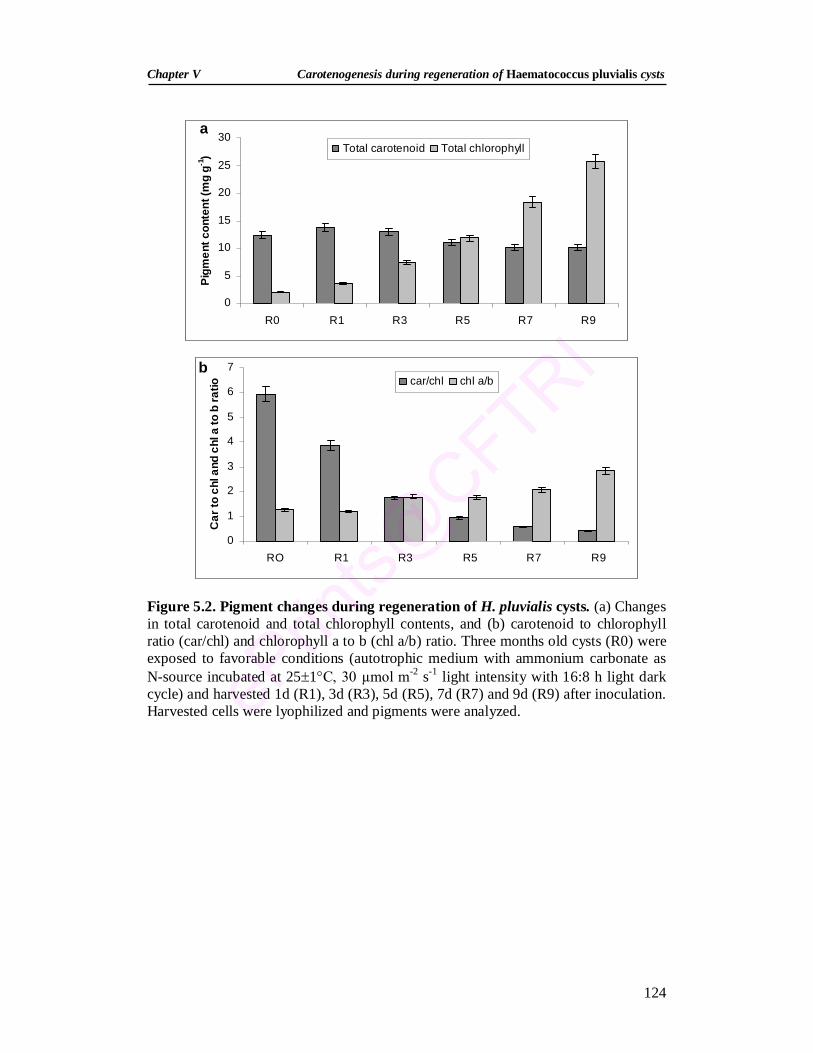
Chapter V Carotenogenesis during regeneration of Haematococcus pluvialis cysts
124
0
5
10
15
20
25
30
R0 R1 R3 R5 R7 R9
Pigm
ent c
onte
nt (m
g g-1
) Total carotenoid Total chlorophyll
0
1
2
3
4
5
6
7
RO R1 R3 R5 R7 R9
Car
to c
hl a
nd c
hl a
to b
ratio car/chl chl a/b
Figure 5.2. Pigment changes during regeneration of H. pluvialis cysts. (a) Changes in total carotenoid and total chlorophyll contents, and (b) carotenoid to chlorophyll ratio (car/chl) and chlorophyll a to b (chl a/b) ratio. Three months old cysts (R0) were exposed to favorable conditions (autotrophic medium with ammonium carbonate as N-source incubated at 251C, 30 µmol m-2 s-1 light intensity with 16:8 h light dark cycle) and harvested 1d (R1), 3d (R3), 5d (R5), 7d (R7) and 9d (R9) after inoculation. Harvested cells were lyophilized and pigments were analyzed.
b
a
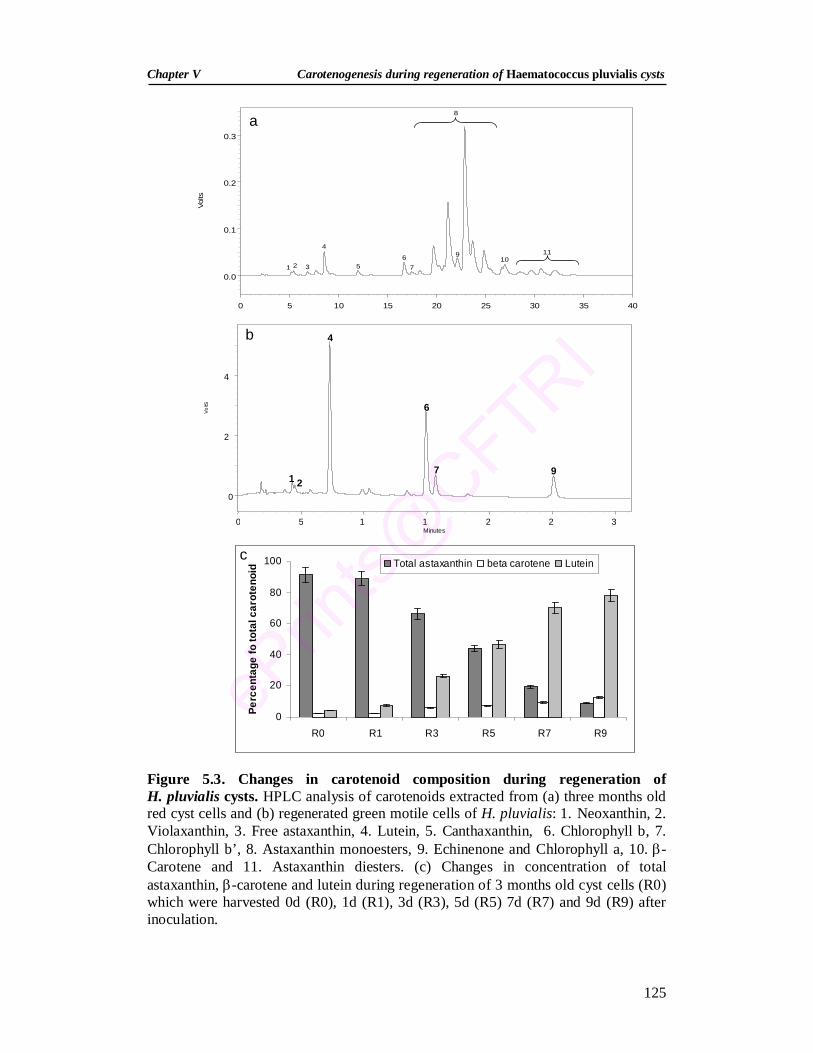
Chapter V Carotenogenesis during regeneration of Haematococcus pluvialis cysts
125
Minutes0 5 10 15 20 25 30 35 40
Volts
0.0
0.1
0.2
0.3
1 2 3
4
56
7
910
11
8
a
Minutes 0 5 1 1 2 2 3 0
2
4
1 2
4
6
7 9
Volts
s
b
Figure 5.3. Changes in carotenoid composition during regeneration of H. pluvialis cysts. HPLC analysis of carotenoids extracted from (a) three months old red cyst cells and (b) regenerated green motile cells of H. pluvialis: 1. Neoxanthin, 2. Violaxanthin, 3. Free astaxanthin, 4. Lutein, 5. Canthaxanthin, 6. Chlorophyll b, 7. Chlorophyll b’, 8. Astaxanthin monoesters, 9. Echinenone and Chlorophyll a, 10. -Carotene and 11. Astaxanthin diesters. (c) Changes in concentration of total astaxanthin, -carotene and lutein during regeneration of 3 months old cyst cells (R0) which were harvested 0d (R0), 1d (R1), 3d (R3), 5d (R5) 7d (R7) and 9d (R9) after inoculation.
0
20
40
60
80
100
R0 R1 R3 R5 R7 R9
Perc
enta
ge fo
tota
l car
oten
oid Total astaxanthin beta carotene Lutein
c
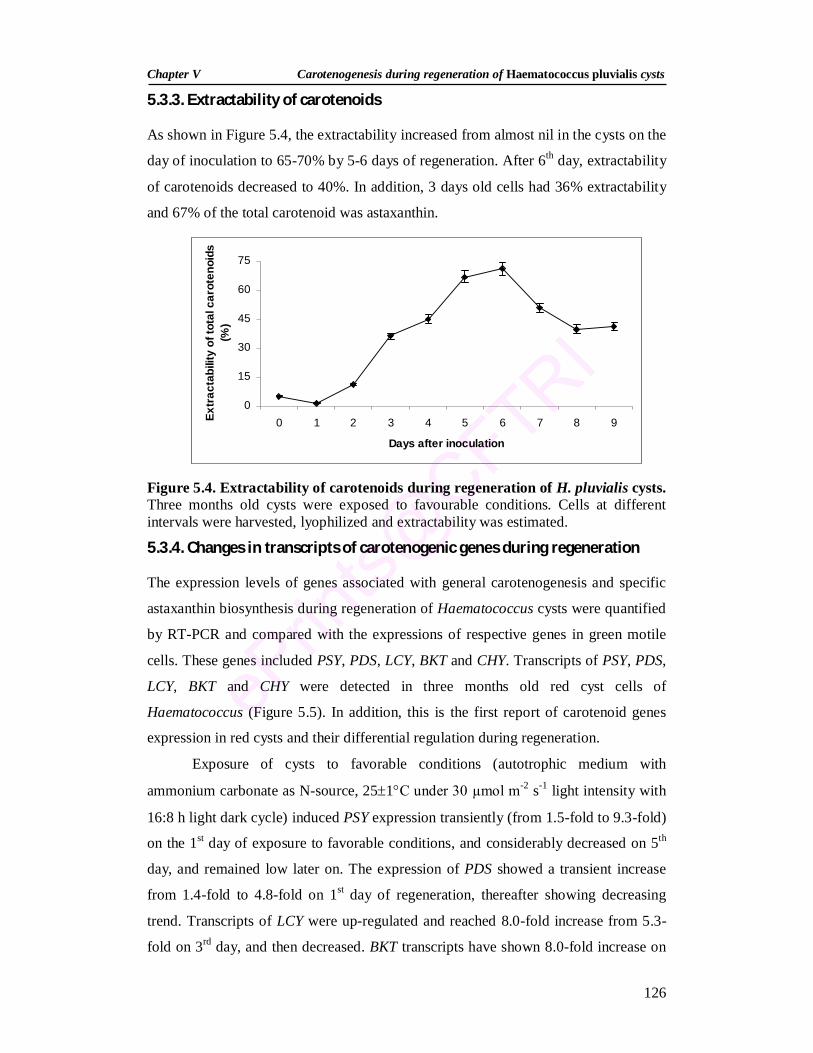
Chapter V Carotenogenesis during regeneration of Haematococcus pluvialis cysts
126
0
15
30
45
60
75
0 1 2 3 4 5 6 7 8 9
Days after inoculation
Extr
acta
bilit
y of
tota
l car
oten
oids
(%
)
5.3.3. Extractability of carotenoids
As shown in Figure 5.4, the extractability increased from almost nil in the cysts on the
day of inoculation to 65-70% by 5-6 days of regeneration. After 6th day, extractability
of carotenoids decreased to 40%. In addition, 3 days old cells had 36% extractability
and 67% of the total carotenoid was astaxanthin.
Figure 5.4. Extractability of carotenoids during regeneration of H. pluvialis cysts. Three months old cysts were exposed to favourable conditions. Cells at different intervals were harvested, lyophilized and extractability was estimated.
5.3.4. Changes in transcripts of carotenogenic genes during regeneration
The expression levels of genes associated with general carotenogenesis and specific
astaxanthin biosynthesis during regeneration of Haematococcus cysts were quantified
by RT-PCR and compared with the expressions of respective genes in green motile
cells. These genes included PSY, PDS, LCY, BKT and CHY. Transcripts of PSY, PDS,
LCY, BKT and CHY were detected in three months old red cyst cells of
Haematococcus (Figure 5.5). In addition, this is the first report of carotenoid genes
expression in red cysts and their differential regulation during regeneration.
Exposure of cysts to favorable conditions (autotrophic medium with
ammonium carbonate as N-source, 251C under 30 µmol m-2 s-1 light intensity with
16:8 h light dark cycle) induced PSY expression transiently (from 1.5-fold to 9.3-fold)
on the 1st day of exposure to favorable conditions, and considerably decreased on 5th
day, and remained low later on. The expression of PDS showed a transient increase
from 1.4-fold to 4.8-fold on 1st day of regeneration, thereafter showing decreasing
trend. Transcripts of LCY were up-regulated and reached 8.0-fold increase from 5.3-
fold on 3rd day, and then decreased. BKT transcripts have shown 8.0-fold increase on
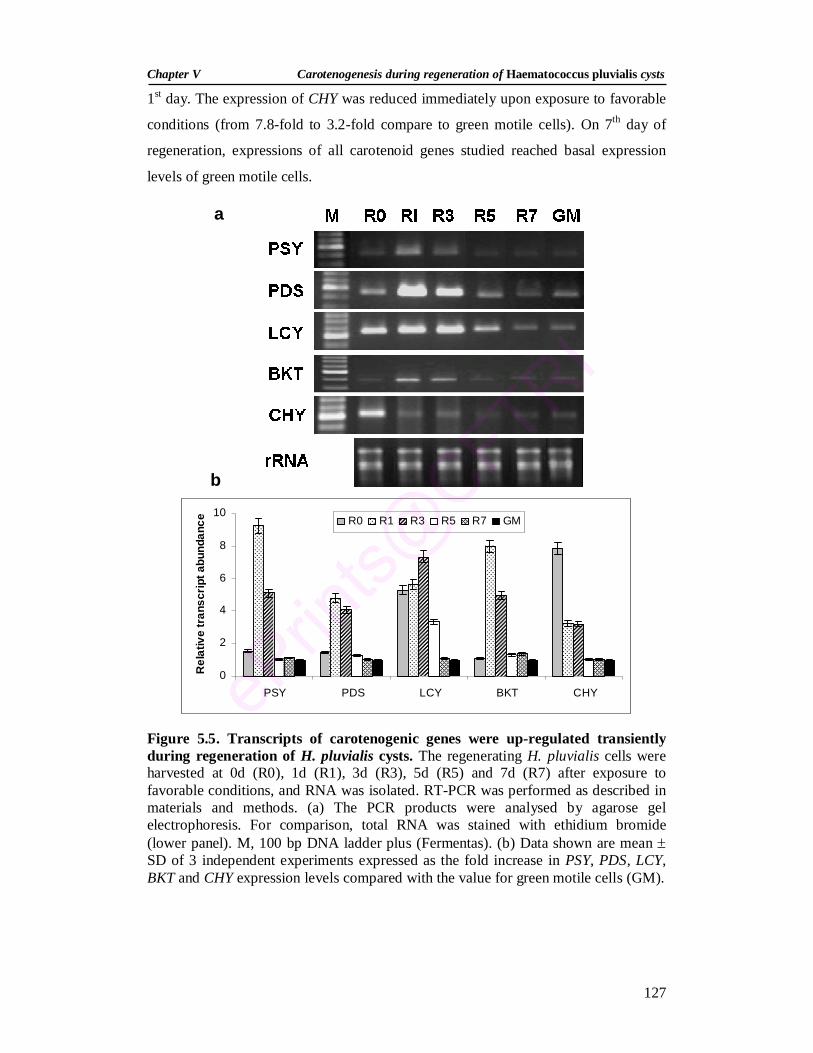
Chapter V Carotenogenesis during regeneration of Haematococcus pluvialis cysts
127
0
2
4
6
8
10
PSY PDS LCY BKT CHY
Rel
ativ
e tr
ansc
ript a
bund
ance R0 R1 R3 R5 R7 GM
1st day. The expression of CHY was reduced immediately upon exposure to favorable
conditions (from 7.8-fold to 3.2-fold compare to green motile cells). On 7th day of
regeneration, expressions of all carotenoid genes studied reached basal expression
levels of green motile cells.
Figure 5.5. Transcripts of carotenogenic genes were up-regulated transiently during regeneration of H. pluvialis cysts. The regenerating H. pluvialis cells were harvested at 0d (R0), 1d (R1), 3d (R3), 5d (R5) and 7d (R7) after exposure to favorable conditions, and RNA was isolated. RT-PCR was performed as described in materials and methods. (a) The PCR products were analysed by agarose gel electrophoresis. For comparison, total RNA was stained with ethidium bromide (lower panel). M, 100 bp DNA ladder plus (Fermentas). (b) Data shown are mean SD of 3 independent experiments expressed as the fold increase in PSY, PDS, LCY, BKT and CHY expression levels compared with the value for green motile cells (GM).
a
b
Chapter V Carotenogenesis during regeneration of Haematococcus pluvialis cysts
128
5.4. Discussion The present study was undertaken to evaluate the methods for achieving maximum
regeneration rate of cysts, and to study changes in carotenogenesis during
regeneration. The results showed the influence of nitrogen source, light dark cycle,
age of cells and treatment temperature on regeneration efficiency of cyst cells.
Bleaching of cells observed during regeneration of cyst cells exposed to 0C for long
time may be due to internal ice crystal formation in absence of added cryoprotectants
thereby affecting the regenerating ability of cells. The complete regeneration obtained
in cells treated at 4C for different durations indicates that cells can withstand that
temperature without losing the viability. Earlier reports had shown the germination of
aplanospores in dark (Hagen et al. 2001; Fabregas et al. 2003), urea-enriched medium
(Lee and Ding 1994), and N-sufficient medium, and aplanospore germination was not
induced in N-free cultures (Fabregas et al. 2003). During regeneration, there was a
decrease in total astaxanthin content; however the relative proportion of free, mono
and diester forms of astaxanthin did not show much variation. This indicated active
degradation of astaxanthin esters. Fabregas et al. (2003) reported that nutrient
availability was a main factor triggering the degradation of astaxanthin, while light
intensity has no effect on the loss of astaxanthin during germination.
The cyst cells contain a thick cell wall made up of algaenan which hinders
carotenoid extraction by solvents. This also reduces carotenoid bioavailability when
whole intact cells were used in nutraceutical preparations. Therefore the cells require
homogenization under high pressure at cryogenic conditions or cracking before usage.
However during regeneration, the extractability of carotenoids increased significantly.
This could be due to breakage of algaenan containing trilaminar sheath, secondary
wall and tertiary wall during germination as reported by Damiani et al. (2006). This
characteristic feature is having biotechnological importance since pigment extraction
from flagellated cells becomes easier (Hagen et al. 2001).
As the growth progresses, transcripts of carotenogenic genes studied - PSY,
PDS, LCY, BKT and CHY were decreased and their levels reached basal expression
level of green motile cells (Figure 5.5). This is in concordance with the report of
Huang et al. (2006a) for basal expression of BKT in green flagellated cells. Even
though transcripts of BKT were detected in green motile cells in our study, the
Chapter V Carotenogenesis during regeneration of Haematococcus pluvialis cysts
129
decrease in astaxanthin during regeneration could be due to reduced level of BKT
transcripts which might have been below a threshold amount necessary for
astaxanthin biosynthesis (Huang et al. 2006a).
During astaxanthin accumulation in Haematococcus, it has been reported that,
high light reduced the plastoquinone pool which seems to function as redox sensor for
transcriptional activation of carotenogenic genes (Steinbrenner and Linden 2003).
Though red cyst cells are photosynthetically competent, they operate at
photosynthetically reduced level which may be due to impaired linear electron flow
from PSII to PSI (Tan et al. 1995). An increase in chlorophyll, decrease in carotenoid
and transient induction of carotenogenic genes observed during regeneration indicates
the possible function of plastoquinone pool as an electron crossover point between
photosynthesis and carotenoid synthesis, as suggested by Kobayashi et al. (1997a).
The slight increase in total carotenoid and total astaxanthin content observed
immediately after exposure of cyst cells to favourable conditions correlated with
transient increase in transcript levels of carotenogenic genes. This shows the
organism’s adaptability to new environment. Since immediately upon exposure to
favourable conditions, extractability decreases, slight increase in total carotenoid and
total astaxanthin may not be due to change in fragility or permeability of cell wall,
and it may be the result of transient induction of carotenogenic genes. In the present
study, we observed an increase in primary carotenoids and chlorophyll, and decrease
in secondary carotenoids and car/chl ratio. It is reported that induction of
carotenogenic genes expression and increase in total carotenoids and secondary
carotenoid occur under stress conditions (Jin et al. 2006). This suggested that
induction of carotenogenic genes expression occurs when cells are exposed to new
conditions (temporary increase in expression under favorable conditions and higher
expression under stress conditions) otherwise they are maintained at basal expression
level.

Chapter VI
Summary and Conclusions
Chapter VI Summary and Conclusions
130
6.1. Brief Background
Chlorophylls and carotenoids are the most abundant pigments in nature. Carotenoids
provide many fruits and flowers with distinct red, orange and yellow colors and a
number of carotenoid-derived aroma, and they are ubiquitous component of all
photosynthetic organisms as they are required for assembly and function of the
photosynthetic apparatus. In plants, carotenoids participate in the light harvesting
process as accessory light-harvesting pigments and they protect the photosynthetic
apparatus from photo-oxidative damage, besides acting as membrane stabilizers
(Bartley and Scolnik 1995). Animals do not synthesize carotenoids de novo and rely
upon the diet (Demmig-Adams and Adams 2002). In animals, besides acting as
precursors for vitamin A and retinoids, carotenoids act as quenchers of singlet
oxygen, free radical scavengers and antioxidants, and they show protective role
against some cancers and macular degenerative diseases (Fraser and Bramley 2004;
Stahl and Sies 2005).
Microalgal species are being exploited for large scale production of
carotenoids. They produce wide spectrum of carotenoids like lutein, zeaxanthin,
astaxanthin, canthaxanthin and β-carotene (Bhosale and Bernstein 2005).
Haematococcus pluvialis is a richest source of valuable ketocarotenoid – astaxanthin
which is accumulated as a secondary carotenoid in extra plastidic lipid vesicles under
stress conditions such as high light, salt stress and acetate addition (Lorenz and
Cysewski 2000; Grünewald et al. 2001). The two distinct phases in the life cycle of
H. pluvialis - a green motile vegetative phase and a non-motile astaxanthin-
accumulating cyst phase, favors the use of H. pluvialis as a model system to study the
regulation of secondary carotenogenesis.
In the biosynthesis of carotenoids, the first committed step, the head-to-head
condensation of geranylgeranyl diphosphate (GGPP) to phytoene, is mediated by the
soluble enzyme phytoene synthase (PSY). The subsequent steps of the pathway
leading to the synthesis of colored carotenoids are carried out by membrane-localized
enzymes such as phytoene desaturase (PDS) and lycopene β-cyclase (LCY)
(Cunningham and Gantt 1998). The biosynthesis of astaxanthin in Haematococcus
follows the general carotenoid pathway up to β-carotene formation. β-carotene
ketolase (BKT) converts β-carotene to canthaxanthin via echinenone which is further
Chapter VI Summary and Conclusions
131
acted upon by β-carotene hydroxylase (CHY) resulting in the formation of astaxanthin
(Jin et al. 2006). Studies on expression of carotenogenic genes revealed that they are
transcriptionally up-regulated. Although there are reports available on the influence of
light on the expression of carotenogenic genes in Haematococcus, studies on the
influences of other stress factors on the expression of carotenogenic genes are limited
(Grünewald et al. 2000; Steinbrenner and Linden 2001; Huang et al. 2006a). Under
nutrient-limiting conditions, the induction of astaxanthin accumulation occurs in
flagellated cells (Brinda et al. 2004), which is more advantageous for biochemical
analysis and for extraction of pigments as the cells are fragile compared to cyst cells.
Moreover astaxanthin accumulation process can be studied independent of the
processes involved in aplanospore formation. Understanding the molecular basis of
stress-induced astaxanthin accumulation in Haematococcus will be useful for the
optimization of astaxanthin production. With this background knowledge, the
objectives of the present research work were laid as follows:
1. To study the differential expression of the enzymes involved in astaxanthin
biosynthesis in Haematococcus pluvialis
2. To study the biochemical changes associated with carotenogenesis
6.2. Summary of results
6.2.1. Expression of carotenoid biosynthetic genes and carotenoid
accumulation
Studies on changes in the pigment profile, expression of carotenogenic genes and their
regulation in H. pluvialis were carried out. The result showed that nutrient stress
(modified BBM containing 1/10th of N and P) and higher light intensity (60 µmol m-2
s-1) in combination with 17.1 mM NaCl / 4.4 mM sodium acetate (SA) enhanced total
carotenoid and total astaxanthin content to 32.0 and 24.5 mg g–1 of dry biomass,
respectively. Expression of carotenogenic genes, phytoene synthase (PSY), phytoene
desaturase (PDS), lycopene β-cyclase (LCY), β-carotene ketolase (BKT) and β-
carotene hydroxylase (CHY) were up-regulated under all the stress conditions studied.
However, the extent of expression of carotenogenic genes varied with stress
conditions. Nutrient stress and high light intensity induced expression of astaxanthin
biosynthetic genes, BKT and CHY, transiently. Enhanced expression of these genes
Chapter VI Summary and Conclusions
132
was observed with SA and NaCl/SA, while expression was delayed with NaCl.
Maximum transcript levels of PSY, PDS, LCY, BKT, and CHY were found to be 158–
277, 5–9, 470–674, 28–40, and 451–673-fold higher, respectively, than green
vegetative cells. The maximum content of astaxanthin recorded in cells grown in
medium with SA and NaCl/SA correlated with the expression profile of the
astaxanthin biosynthetic genes. Studies using various inhibitors indicated that general
carotenogenesis and secondary carotenoid induction were regulated at both
transcriptional and cytoplasmic translational levels. The induction of general
carotenoid synthesis genes was independent of cytoplasmic protein synthesis while
BKT gene expression was dependent on de novo protein synthesis. The present study
also suggests a possible involvement of acetate in the post-transcriptional
modifications of carotenoid genes.
6.2.2. Regulation of carotenogenic and photosynthetic genes expression
Regulation of expression of carotenoid biosynthetic genes and photosynthetic genes
were studied using carotenoid and fatty acid synthesis inhibitors and photosynthetic
electron transport inhibitors. Various carotenoid synthesis inhibitors such as
diphenylamine (DPA), nicotine, norflurazon (NF) and fatty acid synthesis inhibitor
cerulenin were used to study the regulation of carotenogenesis under high light
intensity of 97 µmol m-2 s-1 in nutrient sufficient (NS/HL) and nutrient deficient
(ND/HL) media. The results showed inhibition of astaxanthin by all the inhibitors
under NS/HL and ND/HL. Total carotenoid contents were reduced to 0.70, 0.53, 0.59
and 0.79-fold respectively of NS/HL control in DPA, nicotine, NF and cerulenin
treated cultures while the total carotenoid contents were reduced to 0.37, 0.61 and
0.61-fold respectively of ND/HL control in nicotine, NF and cerulenin treated cultures
except DPA where enhanced total carotenoid production through accumulation of β-
carotene and lutein was observed. Lycopene accumulation was observed with nicotine
treatment while β-carotene accumulation was observed with DPA. Expression of
carotenogenic genes PSY was enhanced by all inhibitors studied except DPA while
PDS expression was reduced by all inhibitors tested except nicotine and the
expression of LCY was enhanced in all the inhibitor treatments. Reduced expressions
of both BKT and CHY were observed under DPA and NF treatment while enhanced
expression for BKT was observed under nicotine treatment and CHY expression under
nicotine and cerulenin. Exposure of cells to ND/HL enhanced carotenogenic genes
Chapter VI Summary and Conclusions
133
expression when compared to respective inhibitors to NS/HL in most cases. Reduced
expression of LCY of nicotine and PSY and LCY of cerulenin treated cultures resulted
in increased lycopene accumulation and decreased β-carotene and lutein respectively.
Non correlation of reduced carotenoid levels and enhanced expression of carotenoid
genes at one hand and accumulation of lycopene and β-carotene which are
intermediates in astaxanthin biosynthetic pathway observed under the experimental
conditions on the other hand indicate the involvement of other regulatory factors
besides transcriptional regulation of carotenogenesis in H. pluvialis.
Pigment accumulation, maximum quantum yield of photosystem II (PSII), and
differential expression of photosynthetic genes were studied under stress conditions.
Regulation of transcription of photosynthetic genes was also studied using inhibitors
of photosynthetic electron transport, transcription, translation as well as carotenoid
synthesis. Astaxanthin accumulation is accompanied by reduction in chlorophyll
content, PSII quantum yield and total carotenoid, and increase in chlorophyll a/b ratio.
Reduced chlorophyll a/b ratio was observed in cysts. Expression of photosynthetic
genes, cabL1818, lhcbm9, psaB, rbcL and atpB were studied. The nuclear genes
cabL1818 and lhcbm9 codes for the chlorophyll a/b binding protein L1818 and major
light-harvesting complex II m9 protein respectively. The chloroplast encoded psaB
gene codes for PSI reaction centre protein PsaB. The chloroplast genes rbcL and atpB
codes for large subunit of Ribulose bisphosphate carboxylase oxygenase (Rubisco)
and ATP synthase -subunit respectively. Transcripts of cabL1818, lhcbm9, psaB,
rbcL and atpB were up-regulated during stress-induced accumulation of astaxanthin
with the maximum of 3.75, 1.66, 1.50, 11.63 and 1.26-fold increase respectively over
non-stressed green motile cells. Transcripts of these genes were detected even in cyst
cells with the transcript levels of cabL1818, psaB and atpB at reduced level. Studies
using photosynthetic inhibitors, DCMU and DBMIB showed expression of cabL1818,
lhcbm9, psaB and rbcL were under redox control of plastoquinone pool and atpB gene
expression may be regulated at cytochrome b6/f complex. Expression of all five
photosynthetic genes studied was regulated at transcriptional and cytoplasmic
translational levels, and their expressions were reduced by norflurazon induced photo
oxidative stress. Acetate modulates the HL induced expression of photosynthetic
genes and it depends on redox state of cytochrome b6/f complex and cytoplasmic
protein synthesis.
Chapter VI Summary and Conclusions
134
6.2.3. Molecular and biochemical changes associated with carotenogenesis
The genes differentially expressed under the stress conditions were analyzed using the
mRNA differential display RT PCR (DD-RT PCR) technique coupled with silver-
staining. From two populations of mRNA (green vegetative cells and cells exposed to
high light intensity 97 µmol m-2 s-1), using 7 anchored primers and 5 arbitrary
primers; a total of 109 transcripts which were differentially expressed under stress
conditions have been identified. After removal of false positives by re-amplification,
34 partial cDNAs were cloned, sequenced and analyzed in silico. Almost 50% of the
DD cDNAs were either of unknown function or shared no apparent homology to any
expressed sequences in the GenBank/EMBL databases. And about 50% of DD clones
were similar to molecules related to general metabolism, photosynthesis, carotenoid
synthesis, lipid synthesis, tetrapyrrole synthesis, transporter proteins, defense
signaling and genetic information processing. In addition, one partial transcript which
is homologue to psaB gene coding D1 protein of photosystem II have been identified
for the first time in H. pluvialis. The differential expression patterns were confirmed
by RNA dot blot, northern blot and semi-quantitative RT-PCR analyses. RNA
analyses of 6 DD clones revealed that 4 genes were induced under high light stress
and two genes exhibited reduced expression. The relationship between the expression
pattern of these mRNA transcripts and the function of their respective encoding
proteins in response to high light stress were studied. The results provide a
contribution to better understanding of the changes in gene expression that
accompanies the carotenogenic process in Haematococcus under stress conditions.
Changes in pigment profile with reference to carotenoid composition in
different cell fractions, activities of carotenoid enzymes such as LCY and BKT,
antioxidant enzymes and protein content were studied. LCY and BKT activities were
found to increase under stress condition. Maximum activity of BKT was observed in
lipid globules of stress induced cultures. Analysis of astaxanthin composition revealed
the decrease in free astaxanthin and increase in astaxanthin mono and diesters.
Exposure of cells to high light, nutrient deficiency along with NaCl and sodium
acetate addition produced cells with astaxanthin composition of 0.95, 92.56 and
6.49% of free astaxanthin, astaxanthin monoesters and diesters respectively of total
astaxanthin. Influence of CO2 enrichment (2%) along with other stress conditions like
high light, nutrient deficiency (modified BBM containing 1/10th of N and P), 17.1
Chapter VI Summary and Conclusions
135
mM NaCl and 4.4 mM sodium acetate addition on carotenoid accumulation was
studied. Under the influence of HL, exposure of cells to nutrient deficiency enhanced
carotenoid accumulation which was further enhanced by exposure to CO2 enriched
environment and/or NaCl and sodium acetate addition. Changing the carbonate buffer
in the lower compartment of 2-tier vessel to provide constant CO2 environment was
found to be efficient in enhancing carotenoid content but the proportion of astaxanthin
among total carotenoid was reduced. A maximum of 30.61 mg/g of total carotenoid
with 87% astaxanthin was achieved by exposing cells to high light, NaCl and CO2
(twice buffer changes).
Influence of phytohormones such as salicylic acid and methyl jasmonate on
pigment production and antioxidant enzymes was studied. At lower concentrations
(10 M), these phytohormones could be used for elicitation of secondary carotenoid
production. Higher concentrations of salicylic acid and methyl jasmonate inhibited
astaxanthin accumulation but each is having different mechanism of inhibition either
by scavenging the free radicals or by increasing primary carotenoids production.
6.2.4. Expression of carotenogenic genes and associated changes in pigment
profile during regeneration of Haematococcus pluvialis cysts
Influence of few cultural parameters and temperature treatments on regeneration
efficiency of red cysts along with changes in pigment profile and expression of
carotenogenic genes during regeneration were investigated. Regeneration efficiency
has been improved by incubating less aged cyst cells in medium containing
ammonium carbonate, 16:8 light dark cycles with light intensity of 30 µmol m-2 s-1.
During regeneration there was decrease in total astaxanthin, total carotenoids and
carotenoid to chlorophyll ratio, and increase in -carotene, lutein, total chlorophyll
and chlorophyll a to b ratio. Expression analysis revealed the presence of transcripts
of carotenogenic genes, PSY, PDS, LCY, BKT and CHY in cyst cells and these
transcripts were up-regulated transiently upon transfer to favorable conditions. As the
culture growth progressed, carotenogenic genes expression were decreased and
reached basal expression levels of green motile vegetative cells. In addition, this is the
first report of detection of carotenogenic gene transcripts in red cysts and their
differential expression during regeneration. The present study suggests the use of red
cysts as an alternate inoculum for mass cultivation to combat protozoan predation.
Chapter VI Summary and Conclusions
136
6.3. Conclusions Detailed studies were undertaken to analyze the expression of carotenoid biosynthetic
genes of H. pluvialis and their regulation along with molecular and biochemical
changes associated with carotenogenesis. In addition, changes in pigment profile and
expression of carotenoid biosynthetic genes during regeneration of H. pluvialis cysts
were also studied. Expression of carotenoid biosynthetic genes of H. pluvialis was
studied and up-regulation of these genes correlated with enhanced astaxanthin
accumulation. Both general carotenogenesis and secondary carotenoid induction were
regulated at transcriptional and cytoplasmic translational levels. This study also
suggested a possible involvement of acetate in the post-transcriptional modifications
of carotenoid genes. Experiments using inhibitors of carotenoid and fatty acid
synthesis indicated the involvement of other regulatory factors besides transcriptional
regulation of carotenogenesis in H. pluvialis. Studies using photosynthetic inhibitors
showed expression of photosynthetic genes, cabL1818, lhcbm9, psaB and rbcL were
under redox control of plastoquinone pool and atpB gene expression may be regulated
at cytochrome b6/f complex. By using mRNA differential display RT PCR technique,
35 differentially expressed transcripts have been identified. A partial transcript
homologue to psaB gene coding D1 protein of photosystem II has been identified for
the first time in H. pluvialis. LCY and BKT activities were found to increase under
stress condition. Maximum activity of BKT was observed in lipid globules of stress
induced cultures. Under the influence of high light, exposure of cells to nutrient
deficiency enhanced carotenoid accumulation which was further enhanced by
exposure to CO2 enriched environment and/or NaCl and sodium acetate addition.
Changing the carbonate buffer in the lower compartment of 2-tier vessel to provide
constant CO2 environment was found to be efficient in enhancing carotenoid content.
Expression analysis of carotenogenic genes during regeneration of H. pluvialis cysts
showed these transcripts were transiently up-regulated upon transfer to favorable
conditions and later reached basal expression levels of green motile vegetative cells.
Thus the thesis work has presented in detail about the regulation of carotenogenesis -
both general and astaxanthin specific under the influence of stress conditions
correlating the expression of carotenogenic enzymes with metabolites. Inhibitor
studies suggested regulation of carotenogenic genes at transcriptional, translational
Chapter VI Summary and Conclusions
137
and post-translational levels. It is evident from the results that acetate has a role in
regulation of both carotenogenic and photosynthetic gene expression.
In recent years, pathway engineering of higher plants to produce valuable carotenoids
is gaining importance. Therefore the results from the present studies will be helpful in
understanding the regulation of carotenogenesis and metabolic engineering of
carotenoid pathway in other organisms.

Bibliography
Bibliography
138
Abe K, Hattori H, Hirano M (2007) Accumulation and antioxidant activity of secondary carotenoids in the aerial microalga Coelastrella striolata var. multistriata. Food Chem 100: 656–661.
Aflalo C, Bing W, Zarka A, Boussiba S (1999) The effect of the herbicide glufosinate (BASTA) on astaxanthin accumulation in the green alga Haematococcus pluvialis. Z Naturforsch 54c: 49-54.
Agarwal S, Sairam RK, Srivastava GC, Tyagi A, Meena RC (2005) Role of ABA, salicylic acid, calcium and hydrogen peroxide on antioxidant enzymes induction in wheat seedlings. Plant Sci 169: 559–570.
Al-Babili S, Hartung W, Kleinig H, Beyer P (1999) CPTA modulates levels of carotenogenic proteins and their mRNAs and affects carotenoid and ABA content as well as chromoplast structure in Narcissus pseudonarcissus flowers. Plant Biol 1:607-12.
Alexceiv K, Tullberg A (1997) Regulation of petB mRNA stability in pea chloroplasts by redox poise. Physiol Plant 99: 477-485.
Alfonso M, Perewoska I, Kirilovsky D (2000) Redox control of psbA gene expression in the cyanobacterium Synechocystis PCC 6803. Involvement of the cytochrome b6/f complex. Plant Physiol 122: 505–515.
Allen JF, Pfannschmidt T (2000) Balancing the two photosystems: photosynthetic electron transfer governs transcription of reaction centre genes in chloroplasts. Phil Trans R Soc London B 355: 1351–1357.
Ameline-Torregrosa C, Wang B-B, O’Bleness MS, Deshpande S, Zhu H, Roe B, Young ND, Cannon SB (2008) Identification and characterization of nucleotide-binding site-leucine-rich repeat genes in the model plant Medicago truncatula. Plant Physiol 146: 5–21.
An GH, Schuman DB, Johnson EA (1989) Isolation of Phaffia rhodozyma mutants with increased astaxanthin content. Appl Environ Microbiol 55: 116-124.
Arad S, Cohen E, Ben-Amotz A (1993) Accumulation of canthaxanthin in Chlorella emersonii. Physiol Plant 87: 232–236.
Armstrong GA (1994) Eubacteria Show Their True Colors: Genetics of Carotenoid Pigment Biosynthesis from Microbes to Plants. J Bacteriol 176: 4795–4802.
Arnold TM, Targett NM, Tanner CE, Hatch WI, Ferrari KE (2001) Evidence for Methyl Jasmonate- Induced Phlorotannin Production in Fucus vesiculosus (Phaeophyceae). J Phycol 37: 1026– 1029.
Baroli I, Niyogi KK (2000) Molecular genetics of xanthophyll-dependent photoprotection in green algae and plants. Philos Trans R Soc Lond B Biol Sci 355: 1385–1394.
Bibliography
139
Bartley GE, Scolnik PA (1995) Plant carotenoids: Pigments for photoprotection, visual attraction and human health. Plant Cell 7: 1027-1038.
Beers RF, Sizer IW (1952) A spectrophotometric method for measuring the breakdown of hydrogen peroxide by catalase. J Biol Chem 195: 133-140.
Ben-Amotz A, Fishler R (1998) Analysis of carotenoids with emphasis on 9-cis-β-carotene in vegetables and fruits commonly consumed in Israel. Food Chem 62:515–520.
Bhosale P, Bernstein PS (2005) Microbial xanthophylls. Appl Microbiol Biotechnol 68: 445–455.
Bidigare RR, Ondrusek ME, Kennicutt MC, Iturriaga R, Harvey HR, Hoham RW, Macko SA (1993) Evidence for a photoprotective function for secondary carotenoids of snow algae. J Phycol 29: 427-434.
Boger P, Sandmann G (1983) Pigment biosynthesis and herbicides interaction. Photosynthetica 28: 481-93.
Bohne F, Linden H (2002) Regulation of carotenoid biosynthesis in response to light in Chlamydomonas reinhardtii. Biochimica et Biophysica Acta 1579: 26-34.
Bold HV, Wynne MJ (1985) Introduction to the algae. Prentice Hall INC 2nd ed. pp 16-17.
Bollag W (1996) The retinoid revolution. FASEB J 10: 938–939.
Borowitzka MA, Huisman JM, Osborn A (1991) Cultures of astaxanthin-producing green alga Haematococcus pluvialis. I. Effect of nutrients on growth and cell types. J Appl Phycol 32: 1077-1082.
Boussiba S (2000) Carotenogenesis in the green alga Haematococcus pluvialis: Cellular physiology and stress response. Physiol Plant 108: 111-117.
Boussiba S, Fan L, Vonshak A (1992) Enhancement and determination of astaxanthin accumulation in green alga Haematococcus pluvialis. Meth Enzymol 213: 386-391.
Boussiba S, Vonshak A (1991) Astaxanthin accumulation in the green alga Haematococcus pluvialis. Plant Cell Physiol 32: 1077-1082.
Boussiba S, Wang B, Yuan JP, Zarka A, Chen F (1999) Changes in pigments profile in the green alga Haeamtococcus pluvialis exposed to environmental stresses. Biotechnol Lett 21: 601-604.
Breitenbach J, Misawa N, Kajiwara S, Sandmann G (1996) Expression in Escherichia coli and properties of the carotene ketolase from Haematococcus pluvialis. FEMS Microbiol Lett 140: 241–246.
Brinda BR, Sarada R, Kamath BS, Ravishankar GA (2004) Accumulation of
Bibliography
140
astaxanthin in flagellated cells of Haematococcus pluvialis - cultural and regulatory aspects. Current Sci 87: 1290 -1295.
Brinker M, Klaff P, Wissel K, Kellmann JW, Piechulla B (2001) Distinct Lhc mRNA stabilities in several vascular plant species. J Plant Physiol 158: 1479–1485.
Britton G (1993) Carotenoids in chloroplast pigment-protein complexes. In: Sundqvist C, Ryberg M (eds) Pigment- Protein Complexes in Plastids: Synthesis and Assembly. Academic Press, New York, pp 447–483.
Burchardt L, Balcerkiewicz S, Kokocinski M, Samardakiewicz S, Adamski Z (2006) Occurrence of Haematococcus pluvialis Flotow emend. Wille in a small artificial pool on the university campus of the collegium biologicum in poznan (Poland). Biodiv Res Conserv 1-2: 163-166.
Campisi L, Fambrini M, Michelotti V, Salvini M, Giuntini D, Pugliesi C (2006) Phytoene accumulation in sunflower decreases the transcript levels of the phytoene synthase gene. Plant Growth Regulation 48: 79-87.
Carginale V, Maria G, Capasso C, Ionata E, Cara FL, Pastore M, Bertaccini A, Capasso A (2004) Identification of genes expressed in response to phytoplasma infection in leaves of Prunus armeniaca by messenger RNA differential display. Gene 332: 29–34.
Chen F, Li H-B, Wong RNS, Ji B, Jiang Y (2005) Isolation and purification of the bioactive carotenoid zeaxanthin from the microalga Microcystis aeruginosa by high-speed counter-current chromatography. J Chromatography A 1064: 183–186.
Chien Y (1996) Biological effects of astaxanthin in shrimp, a review (Hunter B ed.) The 3rd annual Roche aquaculture centre conference on nutrition and disease.
Choo KS, Snoeijs P, Pedersén M (2004) Oxidative stress tolerance in the filamentous green algae Cladophora glomerata and Enteromorpha ahlneriana. J Exp Marine Biol Ecol 298: 111-123.
Crane FL (1977) Hydroquinone dehydrogenases. Ann Rev Biochem 46: 439-469.
Cunningham FX, Gantt E (1998) Genes and enzymes of carotenoid biosynthesis in plants. Annu Rev Plant Physiol Plant Mol Biol 49: 557-583.
Cunningham FX, Gantt E (2000) Identification of multi-gene families encoding isopentenyl diphosphate isomerase in plants by heterologous complementation in Escherichia coli. Plant Cell Physiol 41: 119-123.
Cunningham FX, Gantt E (2005) A study in scarlet: enzymes of ketocarotenoid biosynthesis in the flowers of Adonis aestivalis. Plant J 41: 478–492.
Cuttriss A, Pogson B (2004) Carotenoids IN. Plant pigments and their manipulation. Annual Plant Reviews Vol 14 (Davies KM ed.) CRC press and Blackwell
Bibliography
141
Publishing Ltd.
Czeczuga B (1987) Ketocarotenoids-autumn carotenoids in Metasequoia glyptostroboides. Biochem Syst Ecol 15: 303–306.
Czerpak R, Bajguz A, Gromek M, Kozlowska G, Nowak I (2002) Activity of salicylic acid on the growth and biochemism of Chlorella vulgaris Beijerinck. Acta Physiologiae Plantarum 24: 45-52.
Czerpak R, Piotrowska A, Szulecka K (2006) Jasmonic acid affects changes in the growth and some components con tent in alga Chlorella vulgaris. Acta Physiologiae Plantarum 28: 195-203.
Czygan FC (1970) Blood-rain and blood-snow: nitrogen-deficient cells of Haematococcus pluvialis and Chlamydomonas nivalis. Arch Mikrobiol 74: 69-76.
Damiani AMC, Leonardi PI, Pieroni OI, Caceres EJ (2006) Ultrastructure of the cyst wall of Haematococcus pluvialis (Chlorophyceae): wall development and behaviour during cyst germination. Phycologia 45: 616-623.
Davies BH (1976) Carotenoids. In Chemistry and biochemistry of plant pigments. (Goodwin TW Ed.) Academic Press, London, pp 38-166.
Del Campo JA, Rodriguez H, Moreno J, Vargas MA, Rivas J, Guerrero MG (2001) Lutein production by Muriellopsis sp. in an outdoor tubular photobioreactor. J Biotechnol 85: 289–295.
Del Campo JA, Rodriguez H, Moreno J, Vargas MA, Rivas J, Guerrero MG (2004) Accumulation of astaxanthin and lutein in Chlorella zofingiensis (Chlorophyta). Appl Microbiol Biotechnol 64: 848–854.
Demmig-Adams B, Adams WW (2002) Antioxidants in photosynthesis and human nutrition. Science 298: 2149–2153.
Demmig-Adams B, Gilmore AM, Adams WW (1996) In vivo functions of carotenoids in higher plants. FASEB J 10: 403–412.
Depka B, Jahns P, Trebst A (1998) β-Carotene to zeaxanthin conversion in the rapid turnover of the D1 protein of photosystem II. FEBS Letts 424: 267-270.
Dominguez-Bocanegra AR, Legarreta IG, Jeronimo FM, Campocosio AT (2004) Influence of environmental and nutritional factors in the production of astaxanthin from Haematococcus pluvialis. Bioresource Technol 92: 209-214.
Droop MR (1955) Carotenogenesis in Haematococcus pluvialis. Nature 175: 42.
Ducrey Sanpietro LM, Kula M-R (1998) Studies of astaxanthin biosynthesis in Xanthophyllomyces dendrorhous (Phaffia rhodozyma). Effect of inhibitors and low temperature. Yeast 14: 1007-16.
Bibliography
142
Duncan DB (1955) Multiple range and multiple F tests. Biometrics 11: 1-42.
Durnford DG, Price JA, McKim SM, Sarchfield ML (2003) Light-harvesting complex gene expression is controlled by both transcriptional and post-transcriptional mechanisms during photoacclimation in Chlamydomonas reinhardtii. Physiol Plant 118: 193–205.
Eisenreich W, Rohdich F, Bacher A (2001) Deoxyxylulose phosphate pathway to terpenoids. Trends Plant Sci 6: 78-84.
El Bissati K, Kirilovsky D (2001) Regulation of psbA and psaE expression by light quality in Synechocystis species PCC 6803. A redox control mechanism. Plant Physiol 125: 1988–2000.
Endo T, Asada K (1996) Dark induction of the non-photochemical quenching of chlorophyll fluorescence by acetate in Chlamydomonas reinhardtii. Plant Cell Physiol 37: 551-555.
Eom H, Lee CG, Jin ES (2006) Gene expression profile analysis in astaxanthin-induced Haematococcus pluvialis using cDNA microarray. Planta 223: 1231–1242.
Eom HS, Park S, Lee C-G, Jin ES (2005) Gene expression profiling of a eukaryotic microalga, Haematococcus pluvialis. J Microbiol Biotechnol 15: 1060-1066.
Escoubas J-M, Lomas M, LaRoche J, Falkowski PG (1995) Light intensity regulation of cab gene transcription is signaled by the redox state of the plastoquinone pool. Proc Natl Acad Sci USA 92: 10237–10241.
Fabregas J, Dominguez A, Maseda A, Otero A (2003) Interactions between irradiance and nutrient availability during astaxanthin accumulation and degradation in Haematococcus pluvialis. Appl Microbiol Biotechnol 61: 545-551.
Fabregas J, Otero A, Maseda A, Dominguez A (2001) Two-stage cultures for the production of astaxanthin from Haematococcus pluvialis. J Biotechnol 89: 65-71.
Fan L, Vonshak A, Gabbay R, Hirschberg J, Cohen Z, Boussiba S (1995) The biosynthetic pathway of astaxanthin in a green alga Haematococcus pluvialis as indicated by inhibition with diphenylamine. Plant Cell Physiol 36: 1519–1524.
Fan L, Vonshak A, Zarka A, Boussiba S (1998) Does astaxanthin protect Haematococcus against light damage? Z Naturforsch C 53: 93-100.
Faure H, Fayol V, Galabert C, Grolier P, Moel GL, Steghens J, Kappel AV, Nabet F (1999) Carotenoids: 1. Metabolism and physiology. Ann Biol Clin (Paris) 57: 169–183.
Bibliography
143
Fedina IS, Benderliev KM (2000) Response of Scenedesmus incrassatulus to salt stress as affected by methyl jasmonate. Biologia Plantarum 43: 625-627.
Fiksdahl A, Mortensen JT, Liaaen-Jensen S (1978) High pressure liquid chromatography of carotenoids. J Chromatography 157: 111-117.
Foss P, Renstrøm B, Liaaen-Jensen S (1987) Natural occurrence of enantiomeric and meso astaxanthin in crustaceans including zooplankton. Comp Biochem Physiol 86B: 313–314.
Fraser PD, Bramley PM (2004) The biosynthesis and nutritional uses of carotenoids. Prog Lipid Res 43: 228–265.
Fraser PD, Miura Y, Misawa N (1997) In vitro characterization of astaxanthin biosynthetic enzymes. J Biol Chem 272: 6128-6135.
Fraser PD, Shimada H, Misawa N (1998) Enzymic confirmation of reactions involved in routes to astaxanthin formation, elucidated using a direct substrate in vitro assay. Eur J Biochem 252: 229–236.
Fujii K, Nakajima H, Anno Y (2008) Potential of Monoraphidium sp. GK12 for energy-saving astaxanthin production. Journal of Chemical Technology and Biotechnology 83: 1578 – 1584.
Fung IP (2005) Elicitation of astaxanthin biosynthesis in dark-heterotrophic cultures of Chlorella zofingiensis. Ph.D thesis, The University of Hong Kong, Hong Kong.
Garcia-Gonzalez M, Moreno J, Manzano JC, Florencio FJ, Guerrero MG (2005) Production of Dunaliella salina biomass rich in 9-cis-β-carotene and lutein in a closed tubular photobioreactor. J Biotechnol 115: 81-90.
Garrett RH, Grisham GM (1995) Biochemistry. Saunders College Publishing, Fort Worth, Texas.
Gerjets T, Sandmann G (2006) Ketocarotenoid formation in transgenic potato. J Exp Bot 57: 3639–3645.
Giuliano G, Al-Babili S, von Lintig J (2003) Carotenoid oxygenases: cleave it or leave it. Trends Plant Sci 8:145–149.
Giuliano G, Bartley GE, Scolnik PA (1993) Regulation of carotenoid biosynthesis during tomato development. Plant Cell 5: 379–87.
Goodwin TW (1980) The Biochemistry of Carotenoids. I. Plants. Chapman and Hall, London.
Goodwin TW, Jamikorn M (1954) Studies in Carotenogenesis 11. Carotenoid synthesis in the alga Haematococcus pluvialis. Biochem J 57: 376-381.
Gouveia L, VelosoV, Reis A, Fernandes H, Novais J, Empis J (1996) Evolution of
Bibliography
144
pigment composition in Chlorella vulgaris. Bioresource Technology 57: 157-163.
Gray JC (2003) Chloroplast-to-nucleus signaling: a role for Mg-protoporphyrin. Trends in Genetics 19: 526-529.
Grünewald K, Eckert M, Hirschberg J, Hagen C (2000) Phytoene desaturase is localized exclusively in the chloroplast and up-regulated at the mRNA level during accumulation of secondary carotenoids in Haematococcus pluvialis (Volvocales, Chlorophyceae). Plant Physiol 122: 1261-1268.
Grünewald K, Hagen C (2000) Extrusion of secondary carotenoid containing vesicles from flagellates of Haematococcus pluvialis. (Volvocales; Chlorophyceae). J Appl Bot-Angewandte Botanik 74: 141-144.
Grünewald K, Hagen C (2001) β-carotene is the intermediate exported from the chloroplast during accumulation of secondary carotenoids in Haematococcus pluvialis. J Appl Phycol 13: 89-93.
Grünewald K, Hirschberg J, Hagen C (2001) Ketocarotenoid biosynthesis outside of plastids in the unicellular green alga Haematococcus pluvialis. J Biol Chem 276: 6023-6029.
Grung M, D´Souza FML, Borowitzka MA, Liaaen-Jensen S (1992) Algal carotenoids 51. Secondary carotenoids 2. Haematococcus pluvialis aplansospores as a source of (3S,3S´)- astaxanthin esters. J Appl Phycol 86: 593-599.
Guerin M, Huntley ME, Olaizola M (2003) Haematococcus astaxanthin: applications for human health and nutrition. Trends in Biotechnology 21: 210-216.
Hagen C, Braune W, Bjorn LO (1994) Funtional aspects of secondary carotenoids in Haematococcus lacustris (Volvocales). III. Action as a ‘sunshade’. J Phycol 30: 241–248.
Hagen C, Grünewald K (2000) Fosmidomycin as an inhibitor of the non-mevalonate terpenoid pathway depresses synthesis of secondary carotenoids in flagellates of the green alga Haematococcus pluvialis. J Appl Bot-Angewandte Botanik 74: 137-140.
Hagen C, Grünewald K, Schmidt S, Müller J (2000) Accumulation of secondary carotenoids in flagellates of Haematococcus pluvialis is accompanied by increase in chlorophyll productivity of photosynthesis. Eur J Phycol 35: 75-82.
Hagen C, Grunewald K, Xylander M, Rothe E (2001) Effect of cultivation parameters on growth and pigment biosynthesis in flagellated cells of Haematococcus pluvialis. J Appl Phycol 13:79-87.
Hagen C, Siegmund S, Braune W (2002) Ultrastructural and chemical changes in the cell wall of Haematococcus pluvialis (Volvocales, Chlorophyta) during
Bibliography
145
aplanospore formation. Eur J Phycol 37: 217-226.
Hanagata N, Dubinsky Z (2002) Secondary carotenoid accumulation in Scenedesmus komarekii (Chlorophyceae, Chlorophyta). J Phycol 35: 960 – 966.
Handelman GJ (2001) The evolving role of carotenoids in human biochemistry. Nutrition 17: 818–822.
Harker M, Hirschberg J (1997) Biosynthesis of ketocarotenoids in transgenic cyanobacteria expressing the algal gene for β-C-4- oxygenase, crtO. FEBS Lett 404: 129-134.
Harker M, Tsavalos AJ, Young AJ (1996) Factors responsible for astaxanthin formation in the chlorophyte Haematococcus pluvialis. Bioresource Technol 55: 207-214.
Harker M, Young AJ (1995) Inhibition of astaxanthin synthesis in the green alga Haematococcus pluvialis. Eur J Phycol 30: 179–87.
Harter LN (1960) Critical values for Duncan's new multiple range test. Biometrics 16: 671-685.
Hershkovits G, Dubinsky Z, Katcoff DJ (1997) A novel homologue of the prokaryotic htrA gene is differentially expressed in the alga Haematococcus pluvialis following stress. Mol Gen Genet 254: 345-350.
Hirschberg J (2001) Carotenoid biosynthesis in flowering plants. Curr Opin Plant Biol 4: 210–218.
Hu Q, Sommerfeld M, Wang S-B, Chen SF, Liu GX, Hu ZY (2003) Proteomics of Haematococcus pluvialis: New opportunities for study of genomics of a non-sequenced species. J Phycol 39: 24-25.
Huang JC, Chen F, Sandmann G (2006a) Stress-related differential expression of multiple -carotene ketolase genes in the unicellular green alga Haematococcus pluvialis. J Biotechnol 122: 176-185.
Huang JC, Wang Y, Sandmann G, Chen F (2006b) Isolation and characterization of a carotenoid oxygenase gene from Chlorella zofingiensis (Chlorophyta). Appl Microbiol Biotechnol 71: 473-479.
Im CS, Grossman AR (2001) Identification and regulation of high light-induced genes in Chlamydomonas reinhardtii. Plant J 30: 301-313.
Ip PF, Chen F (2005) Production of astaxanthin by the green microalga Chlorella zofingiensis in the dark. Process Biochem 40: 733–738.
Ishikawa E, Abe H (2004) Lycopene accumulation and cyclic carotenoid deficiency in heterotrophic Chlorella treated with nicotine. J Ind Microbiol Biotechnol 31: 585-589.
Bibliography
146
Jacobson GK, Jolly SO, Sedmark JJ, Skatrud TJ, Wasileski JM (2000) Astaxanthin over-producing strains of Phaffia rhodozyma. Method for their cultivation and their use in animal feeds. US Patent 6,015,684.
Jayaraj J, Devlin R, Punja Z (2008) Metabolic engineering of novel ketocarotenoid production in carrot plants. Transgenic Res 17: 489–501.
Jin E, Lee CG, Polle JEW (2006) Secondary carotenoid accumulation in Haematococcus (Chlorophyceae): biosynthesis, regulation, and biotechnology. J Microbiol Biotechnol 16: 821-831.
Jin ES, Feth B, Melis A (2003a) A mutant of the green alga Dunaliella salina constitutively accumulates zeaxanthin under all growth conditions. Biotechnol Bioeng 81: 115– 124.
Jin ES, Polle JEW, Lee HK, Hyun SM, Chang M (2003b) Xanthophylls in microalgae: From biosynthesis to biotechnological mass production and application. J Microbiol Biotechnol 13: 165–174.
Johnson EA, An GH (1991) Astaxanthin from microbial sources. Critical Rev Biotechnol 11: 297-326.
Johnson EJ (2002) The role of carotenoids in human health. Nutr Clin Care 5: 56–65.
Jorgensen K, Skibsted L (1993) Carotenoid scavenging radicals. Effect of carotenoid structure and oxygen partial pressure on antioxidative activity. Z Lebensm Unters Forsch 196: 423–429.
Julio CB, José HP, Igor BV, Giovanni CDS, Johnny RO, Carlos HIR, Mario SP, Luiz AB, Diogenes SS, Walter FDA (2006) Phosphate closes the solution structure of the 5-enolpyruvylshikimate-3-phosphate synthase (EPSPS) from Mycobacterium tuberculosis. Archives of Biochemistry and Biophysics 452: 156-164.
Jung S (2004). Effect of chlorophyll reduction in Arabidopsis thaliana by methyl jasmonate or norflurazon on antioxidant systems. Plant Physiol Biochem 42: 225–231.
Kakizono T, Kobayashi M, Nagai S (1992) Effect of carbon/nitrogen ratio on encystment accompanied with astaxanthin formation in a green alga, Haematococcus pluvialis. J Ferment Bioeng 74: 403-405.
Kang CD, Lee JS, Park TH, Sim SJ (2005) Comparison of heterotrophic and photoautotrophic induction on astaxanthin production by Haematococcus pluvialis. Appl Microbiol Biotechnol 68: 237–241.
Kanz T, Bold HC (1969) Physiological Studies. 9. Morphological and taxonomic investigations of Nostoc and Anabaena in culture., Univ. of Texas publ. No. 6924, Univ. of Texas, Austin, TX.
Bibliography
147
Kato K, Ishikura K, Kasai S, Shinmyo A (2006) Efficient Translation Destabilizes Transcripts in Chloroplasts of Chlamydomonas reinhardtii. J Biosci Bioeng 101: 471–477.
Kim J-D, Lee W-S, Kim B, Lee C-G (2006) Proteomic analysis of protein expression patterns associated with astaxanthin accumulation by green alga Haematococcus pluvialis (Chlorophyceae) under high light stress. J Microbiol Biotechnol 16: 1222-1228.
Kindle KL (1987) Expression of a gene for a light-harvesting chlorophyll a/b-binding protein in Chlamydomonas reinhardtii: effect of light and acetate. Plant Mol Biol 9: 547-563.
Kitahara T (1984) Carotenoids in the Pacific salmon during the marine period. Comp Biochem Physiol 78B: 859–862.
Kitajima K, Hogan KP (2003) Increases of chlorophyll a/b ratios during acclimation of tropical woody seedlings to nitrogen limitation and high light. Plant Cell Environ 26: 857–865.
Kobayashi M (2000) In vivo antioxidant role of astaxanthin under oxidative stress in the green alga Haematococcus pluvialis. Appl Microbiol Biotechnol 54: 550-555.
Kobayashi M, Hirai N, Kurimura Y, Ohigashi H, Tsuji Y (1997c) Abscisic acid-dependent algal morphogenesis in the unicellular green alga Haematococcus pluvialis. Plant Growth Reg 22: 79–85.
Kobayashi M, Kakizono T, Nagai S (1991) Astaxanthin production by a green alga Haematococcus pluvialis accompanied with morphological changes in acetate media. J Ferment Bioeng 71: 335-339.
Kobayashi M, Kakizono T, Nagai S (1993) Enhanced carotenoid biosynthesis by oxidative stress in acetate-induced cyst cells of a green unicellular alga, Haematococcus pluvialis. Appl Environ Microbiol 59: 867-873.
Kobayashi M, Kakizono T, Yamaguchi K, Nishio N, Nagai S (1992) Growth and astaxanthin formation of Haematococcus pluvialis in heterotrophic and mixotrophic conditions. J Ferment Bioeng 74: 17-20.
Kobayashi M, Kurimura Y, Sakamoto Y, Tsuji Y (1997a) Selective extraction of astaxanthin and chlorophyll from the green alga Haematococcus pluvialis. Biotechnol Tech 11: 657-660.
Kobayashi M, Kurimura Y, Tsuji Y (1997b) Light-independent, astaxanthin production by the green microalga Haematococcus pluvialis under salt stress. Biotechnol Lett 19: 507-509.
Kovacs L, Wiessner W, Kis M, Nagy F, Mende D, Demeter S (2000) Short- and long-
Bibliography
148
term redox regulation of photosynthetic light energy distribution and photosystem stoichoimetry by acetate metabolism in the green alga, Chlamydobotrys stellata. Photosynth Res 65: 231–247.
Krishna KB, Mohanty P (1998) Secondary carotenoid production in green algae. J Sci Ind Res 57: 51-63.
Kujat SL, Owttrim GW (2000) Redox-regulated RNA helicase expression. Plant Physiol 124: 703–714.
Kurashige M, Okimasu E, Inoue M, Utsumi K (1990) Inhibition of oxidative injury of biological membranes by astaxanthin. Physiol Chem Phys and Med NMR 22: 27-38.
La Rocca N, Barbato R, Dalla Vecchia F, Rascio N (2000) Cab gene expression in bleached leaves of carotenoid-deficient maize. Photosynth Res 64:119–126.
La Rocca N, Rascio N, Oster U, Rüdiger W (2001) Amitrole treatment of etiolated barley seedlings leads to deregulation of tetrapyrrole synthesis and to reduced expression of Lhc and RbcS genes. Planta 213: 101–108.
Lang NJ (1968) Electron microscopic studies of extraplastidic astaxanthin in Haematococcus. J Phycol 4: 12-19.
Lee JH, Lee SJ, Choi YH, Chung KT, Jeong YK, Choi BT (2006) Effects of mycelial culture of Phellinus linteus on ethanol-induced gastric ulcer in rats. Phytotherapy Res 20: 396–402.
Lee KS, Meyers SP, Hebert JA (1986) Evaluation of crawfish astaxanthin as a natural red pigmenter of egg yolk. Poultry Sci 65: 177–178.
Lee YK, Ding SY (1994) Cell cycle and accumulation of astaxanthin in Haematococcus lacustris (Chlorophyta). J Phycol 30: 445-448.
Leister D (2005) Genomics-based dissection of the cross-talk of chloroplasts with the nucleus and mitochondria in Arabidopsis. Gene 354: 110-116.
Leon P, Arroyo A, Mackenzie S (1998) Nuclear control of plastid and mitochondrial development in higher plants. Ann Rev Plant Physiol Plant Mol Biol 49: 453–480.
Léon R, Couso I, Ferńandez E (2007) Metabolic engineering of ketocarotenoids biosynthesis in the unicelullar microalga Chlamydomonas reinhardtii. J Biotechnol 130: 143–152.
Lers A, Biener Y, Zamir A (1990) Photoinduction of massive β-carotene accumulation by the alga Dunaliella bardawil. Plant Physiol 93: 389-395.
Li H, Sherman L (2000) A redox-responsive regulator of photosynthesis gene expression in the cyanobacterium Synechocystis sp. strain PCC 6803. J
Bibliography
149
Bacteriol 182: 4268–4277.
Li Y, Huang J, Sandmann G, Chen F (2008a) Glucose sensing and the mitochondrial alternative pathway are involved in the regulation of astaxanthin biosynthesis in the dark-grown Chlorella zoffingiensis (Chlorophyceae). Planta DOI 10.1007/s00425-008-0775-4.
Li Y, Sommerfeld M, Chen F, Hu Q (2008b) Consumption of oxygen by astaxanthin biosynthesis: A protective mechanism against oxidatative stress in Haematococcus pluvialis (Chlorophyceae). J Plant Physiol 165: 1783 – 1797.
Liang P, Pardee AB (1992) Differential display of eukaryotic mRNA by means of the polymerase chain reaction. Science 257: 967-971.
Lichtenthaler HK (1987) Chlorophylls and carotenoids: pigments of photosynthetic biomembranes. Meth Enzymol 148:350-382.
Lichtenthaler HK (1999) The 1-deoxy-D-xylulose-5-phosphate pathway of isoprenoid biosynthesis in plants. Annu Rev Plant Physiol Plant Mol Biol 50: 47-65.
Lichtenthaler HK, Rohmer M, Schwender J (1997) Two independent biochemical pathways for isopentenyl diphosphate and isoprenoid biosynthesis in higher plants. Physiol Plant 101: 643–652.
Linden H (1999) Carotenoid hydroxylase from Haematococcus pluvialsis: cDNA sequence, regulation and functional complementation. Biochem Biophys Acta 1446: 203-212.
Lindgren LO, Stalberg KG, Hoglund AS (2003) Seed-specific overexpression of an endogenous Arabidopsis phytoene synthase gene results in delayed germination and increased levels of carotenoids, chlorophyll, and abscisic acid. Plant Physiol 132: 779–785.
Lorenz T, Cysewski GR (2000) Commercial potential for Haematococcus microalgae as a natural source of astaxanthin. Trends Biotechnol 18: 160-167.
Lotan T, Hirschberg J (1995) Cloning and expression in Escherichia coli of the gene encoding -C-4-oxygenase, that converts -carotene to the ketocarotenoid canthaxanthin in Haematococcus pluvialis. FEBS Letters 364: 125-128.
Lowry OH, Rosebrough NJ, Farr AL, Randall RJ (1951) Protein measurement with folin phenol reagent. J Biol Chem 193: 269–275.
Lubian LM, Montero O, Moreno-Garrido I, Huertas IE, Sobrino C, Valle MG, Pares G (2000) Nannochloropsis (Eustigmatophyceae) as source of commercially valuable pigments. J Appl Phycol 12: 249–255.
Mallick N (2004) Copper-induced oxidative stress in the chlorophycean microalga Chlorella vulgaris: response of the antioxidant system. J Plant Physiol 161: 591–597.
Bibliography
150
Mann V, Harker M, Pecker I, Hirschberg J (2000) Metabolic engineering of astaxanthin production in tobacco flowers. Nat Biotechnol 18: 888–892.
Margalith PZ (1999) Production of ketocarotenoids by microalgae. Appl Microbiol Biotechnol 51: 431-438.
Masojídek J, Kopecký J, Koblížek M, Torzillo G (2004) The xanthophyll cycle in green algae (Chlorophyta): its role in the photosynthetic apparatus. Plant Biol 6: 342-349.
Maxwell DP, Laudenbach DE, Huner NPA (1995) Redox regulation of light-harvesting complex II and cab mRNA abundance in Dunaliella salina. Plant Physiol 109: 787–795.
Meyers SP, Bligh D (1981) Characterization of astaxanthin pigments from heat processed crawfish waste. J Agric Food Chem 3: 505–508.
Miao F, Lu D, Li Y, Zeng M (2006) Characterization of astaxanthin esters in Haematococcus pluvialis by liquid chromatography-atmospheric pressure chemical ionization mass spectrometry. Anal Biochem 352: 176-181.
Miki W (1991) Biological functions and activities of carotenoids. Pure Appl Chem 63: 141–146.
Miura Y, Kondo K, Saito T, Shimada H, Fraser PD, Misawa N (1998) Production of the carotenoids lycopene, β-carotene, and astaxanthin in the food yeast Candida utilis. Appl Environ Microbiol 64: 1226–1229.
Miyamoto K, Tanaka R, Teramoto H, Masuda T, Tsuji H, Inokuchi H (1994) Nucleotide Sequences of cDNA Clones Encoding Ferrochelatase from Barley and Cucumber. Plant Physiol 105: 769-770.
Mogen K, Eide J, Duysen M, Eskins K (1990) Chloramphenicol stimulates the accumulation of light-harvesting chlorophyll a/b protein II by affecting posttranscriptional events in the chlorina CD3 mutant wheat. Plant Physiol 92: 1233-1240.
Montsant A, Zarka, Boussiba S (2001) Presence of a nonhydrolyzable biopolymer in the cell wall of vegetative cells and astaxanthin-rich cysts of Haematococcus pluvialis (Chlorophyceae). Marine Biotechnol 3: 515-521.
Morris WL, Ducreux LJM, Fraser PD, Millam S, Taylor MA (2006) Engineering ketocarotenoid biosynthesis in potato tubers. Metab Eng 8: 253-263.
Muller P, Li XP, Niyogi KK (2001) Non-photochemical quenching. A response to excess light energy. Plant Physiol 125: 1558–1566.
Murillo E (1992) Hypercholesterolemic effect of canthaxanthin and astaxanthin in rats. Arch Latinoam Nutr 42: 409–413.
Bibliography
151
Murthy KNC, Jayaprakasha GK, Singh RP (2002) Studies on antioxidant activity of Pomegranate (Punica granatum) peel extracts using in vivo models. J Agric Food Chem 50: 4791-4795.
Neils HJ, Leenheer AP (1991) Microbial sources of carotenoid pigments uses in foods and feeds. J Appl Bacteriol 70: 181–191.
O’Connor I, O’Brien N (1998) Modulation of UV-A lightinduced oxidative stress by beta-carotene, lutein and astaxanthin in cultured fibroblasts. J Dermatol Sci 16: 226–230.
Oh H, Park Y, Park C (1999) A Mutated PtsG, the Glucose Transporter, Allows Uptake of D-Ribose. J Biol Chem 274: 14006–14011.
Orosa M, Herrero VC, Abald J (2001) Comparision of the accumulation of astaxanthin in Haematococcus pluvialis and other green microalgae under N-starvation and high light condition. Biotechnol Lett 23: 1079-1085.
Orosa M, Torres E, Fidalgo P, Abalde J (2000) Production and analysis of secondary carotenoids in green algae. J Appl Phycol 12: 553-556.
Orset S, Harker M, Tsavalos AJ, Rijo P, McGovern K, Young AJ (1995) Inhibition of Astaxanthin Synthesis in the Green Alga, Haematococcus pluvialis. Vol IV. Kluwer Academic Publishers.
Oswald O, Martin T, Dominy PJ, Graham IA (2001) Plastid redox state and sugars: Interactive regulators of nuclear-encoded photosynthetic gene expression. Proc Natl Acad Sci USA 98: 2047-2052.
Pelah D, Marton I, Wang W, Shoseyov O, Altman A, Cohen E (2004) Accumulation and protection activity of protease-resistant heat-stable proteins in Haematococcus pluvialis during high light and nitrogen starvation. J Appl Phycol 16: 153–155.
Pfander H (1987) Key to Carotenoids. 2nd edn, Birkhäuser Verlag, Basel
Pfannschmidt T (2003) Chloroplast redox signals: how photosynthesis controls its own genes. Trends Plant Sci 8: 33-41.
Pfannschmidt T, Nilsson A, Allen JF (1999) Photosynthetic control of chloroplast gene expression. Nature 397: 625–628.
Pfannschmidt T, Schütze K, Brost M, Oelmüller R (2001) A novel mechanism of nuclear photosynthesis gene regulation by redox signals from the chloroplast during photosystem stoichiometry adjustment. J Biol Chem 276: 36125–36130.
Polle JEW, Benemann JR, Tanaka A, Melis A (2000) Photosynthetic apparatus organization and function in the wild type and a chlorophyll b-less mutant of
Bibliography
152
Chlamydomonas reinhardtii. Dependence on carbon source. Planta 211: 335-344.
Price J, Laxmi A, Martin SKSt, Jang J-C (2004) Global Transcription Profiling Reveals Multiple Sugar Signal Transduction Mechanisms in Arabidopsis. Plant Cell 16: 2128–2150.
Pringsheim EG (1966) Nutritional requirements of Haematococcus pluvialis. J Phycol 2: 1-7.
Proctor WW (1957) Some controlling factors in the distribution of Haematococcus pluvialis. Ecol 38: 457-462.
Pulz O, Gross W (2004) Valuable products from biotechnology of microalgae. Appl Microbiol Biotechnol 65: 635-648.
Rabbani S, Beyer P, Lintig Jv, Hugueney P, Kleinig H (1998) Induced β-carotene synthesis driven by triacylglycerol deposition in the unicellular alga Dunaliella bardawil. Plant Physiol 116: 1239-48.
Ralley L, Fraser PD (2004) Metabolic engineering of ketocarotenoid formation in higher plants. Plant J 39: 477–486.
Ranby B, Rabek JF (1978) Singlet Oxygen, Wiley
Rao MV, Paliyath G, Ormrod DP, Murr DP, Watkins CB (1997) Influence of salicylic acid on H2O2 production, oxidative stress and H2O2 metabolizing enzymes. Plant Physiol 115: 137–149.
Renstrom B, Berger H, Liaaen-Jensen S (1981) Esterified, optically pure (3S, 30S)-astaxanthin from flowers of Adonis annua. Biochem Syst Ecol 9: 249–250.
Řezanka T, Nedbalová L, Sigler K, Cepák V (2008) Identification of astaxanthin diglucoside diesters from snow alga Chlamydomonas nivalis by liquid chromatography–atmospheric pressure chemical ionization mass spectrometry. Phytochemistry 69: 479-490.
Rodriguez-Amaya DB (2001) A guide to carotenoid analysis in foods. ILSI press, Washington DC.
Rodríguez-Concepción M, Boronat A (2002) Elucidation of the Methylerythritol Phosphate Pathway for Isoprenoid Biosynthesis in Bacteria and Plastids. A Metabolic Milestone Achieved through Genomics. Plant Physiol 130: 1079–1089.
Rohmer M (1999) The discovery of a mevalonate-independent pathway for isoprenoid biosynthesis in bacteria, algae and higher plants. Nat Prod Rep 16: 565–574.
Romer S, Fraser PD (2005) Recent advances in carotenoid biosynthesis, regulation and manipulation. Planta 221: 305-308.
Bibliography
153
Sagar AD, Horwitz BA, Elliott RC, Thompson WF, Briggs WR (1988) Light effects on several chloroplast components in norflurazon-treated pea seedlings. Plant Physiol 88: 340-347.
Sambrook J, Fritsch EF, Maniatis T (1989) Molecular Cloning Tome 1: A Laboratory Manual, second ed., Cold Spring Harbor Laboratory Press, Cold Spring Harbor, New York.
Sandmann G (2001) Genetic manipulation of carotenoid biosynthesis: strategies, problems and achievements. Trends Plant Sci 6: 14-17.
Santos MF, Mesquita JF (1984) Ultrastructural study of Haematococcus lacustris (Girod.) Rostafinsky (Volvocales) I. Some aspects of carotenogenesis. Cytologia 49: 215-228.
Sapozhnikov DI (1967) Chemical structure of carotenoids and their conversion in the plant cell. Usp Sovrem Biol 64:248-267.
Sarada R, Usha T, Ravishankar GA (2002) Influence of stress on astaxanthin production in Haematococcus pluvialis grown under different culture conditions. Process Biochem 37: 623-627.
Schell MA (1993) Molecular biology of the LysR family of transcriptional regulators. Annu Rev Microbiol 47: 597-626.
Schnurr G, Misawa N, Sandman G (1996) Expression, purification and properties of lycopene cyclase from Erwinia Uredovora. Biochem J 315: 869-874.
Schoefs B, Rmiki N, Rachadi J, Lemoine Y (2001) Astaxanthin accumulation in Haematococcus requires a cytochrome P450 hydroxylase and an active synthesis of fatty acids. FEBS Lett 5003: 125-128.
Shahidi F, Metusalach, Brown JA (1998) Carotenoid pigments in seafoods and aquaculture. Crit Rev Food Sci 38: 1-67.
Shahidi F, Synowiecki J (1991) Isolation and characterization of nutrients and value added products from snow crab (Chinoecetes opilio) and shrimp (Pandalus borealis) processing discards. J Agric Food Chem 39: 1527–1532.
Shewmaker CK, Sheehy JA, Daley M, Colburn S, Ke DY (1999) Seed-specific overexpression of phytoene synthase: increase in carotenoids and other metabolic effects. Plant J 20: 401–412.
Shi XM, Liu HJ, Zhang XW, Chen F (1999) Production of biomass and lutein by Chlorella protothecoides at various glucose concentrations in heterotrophic cultures. Process Biochem 34: 341–347.
Shimidzu N, Goto M, Miki W (1996) Carotenoids as singlet oxygen quenchers in marine organisms. Fisheries Sci 62: 134-137.
Bibliography
154
Simkin AJ, Breitenbach J, Kuntz M, Sandmann G (2000) In vitro and in situ inhibition of carotenoid biosynthesis in Capsicum annuum by bleaching herbicides. J Agric Food Chem 48: 4676–4680.
Simkin AJ, Moreau H, Kuntz M, Pagny G, Lin C, Tanksley S, McCarthy J (2008) An investigation of carotenoid biosynthesis in Coffea canephora and Coffea arabica. J Plant Physiol 165: 1087 – 1106.
Simkin AJ, Zhu C, Kuntz M, Sandmann G (2003) Light-dark regulation of carotenoid biosynthesis in pepper (Capsicum annuum) leaves. J Plant Physiol 160: 439-443.
Simpson KL, Katayama T, Chichester CO (1981) Carotenoids from microorganisms. In Carotenoids as colorants and vitamin A precursors (Bauernfeld JC ed.), Academic Press, London, pp. 463-480.
Spolaore P, Joannis-Cassan C, Duran E, Isambert A (2006) Commercial applications of microalgae. J Biosci Bioeng 101: 87-96.
Stahl W, Sies H (2005) Bioactivity and protective effects of natural carotenoids. Biochim Biophys Acta 1740: 101–107.
Stalberg KG, Lindgren LO, Ek B, Hoglund AS (2003) Synthesis of ketocarotenoids in the seed of Arabidopsis thaliana. Plant J 36: 771–779.
Steinbrenner J, Linden H (2001) Regulation of two carotenoid biosynthesis genes coding for phytoene synthase and carotenoid hydroxylase during stress-induced astaxanthin formation in the green alga Haematococcus pluvialis. Plant Physiol 125: 810-817.
Steinbrenner J, Linden H (2003) Light induction of carotenoid biosynthesis genes in the green alga Haematococcus pluvialis: Regulation by photosynthetic redox control. Plant Mol Biol 52: 343-356.
Steinbrenner J, Sandmann G (2006) Transformation of the green alga Haematococcus pluvialis with a phytoene desaturase for accelerated astaxanthin biosynthesis. Appl Environ Microbiol 72: 7477–7484.
Steven DM (1948) Studies on animal carotenoids. I. Carotenoids of the brown trout (Salmo trutta Linn.). J Exp Biol 25: 369.
Stockigt J, Oblitz P, Falkenhagen H, Lutterbach R, Endeß S (1995) Natural products and enzymes from plant cell cultures. Plant Cell Tissue Org Cult 43: 97–109.
Storebakken T, Foss P, Austreng E, Liaaen-Jensen S (1985) Carotenoids in diets for salmonids. II. Epimerization studies with astaxanthin in Atlantic salmon. Aquaculture 44: 259-269.
Straub O (1987) List of carotenoids. In: Pfander H (ed.) Key to carotenoids (2nd ed.). Birkhauser Verlag, Basel, pp 11–296.
Bibliography
155
Sudha G, Ravishankar GA (2003) Influence of methyl jasmonate and salicylic acid in the enhancement of capsaicin production in cell suspension cultures of Capsicum frutescens Mill. Current Sci 85: 1212-1217.
Sun N, Wang Y, Li Y-T, Huang J-C, Chen F (2008) Sugar-based growth, astaxanthin accumulation and carotenogenic transcription of heterotrophic Chlorella zofingiensis (Chlorophyta). Process Biochem 43: 1288–1292.
Sun Z, Cunningham FX, Gantt E (1998) Differential expression of two isopentenyl pyrophosphate isomerases and enhanced carotenoid accumulation in a unicellular chlorophyte. Proc Natl Acad Sci USA 95: 11482-11488.
Sun Z, Gantt E, Cunningham FX (1996) Cloning and functional analysis of the β-carotene hydroxylase of Arabidopsis thaliana. J Biol Chem 271: 24349- 24352.
Suseela MR, Toppo K (2006) Haematococcus pluvialis – A green alga, richest natural source of astaxanthin. Current Sci 90: 1602 – 1603.
Tan S, Cunningham FX, Youmans M, Grabowski B, Sun Z, Gantt E (1995) Cytochrome f loss in astaxanthin-accumulating red cells of Haematococcus pluvialis (Chlorophyceae): Comparision of photosynthetic activity, photosynthetic enzymes, and thylakoid membrane polypeptides in red and green cells. J Phycol 31: 897-905.
Tarakhovskaya ER, Maslov YI, Shishova MF (2007) Phytohormones in Algae. Russian J Plant Physiol 54: 163–170.
Teramoto H, Nakamori A, Minagawa J, Ono T (2002) Light-Intensity-Dependent Expression of Lhc Gene Family Encoding Light-Harvesting Chlorophyll-a/b Proteins of Photosystem II in Chlamydomonas reinhardtii. Plant Physiol 130: 325-333.
Teramoto H, Itoh T, Ono T (2004) High-intensity-light-dependent and transient expression of new genes encoding distant relatives of light-harvesting chlorophyll-a/b proteins in Chlamydomonas reinhardtii. Plant Cell Physiol 45: 1221-1232.
Terao J (1989) Antioxidant activity of beta-carotene related carotenoids in solution. Lipids 24: 659–662.
Tonkyn JC, Deng X-W, Gruissem W (1992) Regulation of plastid gene expression during photooxidative stress. Plant Physiol 99: 1406–1415.
Torzillo G, Goksan T, Isik O, Gokpinar S (2005) Photon irradiance required to support optimal growth and interrelations between irradiance and pigment composition in the green alga Haematococcus pluvialis. Eur J Phycol 40: 233–240.
Bibliography
156
Trebst A (1980) Inhibitors in electron flow: tools for the functional and structural localization of carriers and energy conservation sites. Meth Enzymol 69: 675–715.
Triki A, Maillard P, Gudin C (1997) Gametogenesis in Haematococcus pluvialis Flowtow (Volvocales, Chlorophyta). Phycologia 36: 190-194.
Tsubokura A, Yoneda H, Mizuta H (1999) Paracoccus carotinifaciens sp. nov., a new aerobic Gram-negative astaxanthin-producing bacterium. Int J Systematic Bacteriol 49: 277–282.
Tullberg A, Alexceiv K, Pfannschmidt T, Allen JF (2000) Photosynthetic electron flow regulates transcription of the psaB gene in pea (Pisum sativum L.) chloroplasts through redox state of the plastoquinone pool. Plant Cell Physiol 41: 1045–1054.
Ueda J, Miyamoto K, Aoki M, Hirata T, Sato T, Momotani Y (1991) Identification of jasmonic acid from Euglena gracilis Z as a plant growth regulator. Bulletin of the University of Osaka Prefecture, Series B: Agriculture and Biology 43: 103–108.
Usha T (2000) Studies on production af astaxanthin from green alga-Haematococcus pluvialis. Ph.D. thesis, University of Mysore, Mysore.
Usha T, Sarada R and Ravishankar GA (2001). A culture method for microalgal forms using two-tier vessel providing carbon- dioxide environment: Studies on growth and carotenoid production. World J Microbiol Biotechnol 17: 325-329.
Uzunova AN, Popova LP (2000) Effect of salicylic acid on leaf anatomy and chloroplast ultra structure of barley plants. Photosynthetica 38: 243-250.
van Kooten O, Snel JFH (1990) The use of chlorophyll fluorescence nomenclature in plant stress physiology. Photosynth Res 25: 147–150.
Vidhyavathi R, Venkatachalam L, Kamath BS, Sarada R, Ravishankar GA (2007) Differential expression of carotenogenic genes and associated changes in pigment profile during regeneration of Haematococcus pluvialis cysts. Appl Microbiol Biotechnol 75: 879-887.
Vidhyavathi R, Venkatachalam L, Sarada R, Ravishankar GA (2008) Regulation of carotenoid biosynthetic genes expression and carotenoid accumulation in the green alga Haematococcus pluvialis under nutrient stress conditions. J Exp Bot 59: 1409-1418.
Vishnevetsky M, Ovadis M, Itzhaki H, Vainstein A (1997) CHRC, encoding a chromoplast-specific carotenoid-associated protein, is an early gibberellic acid-responsive gene. J Biol Chem 272: 24747-24750.
Vranová E, Atichartpongkul S, Villarroel R, Montagu MV, Inzé D, and Camp WV
Bibliography
157
(2002) Comprehensive analysis of gene expression in Nicotiana tabacum leaves acclimated to oxidative stress. Proc Natl Acad Sci USA 99: 10870-10875.
Walia H, Wilson C, Condamine P, Liu X, Ismail AM, Close TJ (2007) Large scale expression profiling and physiological characterization of jasmonic acid-mediated adaptation of barley to salinity stress. Plant Cell Environ 30: 410-421.
Walsh MC, Klopfenstein WE, Harwood JL (1990) The short chain condensing enzyme has a widespread occurrence in the fatty acid synthetases from higher plants. Phytochem 29: 3797–3799.
Wang S-B, Chen F, Sommerfeld M, Hu Q (2004a) Proteomic analysis of molecular response to oxidative stress by the green alga Haematococcus pluvialis (Chlorophyceae). Planta 220: 17-29.
Wang S-B, Chen F, Sommerfeld M, Hu Q (2005) Isolation and proteomic analysis of cell wall-deficient Haematococcus pluvialis mutants. Proteomics 5: 4839–4851.
Wang S-B, Hu Q, Sommerfeld M, Chen F (2003a) An optimized protocol for isolation of soluble proteins from microalgae for two-dimensional gel electrophoresis analysis. J Appl Phycol 15: 485–496.
Wang S-B, Hu Q, Sommerfeld M, Chen F (2004b) Cell wall proteomics of the green alga Haematococcus pluvialis (Chlorophyceae). Proteomics 4: 692-708.
Wang S-B, Zarka A, Trebst A, Boussiba S (2003b) Astaxanthin accumulation in Haematococcus pluvialis (Chlorophyceae) as an active photoprotective process under high irradiance. J Phycol 39: 1116-1124.
Weedon BCL, Moss GP (1995) Structure and nomenclature, in Carotenoids. Vol 1A. Isolation and analysis. Britton G, Liaan-Jensen S, Pfander H (Eds.). Birkhaüser Verlag, Basel, 1995, chap. 3.
Wei L, Cao Y, Bai L, Liang X, Deng T, Li J, Qiao D (2007) Cloning and expression of a gene coding for the major light-harvesting chlorophyll a/b protein of photosystem II in the green alga Dunaliella salina. J Appl Phycol 19: 89-94.
Wetzel CM, Rodermel SR (1998) Regulation of phytoene desaturase expression is independent of leaf pigment content in Arabidopsis thaliana. Plant Mol Biol 37: 1045-1053.
Whitelam GC, Codd GA (1982) A rapid whole-cell assay for superoxide dismutase. Anal Biochem 121: 207-212.
Xu R, Bingham SE, Webber AN (1993) Increased mRNA accumulation in a psaB frame-shift mutant of Chlamydomonas reinhardtii suggests a role for
Bibliography
158
translation in psaB mRNA stability. Plant Mol Biol 22: 465–474.
Yan Y, Zhu Y, Jiang JG, Song DL (2005) Cloning and sequence analysis of the phytoene synthase gene from a unicellular chlorophyte, Dunaliella salina. J Agric Food Chem 53: 1466-1469.
Ye X, Al-Babili S, Klöti A, Zhang J, Lucca P, Beyer P, Potrykus I (2000) Engineering the provitamin A (beta-carotene) biosynthetic pathway into (carotenoid-free) rice endosperm. Science 287: 303-305.
Yokoyama A, Adachi K, Shizuri Y (1995) New carotenoid glucosides, astaxanthin glucoside and adonixanthin glucoside, isolated from the astaxanthin-producing marine bacterium, Agrobacterium aurantiacum. Journal of Natural Products 58: 1929-1933.
Yong YYR, Lee YK (1991) Do carotenoids play a photoprotective role in the cytoplasm of Haematococcus lacustris (Chlorophyta)? Phycologia 30: 257-261.
Yuan JP, Chen F (1998) Chromatographic separation and purification of trans-astaxanthin from the extracts of Haematococcus pluvialis. J Agric Food Chem 46: 3371–3375.
Yuan JP, Chen F (2000) Purification of trans-astaxanthin from a high yielding astaxanthin ester-producing strain of the microalga Haematococcus pluvialis. Food Chem 68: 443–448.
Zaim J, Kierzek AM (2003) The structure of full-length LysR-type transcriptional regulators. Modeling of the full-length OxyR transcription factor dimer. Nucleic Acids Research 31: 1444-1454.
Zechmeister L (1962) Cis-Trans Isomeric Carotenoids, Vitamin A and Arylpolyenes. Academic Press, New York.
Zhang CK, Lang P, Dane F, Ebel RC, Singh NK, Locy RD and Dozier WA (2005) Cold acclimation induced genes of trifoliate orange (Poncirus trifoliata). Plant Cell Rep 23: 764-769.
Zhang DH, Lee YK, Ng ML, Phang SM (1997) Composition and accumulation of secondary carotenoids in Chlorococcum sp. J Appl Phycol 9: 147–155.
Zhekisheva M, Boussiba S, Khozin-Goldberg I, Zarka A, Cohen Z (2002) Accumulation of oleic acid in Haematococcus pluvialis (Chlorophyceae) under nitrogen starvation or high light is correlated with that of astaxanthin esters. J Phycol 38: 325-331.
Zhekisheva M, Zarka A, Khozin-Goldberg I, Cohen Z, Boussiba S (2005) Inhibition of astaxanthin synthesis under high irradiance does not abolish triacylglycerol
Bibliography
159
accumulation in the green alga Haematococcus pluvialis (Chlorophyceae). J Phycol 41: 819-826.
Zhu YH, Jiang JG, Yan Y, Chen XW (2005) Isolation and characterization of phytoene desaturase cDNA involved in the β-carotene biosynthetic pathway in Dunaliella salina. J Agric Food Chem 53: 5593-5597.
Zlotnik IS, Sukenik A, Dubinsky Z (1993) Physiological and photosynthetic changes during the formation of red aplanospores in the chlorophyte Haematococcus pluvialis. J Phycol 29: 46.

Publications
Publications
160
Papers published
1. Vidhyavathi R, Venkatachalam L, Sarada R, Ravishankar GA (2008) Regulation of carotenoid biosynthetic genes expression and carotenoid accumulation in the green alga Haematococcus pluvialis under nutrient stress conditions. Journal of Experimental Botany 59 (6): 1409-1418.
2. Vidhyavathi R, Venkatachalam L, Kamath BS, Sarada R, Ravishankar GA (2007) Differential expression of carotenogenic genes and associated changes in pigment profile during regeneration of Haematococcus pluvialis cysts. Applied Microbiology and Biotechnology 75: 879-887.
3. Sarada R, Vidhyavathi R, Usha T, Ravishankar GA (2006) An efficient method for extraction of astaxanthin from green alga Haematococcus pluvialis Journal of Agricultural and Food Chemistry 54: 7585-7588.
4. Sandesh Kamath B, Vidhyavathi R, Sarada R, Ravishankar GA (2008) Enhancement of carotenoids by mutation and stress induced carotenogenic genes in Haematococcus pluvialis mutants. Bioresource Technology 99:8667–8673.
Patents
1. Vidhyavathi R, Sarada R, Sandesh Kamath B, Ravishankar GA. A method for production of contaminants free algal biomass-Haematococcus. 333/Del/2006
2. Sandesh Kamath B, Sarada R, Vidhyavathi R, Ravishankar GA. A process for obtaining water dispersible astaxanthin composition. 712/Del/2007
Book Chapters
1. Sarada R, Vidhyavathi R and Ravishankar GA (2008) Carotenoid production and characterization in cultured Haematococcus pluvialis. To be published in ‘Protocols on Algal Research’.
Manuscripts in pipeline
1. Vidhyavathi R, Sarada R, Ravishankar GA (2008) Differential expression of photosynthetic genes and their regulation during secondary carotenogenesis in Haematococus pluvialis.
2. Vidhyavathi R, Sarada R, Ravishankar GA (2008) Influence of carotenoid biosynthetic inhibitors on expression of carotenoid genes in Haematococus pluvialis.
3. Vidhyavathi R, Venkatachalam L, Sarada R, Ravishankar GA (2008) Identification and characterization of mRNA transcripts differentially expressed in
Publications
161
Haematococcus pluvialis during secondary carotenogenesis by differential display RT-PCR.
4. Vidhyavathi R, Sarada R (2008) Effect of salicylic acid and methyl jasmonate on antioxidant systems of Haematococcus pluvialis.
Papers presented in symposia / conferences
1. Vidhyavathi R, Sarada R and Ravishankar GA (2005) Nutrient stress induced accumulation of astaxanthin in Haematococcus pluvialis. Presented at 17th Indian Convention of Food Scientists and Technologists. NIMHANS convention centre, Bangalore. 9-10th December 2005. AP-27.
2. Sarada R, Sandesh Kamath B, Vidhyavathi R, Brinda BR, Ravishankar GA (2006) Astaxanthin production from green alga Haematococcus pluvialis under autotrophic and heterotrophic conditions. Presented at International Conference on Applied Phycology held during 14-15th February 2006.
3. Vidhyavathi R, Sarada R, Ravishankar GA (2007) Profile of carotenogenic genes expression and carotenoids during stress induced accumulation of astaxanthin in Haematococcus pluvialis. Poster presented at 8th Agricultural Science Congress, National Academy of Agricultural Sciences, STS-037 28pp, February 15th -17th held at TNAU, Coimbatore
4. Vidhyavathi R, Sarada R (2007) Effect of salicylic and methyl jasmonate on antioxidant systems of Haematococcus pluvialis. Presented at International Conference on New Horizons in Biotechnology (NHBT) held during November 26-29 in Trivandrum, India. FAB 018, 242pp
5. Vidhyavathi R, Sarada R, Ravishankar GA (2008) Identification and characterization of mRNA transcripts differentially expressed in response to high light by means of differential display in Haematococcus pluvialis Poster to be presented at a National Conference “Current Trends in Algal Biodiversity and Biotechnology” to held at CAS in Botany, University of Madras, Chennai from 7-8th February 2008

Appendix
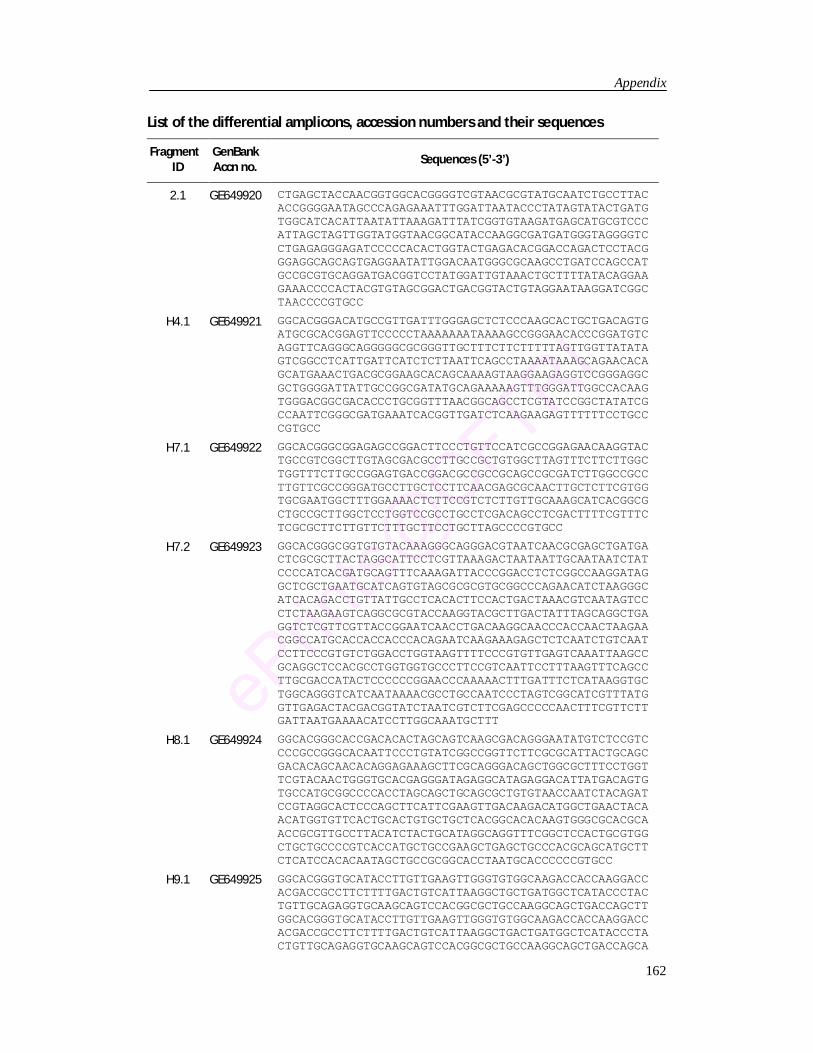
Appendix
162
List of the differential amplicons, accession numbers and their sequences
Fragment ID
GenBank Accn no.
Sequences (5’-3’)
2.1 GE649920 CTGAGCTACCAACGGTGGCACGGGGTCGTAACGCGTATGCAATCTGCCTTACACCGGGGAATAGCCCAGAGAAATTTGGATTAATACCCTATAGTATACTGATGTGGCATCACATTAATATTAAAGATTTATCGGTGTAAGATGAGCATGCGTCCCATTAGCTAGTTGGTATGGTAACGGCATACCAAGGCGATGATGGGTAGGGGTCCTGAGAGGGAGATCCCCCACACTGGTACTGAGACACGGACCAGACTCCTACGGGAGGCAGCAGTGAGGAATATTGGACAATGGGCGCAAGCCTGATCCAGCCATGCCGCGTGCAGGATGACGGTCCTATGGATTGTAAACTGCTTTTATACAGGAAGAAACCCCACTACGTGTAGCGGACTGACGGTACTGTAGGAATAAGGATCGGCTAACCCCGTGCC
H4.1 GE649921 GGCACGGGACATGCCGTTGATTTGGGAGCTCTCCCAAGCACTGCTGACAGTGATGCGCACGGAGTTCCCCCTAAAAAAATAAAAGCCGGGAACACCCGGATGTCAGGTTCAGGGCAGGGGGCGCGGGTTGCTTTCTTCTTTTTAGTTGGTTATATAGTCGGCCTCATTGATTCATCTCTTAATTCAGCCTAAAATAAAGCAGAACACAGCATGAAACTGACGCGGAAGCACAGCAAAAGTAAGGAAGAGGTCCGGGAGGCGCTGGGGATTATTGCCGGCGATATGCAGAAAAAGTTTGGGATTGGCCACAAGTGGGACGGCGACACCCTGCGGTTTAACGGCAGCCTCGTATCCGGCTATATCGCCAATTCGGGCGATGAAATCACGGTTGATCTCAAGAAGAGTTTTTTCCTGCCCGTGCC
H7.1 GE649922 GGCACGGGCGGAGAGCCGGACTTCCCTGTTCCATCGCCGGAGAACAAGGTACTGCCGTCGGCTTGTAGCGACGCCTTGCCGCTGTGGCTTAGTTTCTTCTTGGCTGGTTTCTTGCCGGAGTGACCGGACGCCGCCGCAGCCGCGATCTTGGCCGCCTTGTTCGCCGGGATGCCTTGCTCCTTCAACGAGCGCAACTTGCTCTTCGTGGTGCGAATGGCTTTGGAAAACTCTTCCGTCTCTTGTTGCAAAGCATCACGGCGCTGCCGCTTGGCTCCTGGTCCGCCTGCCTCGACAGCCTCGACTTTTCGTTTCTCGCGCTTCTTGTTCTTTGCTTCCTGCTTAGCCCCGTGCC
H7.2 GE649923 GGCACGGGCGGTGTGTACAAAGGGCAGGGACGTAATCAACGCGAGCTGATGACTCGCGCTTACTAGGCATTCCTCGTTAAAGACTAATAATTGCAATAATCTATCCCCATCACGATGCAGTTTCAAAGATTACCCGGACCTCTCGGCCAAGGATAGGCTCGCTGAATGCATCAGTGTAGCGCGCGTGCGGCCCAGAACATCTAAGGGCATCACAGACCTGTTATTGCCTCACACTTCCACTGACTAAACGTCAATAGTCCCTCTAAGAAGTCAGGCGCGTACCAAGGTACGCTTGACTATTTAGCAGGCTGAGGTCTCGTTCGTTACCGGAATCAACCTGACAAGGCAACCCACCAACTAAGAACGGCCATGCACCACCACCCACAGAATCAAGAAAGAGCTCTCAATCTGTCAATCCTTCCCGTGTCTGGACCTGGTAAGTTTTCCCGTGTTGAGTCAAATTAAGCCGCAGGCTCCACGCCTGGTGGTGCCCTTCCGTCAATTCCTTTAAGTTTCAGCCTTGCGACCATACTCCCCCCGGAACCCAAAAACTTTGATTTCTCATAAGGTGCTGGCAGGGTCATCAATAAAACGCCTGCCAATCCCTAGTCGGCATCGTTTATGGTTGAGACTACGACGGTATCTAATCGTCTTCGAGCCCCCAACTTTCGTTCTTGATTAATGAAAACATCCTTGGCAAATGCTTT
H8.1 GE649924 GGCACGGGCACCGACACACTAGCAGTCAAGCGACAGGGAATATGTCTCCGTCCCCGCCGGGCACAATTCCCTGTATCGGCCGGTTCTTCGCGCATTACTGCAGCGACACAGCAACACAGGAGAAAGCTTCGCAGGGACAGCTGGCGCTTTCCTGGTTCGTACAACTGGGTGCACGAGGGATAGAGGCATAGAGGACATTATGACAGTGTGCCATGCGGCCCCACCTAGCAGCTGCAGCGCTGTGTAACCAATCTACAGATCCGTAGGCACTCCCAGCTTCATTCGAAGTTGACAAGACATGGCTGAACTACAACATGGTGTTCACTGCACTGTGCTGCTCACGGCACACAAGTGGGCGCACGCAACCGCGTTGCCTTACATCTACTGCATAGGCAGGTTTCGGCTCCACTGCGTGGCTGCTGCCCCGTCACCATGCTGCCGAAGCTGAGCTGCCCACGCAGCATGCTTCTCATCCACACAATAGCTGCCGCGGCACCTAATGCACCCCCCGTGCC
H9.1 GE649925 GGCACGGGTGCATACCTTGTTGAAGTTGGGTGTGGCAAGACCACCAAGGACCACGACCGCCTTCTTTTGACTGTCATTAAGGCTGCTGATGGCTCATACCCTACTGTTGCAGAGGTGCAAGCAGTCCACGGCGCTGCCAAGGCAGCTGACCAGCTTGGCACGGGTGCATACCTTGTTGAAGTTGGGTGTGGCAAGACCACCAAGGACCACGACCGCCTTCTTTTGACTGTCATTAAGGCTGACTGATGGCTCATACCCTACTGTTGCAGAGGTGCAAGCAGTCCACGGCGCTGCCAAGGCAGCTGACCAGCA
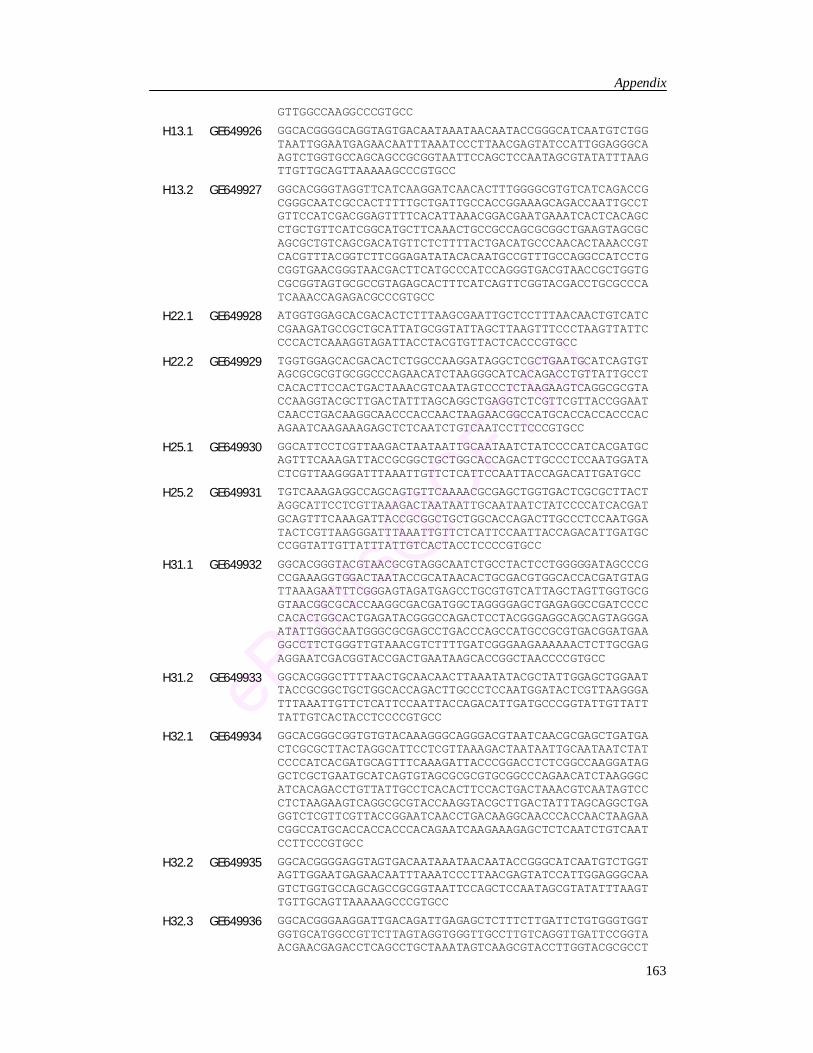
Appendix
163
GTTGGCCAAGGCCCGTGCC
H13.1 GE649926 GGCACGGGGCAGGTAGTGACAATAAATAACAATACCGGGCATCAATGTCTGGTAATTGGAATGAGAACAATTTAAATCCCTTAACGAGTATCCATTGGAGGGCAAGTCTGGTGCCAGCAGCCGCGGTAATTCCAGCTCCAATAGCGTATATTTAAGTTGTTGCAGTTAAAAAGCCCGTGCC
H13.2 GE649927 GGCACGGGTAGGTTCATCAAGGATCAACACTTTGGGGCGTGTCATCAGACCGCGGGCAATCGCCACTTTTTGCTGATTGCCACCGGAAAGCAGACCAATTGCCTGTTCCATCGACGGAGTTTTCACATTAAACGGACGAATGAAATCACTCACAGCCTGCTGTTCATCGGCATGCTTCAAACTGCCGCCAGCGCGGCTGAAGTAGCGCAGCGCTGTCAGCGACATGTTCTCTTTTACTGACATGCCCAACACTAAACCGTCACGTTTACGGTCTTCGGAGATATACACAATGCCGTTTGCCAGGCCATCCTGCGGTGAACGGGTAACGACTTCATGCCCATCCAGGGTGACGTAACCGCTGGTGCGCGGTAGTGCGCCGTAGAGCACTTTCATCAGTTCGGTACGACCTGCGCCCATCAAACCAGAGACGCCCGTGCC
H22.1 GE649928 ATGGTGGAGCACGACACTCTTTAAGCGAATTGCTCCTTTAACAACTGTCATCCGAAGATGCCGCTGCATTATGCGGTATTAGCTTAAGTTTCCCTAAGTTATTCCCCACTCAAAGGTAGATTACCTACGTGTTACTCACCCGTGCC
H22.2 GE649929 TGGTGGAGCACGACACTCTGGCCAAGGATAGGCTCGCTGAATGCATCAGTGTAGCGCGCGTGCGGCCCAGAACATCTAAGGGCATCACAGACCTGTTATTGCCTCACACTTCCACTGACTAAACGTCAATAGTCCCTCTAAGAAGTCAGGCGCGTACCAAGGTACGCTTGACTATTTAGCAGGCTGAGGTCTCGTTCGTTACCGGAATCAACCTGACAAGGCAACCCACCAACTAAGAACGGCCATGCACCACCACCCACAGAATCAAGAAAGAGCTCTCAATCTGTCAATCCTTCCCGTGCC
H25.1 GE649930 GGCATTCCTCGTTAAGACTAATAATTGCAATAATCTATCCCCATCACGATGCAGTTTCAAAGATTACCGCGGCTGCTGGCACCAGACTTGCCCTCCAATGGATACTCGTTAAGGGATTTAAATTGTTCTCATTCCAATTACCAGACATTGATGCC
H25.2 GE649931 TGTCAAAGAGGCCAGCAGTGTTCAAAACGCGAGCTGGTGACTCGCGCTTACTAGGCATTCCTCGTTAAAGACTAATAATTGCAATAATCTATCCCCATCACGATGCAGTTTCAAAGATTACCGCGGCTGCTGGCACCAGACTTGCCCTCCAATGGATACTCGTTAAGGGATTTAAATTGTTCTCATTCCAATTACCAGACATTGATGCCCGGTATTGTTATTTATTGTCACTACCTCCCCGTGCC
H31.1 GE649932 GGCACGGGTACGTAACGCGTAGGCAATCTGCCTACTCCTGGGGGATAGCCCGCCGAAAGGTGGACTAATACCGCATAACACTGCGACGTGGCACCACGATGTAGTTAAAGAATTTCGGGAGTAGATGAGCCTGCGTGTCATTAGCTAGTTGGTGCGGTAACGGCGCACCAAGGCGACGATGGCTAGGGGAGCTGAGAGGCCGATCCCCCACACTGGCACTGAGATACGGGCCAGACTCCTACGGGAGGCAGCAGTAGGGAATATTGGGCAATGGGCGCGAGCCTGACCCAGCCATGCCGCGTGACGGATGAAGGCCTTCTGGGTTGTAAACGTCTTTTGATCGGGAAGAAAAAACTCTTGCGAGAGGAATCGACGGTACCGACTGAATAAGCACCGGCTAACCCCGTGCC
H31.2 GE649933 GGCACGGGCTTTTAACTGCAACAACTTAAATATACGCTATTGGAGCTGGAATTACCGCGGCTGCTGGCACCAGACTTGCCCTCCAATGGATACTCGTTAAGGGATTTAAATTGTTCTCATTCCAATTACCAGACATTGATGCCCGGTATTGTTATTTATTGTCACTACCTCCCCGTGCC
H32.1 GE649934 GGCACGGGCGGTGTGTACAAAGGGCAGGGACGTAATCAACGCGAGCTGATGACTCGCGCTTACTAGGCATTCCTCGTTAAAGACTAATAATTGCAATAATCTATCCCCATCACGATGCAGTTTCAAAGATTACCCGGACCTCTCGGCCAAGGATAGGCTCGCTGAATGCATCAGTGTAGCGCGCGTGCGGCCCAGAACATCTAAGGGCATCACAGACCTGTTATTGCCTCACACTTCCACTGACTAAACGTCAATAGTCCCTCTAAGAAGTCAGGCGCGTACCAAGGTACGCTTGACTATTTAGCAGGCTGAGGTCTCGTTCGTTACCGGAATCAACCTGACAAGGCAACCCACCAACTAAGAACGGCCATGCACCACCACCCACAGAATCAAGAAAGAGCTCTCAATCTGTCAATCCTTCCCGTGCC
H32.2 GE649935 GGCACGGGGAGGTAGTGACAATAAATAACAATACCGGGCATCAATGTCTGGTAGTTGGAATGAGAACAATTTAAATCCCTTAACGAGTATCCATTGGAGGGCAAGTCTGGTGCCAGCAGCCGCGGTAATTCCAGCTCCAATAGCGTATATTTAAGTTGTTGCAGTTAAAAAGCCCGTGCC
H32.3 GE649936 GGCACGGGAAGGATTGACAGATTGAGAGCTCTTTCTTGATTCTGTGGGTGGTGGTGCATGGCCGTTCTTAGTAGGTGGGTTGCCTTGTCAGGTTGATTCCGGTAACGAACGAGACCTCAGCCTGCTAAATAGTCAAGCGTACCTTGGTACGCGCCT
Appendix
164
GACTTCTTAGAGGGACTATTGACGTTTAGTCAGTGGAAGTGTGAGGCAATAACAGGTCTGTGATGCCCTTAGATGTTCTGGGCCGCACGCGCGCTACACTGATGCATTCAGCGAGCCTATCCTTGGCCGAGAGGTCCGGGTAATCTTTGAAACTGCATCGTGATGGGGATAGATTATTGCAATTATTAGTCTTTAACGAGGAATGCCTAGTAAGCGCGAGTCATCAGCTCGCGTTGATTACGTCCCTGCCCTTTGTACACACCGCCCGTCGCTCCTACCGATTGGGTGTGCTGGTGAAGTGTTCGGATTGACTTCAGCGGTGGGCAACCTCTGCTGTCGTTGAGAAGATCATTAAACCCTCCCACCTAGAGAAAGGAGTAGTCGTAACAATGATCCCGTGCC
H34.1 GE649937 GGCACGGGAAGGATTGACAGATTGAGAGCTCTTTCTTGATTCTGTGGGTGGTGGTGCATGGCCGTTCTTAGTTGGTGGGTTGCCTTGTCAGGTTGATTCCGGTAACGAACGAGACCTCAGCCTGCTAAATAGTCAAGCGTACCTTGGTACGCGCCTGACTTCTTAGAGGGACTATTGACGTTTAGTCAGTGGAAGTGTGAGGCAATAACAGGTCTGTGATGCCCTTAGATGTTCTGGGCCGCACGCGCGCTACACTGATGCATTCAGCGAGCCTATCCTTGGCCGAGAGGTCCGGGTAATCTTTGAAACTGCATCGTGATGGGGATGGATTATTGCAATTATTAGTCTTTAACGAGGAATGCCTAGTAAGCGCGAGTCATCAGCTCGCGTTGATTACGTCCCTGCCCTTTGTACACACCGCCCCGCCCCGTGCC
H52.2 GE649938 TGGACGTCCACCACAGGTTGGCTCGGGGCCNAAGCAATAAACCTCATGTGCTGCTGAAGGTGGAACCTCCCAGCTTGCCTGTGCTGAACCACCTGTCCGTGTCCGTGCTGTGTTGAGCGTGCCTGTGTTGGTGGAACCAGCAAGCTGAGCTGAGCAAGCTGACCAGGAGCCAGGTACAGGAACCAAACCACTGTACCTACTACACGTCTGCCATGCATGTACGTGGTGCCGATGATGTGTGTATGGTCGTGATTAGCCACACGGGTTTGGATGGTTCGTTGGCATGAACAATGCACTGTATAGCTTATCACTGGTTGAGTGTAAAACTGATACGGTAAAAAAAAAAAGCTTA
H53.1 GE649939 TTTGGCACGGGCACACACACCAGAAGGCTGAGCTGAAGTGGGCAATAGGCTCACTGTCGGTAGCCTTTACAATGATGAGCTTGCAGCCAGGTTCGATTCCAACTCATGATTTATTTTGGTGTAGCATGAGGGCTGTGGGGTTCAGGAGTTGGTTCCGGATGTTTTTGTGGTGGGTTTGAAAGTGAGCGTTGGTAAAAAAAAAAAGCTT
H55.1 GE649940 CCCCGCGTAGGCTGAAAGACGTGGGCACGGGCCTTGGCCAAATGCTGGTCAGCTGCCTTGGCAGCGCCGTGGACTGCTTGCACCTCTGCAACAGTAGGGTATGAGCCATCAGCAGCCTTAATGACGGTCAAAAGAAGGCGGTCGTGGTCCTTGGTGGTCTTGCCACACCCAACTTCAACAAGGTATGCACCCGTGCC
H64.1 GE649941 GGCACGGGCACACACACCAGAAGGCTGAGCTGAAGTGGGCAATAGGCTCACTGTCGGTAGCCTTTACAATGATGAGCTTGCAGCCAGGTTCGATTCCAACTCATGATTTATTTTGGTGTAGCATGAGGGCTGTGGGGTTCAGGAGTTGGTTCCGGATGTTTTTGTGGTGGGTTTGAAAGTGAGCGTTGGTAAAAAAAAAAAGCTT
H69.1 GE649942 TGTACATATCAGTTGGCAAGGGTTGTAGTGACACACCGATGCGGCACCAGTGTGCTGCTGGGCGCTAACTGCAAACCAGCTGTCACTGGCACCAAGAACGACTCTGCTCCCATCAAGCTCTGTCCTGTCCACTGTGTGTCAGGCTGATGAGCTGACCCAGCTCAAGGCTGCTTCCAGTCCAAATACACCACGGG
H69.2 GE649943 AGCTGGGTCAGCACATCAGCCTGACACACAGTGGACAGGACAGAGCTTGATGGGAGCAGAGTCGTTCTTGGTGCCAGTGACAGCTGGTTTGCAGTTAGCGCTCAGCAGCACACTGGTGCCGCATCGGTGTGTCACTACAACCCTTGCCAACTGATATGTACATGGTACCACAGTTTTGTGCCTGAAGGGCCAAATTCTGAAATGGAACTGATTTTCTTTCCTGAACTCGTCCAGGGCAAG
H77.1 GE649944 GGAATCAATGCCCGCCAATGGATGGCGCTGAAGCGCGTGACCTATACTCAGCCATGGAAGCAAGTGCGAGGTTTCCATGAGTAGGAGGGCGTGGGTGTCGTTGCGCAGCCTGAGGCGTGAGCCTGGGTGAAACGGCACCTAGTGCAGATCTTGGTGGTAGTAGCAAATATTCAAATGAGAACTTTGAAGACTGAAGTGGAGAAAGGTTCCATGTGAACAACGATTGGACATGGGTTAGTCGATCCTAAGAGTGTCGTGCTCCACCAT
H77.2 GE649945 ATGGTGGAGCACGACACTCTGCAAAGCCGCCCCTGCTGTAGCTAACGCGTTAAGTTTCCCGCCTGGGGAGTACAATCGCAAGAGTGAGACTCAAAGGAATTGACAGGCGGTATTCAAGCACG
H80.1 GE649946 GGTCGGTGCCTGTGTGTAGTGAGTGGATACGTTTTAGGGTGTGTAGTAAGTAGAAACGGCGTGTGCTGAGAATCCAGCAAGAGTGTCGTGCTCCACCAT
H80.2 GE649947 TATAGAAAGTTTTTTGAAAAATATGGATGGTCTTTAAAATAACGGGTTTAAANTAAAAAAAATAAAAGGAATTTGGGGTTCTTCTGACCATCTTTGGTGAAGACAGTATTCCTNTTGGGAAAAAAGAGAGTATGGATTGATTTGTGAAGTAGGGTA
Appendix
165
AAAAGACACGAT
H88.3 GE649948 TTGGACGTGGCAAGCCCCTAGGTAGATTGGGCTAGCTCATCAGCCTGACACACAGTGGACAGGACGGAGCTTGATGGGAGCAGAGTCGTTCTTGGTGCTATTGACAGCTGGTTTGCAGTTAGCGCCCAGCAGCACACTGGTGCCGCATCGGTGTGTCAGTACAACCCTTGCCAACTGATATGTACATGTTACCACAGTTTTGTGCCTGATGGGCCAAATTCTGAAATGGAGCTGATTTTCTTTCCTGAACACATTCTTTTGCAGGGCAAGCACAGTGCCCATGTTCCAGCCTTTCTTGCATCTGTTTGTGCAAGATGTAAGTGTTTTTAATCTGTAAGATGGATGGGGTTAAAAAAAAAAAGC
H97.1 GE649949 CATCGAGGTCGACCACACGTGTGGTCGATCCAAGGACGCATACCTAAACGGTATGATAATTCCCATTCACGGCCCATATAACAGCATACACCTAATAAAAAGTGTAATACGATTAATTAGTAAAGACCACCGTTGTACAACCACTCGTCTAAAGAAGCGGCTTCCCAGATAGGATAGAAATGTAGGCCAATGGCGTTAGATGTTGGAATAACGGCGCCTGTGATGATGTTGTTACCGTATAATAAAGAGCCTGAAACTGGTTCACGGATACCATCAATGTCCACTGGAGGAGCAGCGATGAAAGCGATAATGAATACAGAAGTTGCAGTTAATAAAGTTGGGATCGCAACA
H97.2 GE649950 CCTGAGGCTGACAGACGGTGTCTGACTCCTAGTAGAGAGCCTGTGAGGGCGGGAGAACGAGACAGGACCCGGGGTCGGATAGAGTTCGGAGCCAAGGTAACTGTCTCTGCCCTCATAGAGCCTTAAGCACCGTAAACCATACACATTCTTAGTCAGCCAGGTGTTCGAGGAAACGGTA
H97.3 GE649951 GGCACGGGAAGGATTGACAGATTGAGAGCTCTTTCTTGATTCTGTGGGTGGTGGTGCATGGCCGTTCTTAGTTGGTGGGTTGCCTTGTCAGGTTGATTCCGGTAACGAACGAGACCTCAGCCTGCTAAATAGTCAAGCGTACCTTGGTACGCGCCTGACTTCTTAGAGGGACTACTGACGTTTAGTCAGTGGAGGTGTGAGGCAATAACAGGTCTGTGATGCCCTTAGATGTTCTGGGCTGCACGCGCGCTACACTGATGCATTCAGCGAGCCTATCCTTGGCCGAGAGGTCCGGGTAATCTTTGAAACTGCATCGTGATGGGGATAGATTATTGCAATTATTAGTCTTTAACGAGGAATGCCTAGTAAGCGCGAGTCATCAGCTCGCGTTGATTACGTCCCTGCCCTTTGTACACACCGCCCGTGCC
H107.1 GE649952 CTACTTCTAGTACATCCACTTTCGTGATGTGACGGGCGGTGTGTAAAGACCCGGGAACGTATTCACCGCGGCATGCTGATCCGCGATTACTAGCGATTCCAACTTCATGAAGTCGAGTTGCAGACTTCAATCCGAACTGAGAACGGCTTTTTCCGATTAGCTCCCCCTTACGGGATCGCAA
H109.1 GE649953 AGCTTGCCCTGGACGAGTTCACCCCAATCATGAATTAGTAACTTGCCTCCCGAAGGTTAGCCCAGCTACTTCTAGTACAATCCACTTTCGTGATGTGACGGGCGGTGTGTACAAGACCCGGGAACGTATTCACCGCGGCATGCTGATCCGCGATTACTAGCGATTCCAACTTCATGAAGTCGAGTTGCAGACTTCAATCCGAACTGAGAACGGCTTTTTCCGATTAGCTCCCCCTTACGGGATCGCAACA