Embed Size (px)
Citation preview
MOLECULAR AND RADIATIONSTUDIES ON IMPROVING THEAJMALICINE PRODUCTION IN
Catharanthus roseus.
ByISLAM MOHAMED SALAMA EL-SAYED
B. Sc. Agric. (Agric. Botany - Genetics), Fac. of Agric. Al-AzharUniversity 2001
M. Sc. (Agric Botany. - Genetics), Fac. of Agric. Al-Azhar University2006
THESISSubmitted in partial fulfillment of the
Requirements for the Degree
OfDOCTOR OF PHILOSOPHY
InAGRICULTURE SCIENCES
(Agric. Botany - Genetics)
Department of Agric. BotanyFaculty of Agriculture, Cairo
Al-Azhar University
1434 A. H.2013 A. D.
TITLE: MOLECULAR AND RADIATIONSTUDIES ON IMPROVING THEAJMALICINE PRODUCTION IN
Catharanthus roseus.NAME: ISLAM MOHAMED SALAMA EL-SAYED
THESISSubmitted in partial fulfillment of the
Requirements for the Degree
OfDOCTOR OF PHILOSOPHY
InAGRICULTURE SCIENCES
(Agric. Botany - Genetics)
Department of Agric. BotanyFaculty of Agriculture, Cairo
Al-Azhar University
1434 A. H.2013 A. D.
Supervision committee:Prof. Dr. ABD EL-HADI IBRAHIM HASSN SAYED.Prof. of Genetics, Department of Agricultural Botany, Faculty ofAgriculture, Al-Azhar University.Prof. Dr. MOHAMED ALI ABD EL-RAHMAN.Prof. of Genetics, Department of Agricultural Botany, Faculty ofAgriculture, Al-Azhar University.
APPROVAL SHEET
NAME: ISLAM MOHAMED SALAMA EL-SAYEDTITLE: MOLECULAR AND RADIATION
STUDIES ON IMPROVING THEAJMALICINE PRODUCTION IN
Catharanthus roseus.
THESISSubmitted in partial fulfillment of the
Requirements for the Degree
OfDOCTOR OF PHILOSOPHY
InAGRICULTURE SCIENCES
(Agric. Botany - Genetics)
Department of Agric. BotanyFaculty of Agriculture, Cairo
Al-Azhar University1434 A. H.2013 A. D.
Approved by:Prof. Dr. Gomaah Ali Bahgat El – Fadly ………………...Prof. of Genetics, Faculty of Agriculture, Kafrelsheikh University.Prof. Dr. Shafik Ibrahim EL - Morsy El – Bosty ………………...Prof. of Genetics, Faculty of Agriculture, Al-Azhar University.Prof. Dr. Abd El-Hadi Ibrahim Hassn Sayed. ………………...Prof. of Genetics, Faculty of Agriculture, Al-Azhar University.Prof. Dr. Mohamed Ali Abd El-Rahman ………………...Prof. of Genetics, Faculty of Agriculture, Al-Azhar University.
Date: 23 / 1 / 2013 A.D.
i
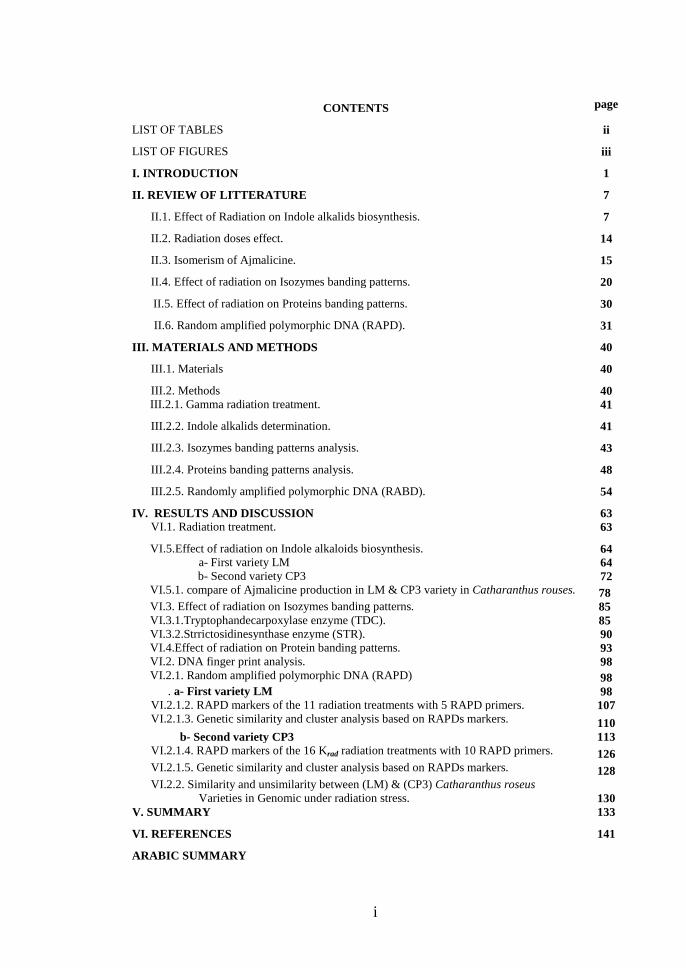
CONTENTS page
LIST OF TABLES ii
LIST OF FIGURES iii
І. INTRODUCTION 1
ІІ. REVIEW OF LITTERATURE 7
II.1. Effect of Radiation on Indole alkalids biosynthesis. 7
II.2. Radiation doses effect. 14
II.3. Isomerism of Ajmalicine. 15
II.4. Effect of radiation on Isozymes banding patterns. 20
II.5. Effect of radiation on Proteins banding patterns. 30
II.6. Random amplified polymorphic DNA (RAPD). 31
ІІІ. MATERIALS AND METHODS 40
III.1. Materials 40
III.2. Methods 40III.2.1. Gamma radiation treatment. 41
III.2.2. Indole alkalids determination. 41
III.2.3. Isozymes banding patterns analysis. 43
III.2.4. Proteins banding patterns analysis. 48
III.2.5. Randomly amplified polymorphic DNA (RABD). 54
ІV. RESULTS AND DISCUSSION 63VI.1. Radiation treatment. 63
VI.5.Effect of radiation on Indole alkaloids biosynthesis. 64a- First variety LM 64b- Second variety CP3 72
VI.5.1. compare of Ajmalicine production in LM & CP3 variety in Catharanthus rouses. 78VI.3. Effect of radiation on Isozymes banding patterns. 85VI.3.1.Tryptophandecarpoxylase enzyme (TDC). 85VI.3.2.Strrictosidinesynthase enzyme (STR). 90VI.4.Effect of radiation on Protein banding patterns. 93VI.2. DNA finger print analysis. 98VI.2.1. Random amplified polymorphic DNA (RAPD) 98
. a- First variety LM 98VI.2.1.2. RAPD markers of the 11 radiation treatments with 5 RAPD primers. 107VI.2.1.3. Genetic similarity and cluster analysis based on RAPDs markers. 110
b- Second variety CP3 113VI.2.1.4. RAPD markers of the 16 Krad radiation treatments with 10 RAPD primers. 126VI.2.1.5. Genetic similarity and cluster analysis based on RAPDs markers. 128VI.2.2. Similarity and unsimilarity between (LM) & (CP3) Catharanthus roseus
Varieties in Genomic under radiation stress. 130V. SUMMARY 133
VI. REFERENCES 141
ARABIC SUMMARY
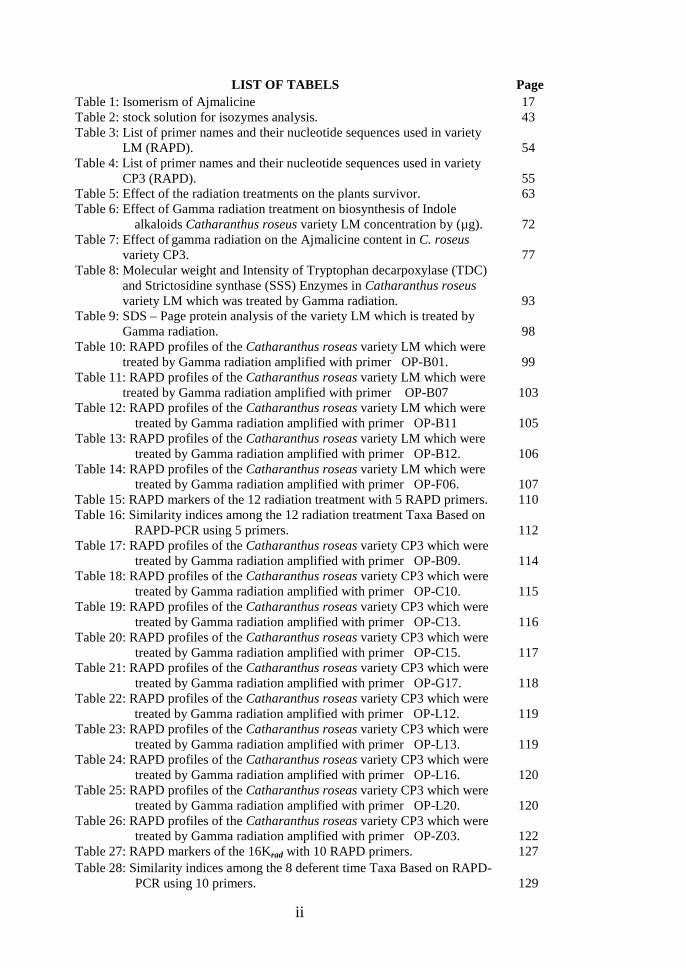
ii
LIST OF TABELS PageTable 1: Isomerism of Ajmalicine 17Table 2: stock solution for isozymes analysis. 43Table 3: List of primer names and their nucleotide sequences used in variety
LM (RAPD). 54Table 4: List of primer names and their nucleotide sequences used in variety
CP3 (RAPD). 55Table 5: Effect of the radiation treatments on the plants survivor. 63Table 6: Effect of Gamma radiation treatment on biosynthesis of Indole
alkaloids Catharanthus roseus variety LM concentration by (µg). 72Table 7: Effect of gamma radiation on the Ajmalicine content in C. roseus
variety CP3. 77Table 8: Molecular weight and Intensity of Tryptophan decarpoxylase (TDC)
and Strictosidine synthase (SSS) Enzymes in Catharanthus roseusvariety LM which was treated by Gamma radiation. 93
Table 9: SDS – Page protein analysis of the variety LM which is treated byGamma radiation. 98
Table 10: RAPD profiles of the Catharanthus roseas variety LM which weretreated by Gamma radiation amplified with primer OP-B01. 99
Table 11: RAPD profiles of the Catharanthus roseas variety LM which weretreated by Gamma radiation amplified with primer OP-B07 103
Table 12: RAPD profiles of the Catharanthus roseas variety LM which weretreated by Gamma radiation amplified with primer OP-B11 105
Table 13: RAPD profiles of the Catharanthus roseas variety LM which weretreated by Gamma radiation amplified with primer OP-B12. 106
Table 14: RAPD profiles of the Catharanthus roseas variety LM which weretreated by Gamma radiation amplified with primer OP-F06. 107
Table 15: RAPD markers of the 12 radiation treatment with 5 RAPD primers. 110Table 16: Similarity indices among the 12 radiation treatment Taxa Based on
RAPD-PCR using 5 primers. 112Table 17: RAPD profiles of the Catharanthus roseas variety CP3 which were
treated by Gamma radiation amplified with primer OP-B09. 114Table 18: RAPD profiles of the Catharanthus roseas variety CP3 which were
treated by Gamma radiation amplified with primer OP-C10. 115Table 19: RAPD profiles of the Catharanthus roseas variety CP3 which were
treated by Gamma radiation amplified with primer OP-C13. 116Table 20: RAPD profiles of the Catharanthus roseas variety CP3 which were
treated by Gamma radiation amplified with primer OP-C15. 117Table 21: RAPD profiles of the Catharanthus roseas variety CP3 which were
treated by Gamma radiation amplified with primer OP-G17. 118Table 22: RAPD profiles of the Catharanthus roseas variety CP3 which were
treated by Gamma radiation amplified with primer OP-L12. 119Table 23: RAPD profiles of the Catharanthus roseas variety CP3 which were
treated by Gamma radiation amplified with primer OP-L13. 119Table 24: RAPD profiles of the Catharanthus roseas variety CP3 which were
treated by Gamma radiation amplified with primer OP-L16. 120Table 25: RAPD profiles of the Catharanthus roseas variety CP3 which were
treated by Gamma radiation amplified with primer OP-L20. 120Table 26: RAPD profiles of the Catharanthus roseas variety CP3 which were
treated by Gamma radiation amplified with primer OP-Z03. 122Table 27: RAPD markers of the 16Krad with 10 RAPD primers. 127Table 28: Similarity indices among the 8 deferent time Taxa Based on RAPD-
PCR using 10 primers. 129
iii
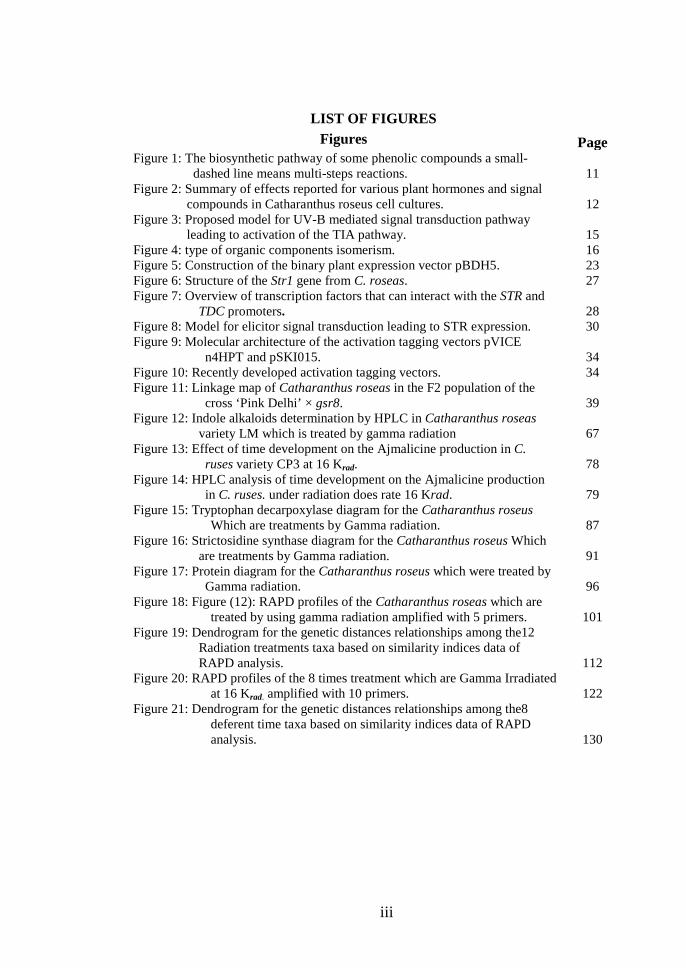
LIST OF FIGURESFigures Page
Figure 1: The biosynthetic pathway of some phenolic compounds a small-dashed line means multi-steps reactions. 11
Figure 2: Summary of effects reported for various plant hormones and signalcompounds in Catharanthus roseus cell cultures. 12
Figure 3: Proposed model for UV-B mediated signal transduction pathwayleading to activation of the TIA pathway. 15
Figure 4: type of organic components isomerism. 16Figure 5: Construction of the binary plant expression vector pBDH5. 23Figure 6: Structure of the Str1 gene from C. roseas. 27Figure 7: Overview of transcription factors that can interact with the STR and
TDC promoters. 28Figure 8: Model for elicitor signal transduction leading to STR expression. 30Figure 9: Molecular architecture of the activation tagging vectors pVICE
n4HPT and pSKI015. 34Figure 10: Recently developed activation tagging vectors. 34Figure 11: Linkage map of Catharanthus roseas in the F2 population of the
cross ‘Pink Delhi’ × gsr8. 39Figure 12: Indole alkaloids determination by HPLC in Catharanthus roseas
variety LM which is treated by gamma radiation 67Figure 13: Effect of time development on the Ajmalicine production in C.
ruses variety CP3 at 16 Krad. 78Figure 14: HPLC analysis of time development on the Ajmalicine production
in C. ruses. under radiation does rate 16 Krad. 79Figure 15: Tryptophan decarpoxylase diagram for the Catharanthus roseus
Which are treatments by Gamma radiation. 87Figure 16: Strictosidine synthase diagram for the Catharanthus roseus Which
are treatments by Gamma radiation. 91Figure 17: Protein diagram for the Catharanthus roseus which were treated by
Gamma radiation. 96Figure 18: Figure (12): RAPD profiles of the Catharanthus roseas which are
treated by using gamma radiation amplified with 5 primers. 101Figure 19: Dendrogram for the genetic distances relationships among the12
Radiation treatments taxa based on similarity indices data ofRAPD analysis. 112
Figure 20: RAPD profiles of the 8 times treatment which are Gamma Irradiatedat 16 Krad. amplified with 10 primers. 122
Figure 21: Dendrogram for the genetic distances relationships among the8deferent time taxa based on similarity indices data of RAPDanalysis. 130
____________________________________________abstract
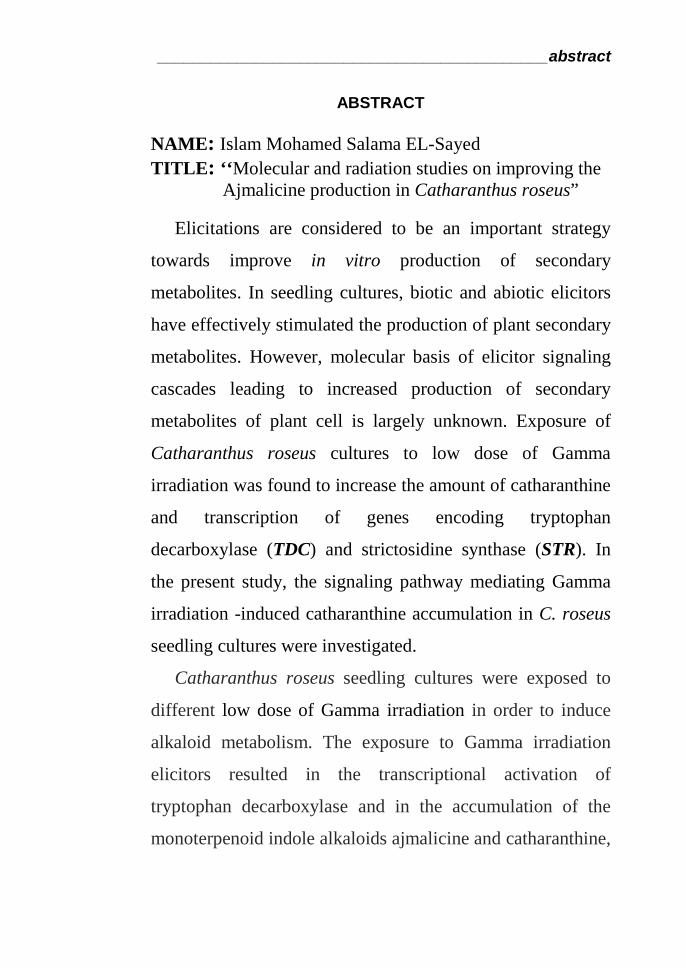
ABSTRACT
NAME: Islam Mohamed Salama EL-SayedTITLE: ‘‘Molecular and radiation studies on improving the
Ajmalicine production in Catharanthus roseus”
Elicitations are considered to be an important strategy
towards improve in vitro production of secondary
metabolites. In seedling cultures, biotic and abiotic elicitors
have effectively stimulated the production of plant secondary
metabolites. However, molecular basis of elicitor signaling
cascades leading to increased production of secondary
metabolites of plant cell is largely unknown. Exposure of
Catharanthus roseus cultures to low dose of Gamma
irradiation was found to increase the amount of catharanthine
and transcription of genes encoding tryptophan
decarboxylase (TDC) and strictosidine synthase (STR). In
the present study, the signaling pathway mediating Gamma
irradiation -induced catharanthine accumulation in C. roseus
seedling cultures were investigated.
Catharanthus roseus seedling cultures were exposed to
different low dose of Gamma irradiation in order to induce
alkaloid metabolism. The exposure to Gamma irradiation
elicitors resulted in the transcriptional activation of
tryptophan decarboxylase and in the accumulation of the
monoterpenoid indole alkaloids ajmalicine and catharanthine,

____________________________________________abstract
but not of vindoline. The inability of the seedling cultures to
produce vindoline was related to a lack of expression of the
tryptophan decarboxylase (TDC) and strictosidine synthase
(STR) genes.
Acknowledgement
DEEP THANKS TO ALLAH
The author wishes to express his sincere gratitude and
appreciation to Prof. Dr. ABD EL-HADI IBRAHIM
HASSN SAYED Professor of Genetics, Department of
Agricultural Botany, Faculty of Agriculture, AL-Azhar
University. For his supervision, encouragement, valuable
advises and his unlimited helps in writing thesis.
Special thanks to Prof. Dr. MOHAMED ALI ABD
EL-RAHMAN Professor of Genetics, Department of
Agricultural Botany, Faculty of Agriculture, AL-Azhar
University. For his supervision and help.
The other wishes to acknowledge all members of
Genetics, Department of Agricultural Botany, Faculty of
Agriculture, AL-Azhar University. And all members of
Department of Natural Product Research, National Center for
Radiation Research and Technology, Atomic Energy
Authority.
The author wishes to extend his deep thanks and
appreciation to Genetics, Department of Natural Product
Research, National Center for Radiation Research and
Technology, Atomic Energy Authority. for helping and
providing facilities during the experimental work.
________________________________________________Introduction
1
I- Introduction
Catharanthus roseas is a medicinal plant that produces
clinically useful drugs, such as ajmalicine and vinblastine.
Tryptophan decarboxylase (TDC) and strictosidine synthase
(STR) are two enzymes that act early in the biosynthetic
pathway leading to terpenoid indole alkaloids. Knowledge of
the regulation of these biosynthetic genes will be helpful for
metabolic engineering of terpenoid indole alkaloid
productivity. In suspension-cultured cells, the genes encoding
these enzymes are induced by fungal elicitors, such as
Pythium aphanidermatum culture filtrate or yeast extract. The
mRNA levels of TDC and STR in response to elicitor
treatment of the suspension cultured cells can be visualized
by Northern blotting using radioactively labeled cDNA
probes. This system is used in our laboratory as a bioassay to
help identify the elicitor in fractionated yeast extract. Here
we report the successful use of digoxigenin-labeled probes in
this system. Frank et al., (1996).
________________________________________________Introduction
2
Although the production of most of the current
medicines is based on chemical synthesis, more than 25% of
the current prescribed drugs contain at least one active
ingredient of plant origin. Examples of important plant-
derived pharmaceuticals include the antitumoral taxol and
vinblastine, the antimalarial drug quinine and artemisinin, the
analgesical morphine and codeine. In addition, it has been
estimated that more than 80% of the world’s population in
developing countries depends primarily on herbal medicine
for basic healthcare needs. There is also a revival of
traditional medicine in developed countries and an increase in
the use of herbal remedies. The world market of herbal
medicines’, including herbal and raw material, has been
estimated to have an annual growth rate between 5-15%.
Total global herbal drug market is estimated as US $ 62
billion and it is expected to grow to US $ 5 trillion by the
year 2050. At same time, there is a growing concern on loss
of genetic diversity since about 75% of the 50,000 different
________________________________________________Introduction
3
medicinal plant species in use are collected from the wild.
Moreover, to rely solely on wild spontaneous plants
Antonella et al., (2007).
Catharanthus roseas plant is still the only source for the
powerful antitumor drugs vinblastine and vincristine. Some
other pharmaceutical compounds from this plant, e.g.,
ajmalicine and serpentine are also of economical importance.
These two drugs are produced in small yields within the
plant, which makes them expensive to produce commercially.
Metabolic engineering has focused on increasing flux
through this pathway by various means such as elicitation,
precursor feeding, and introduction of genes encoding
specific metabolic enzymes into the plant. More than 130 C.
roseas alkaloids have been identified, they are sharing many
biosynthetic steps. The early stages of alkaloid biosynthesis
in C. roseas involve the formation of secologanin derived
from the terpenoid biosynthesis and its condensation with
tryptamine to produce the central intermediate strictosidine,
________________________________________________Introduction
4
the common precursor for the monoterpenoid indole
alkaloids. Over twenty enzymes steps are involved in the
biosynthesis of terpenoid indole alkaloids (TIAs) in C.
roseas. Whereas, reported these enzymes take place in at
least three subcellular compartments, the cytosol, the plastids,
and the vacuol. Furthermore, the full characterization of C.
roseas's alkaloid pathway is not yet achieved. A significant
amount of researchs has contributed to characterization of
several individual steps in the biosynthetic pathway of
medicinally valuable alkaloids. However, the available
knowledge of the regulation of this pathway is still sparse.
The conversion of L-tryptophan into tryptamine is catalysed
by the enzyme tryptophan decarboxylase (TDC). This
enzyme is regarded as a putative site for regulatory control of
alkaloid biosynthesis and operates at the interface between
primary and secondary metabolism. The stereospecific
condensation of tryptamine and secolaganin is catalyzes by
strictosidine synthase enzyme (STR, EC 4.3.3.2) to form the
________________________________________________Introduction
5
key indole alkaloid 3 alpha (S)-strictosidine. The STR gene
of C. roseas has been cloned and its nucleotide sequence was
furthermore, determined. Hussein et al., (2008) Reported
that cells of C. roseas (L.) Don. were genetically engineered
to over-express the enzymes strictosidine synthase and
Tryptophan decarboxylase. Cultures transgenic for STR
consistently showed ten fold higher STR. Two such lines
accumulated over 200 mg / L of the glucoalkaloid -1
strictosidine and / or strictosidine-derived terpenoid indole
alkaloids (TIAs), including ajmalicine, catharanthine,
serpentine, and tabersonine, while maintaining wild-type
levels of TDC activity.
In this study tryptophan decarboxylase and strictosidine
synthase genes will be manipulated in order to determine the
genes behavior in C. roseas which are treated by gamma
radiation. The effect of gene within the obtained, in terpenoid
Indole alkaloid production will be investigated. The selection

________________________________________________Introduction
6
of the best dose rate will be chosen depending on the
resistance of radiation treatments.
_________________________________________ Review of Literature
7
II. Review of Literature
II.1. Effect of radiation on Indole alkaloids biosynthesis
and other components:
Sharabash (1970). reported that no signification effect on
chlorophyll concentration in tissue on onion seedling occurred
when exposed to 50 or 5000 rad. of Gamma irradiation.
Sharabash et al., (1972). found that the dose of 10 Krad. of
Gamma irradiation induced a marked increase in the chlorophyll
contents in wheat seedlings.
Tikhonoy et al., (1980). found that irradiation of Datura
innoxia. seeds with Gamma irradiation at 0.5 – 1.0 Krad. reduced
N content.
Schmauder et al., (1985). Cell suspension cultures of
Cinchona succirubra were cultivated in shake cultures and for the
first time in airlift fermenters. Under both conditions L-
tryptophan exerts a stimulatorv effect on alkaloid formation. In
this context the regulatory pattern of some shikimate pathway
enzvmes was investigated in non-supplemented and Tryptophan
supplemented Cinchona cell cultures. A remarkable increase of
trvptophan decarboxylase (TDC) activity was observed in
Cinchona cells under the influence of tryptophan. Apparently, like
in some other indole alkaloid producing cell cultures, a high TDC
activity is a prerequisite for alkaloid formation. Growth pattern
and some enzyme activities of C. succirubra fermenter cultures at
controlled and non-regulated pH levels were followed. Optimum
growth and alkaloid formation were recorded under nonregulated
_________________________________________ Review of Literature
8
(normal) pH conditions. Abbreviations: TDC = tryptophan
decarboxylase, tyr = L-tyrosine, phe = L-phenylalanine, DAHP =
3-deoxy-D-arabino-heptulosonic acid-7-phosphate, trp = L-
tryptophan, E-4-P = erythrose-4-phosphate, PEP =
phospheenolpyruvate, NDH = malate dehydrogenase, G-6-PDH =
glucose-6-phosphate dehydrogenase, 6-PG-DH = 6-
phosphogluconate dehydrogenase, Ch-mutase = chorismate
mutase, AS-synthase = anthranilate svnthase, n.d. = not
determined
Georgiveva (1987). reported that increasing the Gamma
irradiation doses caused increases in the content of quiones in
pollen tubes of Lilum regali. and Beta vulgares.
Lucumi et al., (2001). A cell suspension culture of
Tabernaemontana divaricata, that had lost alkaloid production,
was still capable of producing a similar pattern of alkaloids as
directly after its initiation. When fed with early precursors, such
as tryptamine and loganin, 57% of the precursors were converted
into indole alkaloids such as strictosidine, vallesamine, O-
acetylvallesamine and voaphylline. Apparently most of the cell
factory has remained stable during the many years of sub
culturing. Only an early step of the biosynthesis the flux seems to
be diverted to other pathways.
Felipe et al., (2002). Catharanthus roseus cell cultures were
exposed to different conditions in order to induce alkaloid
metabolism. The exposure to jasmonate and fungal elicitors
resulted in the transcriptional activation of Tryptophan
_________________________________________ Review of Literature
9
decarboxylase and in the accumulation of the monoterpenoid
indole alkaloids ajmalicine and catharanthine, but not of
vindoline. The inability of the cell cultures to produce vindoline
was related to a lack of expression of the desacetoxyvindoline 4-
hydroxylase (D4h) gene. Southern blot analysis revealed that D4h
gene was not lost in the cell cultures.
Felipe and Victor (2003). The Scientific Research Center of
Yucatan (CICY, for its Spanish acronym) was founded in
November 1979 as part of an effort to decentralize scientific
activities from Mexico City. Several of the research programs
carried out at CICY makes use of plant tissue culture techniques
for their development. For this article, we have reviewed results
obtained in research projects oriented towards basic plant biology
questions, as well as towards the micropropagation of
economically important species, and the production of secondary
metabolites.
Young et al., (2003). Production of camptothecin (CPT)
from callus cultures of Camptotheca acuminata Decne was
affected by light and culture conditions. Among the culture media
tested, modified B5 medium containing 3% (w/v) sucrose, 2 mg/L
2,4-D, 2 times of MS medium vitamins, 500 mg/L casein
hydrolysate, 250 mg/L myo-inositol, 0.05% (w/v) activated
charcoal, and 0.15% (w/v) gelite was used for callus induction.
The highest cell growth and CPT production were obtained in
dark and green light condition, respectively. Photoperiod has no
effect on cell growth and CPT production. Both cell growth and
_________________________________________ Review of Literature
10
CPT production were also influenced by combination ratio of red
and blue light. Cell growth and CPT production were the highest
in the ratio of red and blue light, 90:10.
Carolyn et al., (2004). The optimum growth stage for
enhancing ajmalicine production in Catharanthus roseus cultures
with methyl jasmonate (MJ) was after 6 d growth. MJ added at 10
or 100 µM on day 6 gave a maximum ajmalicine production of
10.2 mg l−1, a 300% increase over that of non-elicited cultures.
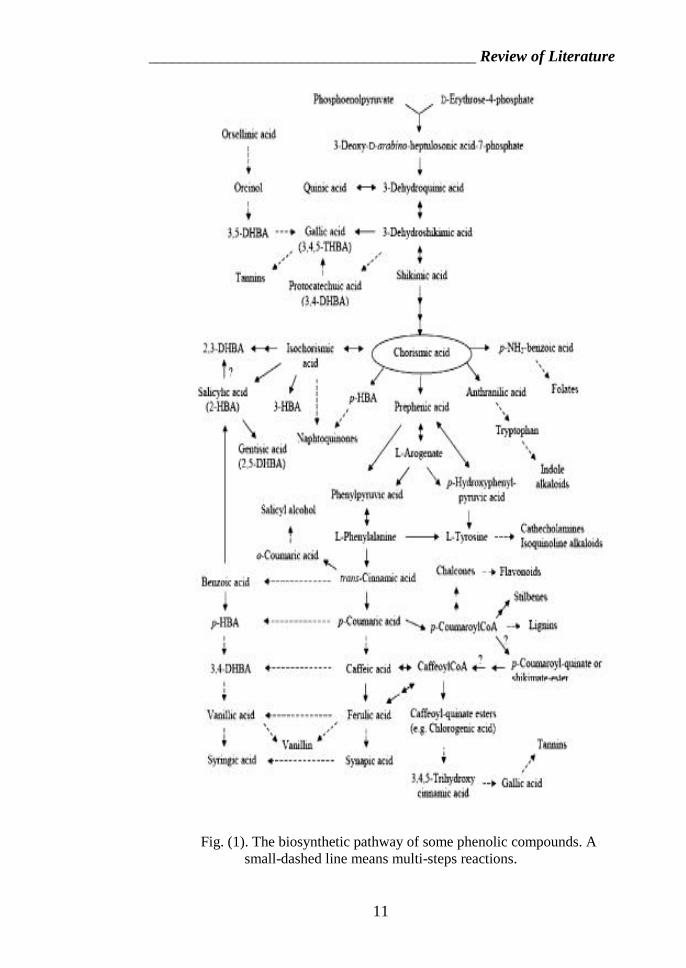
Natali and Robert (2007). Besides alkaloids Catharanthus
roseus produces a wide spectrum of phenolic compounds, this
includes C6C1 compounds such as 2,3-dihydoxybenzoic acid, as
well as phenylpropanoids such as cinnamic acid derivatives,
flavonoids and anthocyanins. The occurrence of these compounds
in C. roseus is reviewed as well as their biosynthesis and the
regulation of the pathways. Both types of compounds compete
with the indole alkaloid biosynthesis for chorismate, an important
intermediate in plant metabolism. The biosynthesis C6C1
compounds are induced by biotic elicitors.
_________________________________________ Review of Literature
11
Fig. (1). The biosynthetic pathway of some phenolic compounds. Asmall-dashed line means multi-steps reactions.
_________________________________________ Review of Literature
12
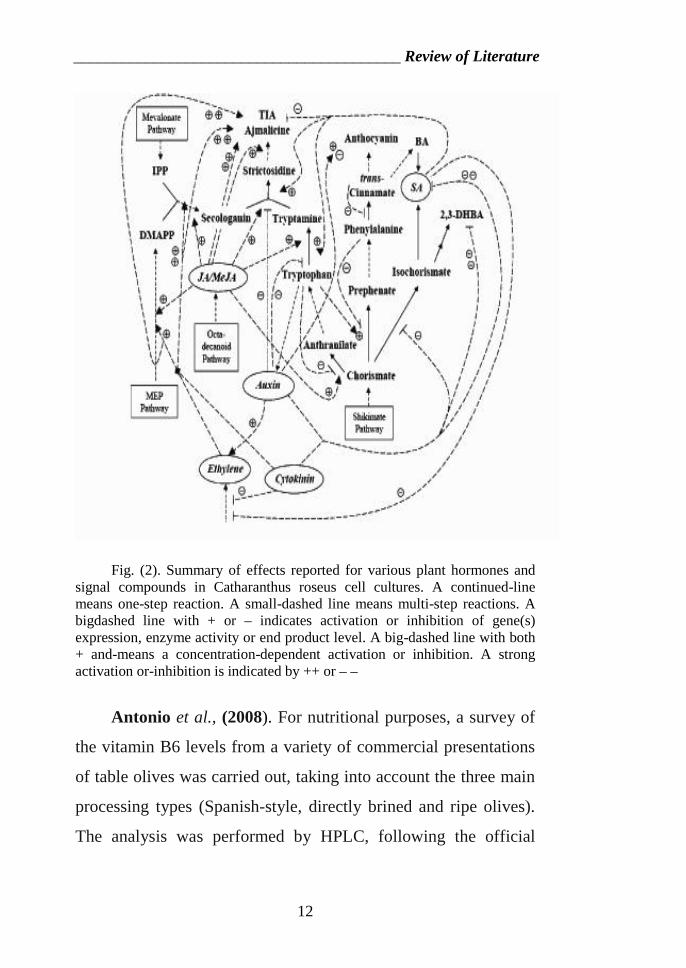
Fig. (2). Summary of effects reported for various plant hormones andsignal compounds in Catharanthus roseus cell cultures. A continued-linemeans one-step reaction. A small-dashed line means multi-step reactions. Abigdashed line with + or – indicates activation or inhibition of gene(s)expression, enzyme activity or end product level. A big-dashed line with both+ and-means a concentration-dependent activation or inhibition. A strongactivation or-inhibition is indicated by ++ or – –
Antonio et al., (2008). For nutritional purposes, a survey of
the vitamin B6 levels from a variety of commercial presentations
of table olives was carried out, taking into account the three main
processing types (Spanish-style, directly brined and ripe olives).
The analysis was performed by HPLC, following the official
_________________________________________ Review of Literature
13
French method for vitamin B6 determination in foodstuffs. In-
house validation data for two commercial table olives showed that
themethod precision was good (coefficient of variation <6%) and
recovery was quantitative (104% on average). There was a wide
range of values for vitamin B6 in table olives (0–69.3 μg/100 g
edible portion). The highest mean content was found in directly
brined olives (33.9 μg/ 100 g edible portion) followed by Spanish-
style (14.4 μg/ 100 g) and ripe olives (4.3 μg/100 g). On average,
samples of the Gordal and Carrasqueña cultivars showed the
highest vitamin B6 content in the case of Spanish-style olives, but
in directly brined olives as well as in ripe olives the effect of
cultivar was not statistically significant (p<0.05).
Hussein et al., (2008). Suspension, calli and leaves of
Egyptian Catharanthus roseas (L.) were genetically engineered to
over-express the two enzymes Tryptophandecarboxylase and
Strrictosidine syntheses, which catalyze key steps in the
biosynthesis of terpenoid indole alkaloids, using Agrobacterium-
mediated transformation with the two corresponding genes. The
percentages of total alkaloids, vinblastine and vincristine were
recorded as relative to C. roseas intact plant. The highest values
of total alkaloids (14.47%), vinblastine (13.62 %) and vincristine
(11.5%) of transgenic leaf cell cultures were recorded with (CS7).
However, (C4) transformed leaf calli cultures gave 10.48, 8.3 and
6.19 (%) for total alkaloid, vinblastine and vincristine,
respectively. On other hand, the maximum values of total
alkaloids (16.47 %), vinblastine (18.09 %) and vincristine (14.16
_________________________________________ Review of Literature
14
%) were recorded with (L3) transgenic leaf in vitro derived
germinated seeds) as compared with other selected cell lines.
II.2. Radiation doses effect
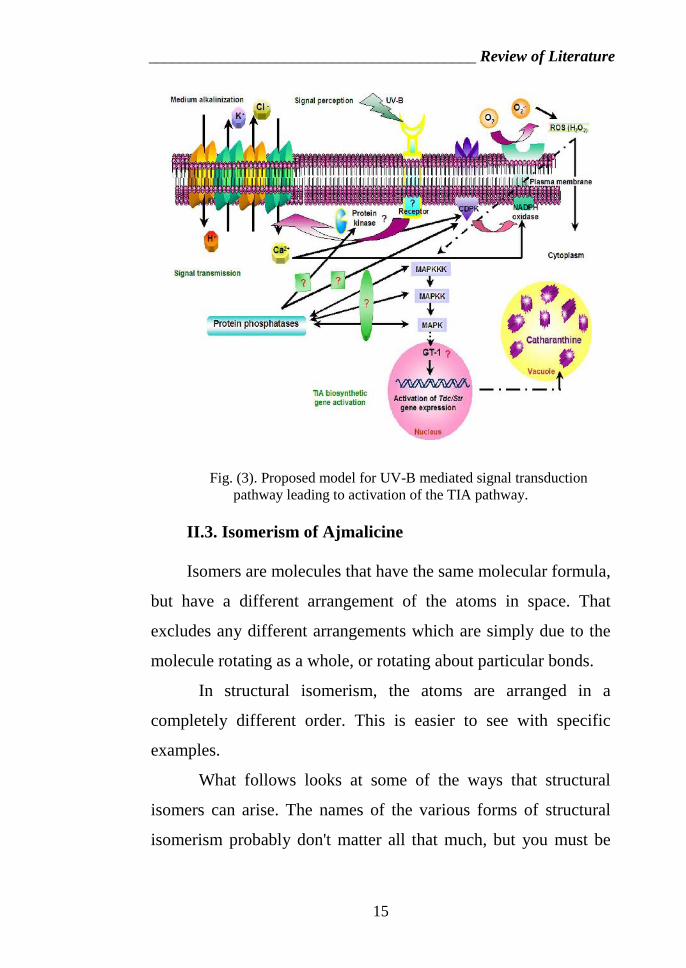
Shilpa and Jayabaskaran (2007). Elicitations are
considered to be an important strategy towards improved in vitro
production of secondary metabolites. In cell cultures, biotic and
abiotic elicitors have effectively stimulated the production of
plant secondary metabolites. However, molecular basis of
elicitorsignaling cascades leading to increased production of
secondary metabolites of plant cell is largely unknown. Exposure
of Catharanthus roseus cell suspension culture to low dose of
UV-B irradiation was found to increase the amount of
catharanthine and transcription of genes encoding Tryptophan
decarboxylase (Tdc) and strictosidine synthase (STR). In the
present study, the signaling pathway mediating UV-B-induced
catharanthine accumulation in C. roseus suspension cultures were
investigated.
_________________________________________ Review of Literature
15
Proposed model for UV-B mediated signal transduction pathway leading toactivate
Fig. (3). Proposed model for UV-B mediated signal transductionpathway leading to activation of the TIA pathway.
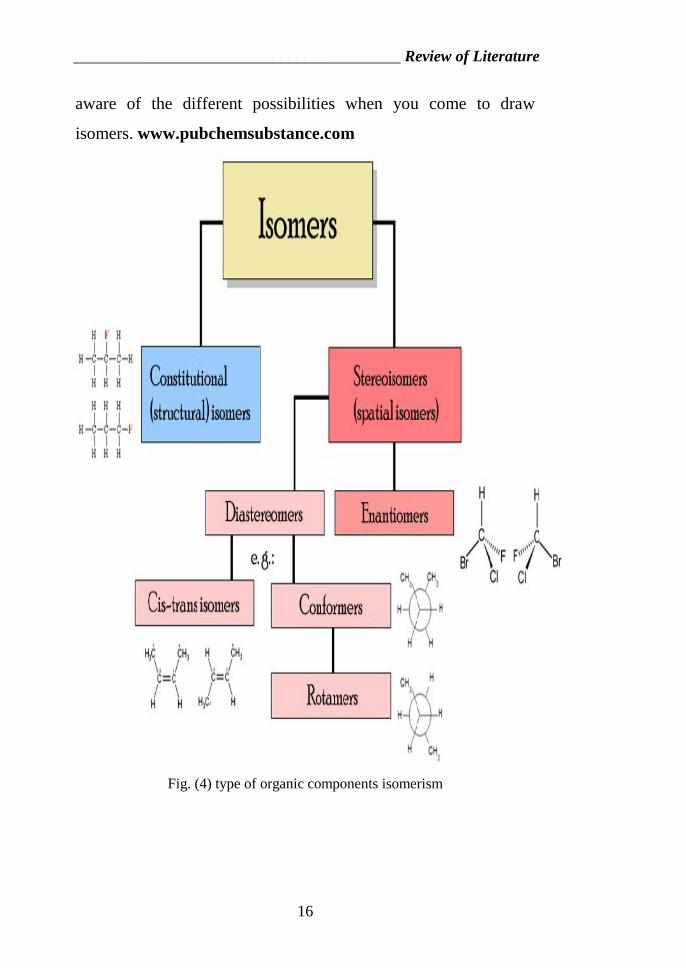
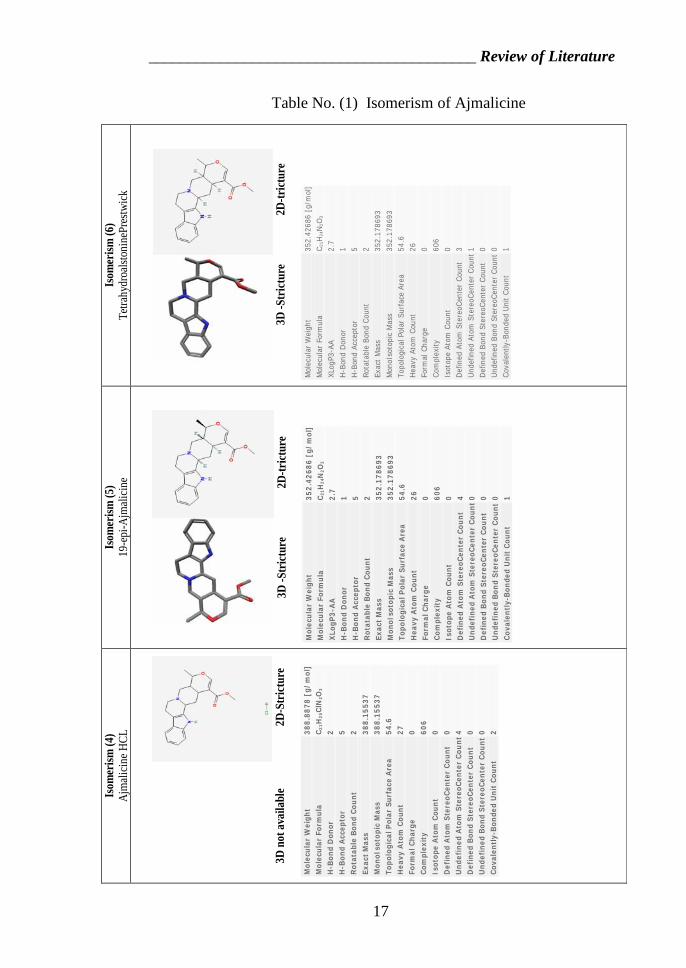
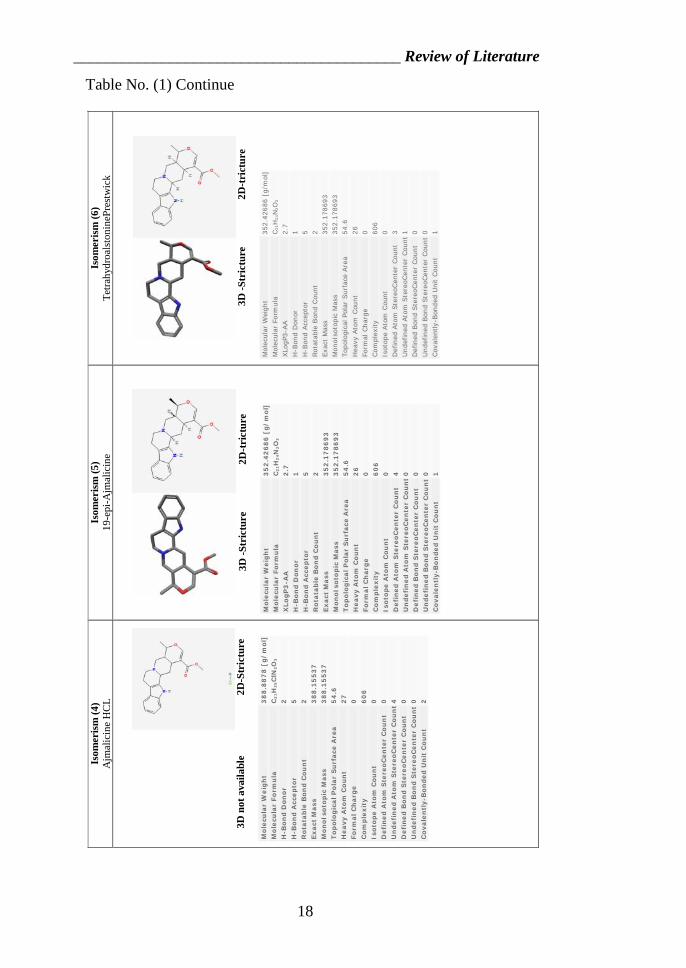
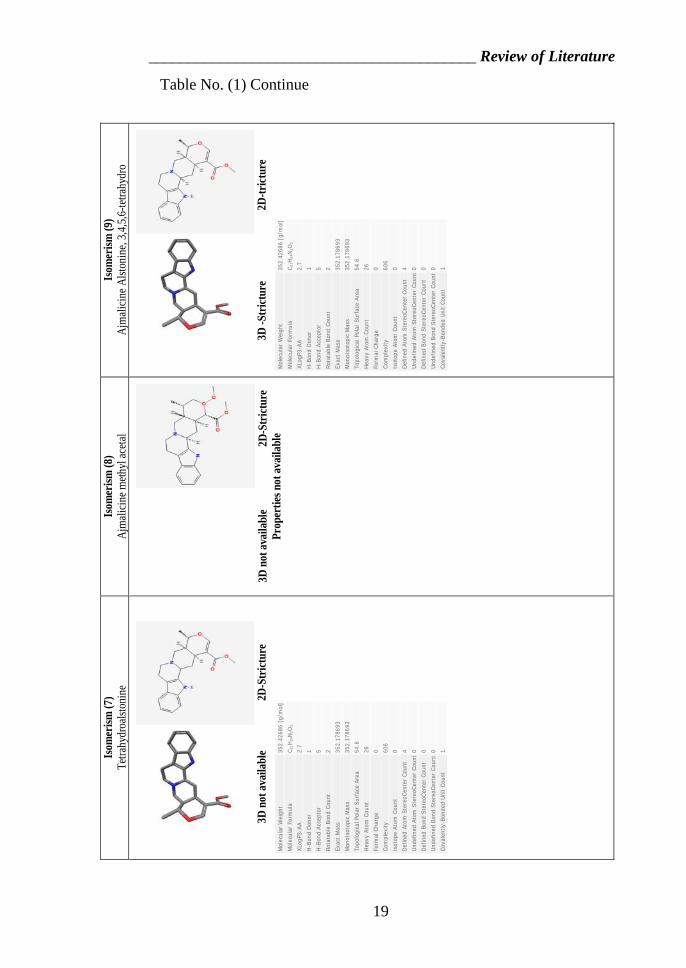
II.3. Isomerism of Ajmalicine
Isomers are molecules that have the same molecular formula,
but have a different arrangement of the atoms in space. That
excludes any different arrangements which are simply due to the
molecule rotating as a whole, or rotating about particular bonds.
In structural isomerism, the atoms are arranged in a
completely different order. This is easier to see with specific
examples.
What follows looks at some of the ways that structural
isomers can arise. The names of the various forms of structural
isomerism probably don't matter all that much, but you must be
_________________________________________ Review of Literature
16
aware of the different possibilities when you come to draw
isomers. www.pubchemsubstance.com
Fig. (4) type of organic components isomerism
_________________________________________ Review of Literature
17
Isom
eris
m (4
)A
jmal
icin
e H
CL
Isom
eris
m (5
)19
-epi
-Ajm
alic
ine
Isom
eris
m (6
)Te
trahy
droa
lsto
nine
Pres
twic
k
3D n
ot a
vaila
ble
2D-S
tric
ture
Mo
lecu
lar
Wei
gh
t3
88
.88
78
[g
/m
ol]
Mo
lecu
lar
Form
ula
C2
1H
25C
lN2O
3
H-B
on
d D
ono
r2
H-B
on
d A
ccep
tor
5R
ota
tab
le B
on
d C
ou
nt
2
Exa
ct M
ass
38
8.1
55
37
Mo
no
Iso
top
ic M
ass
38
8.1
55
37
To
po
log
ical
Po
lar
Su
rfac
e A
rea
54
.6H
eavy
Ato
m C
ou
nt
27
Form
al C
har
ge
0C
om
ple
xity
60
6Is
oto
pe A
tom
Cou
nt
0
Def
ined
Ato
m S
tere
oC
ente
r C
ou
nt
0U
nd
efin
ed A
tom
Ste
reo
Cen
ter
Co
un
t4
Def
ined
Bo
nd
Ste
reo
Cen
ter
Co
un
t0
Un
def
ined
Bo
nd
Ste
reo
Cen
ter
Co
un
t0
Co
vale
ntl
y-B
on
ded
Un
it C
ou
nt
2
3D-S
tric
ture
2D-t
rict
ure
Mo
lecu
lar
Wei
gh
t3
52
.42
68
6 [
g/
mo
l]M
ole
cula
r Fo
rmu
laC
21H
24N
2O
3
XLo
gP
3-A
A2
.7H
-Bo
nd
Don
or
1H
-Bo
nd
Acc
epto
r5
Ro
tata
ble
Bo
nd
Co
un
t2
Exa
ct M
ass
35
2.1
78
69
3M
on
oIs
oto
pic
Mas
s3
52
.17
86
93
To
po
log
ical
Po
lar
Su
rfac
e A
rea
54
.6
Hea
vy A
tom
Co
un
t2
6Fo
rmal
Ch
arg
e0
Co
mp
lexi
ty6
06
Iso
tope
Ato
m C
oun
t0
Def
ined
Ato
m S
tere
oC
ente
r C
ou
nt
4U
nd
efin
ed A
tom
Ste
reo
Cen
ter
Co
un
t0
Def
ined
Bo
nd
Ste
reo
Cen
ter
Co
un
t0
Un
def
ined
Bo
nd
Ste
reo
Cen
ter
Co
un
t0
Co
vale
ntl
y-B
on
ded
Un
it C
ou
nt
1
3D-S
tric
ture
2D-t
rict
ure
Mol
ecul
ar W
eigh
t35
2.42
686
[g/m
ol]
Mol
ecul
ar F
orm
ula
C21
H24
N2O
3
XLo
gP3-
AA
2.7
H-B
ond
Don
or1
H-B
ond
Acce
ptor
5Rot
atab
le B
ond
Cou
nt2
Exac
t M
ass
352.
1786
93
Mon
oIso
topi
c M
ass
352.
1786
93To
polo
gica
l Pol
ar S
urfa
ce A
rea
54.6
Hea
vy A
tom
Cou
nt26
Form
al C
harg
e0
Com
plex
ity60
6Is
otop
e Ato
m C
ount
0D
efin
ed A
tom
Ster
eoCen
ter
Cou
nt3
Und
efin
ed A
tom
Ste
reoC
ente
r Cou
nt1
Def
ined
Bon
d Ste
reoC
ente
r Cou
nt0
Und
efin
ed B
ond
Ster
eoCen
ter
Cou
nt0
Cov
alen
tly-B
onde
d U
nit
Cou
nt1
Table No. (1) Isomerism of Ajmalicine
_________________________________________ Review of Literature
18
Isom
eris
m(4
)A
jmal
icin
e H
CL
Isom
eris
m(5
)19
-epi
-Ajm
alic
ine
Isom
eris
m(6
)T
etra
hydr
oals
toni
nePr
estw
ick
3D n
ot a
vaila
ble
2D-S
tric
ture
Mo
lecu
lar
Weig
ht
38
8.8
87
8 [
g/
mo
l]M
ole
cula
r Fo
rmu
laC
21H
25C
lN2O
3
H-B
on
d D
on
or
2
H-B
on
d A
ccep
tor
5R
ota
tab
le B
on
d C
ou
nt
2E
xact
Mass
38
8.1
55
37
Mo
no
Iso
top
ic M
ass
38
8.1
55
37
To
po
log
ical P
ola
r S
urf
ace
Are
a5
4.6
Heavy A
tom
Co
un
t2
7Fo
rmal C
harg
e0
Co
mp
lexit
y6
06
Iso
tope A
tom
Cou
nt
0D
efi
ned
Ato
m S
tere
oC
en
ter
Co
un
t0
Un
defi
ned
Ato
m S
tere
oC
en
ter
Co
un
t4
Defi
ned
Bo
nd
Ste
reo
Cen
ter
Co
un
t0
Un
defi
ned
Bo
nd
Ste
reo
Cen
ter
Co
un
t0
Co
vale
ntl
y-B
on
ded
Un
it C
ou
nt
2
3D-S
tric
ture
2D-t
rict
ure
Mo
lecu
lar
Weig
ht
35
2.4
26
86
[g
/m
ol]
Mo
lecu
lar
Fo
rmu
laC
21H
24N
2O
3
XLo
gP
3-A
A2
.7H
-Bo
nd
Don
or
1H
-Bo
nd
Acc
ep
tor
5R
ota
tab
le B
on
d C
ou
nt
2
Exact
Mass
35
2.1
78
69
3M
on
oIs
oto
pic
Mass
35
2.1
78
69
3T
op
olo
gic
al P
ola
r S
urf
ace
Are
a5
4.6
Heavy A
tom
Co
un
t2
6Fo
rmal C
harg
e0
Co
mp
lexit
y6
06
Iso
tope A
tom
Cou
nt
0
Defi
ned
Ato
m S
tere
oC
en
ter
Co
un
t4
Un
defi
ned
Ato
m S
tere
oC
en
ter
Co
un
t0
Defi
ned
Bo
nd
Ste
reo
Cen
ter
Co
un
t0
Un
defi
ned
Bo
nd
Ste
reo
Cen
ter
Co
un
t0
Co
vale
ntl
y-B
on
ded
Un
it C
ou
nt
1
3D-S
tric
ture
2D-t
rict
ure
Mol
ecula
r W
eigh
t352.4
2686 [
g/m
ol]
Mol
ecula
r Fo
rmula
C21H
24N
2O
3
XLo
gP3
-AA
2.7
H-B
ond D
onor
1H
-Bon
d A
ccep
tor
5Rot
atab
le B
ond C
ount
2Exa
ct M
ass
352.1
78693
Mon
oIso
topic
Mas
s352.1
78693
Top
olog
ical
Pol
ar S
urf
ace
Are
a54.6
Hea
vy A
tom
Cou
nt
26
Form
al C
har
ge
0Com
ple
xity
606
Isot
ope
Ato
m C
ount
0D
efin
ed A
tom
Ste
reoC
ente
r Cou
nt
3U
ndef
ined
Ato
m S
tere
oCen
ter
Cou
nt
1D
efin
ed B
ond S
tere
oCen
ter
Cou
nt
0
Undef
ined
Bon
d Ste
reoC
ente
r Cou
nt
0Cov
alen
tly-
Bon
ded
Unit C
ount
1
Table No. (1) Continue
_________________________________________ Review of Literature
19
Isom
eris
m(7
)Te
trahy
droa
lsto
nine
Isom
eris
m(8
)A
jmal
icin
e m
ethy
l ace
tal
Isom
eris
m(9
)A
jmal
icin
e A
lsto
nine
,3,4
,5,6
-tetra
hydr
o
3Dno
t ava
ilabl
e2D
-Str
ictu
reM
olec
ular
Wei
ght
352.
4268
6 [g
/mol
]
Mol
ecul
ar F
orm
ula
C21
H24
N2O
3
XLo
gP3-
AA
2.7
H-B
ond
Don
or1
H-B
ond
Acc
epto
r5
Rot
atab
le B
ond
Cou
nt2
Exac
t M
ass
352.
1786
93
Mon
oIso
topi
c M
ass
352.
1786
93
Topo
logi
cal P
olar
Sur
face
Are
a54
.6
Hea
vy A
tom
Cou
nt26
Form
al C
harg
e0
Com
plex
ity60
6
Isot
ope
Ato
m C
ount
0
Def
ined
Ato
mSte
reoC
ente
r Cou
nt4
Und
efin
ed A
tom
Ste
reoC
ente
r Cou
nt0
Def
ined
Bon
d Ste
reoC
ente
r Cou
nt0
Und
efin
ed B
ond
Ste
reoC
ente
r Cou
nt0
Cov
alen
tly-B
onde
d U
nit
Cou
nt1
3D n
ot a
vaila
ble
2D-S
tric
ture
Prop
ertie
s not
ava
ilabl
e3D
-Str
ictu
re2D
-tric
ture
Mol
ecul
ar W
eigh
t35
2.42
686
[g/m
ol]
Mol
ecul
ar F
orm
ula
C21
H24
N2O
3
XLo
gP3-
AA
2.7
H-B
ond
Don
or1
H-B
ond
Acc
epto
r5
Rot
atab
le B
ond
Cou
nt2
Exac
t M
ass
352.
1786
93
Mon
oIso
topi
c M
ass
352.
1786
93
Topo
logi
calP
olar
Sur
face
Are
a54
.6
Hea
vy A
tom
Cou
nt26
Form
al C
harg
e0
Com
plex
ity60
6
Isot
ope
Ato
m C
ount
0
Def
ined
Ato
m S
tere
oCen
ter
Cou
nt4
Und
efin
ed A
tom
Ste
reoC
ente
r Cou
nt0
Def
ined
Bon
d Ste
reoC
ente
r Cou
nt0
Und
efin
ed B
ond
Ste
reoC
ente
r Cou
nt0
Cov
alen
tly-B
onde
d U
nit
Cou
nt1
Table No. (1) Continue
_________________________________________ Review of Literature
20
II.4. Effect of radiation on Isozymes banding patterns.
Flaig and Schmid (1966). reported that differences in the
content on different compounds or enzyme activities have been
observed in irradiated seeds, seedling and plant organs. Thus the
content of sucrose and other sugars increased with increasing
doses of irradiation. Changes in the activities of different
enzymes, such as acid phosphatase, peroxidase, polyphenralase
has been observed, sometimes an increase in activity could be
observed using low doses. For example, respiration is often
increased and content of chlorophyll can be increased after
irradiation.
Toth et al., (1983). Said that there were differences in
isoperoxidase patterns within and between from seeds of Digitalis
lanata treated with Gamma rays and another untreated
plants.Georgieva (1987). reported that increasing the Gamma
irradiation doses enhanced peroxidase activity Lilium regali. and
Beta vulgaris.
Mollenschott and Berlin (1984). The purification of
Tryptophandecarboxylase from Catharanthus roseas (TDC, E.C.:
4.1.1.27), to apparent homogeneity, the enzyme represents a
soluble protein with a molecular weight of 115 000 + 3 000,
consisting of 2 identical subunits of 54 000 + 1 000. The pI was
estimated to be 5.9 and the K m for L-tryptophan was found to be
7.5 × 10 -5 M. Phenylalanine, tyrosine and DOPA were not
decarboxylated by tryptophan decarboxylase from Catharanthus
cells. Similar to the aromatic amino acid decarboxylase from hog
_________________________________________ Review of Literature
21
kidney the enzyme does not appear to be obligatorily dependent
on exogenously supplied pyridoxal phosphate, as it seems to
contain a certain amount of this cofactor. The average percentage
of TDC in the cells was found to be 0.002% in the growth
medium while the level increased up to 0.03% when indole
alkaloid biosynthesis was induced. The role of the protein as a
bottleneck enzyme of indole alkaloid biosynthesis is discussed.
Peter and Frank (1991) suspension-cultured cells of
Catharanthus roseus (L.) G. Don were immobilized on glass fibre
mats and cultivated in shake flasks. The highly-aggregated
immobilized cells exhibited a slower growth rate and accumulated
reduced levels of tryptamine and indole alkaloids, represented by
catharanthine and ajmalicine, in comparison to cells in
suspension. The increased total protein synthesis in immobilized
cells suggests a diversion of the primary metabolic flux toward
protein biosynthetic pathways and away from other growth
processes. In-vitro assays for the specific activity of tryptophan
decarboxylase (TDC) and Tryptophan synthase (TS) suggest that
the decreased accumulation of tryptamine in immobilized cells
was due to reduced tryptophan biosynthesis. The specific activity
of TDC was similar in immobilized and suspension-cultured cells.
However, the expression of TS activity in immobilized cells was
reduced to less than 25% of the maximum level in suspension-
cultured cells. The reduced availability of a free tryptophan pool
in immobilized cells is consistent with the reduced TS activity.
Reduced tryptamine accumulation, however, was not responsible
_________________________________________ Review of Literature
22
for the decreased accumulation of indole alkaloids in immobilized
cells. Indole alkaloid accumulation increased to a similar level in
immobilized and suspension- cultured cells only after the addition
of exogenous secologanin to the culture medium. The addition of
tryptophan resulted in increased accumulation of tryptamine, but
had no effect on Indole alkaloid levels. Reduced biosynthesis of
secologanin, the monoterpenoid precursor to Indole alkaloids, in
immobilized cells is suggested. Immobilization does not appear to
alter the activity of Indole alkaloid biosynthetic enzymes in our
system beyond, and including, Strrictosidinesynthase.
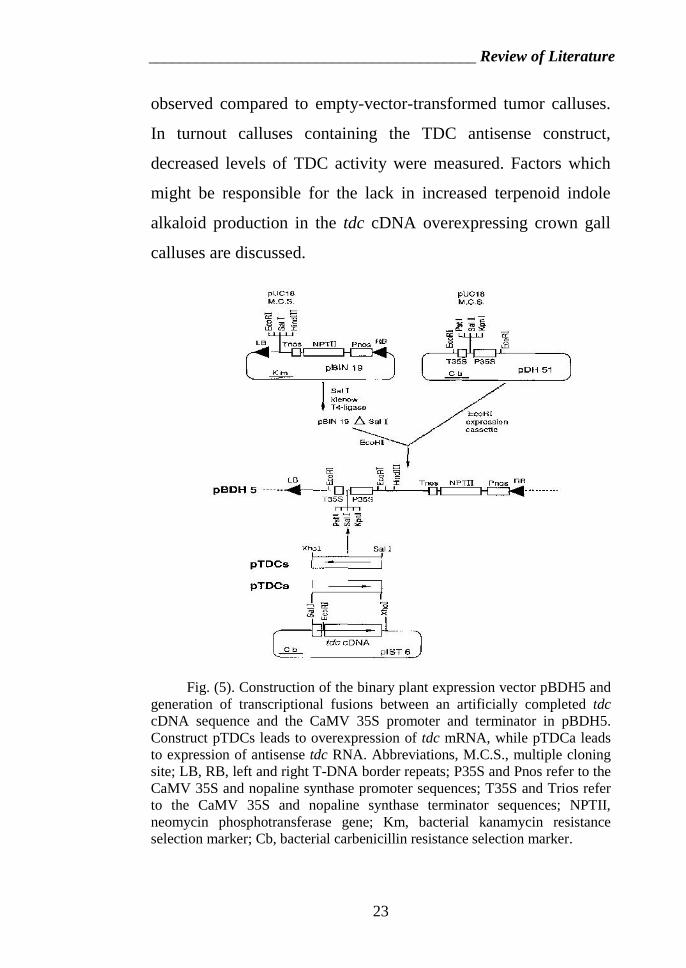
The enzyme tryptophan decarboxylase (TDC) (EC 4.1.1.28)
catalyses a key step in the biosynthesis of terpenoid indole
alkaloids in C. roseus by converting tryptophan into tryptamine.
Hardly any tdc mRNA could be detected in hormone-independent
callus and cell suspension cultures transformed by the oncogenic
T-DNA of Agrobacterium tumefaciens. Oscar et al., (1995).
Supply of tryptamine may therefore represent a limiting factor in
the biosynthesis of alkaloids by such cultures. To investigate this
possibility, chimaeric gene constructs, in which a TDC cDNA is
linked in the sense or antisense orientation to the cauliflower
mosaic virus 35S promoter and terminator, were introduced in C.
roseus cells by infecting seedlings with an oncogenic A.
tumefaciens strain. In the resulting crown gall tumour calluses
harbouring the tdc sense construct, an increased TDC protein
Level, TDC activity and tryptamine content but no
significant increase in terpenoid indole alkaloid production was
_________________________________________ Review of Literature
23
observed compared to empty-vector-transformed tumor calluses.
In turnout calluses containing the TDC antisense construct,
decreased levels of TDC activity were measured. Factors which
might be responsible for the lack in increased terpenoid indole
alkaloid production in the tdc cDNA overexpressing crown gall
calluses are discussed.
Fig. (5). Construction of the binary plant expression vector pBDH5 andgeneration of transcriptional fusions between an artificially completed tdccDNA sequence and the CaMV 35S promoter and terminator in pBDH5.Construct pTDCs leads to overexpression of tdc mRNA, while pTDCa leadsto expression of antisense tdc RNA. Abbreviations, M.C.S., multiple cloningsite; LB, RB, left and right T-DNA border repeats; P35S and Pnos refer to theCaMV 35S and nopaline synthase promoter sequences; T35S and Trios referto the CaMV 35S and nopaline synthase terminator sequences; NPTII,neomycin phosphotransferase gene; Km, bacterial kanamycin resistanceselection marker; Cb, bacterial carbenicillin resistance selection marker.
_________________________________________ Review of Literature
24
Serap et al., (1998). The transgenic cell line of
Catharanthus roseus (L.) G. Don S10 was used to study the effect
of the presence of the synthetic auxins naphthalene acetic acid and
2,4-dichlorophenoxyeacetic acid in the culture medium on the
accumulation of terpenoid indole alkaloids. Line S10 carries a
recombinant, constitutively over-expressed version of the
endogenous strictosidine synthase gene. The experiments were
carried out using a two-stage culture system, consisting of a
growth phase of 7 to 10 days and a production phase of 14 or 30
days. The hormonal composition was a crucial factor when
formulating both the growth and the production media. It was
determined that the presence of naphthalene acetic acid during the
production phase led to lower levels of alkaloid accumulation.
The presence of 2,4-dichlorophenoxyacetic acid in the growth
medium reduced culture aggregation and repressed secondary
metabolism. Cultures grown in medium containing 2,4-
dichlorophenoxyacetic acid showed reduced capacity to supply
biosynthetic precursors, which resulted in low levels of
accumulation of terpenoid indole alkaloids. The expression of the
gus and strictosidine synthase transgenes, measured at the enzyme
level, was similarly high under all conditions tested.
In situ RNA hybridization and immunocytochemistry were
used to establish the cellular distribution of monoterpenoid indole
alkaloid biosynthesis in Madagascar periwinkle (Catharanthus
roseus). Tryptophan decarboxylase (TDC) and strictosidine
synthase (STR1), which are involved in the biosynthesis of the
_________________________________________ Review of Literature
25
central intermediate strictosidine, and desacetoxyvindoline 4-
hydroxylase (D4H) and deacetylvindoline 4-O-acetyltransferase
(DAT), which are involved in the terminal steps of vindoline
biosynthesis, were localized. TDC and STR1 mRNAs were
present in the epidermis of stems, leaves, and flower buds,
whereas they appeared in most protoderm and cortical cells
around the apical meristem of root tips. Benoit et al., (1999) in
marked contrast, d4h and dat mRNAs were associated with the
laticifer and idioblast cells of leaves, stems, and flower buds.
Immunocytochemical localization for TDC, D4H, and DAT
proteins confirmed the differential localization of early and late
stages of vindoline biosynthesis. Therefore, we concluded that the
elaboration of the major leaf alkaloids involves the participation
of at least two cell types and requires the intercellular
translocation of a pathway intermediate. A basipetal gradient of
expression in maturing leaves also was shown for all four genes
by in situ RNA hybridization studies and by complementary
studies with dissected leaves, suggesting that expression of the
Vindoline pathway occurs transiently during early leaf
development. These results partially explain why attempts to
produce Vindoline by cell culture technology have failed.
Giancarlo et al., (1999). Strictosidine synthase (STR) is a
key enzyme in the biosynthesis of terpenoid indole alkaloids. This
class of secondary metabolites harbours several pharmaceutically
important compounds used, among other applications, in cancer
treatment. Terpenoid indole alkaloid biosynthesis and expression
_________________________________________ Review of Literature
26
of biosynthetic genes including Str1 is induced by fungal elicitors.
To identify elicitor-responsive regulatory promoter elements and
trans-acting factors, the single-copy Str1 gene was isolated from
the subtropical plant species Catharanthus roseus (Madagascar
periwinkle). Str1 upstream sequences conferred elicitor-
responsive expression to the _-glucuronidase (gusA) reporter gene
in transgenic tobacco plants. Main enhancer sequences within the
Str1 promoter region studied were shown to be located between
_339 and _145. This region and two other regions of the promoter
bound the tobacco nuclear protein factor GT-1. A G-box located
around position _105 bound nuclear and cloned G-box-binding
factors (GBFs). A mutation that knocked out GBF binding had no
measurable effect on expression, which indicates that the G-box is
not essential for the elicitor responsiveness of the Str1 promoter.
No obvious homologies with promoter elements identified in
other elicitor-responsive genes were observed, suggesting that the
Str1 gene may depend on novel regulatory mechanisms.
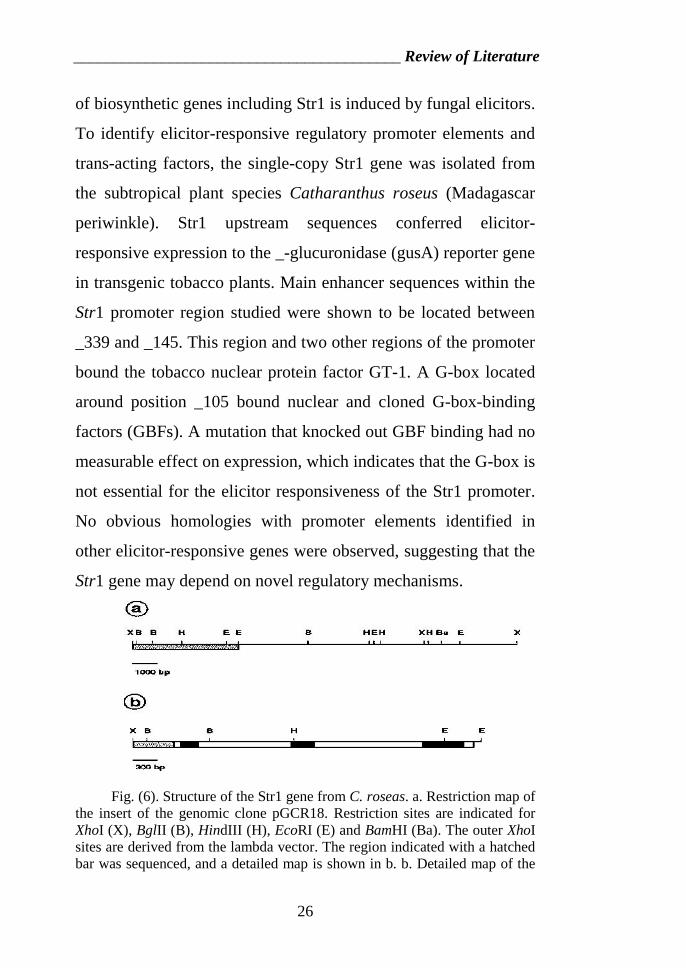
Fig. (6). Structure of the Str1 gene from C. roseas. a. Restriction map ofthe insert of the genomic clone pGCR18. Restriction sites are indicated forXhoI (X), BglII (B), HindIII (H), EcoRI (E) and BamHI (Ba). The outer XhoIsites are derived from the lambda vector. The region indicated with a hatchedbar was sequenced, and a detailed map is shown in b. b. Detailed map of the
_________________________________________ Review of Literature
27
Str1 gene and flanking sequences. The transcribed region is indicated withblack and white boxes. The black portions represent coding sequences. The50- and 30-untranslated regions as well as two introns are shown in white.The promoter region shown in Figure 2 is represented by a hatched bar.Restriction sites are indicated as in a. The XhoI site is derived from thelambda vector.
Leslie et al., (2000). Plants respond to pathogen attack by
induction of various defence responses, including the biosynthesis
of protective secondary metabolites. In Catharanthus roseus, the
elicitor-induced expression of the terpenoid indole alkaloid
biosynthetic gene Strictosidine synthase (STR) is mediated via the
plant stress hormone jasmonate. In the promoters of several
defence-related genes, cis-acting elements have been identified
that are important for transcriptional regulation upon stress
signals. Here we show that an upstream region in the STR
promoter confers responsiveness to partially purified yeast elicitor
and jasmonate. Yeast one-hybrid screening with this element as a
bait identified a MYB-like protein, which shows high homology
to parsley box P-binding factor-1 (PcBPF-1). In vitro analyses
showed that the STR promoter fragment contained a novel
binding site for BPF-1-like proteins with higher binding affinity
than the previously described box P. CrBPF-1 mRNA
accumulated rapidly in elicitor-treated C. roseus suspension cells,
whereas no induction was observed with jasmonate. Inhibitor
studies indicated that CrBPF-1 plays a role in an elicitor-
responsive but jasmonate-independent signal transduction
pathway, acting downstream of protein phosphorylation and
calcium influx.

_________________________________________ Review of Literature
28
FIG. (7). Overview of transcription factors that can interact with theSTR and TDC promoters. Perception of YE leads to an increase in JA levels,which is necessary for the activation of the ORCA transcription factors.Although the cellular location of the YE receptor is unknown, it is tentativelyplaced in the plasma membrane. The ORCA transcription factors can activategene expression via interaction with the TDC promoter and the RV fragmentof the STR promoter. Although the ORCA binding site in the TDC promoterhas not been precisely mapped, it is tentatively indicated downstream of theDB fragment. In addition, YE rapidly induces the accumulation of mRNAsencoding ZCT proteins, which can repress gene expression via binding to theDB fragment of the TDC promoter and the BA and, to a lesser extent, the RVfragments of the STR promoter. Also, YE induces accumulation of mRNAencoding CrBPF1, which is putatively involved in regulation of STR viainteraction with the BA region. CrGBF transcription factors can repress STRpromoter activity via binding to the NR region.
Bea et al., (2004). In Catharanthus roseas cell suspensions,
the expression of several terpenoid indole alkaloid biosynthetic
genes, including two genes encoding strictosidinesynthase (STR)
and tryptophan decarboxylase (TDC), is coordinately induced by
fungal elicitors such as yeast extract. To identify molecular
mechanisms regulating the expression of these genes, a yeast one-
hybrid screening was performed with an elicitor-responsive part
of the TDC promoter. This screening identified three members of
_________________________________________ Review of Literature
29
the Cys2/His2-type (transcription factor IIIA-type) zinc finger
protein family from C. roseas, ZCT1, ZCT2, and ZCT3. These
proteins bind in a sequence-specific manner to the TDC and STR
promoters in vitro and repress the activity of these promoters in
trans-activation assays. In addition, the ZCT proteins can repress
the activating activity of APETALA2/ethylene responsefactor
domain transcription factors, the ORCAs, on the STR promoter.
The expression of the ZCT genes is rapidly induced by yeast
extract and methyljasmonate. These results suggest that the ZCT
proteins act as repressors in the regulation of elicitor-induced
secondary metabolism in C. roseas.
Elizabeta et al., (2004). Vindoline, the major alkaloid in
cultures of Catharanthus roseus shoots, reached 2 mg g−1 dry wt
after 27 d in culture. Maximal vindoline accumulation coincided
with maximum activities of deacetoxyvindoline 4-hydroxylase,
deacetylvindoline acetyl-CoA acetyl transferase and tryptophan
decarboxylase. Shoot exposure to jasmonate shortened the time
required for the maximal vindoline accumulation to 14 d.
_________________________________________ Review of Literature
30
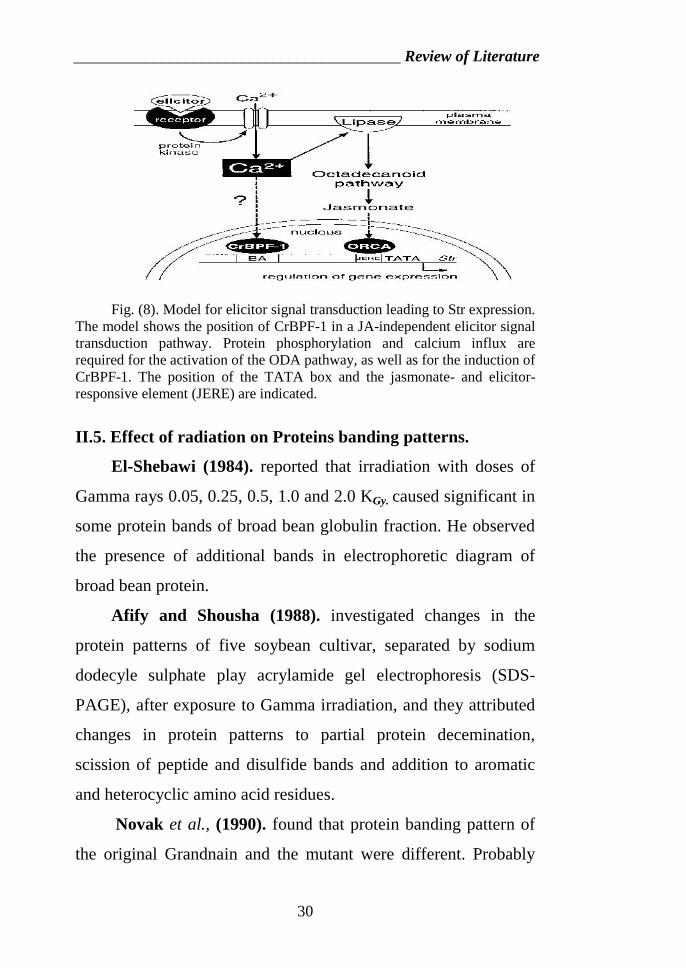
Fig. (8). Model for elicitor signal transduction leading to Str expression.The model shows the position of CrBPF-1 in a JA-independent elicitor signaltransduction pathway. Protein phosphorylation and calcium influx arerequired for the activation of the ODA pathway, as well as for the induction ofCrBPF-1. The position of the TATA box and the jasmonate- and elicitor-responsive element (JERE) are indicated.
II.5. Effect of radiation on Proteins banding patterns.
El-Shebawi (1984). reported that irradiation with doses of
Gamma rays 0.05, 0.25, 0.5, 1.0 and 2.0 KGy. caused significant in
some protein bands of broad bean globulin fraction. He observed
the presence of additional bands in electrophoretic diagram of
broad bean protein.
Afify and Shousha (1988). investigated changes in the
protein patterns of five soybean cultivar, separated by sodium
dodecyle sulphate play acrylamide gel electrophoresis (SDS-
PAGE), after exposure to Gamma irradiation, and they attributed
changes in protein patterns to partial protein decemination,
scission of peptide and disulfide bands and addition to aromatic
and heterocyclic amino acid residues.
Novak et al., (1990). found that protein banding pattern of
the original Grandnain and the mutant were different. Probably
_________________________________________ Review of Literature
31
the most prominent differences was in the intensity quantity and
mobility of a major protein raving a molecular might of about 33
Kda. The original clone showed a densely stained band which
migrated faster (Rf = 0.44) than that of the mutant Gn = 60 Gy/A.
in addition three other bands were nat observed in the mutant, but
only in the original grand nain. Such band (i.e. proteins) were less
densely stained with an Rf value of 0.19, 0.31 and 0.64 and
molecular weight of about 94 and 26 Kda, respectively.
Cambecedes et al., (1991). found that among 20
regeneration plants from irradiation tests on Lonicera nitida
Maigrum, only one very slender mutants was characterized by the
lock of a 52 Kda. Band in the banding pattern of denaturated
soluble protein.
Kazuyuki et al., (2001). A peptidase (GICP) that cleaves the
Gln-Ile bond of a peptide Gly-Ile-Asp-Val-Gln-Ile-Tyr(T-1), a
sequence in phenylalanine oxidase, was purified from bovine
pancreas. The purified enzyme had an Mr of approximately
29,000, as determined by SDS-PAGE, and its N-terminal
sequence was identical to that of bovine pancreatic elastase II.
The enzyme released Gly-Ile-Asp-Val-Gln and Ile-Tyr from T-1
(Km 5 8.3 mM kcat 5 2.1 s21) and the catalytic efficiency (2.6 3
105 M21s21) was comparable to those of elastase II from porcine
pancreas and rat mesenteric arterial bed perfusate. The P1 site
specificity of GICP toward oxidized insulin A and B chains
suggested that major cleavage sites were the peptide bond at the
C-terminal side of Gln, Leu, His, and Tyr residues.
_________________________________________ Review of Literature
32
Rashed et al., (1997). treated high and low yielding soybean
plants with 15 Krad. of Gamma rays and analyzed then for protein
electrophoresis patterns (SDS – PAGE). The low and high
yielding treated plants were characterized by appearance and / or
the disappearance of some minor bands, which confirmed the
association between these bands and the gene expression of high
yielding trait.
II.6. Randomly amplification 0f polymorphic DNA
(RAPD)
Annemarie et al., (1993) reported that cytochrome P-450
monooxygenases are membrane-bound enzymes involved in a
wide range of biosynthetic pathways in plants. An efficient PCR
strategy for isolating cytochrome P-450 cDNA clones from plant
cDNA libraries is described. A set of degenerate primers for PCR
amplification was designed to recognize nucleotide sequences
specifying the highly conserved haembinding region of
cytochrome P-450 proteins. Using this primer set and a non-
specific primer, complementary to either the poly (A) tail of the
cDNA clones or a phage vector sequence, the others isolated 16
different cytochrome P-450 cDNA sequences from a cDNA
library of Catharanthus roseus.
Maria and Matgorzata (1999) infected Alstroemeria
seedlings with naturally infected lily 'Casablanca' with stunting
and flower bud deficiency phytoplasma resulted 3-4 weeks after
top grafting in chlorotic and/or necrotic stripes, whitening of the
leaves, shoot necrosis and die back. Flower discoloration or
_________________________________________ Review of Literature
33
malformation was not observed. Attempts to transmit
phytoplasma from naturally infected lily and experimentally
infected Alstroemeria to Catharanthus roseus by top grafting
resulted in stunted growth, dull yellowing and malformation of
the leaves in 4-6 weeks. Some plants were temporary entirely
vegetative and did not produce flowers. The periwinkle plants that
were bridged by Cuscuta odorata from the diseased lilies and
Alstroemerias showed similar symptoms as top-grafted ones.
With the universal primer pairs rU3/fU5 specific PCR product
with expected length -900 was amplified from samples collected
from lilies with severe symptoms and top grafted test plants. All
PCR products used for RFLP analysis after digestion with Alu I
showed the same restriction profiles. Position of three obtained
bands corresponded to the lengths of the DNA fragments of
American aster yellows (AAY) phytoplasma group.
A significant limitation of classical loss-of function screens
designed to dissect genetic pathways is that they rarely uncover
genes that function redundantly, are compensated by Helen et al.,
(2004) alternative metabolic or regulatory circuits, or which have
an additional role in early embryo or gametophyte development.
Activation T-DNA tagging is one approach that has emerged in
plants to help circumvent these potential problems. This technique
utilises a T-DNA sequence that contains four tandem copies of the
cauliflower mosaic virus (CaMV) 35S enhancer sequence. This
element enhances the expression of neighbouring genes either
side of the randomly integrated T-DNA tag, resulting in gain-of-
_________________________________________ Review of Literature
34
function phenotypes. Activation tagging has identified a number
of genes fundamental to plant development, metabolism and
disease resistance in Arabidopsis. This review provides selected
examples of these discoveries to highlight the utility of this
technology. The recent development of activation tagging
strategies for other model plant systems and the construction of
new more sophisticated vectors for the generation of conditional
alleles are also discussed. These recent advances have
significantly expanded the horizons for gain-of-function genetics
in plants.
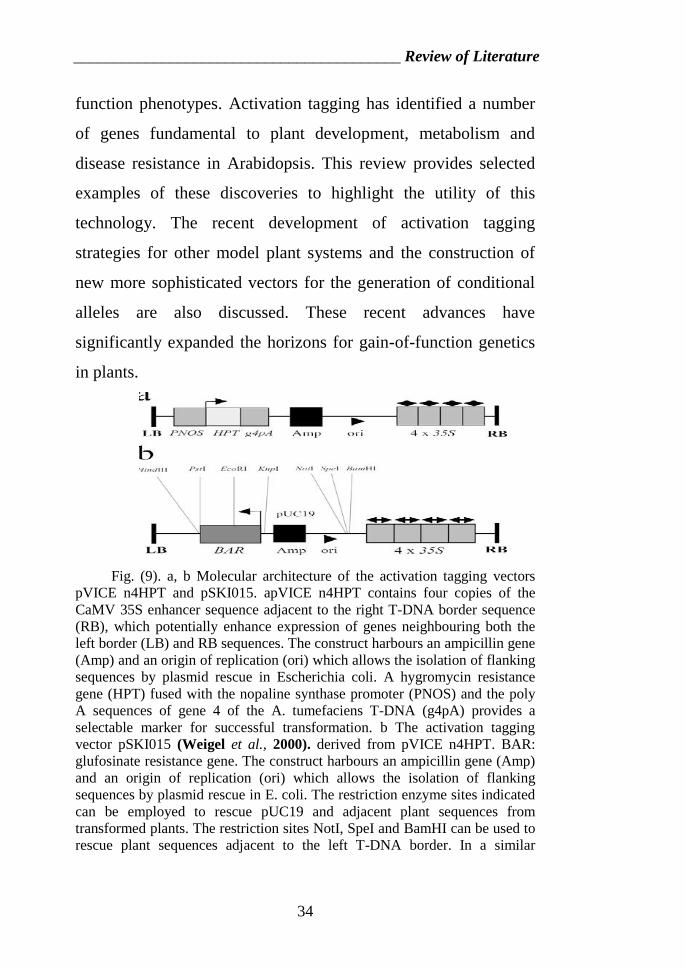
Fig. (9). a, b Molecular architecture of the activation tagging vectorspVICE n4HPT and pSKI015. apVICE n4HPT contains four copies of theCaMV 35S enhancer sequence adjacent to the right T-DNA border sequence(RB), which potentially enhance expression of genes neighbouring both theleft border (LB) and RB sequences. The construct harbours an ampicillin gene(Amp) and an origin of replication (ori) which allows the isolation of flankingsequences by plasmid rescue in Escherichia coli. A hygromycin resistancegene (HPT) fused with the nopaline synthase promoter (PNOS) and the polyA sequences of gene 4 of the A. tumefaciens T-DNA (g4pA) provides aselectable marker for successful transformation. b The activation taggingvector pSKI015 (Weigel et al., 2000). derived from pVICE n4HPT. BAR:glufosinate resistance gene. The construct harbours an ampicillin gene (Amp)and an origin of replication (ori) which allows the isolation of flankingsequences by plasmid rescue in E. coli. The restriction enzyme sites indicatedcan be employed to rescue pUC19 and adjacent plant sequences fromtransformed plants. The restriction sites NotI, SpeI and BamHI can be used torescue plant sequences adjacent to the left T-DNA border. In a similar
_________________________________________ Review of Literature
35
fashion, KpnI, PstI, EcoRI and HindIII sites can be used to rescue plantsequences adjacent to the right T-DNA border
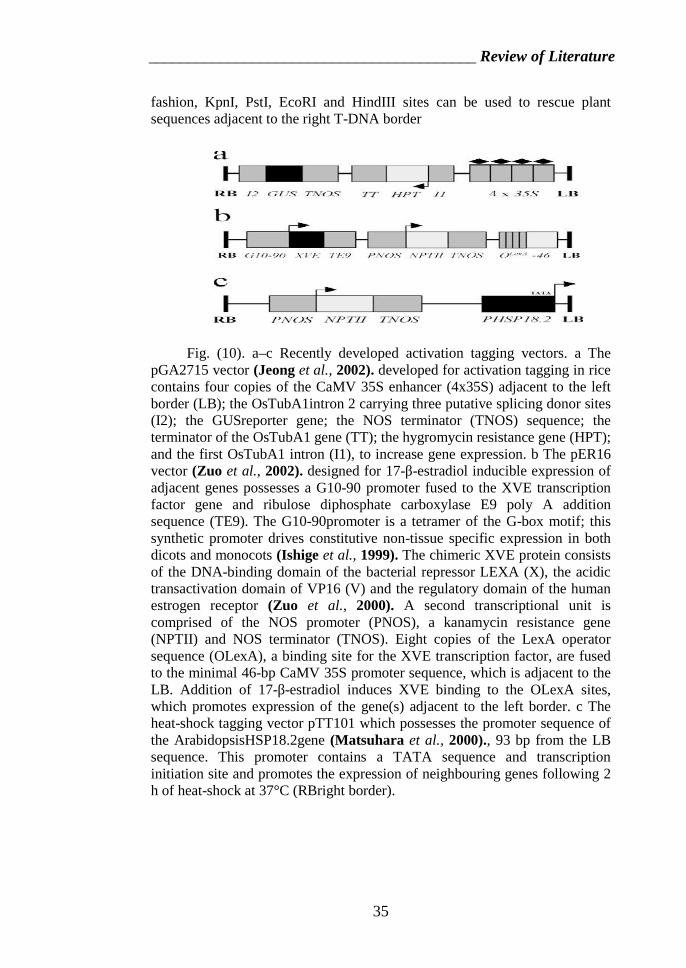
Fig. (10). a–c Recently developed activation tagging vectors. a ThepGA2715 vector (Jeong et al., 2002). developed for activation tagging in ricecontains four copies of the CaMV 35S enhancer (4x35S) adjacent to the leftborder (LB); the OsTubA1intron 2 carrying three putative splicing donor sites(I2); the GUSreporter gene; the NOS terminator (TNOS) sequence; theterminator of the OsTubA1 gene (TT); the hygromycin resistance gene (HPT);and the first OsTubA1 intron (I1), to increase gene expression. b The pER16vector (Zuo et al., 2002). designed for 17-β-estradiol inducible expression ofadjacent genes possesses a G10-90 promoter fused to the XVE transcriptionfactor gene and ribulose diphosphate carboxylase E9 poly A additionsequence (TE9). The G10-90promoter is a tetramer of the G-box motif; thissynthetic promoter drives constitutive non-tissue specific expression in bothdicots and monocots (Ishige et al., 1999). The chimeric XVE protein consistsof the DNA-binding domain of the bacterial repressor LEXA (X), the acidictransactivation domain of VP16 (V) and the regulatory domain of the humanestrogen receptor (Zuo et al., 2000). A second transcriptional unit iscomprised of the NOS promoter (PNOS), a kanamycin resistance gene(NPTII) and NOS terminator (TNOS). Eight copies of the LexA operatorsequence (OLexA), a binding site for the XVE transcription factor, are fusedto the minimal 46-bp CaMV 35S promoter sequence, which is adjacent to theLB. Addition of 17-β-estradiol induces XVE binding to the OLexA sites,which promotes expression of the gene(s) adjacent to the left border. c Theheat-shock tagging vector pTT101 which possesses the promoter sequence ofthe ArabidopsisHSP18.2gene (Matsuhara et al., 2000)., 93 bp from the LBsequence. This promoter contains a TATA sequence and transcriptioninitiation site and promotes the expression of neighbouring genes following 2h of heat-shock at 37°C (RBright border).
_________________________________________ Review of Literature
36
Ajaswrata et al., (2007) a. Plants produce secondary
metabolites in response to various external signals. Coordinated
transcriptional control of biosynthetic genes emerges as a major
mechanism dictating the accumulation of secondary metabolites
in plant cells. However, information about stress regulation of
secondary metabolites and the molecular mechanisms regulating
these specialized pathways are poorly understood. Here, we show
that terpenoid indolealkaloid (TIA) biosynthetic pathway is
differentially regulated in response to different abiotic stresses in
Catharanthus roseus a model medicinal plant producing
important anticancer and antihypertensive drugs. Semi
quantitative RT-PCR analysis of TIA and related primary
pathway genes in response to dehydration, low temperature,
salinity, UV-light and wounding revealed their negative
regulation in response to low temperature. HPLC analysis further
supports the notion that TIA biosynthetic pathway is negatively
controlled by low temperature stress. Furthermore, we report the
cloning of a C-repeat binding transcription factor from C. roseus
(CrCbf), belonging to AP2 class of transcription factor and
possessed the NLS and CBF signatures equence characteristic of
CBFs. CrCbf was found to be similar to Brassica Cbfs, whereas it
was distant to monocot Cbfs. Southern analysis of CrCbf revealed
the presence of more than one copy of CrCbf gene or other Cbf
homologues in C. roseus genome. The transcription of CrCbf was
found to be constitutive in response to low temperature but it
showed differential distribution. The need for identifying novel
_________________________________________ Review of Literature
37
transcription factors in understanding secondary metabolite
biosynthesis is discussed.
The understanding of the complexities and molecular events
regulating genes and the activators involved in terpenoid Indole
alkaloid (TIA) metabolism is known to a certain extent in cell
cultures of an important TIA yielding plant, Catharanthus roseas,
though it is not yet complete. Recently, the repressors of early
TIA pathway genes have also been identified. However, their
roles in the regulation of TIA pathway in C. roseas cell cultures
remains yet unknown. We have made a comparative profiling of
genes catalyzing the important steps of 2-C methyl-D-erythritol-
4-phosphate (MEP), shikimate and TIA biosynthetic pathways,
their activator and repressors using macroarray, semiquantitative
RT-PCR and northern analyses in a rotation culture system of C.
roseas comprising differentiated and proliferated cells. Our results
demonstrate that TIA biosynthetic pathway genes and their
activators show variable expression pattern, which was correlated
with the changes in the cellular conditions in these systems.
Under similar conditions, TIA pathway repressors show strong
and consistent expression. The role of repressors in the complex
regulation of the TIA pathway in C. roseas cell cultures is
discussed. The results were supported by HPLC data, which
demonstrated that the molecular program of cellular
differentiation is intimately linked with TIA pathway gene
expression and TIA production in C. roseas cell cultures.
Ajaswrata et al., (2007). b.
_________________________________________ Review of Literature
38
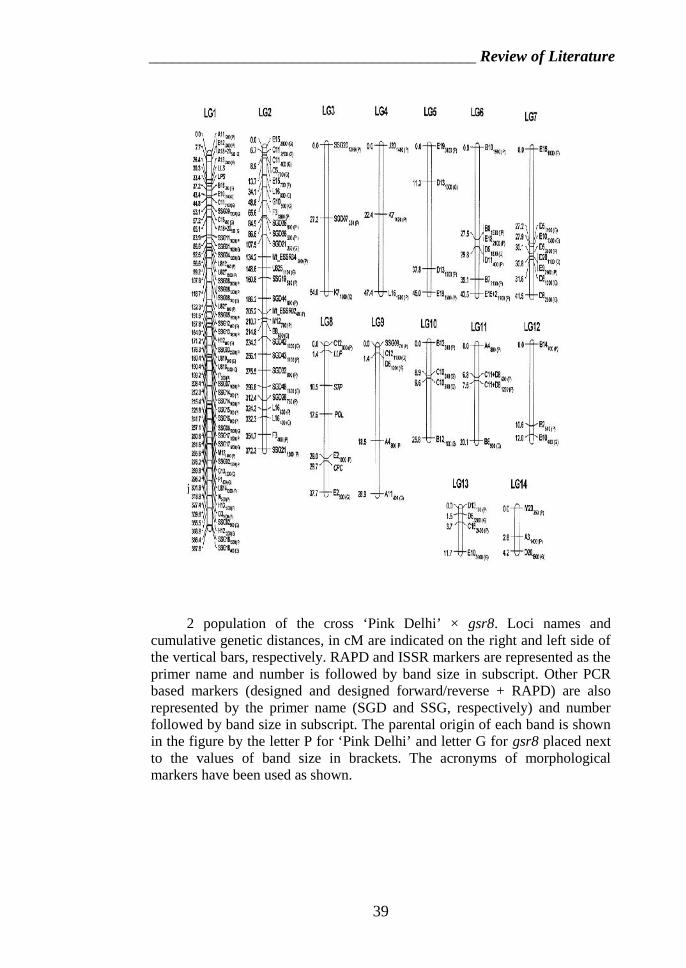
Sarika et al., (2007) an integrated genetic linkage map of
the medicinal and ornamental plant Catharanthus roseus, based
on different types of molecular and morphological markers was
constructed, using a F2 population of 144 plants. The map defines
14 linkage groups (LGs) and consists of 131 marker loci,
including 125 molecular DNA markers (76 RAPD, 3 RAPD
combinations; 7 ISSR; 2 EST-SSR from Medicago truncatula and
37 other PCR based DNA markers), selected from a total of 472
primers or primer pairs, and six morphological markers (stem
pigmentation, leaf lamina pigmentation and shape, leaf petiole
and pod size, and petal colour). The total map length is 1131.9 cM
(centiMorgans), giving an average map length and distance
between two markers equal to 80.9 cM and 8.6 cM, respectively.
The morphological markers/genes were found linked with nearest
molecular or morphological markers at distances varying from 0.7
to 11.4 cM. Linkage was observed between the morphological
markers concerned with lamina shape and petiole size of leaf on
LG1 and leaf, stem and petiole pigmentation and pod size on
LG8. This is the first genetic linkage map of C. roseas.
F
_________________________________________ Review of Literature
39
igure (11). Linkage map of Catharanthus roseas in the F
2 population of the cross ‘Pink Delhi’ × gsr8. Loci names andcumulative genetic distances, in cM are indicated on the right and left side ofthe vertical bars, respectively. RAPD and ISSR markers are represented as theprimer name and number is followed by band size in subscript. Other PCRbased markers (designed and designed forward/reverse + RAPD) are alsorepresented by the primer name (SGD and SSG, respectively) and numberfollowed by band size in subscript. The parental origin of each band is shownin the figure by the letter P for ‘Pink Delhi’ and letter G for gsr8 placed nextto the values of band size in brackets. The acronyms of morphologicalmarkers have been used as shown.
____________________________________ Materials and methods
٤١
III-Materials and methods
III.1-Materials:
III.1.1-plant materials:
This study was carried out by the cooperation
between genetic unit (Botany Dept., Faculty of Agriculture.,
AL-Azhar University) and (Genetic Engineering Laboratory,
Department of Natural Products Research, National Center
for Radiation Research and Technology, Atomic Energy
Authority, Nasr city, Cairo, Egypt).
Catharanthus roseus seeds of tow varieties (LM
& CP3) were obtained from Desert research center (D.R.C.),
Almatarea, Cairo, Egypt.
III.1.2- Cesium irradiation source:137Ce. was used a source of gamma rays with dose
rate 1K rad / 7.35 min. Catharanthus roseus cultivars were
exposed to gamma irradiation at National center for radiation
research and technology, Nasr city, Cairo, Egypt.
III.1.3-Media:
Water agar, free hormones were used in this work.
III.2-Methods:
Preparation seeds of tow varieties LM & CP3 of
Catharanthus roseas and culture initiation:
Seeds were washed with running after wards seeds tap
surface stabilized by soaking for 15 min in 30 % Clorox.
____________________________________ Materials and methods
٤٢
Then they were thoroughly washed to assure that any
residues of Clorox had been removed. They were placed in
jars contained Water agar free hormones. The cultured jars
were incubated in growth chamber at (29.5o + 2o C) under
photoperiod of 16 h. of 1000 LUX intensity.
III.2.1-Gamma radiation treatment:
Catharanthus roseas seedling were irradiated after
four weeks from culture on the media by gamma radiation
doses 0 as a control and 2, 4, 6, 8, 10, 12, 14, 16, 18 and 20
Krad. Cultures were incubated at the previous conditions.
Sub culturing was carried out after 4 weeks.
III.2.2. Alkaloids determination for LM & CP3
varieties:
For the determinations of terpenoid Indole alkaloids and fed
precursor(s) in the leaf, Pollets of cell were leaf ground in a
mortar with glass beads and centrifuged at 14000 g for 5 min
and 25 µl supernatant was injected directly into the HPLC
system Lucumi et al., (2001). Terpenoid Indole alkaloids,
Catharanthine, Vindoline, Vallesiachotamine(a),
Vallesiachotamine (b) Ajmalicine, Horhammericine (a),
Horhammericine (b), Vindolinine, 19-Epivindolineine,
Strrictosidinelactam, Serpentine and Vinamidine were
extracted from 100 mg freeze dried cell material with 15 ml
methanol using an Ultraturrax. After centrifugation at 3500 g
____________________________________ Materials and methods
٤٣
for 30 min, the methanolic extract was evaporated under
reduced pressure, 1 ml of the Mobile phase A was added to
the dry extract and the suspension was homogenized using a
vortex mixer. After centrifugation of the alkaloid solution at
14 000 g for 5 min, 25 µl of the supernatant was injected into
the HPLC system. The identity of the analyses was
established by photodiode array detection of their UV spectra
and ESP LC-MS. ESP LC-MS was performed on a Finnegan
MAT TSQ–700 triple-stage quadropole mass spectrometer
equipped with ESI–MS electro spray ionization. A gradient
system was developed for the determination of the iridous
and the alkaloids present in the sample and in the medium.
The solvent A consisted of water/ acetonitrile / tri fluoro
acetic acid (95:5:0.01, by vol.) (pH = 3) and the solvent B of
water/acetonitrile / tri fluoro acetic acid (5:95:0.01, by vol.)
(pH = 3), linear gradient of 18.5% acetonitrile over 20 min at
1 ml min−1. The column used was a Vydac C18 4.6, 25 cm
for peptide analysis with a C-18 pre-column. 1693 Because
of lack of sufficient pure reference compounds,
quantification was based on calibration curves with alkaloids
with similar UV-spectra: Strrictosidine was quantified using
the Ajmalicine calibration curve and vallesamine, O-
acetylvallesamine, voaphylline and others above using a
tryptamine calibration curve (detection at 280 nm).
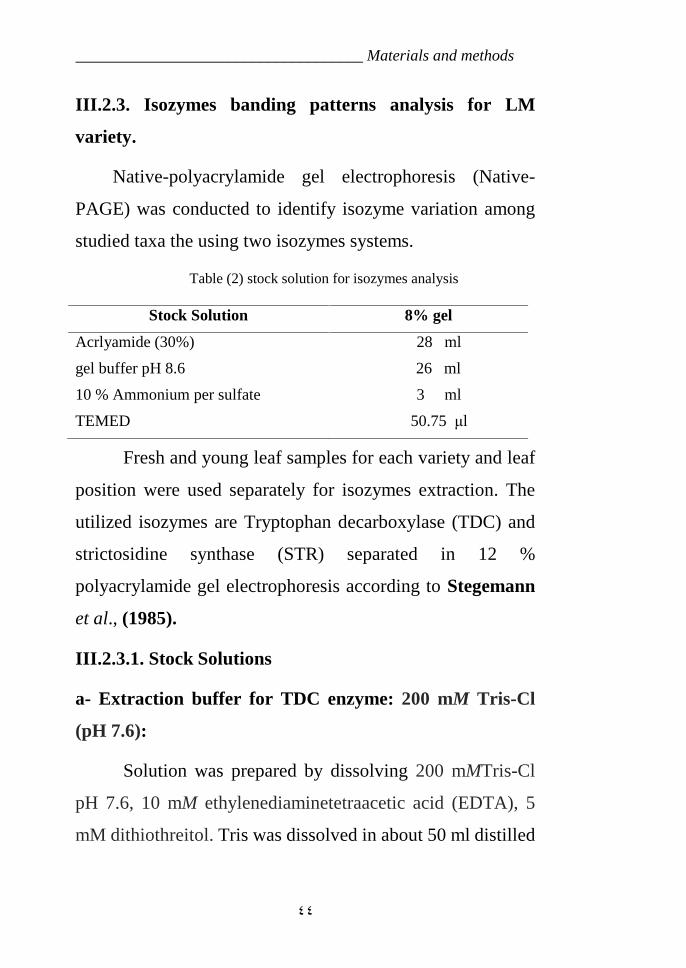
____________________________________ Materials and methods
٤٤
III.2.3. Isozymes banding patterns analysis for LM
variety.
Native-polyacrylamide gel electrophoresis (Native-
PAGE) was conducted to identify isozyme variation among
studied taxa the using two isozymes systems.
Table (2) stock solution for isozymes analysis
Fresh and young leaf samples for each variety and leaf
position were used separately for isozymes extraction. The
utilized isozymes are Tryptophan decarboxylase (TDC) and
strictosidine synthase (STR) separated in 12 %
polyacrylamide gel electrophoresis according to Stegemann
et al., (1985).
III.2.3.1. Stock Solutions
a- Extraction buffer for TDC enzyme: 200 mM Tris-Cl
(pH 7.6):
Solution was prepared by dissolving 200 mMTris-Cl
pH 7.6, 10 mM ethylenediaminetetraacetic acid (EDTA), 5
mM dithiothreitol. Tris was dissolved in about 50 ml distilled
Stock Solution 8% gel
Acrlyamide (30%) 28 ml
gel buffer pH 8.6 26 ml
10 % Ammonium per sulfate 3 ml
TEMED 50.75 μl
____________________________________ Materials and methods
٤٥
water and pH was adjusted to7.6 by HCl, then the volume
was completed to 100 ml with distilled water then kept at
4oC.
b- Equilibrated buffer to TDC enzyme for columns:
Solution was prepared by dissolving 50 mM Tris-Cl pH
7.5 and 28 mM ß-mercaptoethanol. About 50 ml distilled
water and pH was adjusted to7.5 by HCl, then the volume
was completed to 100 ml with distilled water then kept at
4oC.
c- Extraction buffer for STR enzyme: 200 mM Tris-Cl
(pH 7.6):
Solution was prepared by dissolving 1 m Tris-Cl pH 7.5,
4 mM dithiothreitol and 2 mM ethylenediaminetetra acetic
acid (EDTA), 5 mM dithiothreitol. Tris in about 50 ml
distilled water and pH was adjusted to7.6 by HCl, then the
volume was completed to 100 ml with distilled water then
kept at 4oC.
d- 30 % acrylamide stock:
The solution was prepared by dissolving 29.2 g
acrylamide and 0.8 g N, N, methylene bis–acrylamide in
about 70 ml distilled water, then the volume was completed
to 100 ml by distilled water. The stock solution was kept in
dark bottle at 4º C.
____________________________________ Materials and methods
٤٦
e- Electrode buffer (pH 8.65):
Electrode buffer was prepared by dissolving 18.55 g
boric acid and 2.5 g sodium hydroxide in 500 ml distilled
water and mixed well with magnetic stirrer, then pH was
adjusted into 8.6 by distilled water, and then kept at 4º C.
f- Gel buffers:
Separating gel buffer (1.5 M Tris – HCl, pH 8.8):
Tris 18.15 g
H2O (distilled water) up to 100 ml
Stacking gel buffer (0.5 M Tris – HCl pH 6.8):
Tris 6.05 g
H2O (distilled water) up to 100 ml
Ammonium persulfate solution (APS 10 %):
Ammonium persulfate 0.1 g
H2O (distilled water) up to 10 ml
III.2.3.2. Extraction of enzymes:
a- TDC enzyme:
Enzymes were extracted from the different C. roseas taxa
by homogenizing 1g fresh leaves samples in 2.5 ml
extraction buffer using a mortar and pestle. The extract was
then transferred into clean eppendorf tubes and centrifuged at
____________________________________ Materials and methods
٤٧
10000 rpm for 5 minutes. The supernatant was transferred to
new clean eppendorf tubes. Supernatant was desalted on PD-
10 columns (Pharmacia), previously equilibrated with the
equilibrated buffer. For TDC assays, the protein extract was
mixed with 50 nCi of L-[14C] H3 tryptophan (Amersham),
0.5 mM pyridoxal phosphate, and 50 mM Tris-Cl pH 7.5 in a
final volume of 120 µL. The mixtures were incubated at
37°C for 20 min and the reaction was stopped with 1.0 M
NaOH. The unreacted substrate (Rf 0.52) was separated from
the product (Rf 0.22) by thin layer chromatography (TLC)
(silica plates 0.2 mm, Merck) using 10% methanol in ethyl
acetate as solvent. The chromatograms were visualized under
UV light (366 nm) and the spots corresponding to the
product were scraped from the plates, counted and kept at –
20o C until use for the electrophoretic analysis. Felipe et al.,
(2002).
b- STR Enzyme
Enzymes were extracted from the different C. roseas taxa
by homogenizing 1g fresh leaves samples in 2.5 ml
extraction buffer using a mortar and pestle. In the presence of
polyvinylpyrrolidone (50 mg/g fresh weight). To the frozen
material one volume of extraction buffer. The material was
allowed to thaw and the extracts were clarified by
____________________________________ Materials and methods
٤٨
centrifugation for 30 min at 10000 rpm. The supernatant was
desalted on Sephadex G-25 (PD-10 columns, Pharmacia,
Uppsala, Sweden) equilibrated buffer. Incubation mixture for
SSS or STR activity determination contained 25 μl of
desalted protein extract and 62.5 μl of a cocktail containing
1.6 mM tryptamine-HCL and 8.0 mM secologanin in 0.1 mM
sodium phosphate buffer pH 6.8, together with 12.5 μl of a
freshly prepared solution of 0.8 mg D(+)-gluconic acid-δ-
lactone in 0.8 mg Tris. After incubation at 30 oC for 60 min.
the reaction was stopped by adding 75 μl of 5 %
trichloroacetic acid. Blanks were made by adding
trichloroacetic acid prior to the 60-min incubation period.
After addition of 14.8 μl of internal standard (8.0 mM cold-
HCL) and centrifugation, samples were analyzed on
acrylamide gel electrophoresis.
III.2.3.3. Gel preparation:
Vertical slab gel electrophoresis apparatus was used. All
glass plates were washed with tap and distilled water, then
surface sterilized with ethanol. Spacers of 1.5 mm were used.
Separating gel was prepared by mixing the chemical
components listed in Table (2). The prepared gel solution
was poured immediately between the two glass plates and
overlaid with isopropanol and left to polymerize for at least
one hour. After polymerization, isopropanol was removed.
____________________________________ Materials and methods
٤٩
Stacking gel was similarly, prepared by mixing the chemical
ingredients listed in Table (2) and then poured over the
separating gel. The comp was placed immediately. The gel
was left to polymerize. Table (2) showed the chemical
ingredients and their concentrations that used for preparing
both separating gel (resolving gel) and stacking gel.
III.2.3.4. Application of samples
A volume of 40 μl extract of each sample was mixed
with 20 μl sucrose and 10 μl bromophenol blue, then a
volume of 50 μl from this mixture was applied to each well.
III.2.3.5. Electrophoresis conditions:
The gel glasses were fixed to both lower and upper
tanks of the electrophoresis apparatus. The run (electrode)
buffer was added to both lower and upper tanks. The
apparatus was connected to the power supply. The run was
performed at 30 volt until the bromophenol blue dye has
reached the separating gel and then the voltage was increased
to 70 volt. Electrophoresis apparatus was placed inside a
refrigerator during running duration.
III.2.4. Protein banding patterns analysis for LM variety:
III.2.4.1. Stock Solutions
SDS polyacrlamid gel electrophoresis (SDS PAGE):
____________________________________ Materials and methods
٥٠
Sodium dodecyl sulphate polyacrlamid gel
electrophoresis (SDS PAGE) was performed according to the
method described by Laemmli, U. K. (1970). and modified
by Studier et al., (1973).
a- The monomer solution:
29.2g Acrylamide and 0.8 g Bis-acrylamide were
dissolved in 50 ml distilled water and completed to 100 ml,
filtered and kept at 4oC in a dark bottle to be used within
three months.
b- Resolving gel buffer (1.5 m tris-base, pH 8.8):
18.2g Tris-base was dissolved in 50 ml distilled water
and completed to 100 ml. the pH was adjusted at 8.8 with
analar Hcl. The solution was filtered and kept at 4oC.
c- Stacking gel buffer (0.5 m tris- base, pH 6.8):
6 g Tris-base were dissolved in 50 ml distilled water and
completed to 100 ml. The pH was adjusted at 6.8 with anal as
Hcl. The solution was filtered kept in a dark bottle at 4oC.
d- 10 % Sodium dodecyle sulfate (SDS):
10 g SDS were dissolved in 50 ml distilled water and
completed to 100 ml. This solution should be kept at room
temperature to avoid precipitation.
e- Ammonium persulphata (10 %) initiator:
0.5 g Ammonium persulphate was dissolved in 2 ml
distilled water. This solution must be freshly prepared to
____________________________________ Materials and methods
٥١
avoid disactivtion of the ammonium persulphate as a
polymerization catalyst.
f- TEMED: N,N Tetramethylenediamine:
TEMED is a strong polymerizing agent. The volume
required to carry out polymerization depends on the quality
of the used TEMED. In the present work, 50 µl and 30 μl of
TEMED were added for stacking and resolving geles,
respectively.
g- Overlay isopropyl:
50 ml Isopropyl alcohol and 5 ml distilled water.
h- Tank buffer:
6 g Tris-base, 28.8 g glycine and 20 ml of solution were
dissolved in 500 ml distilled water and completed to 2 liters.
i- Staining – Solution (1% COBB):
2g Coomassie brilliant blue (COBB, R250) were
dissolved in 200 ml distilled water, filtered and kept as a
stock solution. The staining solution was prepared as follows:
62.5 ml of stain stock, 250 ml of methyl alcohol and 50 ml of
acetic acid glacial were added, then completed to 500 ml
with distilled water.
j- Destining solution:
45 ml Methyl alcohol, 10 ml acetic acid glacial and 45
ml distilled water were added from the destining solution.
3.2.4.2. Extraction of proteins:
____________________________________ Materials and methods
٥٢
2g from leaf of the Catharanthus roseus plants ground
were to a final powder using a pestle and mortar in liquid
nitrogen. Total soluble proteins were then extracted
supernatant was taken as the total proteins extract.
a- Simple protein Determination:
Simple protein were analyzed by PAGE technology
according to Laemmi, U. K. (1970). SDS-PAGE is currently
the most commnly used electrophoretic technique in protein
analysis due to the ability of the strong anionic detergent
SDS, when used in the presence of disulfide band cleaving
reagents, to solubilize, denature and dissociate most proteins
to produce single polypeptide chains. Here, the protein
migration will be according to the molecular mass size only.
b- Preparation of protein samples:
Protein samples were prepared by mixing clear
supernatant with the sample buffer (treatment buffer) {tris-
Hcl, pH 6.8, 2% (W/V) SDS, 10% (W/V) sucrose, 0.1 %
(V/V) 2,β. Mercaptoethanol, 0.5 % (W/V) bromophenol
blue} in the ratio of 1:1 and denatured by heating in a boiling
water for 4 min, then loaded in equal amounts.
For the native gel, protein samples were prepared by
mixing clear supernatant with the treatment buffer which in
this case contains all components of denatured gel treatment
buffer except SDS.
____________________________________ Materials and methods
٥٣
III.2.4.3. Gel preparation:
a- Resolving gel:
10 ml of monomer, 7.5 ml of resolving Gel buffer 0.3 ml
of 10% SDS, and 12 ml distilled water were mixed and
shaked well.300 μl of freshly prepared ammonium
persulphate (soln.5) were added and shacked well. Finally,
30μ l TEMED was added just before gel casting.
b- Stacking gel:
1.33 ml of monomer solution (soln.1), 2.5 ml of stacking
gel buffer (soln.3), 0.1 ml of 10% SDS (soln.4), 100 μl
ammonium persulphate (solen.5) and 6.1 ml distilled water
were added, respectively and shaked just before gel casting,
50 μl TEMED were added.
c- Gel casting:
Biorad multigel-long is the device which was used in
protein electrophoresis. It is a complete system with two sets
of (12.5 x 11) Cm glass plates. Straight edge while, the other
is with fixed 1.0 mm spacers. A silicon rubber seal, 1 mm
was placed around the periphery of the fixed spacers, then
the other notched glass plate was carefully placed upon it.
The two plates were together by the mean of 6 clips. Two
cobbined plates were prepared as above to carry out gel
casting.
____________________________________ Materials and methods
٥٤
Resolving gel was poured in. between the two plates
leaving 2 Cm benath the plates end. Alayer of 90% isopropyl
alcohol was added over resolving gel to prevent corrugation
of the gel surface. Polymerization of the resolving gel took
from half to one hour after gel solidification, which can be
signicant by the interphase line between the alcohols arid the
solid gel, the alcohol was poured off.
Stacking gel mixture was added over the solid resolving
gel till the top of the glass plates. A comp consisted of 12
wells and 1.0 mm derision was used. The comb was placed
very gently into the liquid gel to avoid any air bubbles.
Stacking gel needed a pit longer time then resolving to be
solididfied. Once the solidification took place, the comb,
clips and the silicon rubber were removed. The two plate’s
acre installed in the electrophoresis chamber. The tank buffer
was added to immerse the wells completely. The protein
samples were pipetted in wells by automatic variable
micropipette (2-200) μ l.
III.2.4.4. Electrophoresis condition:
The run was earned out at 30 V till to loaded samples
passed the stacking gel and entered the resolving gel,
tracking dye (Bromophenol blue) reached the gel bottom.
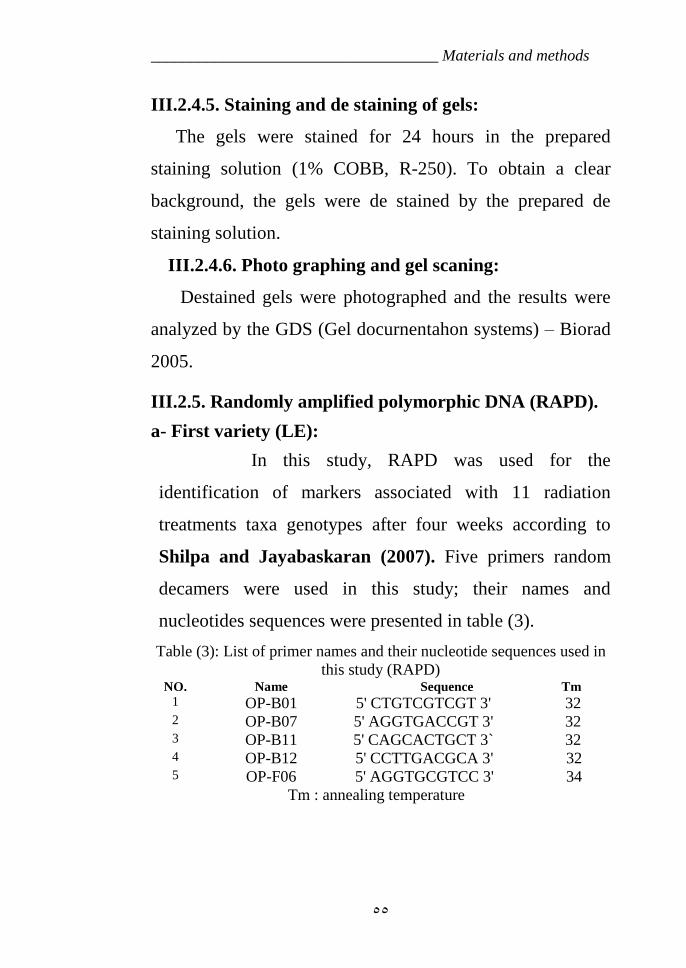
____________________________________ Materials and methods
٥٥
III.2.4.5. Staining and de staining of gels:
The gels were stained for 24 hours in the prepared
staining solution (1% COBB, R-250). To obtain a clear
background, the gels were de stained by the prepared de
staining solution.
III.2.4.6. Photo graphing and gel scaning:
Destained gels were photographed and the results were
analyzed by the GDS (Gel docurnentahon systems) – Biorad
2005.
III.2.5. Randomly amplified polymorphic DNA (RAPD).
a- First variety (LE):
In this study, RAPD was used for the
identification of markers associated with 11 radiation
treatments taxa genotypes after four weeks according to
Shilpa and Jayabaskaran (2007). Five primers random
decamers were used in this study; their names and
nucleotides sequences were presented in table (3).
Table (3): List of primer names and their nucleotide sequences used inthis study (RAPD)
NO. Name Sequence Tm1 OP-B01 5' CTGTCGTCGT 3' 322 OP-B07 5' AGGTGACCGT 3' 323 OP-B11 5' CAGCACTGCT 3` 324 OP-B12 5' CCTTGACGCA 3' 325 OP-F06 5' AGGTGCGTCC 3' 34
Tm : annealing temperature
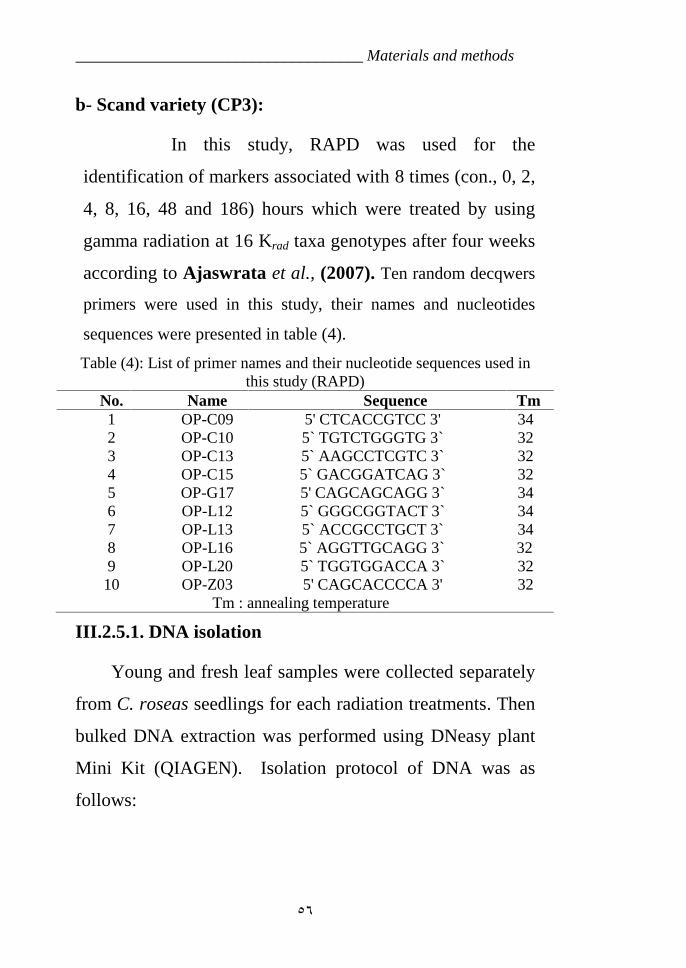
____________________________________ Materials and methods
٥٦
b- Scand variety (CP3):
In this study, RAPD was used for the
identification of markers associated with 8 times (con., 0, 2,
4, 8, 16, 48 and 186) hours which were treated by using
gamma radiation at 16 Krad taxa genotypes after four weeks
according to Ajaswrata et al., (2007). Ten random decqwers
primers were used in this study, their names and nucleotides
sequences were presented in table (4).
Table (4): List of primer names and their nucleotide sequences used inthis study (RAPD)
No. Name Sequence Tm1 OP-C09 5' CTCACCGTCC 3' 342 OP-C10 5` TGTCTGGGTG 3` 323 OP-C13 5` AAGCCTCGTC 3` 324 OP-C15 5` GACGGATCAG 3` 325 OP-G17 5' CAGCAGCAGG 3` 346 OP-L12 5` GGGCGGTACT 3` 347 OP-L13 5` ACCGCCTGCT 3` 348 OP-L16 5` AGGTTGCAGG 3` 329 OP-L20 5` TGGTGGACCA 3` 32
10 OP-Z03 5' CAGCACCCCA 3' 32Tm : annealing temperature
III.2.5.1. DNA isolation
Young and fresh leaf samples were collected separately
from C. roseas seedlings for each radiation treatments. Then
bulked DNA extraction was performed using DNeasy plant
Mini Kit (QIAGEN). Isolation protocol of DNA was as
follows:
____________________________________ Materials and methods
٥٧
1- Plant tissues were ground in liquid nitrogen to a fine powder
using a mortar and pestle. Then, the powder was transferred
to an appropriately sized tube and the liquid nitrogen was
allowed to evaporate.
2- Then, 400 µl of buffer AP1 and 4 µl of RNase a stock
solution (100 mg/ml) were added to a maximum of 100 mg
of ground plant tissues and vortexed vigorously.
3- Mixture was incubated for 10 min at 65oC and mixed 2-3
times during incubation by inverting tube.
4- Then, 130 µl of buffer AP2 was added to the lysate, mixed
and incubated for 5 min on ice.
5- Lysate was applied to the QIA shredder spin column
sitting in a 2 ml collection tube and centrifuged for 2 min at
12000 rpm
6-Flow-through friction from step 5 was transferred to a new
tube without disturbing the cell-debris pellet. Typically, 450
µl of lysate was recovered.
7- Then, 0.5 volume of buffer AP3 and 1 volume of ethanol (96-
100%) were added to the cleared lysate and mixed by
pipetting.
8- Then, 650 µl of the mixture from step 7 was applied through
DNeasy Mini spin column setting in a 2 ml collection tube.
____________________________________ Materials and methods
٥٨
Then, centrifuged for 1 min at 8000 rpm and flow-through
was then discarded.
9- DNeasy column was then placed in a new 2 ml collection
tube. Then, 500 µl buffer AW was added onto the DNeasy
column and centrifuged for 1 min at 8000 rpm. Flow-
through was discarded and reuse the collection tube in step
10 was reused.
10-Then, 500 µl buffer AW was added to DNeasy column and
centrifuged for 2 min at maximum speed to dry the column
membrane.
11-DNeasy column was then transferred to a 1.5 ml microfuge
tube and 100 µl of preheated (65oC) buffer AE was pipetted
directly onto the DNeasy column membrane. Then,
incubated for 5 min at room temperature and centrifuged for
1 min at 8000 rpm to elute.
12-Elution (step11) was repeated once as described. A new
microfuge can be used for first elute. Alternatively, the
microfuge tube can be reused for the second elution step to
combine the elutes.
III.2.5.2. Randomly amplified polymorphic DNA (RAPD)
procedure
PCR reactions were conducted using 15 arbitrary 10-mer
primers.
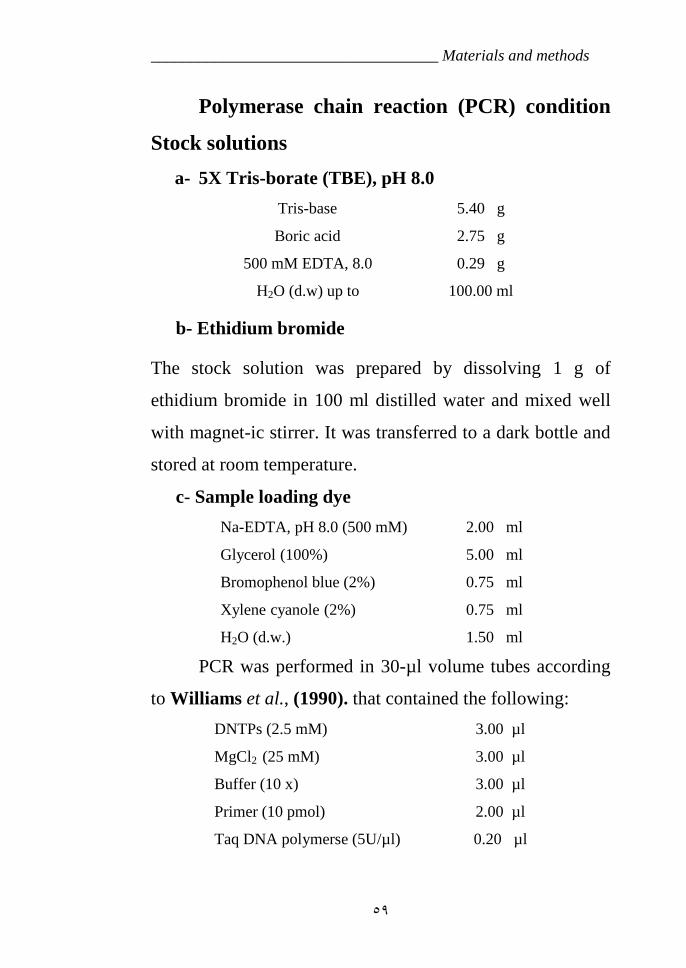
____________________________________ Materials and methods
٥٩
Polymerase chain reaction (PCR) condition
Stock solutions
a- 5X Tris-borate (TBE), pH 8.0
Tris-base 5.40 g
Boric acid 2.75 g
500 mM EDTA, 8.0 0.29 g
H2O (d.w) up to 100.00 ml
b- Ethidium bromide
The stock solution was prepared by dissolving 1 g of
ethidium bromide in 100 ml distilled water and mixed well
with magnet-ic stirrer. It was transferred to a dark bottle and
stored at room temperature.
c- Sample loading dye
Na-EDTA, pH 8.0 (500 mM) 2.00 ml
Glycerol (100%) 5.00 ml
Bromophenol blue (2%) 0.75 ml
Xylene cyanole (2%) 0.75 ml
H2O (d.w.) 1.50 ml
PCR was performed in 30-µl volume tubes according
to Williams et al., (1990). that contained the following:
DNTPs (2.5 mM) 3.00 µl
MgCl2 (25 mM) 3.00 µl
Buffer (10 x) 3.00 µl
Primer (10 pmol) 2.00 µl
Taq DNA polymerse (5U/µl) 0.20 µl
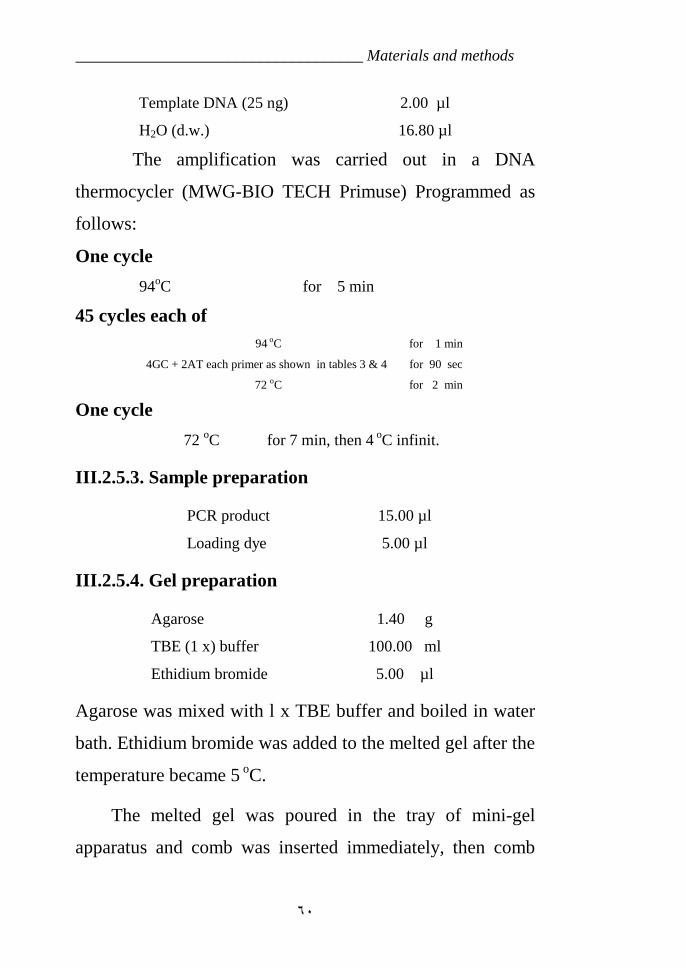
____________________________________ Materials and methods
٦٠
Template DNA (25 ng) 2.00 µl
H2O (d.w.) 16.80 µl
The amplification was carried out in a DNA
thermocycler (MWG-BIO TECH Primuse) Programmed as
follows:
One cycle
94oC for 5 min
45 cycles each of94 oC for 1 min
4GC + 2AT each primer as shown in tables 3 & 4 for 90 sec
72 oC for 2 min
One cycle
72 oC for 7 min, then 4 oC infinit.
III.2.5.3. Sample preparation
PCR product 15.00 µl
Loading dye 5.00 µl
III.2.5.4. Gel preparation
Agarose 1.40 g
TBE (1 x) buffer 100.00 ml
Ethidium bromide 5.00 µl
Agarose was mixed with l x TBE buffer and boiled in water
bath. Ethidium bromide was added to the melted gel after the
temperature became 5 oC.
The melted gel was poured in the tray of mini-gel
apparatus and comb was inserted immediately, then comb
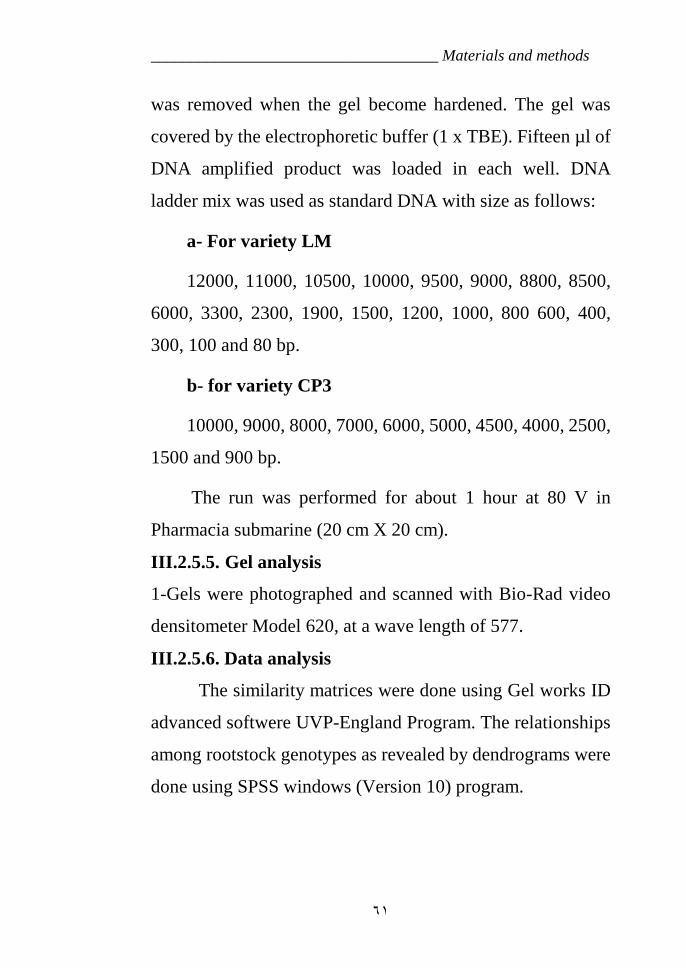
____________________________________ Materials and methods
٦١
was removed when the gel become hardened. The gel was
covered by the electrophoretic buffer (1 x TBE). Fifteen µl of
DNA amplified product was loaded in each well. DNA
ladder mix was used as standard DNA with size as follows:
a- For variety LM
12000, 11000, 10500, 10000, 9500, 9000, 8800, 8500,
6000, 3300, 2300, 1900, 1500, 1200, 1000, 800 600, 400,
300, 100 and 80 bp.
b- for variety CP3
10000, 9000, 8000, 7000, 6000, 5000, 4500, 4000, 2500,
1500 and 900 bp.
The run was performed for about 1 hour at 80 V in
Pharmacia submarine (20 cm X 20 cm).
III.2.5.5. Gel analysis
1-Gels were photographed and scanned with Bio-Rad video
densitometer Model 620, at a wave length of 577.
III.2.5.6. Data analysis
The similarity matrices were done using Gel works ID
advanced softwere UVP-England Program. The relationships
among rootstock genotypes as revealed by dendrograms were
done using SPSS windows (Version 10) program.
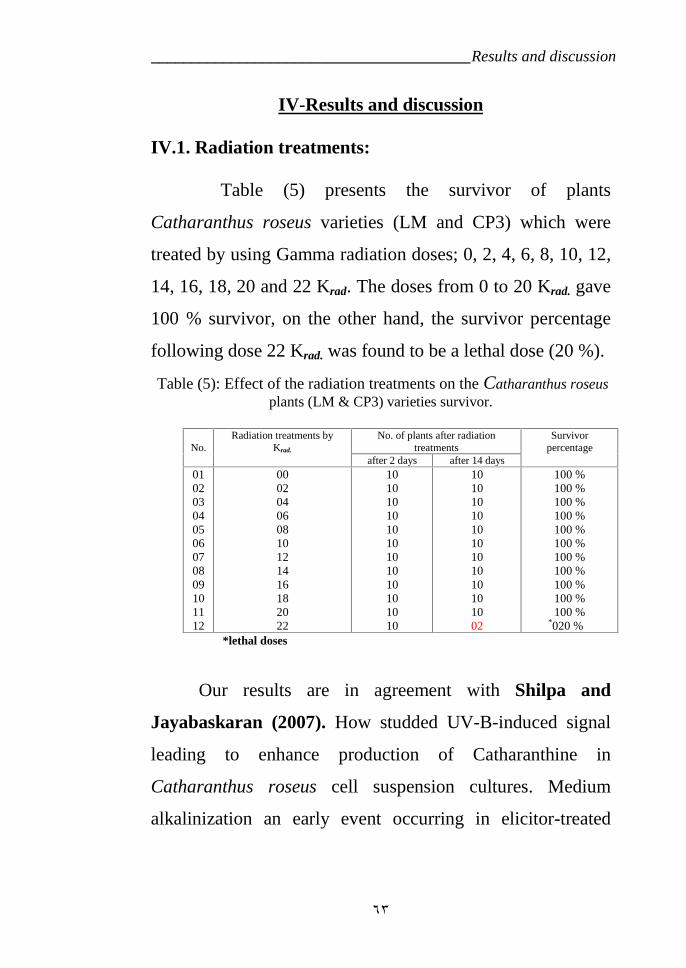
________________________________________Results and discussion
٦٣
ІV-Results and discussion
IV.1. Radiation treatments:
Table (5) presents the survivor of plants
Catharanthus roseus varieties (LM and CP3) which were
treated by using Gamma radiation doses; 0, 2, 4, 6, 8, 10, 12,
14, 16, 18, 20 and 22 Krad. The doses from 0 to 20 Krad. gave
100 % survivor, on the other hand, the survivor percentage
following dose 22 Krad. was found to be a lethal dose (20 %).
Table (5): Effect of the radiation treatments on the Catharanthus roseusplants (LM & CP3) varieties survivor.
*lethal doses
Our results are in agreement with Shilpa and
Jayabaskaran (2007). How studded UV-B-induced signal
leading to enhance production of Catharanthine in
Catharanthus roseus cell suspension cultures. Medium
alkalinization an early event occurring in elicitor-treated
No.Radiation treatments by
Krad.
No. of plants after radiationtreatments
Survivorpercentage
after 2 days after 14 days010203040506070809101112
000204060810121416182022
101010101010101010101010
101010101010101010101002
100 %100 %100 %100 %100 %100 %100 %100 %100 %100 %100 %
*020 %
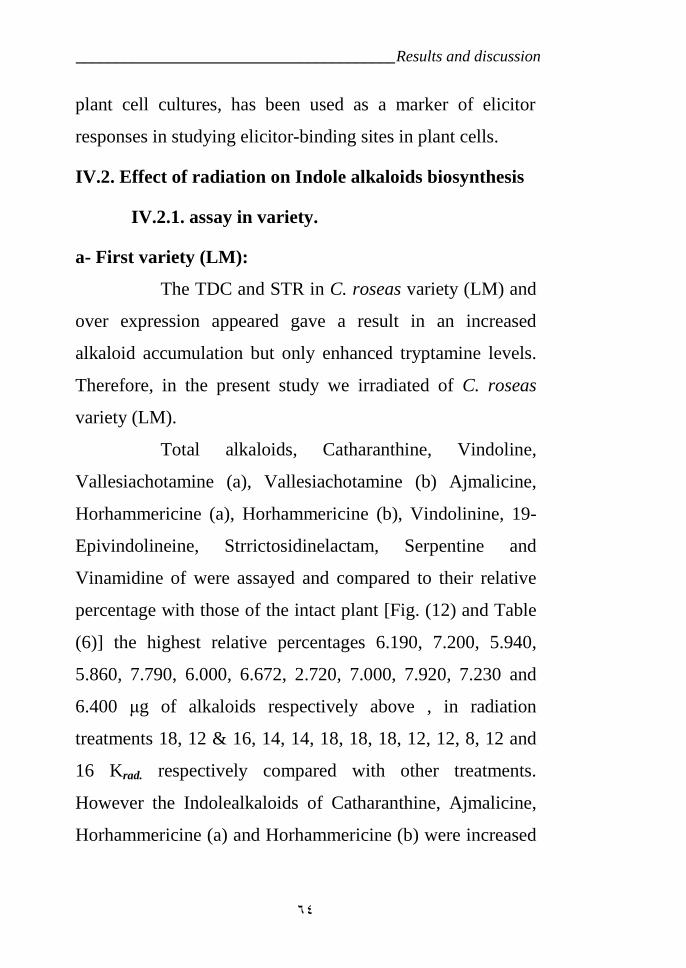
________________________________________Results and discussion
٦٤
plant cell cultures, has been used as a marker of elicitor
responses in studying elicitor-binding sites in plant cells.
IV.2. Effect of radiation on Indole alkaloids biosynthesis
IV.2.1. assay in variety.
a- First variety (LM):
The TDC and STR in C. roseas variety (LM) and
over expression appeared gave a result in an increased
alkaloid accumulation but only enhanced tryptamine levels.
Therefore, in the present study we irradiated of C. roseas
variety (LM).
Total alkaloids, Catharanthine, Vindoline,
Vallesiachotamine (a), Vallesiachotamine (b) Ajmalicine,
Horhammericine (a), Horhammericine (b), Vindolinine, 19-
Epivindolineine, Strrictosidinelactam, Serpentine and
Vinamidine of were assayed and compared to their relative
percentage with those of the intact plant [Fig. (12) and Table
(6)] the highest relative percentages 6.190, 7.200, 5.940,
5.860, 7.790, 6.000, 6.672, 2.720, 7.000, 7.920, 7.230 and
6.400 μg of alkaloids respectively above , in radiation
treatments 18, 12 & 16, 14, 14, 18, 18, 18, 12, 12, 8, 12 and
16 Krad. respectively compared with other treatments.
However the Indolealkaloids of Catharanthine, Ajmalicine,
Horhammericine (a) and Horhammericine (b) were increased
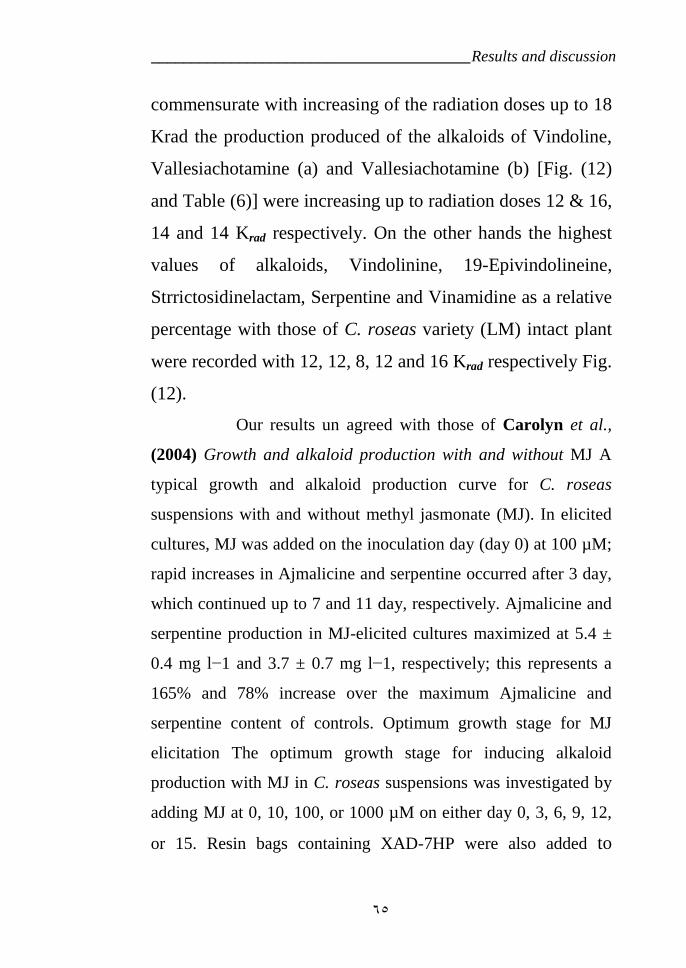
________________________________________Results and discussion
٦٥
commensurate with increasing of the radiation doses up to 18
Krad the production produced of the alkaloids of Vindoline,
Vallesiachotamine (a) and Vallesiachotamine (b) [Fig. (12)
and Table (6)] were increasing up to radiation doses 12 & 16,
14 and 14 Krad respectively. On the other hands the highest
values of alkaloids, Vindolinine, 19-Epivindolineine,
Strrictosidinelactam, Serpentine and Vinamidine as a relative
percentage with those of C. roseas variety (LM) intact plant
were recorded with 12, 12, 8, 12 and 16 Krad respectively Fig.
(12).
Our results un agreed with those of Carolyn et al.,
(2004) Growth and alkaloid production with and without MJ A
typical growth and alkaloid production curve for C. roseas
suspensions with and without methyl jasmonate (MJ). In elicited
cultures, MJ was added on the inoculation day (day 0) at 100 µM;
rapid increases in Ajmalicine and serpentine occurred after 3 day,
which continued up to 7 and 11 day, respectively. Ajmalicine and
serpentine production in MJ-elicited cultures maximized at 5.4 ±
0.4 mg l−1 and 3.7 ± 0.7 mg l−1, respectively; this represents a
165% and 78% increase over the maximum Ajmalicine and
serpentine content of controls. Optimum growth stage for MJ
elicitation The optimum growth stage for inducing alkaloid
production with MJ in C. roseas suspensions was investigated by
adding MJ at 0, 10, 100, or 1000 µM on either day 0, 3, 6, 9, 12,
or 15. Resin bags containing XAD-7HP were also added to
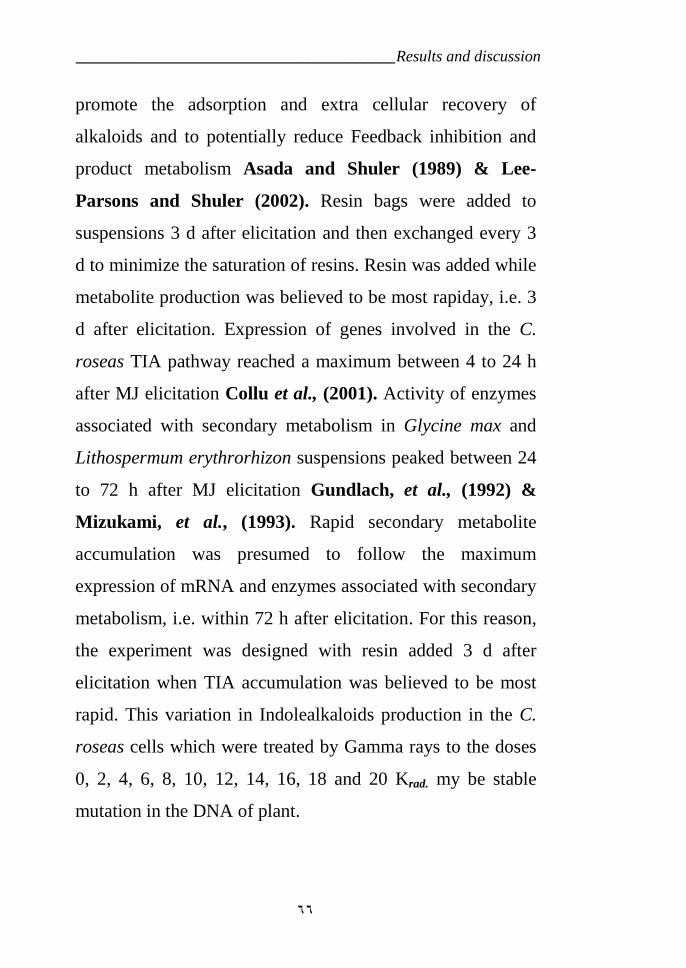
________________________________________Results and discussion
٦٦
promote the adsorption and extra cellular recovery of
alkaloids and to potentially reduce Feedback inhibition and
product metabolism Asada and Shuler (1989) & Lee-
Parsons and Shuler (2002). Resin bags were added to
suspensions 3 d after elicitation and then exchanged every 3
d to minimize the saturation of resins. Resin was added while
metabolite production was believed to be most rapiday, i.e. 3
d after elicitation. Expression of genes involved in the C.
roseas TIA pathway reached a maximum between 4 to 24 h
after MJ elicitation Collu et al., (2001). Activity of enzymes
associated with secondary metabolism in Glycine max and
Lithospermum erythrorhizon suspensions peaked between 24
to 72 h after MJ elicitation Gundlach, et al., (1992) &
Mizukami, et al., (1993). Rapid secondary metabolite
accumulation was presumed to follow the maximum
expression of mRNA and enzymes associated with secondary
metabolism, i.e. within 72 h after elicitation. For this reason,
the experiment was designed with resin added 3 d after
elicitation when TIA accumulation was believed to be most
rapid. This variation in Indolealkaloids production in the C.
roseas cells which were treated by Gamma rays to the doses
0, 2, 4, 6, 8, 10, 12, 14, 16, 18 and 20 Krad. my be stable
mutation in the DNA of plant.
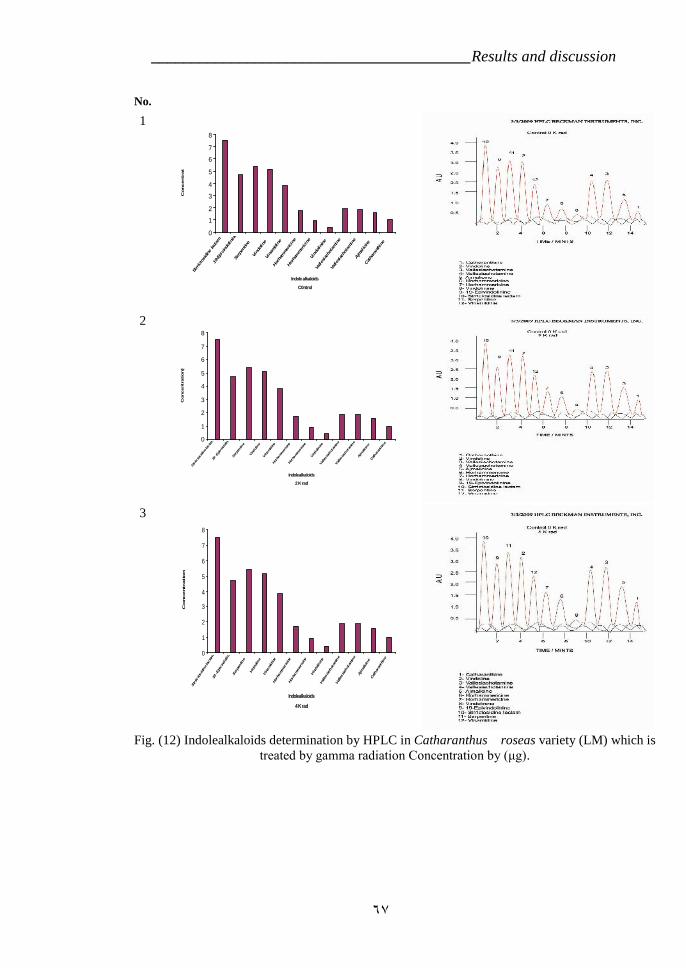
________________________________________Results and discussion
٦٧
No.
1
0
1
2
3
4
5
6
7
8
Strrictos
idine
lacta
m
19-Epivin
dolin
ine
Serpen
tine
Vind
oline
Vina
midine
Horham
meric
ine
Horham
meric
ine
Vind
olinin
e
Valle
siach
otam
ine
Valle
siach
otam
ine
Ajma
licine
Catharan
thine
Indole alkaloids
C0ntrol
Concentr
atin
2
0
1
2
3
4
5
6
7
8
Strrictos
idine
lactam
19-E
pivind
olinine
Serpen
tine
Vind
oline
Vina
midine
Horham
mericine
Horham
mericine
Vind
olinine
Vallesiacho
tamine
Vallesiacho
tamine
Ajmalicin
e
Catharanthine
Indolealkaloids
2 K rad
Concentr
ation(u
n
3
0
1
2
3
4
5
6
7
8
Strrictos
idine
lactam
19-Epiv
indolinine
Serpen
tine
Vind
oline
Vina
midine
Horham
mericine
Horham
mericine
Vind
olinine
Vallesiacho
tamine
Vallesiacho
tamine
Ajmalicin
e
Catharanthine
Indolealkaloids
4 K rad
Concentr
ation0n
Fig. (12) Indolealkaloids determination by HPLC in Catharanthus roseas variety (LM) which istreated by gamma radiation Concentration by (μg).
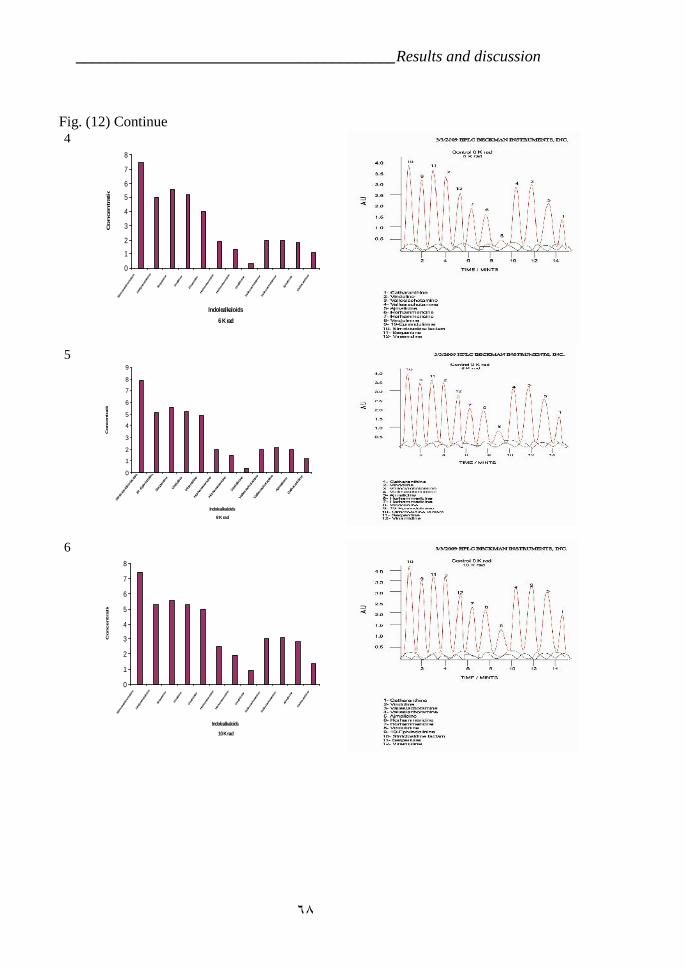
________________________________________Results and discussion
٦٨
Fig. (12) Continue4
0
1
2
3
4
5
6
7
8
Strrictosidine lactam
19-Epivin
dolinine
Serpentin
e
Vindoline
Vinamidine
Horham
mericine
Horham
mericine
Vindolinine
Vallesiacho
tamine
Vallesiacho
tamine
Ajmalicine
Catharanthine
Indolealkaloids6 K rad
Co
ncen
trati
on
5
0
1
2
3
4
5
6
7
8
9
Strrictos
idine
lactam
19-E
pivind
olinine
Serpen
tine
Vind
oline
Vina
midine
Horham
mericine
Horham
mericine
Vind
olinine
Vallesiacho
tamine
Vallesiacho
tamine
Ajmalicin
e
Catharanthine
Indolealkaloids
8 K rad
Concentr
ation
6
0
1
2
3
4
5
6
7
8
Strrictosidine lactam
19-Epivin
dolinine
Serpentin
e
Vindoline
Vinamidine
Horham
mericine
Horham
mericine
Vindolinine
Vallesiacho
tamine
Vallesiacho
tamine
Ajmalicine
Catharanthine
Indolealkaloids
10 K rad
Concentr
ation
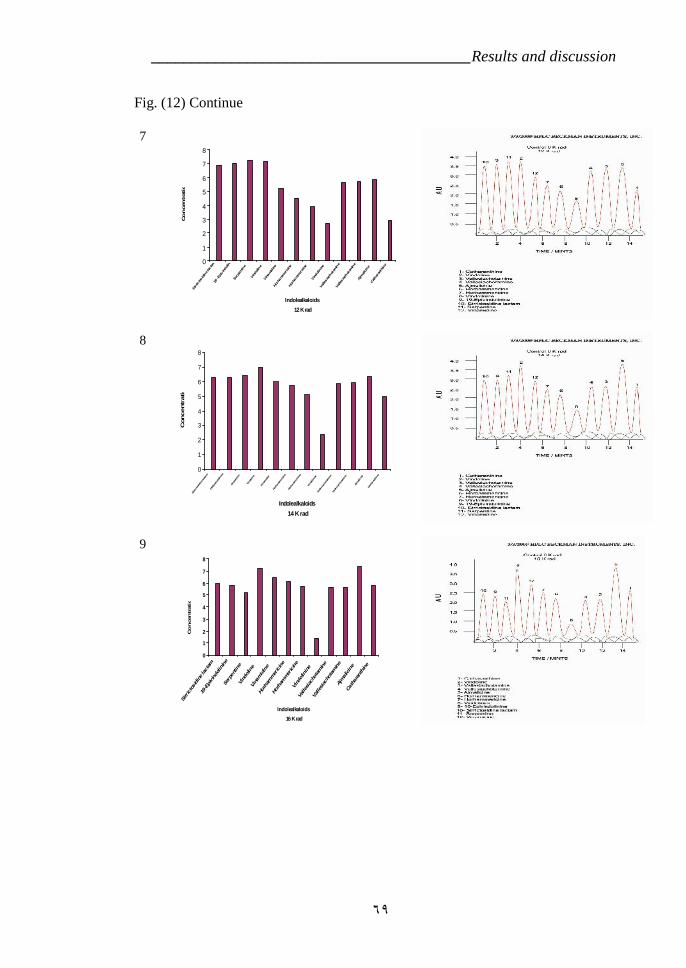
________________________________________Results and discussion
٦٩
Fig. (12) Continue
7
0
1
2
3
4
5
6
7
8
Strrictos
idine
lactam
19-E
pivind
olinine
Serpen
tine
Vind
oline
Vina
midine
Horham
mericine
Horham
mericine
Vind
olinine
Vallesiacho
tamine
Vallesiacho
tamine
Ajmalicin
e
Catharanthine
Indolealkaloids12 K rad
Co
nce
ntr
atio
n
8
0
1
2
3
4
5
6
7
8
Strrictosidine lactam
19-E
pivin
dolinine
Serpentin
e
Vindoline
Vinamidine
Horham
mericine
Horham
mericine
Vindolinine
Vallesiacho
tamine
Vallesiacho
tamine
Ajmalicine
Catharanthine
Indolealkaloids14 K rad
Concentr
ation
9
0
1
2
3
4
5
6
7
8
Strrictos
idine
lactam
19-Epiv
indoli
nine
Serpen
tine
Vind
oline
Vina
midine
Horham
mericine
Horham
mericine
Vind
olinine
Valle
siach
otam
ine
Valle
siach
otam
ine
Ajmali
cine
Catha
ranthine
Indolealkaloids16 K rad
Co
nce
ntr
atio
n
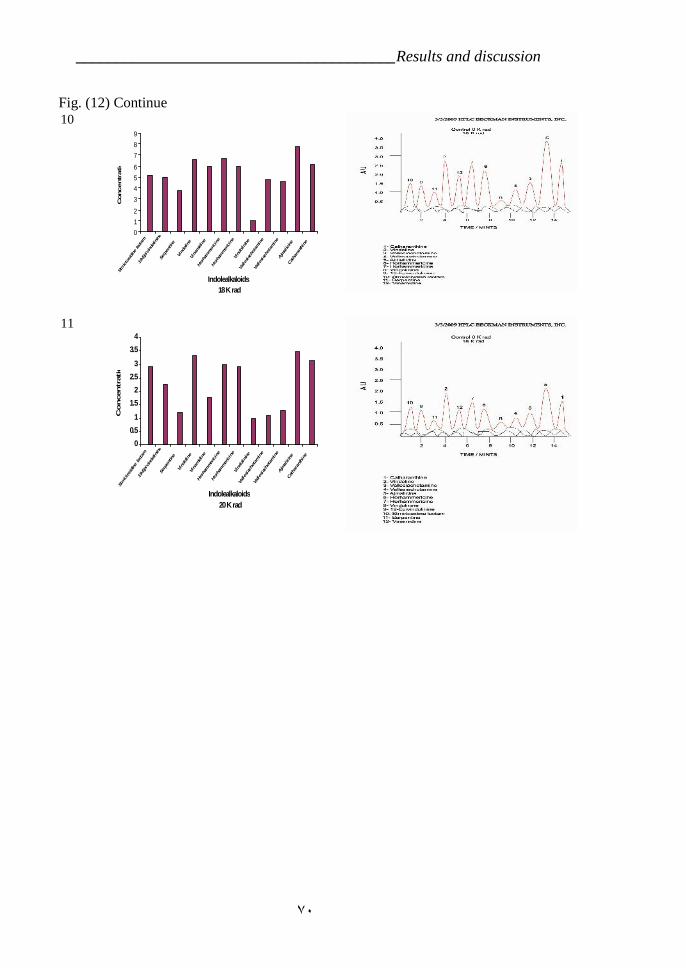
________________________________________Results and discussion
٧٠
Fig. (12) Continue10
012
3456
789
Strrictos
idine
lacta
m
19-Epivin
dolin
ine
Serpen
tine
Vind
oline
Vina
midine
Horham
meric
ine
Horham
meric
ine
Vind
olinin
e
Valle
siach
otam
ine
Valle
siach
otam
ine
Ajma
licine
Catharan
thine
Indolealkaloids18 K rad
Concentr
ation
11
00.5
1
1.52
2.53
3.54
Strrictos
idine
lacta
m
19-Epivin
dolin
ine
Serpen
tine
Vind
oline
Vina
midine
Horham
meric
ine
Horham
meric
ine
Vind
olinin
e
Valle
siach
otam
ine
Valle
siach
otam
ine
Ajma
licine
Catharan
thine
Indolealkaloids20 K rad
Conce
ntr
atio
n
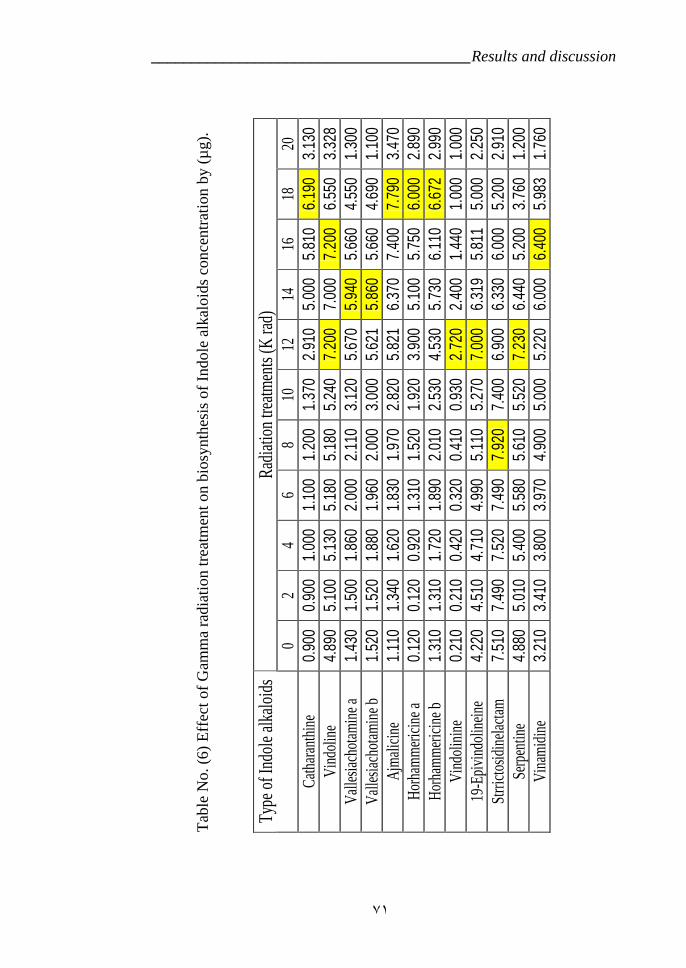
________________________________________Results and discussion
٧١
Radi
ation
trea
tmen
ts (K
rad)
Type
of I
ndol
e alk
aloid
s0
24
68
1012
1416
1820
Cath
aran
thin
e0.9
000.9
001.0
001.1
001.2
001.3
702.9
105.0
005.8
106.1
903.1
30Vi
ndol
ine
4.890
5.100
5.130
5.180
5.180
5.240
7.200
7.000
7.200
6.550
3.328
Valle
siach
otam
ine a
1.430
1.500
1.860
2.000
2.110
3.120
5.670
5.940
5.660
4.550
1.300
Valle
siach
otam
ine b
1.520
1.520
1.880
1.960
2.000
3.000
5.621
5.860
5.660
4.690
1.100
Ajm
alicin
e1.1
101.3
401.6
201.8
301.9
702.8
205.8
216.3
707.4
007.7
903.4
70Ho
rham
mer
icine
a0.1
200.1
200.9
201.3
101.5
201.9
203.9
005.1
005.7
506.0
002.8
90Ho
rham
mer
icine
b1.3
101.3
101.7
201.8
902.0
102.5
304.5
305.7
306.1
106.6
722.9
90Vi
ndol
inin
e0.2
100.2
100.4
200.3
200.4
100.9
302.7
202.4
001.4
401.0
001.0
0019
-Epi
vind
olin
eine
4.220
4.510
4.710
4.990
5.110
5.270
7.000
6.319
5.811
5.000
2.250
Strri
ctosid
inela
ctam
7.510
7.490
7.520
7.490
7.920
7.400
6.900
6.330
6.000
5.200
2.910
Serp
entin
e4.8
805.0
105.4
005.5
805.6
105.5
207.2
306.4
405.2
003.7
601.2
00Vi
nam
idin
e3.2
103.4
103.8
003.9
704.9
005.0
005.2
206.0
006.4
005.9
831.7
60
Tab
le N
o. (
6) E
ffec
t of
Gam
ma
radi
atio
n tr
eatm
ent o
n bi
osyn
thes
is o
f In
dole
alk
aloi
ds c
once
ntra
tion
by
(µg)
.
________________________________________Results and discussion
٧٢
b- Second variety CP3
Depended on the previous assay results in 4.5 and
(table 7 & fig. 13) we are design the experiment to study the
effect of the gamma radiation stress on the Ajmalicene
production on the Development of time in another C. rouses.
Sterna to understanding the gene exprassion behavior in the
cells.
Chosen the Ajmalicine especially because it is a gate
of Indole alkaloids production in a pathway system. And
chose dose rate 16 Krad. because this dose is equilibrium dose
among all Indole alkaloids components above.
In (table 7 and fig. 13) revealed that Gamma
irradiation doses were effective on reducing the content of
Ajmalicine, as compared with the control. In all cases,
raising the doses of Gamma irradiation decreased the content
of Ajmalicine production from 0 times to 48 hours but after
one week level Ajmalicine production increasing suddenly.
The occur of the biosynthesis of the indole alkaloids,
and Ajmalicine specially was reduced in C. roseus seedling
as reported previously seedling cultures of C. roseus
typically exhibit a growth-dissociated accumulation of
secondary products. As shown in (Fig. 13 and table 7),
Ajmalicine levels began to decrease directly after irradiated
on the other hand increase during the deceleration of linear
________________________________________Results and discussion
٧٣
growth and reached plateau levels early in the stationary
phase. The accumulation kinetics of the Ajmalicine-derived
alkaloids succeeded the increase in into cellular, Ajmalicine
concentration (table 7 & Fig. 13 and 14). In contrast, product
levels failed to increase significantly in seedling during the
exponential growth period. For example, the maximum level
of Ajmalicine in cells was approximately 2.1801 µg,
compared with a maximum concentration of greater than
2.8991 µg after 168 hour. Alkaloids were not detected in the
culture medium of either system indicating that product
release was not responsible for low intracellular
concentrations. The accumulation kinetics suggest that
alkaloid biosynthesis is reduced in cells, but not completely
inhibited, since the intracellular product levels, expressed as l
µg / g (fresh weight), remained relatively constant during the
growth cycle. These results are consistent with those reported
for the effects of other non-alginate immobilization methods
on Indole alkaloid accumulation in C. roseus cells. The
decreased biosynthesis of Ajmalicine was initially suggested
as responsible for the reduced accumulation of indole
alkaloids in cells of C. roseus. In order to test this hypothesis,
invitro assays were performed to determine the specific
activity of enzymes involved in Ajmalicine biosynthesis in
cells. Preliminary evidence from these experiments suggested
________________________________________Results and discussion
٧٤
that the biosynthesis of total extractable proteins was
enhanced in immobilized cells relative to cells in suspension.
Since this phenomenon was in contrast to the otherwise
reduced primary metabolism of immobilized cells,
manifested as a decreased growth rate, formal experiments
were performed to determine the total extractable protein
level in both systems. The kinetics of total extractable
Ajmalicine biosynthesis established that irradiated cells were
synthesizing more extractable Ajmalicine than control cells.
Ajmalicine levels per gram (fresh weight) of cells increased
rapidly in both systems reaching peak values within 7 days of
inoculation into plant. The synthesis of total proteins
decreased by day 7 as seedling entered the linear growth
phase. In combination with a rapidly increasing age.
Irradiated seedling may stimulate increased Ajmalicine
biosynthesis, at least in some species. Maximum specific
activity of TDC was similar in seedling cells Fig. (15) and
(table 8). The specific activity of TDC in seedling cells was
greatest on dose rate 16 Krad and declined continuously to
undetectable levels by dose rate 20 Krad The increased
accumulation of Ajmalicine beginning after day 7 at dose
rate 16 Krad (Fig. 13 & 14) is consistent with high TDC
activity during this period. Although the time-course of the
specific activity for TDC during the growth of seedling in 4.6
________________________________________Results and discussion
٧٥
was altered relative to that of seedling in 4.5 maximum
activity levels were similar in both systems. However,
increased accumulation of Ajmalicine was not observed in
seedling in other times suggesting that the limited availability
of an Ajmalicine precursor was responsible for the reduced
Ajmalicine pool. TDC has been characterized and purified to
homogeneity from cell seedling of C. roseus. The
relationship between the expression of enzyme activity under
certain conditions and the accumulation of Ajmalicine
implicated TDC expression as the controlling factor for
alkaloid production in C. roseus seedling.
Workers in several laboratories have observed the
presence in a number of tissues of enzyme systems which are
active in the synthesis of Indole alkaloids. The result
agreement to the result in the assay in (LM). Our result
agreement with Shilpa et al., (2007) who irradiated C.
roseas by UV and studied enzyme (TDC) and (STR) Since
the UV-B-induced early cellular responses, medium
alkalinization and ROS production were inhibited by
suramin, we investigated whether. The effect of UV-B
irradiation on expression of TIA biosynthetic genes, Tdc and
Str, and Indole alkaloids production has been reported
previously in C. roseus leaves. The transcription factor GT-1
binds to the promoter region of Tdc in vitro. The functional
________________________________________Results and discussion
٧٦
importance of GT-1 in the induction of Tdc expression by
UV light has been demonstrated by point mutations in the
GT-1 binding site. However, the molecular basis of UV-B
signaling cascades leading to the induction of expression of
Tdc and Str genes and the production of TIAs is largely
unknown. It has been observed that the polypeptide wound
signal, systemin- specific cell surface receptors initiate a
signal transduction cascade upon UV-B irradiation in L.
peruvianum cell suspension cultures. In the present study, the
signaling pathways mediating UV-B-induced catharanthine
accumulation in C. roseus suspension cultures were
investigated. UV-B induced alkalinization of the culture
medium, generation of hydrogen peroxide, activation of
CDPK and MBPK as well as accumulation of catharanthine
and stimulation of transcription of Tdc and Str genes were
studied. Inhibitors of binding of ligand-cell surface receptors,
protein kinases and phosphatases, calcium fluxes and H2O2
were used to dissect the UV-B signaling cascade.
The oxidative burst, a rapid consumption of oxygen
and production of reactive oxygen species (ROS) such as
H2O2, is a typical early event in plant defense responses with
5 min of UV-B irradiation of C. roseus cells H2O2 production
increased six-fold compared to control cells. We next
examined effects of suramin, an inhibitor of G-protein
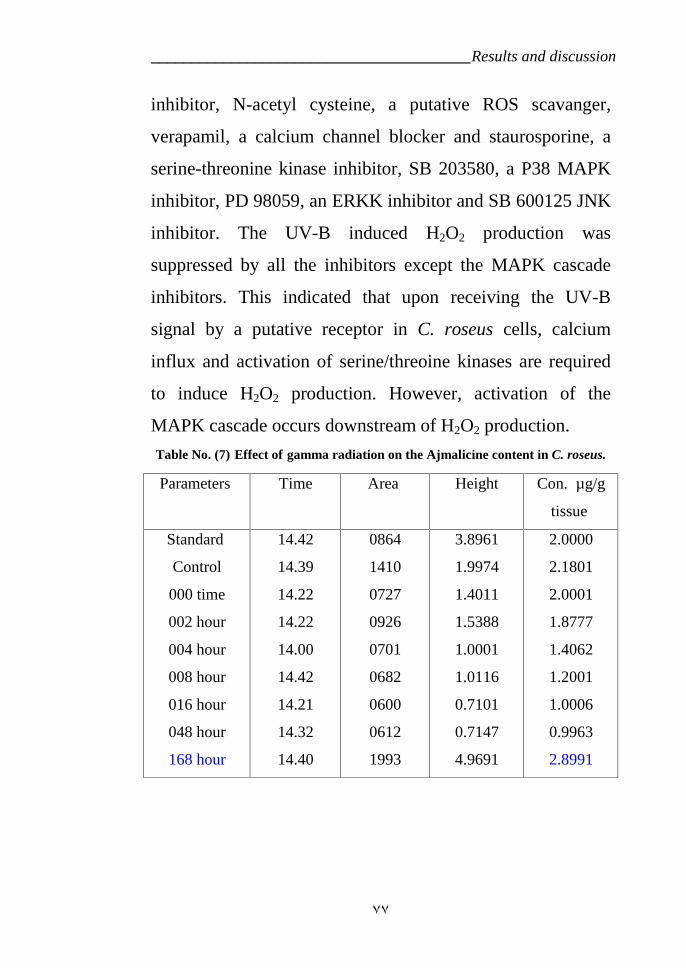
________________________________________Results and discussion
٧٧
inhibitor, N-acetyl cysteine, a putative ROS scavanger,
verapamil, a calcium channel blocker and staurosporine, a
serine-threonine kinase inhibitor, SB 203580, a P38 MAPK
inhibitor, PD 98059, an ERKK inhibitor and SB 600125 JNK
inhibitor. The UV-B induced H2O2 production was
suppressed by all the inhibitors except the MAPK cascade
inhibitors. This indicated that upon receiving the UV-B
signal by a putative receptor in C. roseus cells, calcium
influx and activation of serine/threoine kinases are required
to induce H2O2 production. However, activation of the
MAPK cascade occurs downstream of H2O2 production.
Table No. (7) Effect of gamma radiation on the Ajmalicine content in C. roseus.
Parameters Time Area Height Con. µg/g
tissue
Standard
Control
000 time
002 hour
004 hour
008 hour
016 hour
048 hour
168 hour
14.42
14.39
14.22
14.22
14.00
14.42
14.21
14.32
14.40
0864
1410
0727
0926
0701
0682
0600
0612
1993
3.8961
1.9974
1.4011
1.5388
1.0001
1.0116
0.7101
0.7147
4.9691
2.0000
2.1801
2.0001
1.8777
1.4062
1.2001
1.0006
0.9963
2.8991
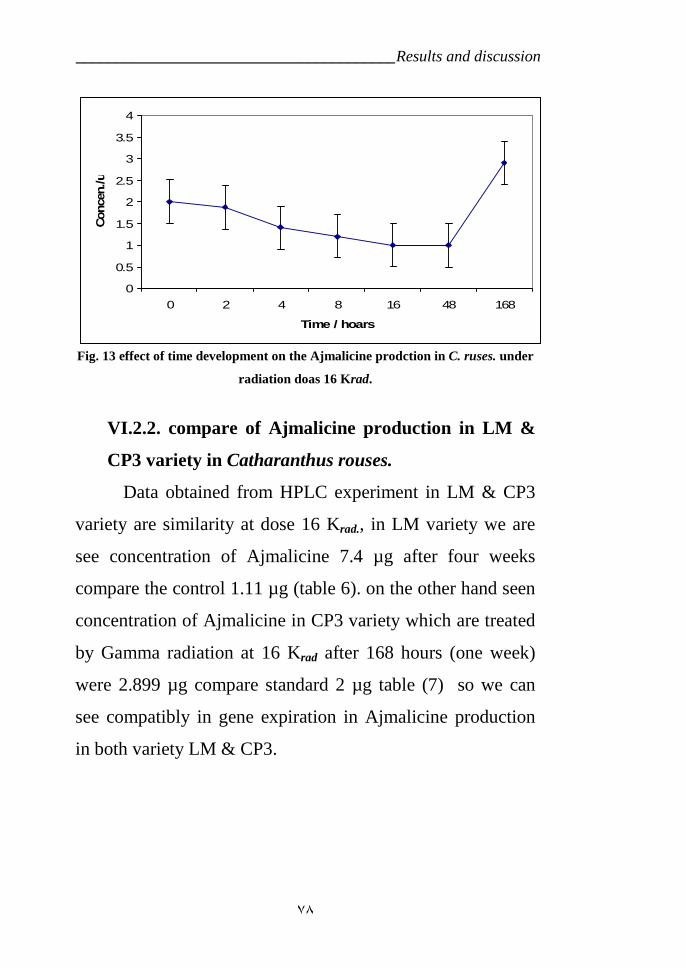
________________________________________Results and discussion
٧٨
Fig. 13 effect of time development on the Ajmalicine prodction in C. ruses. under
radiation doas 16 Krad.
VI.2.2. compare of Ajmalicine production in LM &
CP3 variety in Catharanthus rouses.
Data obtained from HPLC experiment in LM & CP3
variety are similarity at dose 16 Krad., in LM variety we are
see concentration of Ajmalicine 7.4 µg after four weeks
compare the control 1.11 µg (table 6). on the other hand seen
concentration of Ajmalicine in CP3 variety which are treated
by Gamma radiation at 16 Krad after 168 hours (one week)
were 2.899 µg compare standard 2 µg table (7) so we can
see compatibly in gene expiration in Ajmalicine production
in both variety LM & CP3.
0
0.5
1
1.5
2
2.5
3
3.5
4
0 2 4 8 16 48 168
Time / hoars
Conc
en./u
g
________________________________________Results and discussion
٧٩
Fig. 14 HPLC analysis of time development on the Ajmalicine production in
C. ruses. under radiation dose 16 Krad.
control 0 hour
2 hour 4 hour
8 hour 16 hour
48 hour 168 hour
________________________________________Results and discussion
٨٠
This system provided alternating conditions of cellular
growth and proliferation and thus allowed to study the
transcriptional changes of TIA pathway genes and regulators
simultaneously under changing culture conditions. The
results were compared with TIA production data by HPLC.
This study demonstrates the complexities of molecular
regulation of TIA metabolism in C. roseus cell culture and
indicates the probable bottleneck for scale-up production of
TIAs in this system.
Understanding the Terpenoid indole alkaloids (TIAs), an
important group of secondary metabolites are produced by C.
roseus (L.) G. Don (Madagascar periwinkle), a member of
the apocynaceae family. Some of these alkaloids have high
therapeutic values such as, the antihypertensive alkaloids,
ajmalicine, serpentine and anticancer alkaloids, vincristine,
vinblastine. The monoterpenoid moiety of TIAs originates
from the 2-C methyl erythritol phosphate (MEP) pathway
whereas the indole skeleton of TIAs is derived from the
shikimate pathway. The biosynthesis of TIAs in C. roseus is
reported to be under strict regulation. Their metabolism has
been found to be restricted to certain tissues and it is
modulated by developmental and environmental
mechanisms. Despite significant efforts, TIA biosynthesis in
plant cell cultures remains poorly characterized. Regulation
________________________________________Results and discussion
٨١
of two important TIA biosynthetic pathway genes, namely,
strictosidine synthase Str and tryptophan decarboxylase Tdc
has been studied in great detail, which revealed thereof
coordinate regulation and elicitor-mediated induction in cell
cultures. The regulatory mechanisms controlling many of the
remaining steps of the TIA pathway are yet unknown.
Mustafa and Verpoorte (2007).
the understanding of which may reveal the complex
molecular program that governs TIA metabolism in cell
culture. Functional analysis of Str and Tdc gene promoters
led to the identification of cisregulatory sequences involved
in elicitor and Me JAinduced responses. Octadecanoid-
derivative responsive Catharanthus AP2-domain (ORCA3)
transcription factor was found to be jasmonateresponsive
transcriptional regulator of C. roseus primary and secondary
metabolism. Furthermore, G-box binding factors (GBF1,
GBF2 and GBF3) and zinc finger proteins (ZBF1, ZBF2 and
ZBF3) were shown to act as repressors in the regulation of
elicitor-induced TIA metabolism in C. roseus. Two
downstream vindoline pathway genes, desacetoxyvindoline
4-hydroxylase (D4h) and deacetoxyvindoline 4-O-
acetyltransferase (Dat) are known to be transcriptionally
blocked in C. roseus in vitro grown cultures. Many aspects of
such key regulatory events have been recently explored, but
________________________________________Results and discussion
٨٢
understanding of the regulation of complete TIA pathway in
cell cultures is still lacking for which it has not yet become a
viable alternative for improved production of TIAs. The
differential expression of genes in different state of cultures
is expected to be different and will also be associated with
different levels of secondary metabolites. In order to
demonstrate the status of similar changes in expression of
TIA pathway genes and regulators in C. roseus cell culture.
The expressions of two feeder primary (MEP,
shikimate) and committed TIA metabolite pathway genes
were analyzed in C. roseus rotation culture system along
with TIA pathway regulators using a Gamma radation stress.
The database search for C. roseus genome revealed six genes
encoding selected enzymes for each of the primary (MEP and
shikimate) and TIA pathways along with eight TIA pathway
regulator genes. A single amplified product obtained for each
target gene was radiated and identities of putative RAPD-
PCR which showed 95–99% homology with the available
sequences in database. The genes were studding and analysis
with CP3 variety RAPD-PCR (Table 23). Consequently, 495
fragments were spotted in agarose gel to facilitate the
expression analysis and their expressions were monitored in
the tissues originating from cultures. Each membrane was
hybridized simultaneously under radiation stress sample.
________________________________________Results and discussion
٨٣
There were significant changes in the expression levels of
primary as well as TIA pathway genes and the regulators in
the samples originating. TIA pathway repressor genes were,
however, relatively highly expressed in the same tissues.
This system revealed a high degree of reproducibility.
Gene, activator and repressor transcripts of TIA and
related primary pathways in seedling culture system We
known the transcript profiles of three TIA pathway
repressors each of G-box binding factor type, namely, Gbf1,
Gbf2 and Gbf3, and zinc finger protein type, namely, Zct1,
Zct2 and Zct3, one master regulator, Orca3, one MYB
transcription factor, CrBpf1 and TIA and related primary
pathway genes in cells initially. The appropriate number of
cycles for PCR amplification of each target gene was
determined so that it can be quantified and that the
amplification lies in the exponential range before reaching
the plateau. PCR amplification of 30 cycles was found to be
optimum for all the target genes studied and their
amplification was found to be in the exponential range. The
mRNA levels of primary pathway genes, TDC and STR were
higher in cells-induced by Gamma radiation in cultured
seedling, compared to that of the control as below. The
transcript levels of the latter two genes, TDC and STR
remained undetected in seedling cultured. The mRNA levels
________________________________________Results and discussion
٨٤
of early TIA pathway genes, Tdc and Str, showed changes
with changing conditions of irradiated and thus were higher
in 16 Krad but low in other doses.
Ajmalicine level showed low or undetected level of
expression under similar conditions. The levels of
expressions of late TIA pathway transcripts, TDC and STR,
Data changed from high to low with changing culture
irradiated. Some of these show restoration of expression in
seedling cultures. Similar study was carried out using UV
irradiated cell cultures, which revealed similar pattern of
expression for specific TIA as well as primary pathway genes
except G10h, which was faintly detected in this system. One
gene from each pathway, namely G10h (MEP pathway), Tdc
(shikimate pathway), Str (early TIA pathway) and Dat (late
TIA pathway) were used as probes for northern analysis,
which revealed biphasic nature of expression of Tdc and Str
transcripts in cell cultures noted by a reduction in the level of
expression in equilibrium doses but again the level of
expression was restored in high doses.
The transcript level of TDC must be confirmed to be
low in seedling cultured without any treatments and Data
transcript remained undetected by HPLC analysis. There was
significant induction of the repressor Ajmalicene in seedling
cultured. Some of these transcripts, Gbf1, Gbf3, Zct1 were
________________________________________Results and discussion
٨٥
upregulated in seedling cultured. Similarly, the TDC levels,
which play a role in elicitor responsive signal transduction
pathway of TIA biosynthesis, were high in 16 Krad. dose.
Under similar conditions, the STR, the master regulator for
TIA pathway biosynthesis, were relatively high. However, in
seedling cultures, the expression of this STR was reverse in
10 Krad. The steady state TDC levels were confirmed by gel
electrophoresis analysis in seedling cultures, but STR
remained undetected because this enzyme is very low in
molecular Weight.
IV.3. Effect of radiation on Isozymes banding patterns.
VI.3.1. Tryptophandecarpoxylase enzyme (TDC):
The results of electrophoretic patterns of Tryptophan
decarpoxylase isozyme extracted from the seedling variety
(LM) bush of the different doses 0, 2, 4, 6, 8, 10, 12, 14, 16,
18 and 20 Krad in the radiation treatments taxa, Catharanthus
roseas are shown in Figure (15) and are diagrammatically
illustrated in Figure (15) and table (8).The Figures showed a
maximum number of eleven bands.
In taxa with (bands 0 to 18) showed that one bands, the
20 exhibited bands (4) with lower intensity than the treated
samples, the radiation effects on gene expression. Band 1
presents and very faint in the control untreated but was
________________________________________Results and discussion
٨٦
contradictory in the intensity and molecular Weght in the
other doses treatments. Therefore, irradiation modified gene
expression in taxa.
In 20 Krad (lanes 1 to 4) showed that, the enzyme
degradation while complete in control and all doses, so that
should be considered as a conferring modification of gene
expression by irradiation.
As kown Irradiation induces the expression of the
Kinase proteins genes via posttranslational modification
which further interacts with the Tdc and Str promoter
enhancing the gene expression, many protein kinases are
known to respond to both biotic and abiotic stresses. Two
kinases, MAPKs and CDPKs, have been implicated to play
pivotal roles in response to diverse stimuli. Previous studies
have demonstrated that C. roseas variety (LM) cells also
respond to UV-B irradiation by expressing biosynthetic genes
and production of TIAs. To establish a functional link
between these processes, we first examined the possible
activation of MAPK and CDPK in cells irradiated with UV-
B. MBP is known to be a conventional MAPK substrate and
MAPK homologs also have MBP kinase activity. To
determine if a MAPK is associated with the UV-B signaling
the activation of MBP kinase was investigate Shilpa et al.,
(2007).
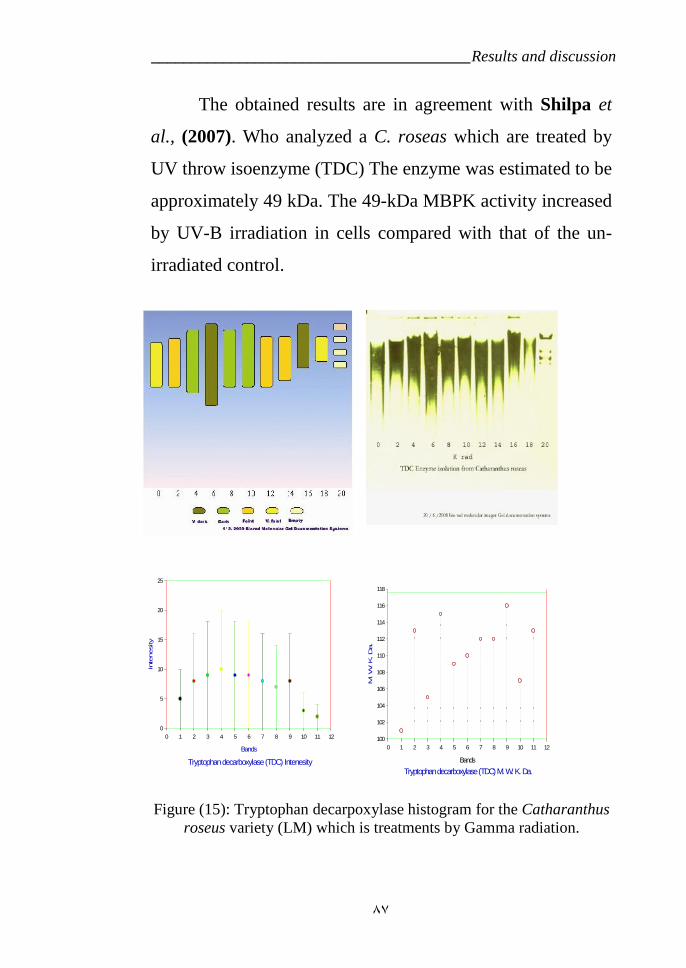
________________________________________Results and discussion
٨٧
The obtained results are in agreement with Shilpa et
al., (2007). Who analyzed a C. roseas which are treated by
UV throw isoenzyme (TDC) The enzyme was estimated to be
approximately 49 kDa. The 49-kDa MBPK activity increased
by UV-B irradiation in cells compared with that of the un-
irradiated control.
Figure (15): Tryptophan decarpoxylase histogram for the Catharanthusroseus variety (LM) which is treatments by Gamma radiation.
Tryptophan decarboxylase (TDC) M. W. K. Da.Bands
0 1 2 3 4 5 6 7 8 9 10 11 12
M. W
. K. Da.
100
102
104
106
108
110
112
114
116
118
Tryptophan decarboxylase (TDC) IntenesityBands
0 1 2 3 4 5 6 7 8 9 10 11 12
Inte
nesi
ty
0
5
10
15
20
25
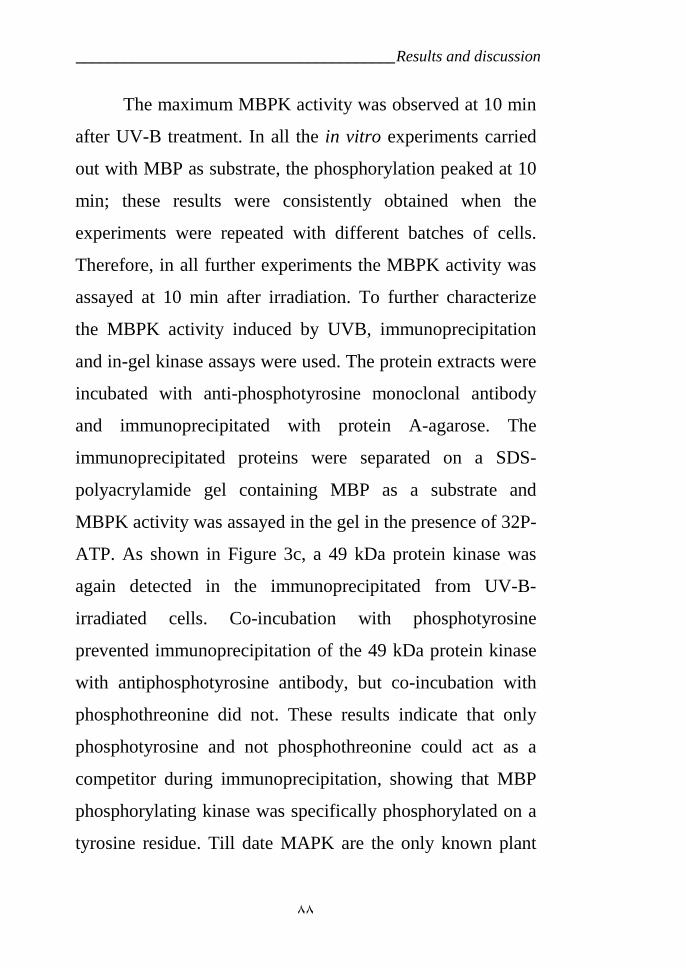
________________________________________Results and discussion
٨٨
The maximum MBPK activity was observed at 10 min
after UV-B treatment. In all the in vitro experiments carried
out with MBP as substrate, the phosphorylation peaked at 10
min; these results were consistently obtained when the
experiments were repeated with different batches of cells.
Therefore, in all further experiments the MBPK activity was
assayed at 10 min after irradiation. To further characterize
the MBPK activity induced by UVB, immunoprecipitation
and in-gel kinase assays were used. The protein extracts were
incubated with anti-phosphotyrosine monoclonal antibody
and immunoprecipitated with protein A-agarose. The
immunoprecipitated proteins were separated on a SDS-
polyacrylamide gel containing MBP as a substrate and
MBPK activity was assayed in the gel in the presence of 32P-
ATP. As shown in Figure 3c, a 49 kDa protein kinase was
again detected in the immunoprecipitated from UV-B-
irradiated cells. Co-incubation with phosphotyrosine
prevented immunoprecipitation of the 49 kDa protein kinase
with antiphosphotyrosine antibody, but co-incubation with
phosphothreonine did not. These results indicate that only
phosphotyrosine and not phosphothreonine could act as a
competitor during immunoprecipitation, showing that MBP
phosphorylating kinase was specifically phosphorylated on a
tyrosine residue. Till date MAPK are the only known plant
________________________________________Results and discussion
٨٩
kinases to be phosphorylated on tyrosine residues. Calcium
dependent protein kinases (CDPKs) belong to the unique
family of calcium-regulated kinases and histone IIIS was one
of the best exogenous substrates for assaying CDPKs to
characterize the kinase (s) induced by UV-B, the activities
were assayed using histone IIIS as a substrate in protein
extracts from cells irradiated with UV-B, as well as the
controls. The protein extracts from 5-min UV-B irradiated
cells, assayed in the presence of calcium using histone IIIS as
substrate showed that, the kinase activity increased
significantly peaking at 4 min after UV-B irradiation and
remained high even at 20 min after UV-B irradiation. The
protein extracts from 5-min UV-B irradiated cells assayed by
in- gel kinase assay in the absence and presence of calcium
using histone IIIS as substrate demonstrated that the
phosphorylation of histone IIIS was calcium dependent in
both UV-B irradiated and un-irradiated cells. CDPK
activities were identified at two positions with an apparent
molecular weight of 55 kDa and 40 kDa. One of the CDPK
activated had an apparent molecular weight of 40 kDa and
was constitutive, as it was observed to phosphorylate histone
IIIS to a similar extent in both un-irradiated and irradiated
cells whereas the 55 kDa kinase activity showed UV-B
dependence and peaked at 4 min. Therefore, the
________________________________________Results and discussion
٩٠
phosphorylation of histone IIIS observed in vitro experiments
was both due to the activities of the 55 and assayed by in-gel
kinase assay containing histone IIIS as substrate. Figure 4c
shows that the 55 and 40 kDa kinases identified by in-gel
kinase assay were both phosphorylated on serine residues and
that the activity of 40 kDa kinase was constitutive in our cell
cultures. In all the in vitro experiments carried out with
histone IIIS as substrate, the phosphorylation peaked at 4
min. These results were consistently obtained when the
experiments were repeated with different batches of cells.
Therefore, in all further experiments the CDPK activity was
assayed at min after irradiation.
IV.3.2. Strrictosidinesynthase enzyme (STR).
Zymograms of Strrictosidinesynthase enzyme
(STR) for the Catharanthus roseas variety (LM) taxa are
shown in Figure (16) and Table (8) and are
histogrammatically illustrated in Figure (16).
In taxa with (lanes 0 to 18) showed that one bands, the
20 exhibited no bands with lower intensity than the treated
samples, the radiation effects on gene expression. Bands
from control to 10 Krad. presents and very dark but was
contradictory in the intensity and molecular Weght in the
other doses treatments. Therefore, irradiation modified gene
expression in taxa. On the other hand radiation treatments 12,
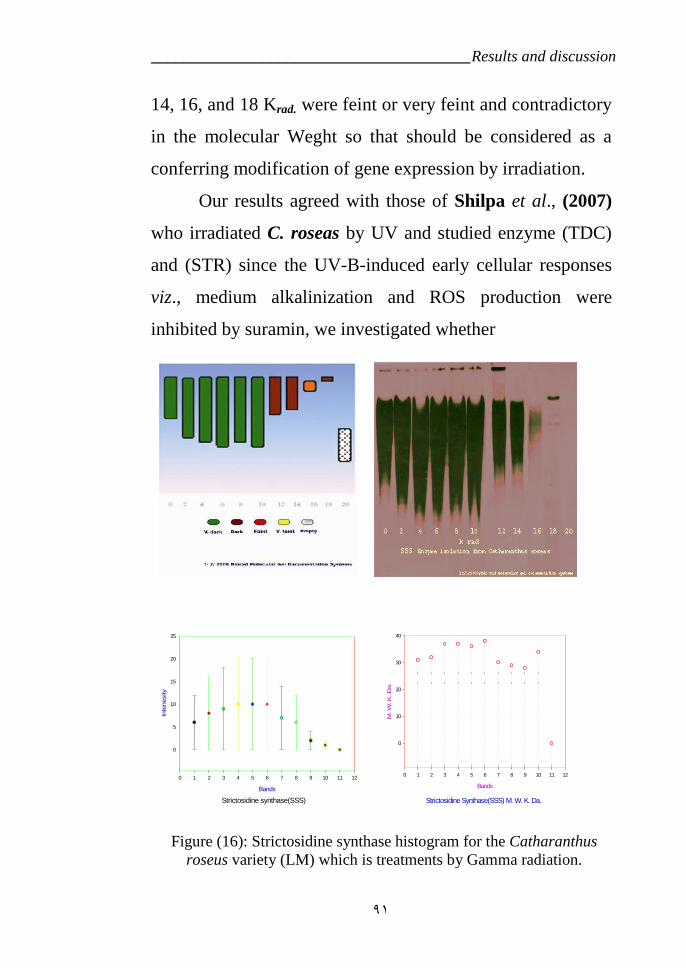
________________________________________Results and discussion
٩١
14, 16, and 18 Krad. were feint or very feint and contradictory
in the molecular Weght so that should be considered as a
conferring modification of gene expression by irradiation.
Our results agreed with those of Shilpa et al., (2007)
who irradiated C. roseas by UV and studied enzyme (TDC)
and (STR) since the UV-B-induced early cellular responses
viz., medium alkalinization and ROS production were
inhibited by suramin, we investigated whether
Figure (16): Strictosidine synthase histogram for the Catharanthusroseus variety (LM) which is treatments by Gamma radiation.
Strictosidine synthase(SSS)Bands
0 1 2 3 4 5 6 7 8 9 10 11 12
Inte
nesi
ty
0
5
10
15
20
25
Strictosidine Synthase(SSS) M. W. K. Da.
Bands
0 1 2 3 4 5 6 7 8 9 10 11 12
M. W
. K. D
a.
0
10
20
30
40
________________________________________Results and discussion
٩٢
suramin could inhibit the UV-B induced other cellular
responses related to synthesis of TIAs. When the cells were
pretreated for 10 min with 0.1 and 1 mM suramin
concentrations and subsequently irradiated with UV-B for 5
min, the UV-Binduced MBPK and CDPK activities,
accumulation of Tdc and STR transcripts and Catharanthine
was strongly inhibited. However, the UV-B-induced MBPK
activity could not be completely inhibited by suramin. To
rule out the possibility that the inhibitory effects of suramin
on responses triggered by UV-B are not due to the unspecific
binding to cell surface components, we used heparin a
structurally similar molecule viz., heparin that possesses
sulfonic acid groups similar to that of suramin for inhibition
of UV-B responses.
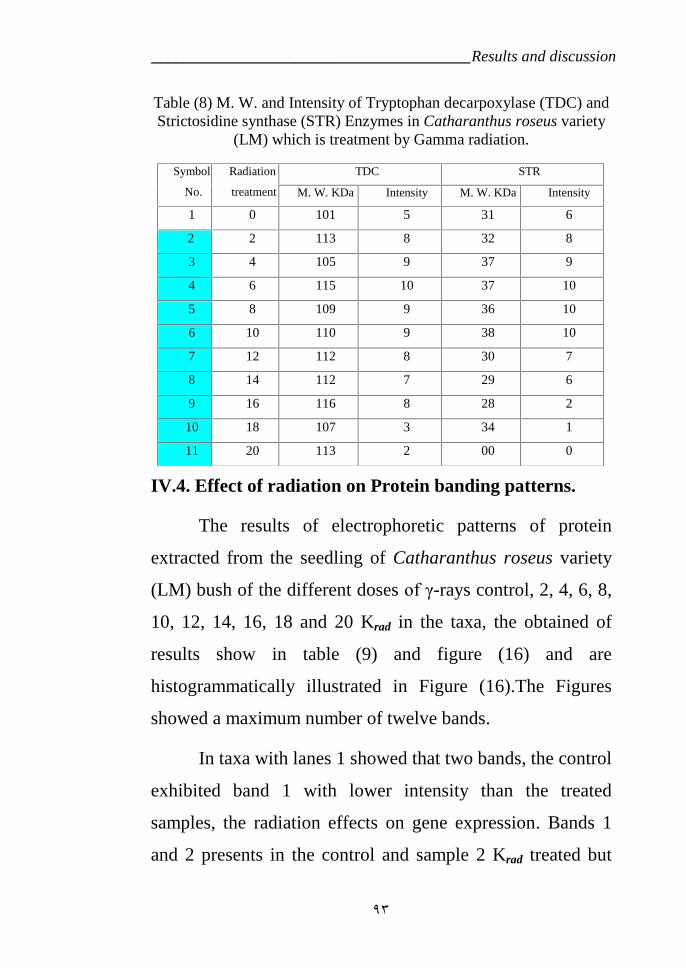
________________________________________Results and discussion
٩٣
Table (8) M. W. and Intensity of Tryptophan decarpoxylase (TDC) andStrictosidine synthase (STR) Enzymes in Catharanthus roseus variety
(LM) which is treatment by Gamma radiation.
IV.4. Effect of radiation on Protein banding patterns.
The results of electrophoretic patterns of protein
extracted from the seedling of Catharanthus roseus variety
(LM) bush of the different doses of γ-rays control, 2, 4, 6, 8,
10, 12, 14, 16, 18 and 20 Krad in the taxa, the obtained of
results show in table (9) and figure (16) and are
histogrammatically illustrated in Figure (16).The Figures
showed a maximum number of twelve bands.
In taxa with lanes 1 showed that two bands, the control
exhibited band 1 with lower intensity than the treated
samples, the radiation effects on gene expression. Bands 1
and 2 presents in the control and sample 2 Krad treated but
Symbol
No.
Radiation
treatment
TDC STR
M. W. KDa Intensity M. W. KDa Intensity
1 0 101 5 31 6
2 2 113 8 32 8
3 4 105 9 37 9
4 6 115 10 37 10
5 8 109 9 36 10
6 10 110 9 38 10
7 12 112 8 30 7
8 14 112 7 29 6
9 16 116 8 28 2
10 18 107 3 34 1
11 20 113 2 00 0
________________________________________Results and discussion
٩٤
was absent in the other doses treatment. Therefore,
irradiation modified gene expression in these taxa.
In the radiation treatments 2 Krad lanes 2 showed that,
band 3, 4, 5 and 6 was absent in control while present in 6
and 8 Krad doses, so that should be considered as a conferring
modification of gene expression by irradiation.
The pattern of 4 Krad lanes 3 exhibited five bands,
band 7 to 12 were present. Indicating the effect of 6 Krad
irradiation treatments on modification of gene expression in
C. roseas variety (LM) Bands 3 and 5 were presents only in
the 6 Krad treatment but were absent in control and 4, 12 and
14 Krad treatments. Therefore, irradiation treatments effected
on modification of gene expression in C. roseas variety (LE).
treated.
The protein Zymograms of lanes 5 to 11 showed nine
bands, which are absent in the some treatments and were
present in the others irradiation treatments affected on gene
expression in C. roseas variety (LM).
Our results agreed with those of Kazuyuki et al.,
(2001) in the preliminary experiments, we found that a
TPCK-treated bovine trypsin (Sigma, type XIII) was
contaminated with GICP. Therefore, we tried to purify GICP
from 116 mg trypsin. Using a combination of several
________________________________________Results and discussion
٩٥
chromatographic procedures, we obtained 0.09 mg enzyme
(the specific activity of 12 n molls/min/mg proteins). SDS-
PAGE pattern of the enzyme showed a major band with a Mr
of approximately 29,000. The N-terminal sequence of major
band was homologous to that of chymotrypsinogen, starting
from Ile-16 Meloun et al., (1966). Therefore, we tested
whether chymotrypsin isozymes, a-, d-, and p-chymotrypsins
have the activity to cleave T-1 in the presence of TPCK.
However, none of these chymotrypsins had such activity.
These results suggest that the amount of GICP is very small
in the commercial preparations of trypsin. Thus, we decided
to purify GICP from bovine pancreas.
Seedling to affect on both Tdc and STR genes, where
STR enzyme wills condensate tryptamine and secologanin to
produce Strrictosidine. The obtained results showed that the
following experiments of C. roseas were used as seedling
bush for extra Tryptophan decarpoxylase and
Strrictosidinesynthase genes
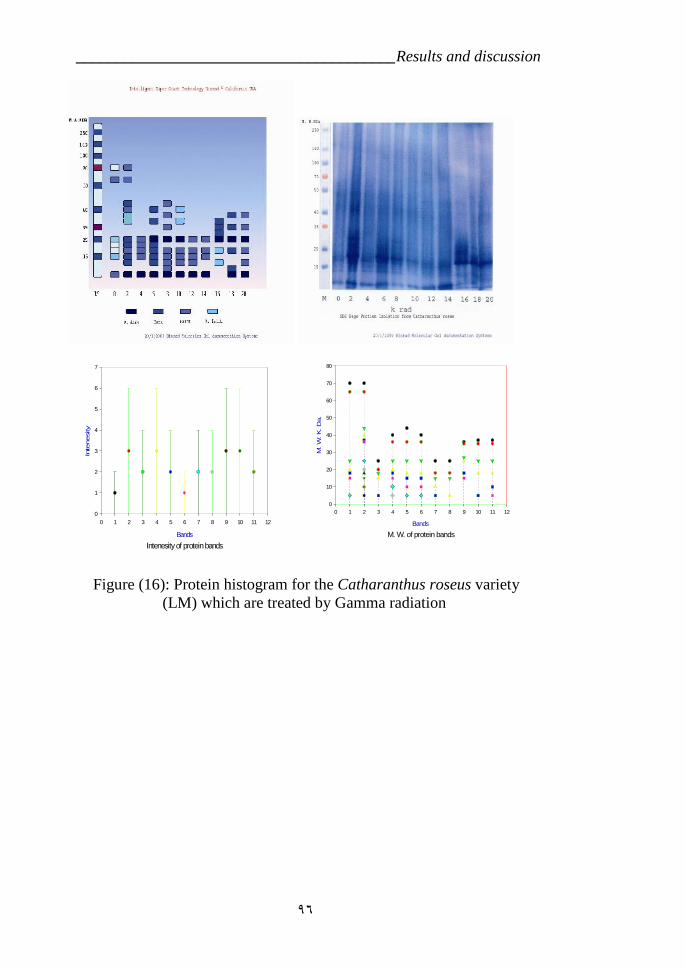
________________________________________Results and discussion
٩٦
Figure (16): Protein histogram for the Catharanthus roseus variety(LM) which are treated by Gamma radiation
M. W. of protein bandsBands
0 1 2 3 4 5 6 7 8 9 10 11 12
M. W
. K. D
a.
0
10
20
30
40
50
60
70
80
Intenesity of protein bandsBands
0 1 2 3 4 5 6 7 8 9 10 11 12
Inte
nesi
ty
0
1
2
3
4
5
6
7
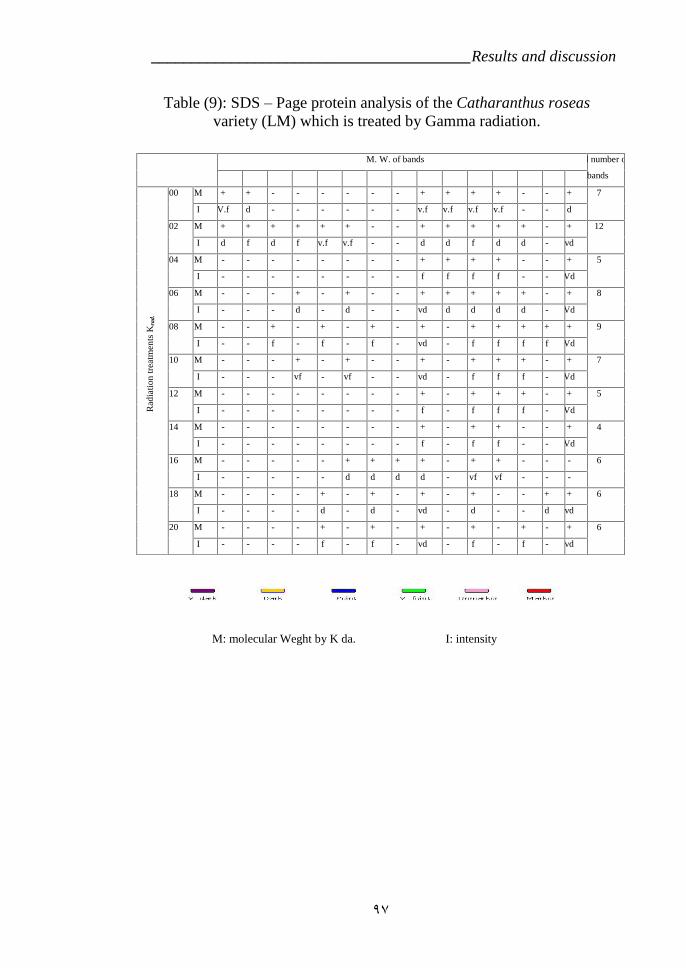
________________________________________Results and discussion
٩٧
Table (9): SDS – Page protein analysis of the Catharanthus roseasvariety (LM) which is treated by Gamma radiation.
M: molecular Weght by K da. I: intensity
M. W. of bands Total number of
bands70 65 44 40 37 36 35 27 25 20 18 15 10 7 5
Rad
iatio
n tr
eatm
ents
Kra
d.
00 M + + - - - - - - + + + + - - + 7
I V.f d - - - - - - v.f v.f v.f v.f - - d
02 M + + + + + + - - + + + + + - + 12
I d f d f v.f v.f - - d d f d d - vd
04 M - - - - - - - - + + + + - - + 5
I - - - - - - - - f f f f - - Vd
06 M - - - + - + - - + + + + + - + 8
I - - - d - d - - vd d d d d - Vd
08 M - - + - + - + - + - + + + + + 9
I - - f - f - f - vd - f f f f Vd
10 M - - - + - + - - + - + + + - + 7
I - - - vf - vf - - vd - f f f - Vd
12 M - - - - - - - - + - + + + - + 5
I - - - - - - - - f - f f f - Vd
14 M - - - - - - - - + - + + - - + 4
I - - - - - - - - f - f f - - Vd
16 M - - - - - + + + + - + + - - - 6
I - - - - - d d d d - vf vf - - -
18 M - - - - + - + - + - + - - + + 6
I - - - - d - d - vd - d - - d vd
20 M - - - - + - + - + - + - + - + 6
I - - - - f - f - vd - f - f - vd
________________________________________Results and discussion
٩٨
IV.5. DNA finger print analysis
Random amplified polymorphic DNA (RAPD).
a- First variety (LM):
Result obtained from RAPD PCR analysis with 5
primers were used for the identification of markers associated
with 11 radiation treatments taxa genotypes after four weeks
presented as follows;
1- Primer OP-B01
(Table 10) shows the effect of gamma radiation
doses on Catharanthus roseas genome throw PCR
techniques, Primer OP-B01 gave 2 monomorphic fragments
with molecular sizes ranging from 80 to 12000 bp. (Figure
17). with 17 polymorphic fragments (80.9 %) with numbers
4, 5, 6, 7, 8, 9, 10, 11, 12, 14, 15, 16, 17, 18, 19, 20 and 21
with corresponding molecular sizes of 11000, 10500, 10000,
9500, 9000, 8800, 8500, 6000, 3300, 2300, 1900, 1200,
1000, 800, 600, 400, 300, 100 and 80 bp. were observed. On
the other hand unique bands were 11000 bp. whereas,
monomorphic were at 1 and 13 with corresponding 12000
and 4500 bp. radiation treatment 16 and 18 Krad. exhibited the
maximum number 12 of fragments, while the lowest number
6 appeared in radiation treatment 0 and 2 Krad.
This primer showed that a fragments with 11000
and 10500 bp. appeared exclusively in radiation treatment20
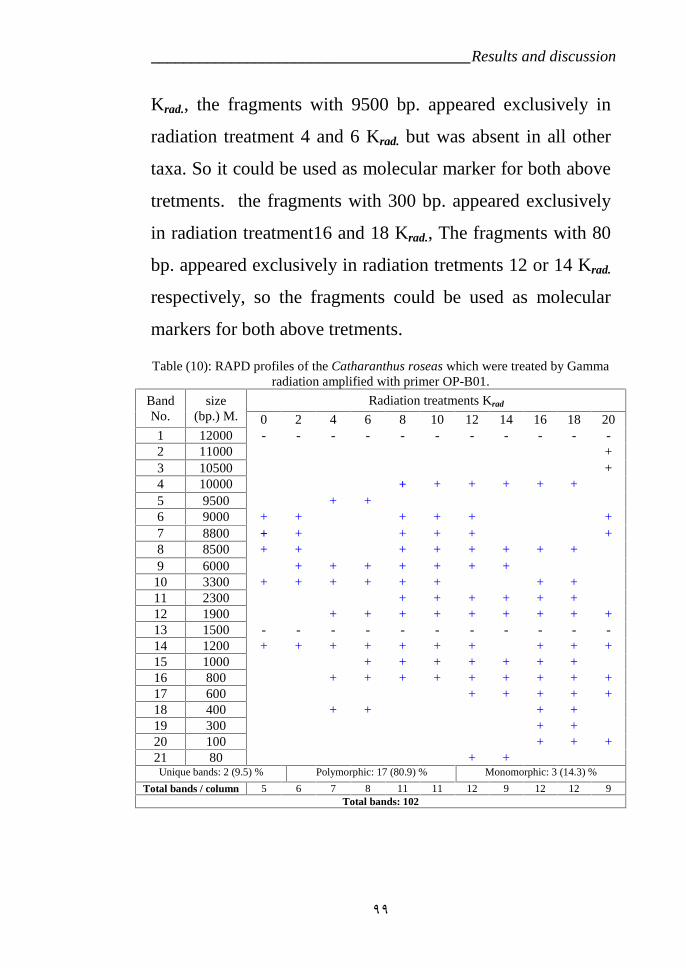
________________________________________Results and discussion
٩٩
Krad., the fragments with 9500 bp. appeared exclusively in
radiation treatment 4 and 6 Krad. but was absent in all other
taxa. So it could be used as molecular marker for both above
tretments. the fragments with 300 bp. appeared exclusively
in radiation treatment16 and 18 Krad., The fragments with 80
bp. appeared exclusively in radiation tretments 12 or 14 Krad.
respectively, so the fragments could be used as molecular
markers for both above tretments.
Table (10): RAPD profiles of the Catharanthus roseas which were treated by Gammaradiation amplified with primer OP-B01.
BandNo.
size(bp.) M.
Radiation treatments Krad
0 2 4 6 8 10 12 14 16 18 201 12000 - - - - - - - - - - -2 11000 +3 10500 +4 10000 + + + + + +5 9500 + +6 9000 + + + + + +7 8800 + + + + + +8 8500 + + + + + + + +9 6000 + + + + + + +
10 3300 + + + + + + + +11 2300 + + + + + +12 1900 + + + + + + + + +13 1500 - - - - - - - - - - -14 1200 + + + + + + + + + +15 1000 + + + + + + +16 800 + + + + + + + + +17 600 + + + + +18 400 + + + +19 300 + +20 100 + + +21 80 + +Unique bands: 2 (9.5) % Polymorphic: 17 (80.9) % Monomorphic: 3 (14.3) %
Total bands / column 5 6 7 8 11 11 12 9 12 12 9Total bands: 102
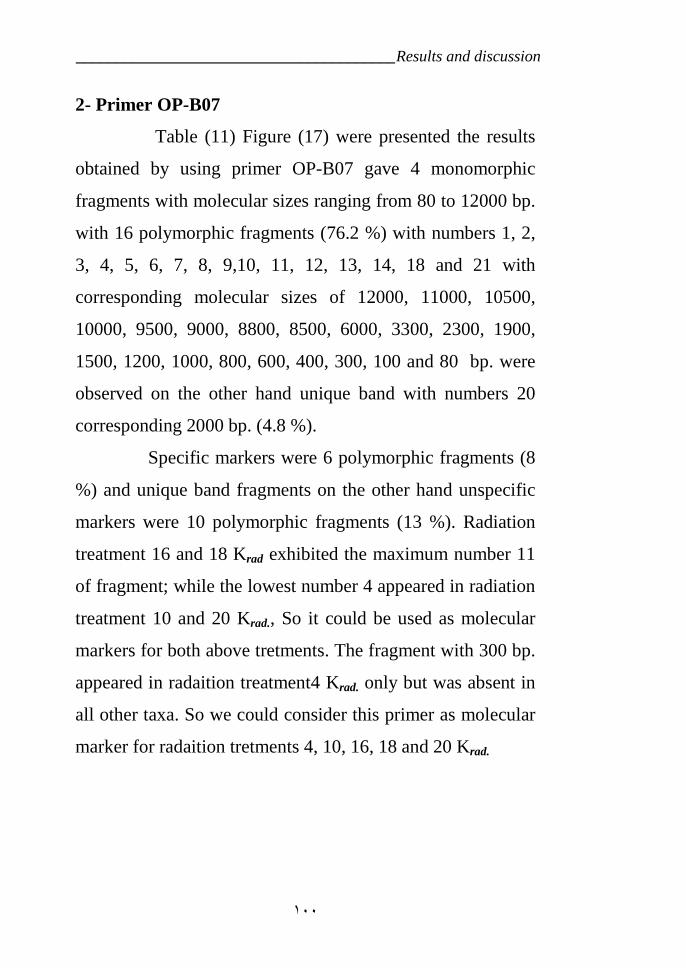
________________________________________Results and discussion
١٠٠
2- Primer OP-B07
Table (11) Figure (17) were presented the results
obtained by using primer OP-B07 gave 4 monomorphic
fragments with molecular sizes ranging from 80 to 12000 bp.
with 16 polymorphic fragments (76.2 %) with numbers 1, 2,
3, 4, 5, 6, 7, 8, 9,10, 11, 12, 13, 14, 18 and 21 with
corresponding molecular sizes of 12000, 11000, 10500,
10000, 9500, 9000, 8800, 8500, 6000, 3300, 2300, 1900,
1500, 1200, 1000, 800, 600, 400, 300, 100 and 80 bp. were
observed on the other hand unique band with numbers 20
corresponding 2000 bp. (4.8 %).
Specific markers were 6 polymorphic fragments (8
%) and unique band fragments on the other hand unspecific
markers were 10 polymorphic fragments (13 %). Radiation
treatment 16 and 18 Krad exhibited the maximum number 11
of fragment; while the lowest number 4 appeared in radiation
treatment 10 and 20 Krad., So it could be used as molecular
markers for both above tretments. The fragment with 300 bp.
appeared in radaition treatment4 Krad. only but was absent in
all other taxa. So we could consider this primer as molecular
marker for radaition tretments 4, 10, 16, 18 and 20 Krad.
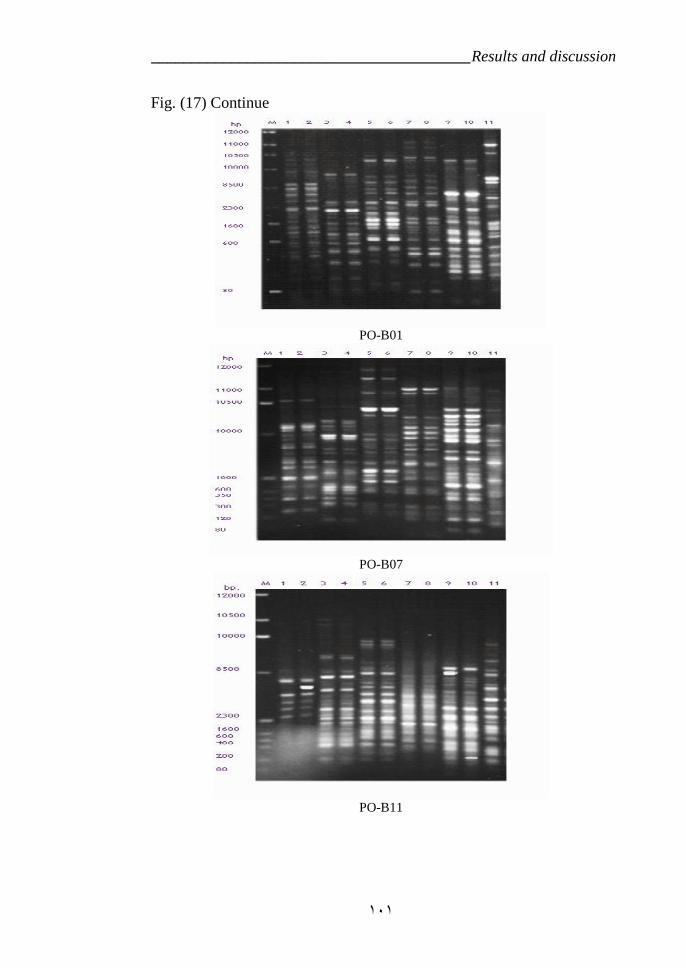
________________________________________Results and discussion
١٠١
Fig. (17) Continue
PO-B01
PO-B07
PO-B11
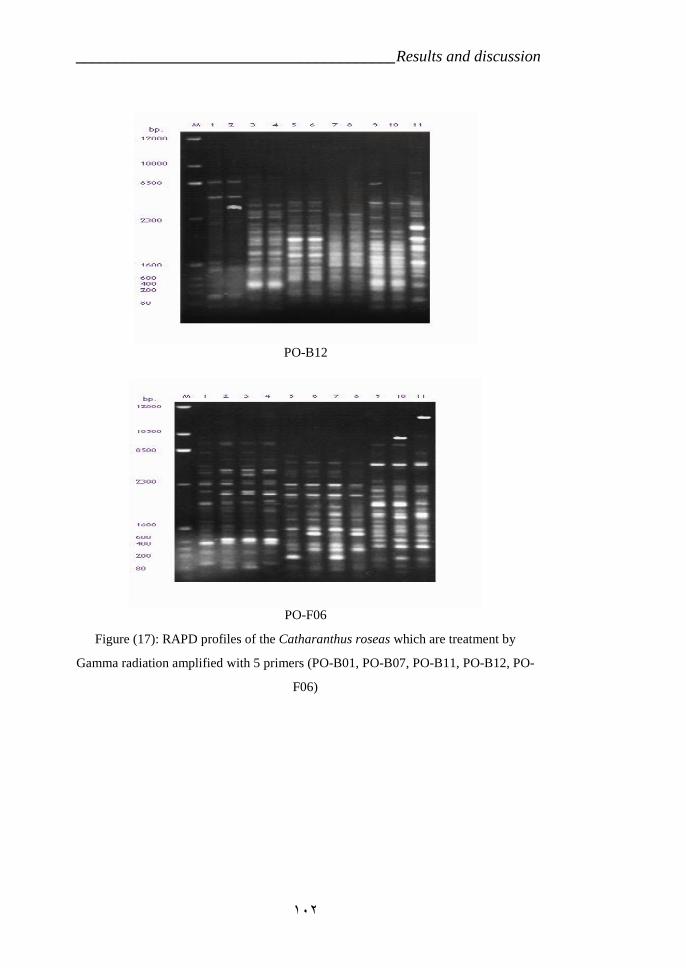
________________________________________Results and discussion
١٠٢
PO-B12
PO-F06
Figure (17): RAPD profiles of the Catharanthus roseas which are treatment by
Gamma radiation amplified with 5 primers (PO-B01, PO-B07, PO-B11, PO-B12, PO-
F06)
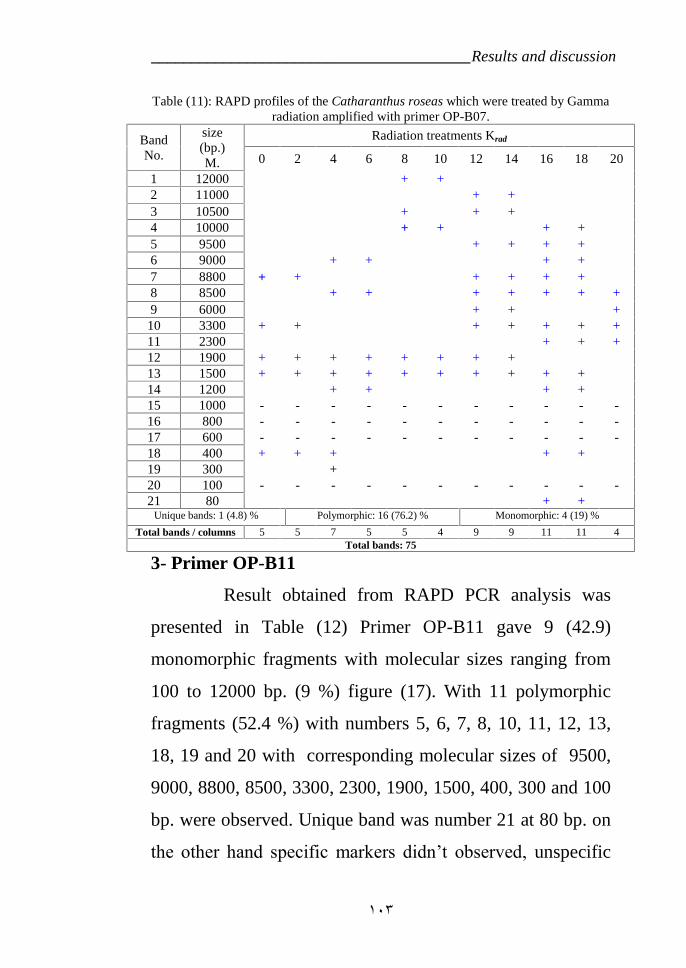
________________________________________Results and discussion
١٠٣
Table (11): RAPD profiles of the Catharanthus roseas which were treated by Gammaradiation amplified with primer OP-B07.
BandNo.
size(bp.)M.
Radiation treatments Krad
0 2 4 6 8 10 12 14 16 18 20
1 12000 + +2 11000 + +3 10500 + + +4 10000 + + + +5 9500 + + + +6 9000 + + + +7 8800 + + + + + +8 8500 + + + + + + +9 6000 + + +10 3300 + + + + + + +11 2300 + + +12 1900 + + + + + + + +13 1500 + + + + + + + + + +14 1200 + + + +15 1000 - - - - - - - - - - -16 800 - - - - - - - - - - -17 600 - - - - - - - - - - -18 400 + + + + +19 300 +20 100 - - - - - - - - - - -21 80 + +
Unique bands: 1 (4.8) % Polymorphic: 16 (76.2) % Monomorphic: 4 (19) %
Total bands / columns 5 5 7 5 5 4 9 9 11 11 4Total bands: 75
3- Primer OP-B11
Result obtained from RAPD PCR analysis was
presented in Table (12) Primer OP-B11 gave 9 (42.9)
monomorphic fragments with molecular sizes ranging from
100 to 12000 bp. (9 %) figure (17). With 11 polymorphic
fragments (52.4 %) with numbers 5, 6, 7, 8, 10, 11, 12, 13,
18, 19 and 20 with corresponding molecular sizes of 9500,
9000, 8800, 8500, 3300, 2300, 1900, 1500, 400, 300 and 100
bp. were observed. Unique band was number 21 at 80 bp. on
the other hand specific markers didn’t observed, unspecific
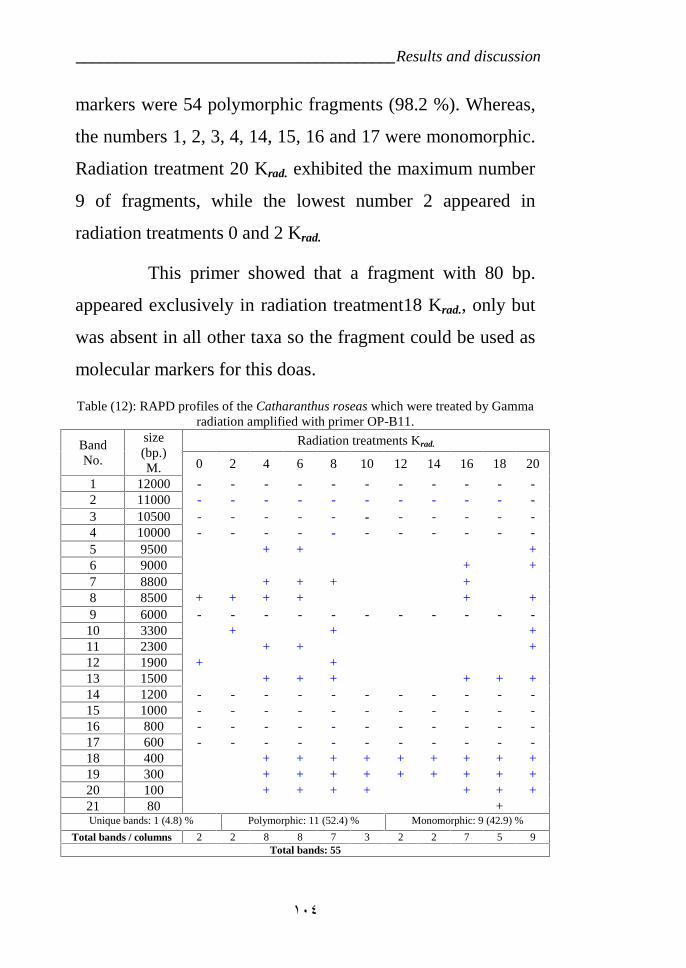
________________________________________Results and discussion
١٠٤
markers were 54 polymorphic fragments (98.2 %). Whereas,
the numbers 1, 2, 3, 4, 14, 15, 16 and 17 were monomorphic.
Radiation treatment 20 Krad. exhibited the maximum number
9 of fragments, while the lowest number 2 appeared in
radiation treatments 0 and 2 Krad.
This primer showed that a fragment with 80 bp.
appeared exclusively in radiation treatment18 Krad., only but
was absent in all other taxa so the fragment could be used as
molecular markers for this doas.
Table (12): RAPD profiles of the Catharanthus roseas which were treated by Gammaradiation amplified with primer OP-B11.
BandNo.
size(bp.)M.
Radiation treatments Krad.
0 2 4 6 8 10 12 14 16 18 20
1 12000 - - - - - - - - - - -2 11000 - - - - - - - - - - -3 10500 - - - - - - - - - - -4 10000 - - - - - - - - - - -5 9500 + + +6 9000 + +7 8800 + + + +8 8500 + + + + + +9 6000 - - - - - - - - - - -
10 3300 + + +11 2300 + + +12 1900 + +13 1500 + + + + + +14 1200 - - - - - - - - - - -15 1000 - - - - - - - - - - -16 800 - - - - - - - - - - -17 600 - - - - - - - - - - -18 400 + + + + + + + + +19 300 + + + + + + + + +20 100 + + + + + + +21 80 +Unique bands: 1 (4.8) % Polymorphic: 11 (52.4) % Monomorphic: 9 (42.9) %
Total bands / columns 2 2 8 8 7 3 2 2 7 5 9Total bands: 55
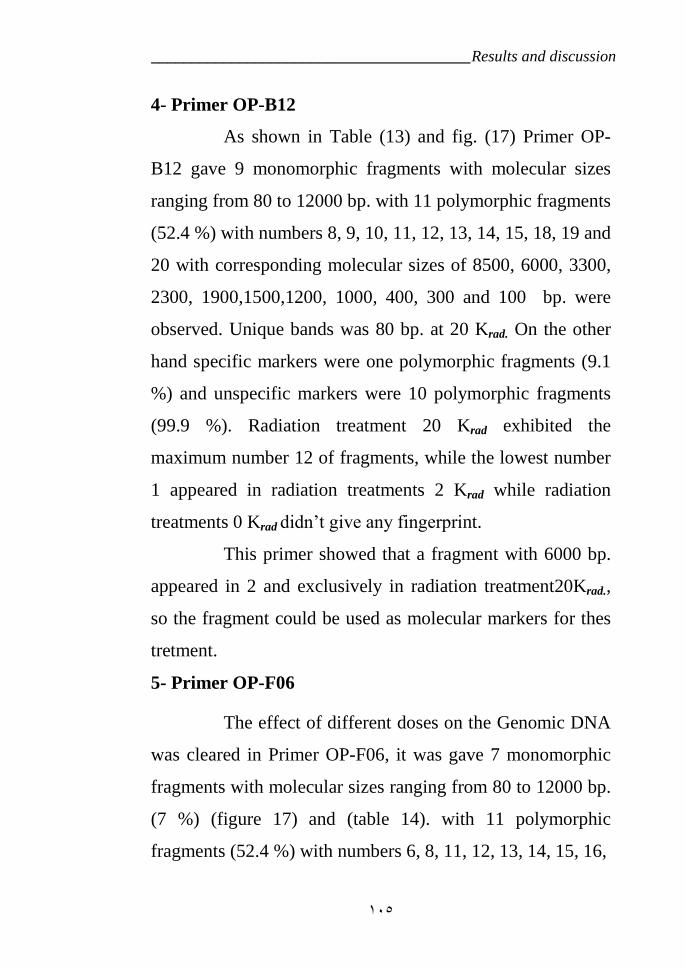
________________________________________Results and discussion
١٠٥
4- Primer OP-B12
As shown in Table (13) and fig. (17) Primer OP-
B12 gave 9 monomorphic fragments with molecular sizes
ranging from 80 to 12000 bp. with 11 polymorphic fragments
(52.4 %) with numbers 8, 9, 10, 11, 12, 13, 14, 15, 18, 19 and
20 with corresponding molecular sizes of 8500, 6000, 3300,
2300, 1900,1500,1200, 1000, 400, 300 and 100 bp. were
observed. Unique bands was 80 bp. at 20 Krad. On the other
hand specific markers were one polymorphic fragments (9.1
%) and unspecific markers were 10 polymorphic fragments
(99.9 %). Radiation treatment 20 Krad exhibited the
maximum number 12 of fragments, while the lowest number
1 appeared in radiation treatments 2 Krad while radiation
treatments 0 Krad didn’t give any fingerprint.
This primer showed that a fragment with 6000 bp.
appeared in 2 and exclusively in radiation treatment20Krad.,
so the fragment could be used as molecular markers for thes
tretment.
5- Primer OP-F06
The effect of different doses on the Genomic DNA
was cleared in Primer OP-F06, it was gave 7 monomorphic
fragments with molecular sizes ranging from 80 to 12000 bp.
(7 %) (figure 17) and (table 14). with 11 polymorphic
fragments (52.4 %) with numbers 6, 8, 11, 12, 13, 14, 15, 16,
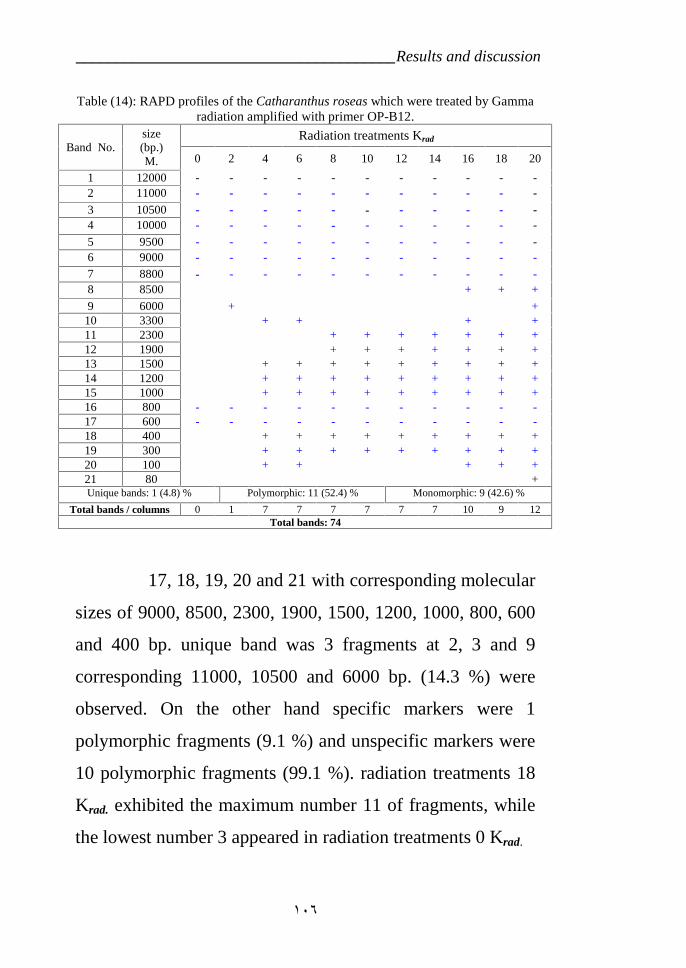
________________________________________Results and discussion
١٠٦
Table (14): RAPD profiles of the Catharanthus roseas which were treated by Gammaradiation amplified with primer OP-B12.
Band No.size(bp.)M.
Radiation treatments Krad
0 2 4 6 8 10 12 14 16 18 20
1 12000 - - - - - - - - - - -2 11000 - - - - - - - - - - -
3 10500 - - - - - - - - - - -4 10000 - - - - - - - - - - -
5 9500 - - - - - - - - - - -6 9000 - - - - - - - - - - -7 8800 - - - - - - - - - - -8 8500 + + +
9 6000 + +10 3300 + + + +11 2300 + + + + + + +12 1900 + + + + + + +13 1500 + + + + + + + + +14 1200 + + + + + + + + +15 1000 + + + + + + + + +16 800 - - - - - - - - - - -17 600 - - - - - - - - - - -18 400 + + + + + + + + +19 300 + + + + + + + + +20 100 + + + + +21 80 +Unique bands: 1 (4.8) % Polymorphic: 11 (52.4) % Monomorphic: 9 (42.6) %
Total bands / columns 0 1 7 7 7 7 7 7 10 9 12Total bands: 74
17, 18, 19, 20 and 21 with corresponding molecular
sizes of 9000, 8500, 2300, 1900, 1500, 1200, 1000, 800, 600
and 400 bp. unique band was 3 fragments at 2, 3 and 9
corresponding 11000, 10500 and 6000 bp. (14.3 %) were
observed. On the other hand specific markers were 1
polymorphic fragments (9.1 %) and unspecific markers were
10 polymorphic fragments (99.1 %). radiation treatments 18
Krad. exhibited the maximum number 11 of fragments, while
the lowest number 3 appeared in radiation treatments 0 Krad.
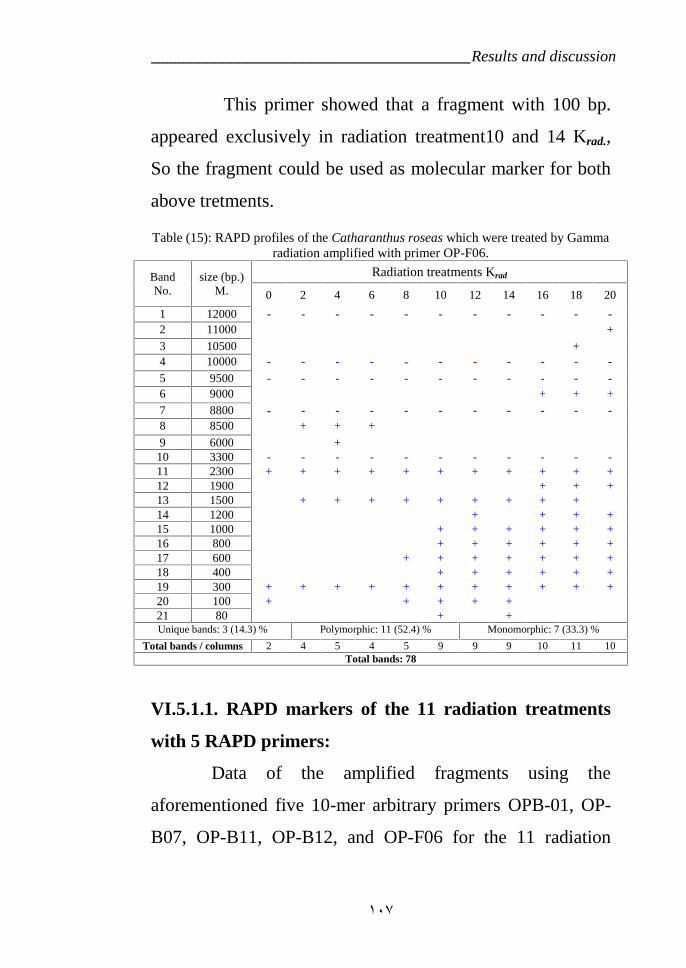
________________________________________Results and discussion
١٠٧
This primer showed that a fragment with 100 bp.
appeared exclusively in radiation treatment10 and 14 Krad.,
So the fragment could be used as molecular marker for both
above tretments.
Table (15): RAPD profiles of the Catharanthus roseas which were treated by Gammaradiation amplified with primer OP-F06.
BandNo.
size (bp.)M.
Radiation treatments Krad
0 2 4 6 8 10 12 14 16 18 20
1 12000 - - - - - - - - - - -2 11000 +
3 10500 +4 10000 - - - - - - - - - - -
5 9500 - - - - - - - - - - -6 9000 + + +7 8800 - - - - - - - - - - -8 8500 + + +
9 6000 +10 3300 - - - - - - - - - - -11 2300 + + + + + + + + + + +12 1900 + + +13 1500 + + + + + + + + +14 1200 + + + +15 1000 + + + + + +16 800 + + + + + +17 600 + + + + + + +18 400 + + + + + +19 300 + + + + + + + + + + +20 100 + + + + +21 80 + +Unique bands: 3 (14.3) % Polymorphic: 11 (52.4) % Monomorphic: 7 (33.3) %
Total bands / columns 2 4 5 4 5 9 9 9 10 11 10Total bands: 78
VI.5.1.1. RAPD markers of the 11 radiation treatments
with 5 RAPD primers:
Data of the amplified fragments using the
aforementioned five 10-mer arbitrary primers OPB-01, OP-
B07, OP-B11, OP-B12, and OP-F06 for the 11 radiation
________________________________________Results and discussion
١٠٨
treatments controlled with 0 Krad; 2, 4, 6, 8, 10, 12, 14, 16, 18
and 20 Krad indicated successful amplification of PCR
products. Polymorphism levels differed from one primer to
the other .The main results was as following table (16).
Data in Table (16) showed that the five primers
showed polymorphic differences among the radiation
treatments, while some primers exhibited high polymorphism
such as OPB-01 (80.9 %) and OP-B07 (76.2 %) on the other
hand, some primers exhibited medium levels of
polymorphism such as OP-B07, OP-F06 and OP-B01 (52.4
%).
The Randomly Amplified Polymorphic DNA (RAPD)
technique is suitable for developing the molecular markers
because of its technical simplicity and the modest cost of
generating a large number of markers. Furthermore, the
technique dose not require knowledge of the genome and
RAPD marker have been adopted as a convenient means of
tagging genes of interest in Catharanthus roseas Quarta et
al., (2001).
PCR-based multi-locus DNA fingerprints represent
one of the most informative and cost-effective measures of
genetic diversity and are useful population-level biomarkers
of toxicological and other anthropogenic impacts. However,
Concerns about reproducibility of DNA fingerprints have
________________________________________Results and discussion
١٠٩
limited their wider use in environmental biology. We
assessed polymorphism and reproducibility of common
fingerprinting techniques, RAPD (randomly amplified
polymorphic DNA).
The results that by excluding bands that comprised
less than 1% of total intensity, and by excluding the largest
and smallest 10% of the bands, we could achieve nearly
100% reproducibility of RAPD fingerprints. Similar
application of band exclusion criteria to RAPD fingerprints
did not significantly enhance their reproducibility, and at
least 15% of RAPD bands were not fully repeat table, heir
table, or transmit table. Our results are in agreement with
Sarika et al., (2007) whom analyzed a C. roseas by
isoenzyme and RAPD markers in order to assess their genetic
relationships. They stated that RAPD technique, through
discriminating among all the species and distinguishing
among 144 F2 plants of C. roseas, developed by crossing the
accession ‘Pink Delhi’ (pink colored flower petals and stem,
dark green leaf lamina bearing elliptic apex and borne on
small petiole, long pods, tall habit, less salt and drought
sensitivity, and high in alkaloid yield).
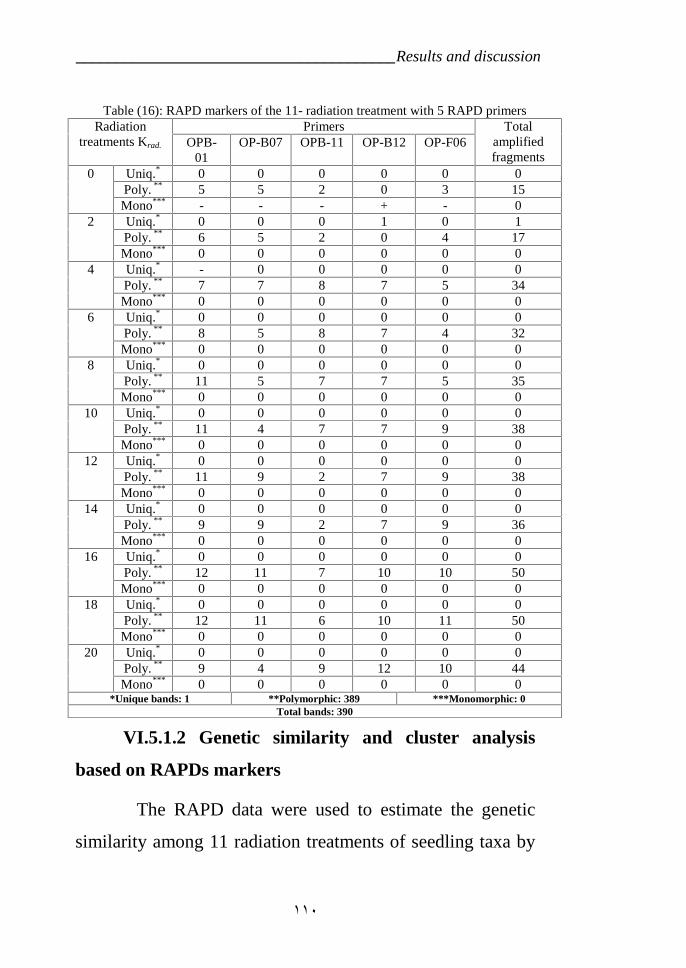
________________________________________Results and discussion
١١٠
VI.5.1.2 Genetic similarity and cluster analysis
based on RAPDs markers
The RAPD data were used to estimate the genetic
similarity among 11 radiation treatments of seedling taxa by
Table (16): RAPD markers of the 11- radiation treatment with 5 RAPD primersRadiation
treatments Krad.
Primers Totalamplifiedfragments
OPB-01
OP-B07 OPB-11 OP-B12 OP-F06
0 Uniq.* 0 0 0 0 0 0Poly. ** 5 5 2 0 3 15Mono*** - - - + - 0
2 Uniq.* 0 0 0 1 0 1Poly. ** 6 5 2 0 4 17Mono*** 0 0 0 0 0 0
4 Uniq.* - 0 0 0 0 0Poly. ** 7 7 8 7 5 34Mono*** 0 0 0 0 0 0
6 Uniq.* 0 0 0 0 0 0Poly. ** 8 5 8 7 4 32Mono*** 0 0 0 0 0 0
8 Uniq.* 0 0 0 0 0 0Poly. ** 11 5 7 7 5 35Mono*** 0 0 0 0 0 0
10 Uniq.* 0 0 0 0 0 0Poly. ** 11 4 7 7 9 38Mono*** 0 0 0 0 0 0
12 Uniq.* 0 0 0 0 0 0Poly. ** 11 9 2 7 9 38Mono*** 0 0 0 0 0 0
14 Uniq.* 0 0 0 0 0 0Poly. ** 9 9 2 7 9 36Mono*** 0 0 0 0 0 0
16 Uniq.* 0 0 0 0 0 0Poly. ** 12 11 7 10 10 50Mono*** 0 0 0 0 0 0
18 Uniq.* 0 0 0 0 0 0Poly. ** 12 11 6 10 11 50Mono*** 0 0 0 0 0 0
20 Uniq.* 0 0 0 0 0 0Poly. ** 9 4 9 12 10 44Mono*** 0 0 0 0 0 0
*Unique bands: 1 **Polymorphic: 389 ***Monomorphic: 0Total bands: 390
________________________________________Results and discussion
١١١
using Biorad softwere computer analysis was shown in (table
17). The highest similarity index recorded was 0.998, which
was observed between the two taxa control and radiation
treatment 20 Krad while the lowest similarity index recorded
was 0.91, which was observed between radiation treatments
2 and 6 Krad
A dendrogram for the genetic relationships among
the control and 10 radiation treatments was carried out as in
Fig. (18). The 11 taxa were separated into two clusters;
cluster one included 0, 20, 12, 16, 18, 8, 2 and 4 Krad., while
the cluster two included 10, 14 and 6 Krad.
Within the cluster one, three sub clusters were found;
the first one contained 2 Krad. and 4 Krad., the second sub
clusters was divided into sub-sub-sub clusters the first
contain 0 and 20 Krad. The while the third sub clusters contain
12, 16 and 18 Krad. (in the first division), and 8 Krad. (in the
second division). The second cluster divided into two sub
clusters the first one contained 6 and 14 Krad. , while the
second sub cluster contained 10 Krad. only.
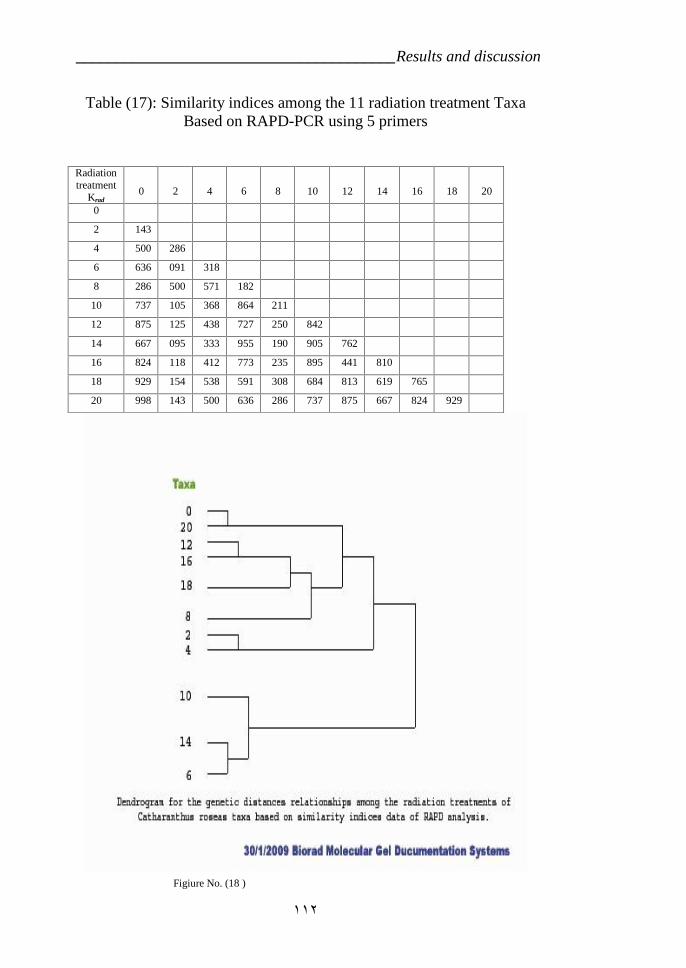
________________________________________Results and discussion
١١٢
Figiure No. (18 )
Table (17): Similarity indices among the 11 radiation treatment TaxaBased on RAPD-PCR using 5 primers
Radiationtreatment
Krad0 2 4 6 8 10 12 14 16 18 20
0
2 143
4 500 286
6 636 091 318
8 286 500 571 182
10 737 105 368 864 211
12 875 125 438 727 250 842
14 667 095 333 955 190 905 762
16 824 118 412 773 235 895 441 810
18 929 154 538 591 308 684 813 619 765
20 998 143 500 636 286 737 875 667 824 929
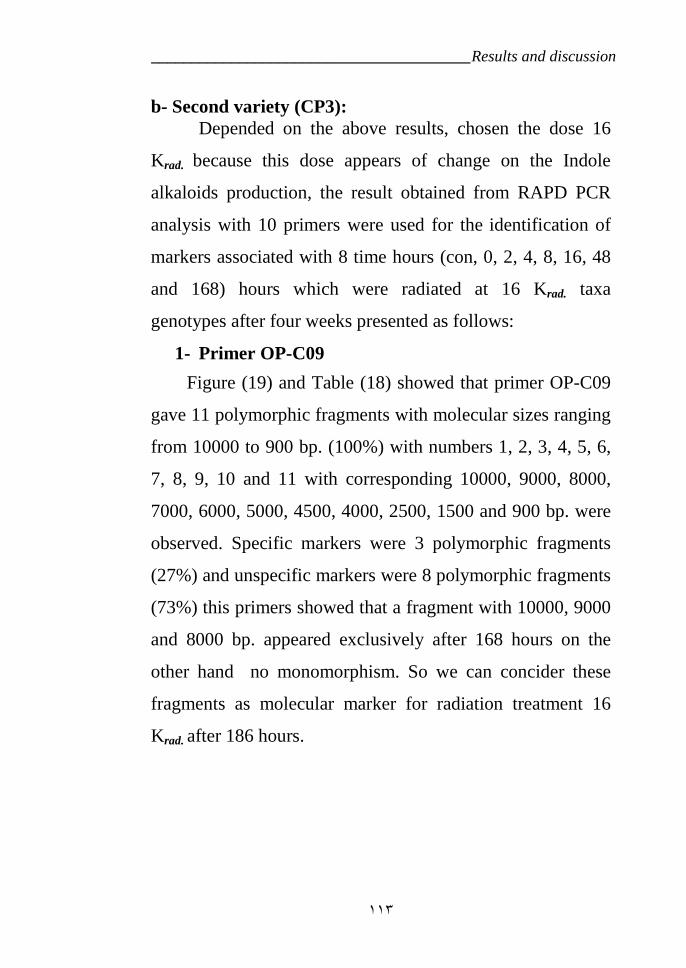
________________________________________Results and discussion
١١٣
b- Second variety (CP3):Depended on the above results, chosen the dose 16
Krad. because this dose appears of change on the Indole
alkaloids production, the result obtained from RAPD PCR
analysis with 10 primers were used for the identification of
markers associated with 8 time hours (con, 0, 2, 4, 8, 16, 48
and 168) hours which were radiated at 16 Krad. taxa
genotypes after four weeks presented as follows:
1- Primer OP-C09
Figure (19) and Table (18) showed that primer OP-C09
gave 11 polymorphic fragments with molecular sizes ranging
from 10000 to 900 bp. (100%) with numbers 1, 2, 3, 4, 5, 6,
7, 8, 9, 10 and 11 with corresponding 10000, 9000, 8000,
7000, 6000, 5000, 4500, 4000, 2500, 1500 and 900 bp. were
observed. Specific markers were 3 polymorphic fragments
(27%) and unspecific markers were 8 polymorphic fragments
(73%) this primers showed that a fragment with 10000, 9000
and 8000 bp. appeared exclusively after 168 hours on the
other hand no monomorphism. So we can concider these
fragments as molecular marker for radiation treatment 16
Krad. after 186 hours.
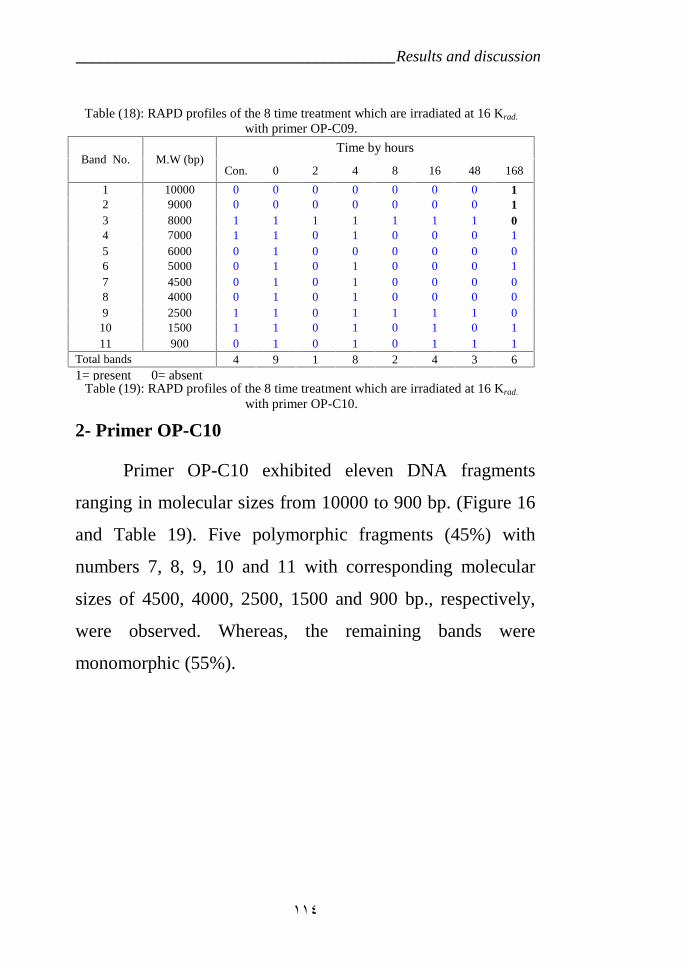
________________________________________Results and discussion
١١٤
2- Primer OP-C10
Primer OP-C10 exhibited eleven DNA fragments
ranging in molecular sizes from 10000 to 900 bp. (Figure 16
and Table 19). Five polymorphic fragments (45%) with
numbers 7, 8, 9, 10 and 11 with corresponding molecular
sizes of 4500, 4000, 2500, 1500 and 900 bp., respectively,
were observed. Whereas, the remaining bands were
monomorphic (55%).
Table (18): RAPD profiles of the 8 time treatment which are irradiated at 16 Krad.
with primer OP-C09.
Band No. M.W (bp)Time by hours
Con. 0 2 4 8 16 48 168
1 10000 0 0 0 0 0 0 0 12 9000 0 0 0 0 0 0 0 13 8000 1 1 1 1 1 1 1 04 7000 1 1 0 1 0 0 0 15 6000 0 1 0 0 0 0 0 06 5000 0 1 0 1 0 0 0 17 4500 0 1 0 1 0 0 0 08 4000 0 1 0 1 0 0 0 09 2500 1 1 0 1 1 1 1 010 1500 1 1 0 1 0 1 0 111 900 0 1 0 1 0 1 1 1
Total bands 4 9 1 8 2 4 3 61= present 0= absent
Table (19): RAPD profiles of the 8 time treatment which are irradiated at 16 Krad.
with primer OP-C10.
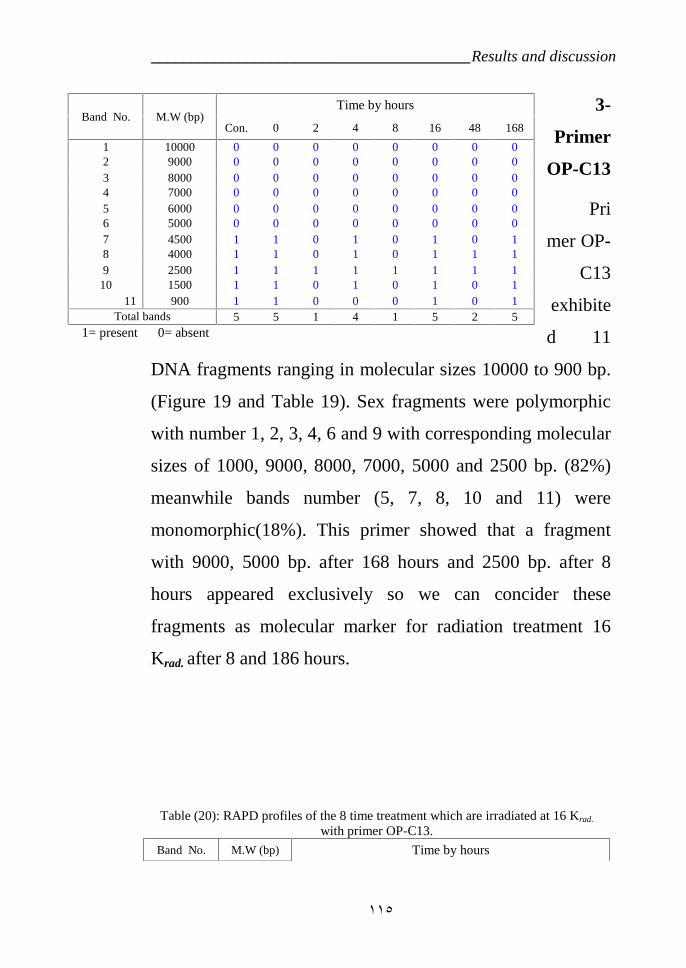
________________________________________Results and discussion
١١٥
3-
Primer
OP-C13
Pri
mer OP-
C13
exhibite
d 11
DNA fragments ranging in molecular sizes 10000 to 900 bp.
(Figure 19 and Table 19). Sex fragments were polymorphic
with number 1, 2, 3, 4, 6 and 9 with corresponding molecular
sizes of 1000, 9000, 8000, 7000, 5000 and 2500 bp. (82%)
meanwhile bands number (5, 7, 8, 10 and 11) were
monomorphic(18%). This primer showed that a fragment
with 9000, 5000 bp. after 168 hours and 2500 bp. after 8
hours appeared exclusively so we can concider these
fragments as molecular marker for radiation treatment 16
Krad. after 8 and 186 hours.
Band No. M.W (bp)Time by hours
Con. 0 2 4 8 16 48 168
1 10000 0 0 0 0 0 0 0 02 9000 0 0 0 0 0 0 0 03 8000 0 0 0 0 0 0 0 04 7000 0 0 0 0 0 0 0 05 6000 0 0 0 0 0 0 0 06 5000 0 0 0 0 0 0 0 07 4500 1 1 0 1 0 1 0 18 4000 1 1 0 1 0 1 1 19 2500 1 1 1 1 1 1 1 1
10 1500 1 1 0 1 0 1 0 111 900 1 1 0 0 0 1 0 1
Total bands 5 5 1 4 1 5 2 51= present 0= absent
Table (20): RAPD profiles of the 8 time treatment which are irradiated at 16 Krad.
with primer OP-C13.
Band No. M.W (bp) Time by hours
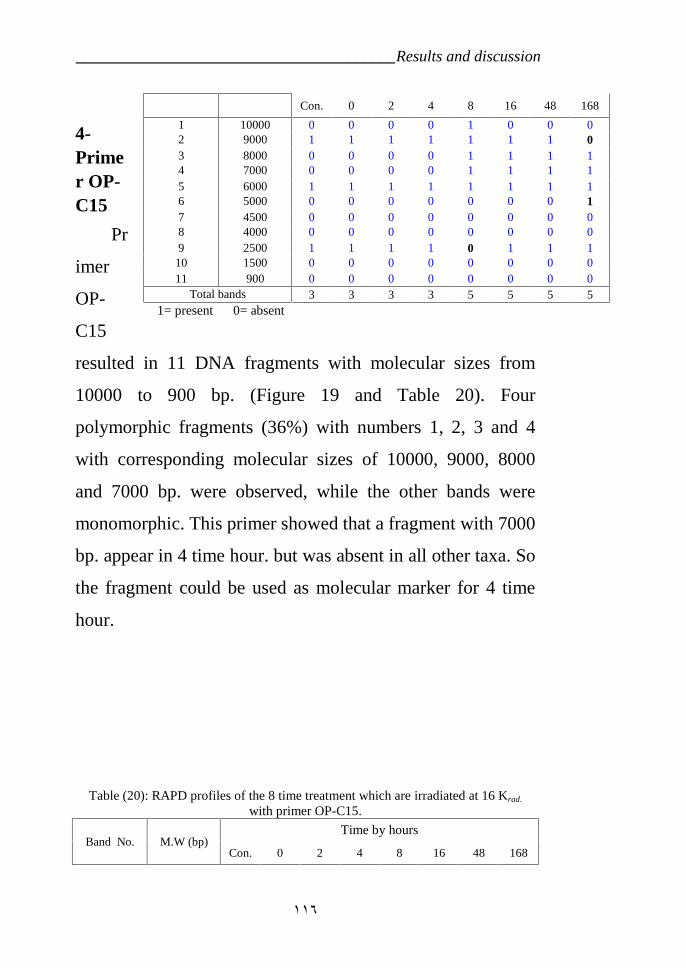
________________________________________Results and discussion
١١٦
4-Primer OP-C15
Pr
imer
OP-
C15
resulted in 11 DNA fragments with molecular sizes from
10000 to 900 bp. (Figure 19 and Table 20). Four
polymorphic fragments (36%) with numbers 1, 2, 3 and 4
with corresponding molecular sizes of 10000, 9000, 8000
and 7000 bp. were observed, while the other bands were
monomorphic. This primer showed that a fragment with 7000
bp. appear in 4 time hour. but was absent in all other taxa. So
the fragment could be used as molecular marker for 4 time
hour.
Table (20): RAPD profiles of the 8 time treatment which are irradiated at 16 Krad.
with primer OP-C15.
Band No. M.W (bp)Time by hours
Con. 0 2 4 8 16 48 168
Con. 0 2 4 8 16 48 168
1 10000 0 0 0 0 1 0 0 02 9000 1 1 1 1 1 1 1 03 8000 0 0 0 0 1 1 1 14 7000 0 0 0 0 1 1 1 15 6000 1 1 1 1 1 1 1 16 5000 0 0 0 0 0 0 0 17 4500 0 0 0 0 0 0 0 08 4000 0 0 0 0 0 0 0 09 2500 1 1 1 1 0 1 1 1
10 1500 0 0 0 0 0 0 0 011 900 0 0 0 0 0 0 0 0
Total bands 3 3 3 3 5 5 5 51= present 0= absent
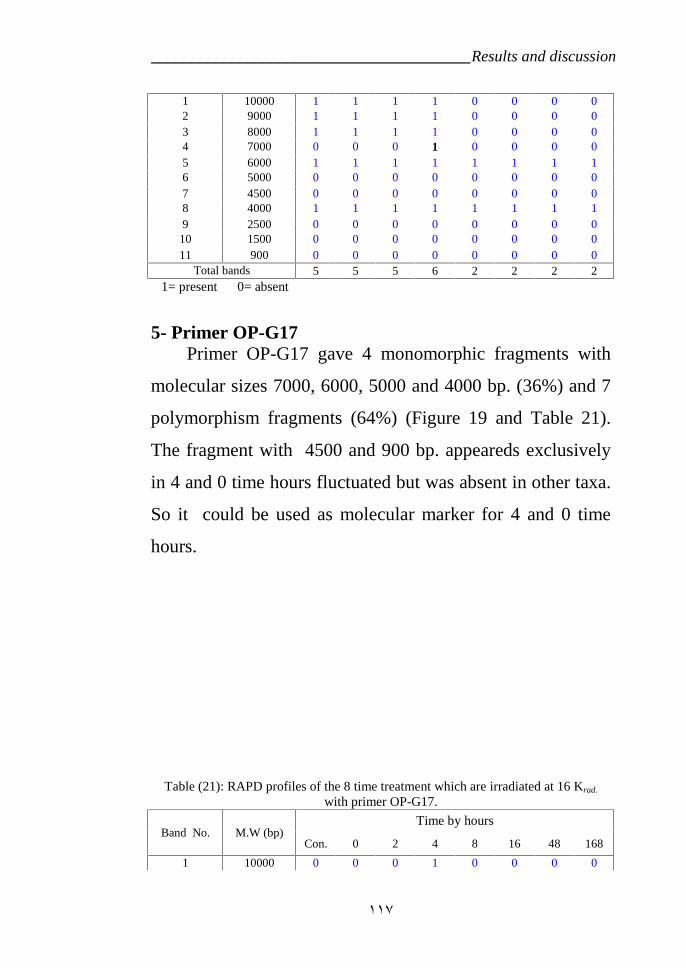
________________________________________Results and discussion
١١٧
1 10000 1 1 1 1 0 0 0 02 9000 1 1 1 1 0 0 0 03 8000 1 1 1 1 0 0 0 04 7000 0 0 0 1 0 0 0 05 6000 1 1 1 1 1 1 1 16 5000 0 0 0 0 0 0 0 07 4500 0 0 0 0 0 0 0 08 4000 1 1 1 1 1 1 1 19 2500 0 0 0 0 0 0 0 0
10 1500 0 0 0 0 0 0 0 011 900 0 0 0 0 0 0 0 0
Total bands 5 5 5 6 2 2 2 21= present 0= absent
5- Primer OP-G17Primer OP-G17 gave 4 monomorphic fragments with
molecular sizes 7000, 6000, 5000 and 4000 bp. (36%) and 7
polymorphism fragments (64%) (Figure 19 and Table 21).
The fragment with 4500 and 900 bp. appeareds exclusively
in 4 and 0 time hours fluctuated but was absent in other taxa.
So it could be used as molecular marker for 4 and 0 time
hours.
Table (21): RAPD profiles of the 8 time treatment which are irradiated at 16 Krad.
with primer OP-G17.
Band No. M.W (bp)Time by hours
Con. 0 2 4 8 16 48 168
1 10000 0 0 0 1 0 0 0 0
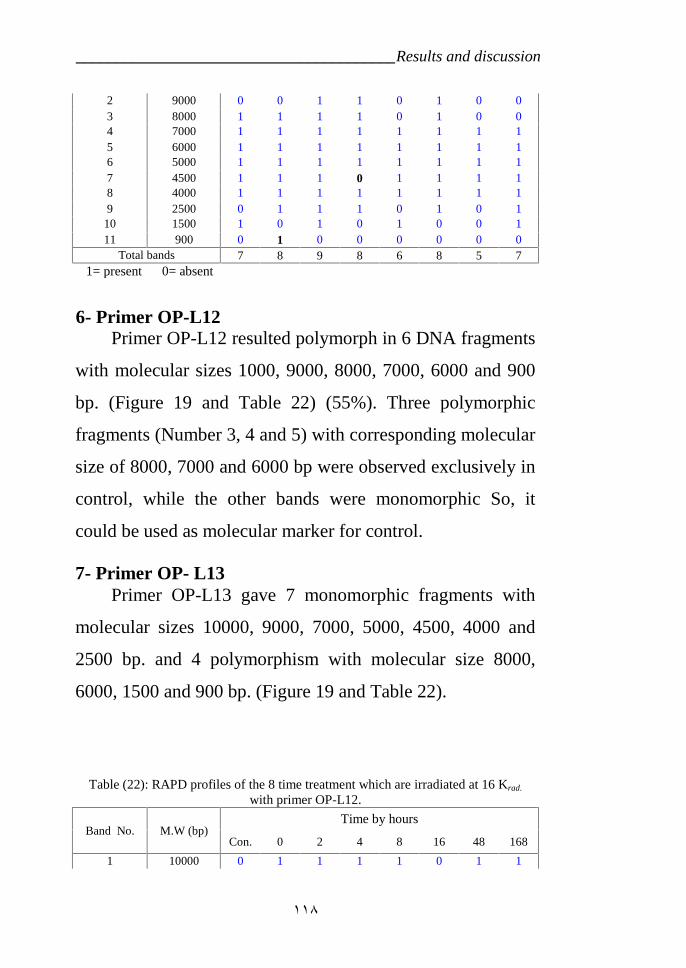
________________________________________Results and discussion
١١٨
2 9000 0 0 1 1 0 1 0 03 8000 1 1 1 1 0 1 0 04 7000 1 1 1 1 1 1 1 15 6000 1 1 1 1 1 1 1 16 5000 1 1 1 1 1 1 1 17 4500 1 1 1 0 1 1 1 18 4000 1 1 1 1 1 1 1 19 2500 0 1 1 1 0 1 0 1
10 1500 1 0 1 0 1 0 0 111 900 0 1 0 0 0 0 0 0
Total bands 7 8 9 8 6 8 5 71= present 0= absent
6- Primer OP-L12Primer OP-L12 resulted polymorph in 6 DNA fragments
with molecular sizes 1000, 9000, 8000, 7000, 6000 and 900
bp. (Figure 19 and Table 22) (55%). Three polymorphic
fragments (Number 3, 4 and 5) with corresponding molecular
size of 8000, 7000 and 6000 bp were observed exclusively in
control, while the other bands were monomorphic So, it
could be used as molecular marker for control.
7- Primer OP- L13Primer OP-L13 gave 7 monomorphic fragments with
molecular sizes 10000, 9000, 7000, 5000, 4500, 4000 and
2500 bp. and 4 polymorphism with molecular size 8000,
6000, 1500 and 900 bp. (Figure 19 and Table 22).
Table (22): RAPD profiles of the 8 time treatment which are irradiated at 16 Krad.
with primer OP-L12.
Band No. M.W (bp)Time by hours
Con. 0 2 4 8 16 48 168
1 10000 0 1 1 1 1 0 1 1
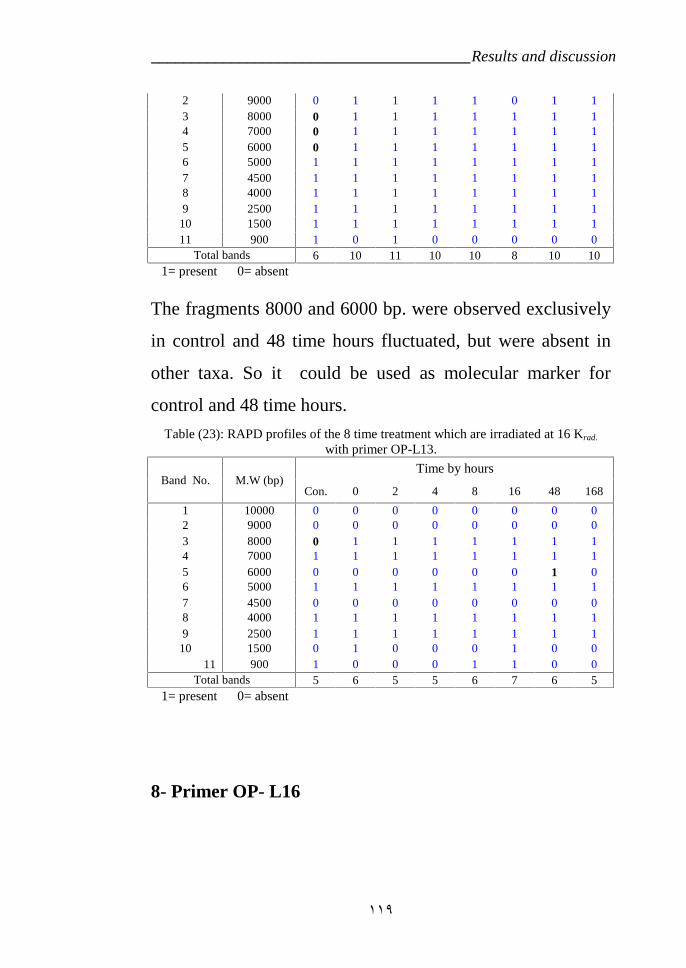
________________________________________Results and discussion
١١٩
2 9000 0 1 1 1 1 0 1 13 8000 0 1 1 1 1 1 1 14 7000 0 1 1 1 1 1 1 15 6000 0 1 1 1 1 1 1 16 5000 1 1 1 1 1 1 1 17 4500 1 1 1 1 1 1 1 18 4000 1 1 1 1 1 1 1 19 2500 1 1 1 1 1 1 1 1
10 1500 1 1 1 1 1 1 1 111 900 1 0 1 0 0 0 0 0
Total bands 6 10 11 10 10 8 10 101= present 0= absent
The fragments 8000 and 6000 bp. were observed exclusively
in control and 48 time hours fluctuated, but were absent in
other taxa. So it could be used as molecular marker for
control and 48 time hours.
Table (23): RAPD profiles of the 8 time treatment which are irradiated at 16 Krad.
with primer OP-L13.
Band No. M.W (bp)Time by hours
Con. 0 2 4 8 16 48 168
1 10000 0 0 0 0 0 0 0 02 9000 0 0 0 0 0 0 0 03 8000 0 1 1 1 1 1 1 14 7000 1 1 1 1 1 1 1 15 6000 0 0 0 0 0 0 1 06 5000 1 1 1 1 1 1 1 17 4500 0 0 0 0 0 0 0 08 4000 1 1 1 1 1 1 1 19 2500 1 1 1 1 1 1 1 1
10 1500 0 1 0 0 0 1 0 011 900 1 0 0 0 1 1 0 0
Total bands 5 6 5 5 6 7 6 51= present 0= absent
8- Primer OP- L16
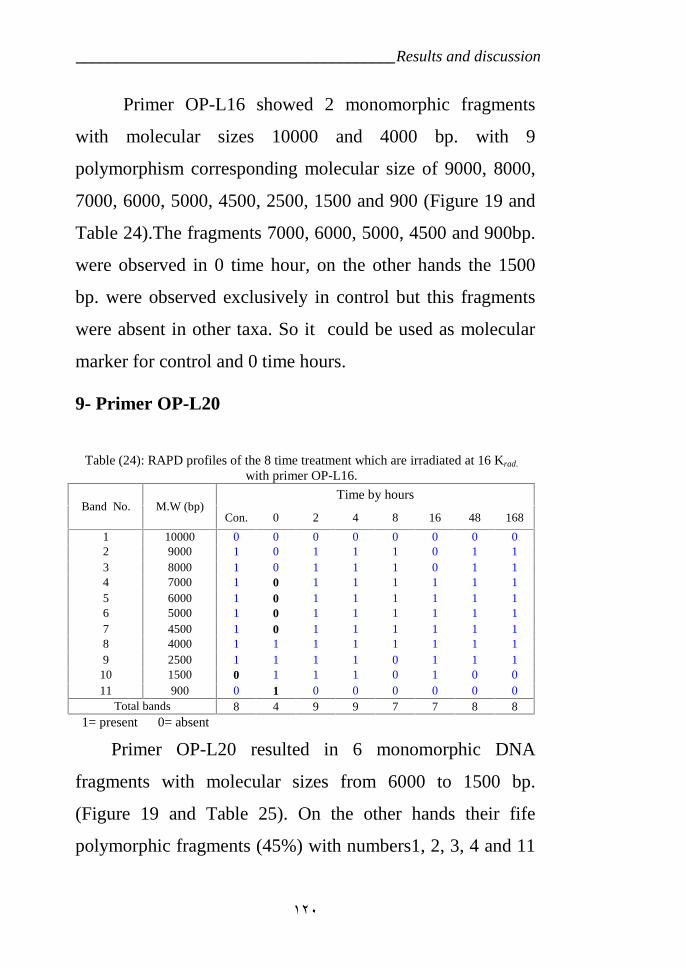
________________________________________Results and discussion
١٢٠
Primer OP-L16 showed 2 monomorphic fragments
with molecular sizes 10000 and 4000 bp. with 9
polymorphism corresponding molecular size of 9000, 8000,
7000, 6000, 5000, 4500, 2500, 1500 and 900 (Figure 19 and
Table 24).The fragments 7000, 6000, 5000, 4500 and 900bp.
were observed in 0 time hour, on the other hands the 1500
bp. were observed exclusively in control but this fragments
were absent in other taxa. So it could be used as molecular
marker for control and 0 time hours.
9- Primer OP-L20
Primer OP-L20 resulted in 6 monomorphic DNA
fragments with molecular sizes from 6000 to 1500 bp.
(Figure 19 and Table 25). On the other hands their fife
polymorphic fragments (45%) with numbers1, 2, 3, 4 and 11
Table (24): RAPD profiles of the 8 time treatment which are irradiated at 16 Krad.
with primer OP-L16.
Band No. M.W (bp)Time by hours
Con. 0 2 4 8 16 48 168
1 10000 0 0 0 0 0 0 0 02 9000 1 0 1 1 1 0 1 13 8000 1 0 1 1 1 0 1 14 7000 1 0 1 1 1 1 1 15 6000 1 0 1 1 1 1 1 16 5000 1 0 1 1 1 1 1 17 4500 1 0 1 1 1 1 1 18 4000 1 1 1 1 1 1 1 19 2500 1 1 1 1 0 1 1 1
10 1500 0 1 1 1 0 1 0 011 900 0 1 0 0 0 0 0 0
Total bands 8 4 9 9 7 7 8 81= present 0= absent
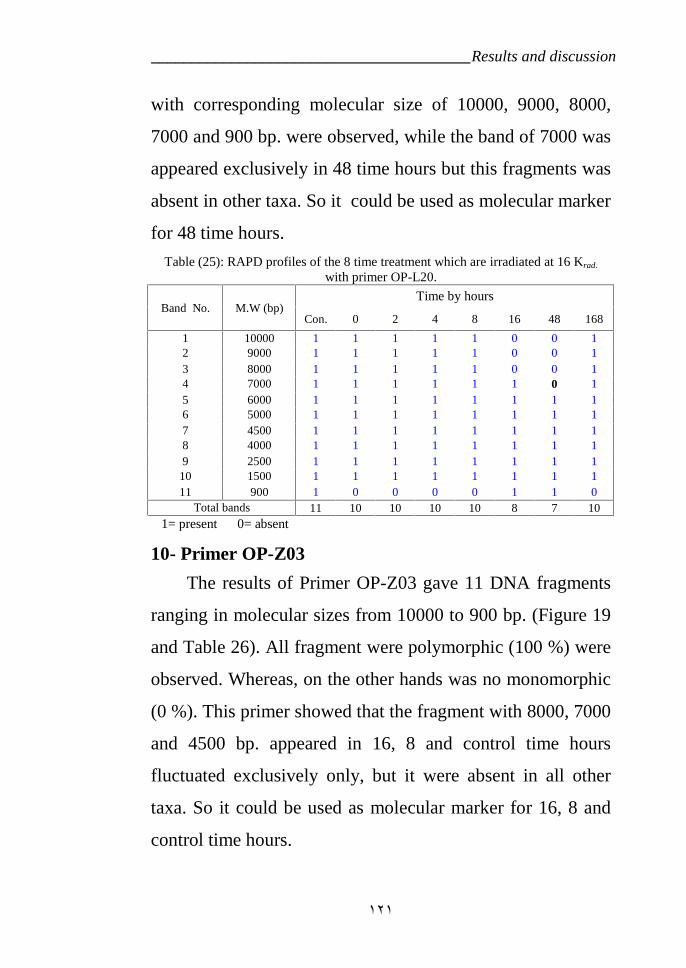
________________________________________Results and discussion
١٢١
with corresponding molecular size of 10000, 9000, 8000,
7000 and 900 bp. were observed, while the band of 7000 was
appeared exclusively in 48 time hours but this fragments was
absent in other taxa. So it could be used as molecular marker
for 48 time hours.
Table (25): RAPD profiles of the 8 time treatment which are irradiated at 16 Krad.
with primer OP-L20.
Band No. M.W (bp)Time by hours
Con. 0 2 4 8 16 48 168
1 10000 1 1 1 1 1 0 0 12 9000 1 1 1 1 1 0 0 13 8000 1 1 1 1 1 0 0 14 7000 1 1 1 1 1 1 0 15 6000 1 1 1 1 1 1 1 16 5000 1 1 1 1 1 1 1 17 4500 1 1 1 1 1 1 1 18 4000 1 1 1 1 1 1 1 19 2500 1 1 1 1 1 1 1 1
10 1500 1 1 1 1 1 1 1 111 900 1 0 0 0 0 1 1 0
Total bands 11 10 10 10 10 8 7 101= present 0= absent
10- Primer OP-Z03
The results of Primer OP-Z03 gave 11 DNA fragments
ranging in molecular sizes from 10000 to 900 bp. (Figure 19
and Table 26). All fragment were polymorphic (100 %) were
observed. Whereas, on the other hands was no monomorphic
(0 %). This primer showed that the fragment with 8000, 7000
and 4500 bp. appeared in 16, 8 and control time hours
fluctuated exclusively only, but it were absent in all other
taxa. So it could be used as molecular marker for 16, 8 and
control time hours.
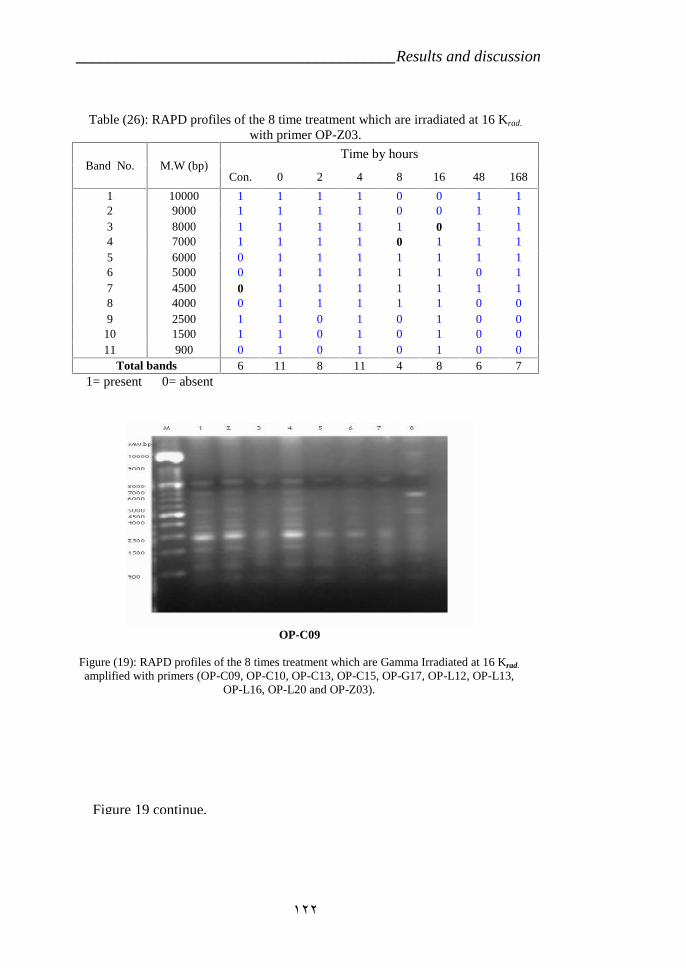
________________________________________Results and discussion
١٢٢
Table (26): RAPD profiles of the 8 time treatment which are irradiated at 16 Krad.
with primer OP-Z03.
Band No. M.W (bp)Time by hours
Con. 0 2 4 8 16 48 168
1 10000 1 1 1 1 0 0 1 12 9000 1 1 1 1 0 0 1 13 8000 1 1 1 1 1 0 1 14 7000 1 1 1 1 0 1 1 15 6000 0 1 1 1 1 1 1 16 5000 0 1 1 1 1 1 0 17 4500 0 1 1 1 1 1 1 18 4000 0 1 1 1 1 1 0 09 2500 1 1 0 1 0 1 0 0
10 1500 1 1 0 1 0 1 0 011 900 0 1 0 1 0 1 0 0
Total bands 6 11 8 11 4 8 6 71= present 0= absent
OP-C09
Figure (19): RAPD profiles of the 8 times treatment which are Gamma Irradiated at 16 Krad.
amplified with primers (OP-C09, OP-C10, OP-C13, OP-C15, OP-G17, OP-L12, OP-L13,OP-L16, OP-L20 and OP-Z03).
Figure 19 continue,
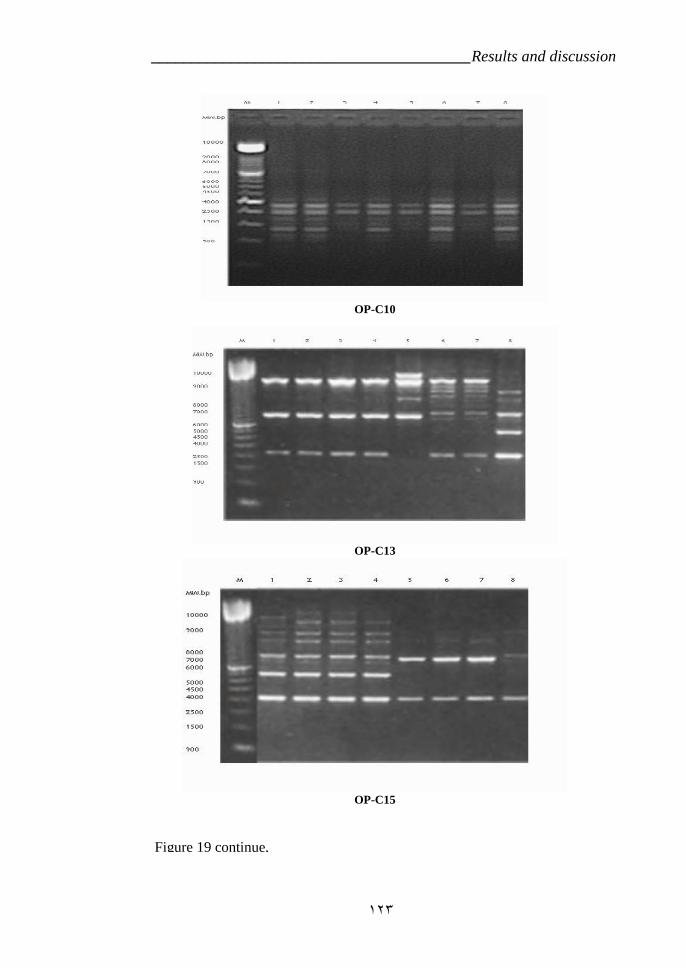
________________________________________Results and discussion
١٢٣
OP-C10
OP-C13
OP-C15
Figure 19 continue,
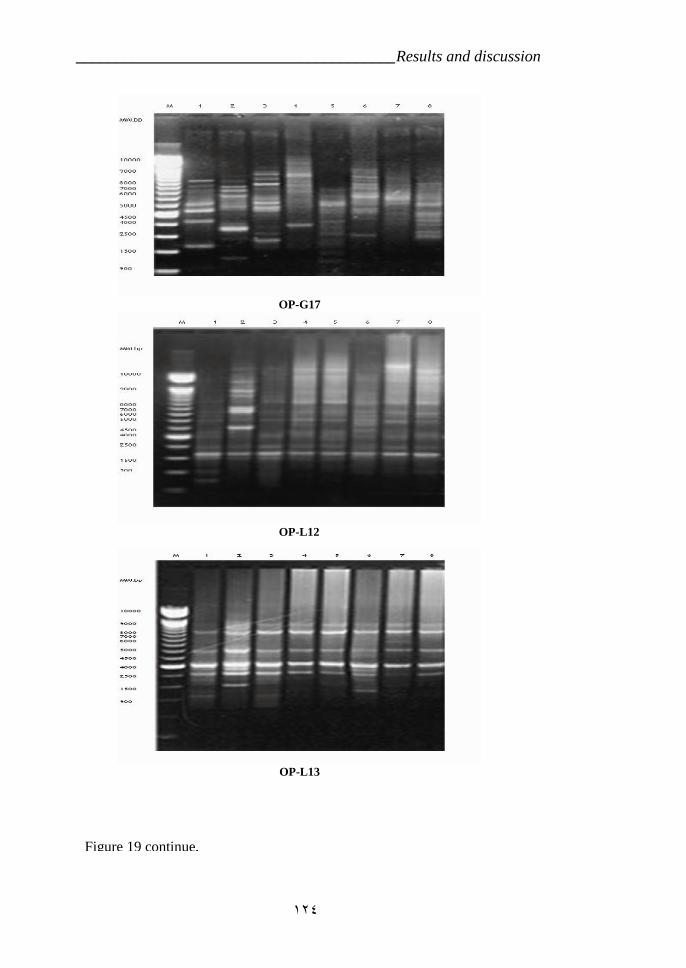
________________________________________Results and discussion
١٢٤
OP-G17
OP-L12
OP-L13
Figure 19 continue,
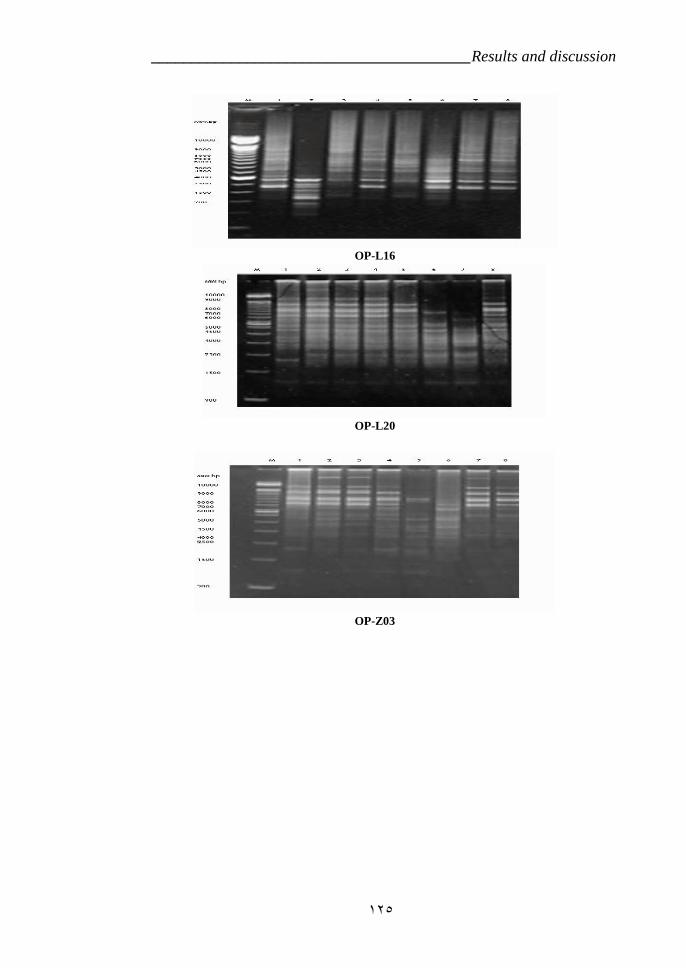
________________________________________Results and discussion
١٢٥
OP-L16
OP-L20
OP-Z03
________________________________________Results and discussion
١٢٦
VI.5.2.1. RAPD markers of the 16 Krad radiation
treatments with 10 RAPD primers
Data of the amplified fragments using the
aforementioned five 10-mer arbitrary primers OP-C09, OP-
C10, OP-C13, OP-C15, OP-G17, OP-L12, OP-L13, OP-L16,
OP-L20 and OP-Z03 for 8 times (con., 0, 2, 4, 8, 16,
48 and 168) which are treated by using gamma radiation on
the dose 16 Krad. controlled with con. Which is none treated
by gamma ray; 0, 2, 4, 6, 8, 10, 12, 14, 16, 48 and 168 hours
indicated successful amplification of PCR products.
Polymorphism levels differed from one primer to the other
.The main results was as following table (27).
Data in Table (27) showed that the tine primers
showed polymorphic differences among the development
time by hours, while some primers exhibited high
polymorphism such as OP-C09 (73 %), OP-C13 (82 %), OP-
L13 (82%), OP-L16 (82%) and OP-Z03 (100 %) on the other
hand, some primers exhibited medium levels of
polymorphism such as OP-C10 (45 %), OP-C15 (63 %), OP-
G17 (64%), OP-L12 (55) and OP-L20 (45%).
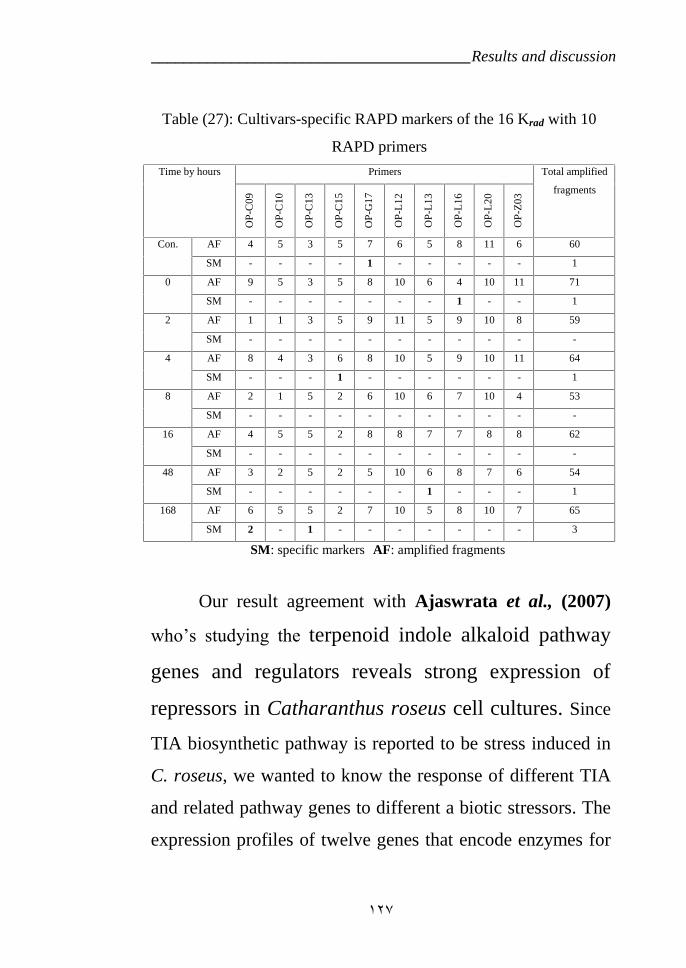
________________________________________Results and discussion
١٢٧
Our result agreement with Ajaswrata et al., (2007)
who’s studying the terpenoid indole alkaloid pathway
genes and regulators reveals strong expression of
repressors in Catharanthus roseus cell cultures. Since
TIA biosynthetic pathway is reported to be stress induced in
C. roseus, we wanted to know the response of different TIA
and related pathway genes to different a biotic stressors. The
expression profiles of twelve genes that encode enzymes for
Table (27): Cultivars-specific RAPD markers of the 16 Krad with 10
RAPD primers
Time by hours Primers Total amplified
fragments
OP-
C09
OP-
C10
OP-
C13
OP-
C15
OP-
G17
OP-
L12
OP-
L13
OP-
L16
OP-
L20
OP-
Z03
Con. AF 4 5 3 5 7 6 5 8 11 6 60
SM - - - - 1 - - - - - 1
0 AF 9 5 3 5 8 10 6 4 10 11 71
SM - - - - - - - 1 - - 1
2 AF 1 1 3 5 9 11 5 9 10 8 59
SM - - - - - - - - - - -
4 AF 8 4 3 6 8 10 5 9 10 11 64
SM - - - 1 - - - - - - 1
8 AF 2 1 5 2 6 10 6 7 10 4 53
SM - - - - - - - - - - -
16 AF 4 5 5 2 8 8 7 7 8 8 62
SM - - - - - - - - - - -
48 AF 3 2 5 2 5 10 6 8 7 6 54
SM - - - - - - 1 - - - 1
168 AF 6 5 5 2 7 10 5 8 10 7 65
SM 2 - 1 - - - - - - - 3
AF: amplified fragmentsSM: specific markers
________________________________________Results and discussion
١٢٨
TIA and related primary (MEP and Shikimate) pathways
were monitored in leaf tissue separately exposed to 4_C,
dehydration, 200 mM NaCl, UV-light and wounding
conditions by semi quantitative RT-PCR analysis and
compared with the untreated control after 6 h treatment.
VI.5.2.2. Genetic similarity and cluster analysis
based on RAPDs markers
The RAPD data were used to estimate the genetic
similarity among 8 time hours which are treated by using
Gamma radiation bush taxa by using Concort softwere
computer analysis was shown in table (28). The highest
similarity index recorded was 0.906, which was observed
between the two taxa 8 hour and 48 hour while the lowest
similarity index recorded was 0.341, which was observed
between 0 hour and 8 hour.
A dendrogram for the genetic relationships among
the 8 different times was carried out as in Fig. (20). The 8
taxa were separated into two clusters; cluster one included 2,
4, 8, 16 and 168 hours while the cluster two included con., 0
and 48 hours.
Within the cluster one, four sub clusters were found;
the first one contained 2 and 8 hours, the second sub clusters
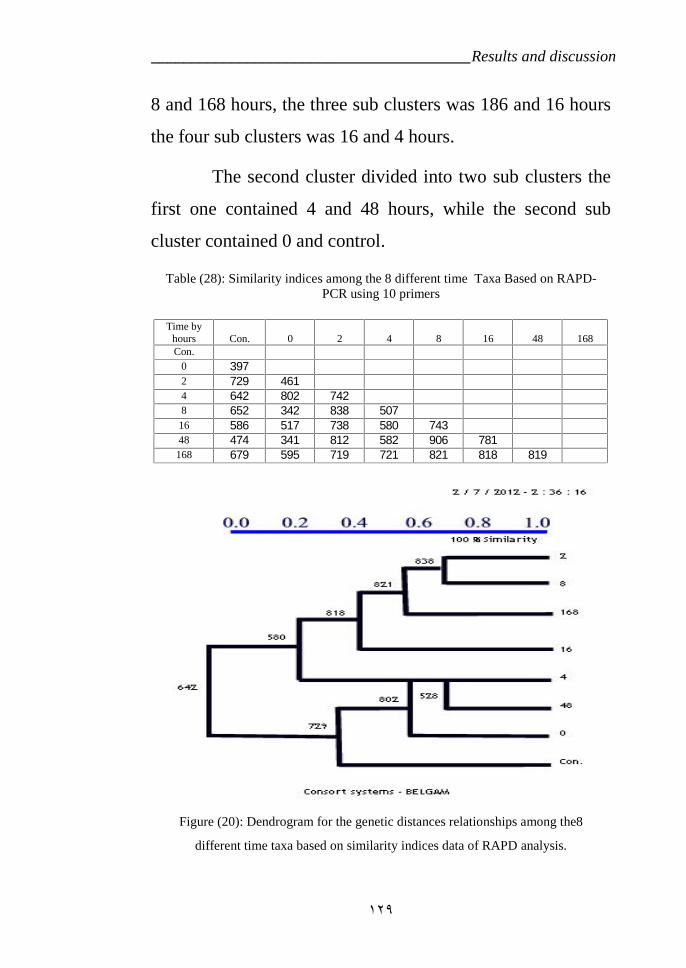
________________________________________Results and discussion
١٢٩
8 and 168 hours, the three sub clusters was 186 and 16 hours
the four sub clusters was 16 and 4 hours.
The second cluster divided into two sub clusters the
first one contained 4 and 48 hours, while the second sub
cluster contained 0 and control.
Table (28): Similarity indices among the 8 different time Taxa Based on RAPD-PCR using 10 primers
Time byhours Con. 0 2 4 8 16 48 168Con.
0 3972 729 4614 642 802 7428 652 342 838 507
16 586 517 738 580 74348 474 341 812 582 906 781168 679 595 719 721 821 818 819
Figure (20): Dendrogram for the genetic distances relationships among the8
different time taxa based on similarity indices data of RAPD analysis.
________________________________________Results and discussion
١٣٠
VI.6. Similarity and unsimilarity between (LM) & (CP3)
Catharanthus roseus Varieties in Genomic under
radiation stress.
The results obtained from RAPD-DNA in two C. roseus
variety (LM) & (CP3) appeared complementary in both it
especially at treatment 16 Krad we are shown in variety (LM)
primers OP-B11 & OP-B12 appeared low specific markers
one fragment only on the other hand variety (CP3) which are
treated by using gamma radiation at 16 Krad after 168 hours
given the same result low specific markers two and one
fragments in primers OP-C09 and OP-C13 respectively.
But all the remaining primers don’t give any specific
fragments in both two variety LM (at 16 Krad) & CP3 (at 168
hours).
There is suggested between both genomes LM & CP3
varieties after radiation treatment especially at 16 Krad. and
complimentary in gene expression to indole alkaloids
production, this are appeared clearly Suffix in HPLC results.
This results agreement with Sarika et al., (2007) that
analyzed a C. roseas by isoenzyme and RAPD markers in
order to assess their genetic relationships. The molecular
marker mapped in this study was of the RAPD types. The
fingerprinting RAPD markers are known to be useful in
increasing the map density in both eu chromatic and hetero
________________________________________Results and discussion
١٣١
chromatic regions. Indeed, 86 (68.8%) of the 125 DNA
markers placed on the C. roseus map are of RAPD kinds. The
sequence specific and EST-SSR markers are known to cover
the euchromatic regions of genome/map. A total of 12 such
markers were placed on the map. Thirty markers have their
origin in RAPD combinations. The combinations apparently
gave markers by promoting new amplifications in regions not
covered by a single RAPD.
RAPD markers are also expected to have covered the
chromatic regions of C. roseus map. This study showed that
combining of RAPD with anther kinds of primers can be a
reliable means to generate new markers.

________________________________________Results and discussion
١٣٢
______________________________________________Summary
١٣٣
Summary:
This work is a cooperation between Agriculture
Botany Department; Faculty of Agriculture, Al-Azhar
University, Nasr city, Cairo, Egypt; and Natural products
department; National center for radiation research and
technology, Atomic Energy Authority, Nasr city, Cairo,
Egypt. During the period (2007 – 2012), to study the gamma
irradiated effects on the Indole alkaloids production, protein
marker, TDC & STR enzymes, and DNA content in
Catharanthus roseus.
The present work was aimed also to obtain the
maximum values of Indole alkaloids content using ionizing
radiation in tow variety (LM & CP3). Quantity & quality of
Indole alkaloids, protein, enzymes TDC & STR and DNA
determinations during expression of Indole alkaloids which
helped to achievement of these objectives.
I- Indole alkaloids determination by HPLC:
a- variety (LM):
Gamma rays effects on Catharanthus roseus (L.) were
genetically engineered to over express the two enzymes
Tryptophandecarboxylase and Strrictosidinesynthase, which
catalyze key steps in the biosynthesis of terpenoid Indole
alkaloids, using gamma radiation effect with the two
______________________________________________Summary
١٣٤
corresponding genes. The percentages of total alkaloids,
Catharanthine, Vindoline, Vallesiachotamine a (a),
Vallesiachotamine b (b) Ajmalicine, Horhammericine (a),
Horhammericine (b), Vindolinine, 19-Epivindolineine,
Strrictosidinelactam, Serpentine and Vinamidine were
recorded as relative to C. roseus intact plant. The highest
values of alkaloids were 6.190, 7.200, 5.940, 5.860, 7.790,
6.000, 6.672, 2.720, 7.000, 7.920, 7.230 and 6.400 μg of
alkaloids respectively above , in radiation treatments 18, 12
& 16, 14, 14, 18, 18, 18, 12, 12, 8, 12 and 16 K rad
respectively compared with other treatments.
b- Variety (CP3):
Gamma irradiation at 16 Krad was effective on
reducing the content of Ajmalicine, as compared with the
control. In all cases, raising the doses of Gamma irradiation
decreased the content of Ajmalicine production from 0 times
to 48 hour this content were 2.1801, 2.0001, 1.8777, 1.4062,
1.2001, 1.0006 and 0.9963 µg / g leaf tissue fluctuated. But
after one week 168 hours, Ajmalicine level production
increasing suddenly 208991 µg / g leaf tissue. ; this results
corresponds rationalize the cell surface receptor(s), Ca2+
influx, medium alkalinization, CDPK, H2O2 and MAPK
play significant roles in Gamma ray signaling leading to
stimulation of Tdc and Str genes and the accumulation of
______________________________________________Summary
١٣٥
catharanthine in C. roseus seedling cultures. Based on these
findings, a model for signal transduction cascade has been
proposed.
II- Enzyme analysis verity (LM)
a- TDC enzyme:
The radiation with Gamma rays effects on TDC. In
taxa with (lanes 0 to 18) showed that one bands, the 20
exhibited bands (4) with lower intensity than the treated
samples, the radiation effects on gene expression. Band 1
presents and very faint in the control untreated but was
contradictory in the intensity and molecular Wight in the
other doses treatments. Therefore, irradiation modified gene
expression in taxa.
In 20 K rad (lanes 1 to 4) showed that, the enzyme de
dig ration while complete in control and all doses, so that
should be considered as a conferring modification of gene
expression by irradiation. That we could be considered as a
positive molecular marker associated with irradiation
treatments.
b- STR or SSS enzyme:
STR or SSS, enzyme activity. In taxa with (lanes 0 to
18) showed that one bands, the 20 exhibited no bands with
lower intensity than the treated samples, the radiation effects
______________________________________________Summary
١٣٦
on gene expression. Bands from control to 10 Krad presents
and very dark but was contradictory in the intensity and
molecular Wight in the other doses treatments. Therefore,
irradiation modified gene expression in taxa. On the other
hand radiation treatments 12, 14, 16, and 18 Krad were feint
or very feint and contradictory in the molecular Wight so that
should be considered as a conferring modification of gene
expression by irradiation. That we could be considered as a
positive molecular marker associated with irradiation
treatments.
III- SDS- protein Page electrophoresis in variety
(LM):
The effect of radiation treatments on the protein
banding were 2 Krad. lanes 2 showed that, band 3, 4, 5 and 6
was absent in control while present in 6 and 8 K rad. doses,
so that should be considered as a conferring modification of
gene expression by irradiation. The pattern of 4 Krad. lanes 3
exhibited five bands, band 7 to 12 were present. Indicating
the effect of 6 K rad. irradiation treatments on modification
of gene expression in C. roseas Bands 3 and 5 were presents
only in the 6 K rad treatment but were absent in control and
4, 12 and 14 Krad. treatments. Therefore, irradiation
treatments effected on modification of gene expression in C.
roseas treated.
______________________________________________Summary
١٣٧
IV-RAPD-PCR analysis showed that:
a- first verity (LM):
All the 5 primers successfully exhibited DNA
fragments with 11 radiation treatments taxa genotypes after
four weeks presented as follows; a total number of 72
fragments were visualized across the taxa. Different levels of
polymorphism were observed from one primer to the other.
Some primers exhibited high levels of polymorphism as:
OB-P01 primer showed that, fragment with 5500 bp
could be used as molecular marker for 6 Krad. Fragment with
4500 bp could be used as molecular marker for 8 K rad.
Fragment with 400 bp. could be used as molecular marker for
14 Krad.
OB-P07 primer showed that, fragment with 10000 bp
could be used as molecular marker for 12 Krad. Fragment
with 250 bp. could be used as molecular marker for 20 Krad.
OB-P11 primer showed that, fragment with 8500 bp
could be used as molecular marker for16 Krad. Fragment with
5000 bp. could be used as molecular marker for 2 Krad.
Fragment with 500 bp. could be used as molecular marker for
10 Krad. Fragment with 300 bp. could be used as molecular
marker for 4 Krad. Fragment with 100 bp. could be used as
molecular marker for 18 Krad.
______________________________________________Summary
١٣٨
OB-P12 primer showed that, fragment with 8500 bp.
could be used as molecular marker for 16 Krad. Fragment
with 4600 bp. could be used as molecular marker for 2 K rad.
Fragment with 400 bp. could be used as molecular marker for
12 Krad.
OP- F06 primer showed that, fragment with 11000 bp.
could be used as molecular marker for 20 Krad. Fragment
with 10000 bp. could be used as molecular marker for 18
Krad.
b- Second verity (CP3):
the result obtained from RAPD PCR analysis with
10 primers were used for the identification of markers
associated with 8 time hours deferens (con, 0, 2, 4, 8, 16, 48
and 168) hours which are radiated at 16 Krad taxa genotypes
after time above presented as follows; a total number of 495
fragments were visualized across the taxa. while some
primers exhibited high polymorphism such as OP-C09 (73
%), OP-C13 (82 %), OP-L13 (82%), OP-L16 (82%) and OP-
Z03 (100 %) on the other hand, some primers exhibited
medium levels of polymorphism such as OP-C10 (45 %),
OP-C15 (63 %), OP-G17 (64%), OP-L12 (55%) and OP-L20
(45%).
Primer OP-C09 this primer showed that a fragment
with 10000, 9000 and 8000 bp. appeared exclusively after
______________________________________________Summary
١٣٩
168 hours So we can concider these fragments as molecular
marker for radiation treatment 16 K rad. after 186 hours.
Primer OP-C13 This primer showed that a fragment with
9000, 5000 bp. after 168 hours and 2500 bp. after 8 hours
appeared exclusively so we can concider these fragments as
molecular marker for radiation treatment 16Krad. After 8 and 186
hours.
Primer OP-C15 This primer showed that a fragment with
7000 bp. appear in 4 time hour. but was absent in all other taxa.
So the fragment could be used as molecular marker for 4 time
hour.
Primer OP-G17 The fragment with 4500 and 900 bp
appeareds exclusively in 4 and 0 time hours flectuated but was
absent in other taxa. So it could be used as molecular marker for
4 and 0 time hours.
Primer OP-L12 The fragments 8000 and 6000 bp. were
observed exclusively in control and 48 time hours flectuated, but
were absent in other taxa. So it could be used as molecular
marker for control and 48 time hours.
Primer OP- L16 this primer showed that a fragment with
900 bp was observed in 0 time hour So it could be used as
molecular marker for control and 0 time hours.
On the other hands Primers OP-C10, OP- L13, OP-L20 and
OP-Z03 didn’t gave any molecular markers with samples above.
_____________________________________________ Reference
141
Reference
Afify, M. R. and Shousha, M. (1988). Effect of low dose
irradiation on soybean protein salubilit, typsin
inhibitor activity and protein patterns separated by
polyacrylamide gel electrophoresis, J. Agric. Food
Chem., 36: 810-813.
Ajaswrata, D.; Digvijay, S.; Sushil, K. and Jayanti, S.
(2007) a. Transcript profiling of terpenoid indole
alkaloid pathway genes and regulators reveals
strong expression of repressors in Catharanthus
roseus cell cultures. Plant Cell Rep. 26:907–915
Ajaswrata, D.; Jayanti, S. and Renu, D. (2007) b.
Downregulation of terpenoid indole alkaloid
biosynthetic pathway by low temperature and
cloning of a AP2 type C-repeat binding factor
(CBF) from Catharanthus roseus (L). G. Don.
Plant Cell Rep. 26:1869–1878.
Annemarie, H. M.; Erik, S.; Robert, V.; and J. Harry, C.
H. (1993) Isolation of cytochrome P-450 cDNA
clones from the higher plant Catharanthus roseus
by a PCR strategy. Plant Molecular Biology 22:
379-383.
Antonella, L.; Stefania, G.; Luigi M. and Teodoro, C.
(2007): Molecular tailoring and boosting of
_____________________________________________ Reference
142
bioactive secondary metabolites in medicinal plants
P. Ranalli (ed.), Improvement of Crop Plants for
Industrial End Uses, 471–507.
Antonio, L. and Alfredo, M. (2008): Survey of Vitamin B6
Content in Commercial Presentations of Table
Olives Plant. Foods Hum Nutr. 63:87–91.
Asada, M. and Shuler, M. (1989): Stimulation of
ajmalicine production and excretion from
Catharanthus roseus: effects of adsorption in situ,
elicitors, and alginate immobilization. Appl.
Microbiol. Biotechnol. 30: 475–481.
Bea, P.; Frederique, A. O. H.; Virginia, S. M.;
Guillaume, C.; Cocky, J. F.; Antony, C.;
Martial, P.; Bertvan, D.; Jan, W.; Kijne, L. F.
and Johan, M. (2004): Zinc Finger Proteins Act as
Transcriptional Repressors of Alkaloid
Biosynthesis Genes in Catharanthus roseus The
journal of biologecal chemistry vol. 279, No. 51,
17, pp. 52940–52948.
Benoit, S.; Felipe, A. V. and Vincenzo, D. (1999)
Multicellular Compartmentation of Catharanthus
roseus Alkaloid Biosynthesis Predicts Intercellular
Translocation of a Pathway Intermediate. The
Plant Cell, Vol. 11, 887–900.
_____________________________________________ Reference
143
Cambecedes, J.; Duron, M., Decourtye, L. and jalouzot,
R. (1992). Methodology of vitro Gamma
irradiation from lonicera species, mutant
description and biochemical characterization. Acts
Hort, 320, 119-126.
Carolyn, W.T. L.; Seda, E. and Jennifer, T. (2004):
Enhancement of ajmalicine production in
Catharanthus roseus cell cultures with methyl
jasmonate is dependent on timing and dosage of
elicitation. Biotechnology Letters 0: 1595–1599.
Collu, G.; Unver, N.; Peltenburg, A.; Heijden, R.;
Verpoorte, R. and Memelink, J. (2001): Geraniol
10-hydroxylase, a cytochrome P450 enzyme
involved in terpenoid indole alkaloid biosynthesis.
FEBS Lett. 508: 215–220.
Elizabeta, H. D.; Freddy, C. and Felipe, V. (2004).
Vindoline synthesis in vitro shoot cultures of
Catharanthus roseus. Biotechnology Letters 26:
671–674.
El-Shebawi, K. (1984). Biochemical changes in protein of
some food stuffs by ionizing radiation. M. Sc.
Thesis, faculty of Agriculture, Cairo University.
Felipe, V.; Vincenzo, D.; Mildred, C.; Adriana, C. and
Maria, M. (2002): Vindoline Biosynthesis Is
_____________________________________________ Reference
144
Transcription ally blocked in Catharanthus roseus
Cell Suspension Cultures Molecular biotechnology
Volume 22.
Felipe, V. and Victor, M. L. (2003): in vitro plant cell
culture as the basis for the development of a
research institute Mexico: Centro de Investigacio N
Cientifica de Yucata N. In Vitro Cell. Dev. Biol.
Plant 39:250–258.
Flaig, W and Schmid, G. (1966). Comparison of the effect
of chemical compounds and low doses of radiation
on plant metabolism. International Atomic Energy,
Vienna, 64:26.
Frank, L. H. M.; JAN, W. K.; and Johan, M. (1996):
Digging for Gene Expression Levels in
Catharanthus roseus Non radioactive Detection of
Plant mRNA Levels Biochemical. No. 2.
Georgieva, I. (1987). Cytochemical investigation of pallem
and pollen tubes after Gamma irradiation. II. Effect
of the irradiation on quinine formation.
Phytomorphology, 37: 203, 159-163.
Giancarlo, P.; Alexandra, S.W. E.; Pieter, B. F. O.;
Frank, L.H. M. and Johan, M. (1999): The
promoter of the strictosidine synthase gene from
periwinkle confers elicitor-inducible expression in
_____________________________________________ Reference
145
transgenic tobacco and binds nuclear factors GT-1
and GBF. Plant Molecular Biology 39: 1299–1310.
Gundlach, H.; Muller, M. J.; Kutchan, T. M. and Zenk,
M. H. (1992): Jasmonic acid is a signal transducer
in elicitor-induced plant cell cultures. Proc. Natl.
Acad. Sci. USA 89: 2389–2393.
Helen, T.; Xinwei C.; Pedro, N.; John, J. G.; Marjorie,
Santa, M. A. C.; Eleanor, G.; Paul, R. J. B. and
Gary, J. L. (2004) Activation tagging in plants: a
tool for gene discovery Funct Integr Genomics 4:
258–266.
Hussein, S. T.; Salah, E. M. A.; Ola, I.M. El-H.; Nahla, S.
A.; Naglaa, M. N.; Mohamed, K. E. and
Medhat, M. S. E. (2008): In vitro studies on
Egyptian Catharanthus roseus (L.) G. Don: III.
Effects of Extra Tryptophan Decarboxylase and
Strictosidine Synthase Genes Copies in Indole
Alkaloid Production. Research Journal of Cell and
Molecular Biology, 2 (2): 18-23.
Ishige, F.; Takaichi, M.; Foster, R.; Chua, N. H. and
Oeda, K. (1999). A G-box motif
(GCCACGTGCC) tetramer confers high-level
constitutiveexpression in dicot and monocot plants.
Plant J 18:443 – 448.
_____________________________________________ Reference
146
Jeong, D. H.; An, S.; Kang, H. G.; Moon, S.; Han, J. J.;
Park, S.; Lee, H. S.; An, K. and An, G. (2002). T-
DNA insertion mutagenesis for activation tagging
in rice. Plant Physiol 130:1636–1644.
Kazuyuki, A.; Yasuko, B. and Haruo, S. (2001): Bovine
Pancreatic Elastase II Cleaves Gln-Ile BondJournal
of Protein Chemistry, Vol. 20, No. 7
Laemmli, U. K. (1970). Cleavage of structural protein
during assembly of head bacteriophage T4. Nature,
227: 680-686
Lee, C. W. T. and Shuler, M. L. (2002): The effect of
ajmalicine spiking and resin addition timing on the
production of indole alkaloids from Catharanthus
roseus cell cultures. Biotechnol. Bioeng. 79: 408–
415.
Leslie, V.; Hui Z.; Frank, L.H. M,; Magdalena, D. and
Johan, M. (2000): A Catharanthus roseus BPF-1
homologue interacts with an elicitor-responsive
region of the secondary metabolite biosynthetic
gene Str and is induced by elicitor via a JA-
independent signal transduction Pathway. Plant
Molecular Biology 44: 675–685, 2000.
_____________________________________________ Reference
147
Lucumi, E.; Luczkiewicz M.; Vera A.; Hallard D.;
Heijden R. and Verpoorte R. (2001): Alkaloid
formation in cell suspension cultures of
Tabernaemontana divaricata after feeding of
tryptamine and loganin Biotechnology Letters 23:
1691–1696.
Maria, K. and Matgorzata, K. (1999): Graft and dodder
transmission of phytoplasma affecting lily to
experimental hosts. physiologiae plantarum Vol.
21. No. 1. 21-26.
Matsuhara, S.; Jingu, F.; Takahashi, T. and Komeda, Y.
(2000). Heat-shock tagging: a simple method for
expression and isolation of plant genome DNA
flanked by T-DNA insertions. Plant J 22:79 – 86.
Meloun, B.; Kluh, I.; Kostka, V.; Moravek, L.; Prusik,
Z.; Vanecek, J.; Keil, B.; and Sorm, F. (1966):
Biochim. Biophys. Acta 130, 543–546.
Mizukami, H.; Tabira, Y. and Ellis, B. E. (1993): Methyl
jasmonate-induced rosmarinic acid biosynthesis in
Lithospermum erythrorhizon cell suspension
cultures. Plant Cell Rep. 12: 706–709.
Mollenschott, W. N. C. and Berlin J. (1984): Tryptophan
decarboxylase from Catharanthus roseus cell
suspension cultures: purification, molecular and
_____________________________________________ Reference
148
kinetic data of the homogenous protein. Plant
Molecular Biology 3:281-288.
Mustafa R. N. and Verpoorte R. (2007): Phenolic
compounds in Catharanthus roseus Natali Rianika
Mustafa Robert VerpoortePhytochem Rev (2007)
6:243–258.
Novake, F. J.; Afza, R., Duren, M. V. and Omar, M. S.
(1990). Mutation induction by Gamma rays in vitro
cultured shoot tips of banana and plantain (Musa
Cvs). Tropical Agriculture, 67: 1-21.
OSCAR, J. M. G.; ED, J. M. P.; PETER, V.; ROB, A. S.;
ROB, V. and J. HARRY, C. H. (1995)
Overexpression of a tryptophan decarboxylase
cDNA in Catharanthus roseus crown gall calluses
results in increased tryptamine levels but not in
increased terpenoid indole alkaloid production
Transgenic Research 4,315-323
Peter, J. F. and Frank, D. (1991) Secondary metabolite
biosynthesis in cultured cells of Catharanthus
roseus (L.) G. Don immobilized by adhesion to
glass fibres Appl Microbiol Biotechnol 35:382-
392.
Saghai, M. A.; Soliman, K. M.; Jorgensen, R. A. and
Allard, R.W. (1984): Ribosomal DNA spacer-
_____________________________________________ Reference
149
length polymorphism in barley: Mendelian
inheritance, chromosomal location, and
populationdynamics. Proc. Natl. Acad. Sci. USA
81, 8014–8018.
Sarika, G.; Sashi, P.; Suchi, S.; Subhas, C. N.; Manoj, P.
and Sushil, K. (2007) Construction of genetic
linkage map of the medicinal and ornamental plant
Catharanthus roseus. Journal of Genetics, Vol. 86,
No. 3.
Schmauder H. P.; GrOger D.; Koblitz H.; and Koblitz D.
(1985): Shikimate pathway activity in shake and
fermenter cultures of Cinchona succirubraPlant
Cell Reports 4: 233- 236.
Serap, W.; Robert, V. and Camilo, C. (1998) Influence of
auxins on alkaloid accumulation by a transgenic
cell line of Catharanthus roseus. Plant Cell, Tissue
and Organ Culture 53: 135–141.
Shilpa, R. and Jayabaskaran, C. (2007): UV-B-induced
signaling events leading to enhanced-production of
catharanthine in Catharanthus roseus cell
suspension cultures. BMC Plant Biology 2007,
7:61
Stegmann, H.; Affify A. M. R. and Hussein K. R. F.
(1985). Cultivar identification of dates (Phoenix
_____________________________________________ Reference
150
dectylifera) by protein patterns. 2nd international
symposium of Biochemical Approaches to
identification of taxa. Braunschweig, West
Germany, 44pp.
Studier, R.; Rajkumar, W.; Dicosmo, Q. and Misawa, S.
(1973). Photoautotrophic cell suspension culture of
periwinkle (Catharanthus roseus) transition from
heterophic to photoautotrophic growth. Plant cell
Rep. 3: 195-198.
Toth, E.; Ghiorghita, G. and Gille, E. (1983). Some
biochemical peculiarities in plants of Digitalis
lanata Ehrh. Modified after successive treatments
with Gamma rays and ehylmethanosulfonate.
review roumaine de Biologie Vegetale, 28: 1, 41-
47.
Weigel, D., Ahn, J. H., Blazquez, M. A., Borevitz, J. O.,Christensen, S. K., Fankhauser, C., Ferrandiz,C., Kardailsky, I., Malancharuvil, E. J., Neff, M.M., Nguyen, J. T., Sato, S., Wang, Z. Y., Xia, Y.,Dixon, R. A., Harrison, M. J. Lamb, C. J.,Yanofsky, M. F. and Chory, J. (2000) Activationtagging in Arabidopsis. Plant Physiol 122:1003–1013.
Williams, J. G. K.; Kublik, A. R.; Livak, K. J., Rafalsky,
J. A. and Tingey, S. V. (1990). DNA
_____________________________________________ Reference
151
polymorphisms amplified by arbitrary primers are
useful as genetic markers. Nucl. Acid.Res.(18):6531-
6535.
www.pubchemsubstance.com
Young, G. M. H. K.; Jae, K. Y.; Young, G. C. and
Myung, S. C. (2003): Light-susceptibility of
Camptothecin Production from In Vitro Cultures of
Camptotheca acuminata Decne Biotechnology and
Bioprocess Engineering 8: 32-36.
Zuo, J; Niu, Q. W.; Frugis, G. and Chua, N. H. (2002).
The WUSCHEL gene promotes vegetative-to-
embryonic transition in Arabidopsis.Plant J 30:349
– 359.
Zuo, Z.; Niu, Q. W. and Chua, N. H. (2000). An estrogen
receptor-based transactivator XVE mediates highly
inducible gene expression in transgenic plants.
Plant J 24:265 – 273.
الملخص العربي_____________________________________________
1
الملخص العربى
–كلیة الزراعة –قسم النبات الزراعيبالتعاون بینأجریت ھذه الدراسة
بمدینة نصر ومعمل بحوث الھندسة الوراثیة بقسم بحوث –الازھرجامعة
بھیئة الطاقة -المنتجات الطبیعیة بالمركز القومي لبحوث وتكنولوجیا الاشعاع
دراسة لوذلك٢٠١٢-٢٠٠٧ن خلال الفترة مالذریة بمدینة نصر بالقاھرة
تأثیر الاشعاع الجامي على أنتاجیة قلویدات الاندول و حزم البروتین و أنزیمات
وكذلك المحتوى من ) التربتوفان دي كاربوكسیلیز و مخلق الاستركتوسیدین(
.المادة الوراثیة في نبات الونكا
ت الاندول والدراسة الحالیة تھدف الي الحصول علي قیم عالیة من قلویدا
وتم أجراء تحالیل كمیة في صنفین من نبات الونكابأستخدام الاشعاع المؤین
التربتوفان دي كاربوكسیلیز و (البروتین وأنزیمي ووكیفیة لقلویدات الاندول
وكذلك المادة الوراثیة وذلك أثناء التعبییر الجیني لانتاج ) مخلق الاستركتوسیدین
.الھدف من الدراسةقلویدات الاندول وذلك لتحقیق
I -تحلیل قلویدات الاندول باستخدام جھازHPLC:
: (LM)الصنف -ا
أظھرت المعاملات الاشعاعیة علي نبات الونكا تغیرات وراثیة وبالتالي
التربتوفان دي كاربوكسیلیز تغیرات علي التعبییر الفائق لانزیمیین ھما
ستركتوسیدین والمعروف اختصارا مخلق الاو (TDC)والمعروف أختصارا
(SSS or STR) وھما الانزیمان الاساسیا ن اللاذمان لحفز خطوات عملیة
التخلیق الحیوي لقلویدات الاندول و بأستعمال الاشعاع الجامي كان ھناك تأثیر
.علي تداخل فعل كلا الجینین المسؤلین عن انتاج كلا من الانزیمین السابقتین
:التي قدرت ھيوكانت القلویدات
الملخص العربي_____________________________________________
2
Catharanthine, Vindoline, Vallesiachotamine a (a),
Vallesiachotamine b (b) Ajmalicine, Horhammericine (a),
Horhammericine (b), Vindolinine, 19-Epivindolineine,
Strrictosidinelactam, Serpentine and Vinamidine
: عالیة ھي علي التوالي ونسبة ھذة القلویدات التي سجلت قیم
و2.720و6.672و6.000و7.790و5.860و5.940و7.200و6.190
وذلك .جرام نسیج ورقة/ میكرو جرام 6.400و7.230و7.920و٧٫٠٠٠
:للجرعات الإشعاعیة
18, 12 & 16, 14, 14, 18, 18, 18, 12, 12, 8, 12, 16 K rad
.وذلك مقارنة بباقي الجرعات الإشعاعیة
:(CP3)الصنف -ب
ملحوظا في اتأثیرKrad 16بجرعةأظھر تأثیر الإشعاع الجامي
فقد لوحظ أن المحتوى من قلوید الاجمالایسن وذلك مقارنة بالكنترول
فيساعة ٤٨المحتوى من القلویدات بدایة من عقب التشعیع مباشرة وحتى
فكانت القیمتدھور في إنتاجیة الاجمالایسین
1.0006و1.2001و1.4062و1.8777و2.0001و2.1801
ساعة أو ١٩٦ولكن بعد مرور .جرام نسیج ورقة/ میكرو جرام 0.9963
میكرو 2,08991لیصبح أسبوع فأن مستوى إنتاج الاجمالایسین قد أرتفع فجأة
)S(تفسیر بأن المستقبلھذه النتائج تتماشى مع ال، . جرام نسیج ورقة/ جرام
على سطح الخلیة و وتدفق أیونات الكالسیوم وقلویة البیئة وفوق أكسید
الكینیز تلعب دور ملموس مع الإشعاع الجامي في تالھیدروجین وبروتینیا
تحفیز كلا من جیني إنزیمي نازع الكربوكسیل ومخلق الاستركتوسیدین كما
الملخص العربي_____________________________________________
3
نسین في بادرات نبات الونكا و اعتمادا یساعد على تراكم وتجمیع مادة الكزارا
. نقل الإشارة بانتظام ھو النموذج المثاليلعلى الدراسات یعتبر مود ی
II- تحلیل الأنزیمات للصنف(LM):
: نازع مجموعة الكربوكسیل من التربتوفانإنزیم-ا
أظھر تحلیل نشاط انزیم التربتوفان دي كاربوكسیلیز والمعروف
٠وذلك بعد المعاملة بالاشعاع الجامي ان المعاملات من (TDC)أختصارا
حزم٤كانت بھا ٢٠احتوت علي بند واحدة بینما المعاملة الاشعاعیة ١٨الي
ذات كثافة خفیفة مقارنة مع باقي المعاملات وكان ھناك تأثیر للا شعاع علي
ولكن یلو راد ك٠التعبییر الجیني متمثلا بوجود بند واحدة خفیفة في المعاملة
كانت علي النقییض من ذلك في الكثافة والوذن الجزیئي في باقي المعاملات
الجیني نتیجة المعاملة بالاشعاع التعبیرفي تحویرولذلك یمكن ملاحظة وجود
كیلو راد اظھرت ان الانزیم ٢٠في الجرعة الاشعاعاعیة حزموالاربع . الجامي
لجرعات الاشعاعیة ولذلك من الممكن مقارنة مع الكونترول وباقي امتحلل
.بالإشعاعمعلمات موجبة للمعاملة حزماعتبار ھذة ال
:إنزیم مخلق الاستركتوسیدین-ب
أظھر تحلیل نشاط انزیم مخلق الاستركتوسیدین والمعروف اختصارا
(SSS or STR)كیلو ) ١٨(وحتي ) ٠(من ان مختلف الجرعات الاشعاعیة
تعطي اى لاكیلو راد ) ٢٠(دة اما الجرعة الاشعاعیة حزمة واحاعطت راد
. مع انخفاض ملحوظ في الكثافة مقارنة بباقي المعاملاتحزم
كیلو راد وحتي ) ٠(من حزماظھر تأثیر الاشعاع على التعبییر الجیني ان ال
كیلو راد كانت موجودة وذو كثافة كبیرة مقارنة مع الكثافة والاوزان ) ١٠(
ومن . الجینيالتعبیریر في الجرعات الاخري ولذلك حدث تحوالجزیئیة في
كیلو راد خفیفة او ١٨، ١٦، ١٤، ١٢جھة اخري كانت المعاملات الاشعاعیة
الملخص العربي_____________________________________________
4
ات المدروسة ولذلك المعطیحزممتناقضا مع الاوزان الجزیئیة لنفس الخفیفة جدا
اع الجامي یر في التعبیر الجیني بواسطة المعاملة بالاشعدلت علي ان ھناك تحو
ھناك تلاذم واضح بین المعلامات الجزیئیة الموجبة ولذلك نستطیع القول بأن
.الإشعاعیةوالمعاملات
III -الصنف تكنیك الالكتروفوریسیس في متحلیل الحزم البروتینیة باستخدا
(LM) .
ظاھرا في علي الحزم البروتینیةالمعاملات الاشعاعیةتأثیركان
K 2الجرعة الاشعاعیة rad. 3فظھرت حزم, 4, 5, بینما كانت ھذة الحزم 6
K 0البروتینیة غائبة فى المعاملة rad. بینما ھذة الحزم كانت موجودة في
,6المعاملات الاشعاعیة 8 K rad. ولذلك من الممكن استعمال تحلیل الحزم
ي التعبیر البروتینیة بأستخدام تكنیك الالكتروفوریسیز للاستدلال علي التغییر ف
K 4في الجرعة الاشعاعیة اما الجینیي rad. الي ٥ھي من حزمظھرت خمس
K 6واستحدثت المعاملة الاشعاعیة ٧ rad. تغییر في التعبییر الجیني في نبات
١٤و ١٢و ٤و٠بینما كانت غائبة في المعاملات ٥و ٣حزمالونكا فظھرت ال
املات الشعاعیة أحدثت تغییر في التعبییر كیلو راد ولذلك یمكن القول بأن المع
.الجیني في نبات الونكا
VΙ- أظھر تحلیل تفاعل البلمرة المتسلسل باستخدام البادئات العشوائیة
: آلاتي
):LM(الصنف الأول -ا
RAPDتقنیة الـ باستخدامأظھر التحلیل – PCR من ٥وعدد
، وقد اختلف مستوى التباین من حزمة ٧٢البادئات العشوائیة تم الحصول على
من التباین وكان ذلك عاليحیث أظھرت بعض البادئات مستوى . لاخر بادئ
: كما یلي
الملخص العربي_____________________________________________
5
جزیئيوتعتبر كشاف .pb 5500حزمةOP-BO1البادئأظھر
جزیئيتعتبر كشاف .pb 4500وأظھر حزمة Krad 6.الإشعاعیةللجرعة
تعتبر .pb 400جزیئيزمة بوزن وكذلك أظھر حKrad 8.الإشعاعیةللجرعة
.Krad 14الإشعاعیةكشاف جزیئي للجرعة
تعتبر كشاف والتي.pb 10000حزمة OP-B07البادئأوضح
من الممكن .pb 250واظھر حزمة Krad 12الإشعاعیةللجرعة جزیئي
.Krad 20الإشعاعیةاعتبارھا كشاف جزیئي للجرعة
والتى تعتبر كشاف جزیئى .pb 8500حزمةOP-B11البادئ أوضح
تعتبر كشاف جزیئي .pb 5000واظھر حزمة.Krad 16للجرعة الاشعاعیة
من الممكن اعتبارھا كشاف جزیئي .pb 500واظھر حزمة.Krad 2للجرعة
والتي من الممكن .pb 300وظھرت حزمة .Krad 10للجرعة الاشعاعیة
.pb 100وظھرت حزمة.Krad 4ة اعبارھا كشاف جزیئي للجرعة الاشعاعی
. .Krad 18من الممكن اعتبارھا كشاف جزیئي للجرعة
والتى تعتبر كشاف .pb 8500حزمة OP-B12البادئ أظھر
وتعتبر كشاف .pb 4600واظھر حزمة . Krad 16جزیئي للجرعة الاشعاعیة
كشاف یمكن اعتبارھا .pb 400كما ظھرت حزمة Krad 2جزیئي للجرعة
.Krad 12جزیئي للجرعة الاشعاعیة
وتعتبر كشاف جزیئى .pb 11000حزمة OP-F06البادئ بین
والتى تعتبر .pb 10000ظھر حزمة أكذلك Krad 20للجرعة الاشعاعیة
.Krad 18كشاف جزیئى للجرعة الاشعاعیة
: )CP3(الصنف الثاني -ب
RAPDأظھرت النتائج المتحصل علیھا من تحلیل – PCR١٠عدد ل
أوقات مختلفة ٨للتعریف كمعلم وذلك لثماني عینات تمثل من البادئات العشوائیة
الملخص العربي_____________________________________________
6
ساعة والتي عوملت بالجرعة ) ١٦٨و ٤٨و ١٦و ٨و ٤و ٢و ٠كنترول و (
كیلو راد وكان المظھر العام للحزم على الجل بعد الأوقات ١٦الإشعاعیة
:السابق ذكرھا ظھرت كما یلي
وكان ، حزمة منظورة ٤٩٥ن المجموع الكلي للحزم المتحصل علیھا كا
%) ٧٣(OP-C09ھناك بعض البادئات التي أعطت تباین عالي مثل
و %) ٨٢(OP-L13و %) ٨٢(OP-C13و
OP-Z3)ومن جھة أخرى نجد أن نعض البادئات أعطت مستوى %) ١٠٠
و %) ٦٣(OP-C15و %) ٤٥(OP-C10:باین مثلمتوسط من الت
OP-G17)٦٤ (% وOP-L12)٥٥ (% وOP-L20)٤٥.(%
و ٩٠٠٠و ١٠٠٠٠وزنھا الجزیئي حزمOP-C09أظھر البادئ
١٦٨كیلو راد بعد ١٦زوج نیوكلیوتیدي فقط مع المعاملة الإشعاعیة ٨٠٠٠
.ھساعة ولذلك یمكن اعتبارھا معلمات جزیئی
زوج ٥٠٠٠و ٩٠٠٠وزنھا الجزیئي حزمOP-C13أظھر البادئ
وكذلك أظھر١٦٨كیلو راد بعد ١٦نیوكلیوتیدي فقط مع المعاملة الإشعاعیة
ساعات ولذلك ٨زوج نیوكلیوتیدي في العینة بعد ٢٥٠٠بوزن حزمة واحدة
.ا الوقتیمكن اعتبار ھذا البادئ معلم جزیئي مع المعاملة الإشعاعیة بعد ھذ
زوج نیوكلیوتیدي ٧٠٠٠بوزن حزمة واحدة OP-C15أظھر البادئ
.ساعات ولذلك یمكن اعتبار ھذه الحزمة معلم جزیئي٤مع العینة المأخوذة بعد
زوج ٩٠٠و ٤٥٠٠وزنھا الجزیئي حزمأعطىOP-G17البادئ
م في ساعة وقد اختفت ھذه الحز٤نیوكلیوتیدي مع المعاملات الوقتیة صفر و
.باقي المعاملات ولذلك تعتبر معلمات جزیئیھ لھذه المعاملات
الملخص العربي_____________________________________________
7
٦٠٠٠و ٨٠٠٠حزم وزنھا الجزیئي أعطىOP-L12البادئ
ساعة بالترتیب ولذلك یمكن ٤٨زوج نیوكلیوتیدي حصریا في الكنترول و
.معلمات جزیئیھ خاصة بھذه المعاملاتحزماعتبار ھذه ال
زوج ٩٠٠مة بوزن جزیئي حزأعطى OP-L16البادئ
ولذلك تعتبر ھذه ) عقب التشعیع مباشرة(نیوكلیوتیدي في المعاملة صفر ساعة
.الحزمة معلم جزیئي لھذه المعاملة
,OP-C10ومن جھة أخرى البادئات OP- L13, OP-L20 and
OP-Z03لم تعطي أي معلمات جزیئیھ ممیزة مع المعاملات الإشعاعیة.
جامعة) - () (٢٠٠١
جامعة ) -(ة ي) (٢٠٠٦
) ()-(
–
هـ١٤٣٤٢٠١٣
عية
جامعة) - () بكال(٢٠٠١
جامعة ) ل-() (٢٠٠٦
) ()-(
–
هـ١٤٣٤٢٠١٣
:. / ...................................
.جامعة -ب. / ....................................
-.
جامعة) - () (٢٠٠١
جامعة ) -() (٢٠٠٦
) ()-(
جامعة –
هـ١٤٣٤٢٠١٣
:./..............................
-../.............................
-.. /..............................
-../...............................
-.
:٢٠١٣/ ٢٣/١