Embed Size (px)
Citation preview
Molecular approaches to the conservation and managementof Bengal tiger in Nepal
Author
Karmacharya, Dibesh
Published
2017-08
Thesis Type
Thesis (PhD Doctorate)
School
Griffith School of Environment
DOI
https://doi.org/10.25904/1912/2714
Copyright Statement
The author owns the copyright in this thesis, unless stated otherwise.
Downloaded from
http://hdl.handle.net/10072/374750
Griffith Research Online
https://research-repository.griffith.edu.au

Molecular approaches to the conservation and management of Bengal tiger in Nepal
A Dissertation Submitted to School of Environment
Griffith University
In Partial Fulfillment of the Requirements for the Degree of Doctor of
Philosophy
August 2017
© 2016 Dibesh Karmacharya
Supervisors
Dr. Jean Marc Hero
Dr. Jane Hughes
Author: Dibesh Karmacharya
ID: 2909328
SUMMARY
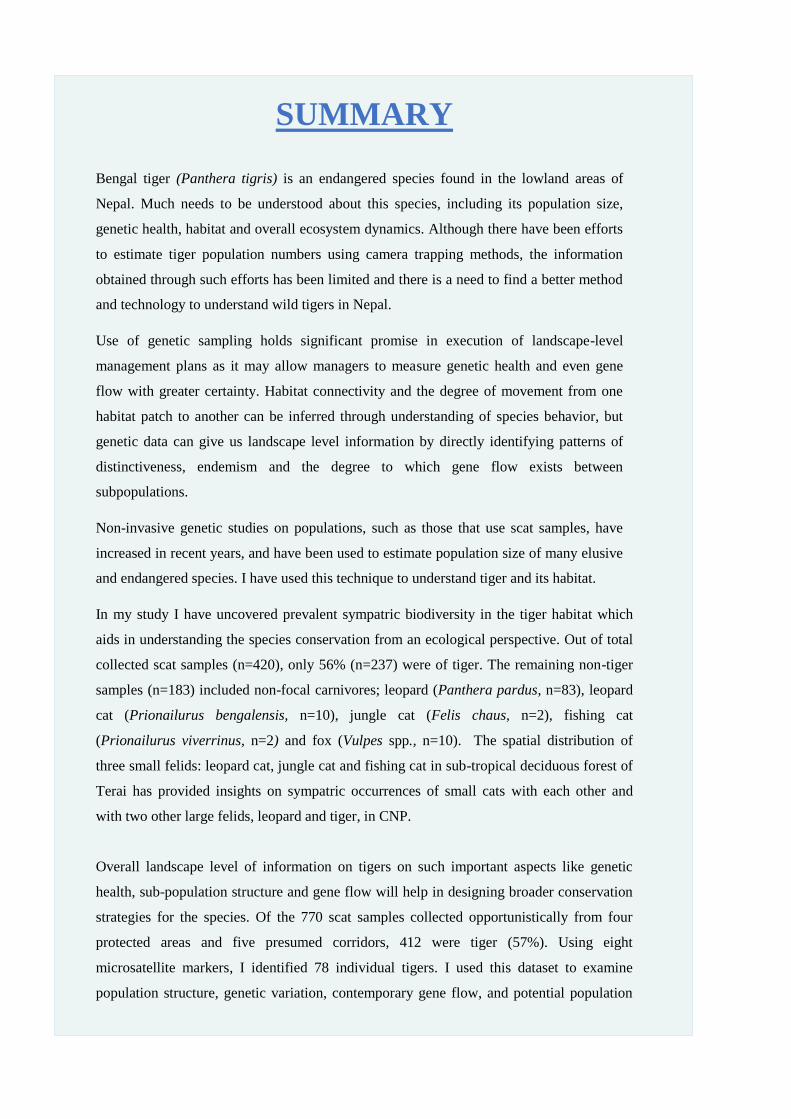
Bengal tiger (Panthera tigris) is an endangered species found in the lowland areas of
Nepal. Much needs to be understood about this species, including its population size,
genetic health, habitat and overall ecosystem dynamics. Although there have been efforts
to estimate tiger population numbers using camera trapping methods, the information
obtained through such efforts has been limited and there is a need to find a better method
and technology to understand wild tigers in Nepal.
Use of genetic sampling holds significant promise in execution of landscape-level
management plans as it may allow managers to measure genetic health and even gene
flow with greater certainty. Habitat connectivity and the degree of movement from one
habitat patch to another can be inferred through understanding of species behavior, but
genetic data can give us landscape level information by directly identifying patterns of
distinctiveness, endemism and the degree to which gene flow exists between
subpopulations.
Non-invasive genetic studies on populations, such as those that use scat samples, have
increased in recent years, and have been used to estimate population size of many elusive
and endangered species. I have used this technique to understand tiger and its habitat.
In my study I have uncovered prevalent sympatric biodiversity in the tiger habitat which
aids in understanding the species conservation from an ecological perspective. Out of total
collected scat samples (n=420), only 56% (n=237) were of tiger. The remaining non-tiger
samples (n=183) included non-focal carnivores; leopard (Panthera pardus, n=83), leopard
cat (Prionailurus bengalensis, n=10), jungle cat (Felis chaus, n=2), fishing cat
(Prionailurus viverrinus, n=2) and fox (Vulpes spp., n=10). The spatial distribution of
three small felids: leopard cat, jungle cat and fishing cat in sub-tropical deciduous forest of
Terai has provided insights on sympatric occurrences of small cats with each other and
with two other large felids, leopard and tiger, in CNP.
Overall landscape level of information on tigers on such important aspects like genetic
health, sub-population structure and gene flow will help in designing broader conservation
strategies for the species. Of the 770 scat samples collected opportunistically from four
protected areas and five presumed corridors, 412 were tiger (57%). Using eight
microsatellite markers, I identified 78 individual tigers. I used this dataset to examine
population structure, genetic variation, contemporary gene flow, and potential population
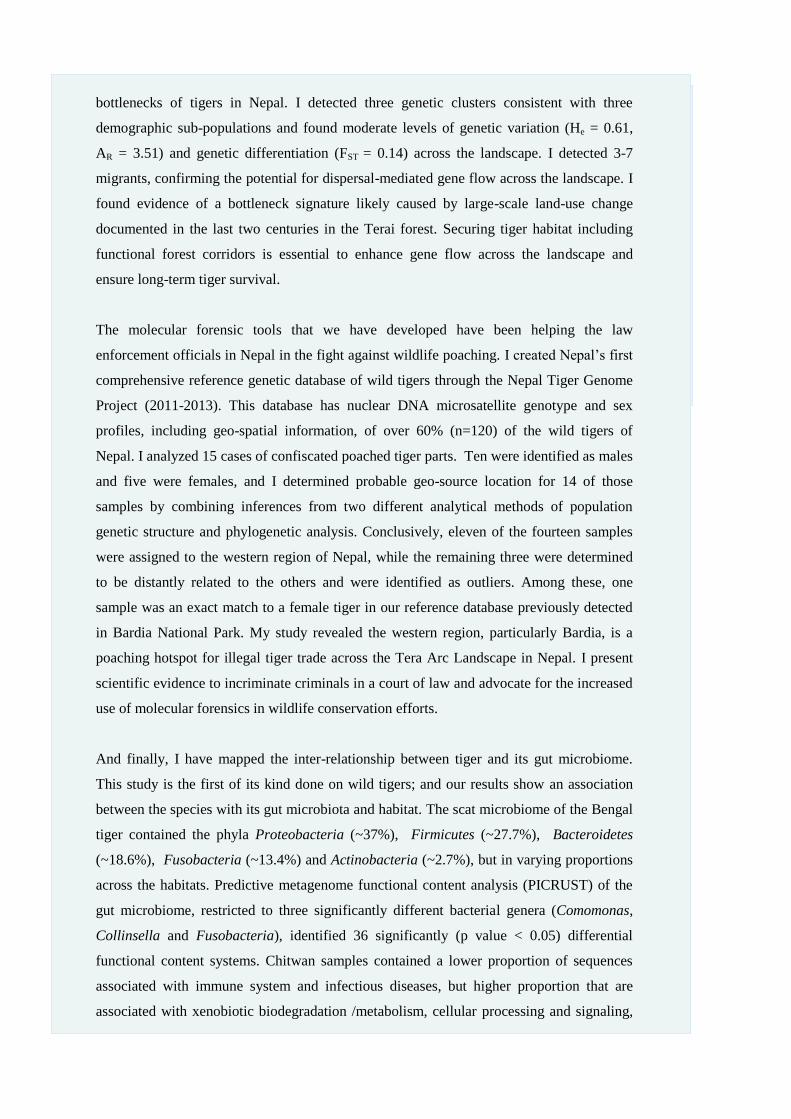
bottlenecks of tigers in Nepal. I detected three genetic clusters consistent with three
demographic sub-populations and found moderate levels of genetic variation (He = 0.61,
AR = 3.51) and genetic differentiation (FST = 0.14) across the landscape. I detected 3-7
migrants, confirming the potential for dispersal-mediated gene flow across the landscape. I
found evidence of a bottleneck signature likely caused by large-scale land-use change
documented in the last two centuries in the Terai forest. Securing tiger habitat including
functional forest corridors is essential to enhance gene flow across the landscape and
ensure long-term tiger survival.
The molecular forensic tools that we have developed have been helping the law
enforcement officials in Nepal in the fight against wildlife poaching. I created Nepal‘s first
comprehensive reference genetic database of wild tigers through the Nepal Tiger Genome
Project (2011-2013). This database has nuclear DNA microsatellite genotype and sex
profiles, including geo-spatial information, of over 60% (n=120) of the wild tigers of
Nepal. I analyzed 15 cases of confiscated poached tiger parts. Ten were identified as males
and five were females, and I determined probable geo-source location for 14 of those
samples by combining inferences from two different analytical methods of population
genetic structure and phylogenetic analysis. Conclusively, eleven of the fourteen samples
were assigned to the western region of Nepal, while the remaining three were determined
to be distantly related to the others and were identified as outliers. Among these, one
sample was an exact match to a female tiger in our reference database previously detected
in Bardia National Park. My study revealed the western region, particularly Bardia, is a
poaching hotspot for illegal tiger trade across the Tera Arc Landscape in Nepal. I present
scientific evidence to incriminate criminals in a court of law and advocate for the increased
use of molecular forensics in wildlife conservation efforts.
And finally, I have mapped the inter-relationship between tiger and its gut microbiome.
This study is the first of its kind done on wild tigers; and our results show an association
between the species with its gut microbiota and habitat. The scat microbiome of the Bengal
tiger contained the phyla Proteobacteria (~37%), Firmicutes (~27.7%), Bacteroidetes
(~18.6%), Fusobacteria (~13.4%) and Actinobacteria (~2.7%), but in varying proportions
across the habitats. Predictive metagenome functional content analysis (PICRUST) of the
gut microbiome, restricted to three significantly different bacterial genera (Comomonas,
Collinsella and Fusobacteria), identified 36 significantly (p value < 0.05) differential
functional content systems. Chitwan samples contained a lower proportion of sequences
associated with immune system and infectious diseases, but higher proportion that are
associated with xenobiotic biodegradation /metabolism, cellular processing and signaling,

and neurodegenerative diseases compared to the other two. These findings underscore the
importance of a conservation design that specifically seeks to maximize genetic and gut
microbial diversity amongst wild tigers in Nepal.
My Study, through the Nepal Tiger Genome Project, has looked into a range of molecular
approaches to comprehend the tiger population from conservation genetics perspective and
uncovered wealth of information which is now being utilized to formulate effective
conservation strategies. Most of this work was done for the first time in Nepal; and some
work, especially molecular forensics and gut microbiome study, were done for the first
time. My utility based study has also been able to create necessary capacity to do similar
work in other species in developing countries like Nepal, and beyond this I am looking at
creating viral and dietary profiles on some of these tiger fecal samples as part of my
commitment to understand this species further

ACKNOWLEDGEMENTS
To my Professors Jean Marc Hero and Jane Hughes for encouraging and guiding me while
I designed and carried out my research; and a special thank you to Professor Hero for
encouraging me to pursue my PhD.
The whole study would not have been possible if it were not for the funding support from
USAID to initiate Nepal Tiger Genome Project. Special thanks to USAID/Nepal mission
director, Dr. Kevin Rushing, for believing in my tiger project and helping us with the
funding. I would like to thank all the team members who worked extremely hard in making
the project a grand success. I was privileged to lead the project as the Principal
Investigator.
A special thank you also goes to the Department of National Parks and Wildlife
Conservation and the Ministry of Forests and Soil Conservation of the Government of
Nepal for providing us with all the needed guidance and permits.
Dr. Momchilo Vuyisich of the Los Alamos Laboratory has been one of my key
collaborators who made tiger gut microbiome study possible. I am very thankful to him and
his team for providing me with the valuable support. Also a big thank you to Dr. Lisette
Waits of the University of Idaho for providing me with continued technical support on
conservation genetics.
CMDN Bioinformatics and Computational Biology team worked really hard to analyze my
metagenomics data and helped build the necessary computational pipeline. Thank you for
this wonderful team. And a big thank you to all the members of CMDN and INPL team for
helping me generate all these wonderful and important data.
And finally a wonderful appreciation to my parents and Ms. Manisha Bista for encouraging
and pushing me to get my PhD. Their constant reminder and pushing made me realize the
importance of getting this degree. A warm thank you to them

Statement of Originality
This work has not previously been submitted for a degree or diploma in any university. To
the best of my knowledge and belief, the thesis contains no material previously published
or written by another person except where due reference is made in the thesis itself.
(Signed)
Name of Student DIBESH BIKRAM KARMACHARYA
CHAPTER CONTRIBUTIONS
This work has been entirely designed, implemented and analyzed by the Center for
Molecular Dynamics Nepal (CMDN) under my leadership. Some parts of the work have
been done in collaboration with various experts. Entire work has been a part of Nepal
Tiger Genome Project which was funded by USAID (www.ntgp.org.np). I am the
principal investigator of the project and I was responsible for designing and securing the
funding. I also acted as a supervisor and lead the entire field and lab team, and fostered
collaborative relationships with the government as well as non-government agencies.
Please see table below for my contribution to conduct this research.
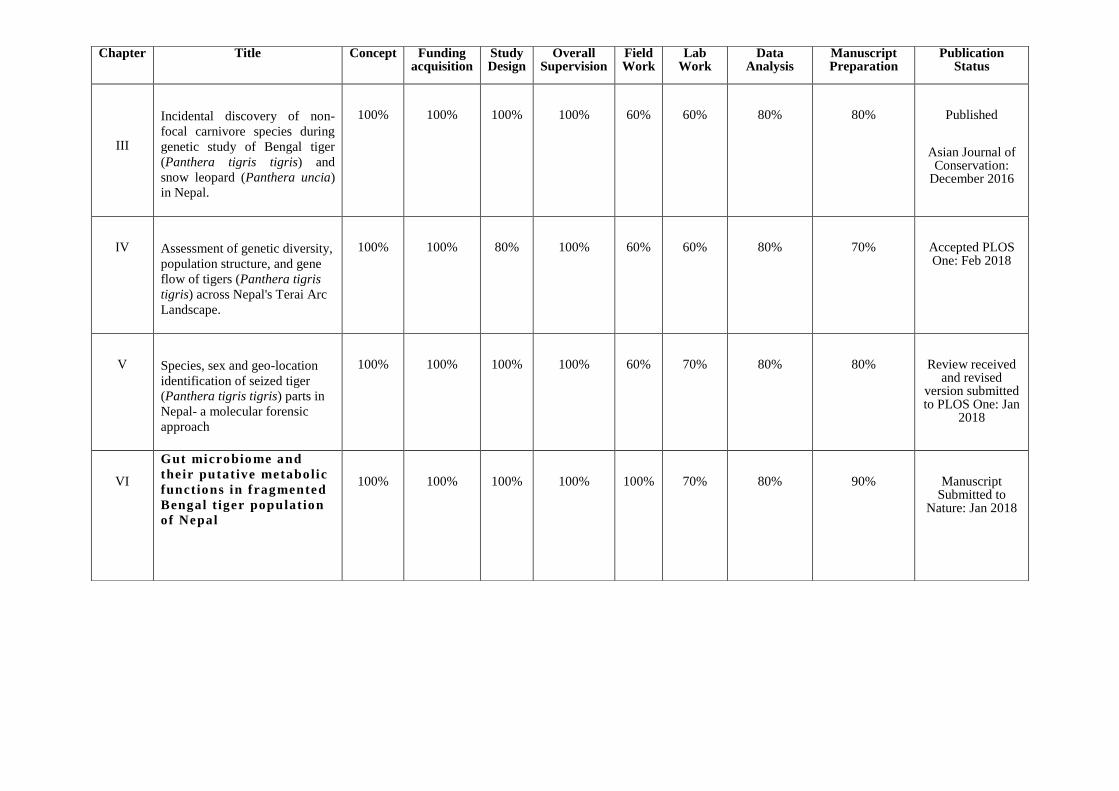
Chapter Title Concept Funding acquisition
Study Design
Overall Supervision
Field Work
Lab Work
Data Analysis
Manuscript Preparation
Publication Status
III
Incidental discovery of non-
focal carnivore species during
genetic study of Bengal tiger
(Panthera tigris tigris) and
snow leopard (Panthera uncia)
in Nepal.
100% 100% 100% 100% 60% 60% 80% 80% Published
Asian Journal of Conservation:
December 2016
IV Assessment of genetic diversity,
population structure, and gene
flow of tigers (Panthera tigris
tigris) across Nepal's Terai Arc
Landscape.
100% 100% 80% 100% 60% 60% 80% 70% Accepted PLOS One: Feb 2018
V Species, sex and geo-location
identification of seized tiger
(Panthera tigris tigris) parts in
Nepal- a molecular forensic
approach
100% 100% 100% 100% 60% 70% 80% 80% Review received and revised
version submitted to PLOS One: Jan
2018
VI
Gut microbio me and
their putative metabolic
functions in fragmented
Bengal t iger population
of Nepal
100% 100% 100% 100% 100% 70% 80% 90% Manuscript Submitted to
Nature: Jan 2018
Contents
SUMMARY
ACKNOWLEDGEMENTS
Statement of Originality
CHAPTER 1
1. INTRODUCTION
CHAPTER II
2. METHODOLOGY & STUDY DESIGN
3. CHAPTER III
Incidental discovery of nonfocal carnivore species during genetic study of Bengal tiger
(Panthera tigris tigris) and snow leopard (Panthera uncia) in Nepal
4. CHAPTER IV
Assessment of Genetic Diversity, Genetic Structure, and Gene Flow of tigers (Panthera tigris
tigris) in the Terai Arc Landscape of Nepal
5. CHAPTER V
A molecular forensic approach for species, sex and geosource location identification of
seized tiger (Panthera tigris tigris) parts in Nepal
6. CHAPTER VI
Gut microbio me and t heir putative metabol ic functions in fragmented B engal
t iger populat ion of Nepal
7. Chapter VII
Conclusion and Future Direction
CHAPTER I
INTRODUCTION
Bengal tiger (Panthera tigris) is an endangered species found in the lowland areas of Nepal. Much needs to be
understood about this species, including its population size, genetic health, habitat and overall ecosystem dynamics.
Although there have been efforts to estimate tiger population numbers using camera trapping methods, the
information obtained through such efforts has been limited and there is a need to find a better method and technology
to understand wild tigers in Nepal.
1.1 Landscape level tiger population management and conservation
There is growing emphasis on management of tigers at a landscape level in order to facilitate long-term tiger recovery
(Sanderson et. al. 2006), a practice currently seen in the Terai Arc Landscape (TAL) in India and lowland Nepal.
With one of the highest densities of wild tigers on earth, this region has become a global priority for conservation of
wild tigers (Barlow et al. 2009, Sanderson et al. 2006).
The TAL is a tiger inhabited landscape on the southern slope of the Himalayas, with highly productive alluvial
grasslands and riverine forests capable of supporting some of the highest tiger densities across the range. In this
human-dominated landscape, the Government of Nepal and partners have set an ambitious goal of sustaining 550
tigers. Demographically, core tiger populations are currently limited to three sub-populations in four protected areas
across the landscape: Chitwan population (Parsa Wildlife Reserve & Chitwan National Park), Bardia population
(Bardia National Park) and Suklaphanta population (Suklaphanta Wildlife Reserve) with an estimated total of 125
adult tigers across these areas (DNPWC 2010).
1.2 Understanding biodiversity, species presence/absence and distribution-holistic
approach to conservation
Amid concerns over the loss of biodiversity, experts have been increasingly seeking clues to understand ecosystems
and biodiversity (Cardinale et. al, 2012). The prevailing conservation and management practices, globally, include
coarse-filter and fine-filter approaches (Noss et. al., 1987).The former aims to preserve entire communities of plants
and animals by protecting large areas of habitat (ecosystem approach) whilst the latter focuses to protect species
(species approach).
Current burgeoning conservation needs and limited availability of resources often forces conservation managers and
planners to rely on information on the occurrence of apex species such as tiger in the TAL (Forrest et. al., 2012) to
serve as ecosystem health indicators (Simberloff et. al, 1998).
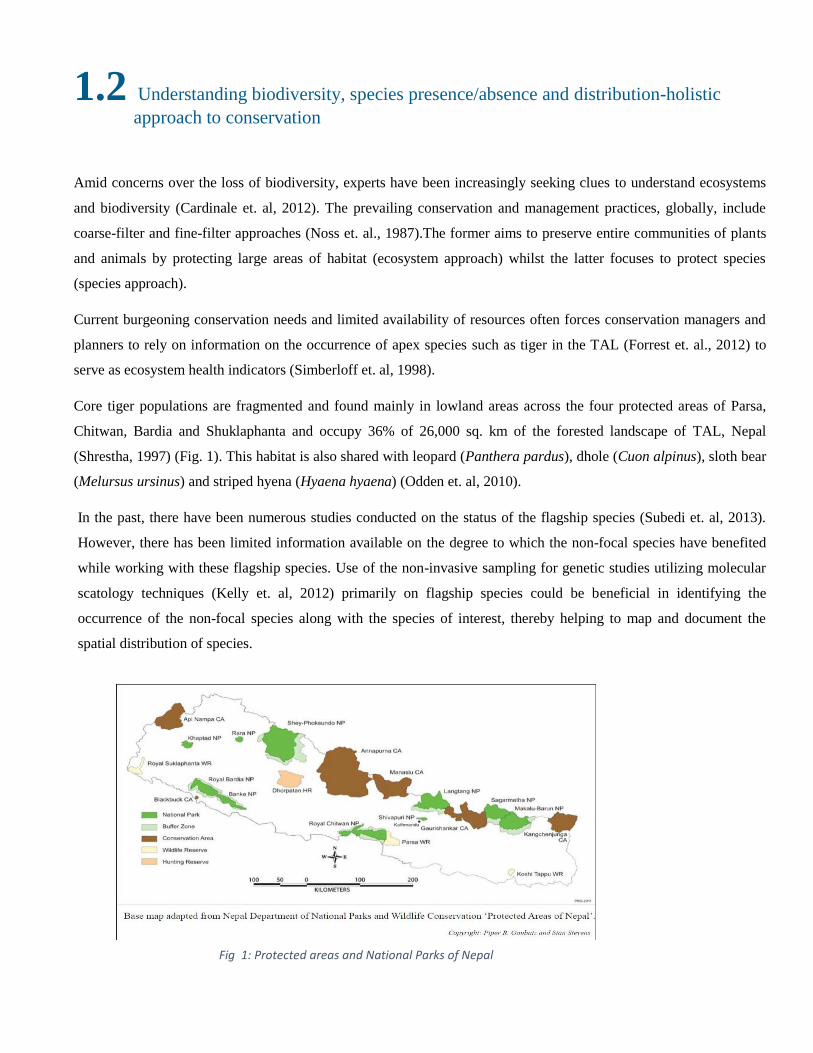
Core tiger populations are fragmented and found mainly in lowland areas across the four protected areas of Parsa,
Chitwan, Bardia and Shuklaphanta and occupy 36% of 26,000 sq. km of the forested landscape of TAL, Nepal
(Shrestha, 1997) (Fig. 1). This habitat is also shared with leopard (Panthera pardus), dhole (Cuon alpinus), sloth bear
(Melursus ursinus) and striped hyena (Hyaena hyaena) (Odden et. al, 2010).
In the past, there have been numerous studies conducted on the status of the flagship species (Subedi et. al, 2013).
However, there has been limited information available on the degree to which the non-focal species have benefited
while working with these flagship species. Use of the non-invasive sampling for genetic studies utilizing molecular
scatology techniques (Kelly et. al, 2012) primarily on flagship species could be beneficial in identifying the
occurrence of the non-focal species along with the species of interest, thereby helping to map and document the
spatial distribution of species.
Fig 1: Protected areas and National Parks of Nepal
1.3 Gene flow, genetic diversity and genetic structure of tiger conservation implications
Low genetic diversity and reduction in habitat area are potential influential factors leading to the extirpation of
populations and extinction of species (Lacy et. al. 1997). In the face of habitat fragmentation and isolation,
maintaining the optimum level of genetic connectivity among fragmented patches is a challenging task (Mills et. al,
1998).Yet gene flow among isolated populations is necessary to avert the negative consequences of genetic drift
and/or inbreeding and plays an important role in persistence of natural populations. Gene flow is particularly critical
for carnivores that often occur at naturally low densities thus increasing their risk of extinction due to a greater
susceptibility to stochastic events (Caughley et. al., 1994; Frankham et. al., 2002).
A recent study has shown that tigers occupy 36% of the TAL (Nepal) clustered within the protected areas (Barber-
Meyer et. al., 2013). Few tiger signs have been detected outside of protected areas (Wikramanayake et. al., 2010),
although telemetry studies have shown that tigers in the TAL have dispersed as far as 30 km (Smith et. al., 1993),
including through human dominated areas within the landscape (Sharma et. al, 2009). Camera trap data have also
confirmed the presence of tigers in the corridors (Wikramanayake et. al., 2010).Thus, a landscape level genetic
approach to conservation is needed to assess whether dispersal and subsequent breeding (genetic migration) of tiger
occurs across the fragmented habitat. Existing methods (e.g. camera trapping and telemetric studies) require long-
term data sets to study the dispersal events (Patil et. al., 2011) and are somewhat ineffective for determining numbers
of genetic migrants. Noninvasive genetic techniques, therefore, are useful tools to study landscape connectivity and
dispersal across the TAL (Joshi et. al., 2013).
1.4 DNA molecular forensics- tool for tiger anti-poaching and fight against wildlife
crime
Applications of DNA profiling in wildlife forensics remain rare, although they have been used successfully in
investigations in Canada with mule deer, white-tailed deer, moose, caribou and black bear (Ogden et al. 2009) and in
Italy in one particular poaching case of a wild boar (Lorenzini 2005) and six Italian wolves (Caniglia et al. (2009).
Use of this method in tiger conservation has also been rare, although one study demonstrated feasibility in a tiger
bone smuggling case in China (Xu et al. 2005) and in the illegal sale of tiger meat from a circus tiger (Wan and Fang
2003). Genetic tools can also provide opportunities to discern geographic origin of confiscated wildlife parts and their
derivatives (Ogden et al. 2009, Palsboll et al. 2006), information which can inform management of areas that require
greater investments in anti-poaching.
The Nepal government‘s plan also emphasizes the need for a new approach to prevent poaching and illegal trade in
tiger parts. The Nepal government has asserted that the volume of seized tiger parts is high, with Nepal acting as both
a source and as a conduit for trafficking into China/Tibet and other areas (Bajimaya et al. 2007). Current high levels
of poaching activity severely undermine protection efforts. Moreover, anti-poaching operations are highly localized
and in need of landscape-level coordination. The government of Nepal has proposed establishing a system to better
track records of poaching incidences and confiscation and enforcement of CITES by increasing capacity for
identifying animal parts and their derivatives, by using effective and modern forensic procedures. In reviewing
success of investments in tiger conservation, best practices in anti-poaching projects have been those incorporating
scientifically sound wildlife monitoring; and projects that have been unsuccessful had failed to effectively
disseminate data to management and other conservation institutions (Gratwicke et al. 2007). There is a significant
need for studies on tigers; and projects related to tiger conservation need to make reliable information readily
available to decision-makers and other stakeholders. Without accurate information on populations it is impossible to
determine if the large investments currently being made have been effective.
1.5 Profiling gut microbiome of tiger- its implication on wildlife disease dynamics and
comparative genomics
Recent studies have clearly demonstrated the enormous pathogen diversity that exists among wild animals. This
exemplifies the required expansion of our knowledge of the pathogen and gut microbiome diversity present in
wildlife (Bodewes et al. 2014). There is very limited information on prevalent diseases in wild tigers, although it is
widely believed that viral infections such as Rabies and Canine Distemper are commonly seen in captive populations.
Often, disease study is almost impossible in the wild due to difficulty in accessing samples. My study uses DNA
extracted from scat to perform metagenomic analysis using next generation DNA sequencing technology to profile
prevalent pathogens (bacteria) in the identified tigers, thereby producing a tiger gut microbiome profile for the first
time. This should provide some valuable information on pathogens present in the wild tiger population, and also by
conducting phylogenetic analysis between host (tiger) and pathogen (present bacteria), my research might be able to
create comparative gene flow information, thereby providing a new tool to estimate recent host sub-population
interactions utilizing molecular epidemiology approach. Currently, no such method is available.
1.6 Available tools for tiger research
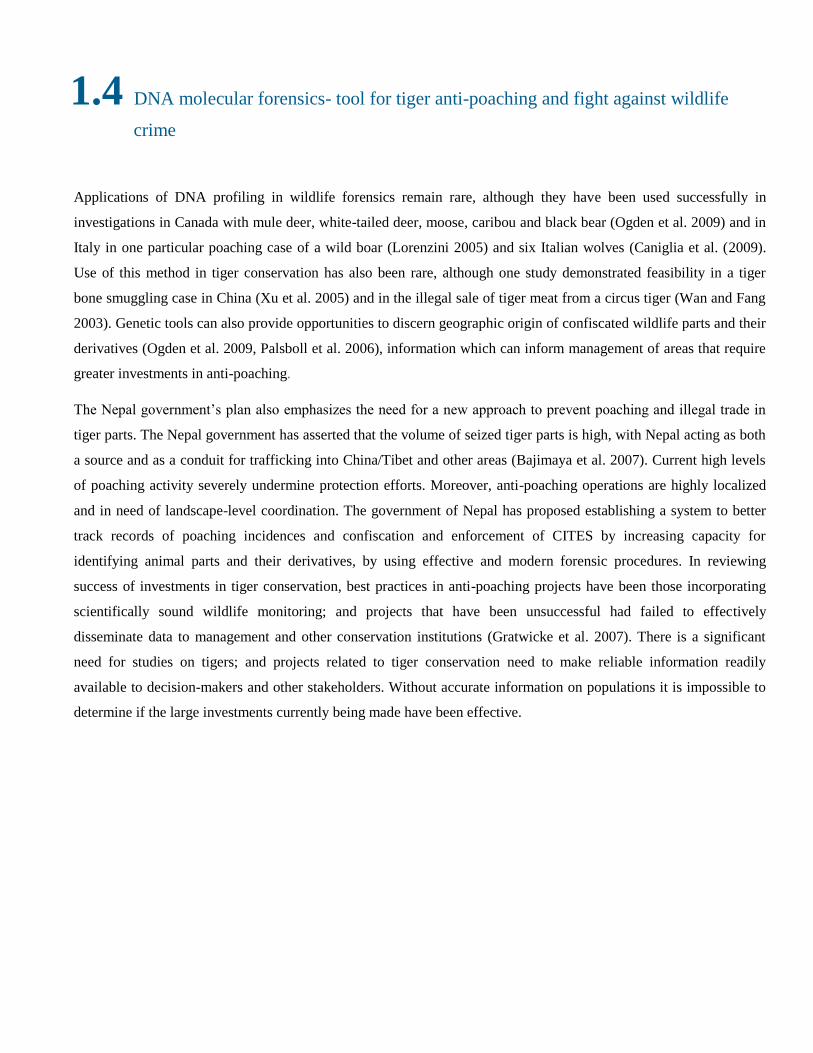
1.6.1 Conventional methods of collecting data- Pugmark analysis
For tigers, use of pugmarks as a technique to
identify individuals and generate population estimates
has long been used by the Indian government; however,
the method‘s high susceptibility to errors generates
limited confidence in results (Karanth et al. 2003,
Narain et al. 2005). This technique relies on
measurement of paw prints of animals, with the
presumption that each paw print profile is unique to an
individual animal. However, environmental exposure
(ground texture, moisture etc) greatly influences the
paw imprints and hence there is a wide error rate on
identifying pugmark impressions.
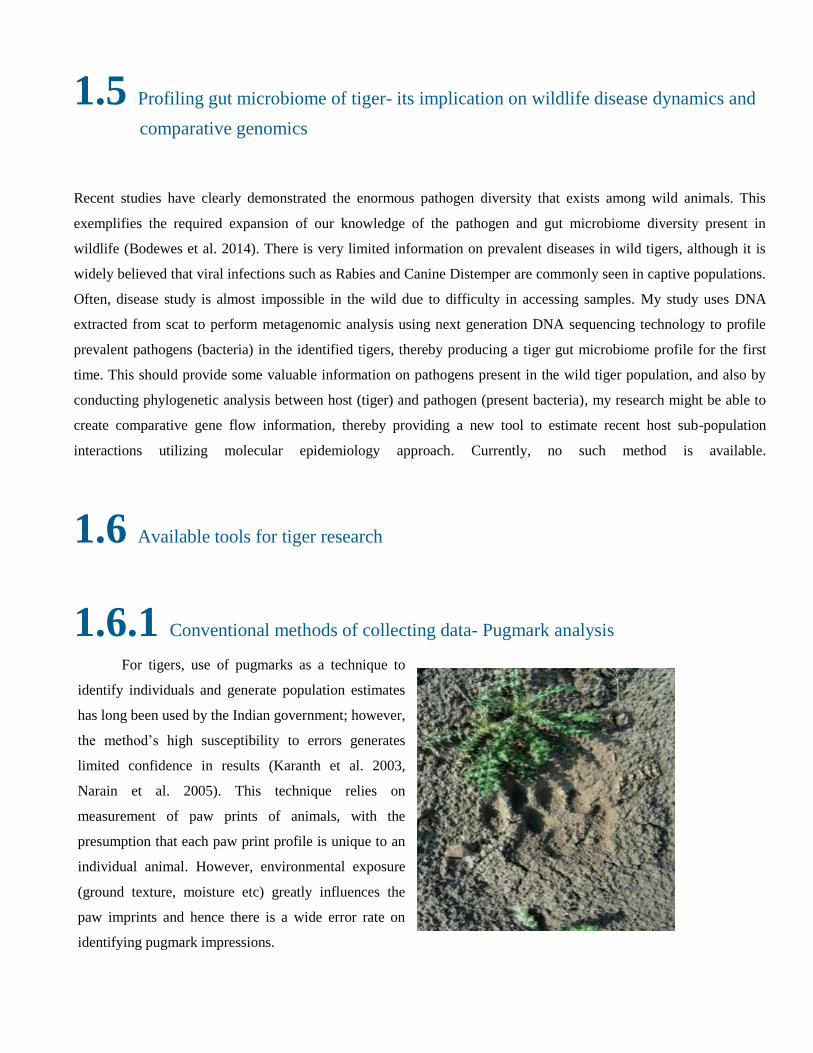
1.6.2 Camera trapping
A recent alternative has been to use remote cameras to
photograph (camera trapping) animals under the assumption
that individuals can be identified based on certain physical
characteristics such as stripes or other markings. Rates of
appearance (detection histories) of individuals over a
survey period can be combined with capture-mark-
recapture (CMR) methods to generate robust estimates of
population size. CMR methods and analyses have a long
history and thorough vetting in wildlife management, but
only recently have newer data collection techniques such as
camera trapping been combined with well-established CMR
population estimation to obtain better, more defensible and robust estimates of population size (Karanth et
al. 2006, Mondol et al. 2009). There are however, a number of potential disadvantages of using camera
traps, including poor performance in areas of difficult terrain or adverse weather, susceptibility to theft or
vandalism, low detection and demanding field logistical support and possible violation of population
closure assumptions in mark-recapture (Mondol et al. 2006, Harihar et al. 2009). Moreover, due to
limitations of its use in areas of low population density, it may not be feasible in marginal habitats, reducing
the extent to which it can be applied in studying landscape-level population dynamics (Bhagavatula and
Singh 2006). The use of camera traps is also inherently restricted to animals that can be identified down to
the individual, due to their distinctly different coat patterns with a high degree of confidence through
photographs. Finally, threat of vandalism, potentially makes it infeasible to use camera traps in areas
outside of protected areas, such as in corridors surrounded by villages with high human use.
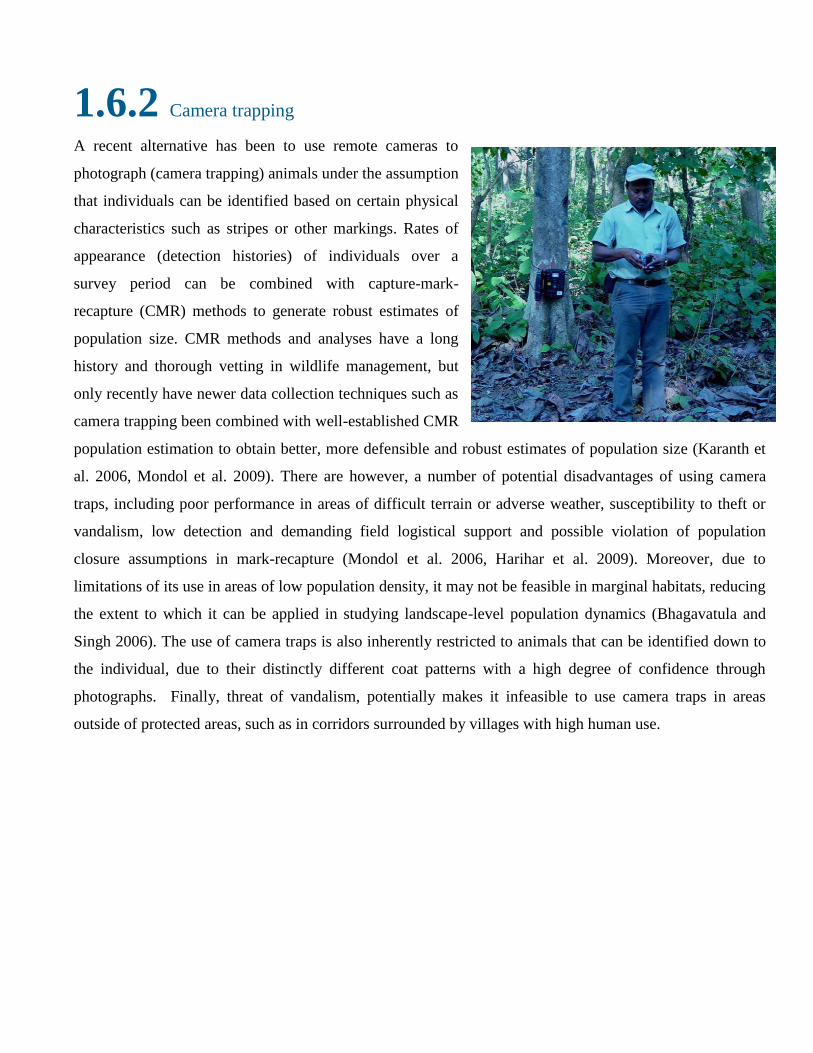
1.6.3 DNA technology and its utility in conservation science
A research tool yet to be fully utilized for tigers is genetic sampling in combination with Capture-Mark-Recapture
(CMR) statistical techniques; this constitutes use of molecular techniques to derive unique genetic profiles for
individuals based on collection of samples that harbor DNA such as blood, tissue, hair, bones and scats (Waits and
Paetkau 2005, Wetton at al. 2004, Ruttledge et al 2009, Gillett et al 2010, Wilson et al, 2009). Enthusiasm has
increased as studies have documented the potential use of genetic
sampling in applications such as non-invasive population estimation and
wildlife forensics (Mills et al. 2000; Kelly et al 2012). This is of
particular interest in tiger conservation, providing new opportunities for
understanding not only population size through genetic identification of
individuals, but it also gives information on landscape level population
dynamics (Holdregger and Wagner 2008, Sharma et al. 2009); and is
useful for enforcing anti-poaching laws (Singh et al. 2004, Wetton et al.
2004). Use of genetic sampling holds significant promise in execution of
landscape-level management plans as it may allow managers to measure
genetic health and even gene flow with greater certainty. Habitat
connectivity and the degree of movement from one habitat patch to
another can be inferred through understanding of species behavior, but
genetic data can give us landscape level information by directly identifying patterns of distinctiveness, endemism and
the degree to which gene flow exists between subpopulations (Cracraft et al. 1998, Holdregger and Wagner 2008).
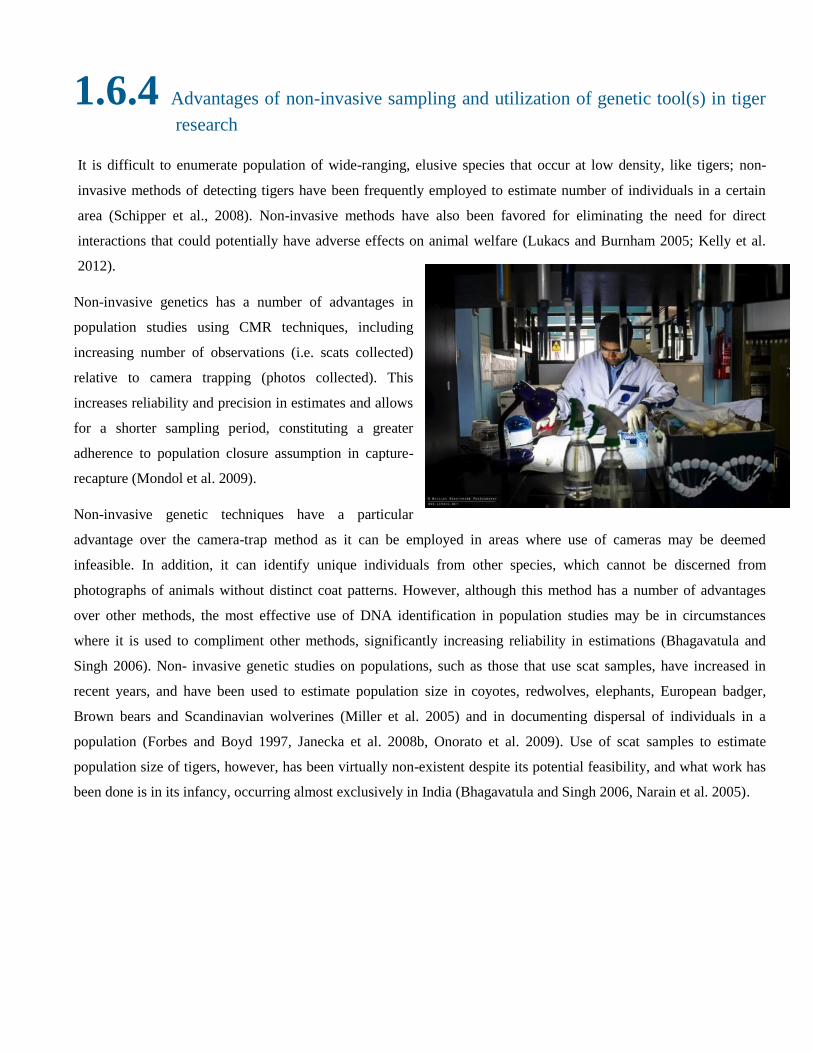
1.6.4 Advantages of non-invasive sampling and utilization of genetic tool(s) in tiger
research
It is difficult to enumerate population of wide-ranging, elusive species that occur at low density, like tigers; non-
invasive methods of detecting tigers have been frequently employed to estimate number of individuals in a certain
area (Schipper et al., 2008). Non-invasive methods have also been favored for eliminating the need for direct
interactions that could potentially have adverse effects on animal welfare (Lukacs and Burnham 2005; Kelly et al.
2012).
Non-invasive genetics has a number of advantages in
population studies using CMR techniques, including
increasing number of observations (i.e. scats collected)
relative to camera trapping (photos collected). This
increases reliability and precision in estimates and allows
for a shorter sampling period, constituting a greater
adherence to population closure assumption in capture-
recapture (Mondol et al. 2009).
Non-invasive genetic techniques have a particular
advantage over the camera-trap method as it can be employed in areas where use of cameras may be deemed
infeasible. In addition, it can identify unique individuals from other species, which cannot be discerned from
photographs of animals without distinct coat patterns. However, although this method has a number of advantages
over other methods, the most effective use of DNA identification in population studies may be in circumstances
where it is used to compliment other methods, significantly increasing reliability in estimations (Bhagavatula and
Singh 2006). Non- invasive genetic studies on populations, such as those that use scat samples, have increased in
recent years, and have been used to estimate population size in coyotes, redwolves, elephants, European badger,
Brown bears and Scandinavian wolverines (Miller et al. 2005) and in documenting dispersal of individuals in a
population (Forbes and Boyd 1997, Janecka et al. 2008b, Onorato et al. 2009). Use of scat samples to estimate
population size of tigers, however, has been virtually non-existent despite its potential feasibility, and what work has
been done is in its infancy, occurring almost exclusively in India (Bhagavatula and Singh 2006, Narain et al. 2005).
1.7 Study Species
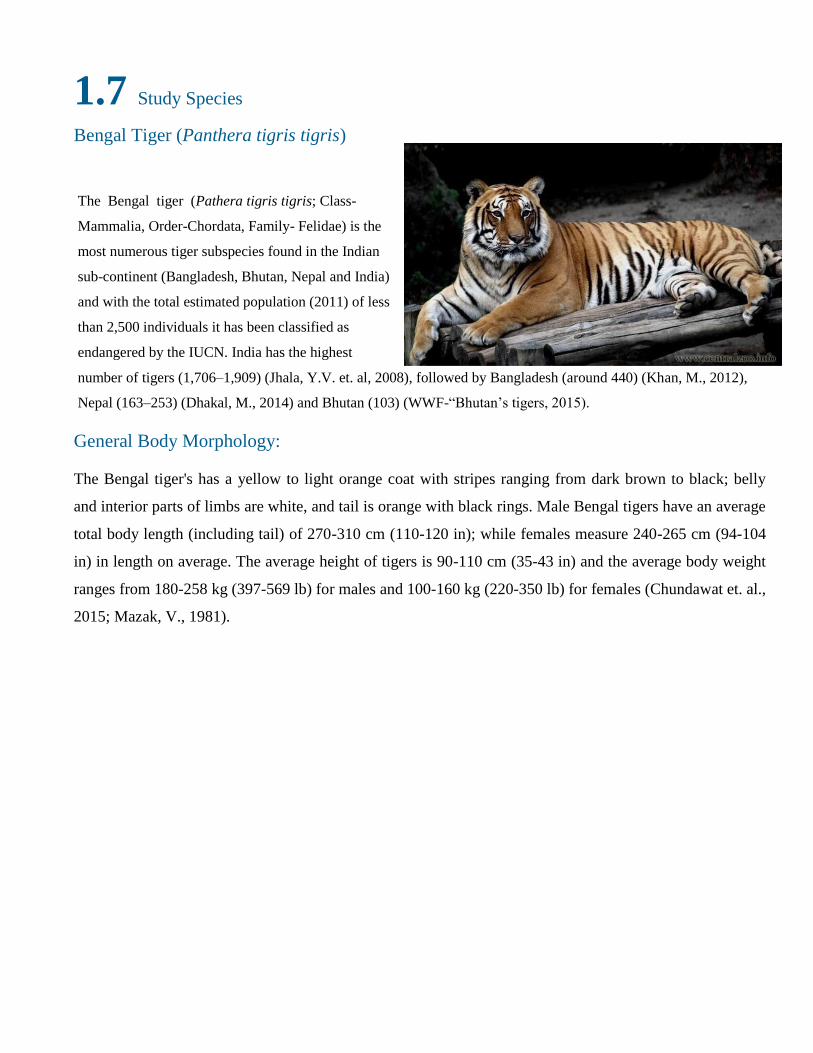
Bengal Tiger (Panthera tigris tigris)
The Bengal tiger (Pathera tigris tigris; Class-
Mammalia, Order-Chordata, Family- Felidae) is the
most numerous tiger subspecies found in the Indian
sub-continent (Bangladesh, Bhutan, Nepal and India)
and with the total estimated population (2011) of less
than 2,500 individuals it has been classified as
endangered by the IUCN. India has the highest
number of tigers (1,706–1,909) (Jhala, Y.V. et. al, 2008), followed by Bangladesh (around 440) (Khan, M., 2012),
Nepal (163–253) (Dhakal, M., 2014) and Bhutan (103) (WWF-―Bhutan‘s tigers, 2015).
General Body Morphology:
The Bengal tiger's has a yellow to light orange coat with stripes ranging from dark brown to black; belly
and interior parts of limbs are white, and tail is orange with black rings. Male Bengal tigers have an average
total body length (including tail) of 270-310 cm (110-120 in); while females measure 240-265 cm (94-104
in) in length on average. The average height of tigers is 90-110 cm (35-43 in) and the average body weight
ranges from 180-258 kg (397-569 lb) for males and 100-160 kg (220-350 lb) for females (Chundawat et. al.,
2015; Mazak, V., 1981).
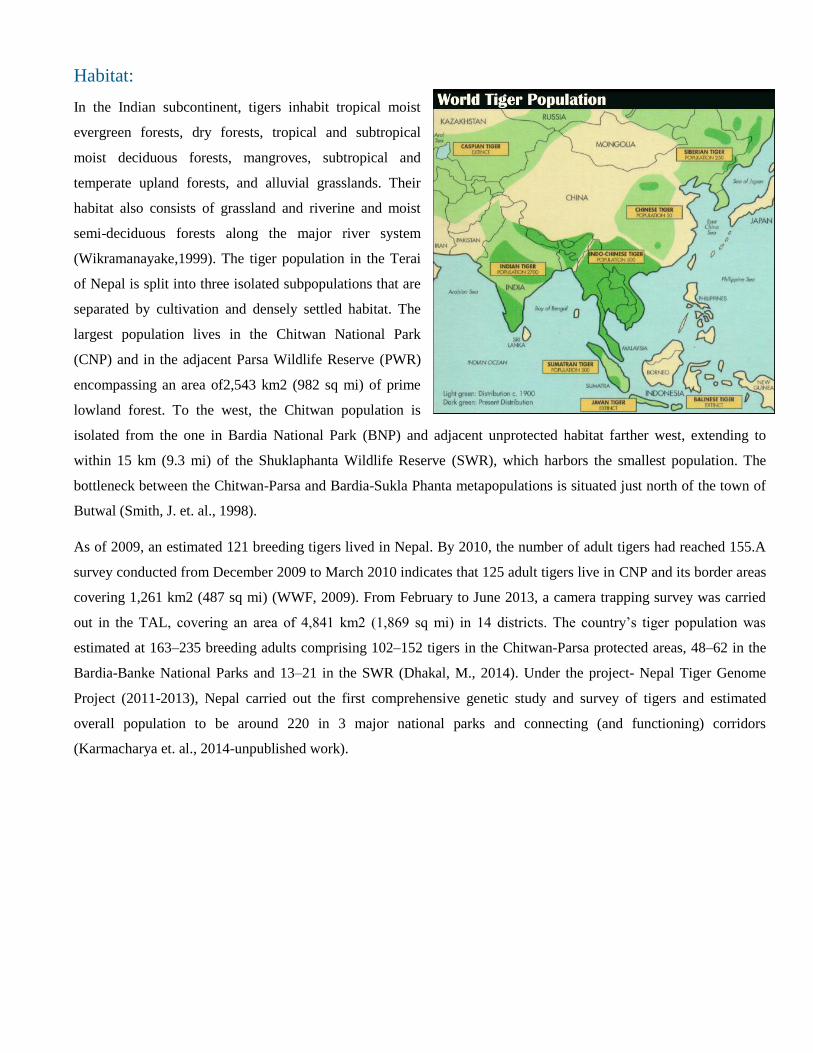
Habitat:
In the Indian subcontinent, tigers inhabit tropical moist
evergreen forests, dry forests, tropical and subtropical
moist deciduous forests, mangroves, subtropical and
temperate upland forests, and alluvial grasslands. Their
habitat also consists of grassland and riverine and moist
semi-deciduous forests along the major river system
(Wikramanayake,1999). The tiger population in the Terai
of Nepal is split into three isolated subpopulations that are
separated by cultivation and densely settled habitat. The
largest population lives in the Chitwan National Park
(CNP) and in the adjacent Parsa Wildlife Reserve (PWR)
encompassing an area of2,543 km2 (982 sq mi) of prime
lowland forest. To the west, the Chitwan population is
isolated from the one in Bardia National Park (BNP) and adjacent unprotected habitat farther west, extending to
within 15 km (9.3 mi) of the Shuklaphanta Wildlife Reserve (SWR), which harbors the smallest population. The
bottleneck between the Chitwan-Parsa and Bardia-Sukla Phanta metapopulations is situated just north of the town of
Butwal (Smith, J. et. al., 1998).
As of 2009, an estimated 121 breeding tigers lived in Nepal. By 2010, the number of adult tigers had reached 155.A
survey conducted from December 2009 to March 2010 indicates that 125 adult tigers live in CNP and its border areas
covering 1,261 km2 (487 sq mi) (WWF, 2009). From February to June 2013, a camera trapping survey was carried
out in the TAL, covering an area of 4,841 km2 (1,869 sq mi) in 14 districts. The country‘s tiger population was
estimated at 163–235 breeding adults comprising 102–152 tigers in the Chitwan-Parsa protected areas, 48–62 in the
Bardia-Banke National Parks and 13–21 in the SWR (Dhakal, M., 2014). Under the project- Nepal Tiger Genome
Project (2011-2013), Nepal carried out the first comprehensive genetic study and survey of tigers and estimated
overall population to be around 220 in 3 major national parks and connecting (and functioning) corridors
(Karmacharya et. al., 2014-unpublished work).
Conservation Threats:
Over the past century the tiger population has dwindled and its habitat reduced drastically. None of the tiger
conservation landscapes is large enough to support an effective population size of 250 individuals. Habitat loss and
high incidences of poaching are serious threats to tiger‘s survival (Chundawat, et.al., 2011). Additionally, emerging
and re-emerging diseases might be the next big threat to tiger conservation.
Poaching
Immediate threat to wild tiger populations in south Asia is poaching. There is often inadequate enforcement response
in these countries to stop or slow down wildlife crime (poaching). Various tiger body parts such as skin and bones
have high monetary value in countries like China where they are used as ornamental and decorative items and as
ingredients in traditional medicine (Hemley, et. al., 1999). According to the report from Wildlife Protection Society
of India, in 15 years (1994-2009) there were more than 893 documented cases of tiger killings in India, which
experts believe is just a fraction of actual total poaching.
Human-Wildlife conflict
The increasing human population is encroaching and shrinking tiger habitats thereby increasing the risks of human-
tiger conflict. The conflict often results in human, tiger or livestock losses. There were no recorded cases of human
death due to tiger attacks before 1980 in the CNP of Nepal. However the following year 13 people were killed in tiger
attacks (McDougal, 1987). Every year there are reported cases of human and livestock casualties in Nepal, and the
government is struggling with mitigation and compensation challenges with human wildlife conflicts. This creates
resentment in the affected communities, and often this result in retaliatory killing of animals.

1.8 Study Aims and Hypothesis:
Conservation of the Bengal tigers in Nepal is a top priority due to the species‘ dwindling numbers worldwide. It is
also important to have a comprehensive understanding of tiger conservation from a landscape perspective. In order to
develop effective policies and strategies for the conservation of Bengal tigers, effective census tools need to be
developed and deployed. The previous traditional/conventional tools for conservation are often inadequate and
ineffective to address the problem.
Genetic analysis has become an effective and popular method and is used in all aspects of wildlife biology and
conservation. Since portions of the genome of every individual are unique, the use of genetic tools yield highly
specific information that can help in estimating animal migration rates, population size, bottlenecks and kinship.
Genetic analysis can also be utilized to identify species, sex and individuals; and provide insight on its population
trend as well as to gather other taxonomic level information. Since it is infeasible to enumerate populations of low
density, wide-ranging and elusive species like tigers, non-invasive methods of detecting the species by using scat or
fecal sample have been frequently employed to infer estimations on the number of individuals in a certain area;
moreover, this method has also been favored for eliminating the need for direct interactions (invasive) that could
potentially have adverse effects on animal welfare. Scat is also a good source of DNA of gut microbiome of tigers.
The implication and utility of information obtained through this research has great potential to address many
outstanding tiger related conservation questions- How many tigers are there in each of our national parks? How
healthy are they from genetic perspective? Are there any interactions between pockets of tiger populations? Will we
be able to track the source of poached tiger parts and help in the fight against wildlife crime? These are all important
questions that can only be answered through genetics and use of DNA technology. Additionally, by building a
genetic database and creating a geo-spatial map of all the wild tigers in Nepal, one could potentially track each tiger
over time and gauge its status.
The next big threat to tiger conservation will be coming from wildlife diseases; as the tiger habitats are gradually
being encroached and circled by humans and livestock, there is a growing threat of zoonotic diseases being
transmitted between humans, animals (livestock) and wildlife populations. We know very little about the gut
microbiome of wild tigers and its role in general health and disease implications on the species. My research will shed
new light on gut microbiota of wild tigers in Nepal. This research and its findings will pave ways to conduct similar
research on other endangered and important species of Nepal.
My research thesis has 6 main chapters, including methodology and study design data (Chapter II) that describes the
overall method that was used to derive all the experiments. The first research chapter (Chapter III) outlines discovery
of other sympatric carnivore species while we conducted the tiger study- the findings are important to understand
conservation of the species at a landscape scale with holistic approach. In the second data chapter (Chapter IV),
tiger‘s genetic structure, gene flow and population genetics analysis is described in detail. The practical utility of tiger
genetic database created as a result of our project (Nepal Tiger Genome Project) has been providing valuable
information for identification of at source location of poached tiger parts; this molecular forensic tool has now been
serving Nepal Police in its wildlife crime investigations and this has been described in Chapter V. The gut
mircrobiome of wild tigers, and comparative analysis between host (tiger) and its gut microbiome (including potential
pathogens) is analyzed and described in the final chapter (Chapter VI).
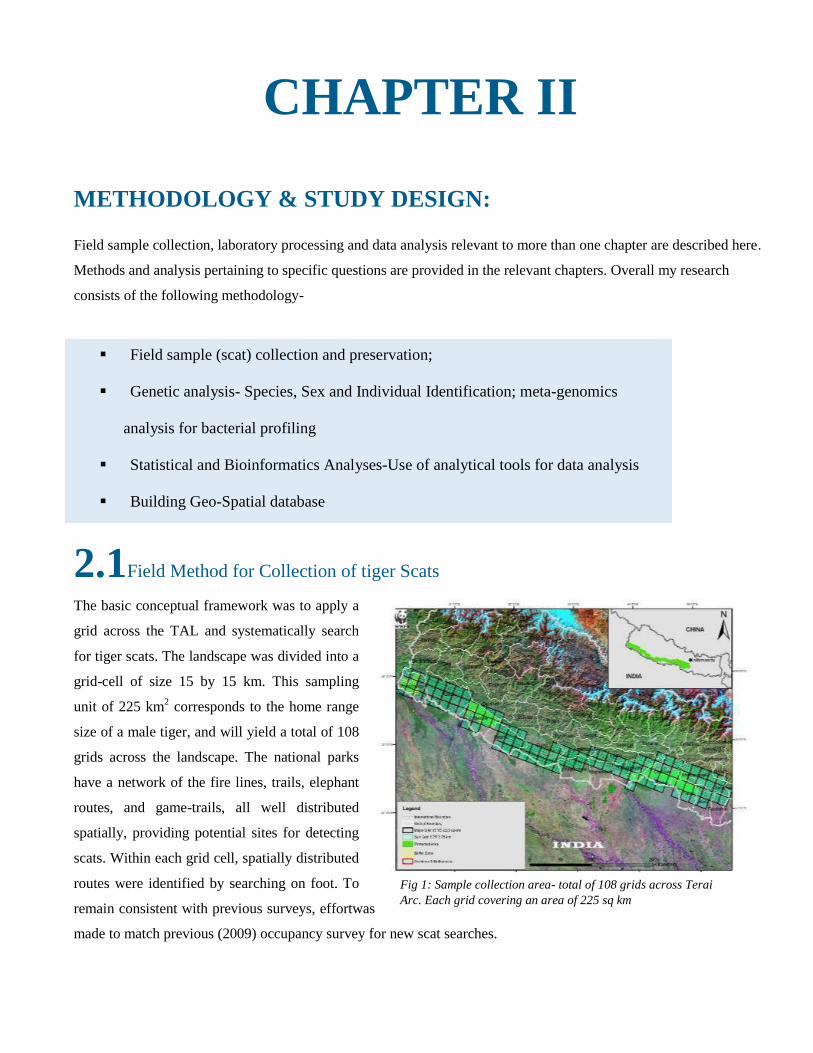
Fig 1: Sample collection area- total of 108 grids across Terai
Arc. Each grid covering an area of 225 sq km
CHAPTER II
METHODOLOGY & STUDY DESIGN:
Field sample collection, laboratory processing and data analysis relevant to more than one chapter are described here.
Methods and analysis pertaining to specific questions are provided in the relevant chapters. Overall my research
consists of the following methodology-
2.1Field Method for Collection of tiger Scats The basic conceptual framework was to apply a
grid across the TAL and systematically search
for tiger scats. The landscape was divided into a
grid-cell of size 15 by 15 km. This sampling
unit of 225 km2 corresponds to the home range
size of a male tiger, and will yield a total of 108
grids across the landscape. The national parks
have a network of the fire lines, trails, elephant
routes, and game-trails, all well distributed
spatially, providing potential sites for detecting
scats. Within each grid cell, spatially distributed
routes were identified by searching on foot. To
remain consistent with previous surveys, effortwas
made to match previous (2009) occupancy survey for new scat searches.
Field sample (scat) collection and preservation;
Genetic analysis- Species, Sex and Individual Identification; meta-genomics
analysis for bacterial profiling
Statistical and Bioinformatics Analyses-Use of analytical tools for data analysis
Building Geo-Spatial database
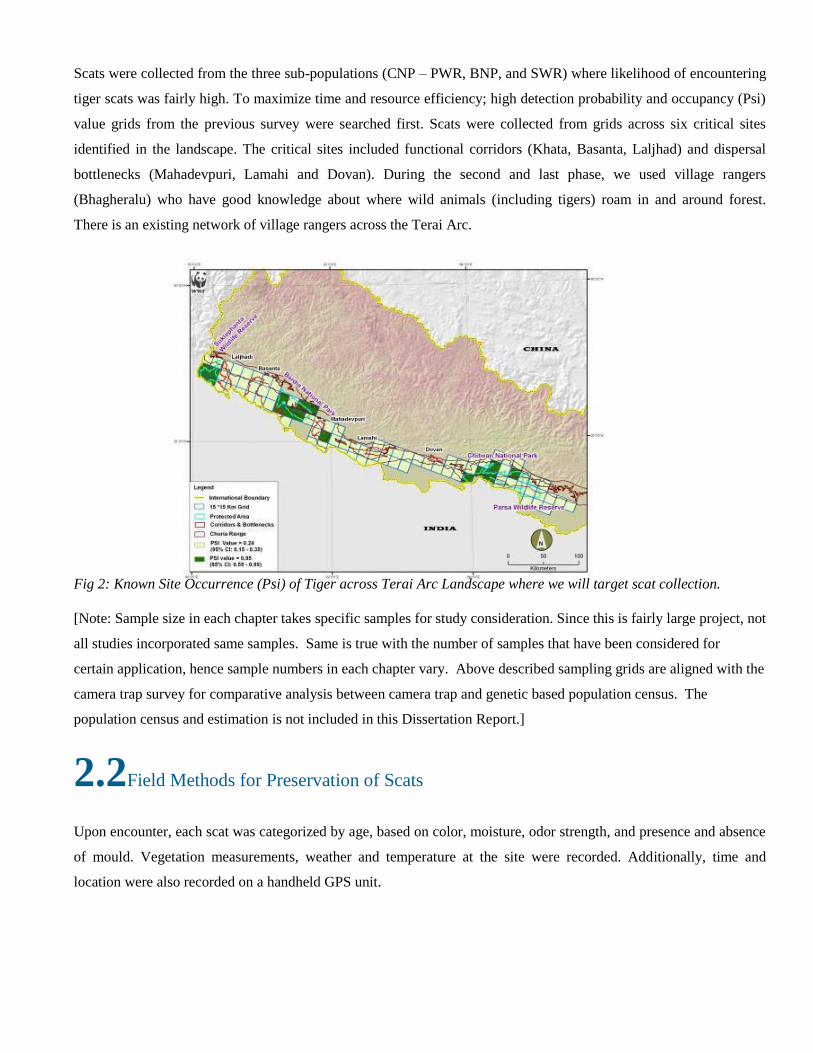
Scats were collected from the three sub-populations (CNP – PWR, BNP, and SWR) where likelihood of encountering
tiger scats was fairly high. To maximize time and resource efficiency; high detection probability and occupancy (Psi)
value grids from the previous survey were searched first. Scats were collected from grids across six critical sites
identified in the landscape. The critical sites included functional corridors (Khata, Basanta, Laljhad) and dispersal
bottlenecks (Mahadevpuri, Lamahi and Dovan). During the second and last phase, we used village rangers
(Bhagheralu) who have good knowledge about where wild animals (including tigers) roam in and around forest.
There is an existing network of village rangers across the Terai Arc.
Fig 2: Known Site Occurrence (Psi) of Tiger across Terai Arc Landscape where we will target scat collection.
[Note: Sample size in each chapter takes specific samples for study consideration. Since this is fairly large project, not
all studies incorporated same samples. Same is true with the number of samples that have been considered for
certain application, hence sample numbers in each chapter vary. Above described sampling grids are aligned with the
camera trap survey for comparative analysis between camera trap and genetic based population census. The
population census and estimation is not included in this Dissertation Report.]
2.2Field Methods for Preservation of Scats
Upon encounter, each scat was categorized by age, based on color, moisture, odor strength, and presence and absence
of mould. Vegetation measurements, weather and temperature at the site were recorded. Additionally, time and
location were also recorded on a handheld GPS unit.
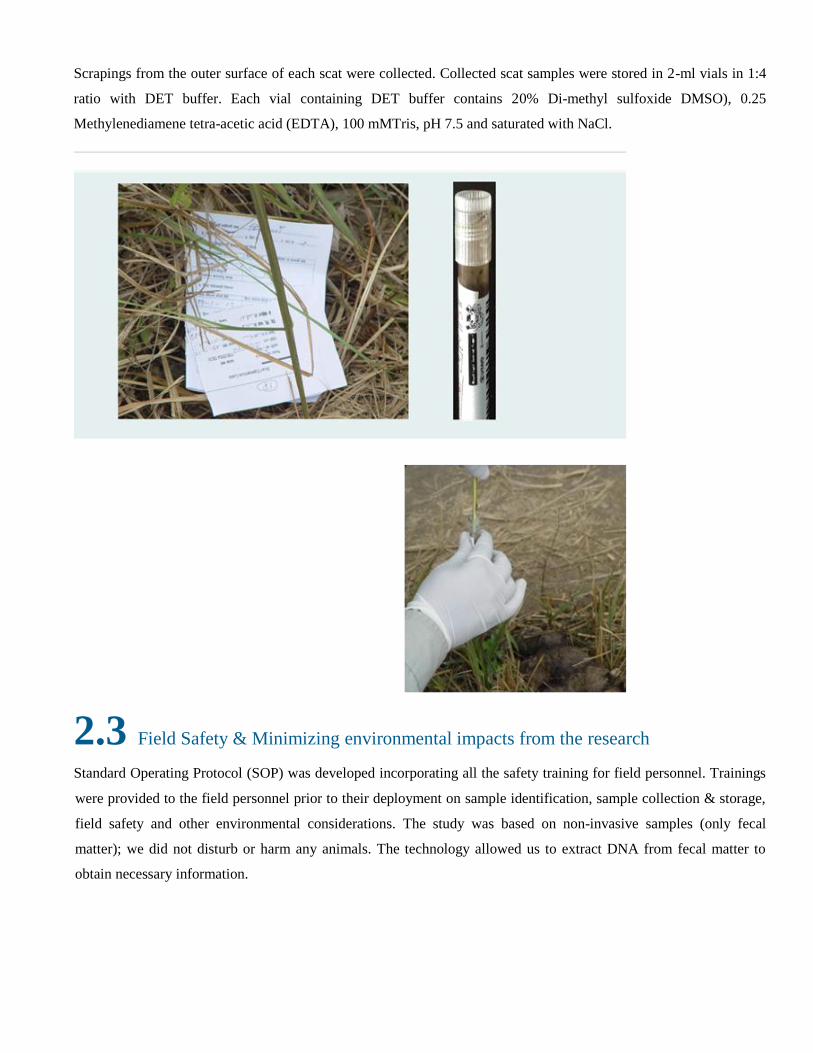
Scrapings from the outer surface of each scat were collected. Collected scat samples were stored in 2-ml vials in 1:4
ratio with DET buffer. Each vial containing DET buffer contains 20% Di-methyl sulfoxide DMSO), 0.25
Methylenediamene tetra-acetic acid (EDTA), 100 mMTris, pH 7.5 and saturated with NaCl.
2.3 Field Safety & Minimizing environmental impacts from the research
Standard Operating Protocol (SOP) was developed incorporating all the safety training for field personnel. Trainings
were provided to the field personnel prior to their deployment on sample identification, sample collection & storage,
field safety and other environmental considerations. The study was based on non-invasive samples (only fecal
matter); we did not disturb or harm any animals. The technology allowed us to extract DNA from fecal matter to
obtain necessary information.
2.4Genetic Analysis:
Some portion of genetic analysis of tiger scats was adapted from earlier work by Bhagavatula et al. (2009) from the
Centre for Cellular and Molecular Biology, India (Genotyping faecal samples of Bengal tiger Panthera tigris tigris
for population estimation: A pilot study. BMC Genetics. 2006).
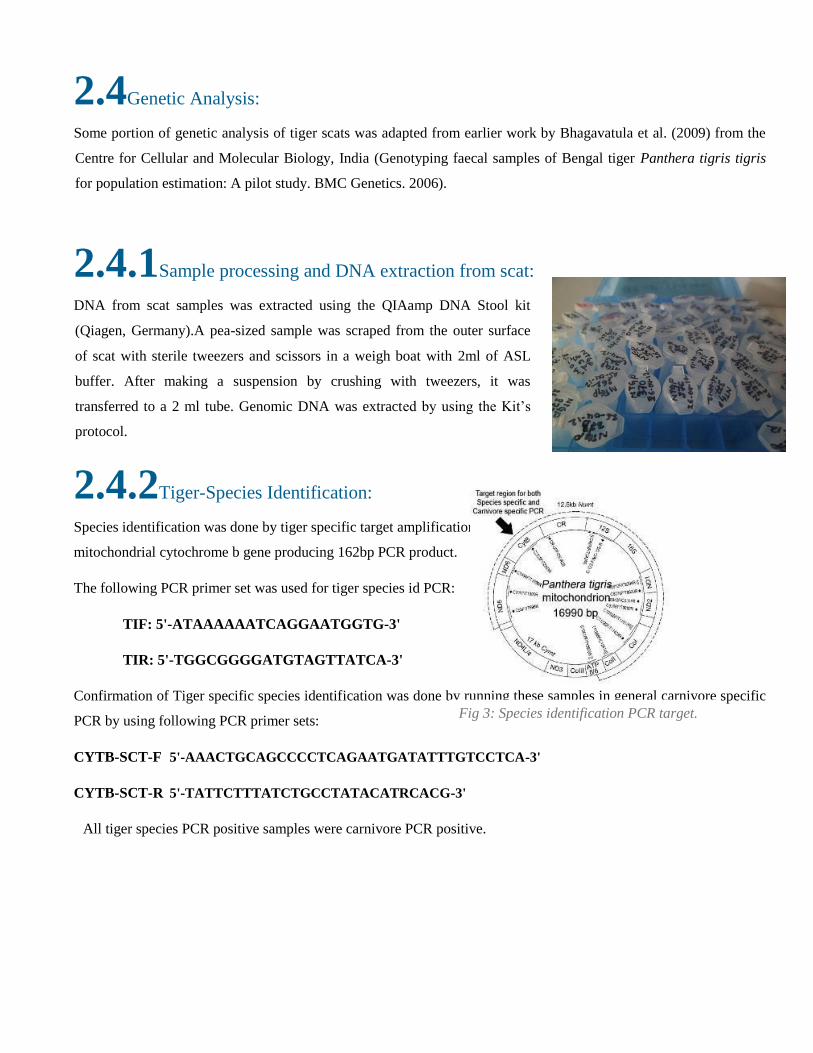
2.4.1Sample processing and DNA extraction from scat:
DNA from scat samples was extracted using the QIAamp DNA Stool kit
(Qiagen, Germany).A pea-sized sample was scraped from the outer surface
of scat with sterile tweezers and scissors in a weigh boat with 2ml of ASL
buffer. After making a suspension by crushing with tweezers, it was
transferred to a 2 ml tube. Genomic DNA was extracted by using the Kit‘s
protocol.
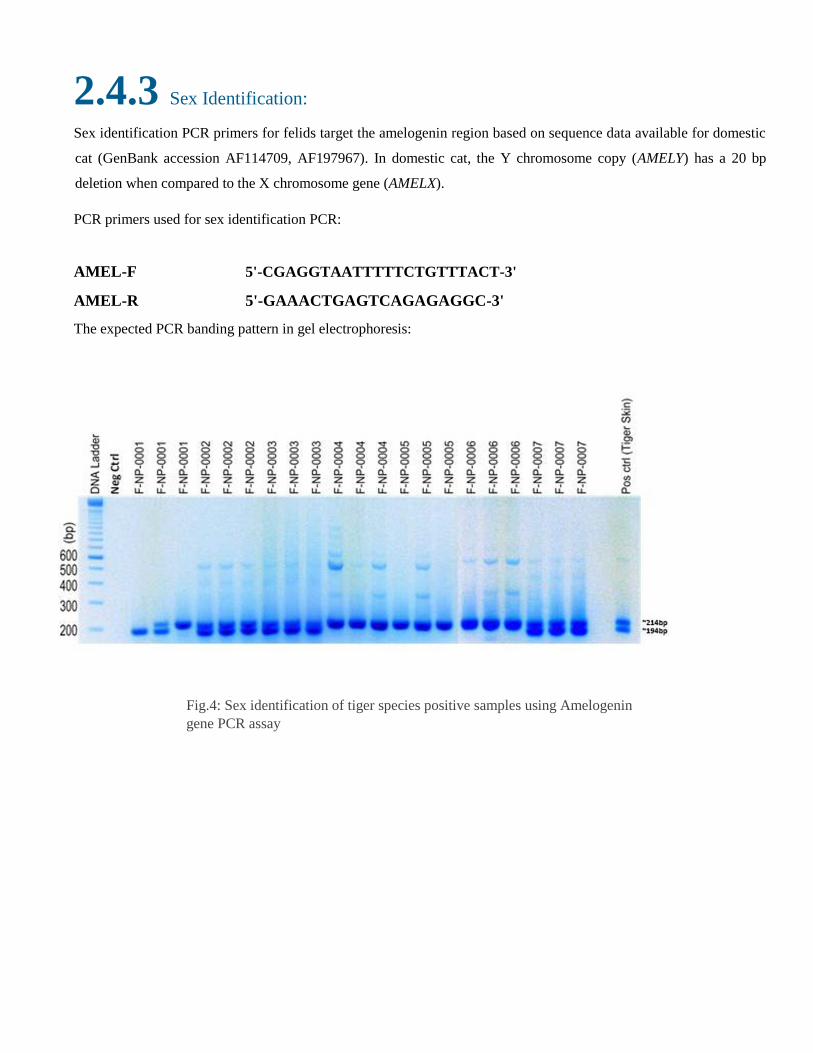
2.4.2Tiger-Species Identification:
Species identification was done by tiger specific target amplification in the
mitochondrial cytochrome b gene producing 162bp PCR product.
The following PCR primer set was used for tiger species id PCR:
TIF: 5'-ATAAAAAATCAGGAATGGTG-3'
TIR: 5'-TGGCGGGGATGTAGTTATCA-3'
Confirmation of Tiger specific species identification was done by running these samples in general carnivore specific
PCR by using following PCR primer sets:
CYTB-SCT-F 5'-AAACTGCAGCCCCTCAGAATGATATTTGTCCTCA-3'
CYTB-SCT-R 5'-TATTCTTTATCTGCCTATACATRCACG-3'
All tiger species PCR positive samples were carnivore PCR positive.
Fig 3: Species identification PCR target.
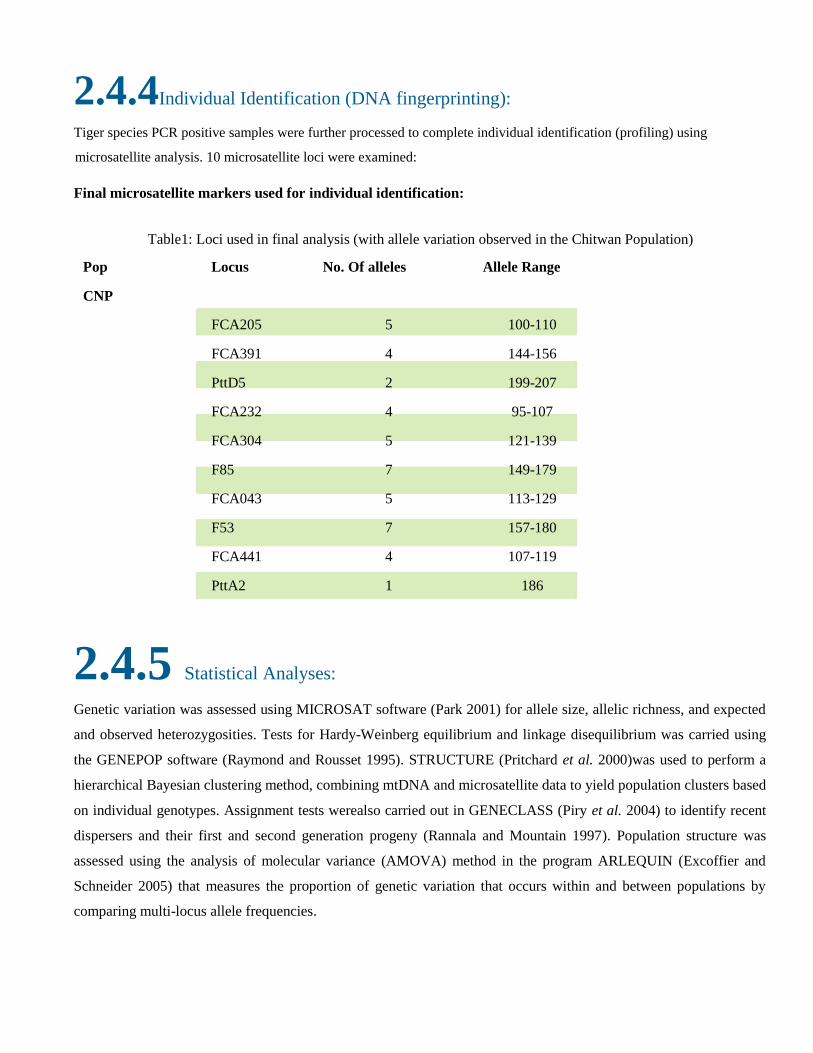
2.4.3 Sex Identification:
Sex identification PCR primers for felids target the amelogenin region based on sequence data available for domestic
cat (GenBank accession AF114709, AF197967). In domestic cat, the Y chromosome copy (AMELY) has a 20 bp
deletion when compared to the X chromosome gene (AMELX).
PCR primers used for sex identification PCR:
AMEL-F 5'-CGAGGTAATTTTTCTGTTTACT-3'
AMEL-R 5'-GAAACTGAGTCAGAGAGGC-3'
The expected PCR banding pattern in gel electrophoresis:
Fig.4: Sex identification of tiger species positive samples using Amelogenin
gene PCR assay
2.4.4Individual Identification (DNA fingerprinting):
Tiger species PCR positive samples were further processed to complete individual identification (profiling) using
microsatellite analysis. 10 microsatellite loci were examined:
Final microsatellite markers used for individual identification:
Table1: Loci used in final analysis (with allele variation observed in the Chitwan Population)
Pop Locus No. Of alleles Allele Range
CNP
FCA205 5 100-110
FCA391 4 144-156
PttD5 2 199-207
FCA232 4 95-107
FCA304 5 121-139
F85 7 149-179
FCA043 5 113-129
F53 7 157-180
FCA441 4 107-119
PttA2 1 186
2.4.5 Statistical Analyses:
Genetic variation was assessed using MICROSAT software (Park 2001) for allele size, allelic richness, and expected
and observed heterozygosities. Tests for Hardy-Weinberg equilibrium and linkage disequilibrium was carried using
the GENEPOP software (Raymond and Rousset 1995). STRUCTURE (Pritchard et al. 2000)was used to perform a
hierarchical Bayesian clustering method, combining mtDNA and microsatellite data to yield population clusters based
on individual genotypes. Assignment tests werealso carried out in GENECLASS (Piry et al. 2004) to identify recent
dispersers and their first and second generation progeny (Rannala and Mountain 1997). Population structure was
assessed using the analysis of molecular variance (AMOVA) method in the program ARLEQUIN (Excoffier and
Schneider 2005) that measures the proportion of genetic variation that occurs within and between populations by
comparing multi-locus allele frequencies.
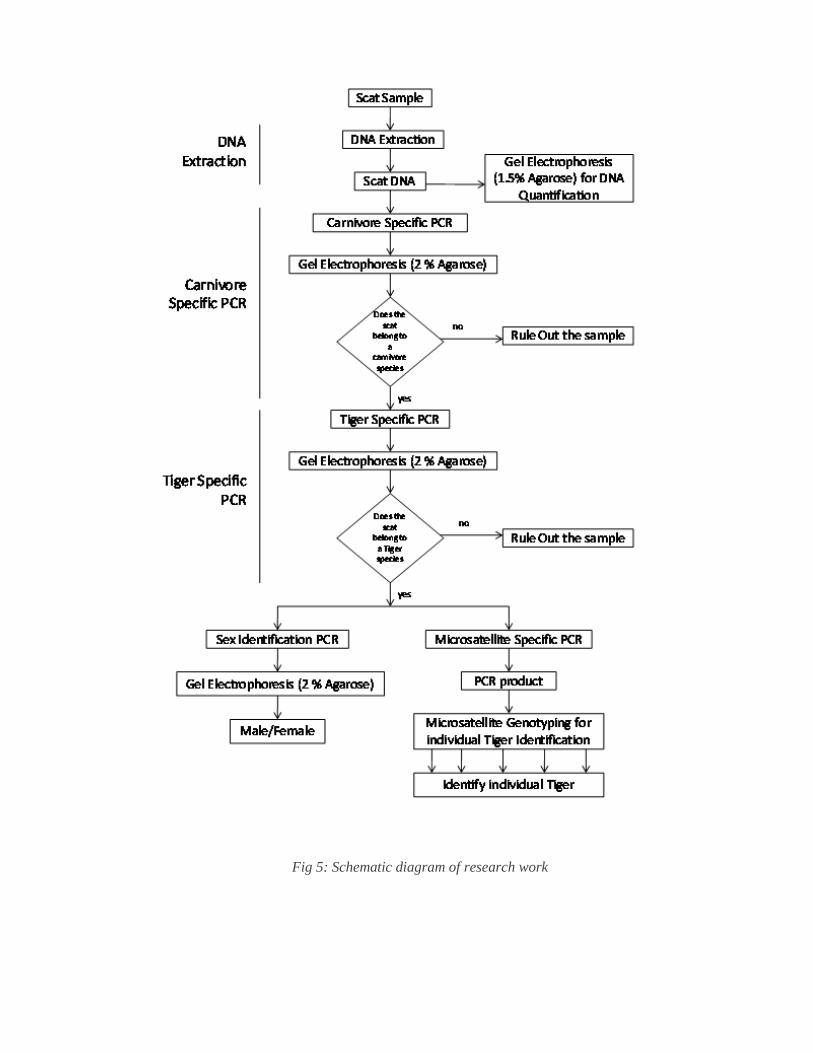
Fig 5: Schematic diagram of research work
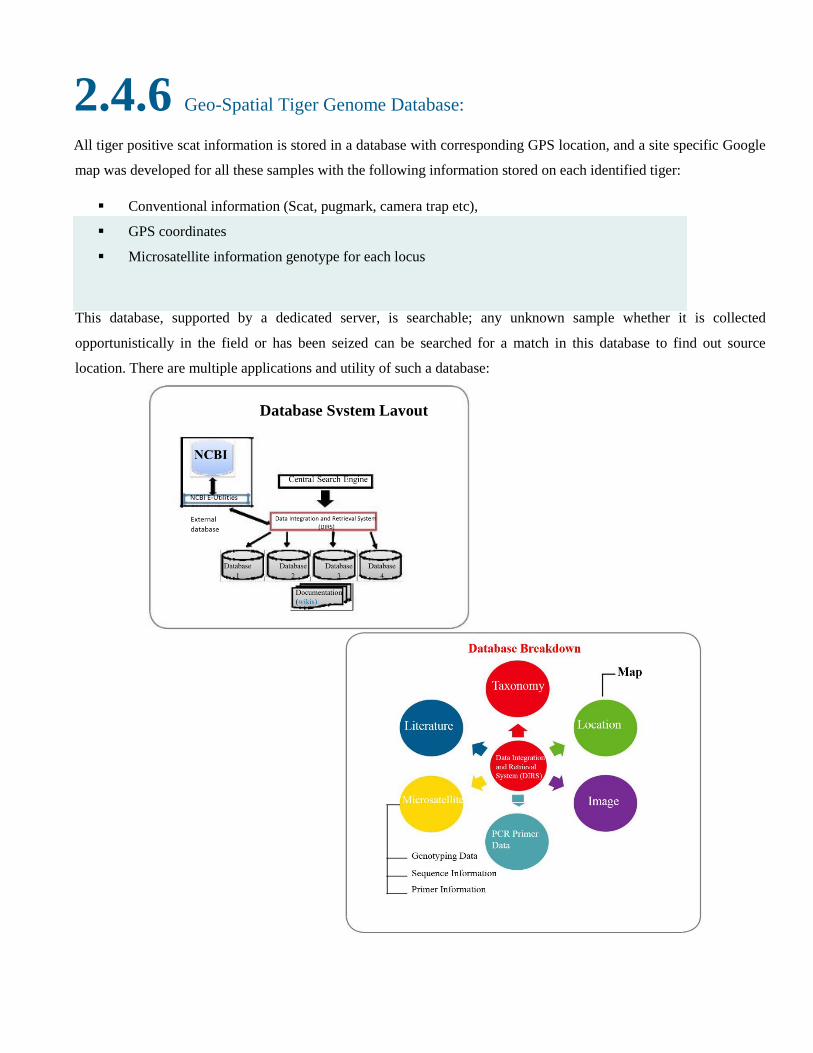
2.4.6 Geo-Spatial Tiger Genome Database: All tiger positive scat information is stored in a database with corresponding GPS location, and a site specific Google
map was developed for all these samples with the following information stored on each identified tiger:
Conventional information (Scat, pugmark, camera trap etc),
GPS coordinates
Microsatellite information genotype for each locus
This database, supported by a dedicated server, is searchable; any unknown sample whether it is collected
opportunistically in the field or has been seized can be searched for a match in this database to find out source
location. There are multiple applications and utility of such a database:
Database System Layout
References:
1. Bajimaya, S., S.R. Bhatta and S.R. Jnawali. 2006. The Greater One-Horned Rhinoceros Conservation Action Plan
for Nepal (2006-2011). Department of National Parks and Wildlife Conservation, Ministry of Forests and Soil
Conservation, The Government of Nepal, Kathmandu. <http://assets.panda.
org/downloads/rhino_action_plan_25aug_06_ low_2.pdf>
2. Bajimaya, S., J.B. Karki, G. Pant, M.N. Kafle, S.R.Jnawali, S. Bajracharya, S. Khaling, S.M. Nepal, S. Lohani,
and U.R. Bhuju. 2007 Tiger Conservation Action Plan for Nepal 2008-2012. Department of National Parks and
Wildlife Conservation, Ministry of Forests and Soil conservation, Government of
Nepal.<http://assets.panda.org/downloads/tiger_ conservation_action_plan.pdf>
3. Barlow, A.C.D., C. McDougal, J.L.D. Smith, B. Gurung, S.R. Bhatta, S. Kumal, B. Mahato, and D.B. Tamang.
2009. Temporal variation in tiger (Panthera tigris) populations and its implications for monitoring. Journal of
Mammalogy 90: 472-478
4. DNPWC. 2004. The Snow Leopard Conservation Action Plan for Nepal. Department of National Parks and
Wildlife Conservation, Ministry of Forests and Soil Conservation, the Government of
Nepal.Kathmandu<http://www.dnpwc.gov.np/The%20Snow%20Leopard%20Conservation%20Action%20
Plan%20for%20Nepal.pdf>
5. Gratwicke, B., J. Seidensticker, M. Shrestha, K. Vermilyue and M. Birnbaum. 2007. Evaluating the performance
of a decade of Save The Tiger Fund's investments to save the world's last wild tigers. Environmental Conservation:
1-11
6. Gurung, B.B.. 2002. Mapping the metapopulation structure of tigers throughout Nepalby establishing a tiger
monitoring network of "village rangers". MSc Thesis. University of Minnesota, Twin Cities
7. Karanth, K.U., J.D. Nichols, J. Seidensticker, E.Dinerstein, J.L. David Smith, C. McDougal, A.J.T. Johnsingh, R. S.
Chundawat and W. Thapar. 2003. Science deficiency in conservation practice: the monitoring of tiger populations in India.
Animal Conservation 6: 141-146
8. Sanderson, E., J. Forrest, C. Loucks, J. Ginsberg, E. Dinerstein, J. Seidensticker, P. Leimgruber, M. Songer, A.
Heydlauff, T.O‘Brien, G. Bryja, S. Klenzendorf and E. Wikramanayake. 2006. Setting Priorities for the
Conservation and Recovery of Wild Tigers: 2005-2015. The Technical Assessment. Wildlife Conservation Society,
World Wildlife Fund, and National Fish and Wildlife Service – Save the Tiger Fund, New York – Washington,
D.C.
9. Schipper, J. et al., 2008. The status of the world‘s land and marine mammals: diversity, threat, and knowledge.
Science 141, 67–77.
10. Harihar, A., B. Pandav, and S.P. Goyal. 2009. Subsampling photographic capture-recapture data of tigers
(Panthera tigris) to minimize closure violation and improve estimate precision: a case study. Population Ecology
51: 471-479
11. Jackson. R.M., J.D. Roe, R. Wangchuk, D.O. Hunter. 2006. Estimating snow leopard population abundance using
photography and capture-recapture techniques. Wildlife Society Bulletin 34: 772-781
12. Karanth, U.K., J.D. Nichols, N.S. Kumar and J.E. Hines. 2006. Assessing tiger population dynamics using
photographic capture-recapture sampling. Ecology 87: 2925-2937
13. Bhagavatula, J. and L. Singh. 2006. Genotyping faecal samples of Bengal tiger Panthera tigris tigris for
population estimation: A pilot study. BMC Genetics 4: 48
14. Cracraft, J., J. Feinstein, J. Vaughn, and K. Helm-Bychowski. 1998. Sorting out tigers (Panthera tigris):
mitochondrial sequences, nuclear inserts, systematics and conservation genetics. Animal Conservation 1: 139-150
15. Fernando, P., G. Polet, N. Foead, L.S. Ng, J.Pastorini, and D.J. Melnick. 2006. Genetic diversity, phylogeny
and conservation of the Javan rhinoceros (Rhinoceros sondaicus). Conservation Genetics 7: 439-448
16. Forbes S.H. and D.K. Boyd. 1997. Genetic structure and migration in native and reintroduced Rocky Mountain
wolf populations. Conservation Biology 11: 1226–1234
17. Holdregger, R. and H.H. Wagner. 2008. Landscape Genetics. Bioscience 58: 199-207
18. Janecka, J.E., R. Jackson, Z. Yuquang, L. Diqiang, B. Munkhtsog, V. Buckley-Beason and W.J. Murphy. 2008a.
Population monitoring of snow leopards using noninvasive collection of scat samples: a pilot study. Animal
Conservation 11: 401-411
19. Miller, C.G., P. Joyce, and L.P. Waits. 2005. A new method for estimating the size of small populations from
genetic mark-recapture data. Molecular Ecology 14: 1991-2005
20. Mills, L.S., J.J. Citta, K.P. Lair, M.K. Schwartz, and D.A. Tallmon. 2000. Estimating animal abundance using
noninvasive DNA sampling: promise and pitfalls. Ecological Applications 10: 283-294
21. Mondol, S., K. U. Karanth, N.S. Kumar, A.M. Gopalaswamy, A. Andheria, and U. Ramakrishnan. 2009.
Evaluation of non-invasive genetic sampling methods for estimating tiger population size. Biological Conservation
142: 2350-2360
22. Onorato, D.P., E.C. Hellgren, R.A. Van Den Bussche, D.L. Doan-Crider and J. Raymon Skiles Jr.2009. Genetic
structure of American black bears in the desert southwest of North America: conservation implications for
recolonization. Conservation Genetics 8: 565-576
23. Singh, A., A. Gaur, K. Shailaja, B.S. Bala, and L. Singh. 2004. A novel microsatellite (STR) marker for forensic
identification of big cats in India.Forensic Science International 141: 143-14
24. Taberlet P. and G. Luikart. 1999. Non-invasive genetic sampling and individual identification.Biological Journal
of the Linnean Society 68: 41-55.
25. Waits, L.P. and D. Paetkau. 2005. Noninvasive genetic sampling tools for wildlife biologists: a review of applications and
recommendations for accurate data collection. Journal of Wildlife Management 69: 1419-1433
26. Wan, Q., and S. Fang. 2003. Application of species-specific polymerase chain reaction in the forensic
identification of tiger species. ForensicScience International 131: 75-78
27. Wetton, J.H., C.S.F. Tsang, C.A. Roney, A.C. Spriggs.2004. An extremely sensitive species-specificARMs PCR
test for the presence of tiger bone DNA. Forensic Science International 140: 139-145
28. Xu, Y.C., B. Li, W.S. Li, S.Y. Bai, Y. Jin, X.P. Li, M.B. Gu, S.Y. Jing, W. Zhang. 2005. Individualization of tiger
by using microsatellites. Forensic Science International 151: 45-51
29. Caniglia, R., E. Fabbri, C. Greco, M. Galaverni, and E. Randi. 2009. Forensic DNA against wildlife poaching:
Identification of a serial wolf killing inItaly. Forensic Science International: Genetics
30. Coghlan, A. 2003. Forensic test fingers rhino poachers. New Scientist 179: 9-9
31. Lorenzini, R. 2005. DNA forensics and the poaching of wildlife in Italy: A case study. Forensic Science
International 153: 218-221
32. Ogden, R., N. Dawnay, R. McEwing. 2009. Wildlife DNA forensics - bridging the gap between conservation
genetics and law enforcement. Forensic Methods in Conservation Research, Endangered Species Research: pp5 <
http://www.intres.com/abstracts/esr/forensic/pp5/>
33. Palsboll, P.K., M. Berube, H.J.Skaug, and C. Raymakers. 2006. DNA registers of legally obtained wildlife and
derived products as means to identify illegal takes. Conservation Biology 20: 1284-1293
34. Singh, A., A. Gaur, K. Shailaja, B.S. Bala, and L. Singh. 2004. A novel microsatellite (STR) marker for forensic
identification of big cats in India.Forensic Science International 141: 143-147
35. Wan, Q., and S. Fang. 2003. Application of species-specific polymerase chain reaction in the forensic identification of tiger
species. ForensicScience International 131: 75-78
36. Qin J, Li R, Raes J, Arumugam M, Burgdorf KS, Manichanh C, Nielsen T, Pons N, Levenez F, Yamada T, et al.:
A human gut microbial gene catalogue established by metagenomic sequencing.Nature 2010, 464(7285):59-65.
37. Gill SR, Pop M, DeBoy RT, Eckburg PB, Turnbaugh PJ, Samuel BS, Gordon JI, Relman DA, Fraser-Liggett CM,
Nelson KE: Metagenomic analysis of the human distal gut microbiome. Science 2006, 312(5778):1355-1359.
38. Hugenholtz P, Tyson G: Microbiology:metagenomics.Nature 2008, 455(7212):481-483
39. Chakravorty S, Helb D, Burday M, Connell N, Alland D: A detailed analysis of 16S ribosomalnRNA gene
segments for the diagnosis of pathogenic bacteria.Journal of microbiologicalmethods 2007, 69(2):330-339
40. HaoX,JiangR,ChenT:Clustering 16S rRNA for OUTprediction: a method of unsupervised Bayesianclustering. Bioinformatics
2011, 27(5):611-618
41. Sun Y, Cai Y, Liu L, Yu F, Farrell M, McKendree W, Farmerie W: ESPRIT: estimatingspecies richness using
largecollectionsof 16S rRNA pyrosequences.NucleicAcidsResearch 2009,37(10):e76-e76
42. Sogin ML, Morrison HG, Huber JA, Welch D, Huse SM, Neal PR, Arrieta JM, Herndl GJ: Microbial diversity in the deep
sea and the underexplored "rare biosphere".Proc Natl AcadSci U S A 2006,103(32):12115-12120
43. Weisburg WG, Barns SM, Pelletier DA, Lane DJ (January 1991). "16S ribosomal DNA amplification for
phylogenetic study". J Bacteriol. 173 (2): 697– 703. PMC 207061.PMID 1987160.
CHAPTER III
Incidental discovery of non-focal carnivore species during genetic study of Bengal tiger (Panthera
tigris tigris) and snow leopard (Panthera uncia) in Nepal
Dibesh Karmacharya1§
, Sulochana Manandhar1, Santosh Dulal
1, Jivan Shakya
1, Kanchan Thapa
2, Manisha Bista
1,
Govind P. Sah1, Ajay N. Sharma
1, Adarsh Sherchan
1, Prajwol Manandhar
1, Laura D. Bertola
3 , Jan Janecka
4,
Marcella Kelly2, Lisette Waits
5
1Center for Molecular Dynamics-Nepal, Thapathali-11, Kathmandu, Nepal
2Department of Fish and Wildlife Conservation, Virginia Tech, Blacksburg, Virginia, USA
3Institute of Environmental Sciences (CML), Leiden University, Leiden, The Netherlands
4Department of Biological Sciences, Duquesne University, Pittsburgh, Pennsylvania, USA
5Laboratory for Ecological, Evolutionary and Conservation Genetics, University of Idaho, USA
§Corresponding author ([email protected])
[This article has been published in the Asian Journal of Conservation Biology; December 2016, Vol.5 no.2; pp 81-88; ISSN
2278-7666]
Abstract
Background
The Bengal tiger (Panthera tigris tigris) and snow leopard (Panthera uncia) are highly endangered apex predators.
These charismatic animals are categorized as flagship and umbrella species, and hence are the focus of many
conservation programs. Protecting tiger and snow leopard also safeguards entire habitat in which they reside,
including other non-focal sympatric carnivores.
Results
In our non-invasive genetic study of the tiger in the Chitwan National Park (CNP) (2011-2013), out of total collected
scat samples (n=420), only 56% (n=237) were of tiger. The remaining non-tiger samples (n=183) included non-focal
carnivores; leopard (Panthera pardus, n=83), leopard cat (Prionailurus bengalensis, n=10), jungle cat (Felis chaus,
n=2), fishing cat (Prionailurus viverrinus, n=2) and fox (Vulpes spp., n=10). Out of total 32 putative snow leopard
scat samples collected from the Mustang region of Annapurna Conservation Area (ACA) (2010-2011), only 56% (n=
18) were found to be snow leopard. We identified red fox (Vulpes vulpes, n=6), Himalayan wolf (Canis spp., n=1),
leopard cat (P. bengalensis, n=1), lynx (Lynx lynx, n=1) and leopard (P. pardus, n=1) from the remaining samples
using DNA barcoding. Remarkably, we were able to document various threatened carnivores categorized as either
critically endangered (wolf), endangered (fishing cat) or vulnerable (lynx, leopard) on Nepal‘s red list mammal status.
The presence of lynx in alpine forest at elevation of 3939 m, Himalayan wolf in rugged Trans-Himalayan terrain at
elevation of 4317 m in the snow leopard habitat were some significant findings from our non-invasive genetic study.
Similarly, the spatial distribution of three small felids: leopard cat, jungle cat and fishing cat in sub-tropical deciduous
forest of Terai has provided insights on sympatric occurrences of small cats among themselves as well as with two
other large felids leopard and tiger in CNP.
Conclusions
Our non-invasive sampling based genetic studies on tiger and snow leopard have detected other non-focal carnivore
species that co-share the same habitat. This hence has significantly increased our understanding of the carnivore
communities in two different landscapes, Terai and Himalayas, of Nepal that are prime habitat for snow leopards and
tigers.
Key Words: Non-invasive, DNA barcoding, sympatric, non-focal carnivore, flagship

Background
Amid concerns over the loss of biodiversity, experts have been increasingly seeking clues to understand ecosystems
and biodiversity [1]. The prevailing conservation and management practices, globally, include coarse-filter and fine-
filter approaches [2], the former aims to preserve entire communities of plants and animals by protecting large extents
of habitat (ecosystem approach) whilst the latter focuses to protect species (species approach).
Nepal established several protected areas based on species and ecosystem approaches for wildlife and habitat
management following prevailing conservation trends in the 1970s [3]. The ecosystem conservation and management
approach has largely been boosted by research on mega species such as the greater one-horned rhinoceros
(Rhinoceros unicornis), Bengal tiger (P. t. tigris, hereafter referred as tiger) and snow leopard (P. uncia).
Maintaining viable populations of these mega species, that include apex predators, is important for ecosystem
integrity and resilience [4]. This has been demonstrated well by successful programs with landscape level approach
to conservation like the Terai Arc Landscape (TAL) project in Nepal, which has recently contributed to the gradual
recovery in the tiger population [5] including other mega fauna such as rhinoceros and elephants [6, 7].
Current burgeoning conservation needs and limited availability of resources often forces conservation managers and
planners to rely on information on the occurrence of apex species to serve as ecosystem health indicators [8]. Tiger in
the TAL and snow leopard in the high Himalaya including the trans-Himalayan region of Nepal are such apex
predators [9].
Tiger and snow leopard are both endangered species [10]. They are also charismatic and umbrella species [11].
Therefore, they are herded as both means for and targets of conservation. By protecting tiger and snow leopard, it is
hoped that the entire community and ecosystem they reside in can be protected. Being charismatic, they also have
traits and qualities that appeal to target audiences to raise funds and awareness for reducing the biodiversity loss [12].
Core tiger populations are fragmented and found mainly in lowland areas across the four protected areas of Parsa,
Chitwan, Bardia and Shuklaphanta and occupy 36% of 26,000 sq. km of the forested landscape of TAL, Nepal [13-
15]. This habitat is also shared with leopard (P. pardus), dhole (Cuon alpinus), sloth bear (Melursus ursinus) and
striped hyena (Hyaena hyaena) within the TAL [16-19]. The trans-Himalayan region of Nepal is prime habitat for
snow leopard covering an area of 20,000 sq. km [20, 9] and including additional carnivore species, such as wolf (C.
lupus) and lynx (L. lynx) [21, 22].
In the past, there have been numerous studies conducted on the status of the flagship species [23, 24, 5]. However,
there has been limited information available on the degree to which the non-focal species have benefited while
working with these flagship species. Use of non-invasive sampling for genetic studies utilizing molecular scatology
techniques [25, 26] primarily on flagship species could be beneficial in identifying the occurrence of the non-focal
species along with the species of interest , thereby supporting to map and document the spatial distribution of species.
Scat (fecal) surveys are often used to detect and monitor elusive and low-density carnivore species [27-29].
However, there is a high degree of misidentification of scats during field sampling, with many scats not belonging to
the target species of interest [29, 28, 30]. Genetic analysis of DNA extracted from scat samples can address this
problem. One common approach is to identify a species of interest using species-specific PCR primers for
identification [31-34] for the selected pools of samples. However, this approach does not provide identification of any
of the non-focused species. For these samples, DNA sequence data can help identify the species: this is the basis of
DNA barcoding for species identification [35].
During our study on tiger in the Chitwan National Park (CNP) in the lowland areas of TAL under Nepal Tiger
Genome Project [36] in 2011-2013 and on snow leopard in the high elevation of the Mustang region of ACA in Nepal
(Fig. 1), there was significant misidentification of collected scats [28]. Using DNA barcoding technique, we were able
to genetically profile non-focal carnivore species sharing tiger and snow leopard habitats, thereby enhancing our
understanding of the carnivore community across the lowland of Terai and the high elevations in Himalayan
landscapes of Nepal. For broader tiger and snow leopard conservation efforts, it is essential that we have landscape
level of ecological information to understand conservation from ecological perspective. This study aims to provide
the better understanding of major fauna in the habitat coexisting with tiger and snow leopard.
Results
Tiger genetic study
Based on tiger specific PCR, we identified 56% (n=237) of the total collected samples (n=420) as tiger. From the
remaining samples (n=183), we identified leopards (P. pardus, n=83) through leopard specific PCR identification.
Out of remaining 100 samples, we were able to identify leopard cat (P. bengalensis, n=10), fishing cat (P. viverrinus,
n=2), jungle cat (F. chaus, n=2) and fox (Vulpes spp., n=10) through sequencing (Table 3). The rest of the samples
(n=76) yielded poor quality sequencing data, possibly due to poor quality of DNA, which could not be used for
species identification. This suggests there was 31% field misidentification of target species (without including non-
identified samples).
Snow leopard genetic study
Based on snow leopard specific PCR, we identified 56% (n=18) of the total samples (n=32) as snow leopards. Out of
the 14 remaining samples, we determined red fox (V. vulpes, n=6), leopard cat (P. bengalensis, n= 1), wolf (C. lupus,
n=1), leopard (P. pardus, n=1) and lynx (L. lynx, n=1) (Table 4). No DNA amplicon of interest (CYT-B) was amplified
from one sample and three samples yielded bad-quality sequencing data (n=4), which could have been most likely due
to the relatively low quality and quantity of DNA. Overall there was ascertained to be 36% field misidentification of
target species (without including non-identified samples).
Discussion
Species distribution studies based solely on scat morphology can be misleading [37] because sympatric carnivore
species often have indistinguishable scat morphologies [38]. The method of species identification through molecular
scatology has proved to be robust for species distribution studies [39, 40]. In most studies, only scats thought to be
from target species based on morphology are collected, but DNA analysis have frequently revealed that many
collected samples originate from non-focal species reported by previous studies [38, 29, 41, 42], as were also found in
our study.
In this study, 31% (tiger) and 36% (snow leopard) field misidentification of target species was higher than 8% and
4% reported by Mondol et al. 2009 [43] and Borthakur et al. 2011 [44] respectively. The reasons behind high
misidentification could be due to difficulty in distinguishing scats of juvenile tigers with adult leopards or juvenile
leopards with adult snow leopards in the field, comparably minimum expertise of field personnel in scat
identification, the opportunistic sample collection strategy and high degree of non-identification of the total collected
samples most likely due to the relatively low quality of DNA in compromised samples like scats. However, our
accuracy of 56% for the target species (snow leopard) was higher than 39% reported in Kanchenjunga Conservation
Area and Shey Phoksundo National Park of Nepal [28] and 33% reported in Gobi desert in Mongolia [45].
While field misidentification can be a disadvantage when investigating specific species, we can make the best out of
all other samples we have collected non-invasively by identifying them through DNA barcoding using mitochondrial
markers for species identification (Table 3 and Table 4) [46]. Genetic study on mtDNA compared to nuclear DNA is
most scientific and reliable method for species identification because there are various genetic markers currently
available within mtDNA region for specific species identification confirmed through previous studies [47]. In the
field sampling of compromised scat samples, the presence of genetic material is in relatively low quality and quantity,
however mtDNA occurs in high copy numbers in each cell and is able to withstand degradation and environmental
challenges, thus increasing chances of DNA amplification for genetic analysis.
This study was able to find occurrences of three felids (leopard, lynx, leopard cat) and two canids (wolf, red fox)
species in trans-himalayan landscape of Upper Mustang, which is prime habitat for snow leopards. Our study has
revealed one of the first strong records of lynx in Nepalese Himalayas using non-invasive genetics, as there is
currently very limited information on the occurrences of this species in Nepal [48]. This study has discerned insights
on sympatry between snow leopards and other large predators such as leopards and wolves in Mustang region of
ACA.
Similarly, our tiger study in CNP has found occurrences of four other felid species, one large (leopard) and three
small (leopard cat, jungle cat, fishing cat) that co-share habitat with tigers. Among canids, we detected a species of
fox demonstrated to have match with red fox (V. vulpes) sequence in GenBank database, but red foxes are not known
to inhabit Terai landscape. We believe that we might have discovered bengal fox (V. bengalensis) that are known to
occur commonly in Terai region of Nepal and India [49], whose reference sequences are not available in GenBank
database. It has also been reported by previous study [29] that this ~100 bp fragment of CYT-B gene is not able to
differentiate between different species of Vulpes, hence additional studies might be required to verify our assumption.
The wildlife genetic study is vital to determine and construct baseline genetic information on species including those
that are currently not focus for studies. By analyzing misidentified samples, we have gathered information on those
species that are under various threatened categories according to national red list assessment [48]. Wolf is categorized
as "Critically Endangered", fishing cat as "Endangered", while leopard cat, lynx and leopard are categorized
"Vulnerable" in the national red list assessment [48]. Among these threatened taxa, wolf, leopard cat and lynx are
also listed as protected mammal species under the National Parks and Wildlife Conservation Act 1973 of Government
of Nepal [50]. Our study has documented lynx in alpine forest habitat at an elevation of 3939 m above sea level of
Mustang region in ACA. In ACA, lynx are thought to have potential distribution across Trans-Himalaya of Upper
Mustang [48], but we have identified from alpine forest near Jomsom. Due to their elusiveness, there is lack of
complete information about their distribution in the Himalayas of Nepal, this record of lynx in alpine forest habitat
denotes that more studies are required to understand the ecology of such charismatic and protected species. Leopard
cats are found in a broad range of habitat types from tropical lowland rain forests to coniferous forests in the
Himalayas [51], their occurrence in our survey sites agrees with this distribution range from sub-tropical deciduous
forest (elevation 150- 800 m) in plains of Terai across CNP to alpine forest (elevation 3876 m) in the high Himalaya
of Mustang. Our claim on the habitat of leopard cat was also supported by the previous study which recorded the
presence of leopard cat at highest elevation (4474 m) across snow leopard habitat at Kanchenjunga Conservation Area
[52]. Wolves are among the least studied species in Nepal, recent genetic studies have provided insights about
divergent taxonomic placement of wolves roaming the Himalayas [53-55]. We think we might have also discovered
the Himalayan wolf in Upper Mustang, but we are not able to confirm it because of shorter sequence fragment that
cannot differentiate between different species of wolves. The wolf scat was detected alongside the scat identified as
snow leopard in rugged Trans-Himalayan terrain at elevation of 4317 m, which is very interesting information from
the point of view of behavioral ecology of these two predators, as carnivore scat deposits are mostly associated with
their territorial marking behavior [56-59].
Among large felids, leopards are considered to be habitat generalist. They are known to occur across Himalayan
regions through Mid-hills to Terai regions of Nepal [48]. Here in our study, we have detected their occurrence at one
instance in Mustang and at multiple instances in CNP sharing habitat with snow leopards and tigers in high Himalayas
and lowland Terai respectively. CNP is one of the few national parks in the world boasting six felid species [60],
among which three are small felids. We have detected all of the three small felids in CNP through our non-invasive
genetic study. Leopard cats are the most frequently captured small felids in our study along with jungle cat and fishing
cat. The spatial data of these three small felids across CNP provides vital understanding about their sympatric
occurrences in the same habitat. Fishing cat is a rare species known to have sparse distribution range in Terai plains of
Nepal and is known to highly associate with wetland areas [61-63]. Here, we have detected two instances of fishing
cat, both of which fall under their known distribution range in CNP and lie very close to river (< 2 km). Fishing cats
have been recorded outside protected areas in Jagdishpur Reservior, a Ramsar site lying along a rural settlement area
of south-western Nepal [64]. One of the instances of fishing cat in our study was also found to be located in distance
less than 100 m from nearest human settlement of Amaltari village in Chitwan.
Conclusion
In the on-going debate on whether focusing solely on an umbrella and/or flagship species is beneficial [65], this study
revealed that even while conducting research on focal carnivore species such as tiger or snow leopard, there is ample
opportunity to collect data on other, often neglected, non-focal carnivore species that co-occur in the same habitat.
This emphasizes the importance of holistic sampling and monitoring approaches that capture broader ecological
information. This non-invasive genetic sampling approach, integrated in our studies of tiger and snow leopard, has
significantly increased our understanding on sympatric coexisting carnivores and provided us with the vital
information about their rough distribution. Hence, this study has in overall contributed expanding our knowledge of
the carnivore community in the Terai and Himalaya regions of Nepal.
Methods
Putative tiger scat samples (n=420) were collected from CNP in 2011-2013. Samples were opportunistically collected
across selected routes (fire-lines, trails and riverbanks) within core areas of CNP (Fig. 1). Similarly, putative snow
leopard scat samples (n= 48) were opportunistically collected in 2010-2011 from Mustang region of ACA. The study
sites were selected based on suitable habitat and recently reported high activities for snow leopard (Fig. 1).
Collected samples were stored in DET buffer (20% DMSO, 0.25 M Sodium-EDTA, NaCl to saturation, pH 7.5) and
transported in ambient temperature to the laboratory of the Center for Molecular Dynamics Nepal in Kathmandu.
Total DNA was extracted from all scat samples using commercially available QIAamp DNA stool mini kit
(QIAGEN, Inc., Germany) following the manufacturer‘s instructions. Extracted DNA was stored at -20°C and
handled carefully to avoid any cross contamination between samples.
Species Identification: tiger, snow leopard and leopard
Species identification on samples was done by Polymerase Chain Reaction (PCR) using species-specific primers (SSP)
for tiger, snow leopard and leopard. For samples from CNP, samples were first addressed to tiger specific primers
(TIF/TIR) [66], which targets ~162 bp fragment of mitochondrial cytochrome b gene. Similarly, for samples from
ACA, samples were first addressed to snow leopard-specific primers (CYTB-SCT-PUN-F/CYTB-SCT-PUN-R) [67],
which targets ~150 bp fragment of mitochondrial cytochrome b gene. The negative samples from these two different
PCR reactions were then addressed to leopard-specific primers (NADH4-F/NADH4-R) [68] that targets ~130 bp
fragment of mitochondrial ND4 gene.
PCR reactions were carried out in a final volume of 7 µl containing 3.5 µl Qiagen mastermix (2X), 0.7 µl Q-solution,
0.07 µl of each forward and reverse primer at a final concentration of 0.2 µM, 0.66 µl nuclease free water and 2 µl
template DNA for tiger samples and 1.16 µl nuclease free water and 1.5 µl template DNA for snow leopard samples,
respectively. DNA from known tiger and snow leopard tissue samples generously provided by Dr. Jan Janecka, was
used as a positive control. PCR reactions were carried out in the thermocycler (MJ Research Tetrad PTC-225
Thermal Cycler, USA) with the conditions shown in Table 2. The amplified PCR products (~162 bp for tiger, ~150
bp for snow leopard and ~130 bp for leopard) were visualized on 1.8 % agarose gel electrophoresis.
General carnivore identification
The species barcoding of samples that were not identified as tigers, snow leopards and leopards were performed by
amplifying short fragment (~146 bp) of cytochrome b gene and sequencing the PCR product. The PCR was done
using a unique primer set (CYTB-SCT-F/CYTB-SCT-R) [38] which amplifies a short variable region of CYT-B in
carnivores. PCR was performed in a final 25 µl reaction mixture containing 12.5 µl Qiagen mastermix, 2.5 µl Q-
solution, 0.63 µl each forward and reverse primers at a final concentration of 0.5 µM, 6.74 µl nuclease free water and
2 µ DNA. PCR reactions were carried out in MJ Research PTC-225 Thermal Cycler, USA with the conditions as
shown in Table 2. The PCR products, along with incorporated known carnivore sample as positive control, were
visualized on 2% agarose gel. The carnivore positive amplicons were sequenced on an ABI 310 machine using the
forward primer (CYTB-SCT-F). The DNA sequences were edited and compared with reference GenBank database
using BLAST tool in NCBI to identify carnivore species. The species identification was confirmed following the
criteria of ≥ 90% query coverage and ≥ 97% identity.
Acknowledgements
We would like to express our deepest gratitude to Dr. Rodney Jackson of the Snow Leopard Conservancy for
supporting us in many ways, including providing us with funds for the study. We would like to thank the entire team
of NTGP, including Waits Laboratory for providing training and supporting us with this study. USAID/Nepal
provided funding for NTGP, and Mr. Netra Sharma of USAID/Nepal helped in NTGP project implementation. We
would also like to thank the Department of National Parks and Wildlife Conservation and Ministry of Forests and Soil
Conservation (Nepal) for their continuing support in our conservation genetics work in Nepal and providing us with
the necessary permits. Mr. Pema Lama and his field team assisted us in collecting samples from Mustang area. This
study was also supported by the Snow Leopard Network through its Snow Leopard Conservation Grants.

References
1. Cardinale BJ, Duffy JE, Gonzalez A, Hooper DU, Perrings C, Venail P et al. Biodiversity loss and its impact on
humanity. Nature. 2012;486(7401):59-67. doi:10.1038/nature11148.
2. Noss RF. From plant communities to landscapes in conservation inventories: a look at The Nature Conservancy
(USA). Biological Conservation. 1987;41(1):11-37.
3. Heinen JT, Shrestha SK. Evolving policies for conservation: an historical profile of the protected area system of
Nepal. Journal of Environmental Planning and Management. 2006;49(1):41-58.
4. Soulé ME, Terborgh JW. Continental conservation: scientific foundations of regional reserve networks. Island
Press; 1999.
5. GoN. Summary Report : Status of Tiger and Prey-Base Population in Nepal. Kathmandu, Nepal., Department of
National Parks and Soil Conservation DoF;2013 2013.
6. Thapa K, Nepal S, Thapa G, Bhatta SR, Wikramanayake E. Past, present and future conservation of the greater
one-horned rhinoceros Rhinoceros unicornis in Nepal. Oryx. 2013;47(03):345-51.
7. GoN. Elephant Conservation Action Plan for Nepal., Department of National Parks and Soil Conservation
DoF;2009.
8. Simberloff D. Flagships, umbrellas, and keystones: Is single-species management passé in the landscape era?
Biological conservation. 1998;83(3):247-57. doi:http://dx.doi.org/10.1016/S0006-3207(97)00081-5.
9. Forrest JL, Wikramanayake E, Shrestha R, Areendran G, Gyeltshen K, Maheshwari A et al. Conservation and
climate change: Assessing the vulnerability of snow leopard habitat to treeline shift in the Himalaya. Biological
Conservation. 2012;150(1):129-35.
10. The IUCN Red List of Threatened Species. Version 2013.1 http://www.iucnredlist.org. Downloaded on 24
September 2013. [database on the Internet]2013. Accessed: 24 September 2013
11. Clucas B, McHugh K, Caro T. Flagship species on covers of US conservation and nature magazines. Biodiversity
and Conservation. 2008;17(6):1517-28.
12. Verissimo D, Pongiluppi T, Santos MC, Develey PF, Fraser I, Smith RJ et al. Using a Systematic Approach to
Select Flagship Species for Bird Conservation. Conservation biology : the journal of the Society for Conservation
Biology. 2013. doi:10.1111/cobi.12142.
13. Shrestha N. Protected wildlife species of Nepal: an introductory handbook. IUCN; 1997.
14. Smith JLD, Ahern SC, McDougal C. Landscape analysis of tiger distribution and habitat quality in Nepal.
Conservation Biology. 1998;12(6):1338-46.
15. Barber‐Meyer S, Jnawali S, Karki J, Khanal P, Lohani S, Long B et al. Influence of prey depletion and human
disturbance on tiger occupancy in Nepal. Journal of Zoology. 2013;289(1):10-8.
16. Odden M, Wegge P, Fredriksen T. Do tigers displace leopards? If so, why? Ecological research. 2010;25(4):875-
81.
17. Joshi AR, Garshelis DL, Smith JL. Home ranges of sloth bears in Nepal: implications for conservation. The
Journal of wildlife management. 1995:204-14.
18. Seidensticker J. On the ecological separation between tigers and leopards. Biotropica. 1976:225-34.
19. Thapa K, Kelly MJ, Karki JB, Sub‐edi N. Distribution update. 2013.
20. Jackson R, Ahlborn G. Snow leopards (Panthera uncia) in Nepal: home range and movements. National
Geographic Research. 1989;5(2):161-75.
21. Mishra C, Allen P, McCarthy T, Madhusudan M, Bayarjargal A, Prins HH. The role of incentive programs in
conserving the snow leopard. Conservation Biology. 2003;17(6):1512-20.
22. Namgail T, Fox JL, Bhatnagar YV. Carnivore-caused livestock mortality in Trans-Himalaya. Environmental
management. 2007;39(4):490-6. doi:10.1007/s00267-005-0178-2.
23. Subedi N, Jnawali SR, Dhakal M, Pradhan N, Lamichhane BR, Malla S et al. Population status, structure and
distribution of the greater one-horned rhinoceros Rhinoceros unicornis in Nepal. Oryx. 2013;47(03):352-60.
24. Karki JB, Pandav B, Jnawali SR, Shrestha R, Pradhan NMB, Lamichane BR et al. Estimating the abundance of
Nepal's largest population of tigers Panthera tigris. Oryx. 2013;FirstView:1-7. doi:doi:10.1017/S0030605313000471.
25. Kelly MJ, Betsch J, Wultsch C, Mesa B, Mills LS. Noninvasive sampling for carnivores. Carnivore ecology and
conservation: a hand-book of techniques Oxford University Press, Oxford. 2012:47-67.
26. Reed J, Tollit D, Thompson P, Amos W. Molecular scatology: the use of molecular genetic analysis to assign
species, sex and individual identity to seal faeces. Molecular ecology. 1997;6(3):225-34.
27. Waits LP, Paetkau D. Noninvasive genetic sampling tools for wildlife biologists: a review of applications and
recommendations for accurate data collection. Journal of Wildlife Management. 2005;69(4):1419-33.
28. Karmacharya DB, Thapa K, Shrestha R, Dhakal M, Janecka JE. Noninvasive genetic population survey of snow
leopards (Panthera uncia) in Kangchenjunga conservation area, Shey Phoksundo National Park and surrounding
buffer zones of Nepal. BMC research notes. 2011;4:516. doi:10.1186/1756-0500-4-516.
29. Janečka J, Jackson R, Yuquang Z, Diqiang L, Munkhtsog B, Buckley‐Beason V et al. Population monitoring of
snow leopards using noninvasive collection of scat samples: a pilot study. Animal Conservation. 2008;11(5):401-11.
30. Spiering PA, Gunther MS, Wildt DE, Somers MJ, Maldonado JE. Sampling error in non-invasive genetic
analyses of an endangered social carnivore. Conservation Genetics. 2009;10(6):2005-7.
31. Fernandes CA, Ginja C, Pereira I, Tenreiro R, Bruford MW, Santos-Reis M. Species-specific mitochondrial DNA
markers for identification of non-invasive samples from sympatric carnivores in the Iberian Peninsula. Conservation
genetics. 2008;9(3):681-90.
32. Kurose N, Masuda R, Tatara M. Fecal DNA analysis for identifying species and sex of sympatric carnivores: a
noninvasive method for conservation on the Tsushima Islands, Japan. The Journal of heredity. 2005;96(6):688-97.
doi:10.1093/jhered/esi124.
33. Nagata J, Aramilev VV, Belozor A, Sugimoto T, McCullough DR. Fecal genetic analysis using PCR-RFLP of
cytochrome b to identify sympatric carnivores, the tiger Panthera tigris and the leopard Panthera pardus, in far eastern
Russia. Conservation Genetics. 2005;6(5):863-6.
34. Oliveira R, Castro D, Godinho R, Luikart G, Alves P. Species identification using a small nuclear gene fragment:
application to sympatric wild carnivores from South-western Europe. Conservation Genetics. 2010;11(3):1023-32.
35. Baselga A, Fujisawa T, Crampton-Platt A, Bergsten J, Foster PG, Monaghan MT et al. Whole-community DNA
barcoding reveals a spatio-temporal continuum of biodiversity at species and genetic levels. Nature communications.
2013;4:1892. doi:10.1038/ncomms2881.
36. NTGP/CMDN. Nepal Tiger Genome Project - Final Report 2014, Center for Molecular Dynamics-Nepal: Center
for Molecular Dynamics-Nepal2014.
37. Davison A, Birks JDS, Brookes RC, Braithwaite TC, Messenger JE. On the origin of faeces: morphological
versus molecular methods for surveying rare carnivores from their scats. Journal of Zoology. 2002;257(2):141-3.
doi:10.1017/s0952836902000730.
38. Farrell LE, Roman J, Sunquist ME. Dietary separation of sympatric carnivores identified by molecular analysis of
scats. Mol Ecol. 2000;9(10):1583-90. doi:10.1046/j.1365-294x.2000.01037.x.
39. Palomares F, Godoy JA, Piriz A, O'Brien SJ. Faecal genetic analysis to determine the presence and distribution of
elusive carnivores: design and feasibility for the Iberian lynx. Mol Ecol. 2002;11(10):2171-82.
40. Cossíos ED, Madrid A, Condori JL, Fajardo U. Update on the distribution of the Andean cat Oreailurus jacobita
and the pampas cat Lynchailurus colocolo in Peru. 2007.
41. Sugimoto T, Nagata J, Aramilev VV, McCullough DR. Population size estimation of Amur tigers in Russian Far
East using noninvasive genetic samples. Journal of Mammalogy. 2012;93(1):93-101. doi:10.1644/10-mamm-a-368.1.
42. Perez I, Geffen E, Mokady O. Critically Endangered Arabian leopards Panthera pardus nimr in Israel: estimating
population parameters using molecular scatology. Oryx. 2006;40(03):295-301. doi:doi:10.1017/S0030605306000846.
43. Mondol S, Ullas Karanth K, Samba Kumar N, Gopalaswamy AM, Andheria A, Ramakrishnan U. Evaluation of
non-invasive genetic sampling methods for estimating tiger population size. Biological Conservation.
2009;142(10):2350-60.
44. Borthakur U, Barman RD, Das C, Basumatary A, Talukdar A, Ahmed MF et al. Noninvasive genetic monitoring
of tiger (Panthera tigris tigris) population of Orang National Park in the Brahmaputra floodplain, Assam, India.
European Journal of Wildlife Research. 2011;57(3):603-13.
45. Janecka JE, Munkhtsog B, Jackson RM, Naranbaatar G, Mallon DP, Murphy WJ. Comparison of noninvasive
genetic and camera-trapping techniques for surveying snow leopards. Journal of Mammalogy. 2011;92(4):771-83.
46. Madden T. The BLAST sequence analysis tool. The NCBI Handbook [Internet] National Library of Medicine
(US), National Center for Biotechnology Information, Bethesda, MD. 2002.
47. Alacs EA, Georges A, FitzSimmons NN, Robertson J. DNA detective: a review of molecular approaches to
wildlife forensics. Forensic science, medicine, and pathology. 2010;6(3):180-94. doi:10.1007/s12024-009-9131-7.
48. Jnawali S, Baral H, Lee S, Acharya K, Upadhyay G, Pandey M et al. The Status of Nepal Mammals: The National
Red List Series, Department of National Parks and Wildlife Conservation Kathmandu, Nepal. Preface by Simon M
Stuart Chair IUCN Species Survival Commission The Status of Nepal‘s Mammals: The National Red List Series.
2011:4.
49. Gompper ME, Vanak AT. Vulpes bengalensis. Mammalian Species. 2006:1-5.
50. NPWCA. National Parks and Wildlife Conservation Act. 1973. National Parks and Wildlife Conservation Act
2029. Government of Nepal.1973.
51. Mohamed A, Sollmann R, Bernard H, Ambu LN, Lagan P, Mannan S et al. Density and habitat use of the leopard
cat (Prionailurus bengalensis) in three commercial forest reserves in Sabah, Malaysian Borneo. Journal of
Mammalogy. 2013;94(1):82-9.
52. Thapa K, Pradhan N, Barker J, Dhakal M, Bhandari A, Gurung G et al. High elevation record of a leopard cat in
the Kangchenjunga Conservation Area, Nepal. Cat News. 2013;58:26-7.
53. Chetri M, Jhala YV, Jnawali SR, Subedi N, Dhakal M, Yumnam B. Ancient Himalayan wolf (Canis lupus
chanco) lineage in Upper Mustang of the Annapurna Conservation Area, Nepal. ZooKeys. 2016(582):143.
54. Aggarwal RK, Kivisild T, Ramadevi J, Singh L. Mitochondrial DNA coding region sequences support the
phylogenetic distinction of two Indian wolf species. Journal of Zoological Systematics and Evolutionary Research.
2007;45(2):163-72.
55. Sharma DK, Maldonado JE, Jhala YV, Fleischer RC. Ancient wolf lineages in India. Proceedings of the Royal
Society of London B: Biological Sciences. 2004;271(Suppl 3):S1-S4.
56. Barja I, de Miguel FJ, Bárcena F. The importance of crossroads in faecal marking behaviour of the wolves (Canis
lupus). Naturwissenschaften. 2004;91(10):489-92.
57. Barja I, de Miguel FJ, Bárcena F. Faecal marking behaviour of Iberian wolf in different zones of their territory.
Folia Zoologica. 2005;54(1/2):21.
58. Piñeiro A, Barja I. The plant physical features selected by wildcats as signal posts: an economic approach to fecal
marking. Naturwissenschaften. 2012;99(10):801-9.
59. Piñeiro A, Barja I. Evaluating the function of wildcat faecal marks in relation to the defence of favourable hunting
areas. Ethology Ecology & Evolution. 2015;27(2):161-72.
60. Lamichhane B, Dhakal M, Subedi N, Pokheral C. Clouded leopard co-exist with other five felids in Chitwan
National Park, Nepal. Cat News. 2014;61:30-2.
61. Jha S. Status and conservation of lowland Terai wetlands in Nepal. Our Nature. 2009;6(1):67-77.
62. Taylor IR, Baral HS, Pandey P, Kaspal P. The conservation status of the Fishing Cat Prionailurus viverrinus
Bennett, 1833 (Carnivora: Felidae) In Koshi Tappu Wildlife Reserve, Nepal. Journal of Threatened Taxa.
2016;8(1):8323-32.
63. Mukherjee S, Appel, A., Duckworth, J.W., Sanderson, J., Dahal, S., Willcox, D.H.A., Herranz Muñoz, V., Malla,
G., Ratnayaka, A., Kantimahanti, M., Thudugala, A., Thaung R. & Rahman, H. . Prionailurus viverrinus. The IUCN
Red List of Threatened Species 2016: e.T18150A50662615. Downloaded on 15 February 2017. 2016.
64. Dahal S, Baral S, Nepal M, Neupane KR, Dahal BV, Kathmandu B. Status of Fishing Cat in Jagadishpur
Reservoir and Ghodaghodi Lake and assessment of threat. 2014.
65. Andelman SJ, Fagan WF. Umbrellas and flagships: efficient conservation surrogates or expensive mistakes?
Proceedings of the National Academy of Sciences of the United States of America. 2000;97(11):5954-9.
doi:10.1073/pnas.100126797.
66. Bhagavatula J, Singh L. Genotyping faecal samples of Bengal tiger Panthera tigris tigris for population
estimation: a pilot study. BMC genetics. 2006;7(1):48.
67. Janecka JE, Jackson R, Munkhtsog B, Murphy WJ. Characterization of 9 microsatellites and primers in snow
leopards and a species-specific PCR assay for identifying noninvasive samples. Conservation Genetics Resources.
2014;6(2):369-73.
68. Mondol S, Navya R, Athreya V, Sunagar K, Selvaraj V, Ramakrishnan U. A panel of microsatellites to
individually identify leopards and its application to leopard monitoring in human dominated landscapes. BMC
genetics. 2009;10(1):79.
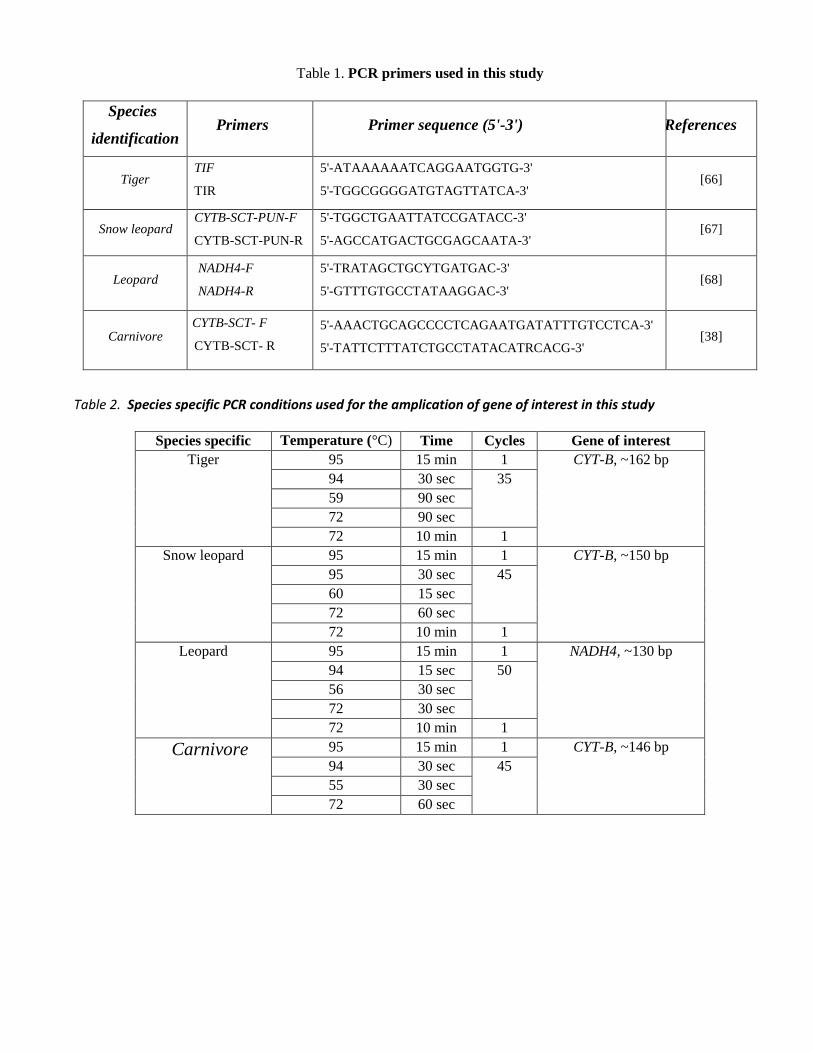
Table 1. PCR primers used in this study
Species
identification Primers Primer sequence (5'-3') References
Tiger TIF
TIR
5'-ATAAAAAATCAGGAATGGTG-3'
5'-TGGCGGGGATGTAGTTATCA-3' [66]
Snow leopard CYTB-SCT-PUN-F
CYTB-SCT-PUN-R
5'-TGGCTGAATTATCCGATACC-3'
5'-AGCCATGACTGCGAGCAATA-3' [67]
Leopard NADH4-F
NADH4-R
5'-TRATAGCTGCYTGATGAC-3'
5'-GTTTGTGCCTATAAGGAC-3' [68]
Carnivore CYTB-SCT- F
CYTB-SCT- R
5'-AAACTGCAGCCCCTCAGAATGATATTTGTCCTCA-3'
5'-TATTCTTTATCTGCCTATACATRCACG-3' [38]
Table 2. Species specific PCR conditions used for the amplication of gene of interest in this study
Species specific
PCR
Temperature (°C) Time Cycles Gene of interest
(Amplicon size) Tiger 95 15 min 1 CYT-B, ~162 bp
94 30 sec 35
59 90 sec
72 90 sec
72 10 min 1
Snow leopard 95 15 min 1 CYT-B, ~150 bp
95 30 sec 45
60 15 sec
72 60 sec
72 10 min 1
Leopard 95 15 min 1 NADH4, ~130 bp
94 15 sec 50
56 30 sec
72 30 sec
72 10 min 1
Carnivore 95 15 min 1 CYT-B, ~146 bp
94 30 sec 45
55 30 sec
72 60 sec
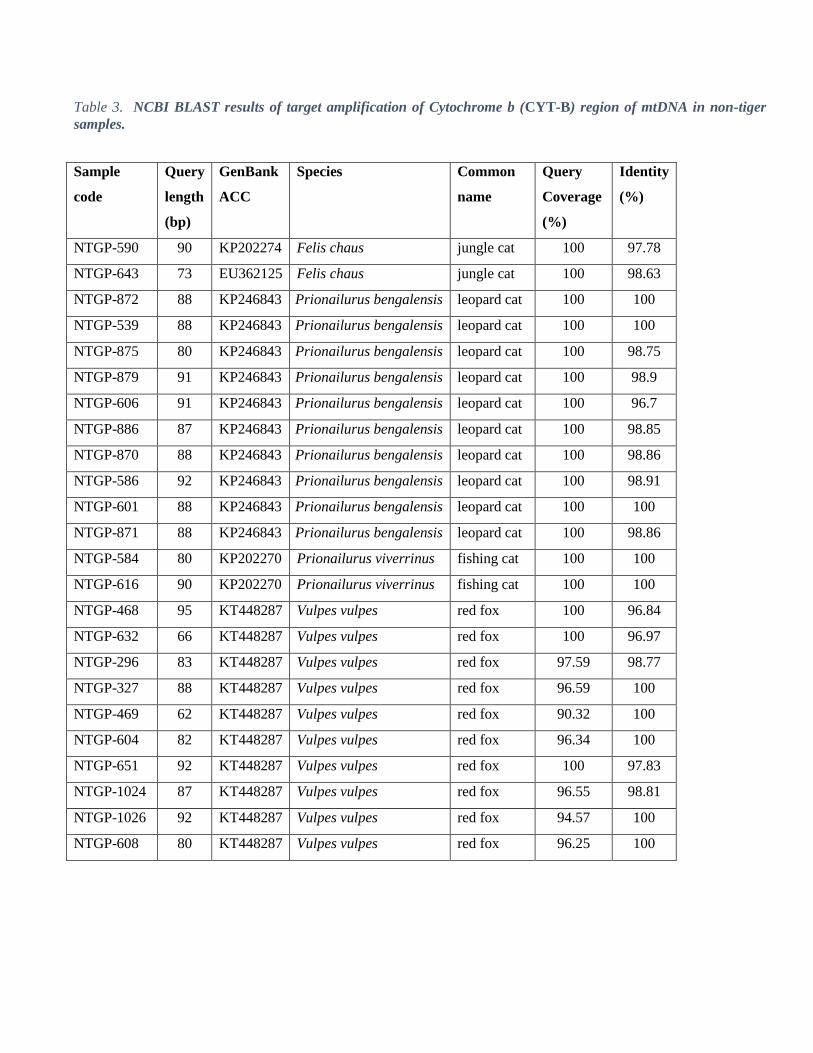
Table 3. NCBI BLAST results of target amplification of Cytochrome b (CYT-B) region of mtDNA in non-tiger
samples.
Sample
code
Query
length
(bp)
GenBank
ACC
Species Common
name
Query
Coverage
(%)
Identity
(%)
NTGP-590 90 KP202274 Felis chaus jungle cat 100 97.78
NTGP-643 73 EU362125 Felis chaus jungle cat 100 98.63
NTGP-872 88 KP246843 Prionailurus bengalensis leopard cat 100 100
NTGP-539 88 KP246843 Prionailurus bengalensis leopard cat 100 100
NTGP-875 80 KP246843 Prionailurus bengalensis leopard cat 100 98.75
NTGP-879 91 KP246843 Prionailurus bengalensis leopard cat 100 98.9
NTGP-606 91 KP246843 Prionailurus bengalensis leopard cat 100 96.7
NTGP-886 87 KP246843 Prionailurus bengalensis leopard cat 100 98.85
NTGP-870 88 KP246843 Prionailurus bengalensis leopard cat 100 98.86
NTGP-586 92 KP246843 Prionailurus bengalensis leopard cat 100 98.91
NTGP-601 88 KP246843 Prionailurus bengalensis leopard cat 100 100
NTGP-871 88 KP246843 Prionailurus bengalensis leopard cat 100 98.86
NTGP-584 80 KP202270 Prionailurus viverrinus fishing cat 100 100
NTGP-616 90 KP202270 Prionailurus viverrinus fishing cat 100 100
NTGP-468 95 KT448287 Vulpes vulpes red fox 100 96.84
NTGP-632 66 KT448287 Vulpes vulpes red fox 100 96.97
NTGP-296 83 KT448287 Vulpes vulpes red fox 97.59 98.77
NTGP-327 88 KT448287 Vulpes vulpes red fox 96.59 100
NTGP-469 62 KT448287 Vulpes vulpes red fox 90.32 100
NTGP-604 82 KT448287 Vulpes vulpes red fox 96.34 100
NTGP-651 92 KT448287 Vulpes vulpes red fox 100 97.83
NTGP-1024 87 KT448287 Vulpes vulpes red fox 96.55 98.81
NTGP-1026 92 KT448287 Vulpes vulpes red fox 94.57 100
NTGP-608 80 KT448287 Vulpes vulpes red fox 96.25 100
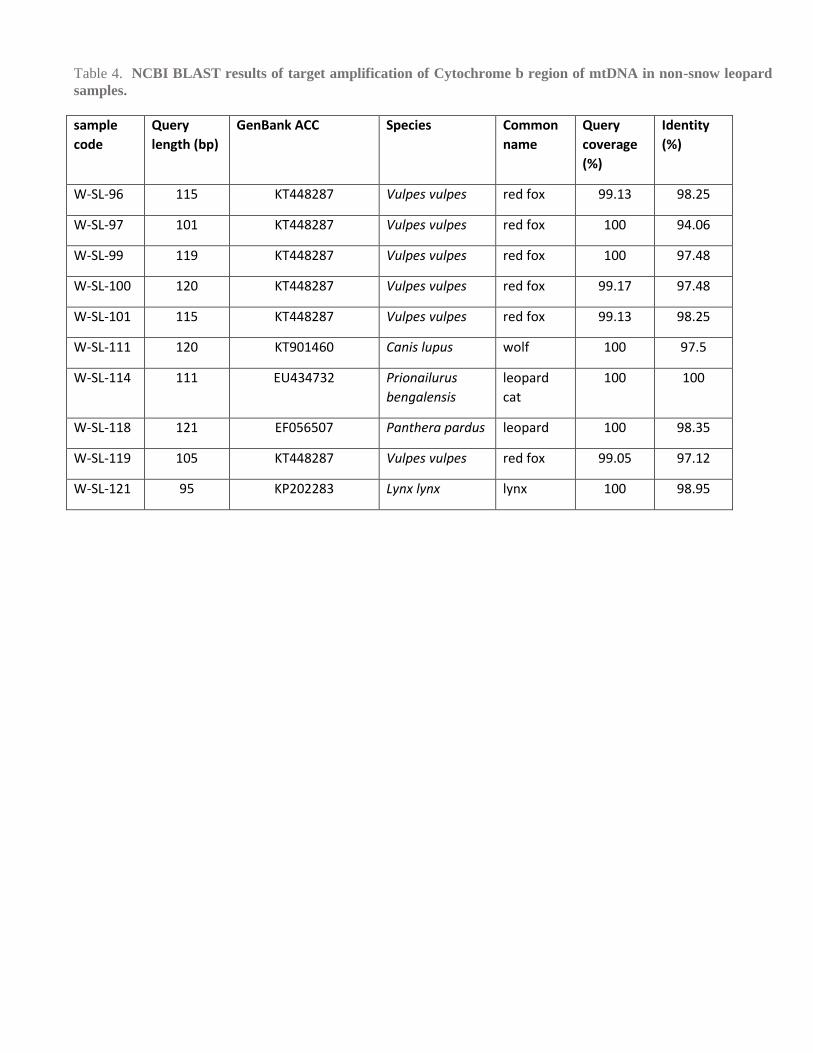
Table 4. NCBI BLAST results of target amplification of Cytochrome b region of mtDNA in non-snow leopard
samples.
sample
code
Query
length (bp)
GenBank ACC Species Common
name
Query
coverage
(%)
Identity
(%)
W-SL-96 115 KT448287 Vulpes vulpes red fox 99.13 98.25
W-SL-97 101 KT448287 Vulpes vulpes red fox 100 94.06
W-SL-99 119 KT448287 Vulpes vulpes red fox 100 97.48
W-SL-100 120 KT448287 Vulpes vulpes red fox 99.17 97.48
W-SL-101 115 KT448287 Vulpes vulpes red fox 99.13 98.25
W-SL-111 120 KT901460 Canis lupus wolf 100 97.5
W-SL-114 111 EU434732 Prionailurus
bengalensis
leopard
cat
100 100
W-SL-118 121 EF056507 Panthera pardus leopard 100 98.35
W-SL-119 105 KT448287 Vulpes vulpes red fox 99.05 97.12
W-SL-121 95 KP202283 Lynx lynx lynx 100 98.95
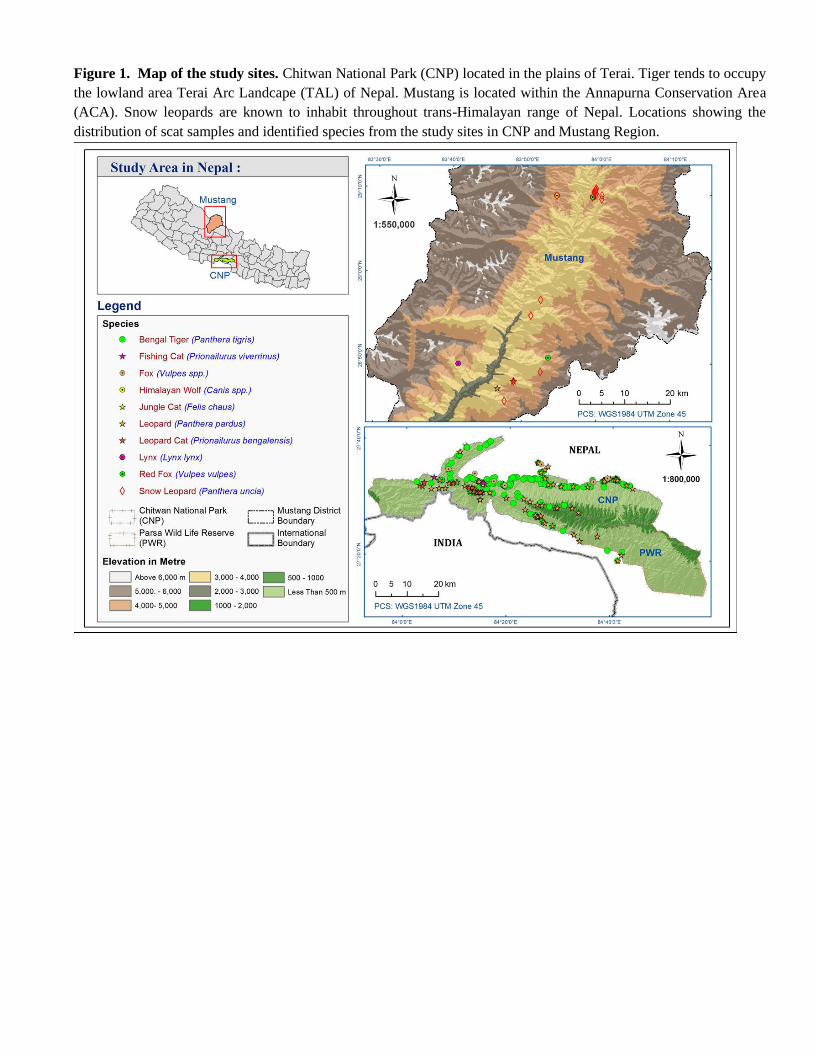
Figure 1. Map of the study sites. Chitwan National Park (CNP) located in the plains of Terai. Tiger tends to occupy
the lowland area Terai Arc Landcape (TAL) of Nepal. Mustang is located within the Annapurna Conservation Area
(ACA). Snow leopards are known to inhabit throughout trans-Himalayan range of Nepal. Locations showing the
distribution of scat samples and identified species from the study sites in CNP and Mustang Region.
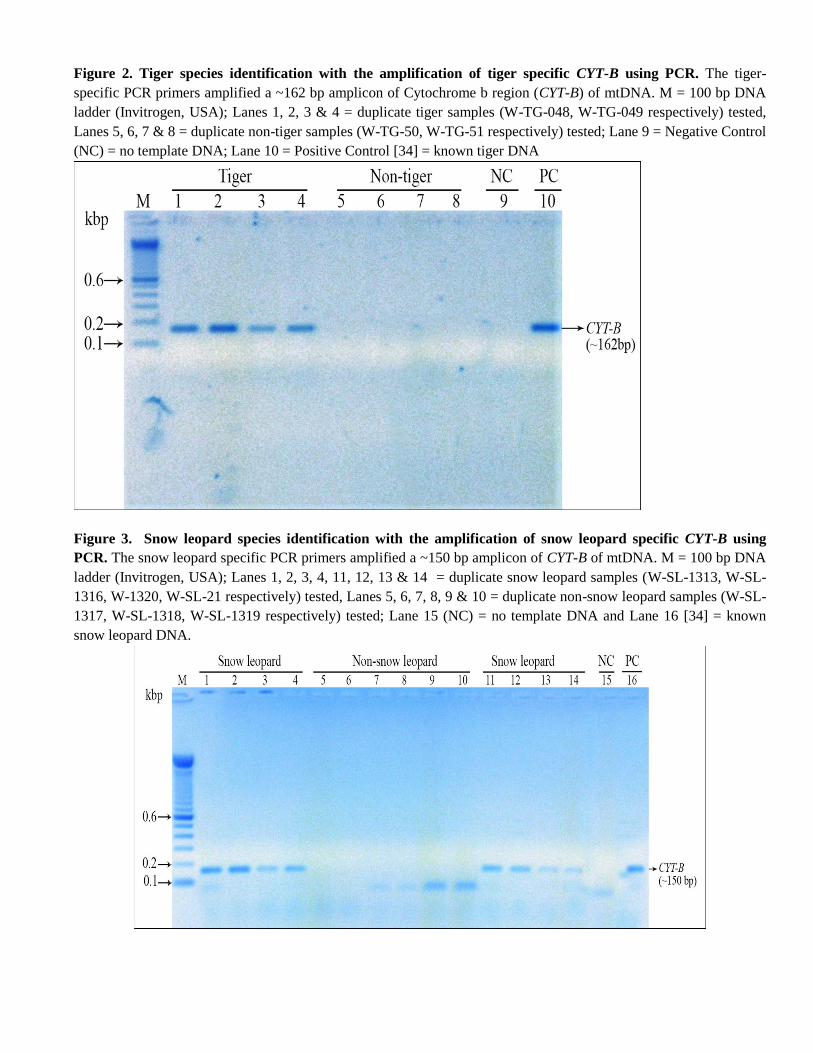
Figure 2. Tiger species identification with the amplification of tiger specific CYT-B using PCR. The tiger-
specific PCR primers amplified a ~162 bp amplicon of Cytochrome b region (CYT-B) of mtDNA. M = 100 bp DNA
ladder (Invitrogen, USA); Lanes 1, 2, 3 & 4 = duplicate tiger samples (W-TG-048, W-TG-049 respectively) tested,
Lanes 5, 6, 7 & 8 = duplicate non-tiger samples (W-TG-50, W-TG-51 respectively) tested; Lane 9 = Negative Control
(NC) = no template DNA; Lane 10 = Positive Control [34] = known tiger DNA
Figure 3. Snow leopard species identification with the amplification of snow leopard specific CYT-B using
PCR. The snow leopard specific PCR primers amplified a ~150 bp amplicon of CYT-B of mtDNA. M = 100 bp DNA
ladder (Invitrogen, USA); Lanes 1, 2, 3, 4, 11, 12, 13 & 14 = duplicate snow leopard samples (W-SL-1313, W-SL-
1316, W-1320, W-SL-21 respectively) tested, Lanes 5, 6, 7, 8, 9 & 10 = duplicate non-snow leopard samples (W-SL-
1317, W-SL-1318, W-SL-1319 respectively) tested; Lane 15 (NC) = no template DNA and Lane 16 [34] = known
snow leopard DNA.
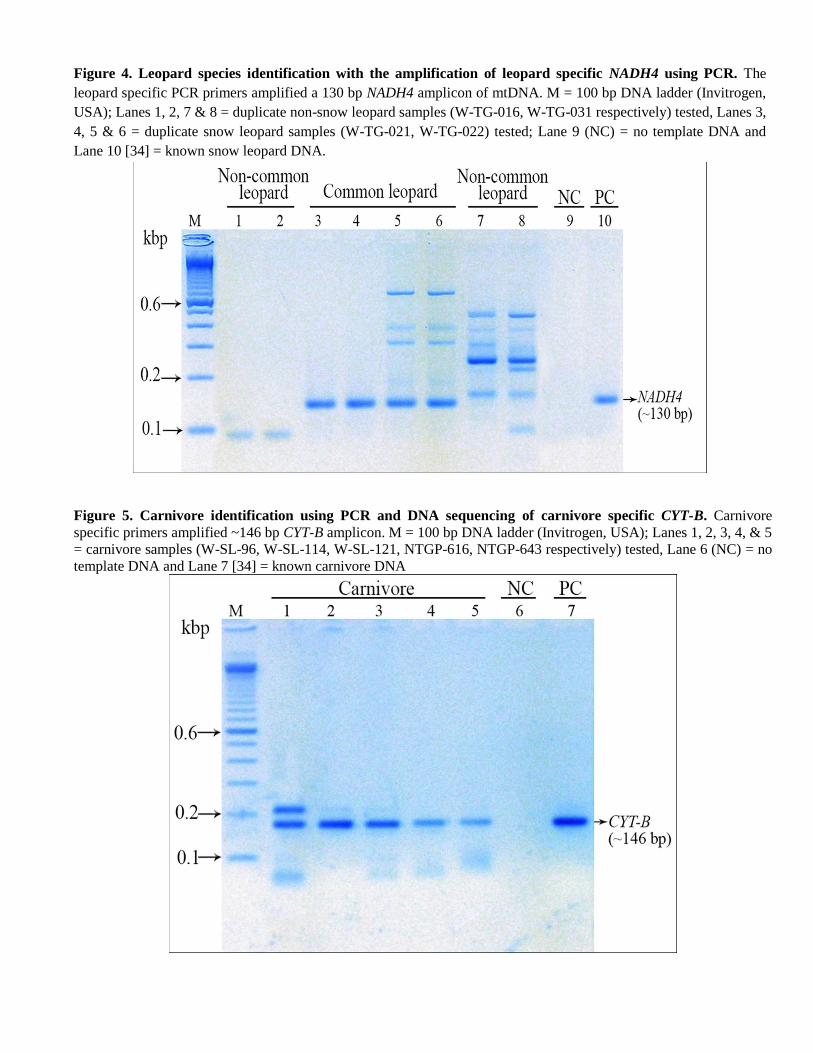
Figure 4. Leopard species identification with the amplification of leopard specific NADH4 using PCR. The
leopard specific PCR primers amplified a 130 bp NADH4 amplicon of mtDNA. M = 100 bp DNA ladder (Invitrogen,
USA); Lanes 1, 2, 7 & 8 = duplicate non-snow leopard samples (W-TG-016, W-TG-031 respectively) tested, Lanes 3,
4, 5 & 6 = duplicate snow leopard samples (W-TG-021, W-TG-022) tested; Lane 9 (NC) = no template DNA and
Lane 10 [34] = known snow leopard DNA.
Figure 5. Carnivore identification using PCR and DNA sequencing of carnivore specific CYT-B. Carnivore
specific primers amplified ~146 bp CYT-B amplicon. M = 100 bp DNA ladder (Invitrogen, USA); Lanes 1, 2, 3, 4, & 5
= carnivore samples (W-SL-96, W-SL-114, W-SL-121, NTGP-616, NTGP-643 respectively) tested, Lane 6 (NC) = no
template DNA and Lane 7 [34] = known carnivore DNA
CHAPTER IV
Assessment of genetic diversity, population structure, and gene flow of tigers (Panthera tigris tigris) across
Nepal's Terai Arc Landscape
Short Title:
Genetic diversity assessment of tigers in Nepal
Kanchan Thapa1, #a¶
, Sulochana Manandhar2, Manisha Bista
2, Jivan Shakya
2, Govind Sah
2, Maheshwar Dhakal
3, Netra
Sharma4, Bronwyn Llewellyn
4, Claudia Wultsch
5, Lisette P. Waits
6, Marcella J. Kelly
1, Jean-Marc Hero
7, Jane
Hughes7, Dibesh Karmacharya
2,7¶*
1Department of Fish and Wildlife Conservation, Virginia Tech, Blacksburg, Virginia, USA
#a Current address: Conservation Science Unit, WWF Nepal, Kathmandu, Nepal
2Center for Molecular Dynamics Nepal, Thapathali-11, Kathmandu, Nepal
3Department of National Parks and Wildlife Conservation, Kathmandu, Nepal
4Environment Team, U.S. Agency for International Development, Kathmandu, Nepal
5 American Natural History Museum, New York City, New York, USA
6Department of Fish and Wildlife Sciences, University of Idaho, Moscow, USA
7School of Environment, Griffith University, Queensland, Australia
* Corresponding author
E-mail:[email protected] (DK)
¶ This author contributed equally to this work
[This article has been accepted in the journal PLOS One, and will be published on March 21, 2018]
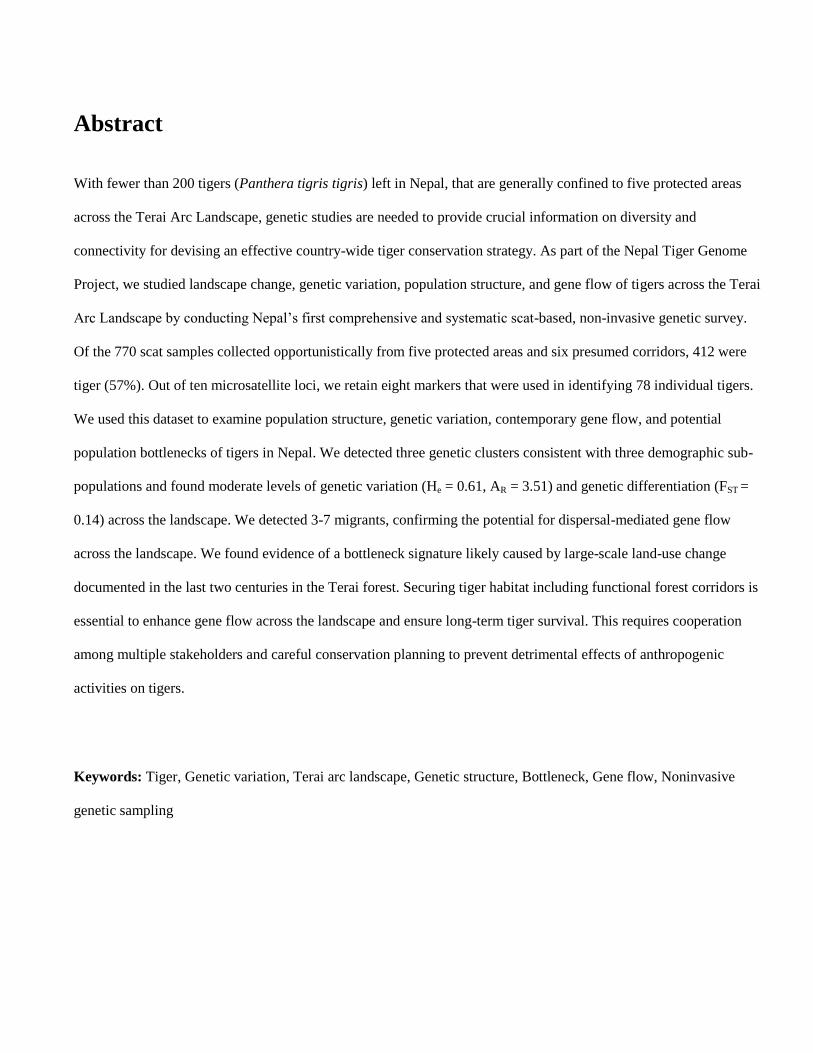
Abstract
With fewer than 200 tigers (Panthera tigris tigris) left in Nepal, that are generally confined to five protected areas
across the Terai Arc Landscape, genetic studies are needed to provide crucial information on diversity and
connectivity for devising an effective country-wide tiger conservation strategy. As part of the Nepal Tiger Genome
Project, we studied landscape change, genetic variation, population structure, and gene flow of tigers across the Terai
Arc Landscape by conducting Nepal‘s first comprehensive and systematic scat-based, non-invasive genetic survey.
Of the 770 scat samples collected opportunistically from five protected areas and six presumed corridors, 412 were
tiger (57%). Out of ten microsatellite loci, we retain eight markers that were used in identifying 78 individual tigers.
We used this dataset to examine population structure, genetic variation, contemporary gene flow, and potential
population bottlenecks of tigers in Nepal. We detected three genetic clusters consistent with three demographic sub-
populations and found moderate levels of genetic variation (He = 0.61, AR = 3.51) and genetic differentiation (FST =
0.14) across the landscape. We detected 3-7 migrants, confirming the potential for dispersal-mediated gene flow
across the landscape. We found evidence of a bottleneck signature likely caused by large-scale land-use change
documented in the last two centuries in the Terai forest. Securing tiger habitat including functional forest corridors is
essential to enhance gene flow across the landscape and ensure long-term tiger survival. This requires cooperation
among multiple stakeholders and careful conservation planning to prevent detrimental effects of anthropogenic
activities on tigers.
Keywords: Tiger, Genetic variation, Terai arc landscape, Genetic structure, Bottleneck, Gene flow, Noninvasive
genetic sampling
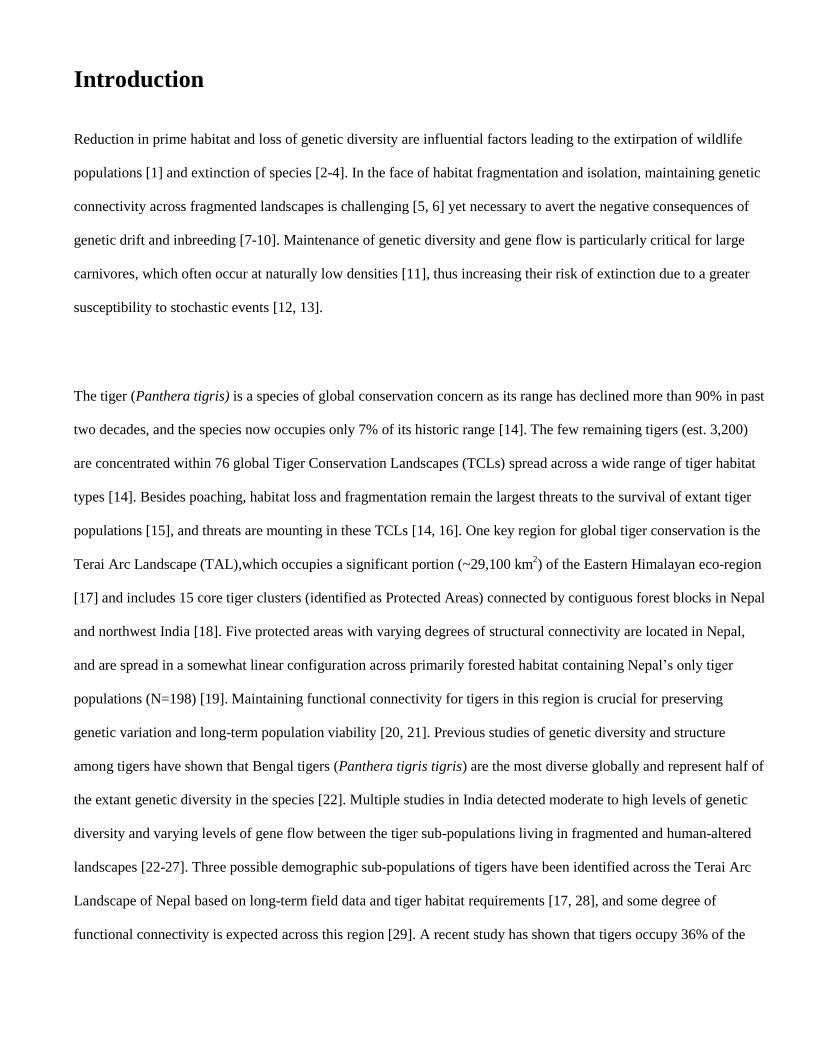
Introduction
Reduction in prime habitat and loss of genetic diversity are influential factors leading to the extirpation of wildlife
populations [1] and extinction of species [2-4]. In the face of habitat fragmentation and isolation, maintaining genetic
connectivity across fragmented landscapes is challenging [5, 6] yet necessary to avert the negative consequences of
genetic drift and inbreeding [7-10]. Maintenance of genetic diversity and gene flow is particularly critical for large
carnivores, which often occur at naturally low densities [11], thus increasing their risk of extinction due to a greater
susceptibility to stochastic events [12, 13].
The tiger (Panthera tigris) is a species of global conservation concern as its range has declined more than 90% in past
two decades, and the species now occupies only 7% of its historic range [14]. The few remaining tigers (est. 3,200)
are concentrated within 76 global Tiger Conservation Landscapes (TCLs) spread across a wide range of tiger habitat
types [14]. Besides poaching, habitat loss and fragmentation remain the largest threats to the survival of extant tiger
populations [15], and threats are mounting in these TCLs [14, 16]. One key region for global tiger conservation is the
Terai Arc Landscape (TAL),which occupies a significant portion (~29,100 km2) of the Eastern Himalayan eco-region
[17] and includes 15 core tiger clusters (identified as Protected Areas) connected by contiguous forest blocks in Nepal
and northwest India [18]. Five protected areas with varying degrees of structural connectivity are located in Nepal,
and are spread in a somewhat linear configuration across primarily forested habitat containing Nepal‘s only tiger
populations (N=198) [19]. Maintaining functional connectivity for tigers in this region is crucial for preserving
genetic variation and long-term population viability [20, 21]. Previous studies of genetic diversity and structure
among tigers have shown that Bengal tigers (Panthera tigris tigris) are the most diverse globally and represent half of
the extant genetic diversity in the species [22]. Multiple studies in India detected moderate to high levels of genetic
diversity and varying levels of gene flow between the tiger sub-populations living in fragmented and human-altered
landscapes [22-27]. Three possible demographic sub-populations of tigers have been identified across the Terai Arc
Landscape of Nepal based on long-term field data and tiger habitat requirements [17, 28], and some degree of
functional connectivity is expected across this region [29]. A recent study has shown that tigers occupy 36% of the
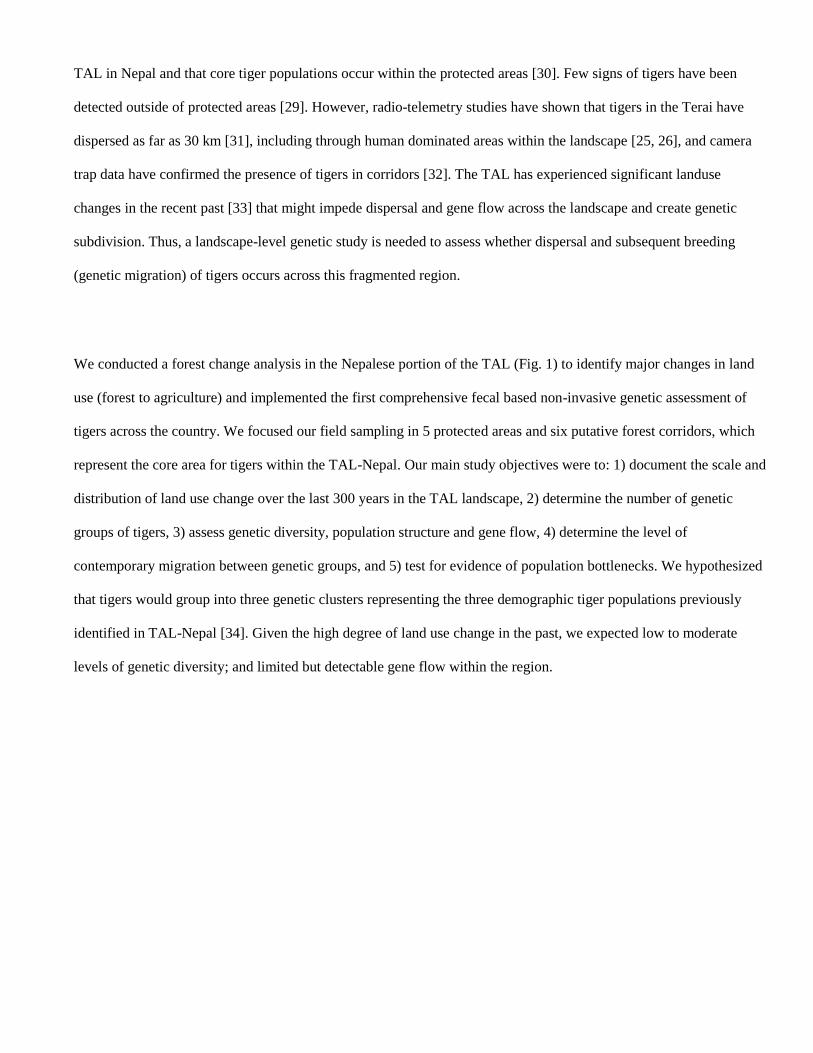
TAL in Nepal and that core tiger populations occur within the protected areas [30]. Few signs of tigers have been
detected outside of protected areas [29]. However, radio-telemetry studies have shown that tigers in the Terai have
dispersed as far as 30 km [31], including through human dominated areas within the landscape [25, 26], and camera
trap data have confirmed the presence of tigers in corridors [32]. The TAL has experienced significant landuse
changes in the recent past [33] that might impede dispersal and gene flow across the landscape and create genetic
subdivision. Thus, a landscape-level genetic study is needed to assess whether dispersal and subsequent breeding
(genetic migration) of tigers occurs across this fragmented region.
We conducted a forest change analysis in the Nepalese portion of the TAL (Fig. 1) to identify major changes in land
use (forest to agriculture) and implemented the first comprehensive fecal based non-invasive genetic assessment of
tigers across the country. We focused our field sampling in 5 protected areas and six putative forest corridors, which
represent the core area for tigers within the TAL-Nepal. Our main study objectives were to: 1) document the scale and
distribution of land use change over the last 300 years in the TAL landscape, 2) determine the number of genetic
groups of tigers, 3) assess genetic diversity, population structure and gene flow, 4) determine the level of
contemporary migration between genetic groups, and 5) test for evidence of population bottlenecks. We hypothesized
that tigers would group into three genetic clusters representing the three demographic tiger populations previously
identified in TAL-Nepal [34]. Given the high degree of land use change in the past, we expected low to moderate
levels of genetic diversity; and limited but detectable gene flow within the region.
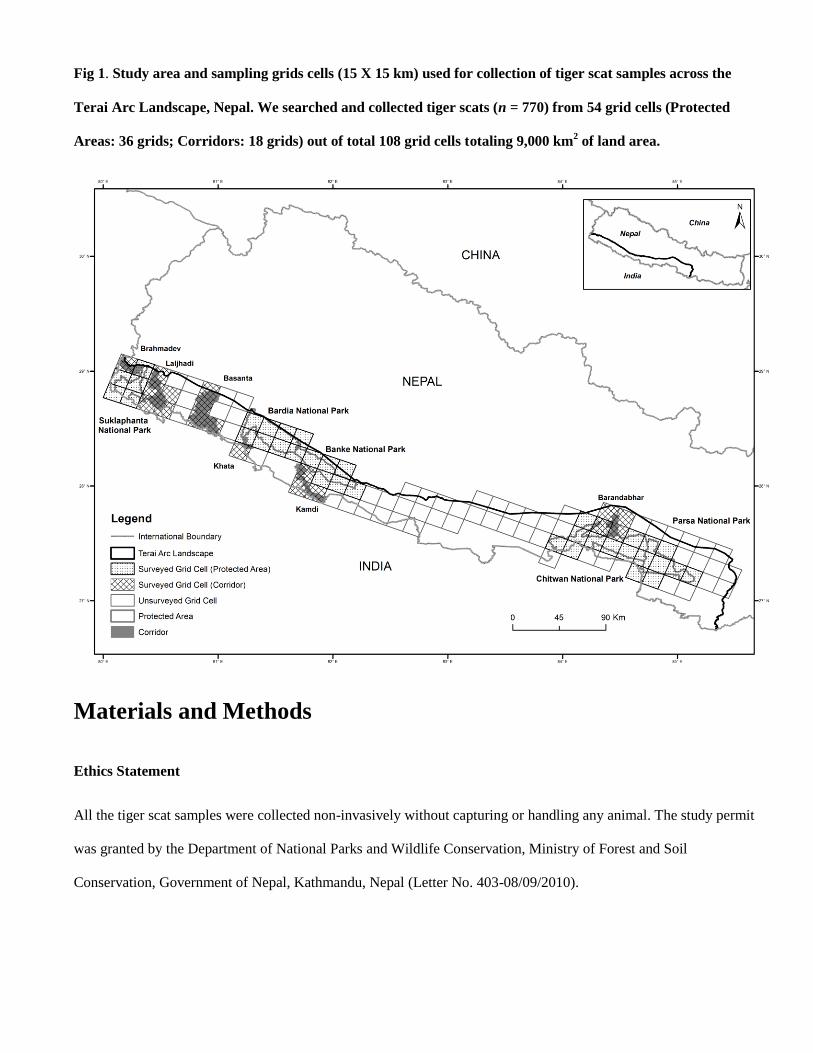
Fig 1. Study area and sampling grids cells (15 X 15 km) used for collection of tiger scat samples across the
Terai Arc Landscape, Nepal. We searched and collected tiger scats (n = 770) from 54 grid cells (Protected
Areas: 36 grids; Corridors: 18 grids) out of total 108 grid cells totaling 9,000 km2 of land area.
Materials and Methods
Ethics Statement
All the tiger scat samples were collected non-invasively without capturing or handling any animal. The study permit
was granted by the Department of National Parks and Wildlife Conservation, Ministry of Forest and Soil
Conservation, Government of Nepal, Kathmandu, Nepal (Letter No. 403-08/09/2010).
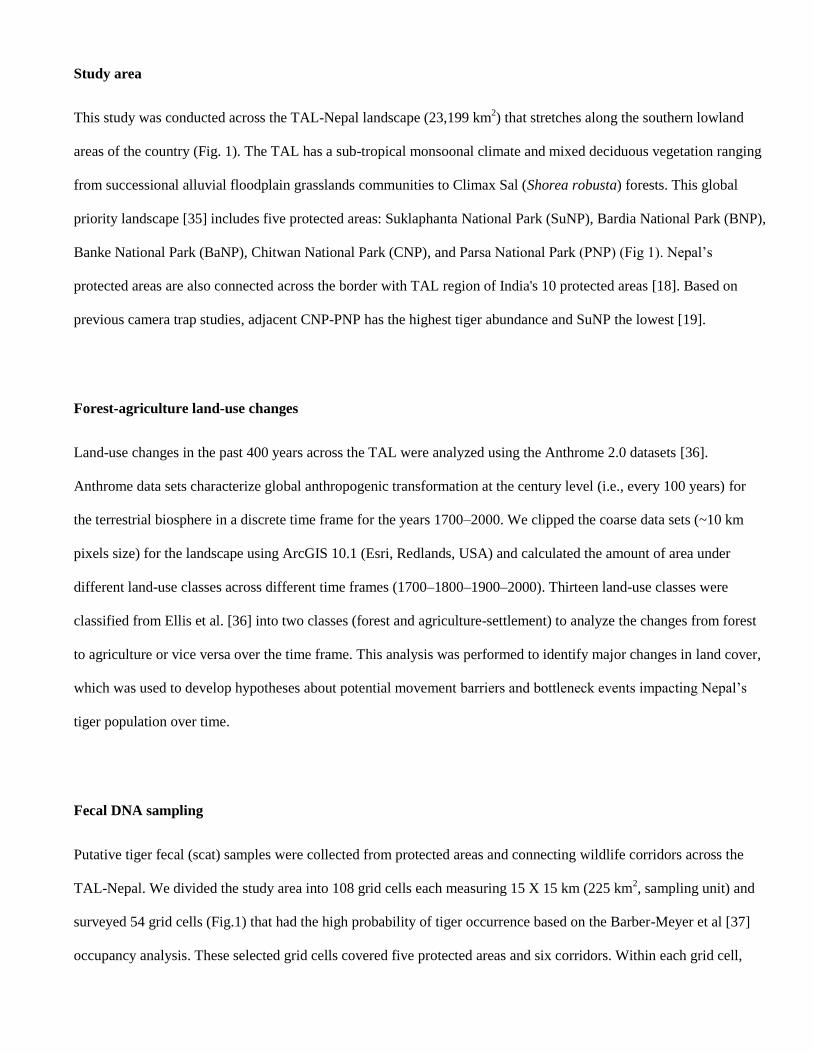
Study area
This study was conducted across the TAL-Nepal landscape (23,199 km2) that stretches along the southern lowland
areas of the country (Fig. 1). The TAL has a sub-tropical monsoonal climate and mixed deciduous vegetation ranging
from successional alluvial floodplain grasslands communities to Climax Sal (Shorea robusta) forests. This global
priority landscape [35] includes five protected areas: Suklaphanta National Park (SuNP), Bardia National Park (BNP),
Banke National Park (BaNP), Chitwan National Park (CNP), and Parsa National Park (PNP) (Fig 1). Nepal‘s
protected areas are also connected across the border with TAL region of India's 10 protected areas [18]. Based on
previous camera trap studies, adjacent CNP-PNP has the highest tiger abundance and SuNP the lowest [19].
Forest-agriculture land-use changes
Land-use changes in the past 400 years across the TAL were analyzed using the Anthrome 2.0 datasets [36].
Anthrome data sets characterize global anthropogenic transformation at the century level (i.e., every 100 years) for
the terrestrial biosphere in a discrete time frame for the years 1700–2000. We clipped the coarse data sets (~10 km
pixels size) for the landscape using ArcGIS 10.1 (Esri, Redlands, USA) and calculated the amount of area under
different land-use classes across different time frames (1700–1800–1900–2000). Thirteen land-use classes were
classified from Ellis et al. [36] into two classes (forest and agriculture-settlement) to analyze the changes from forest
to agriculture or vice versa over the time frame. This analysis was performed to identify major changes in land cover,
which was used to develop hypotheses about potential movement barriers and bottleneck events impacting Nepal‘s
tiger population over time.
Fecal DNA sampling
Putative tiger fecal (scat) samples were collected from protected areas and connecting wildlife corridors across the
TAL-Nepal. We divided the study area into 108 grid cells each measuring 15 X 15 km (225 km2, sampling unit) and
surveyed 54 grid cells (Fig.1) that had the high probability of tiger occurrence based on the Barber-Meyer et al [37]
occupancy analysis. These selected grid cells covered five protected areas and six corridors. Within each grid cell,
fecal samples were detected and collected during opportunistic field surveys. Field teams followed human trails, fire
lines, and animal trails. Fecal samples were field-identified based on their physical appearance and associated indirect
tiger signs like pugmarks and scratches [38].
A few grams from the upper surfaces of the scat were removed [39] and stored at room temperature in sterile 2-ml
vials filled with DETs buffer (dimethyl sulphoxide saline solution) [40] at1:4 volume scat-to-solution ratio. The
remaining fecal sample was left in the original location to minimize disturbance on any tiger signs. Scat samples were
transported to the Kathmandu-based laboratory of the Center for Molecular Dynamic Nepal (CMDN) for genetic
analysis.
DNA extraction, species identification and sex identification
DNA was extracted from scat samples using a commercially available QIAmp DNA Stool Kit (QIAGEN Inc.,
Germany) following the manufacturer‘s instructions. Species identification polymerase chain reaction (PCR) was
performed using tiger-specific primers (TIF/TIR) (S1 Table) [41] that amplify a 162 bp mtDNA cytochrome b
fragment. The genetically identified tiger samples were further processed for sex identification (S1,S2 Tables) [42].
Microsatellite primer selection and genotyping for individual identification
Sixteen microsatellite markers used by previous studies [41, 43-45] were evaluated. Based on amplification success
and degree of polymorphism, we amplified 10 polymorphic microsatellite loci but retain only 8 microsatellite loci for
individual identification and genetic analyses. (S3 Table).
PCR amplification was carried out in a 7 µL reaction volume containing 3.5 µL of Qiagen master-mix (Qiagen Inc.,
Germany). The PCR conditions for microsatellites amplification included an initial denaturation (95ºC for 15 min)
with a touchdown PCR step for 10 cycles (denaturation at 94ºC for 30 s, annealing initially at 62ºC and reduced by
0.5ºC in each cycle for 90 s and extension at 72ºC for 60 s). This was followed by 25 cycles of denaturation at 94ºC
for 30 s, annealing at 57ºC for 90 s and extension at 72ºC for 60 s, and a final extension at 72ºC for 10 mi. PCR
product (0.7 µL) were sized against LIZ-500 size standard in ABI 310 genetic analyzer (Applied Biosystems, USA).
Three to five PCR replicates were run per sample. Microsatellite alleles were scored in GENEMAPPER, version 4.1
(Applied Biosystems, USA). To finalize consensus genotypes, at least three identical homozygote PCR results were
assessed to determine homozygote, and each allele was observed in two independent PCR for a heterozygous
genotype [46].
Genetic analyses
PCR amplification success rates and genotype accuracy (GA) were based on results from the last two PCR runs [46].
PCR amplification success was based on the percentage of PCR successes across all the tiger-positive samples.
Genotype accuracy was calculated based on the percentage of successful PCR results that matched the finalized
consensus genotype. In addition, cumulative probabilities of identity for unrelated individuals (P(ID)) and siblings
(P(ID)sib) were estimated using Gimlet, version 1.3.3[47]. A minimum criteria of P(ID)sib [48, 49] for selecting the
minimum number of loci required for individual identification was set at 0.035. The GenAlEx program, version 6.5
[50] was used to assess genotype matching and determine the minimum number of individual tigers in the consensus
genotype data sets.
Genetic diversity was quantified by estimating observed heterozygosity (Ho) and expected heterozygosity (He) using
GenAlEx, version 6.41[50]; and allelic richness using the rarefaction method in HP-RARE, version 1.0 [51]. Global
and population-level deviations from the Hardy-Weinberg equilibrium (HWE) and linkage disequilibrium (LDE) [52]
were calculated using ARLEQUIN, version 3.5 [53] and evaluated with and without Bonferroni corrections for
multiple tests [54]. ARLEQUIN was also used to estimate FST, inbreeding coefficients (FIS) and to test the statistical
significance of the pair-wise FST values between the populations in the TAL, using 10,000 permutations [55]. This
was further complemented by the Analysis of the Molecular Variance (AMOVA), implemented within ARLEQUIN,
was used to assess the amount of variation within, and across, individuals and populations (CNP, BNP, SWR) in
TAL. DEST was used as an alternative metric for genetic distances between the populations, as it outperforms FST as an
accurate and unbiased metric of the level of differentiation between populations when the sample size is high and the
number of loci is low [56]. The harmonic mean of DEST across the loci for each population was calculated using the
web-based program SMOGD [57] with 1,000 bootstrap replicates.
To visualize genetic similarities among regions and individuals, we performed a multivariate principal coordinate
analysis (PCoA) in GenAlEx. Furthermore, an individual-based Bayesian clustering approach was implemented using
STRUCTURE (non-spatially explicit), version 2.3.4 [58] and TESS (spatially explicit), version 2.3[59], for inferring
genetic subdivision across the tiger population in the TAL. In STRUCTURE, the value k, representing the potential
number of genetic clusters (sub-populations), was allowed to vary between 1 and 5; we performed 10 independent
runs for each value of k. This analysis was run with admixture models with correlated frequencies using a burn-in of
500,000 Markov chain Monte Carlo (MCMC) steps followed by an additional 1,000,000 iterations without prior
information on the sampling sites. The optimal value of k was inferred by examining the likelihood curve, q value bar
plots, and using the Evanno method [60] implemented in the web-based program Structure Harvester [61]. The
individual membership assignments estimated in STRUCTURE were analyzed in program CLUMPP [62] with a
greedy algorithm and 10,000 random permutations for estimating the mean of the permuted matrices across
replicates. We used the stringent criterion of q> 0.8 for assigning individuals as residents to potential sub populations.
Values below 0.8 were considered representative of individuals with admixed ancestry.
The admixture models (convolution Gaussian model [BYM] and the conditional auto-regressive [CAR]) were run
using TESS [63] with 100,000 burn-in runs followed by 20,000 iterations for k = 2 to 10 with 100 replications per k.
The average of the 10% of the lowest Deviance Information Criteria (DIC) values was used for each kmax. DIC values
were taken for estimating the number of optimal kmax (genetic sub-populations) [64]. DIC values averaged over100
independent iterations were plotted against kmax and most likely value of kmax was selected by visually assessing the
point at which DIC first reached a plateau and the number of clusters to which individuals were proportionally
assigned.
We also examined isolation-by-distance (IBD) and spatial auto-correlation patterns to characterize spatial genetic
structure of tigers in TAL using GenAlEx. First, we tested whether a significant correlation existed between pair-wise
co-dominant genotypic distance and geographical distance by applying simple Mantel tests with 9,999
permutations[65]. Secondly, we used spatial auto-correlation analysis to test the spatial extent of the genetic structure
against the null hypothesis of no auto-correlation (correlation coefficient, r = 0) by generating 95% confidence
intervals (CI) for each distance class via permutation (9,999 simulations) and bootstrapping (999 repeats). We
correlated genetic distances and spatial distance matrices and generated auto-correlation matrices for each spatial
distance class ranging from 0-250 km based on the distribution of tigers in TAL. Results were visualized as
correlograms and the location of first x-intercept represents the extent of non-random spatial genetic structure.
Individuals below this threshold share a higher proportion of genes than spatially distant individuals. Within a given
correlogram, significant spatial auto-correlation was confirmed only when a positive r-value fell outside the 95% CI
(derived from the permutation test), and when the 95% CI about r (derived from bootstrapping) did not intercept the
axis of r = 0[66].
To examine whether the individuals were born in the location from which they were sampled, assignment/exclusion
tests were performed in GENECLASS, version 2.0 [67]. The Bayesian approach with re-sampling algorithm [68] was
used with 10,000 individuals at an assignment threshold (alpha, α) value of 0.01. The likelihood ratio test statistic
(Lhome/ Lmax) was applied to identify migrants. This method uses the Bayesian criteria of Rannala & Mountain (1997)
[69] along with the MCMC re-sampling method to determine the critical value of Lhome/ Lmax beyond which a sample
is treated as a migrant. We also carried out assignment tests in program STRUCTURE incorporating the geographical
sampling sites as prior information (LOCPRIOR) without changing the other parameter settings as described above.
Since we did not have prior knowledge about migration of individuals (MIGPRIOR) between potential sub-
populations, we used the default setting.
Rates of recent immigration over the last several generations among the sub-populations were estimated using
program BayesAss+, version 3.0 [70]. This Bayesian approach uses the multi-locus genotype data and relaxes the key
assumption that populations are in HWE or migration-drift equilibrium. Recent gene flow (over the past 5–7
generations, approximately 25-30 years) was assumed [27], given a 7.55 year generation time for tigers [71]. Multiple
runs (n=5) of the program BayesAss+ with 3×10⁷ MCMC iterations and a 10
7 burn-in with different seed numbers
and delta values confirmed the final parameters and ensured their convergence. Both immigration and emigration
rates between populations were considered as contemporary migrations.
We used two approaches to test for the genetic signature of a severe demographic contraction (i.e. bottleneck) in the
tiger population across the TAL. First, we used test M-ratio [72] implemented in ARELQUIN. The M-ratio compares
the number of alleles (k) with the allelic size range (r). Presence of a bottleneck signature in a population occurs when
rare alleles are lost along with reductions in k faster than r. Low M-ratio values less than the threshold of 0.68 are
thought to represent the presence of a bottleneck signature in the population [72]. Second, we used the Cornuet and
Luikart [73] approach in program BOTTLENECK [74] for comparing the bottleneck signature in each population.
This method tests for the departure from mutation-drift equilibrium based on heterozygote excess or deficiency (Heq).
Simulations were performed under three mutation models: infinite allele model (IAM), single stepwise model (SSM),
and two-phase model (TPM). The simulation values were then compared to real data values to obtain the distribution
of Heq. For the TPM, we used the generic values of 0.95 and 0.12 for frequency of single-step mutations and variance,
respectively [74]. A Wilcoxon sign-rank test was used to detect heterozygosity excess or deficiencies across loci. We
also used a qualitative approach with the mode shift test to detect a population bottleneck. Recently bottlenecked
populations show a mode shift in the distribution of allele frequencies such that alleles with very low frequency (less
than 0.1) are less abundant than alleles that occur frequently.
Results
Landuse changes
Land-use change analysis showed a dramatic decline in forest cover and an increase in agricultural areas by 62% in
the last 300 years across the TAL-Nepal (Fig 2). The major decline in forested areas, with a 47% decrease in land
cover, occurred between the 19th and 20
th centuries. There has been a 97% increase in agriculture and settlement areas
over the past 200 years in the TAL (S1 Fig). Within the TAL, a major break in the contiguous forest landscape
occurred around 52 km west of Chitwan National Park due to a large-scale resettlement and development project
between 1900-1960s. Among these protected areas, Chitwan valley (CNP and surrounding areas) suffered the largest
and most dramatic decline in forested area. Therefore, we predicted that the CNP-PNP tiger population would be an
isolated sub-population. Based on our landscape change analysis, we expected to find a bottleneck signature within
CNP-PNP and the other hypothesized sub-populations (BNP and SuNP).
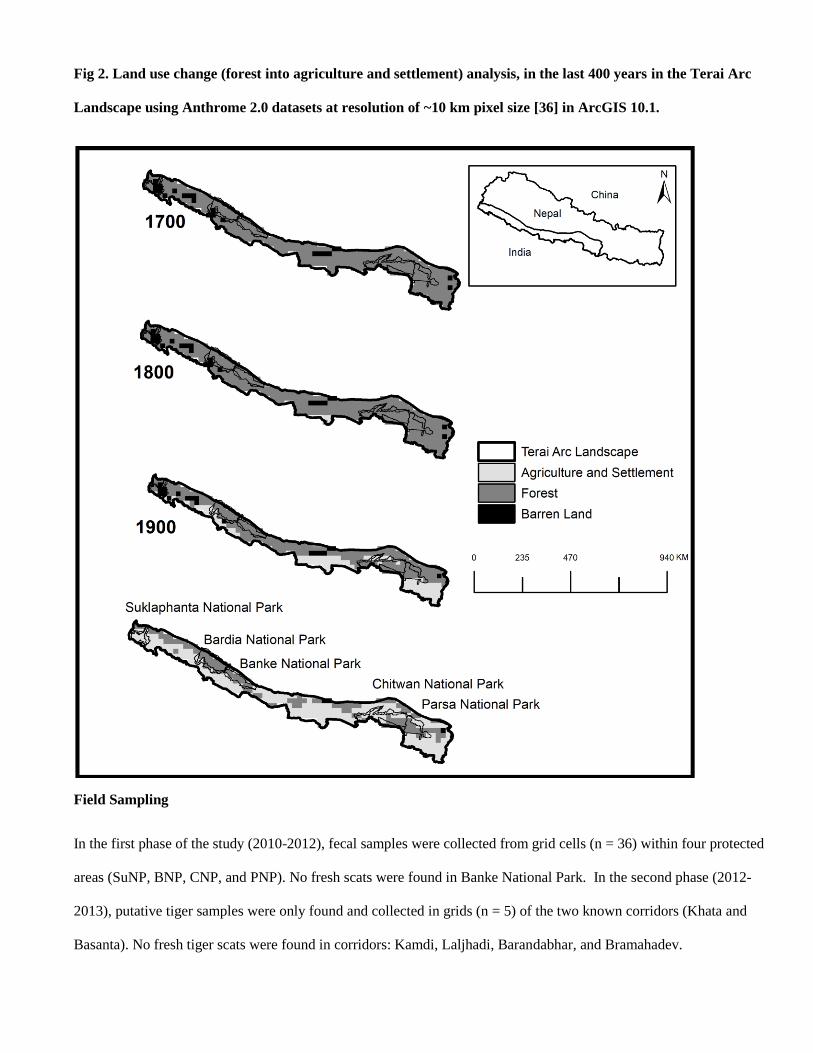
Fig 2. Land use change (forest into agriculture and settlement) analysis, in the last 400 years in the Terai Arc
Landscape using Anthrome 2.0 datasets at resolution of ~10 km pixel size [36] in ArcGIS 10.1.
Field Sampling
In the first phase of the study (2010-2012), fecal samples were collected from grid cells (n = 36) within four protected
areas (SuNP, BNP, CNP, and PNP). No fresh scats were found in Banke National Park. In the second phase (2012-
2013), putative tiger samples were only found and collected in grids (n = 5) of the two known corridors (Khata and
Basanta). No fresh tiger scats were found in corridors: Kamdi, Laljhadi, Barandabhar, and Bramahadev.
Genetic analysis of tiger samples
Of 770 putative tiger scat samples collected from four protected areas (SuNP, BNP, CNP, and PNP) and two
corridors (Khata and Basanta) within the TAL, a total of 412 were confirmed to be tiger scat (Fig 3) (Table1). Of
these, sex was genetically identified in 353 scat samples, among which 255 samples came from males and rest (98)
were from females (Fig 4) (Table 1). Of the ten microsatellite loci that were amplified, eight were retained for
individual identification and genetic analysis based on high PCR amplification success (84%), genotyping accuracy
(82%) (Table 2), and polymorphism. Two Loci (FCA205 and PttA2) were removed from the analysis due to poor
amplification success or monomorphism. For the remaining 8 loci, the cumulative P(ID) and P(ID)sib were estimated to
be 1.5E-06 and 3.2E-03 (<0.01) respectively, and 3.1 E-02 for our 6 least powerful loci. We obtained a consensus
genotype at 6-8 loci for 212 samples (51% genotyping success) and identified 78 individual tigers (male=49,
female=27, unknown sex=2). Only four scat samples collected outside of protected areas were of tiger (Table 1).
Unfortunately, we were unable to identify the number of individuals from these samples due to poor DNA quality.
Only one tiger sample from the PNP collected 15 km east of the CNP was successfully genotyped and added to the
CNP dataset.
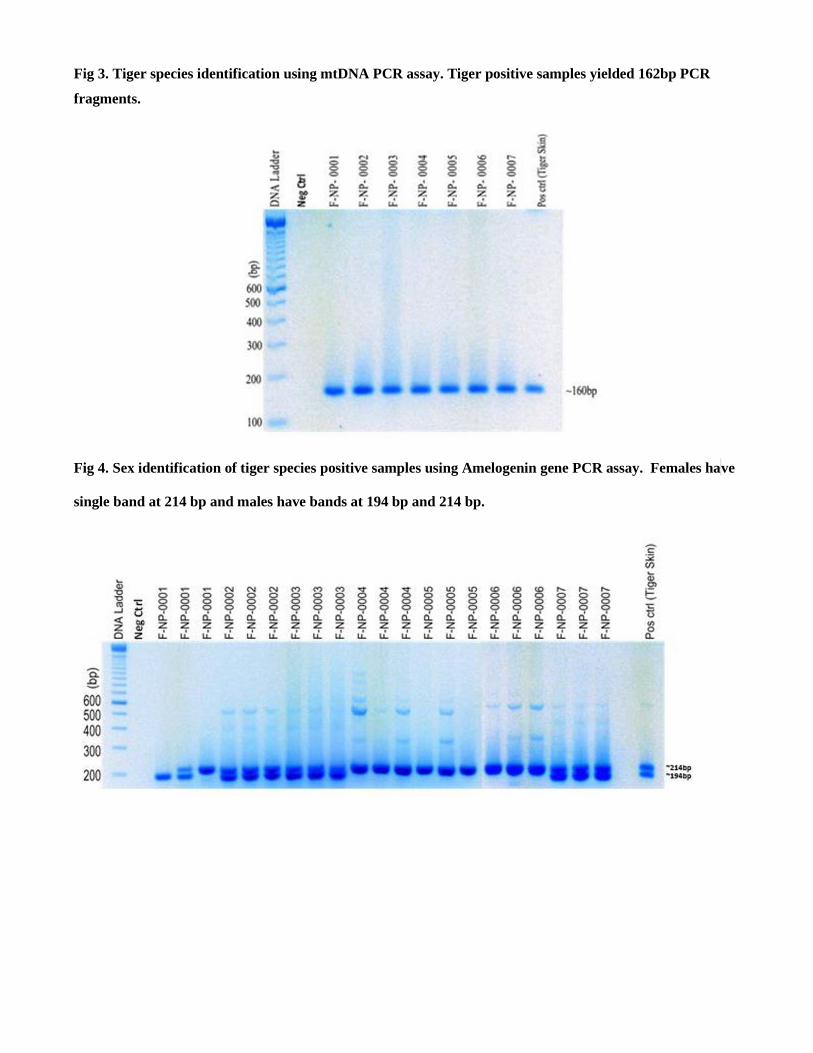
Fig 3. Tiger species identification using mtDNA PCR assay. Tiger positive samples yielded 162bp PCR
fragments.
Fig 4. Sex identification of tiger species positive samples using Amelogenin gene PCR assay. Females ha ve
single band at 214 bp and males have bands at 194 bp and 214 bp.
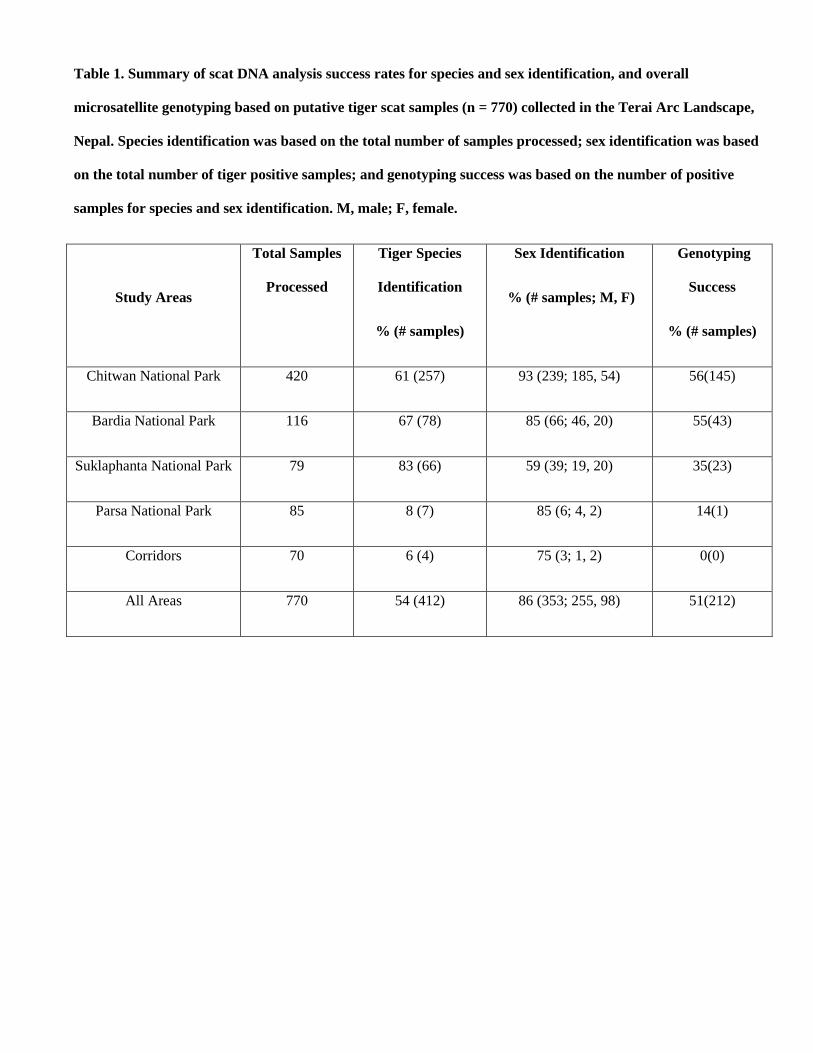
Table 1. Summary of scat DNA analysis success rates for species and sex identification, and overall
microsatellite genotyping based on putative tiger scat samples (n = 770) collected in the Terai Arc Landscape,
Nepal. Species identification was based on the total number of samples processed; sex identification was based
on the total number of tiger positive samples; and genotyping success was based on the number of positive
samples for species and sex identification. M, male; F, female.
Study Areas
Total Samples
Processed
Tiger Species
Identification
% (# samples)
Sex Identification
% (# samples; M, F)
Genotyping
Success
% (# samples)
Chitwan National Park 420 61 (257) 93 (239; 185, 54) 56(145)
Bardia National Park 116 67 (78) 85 (66; 46, 20) 55(43)
Suklaphanta National Park 79 83 (66) 59 (39; 19, 20) 35(23)
Parsa National Park 85 8 (7) 85 (6; 4, 2) 14(1)
Corridors 70 6 (4) 75 (3; 1, 2) 0(0)
All Areas 770 54 (412) 86 (353; 255, 98) 51(212)
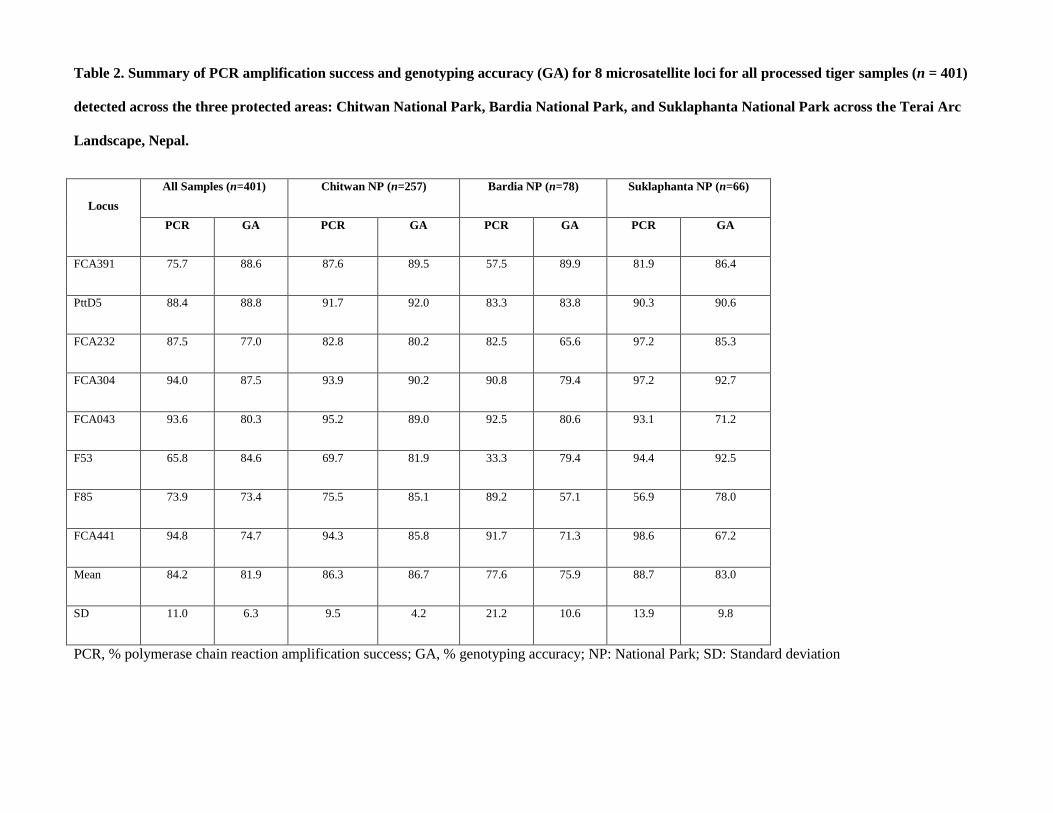
Table 2. Summary of PCR amplification success and genotyping accuracy (GA) for 8 microsatellite loci for all processed tiger samples (n = 401)
detected across the three protected areas: Chitwan National Park, Bardia National Park, and Suklaphanta National Park across the Terai Arc
Landscape, Nepal.
Locus
All Samples (n=401) Chitwan NP (n=257) Bardia NP (n=78) Suklaphanta NP (n=66)
PCR GA PCR GA PCR GA PCR GA
FCA391 75.7 88.6 87.6 89.5 57.5 89.9 81.9 86.4
PttD5 88.4 88.8 91.7 92.0 83.3 83.8 90.3 90.6
FCA232 87.5 77.0 82.8 80.2 82.5 65.6 97.2 85.3
FCA304 94.0 87.5 93.9 90.2 90.8 79.4 97.2 92.7
FCA043 93.6 80.3 95.2 89.0 92.5 80.6 93.1 71.2
F53 65.8 84.6 69.7 81.9 33.3 79.4 94.4 92.5
F85 73.9 73.4 75.5 85.1 89.2 57.1 56.9 78.0
FCA441 94.8 74.7 94.3 85.8 91.7 71.3 98.6 67.2
Mean 84.2 81.9 86.3 86.7 77.6 75.9 88.7 83.0
SD 11.0 6.3 9.5 4.2 21.2 10.6 13.9 9.8
PCR, % polymerase chain reaction amplification success; GA, % genotyping accuracy; NP: National Park; SD: Standard deviation
Equilibrium analyses and genetic diversity
Based on the population-level analysis, four loci in CNP, two in BNP, and three in SuNP deviated significantly from
Hardy-Weinberg Equilibrium (HWE) at P < 0.05 (Table 3). No locus was consistently out of the HWE across all
sampling sites. After Bonferroni corrections, one locus (F85) in CNP and one locus (F53) in SuNP remained
significantly out of the HWE. Significant linkage disequilibrium after sequential Bonferroni corrections (P≤ 5.95E-
04) was detected among three pairs of loci with no apparent pattern (FCA232-FCA043 in CNP, FCA304-F53 and
FCA391-FCA232 in SuNP). Overall average genetic diversity of the TAL tiger population was as follows: observed
heterozygosity of 0.54, expected heterozygosity of 0.61, mean number of alleles per locus of 6.0, and mean allelic
richness of 3.51. Levels of genetic variability varied among the protected areas, with the highest genetic diversity
found in CNP and the lowest in SuNP (Table 3). The average local inbreeding coefficient was high (FIS = 0.16) in the
smaller SuNP population relative to other sites in the TAL (Table 3), which is consistent with the lower diversity
observed for SuNP population.
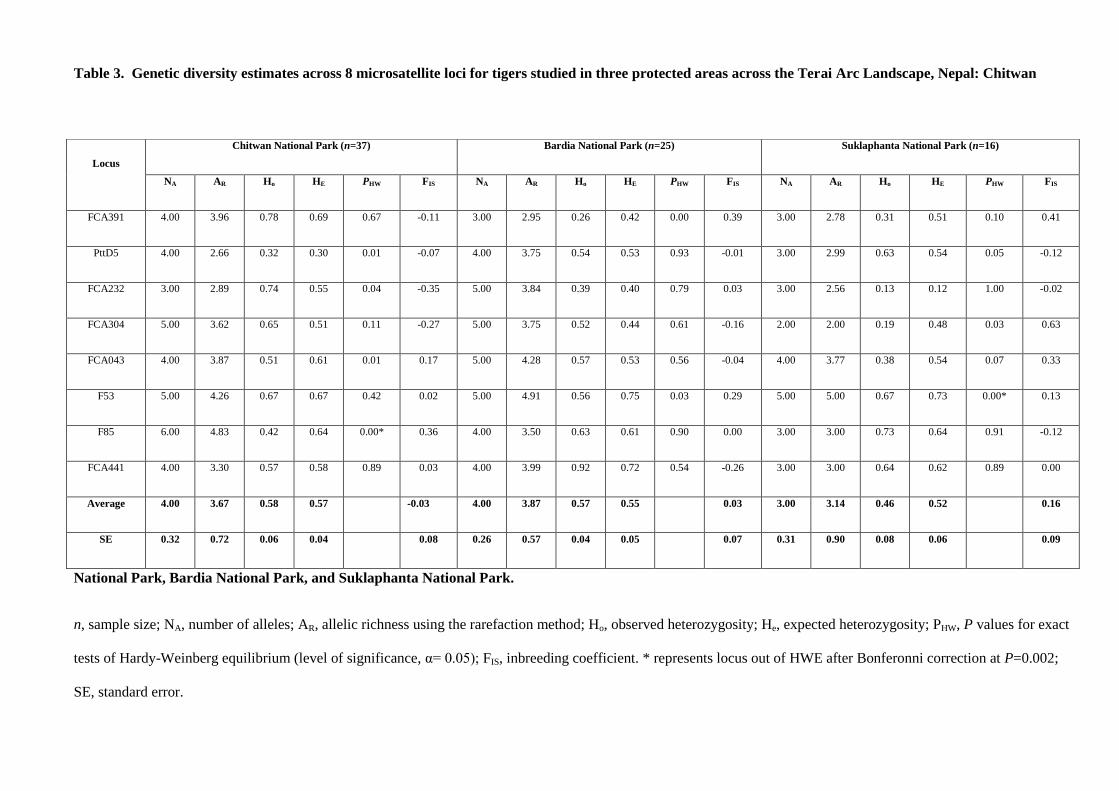
Table 3. Genetic diversity estimates across 8 microsatellite loci for tigers studied in three protected areas across the Terai Arc Landscape, Nepal: Chitwan
National Park, Bardia National Park, and Suklaphanta National Park.
n, sample size; NA, number of alleles; AR, allelic richness using the rarefaction method; Ho, observed heterozygosity; He, expected heterozygosity; PHW, P values for exact
tests of Hardy-Weinberg equilibrium (level of significance, α= 0.05); FIS, inbreeding coefficient. * represents locus out of HWE after Bonferonni correction at P=0.002;
SE, standard error.
Locus
Chitwan National Park (n=37) Bardia National Park (n=25) Suklaphanta National Park (n=16)
NA AR Ho HE PHW FIS NA AR Ho HE PHW FIS NA AR Ho HE PHW FIS
FCA391 4.00 3.96 0.78 0.69 0.67 -0.11 3.00 2.95 0.26 0.42 0.00 0.39 3.00 2.78 0.31 0.51 0.10 0.41
PttD5 4.00 2.66 0.32 0.30 0.01 -0.07 4.00 3.75 0.54 0.53 0.93 -0.01 3.00 2.99 0.63 0.54 0.05 -0.12
FCA232 3.00 2.89 0.74 0.55 0.04 -0.35 5.00 3.84 0.39 0.40 0.79 0.03 3.00 2.56 0.13 0.12 1.00 -0.02
FCA304 5.00 3.62 0.65 0.51 0.11 -0.27 5.00 3.75 0.52 0.44 0.61 -0.16 2.00 2.00 0.19 0.48 0.03 0.63
FCA043 4.00 3.87 0.51 0.61 0.01 0.17 5.00 4.28 0.57 0.53 0.56 -0.04 4.00 3.77 0.38 0.54 0.07 0.33
F53 5.00 4.26 0.67 0.67 0.42 0.02 5.00 4.91 0.56 0.75 0.03 0.29 5.00 5.00 0.67 0.73 0.00* 0.13
F85 6.00 4.83 0.42 0.64 0.00* 0.36 4.00 3.50 0.63 0.61 0.90 0.00 3.00 3.00 0.73 0.64 0.91 -0.12
FCA441 4.00 3.30 0.57 0.58 0.89 0.03 4.00 3.99 0.92 0.72 0.54 -0.26 3.00 3.00 0.64 0.62 0.89 0.00
Average 4.00 3.67 0.58 0.57
-0.03 4.00 3.87 0.57 0.55
0.03 3.00 3.14 0.46 0.52
0.16
SE 0.32 0.72 0.06 0.04
0.08 0.26 0.57 0.04 0.05
0.07 0.31 0.90 0.08 0.06
0.09

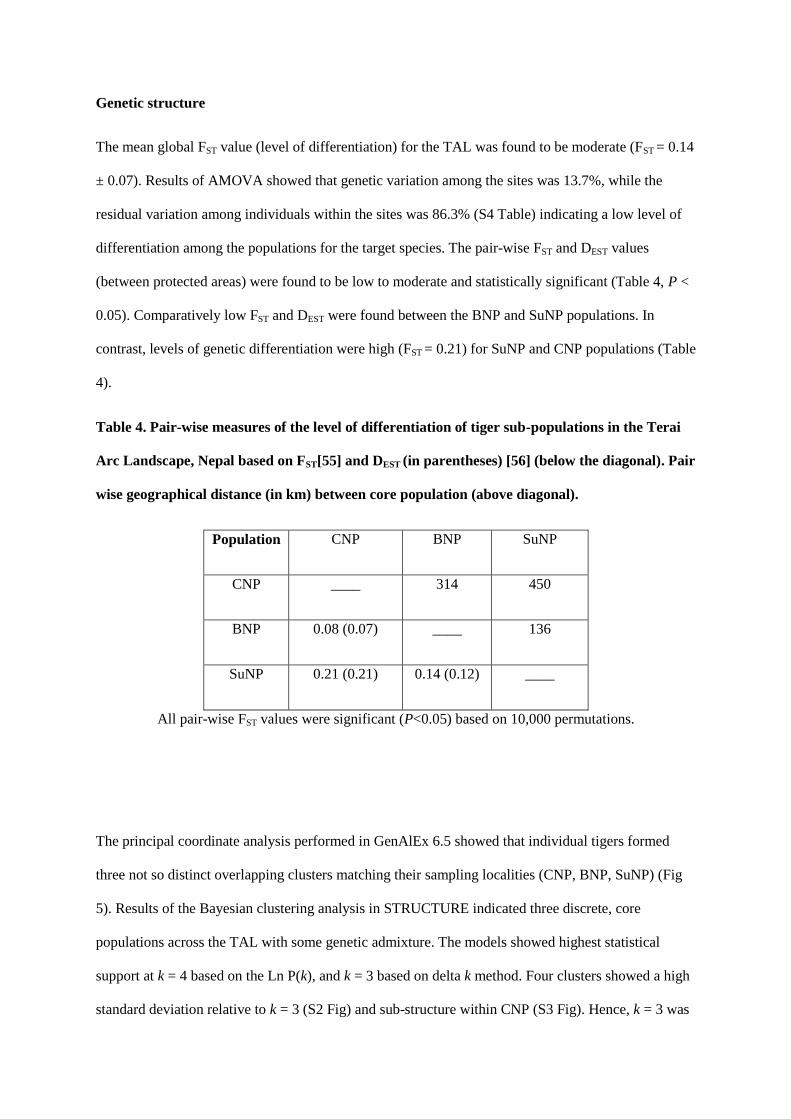
Genetic structure
The mean global FST value (level of differentiation) for the TAL was found to be moderate (FST = 0.14
± 0.07). Results of AMOVA showed that genetic variation among the sites was 13.7%, while the
residual variation among individuals within the sites was 86.3% (S4 Table) indicating a low level of
differentiation among the populations for the target species. The pair-wise FST and DEST values
(between protected areas) were found to be low to moderate and statistically significant (Table 4, P <
0.05). Comparatively low FST and DEST were found between the BNP and SuNP populations. In
contrast, levels of genetic differentiation were high (FST = 0.21) for SuNP and CNP populations (Table
4).
Table 4. Pair-wise measures of the level of differentiation of tiger sub-populations in the Terai
Arc Landscape, Nepal based on FST[55] and DEST (in parentheses) [56] (below the diagonal). Pair
wise geographical distance (in km) between core population (above diagonal).
Population CNP BNP SuNP
CNP ____ 314 450
BNP 0.08 (0.07) ____ 136
SuNP 0.21 (0.21) 0.14 (0.12) ____
All pair-wise FST values were significant (P<0.05) based on 10,000 permutations.
The principal coordinate analysis performed in GenAlEx 6.5 showed that individual tigers formed
three not so distinct overlapping clusters matching their sampling localities (CNP, BNP, SuNP) (Fig
5). Results of the Bayesian clustering analysis in STRUCTURE indicated three discrete, core
populations across the TAL with some genetic admixture. The models showed highest statistical
support at k = 4 based on the Ln P(k), and k = 3 based on delta k method. Four clusters showed a high
standard deviation relative to k = 3 (S2 Fig) and sub-structure within CNP (S3 Fig). Hence, k = 3 was
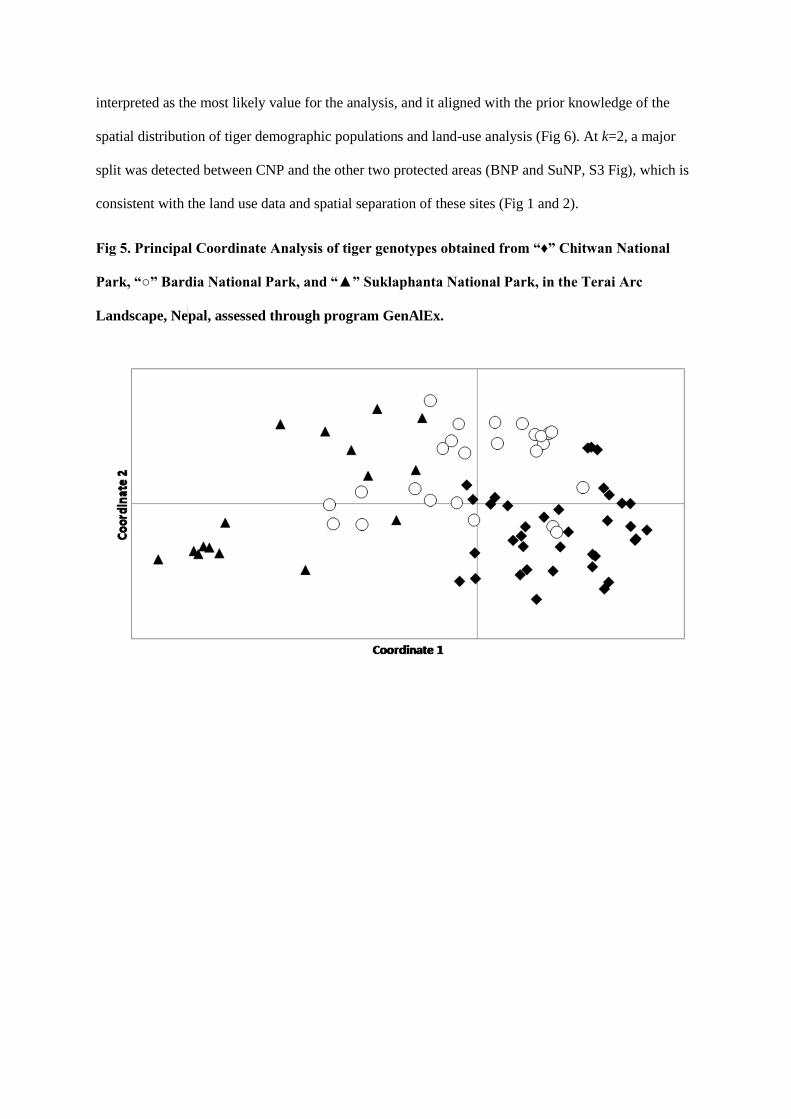
interpreted as the most likely value for the analysis, and it aligned with the prior knowledge of the
spatial distribution of tiger demographic populations and land-use analysis (Fig 6). At k=2, a major
split was detected between CNP and the other two protected areas (BNP and SuNP, S3 Fig), which is
consistent with the land use data and spatial separation of these sites (Fig 1 and 2).
Fig 5. Principal Coordinate Analysis of tiger genotypes obtained from “♦” Chitwan National
Park, “○” Bardia National Park, and “▲” Suklaphanta National Park, in the Terai Arc
Landscape, Ne pal, assessed through program GenAlEx.
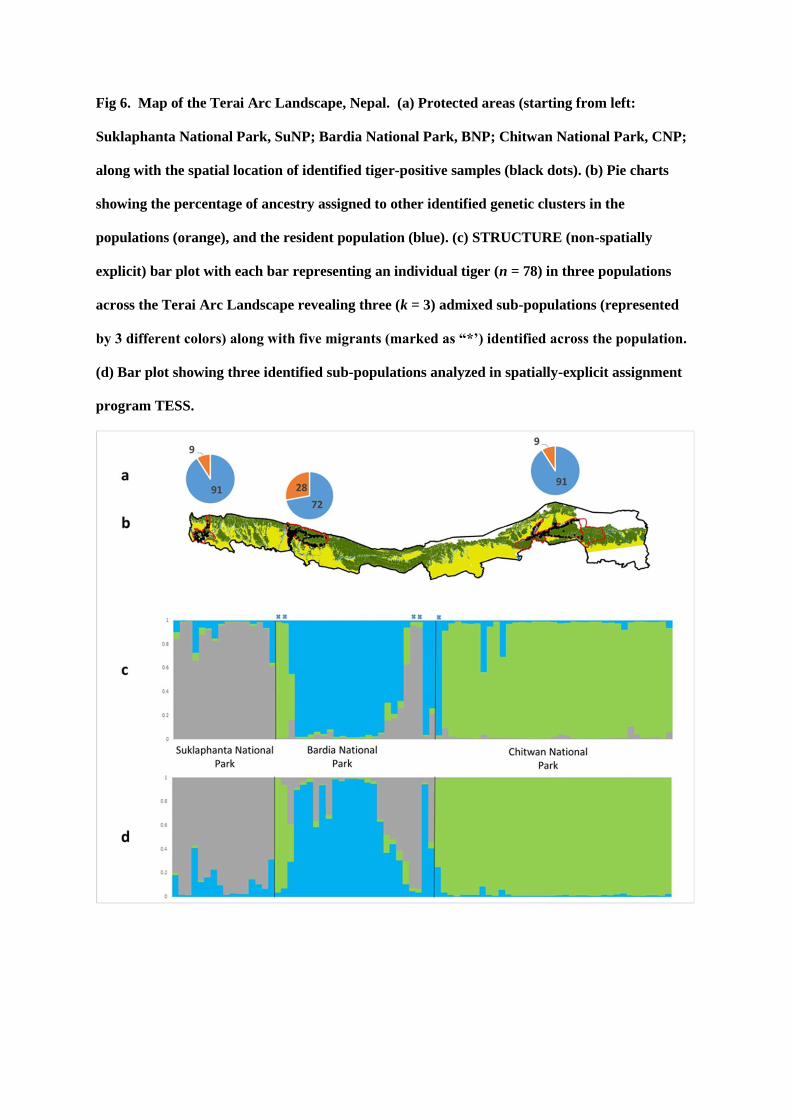
Fig 6. Map of the Terai Arc Landscape, Nepal. (a) Protected areas (starting from left:
Suklaphanta National Park, SuNP; Bardia National Park, BNP; Chitwan National Park, CNP;
along with the spatial location of identified tiger-positive samples (black dots). (b) Pie charts
showing the percentage of ancestry assigned to other identified genetic clusters in the
populations (orange), and the resident population (blue). (c) STRUCTURE (non-spatially
explicit) bar plot with each bar representing an individual tiger (n = 78) in three populations
across the Terai Arc Landscape revealing three (k = 3) admixed sub-populations (represented
by 3 different colors) along with five migrants (marked as “*’) identified across the population.
(d) Bar plot showing three identified sub-populations analyzed in spatially-explicit assignment
program TESS.
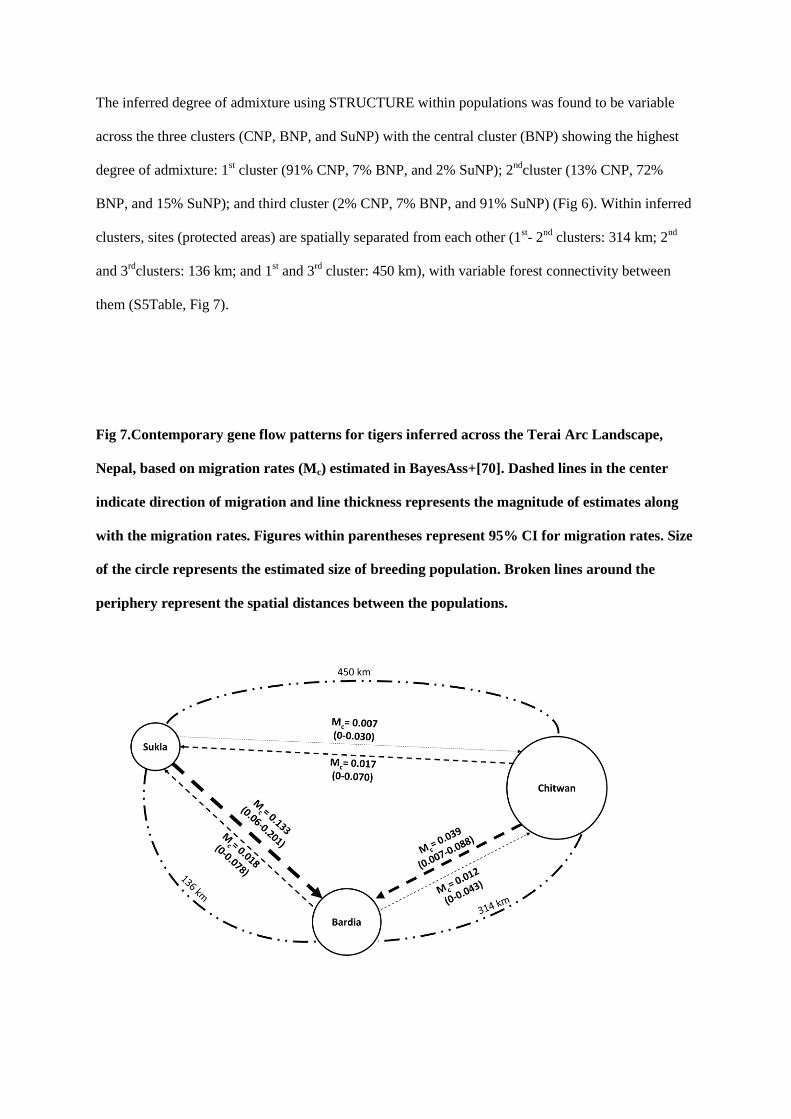
The inferred degree of admixture using STRUCTURE within populations was found to be variable
across the three clusters (CNP, BNP, and SuNP) with the central cluster (BNP) showing the highest
degree of admixture: 1st cluster (91% CNP, 7% BNP, and 2% SuNP); 2
ndcluster (13% CNP, 72%
BNP, and 15% SuNP); and third cluster (2% CNP, 7% BNP, and 91% SuNP) (Fig 6). Within inferred
clusters, sites (protected areas) are spatially separated from each other (1st- 2
nd clusters: 314 km; 2
nd
and 3rd
clusters: 136 km; and 1st and 3
rd cluster: 450 km), with variable forest connectivity between
them (S5Table, Fig 7).
Fig 7.Contemporary gene flow patterns for tigers inferred across the Terai Arc Landscape,
Nepal, based on migration rates (Mc) estimated in BayesAss+[70]. Dashed lines in the center
indicate direction of migration and line thickness represents the magnitude of estimates along
with the migration rates. Figures within parentheses represent 95% CI for migration rates. Size
of the circle represents the estimated size of breeding population. Broken lines around the
periphery represent the spatial distances between the populations.
Results from the non-spatially explicit clustering analysis in STRUCTURE were corroborated with
the spatially explicit analyses in TESS. Based on the DIC model selection criteria, graphs tended to
plateau at k = 3, and the standard deviation increased with an increasing value of kmax (S4 Fig). The
hard-clustering algorithm for individual membership with BYM admixture models did not change
with kmax≥ 3, while in the CAR admixture model, there were inconsistent results with kmax> 3. Overall,
k = 3 was the best supported model, inferred number of genetic clusters for the tiger populations
across the TAL, thereby identifying CNP (1), BNP (2), and SuNP (3) as three distinct sub-populations
with some evidence for sub-structure within CNP.
There was significant correlation (r = 0.48, P= 0.0001) between geographical distance and genetic
distance (Fig 8), supporting the hypothesis of isolation-by-distance for tigers in the TAL. The auto-
correlogram for all tigers showed significantly positive autocorrelation within 75 km distance class
(25 km, r = 0.050, P = 0.0001; 50 km, r = 0.094, P = 0.0001; 75 km, r = 0.076, P = 0.02). An x-
intercept of r at ~ between 75-100 km (S5 Fig), empirically shows presence of nonrandom spatial
structuring and genetic association among individuals at distances <94 km.
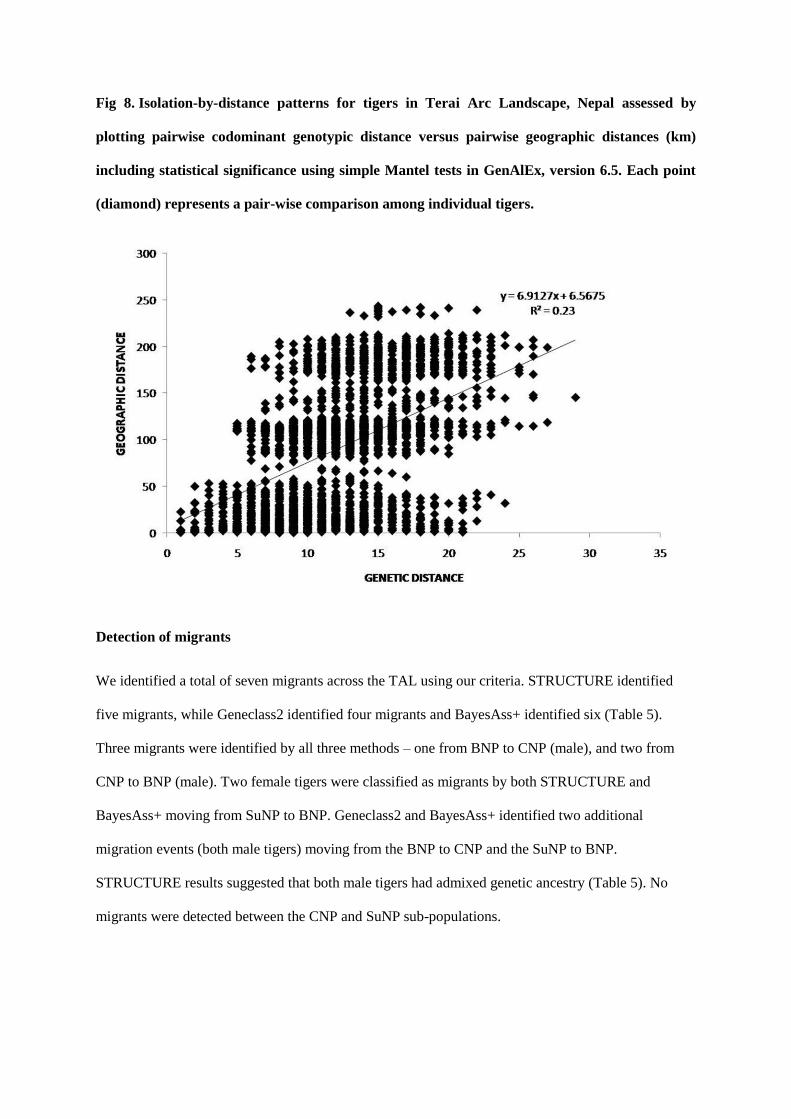
Fig 8. Isolation-by-distance patterns for tigers in Terai Arc Landscape, Nepal assessed by
plotting pairwise codominant genotypic distance versus pairwise geographic distances (km)
including statistical significance using simple Mantel tests in GenAlEx, version 6.5. Each point
(diamond) represents a pair-wise comparison among individual tigers.
Detection of migrants
We identified a total of seven migrants across the TAL using our criteria. STRUCTURE identified
five migrants, while Geneclass2 identified four migrants and BayesAss+ identified six (Table 5).
Three migrants were identified by all three methods – one from BNP to CNP (male), and two from
CNP to BNP (male). Two female tigers were classified as migrants by both STRUCTURE and
BayesAss+ moving from SuNP to BNP. Geneclass2 and BayesAss+ identified two additional
migration events (both male tigers) moving from the BNP to CNP and the SuNP to BNP.
STRUCTURE results suggested that both male tigers had admixed genetic ancestry (Table 5). No
migrants were detected between the CNP and SuNP sub-populations.
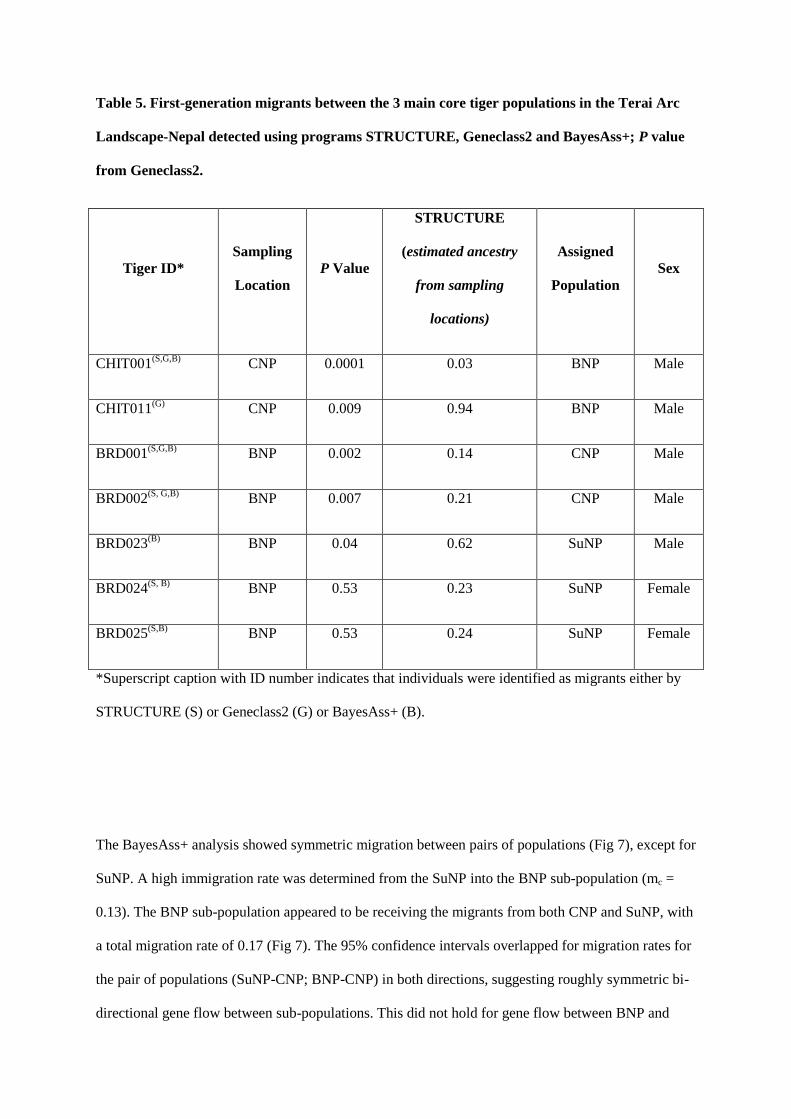
Table 5. First-generation migrants between the 3 main core tiger populations in the Terai Arc
Landscape-Nepal detected using programs STRUCTURE, Geneclass2 and BayesAss+; P value
from Geneclass2.
Tiger ID*
Sampling
Location
P Value
STRUCTURE
(estimated ancestry
from sampling
locations)
Assigned
Population
Sex
CHIT001(S,G,B)
CNP 0.0001 0.03 BNP Male
CHIT011(G)
CNP 0.009 0.94 BNP Male
BRD001(S,G,B)
BNP 0.002 0.14 CNP Male
BRD002(S, G,B)
BNP 0.007 0.21 CNP Male
BRD023(B)
BNP 0.04 0.62 SuNP Male
BRD024(S, B)
BNP 0.53 0.23 SuNP Female
BRD025(S,B)
BNP 0.53 0.24 SuNP Female
*Superscript caption with ID number indicates that individuals were identified as migrants either by
STRUCTURE (S) or Geneclass2 (G) or BayesAss+ (B).
The BayesAss+ analysis showed symmetric migration between pairs of populations (Fig 7), except for
SuNP. A high immigration rate was determined from the SuNP into the BNP sub-population (mc =
0.13). The BNP sub-population appeared to be receiving the migrants from both CNP and SuNP, with
a total migration rate of 0.17 (Fig 7). The 95% confidence intervals overlapped for migration rates for
the pair of populations (SuNP-CNP; BNP-CNP) in both directions, suggesting roughly symmetric bi-
directional gene flow between sub-populations. This did not hold for gene flow between BNP and
SuNP, which appeared to be uni-directional from SuNP to BNP. The net emigration rate was highest
for SuNP, as it contributed the most migrants to the other protected areas (Fig 7). The net emigration
rate for BNP and CNP were negative, suggesting the site received more migrants than it contributed to
other populations.
Detection of bottlenecks
The average M-ratio describing potential bottlenecks for all sites was 0.29 (SE = 0.07), which is
below the threshold value of 0.68. This suggests that the tiger population suffered a bottleneck event
that caused a severe decline in the population size in the recent past. These results were supported
among all sub-populations. The Bottleneck software detected heterozygote excess using the sign test,
with 5 to 6 loci, depending upon the mutation models. However, results of the two-tailed Wilcoxon
signed-rank test showed that the signature of a bottleneck event was significant only for the CNP
population under the Infinite Allele Mutational (IAM) model (P = 0.03, S6 Table). The mode-shift
test showed the normal ―L‖-shaped allele distribution in BNP. The test only showed the presence of a
large proportion of alleles at low frequencies, indicating a genetic bottleneck between CNP and SuNP,
but not CNP and BNP.
Discussion
Effect of landuse change
The historical land-use change analysis was consistent with the present structuring of animals on the
landscape into sub-populations [27, 75, 76]. Tigers used to roam the vast expense of Terai forests in
Nepal and India. Beginning in the mid-1840s, core tiger habitat was protected by the Rana rulers for
their exclusive royal hunting, thus discouraging people from settling and conducting agriculture.
Tigers were persecuted in large numbers during organized royal hunts. However, the population
recovery of tigers was relatively quick following this time, likely due to immigration from adjacent
forest areas. Rampant malaria also hindered people from clearing forest and settling in the Terai
region [77].
By the late 20th century however, extensive land clearing had occurred and the level of wildlife
hunting was high, fragmenting tiger habitat, reducing abundance of tiger prey species, and contracting
tiger range to the Chitwan Valley in central Nepal [75, 78], the BNP and SuNP in the west, and to a
few large blocks of forest in the east. High human population density and extensive deforestation for
agricultural practices [79] led to inadequate cover and low prey availability and tigers became
extirpated in the eastern Terai region by the 1970s [80].With the eradication of malaria and the
government policy of extending settlements along the border with India, large swaths of forest
landscape were disturbed [81]. Taken together, these events resulted in the loss and fragmentation of
the forest biomes in the TAL, likely causing the decline in tiger population size and genetic diversity,
and the subsequent sub-structuring of the tiger population in Nepal, perhaps through population
bottlenecks [36].
High rates of anthropogenic transformation of landscapes [36] play a major role in the extinction of
wild mammal populations [82]. Intense forest fragmentation has imposed similar effects upon jaguars
in Brazil [83] and Amur leopards in the Russian Far East [84], causing significant loss of genetic
variation. In contrast, tigers [27, 85] and leopards [86] in India have high levels of genetic variation,
and no genetic bottlenecks have been detected despite habitat fragmentation.
Sampling Strategy
Our sampling strategy was to collect as many as possible from the potential habitat (protected areas,
surrounding buffer zones forests, and corridors) along TAL. We screened the duplication of samples
at two stages: at field, we only collected the fresh scat samples at each encounter and avoided
collection of the same scats samples by putting in the red marker on the scat (dried) itself and/or
placed a twig into soil at the site of fresh samples. At the analysis phase, each of the duplicate samples
(if scored) were taken as recapture.
Genetic variation in TAL
Tigers in the TAL displayed moderate levels of genetic variation (He = 0.61) across the landscape and
similar levels across sub-populations (He ≈ 0.57), perhaps due to moderate population size and/or
gene flow resulting from potential connectivity among tiger-bearing protected areas across the TAL in
Nepal (n=5) and India (n=10).Our estimates of genetic variation were lower in comparison to genetic
diversity estimates for Bengal tigers overall (He = 0.72) [87] or the Indian Subcontinent (He = 0.70)
[22] using microsatellite loci. However, the estimates were higher than in other sub-species of tigers
(average He = 0.53, Sumatran, Indochinese, Malayan and Siberian) [87]. Landscape-wide genetic
variation in tigers across the major tiger conservation landscapes in India range from as low as He =
0.58 in the southeastern Ghats [88], He = 0.67 in the northeast landscape [89], He = 0.76 in the
Western Ghats [24], and as high as He = 0.81 in the central Indian landscape [27]. However, care
should be taken in interpretation of heterozygosity because direct comparisons of diversity are not
possible since these studies employed different numbers and combinations of microsatellite loci.
The average inbreeding coefficient across the sub-populations in the TAL-Nepal suggests weak
inbreeding that was statistically non-significant (P= 0.42). At the sub-population level, SuNP showed
a weak sign of local inbreeding (FIS = 0.16), which approached statistical significance (P= 0.06). This
suggests the importance of connectivity in averting inbreeding depression in the small SuNP sub-
population[90]. Spatially, SuNP is surrounded by human settlements, but retains dispersal potential
through the northern and southern sections of the reserve. However, we did not detect any migrants
into this population, but rather detected three migrants leaving this subpopulation. Additionally, the
creation of the Pilibhit Tiger Reserve (India) to the south strengthens the possibility of future
connectivity via tiger dispersal through the Lagga Bagga Forest in India (Dr A.J.T Johnsingh:
personal communication). Currently, the net migration estimates suggest that more tigers are leaving
SuNP than are immigrating (Fig 7).
Genetic structure
Both population- and individual-based tests for assessing the level of genetic sub-division revealed
moderate levels of differentiation across the landscape. This is in concordant with AMOVA and
fixation index (Fst) results where populations (sites) observed moderate differentiation showing three
genetic clusters confirming that total population in Terai Arc may not be total panmixia. Our Bayesian
clustering results support three distinct genetic clusters (sub-populations) within the TAL-Nepal,
representing the three tiger bearing protected areas (CNP, SuNP, BNP) confirming our a priori
hypothesis. Our field data suggested demographic contiguity in and around these protected areas [30].
However, with the absence of tiger samples from the Indian side of the TAL, there is a lack of clarity
in explaining the overall genetic structure of tigers across the entire landscape; tigers could travel
through the contiguous protected areas of India into Nepal. Joint camera trap surveys conducted
across the transboundary protected areas revealed 10 common tigers dispersing between Nepal and
India [91]. We did detect a strong isolation-by-distance effect for individual tigers across the TAL.
Spatial auto-correlation analysis detected genetic spatial structuring at geographic scale of 75-100 km
across all samples indicating high genetic association among individuals even at such broad distances,
and gene flow for the tigers might be possible through the landscape. The Bayesian clustering analysis
in STRUCTURE and migration analysis in BayesAss+, both assessing contemporary gene flow levels
[92, 93], showed higher connectivity between SuNP and BNP than between BNP and CNP. In
contrast FST/DEST showed higher connectivity between CNP and BNP, which are farther apart, than
between SuNP and BNP, which are closer together.
Gene flow and detection of migrants
The results of the assignment tests offered evidence of contemporary gene flow between tiger sub-
populations suggesting that tigers can, and do, disperse across the TAL-Nepal. We detected 7
migrants (5 males, 2 females) moving between the sub-populations. Tigers are known to disperse long
distances (~200 km) based on long-term camera-trap data [94]. Furthermore, dispersal has been
recorded as far as 600 km in the central Indian landscapes [25]. Consequently, the detection of tiger
dispersal (first-generation migrants) between protected areas, which range from 314 km (CNP and
BNP) to 136 km (BNP and SuNP) apart, is expected if the landscape provides stepping stone habitats
to allow tiger movement throughout the landscape.
Results of the BayesAss+ analysis showed high estimates of recent migration of tigers among the sub-
populations. High net immigration rates were detected in BNP. In the medium and large sub-
populations (BNP and CNP), we found evidence of one to two male tigers dispersing between the
populations. There was also evidence of one male and two females moving from SuNP to BNP. If
these tigers breed, this will likely avert the detrimental effects of inbreeding depression, thus
flattening the slopes of extinctions curves accordingly [90]. Results from the STRUCTURE analyses
(Table 5) detected 3-7 individuals with mixed ancestry suggesting that migrants have successfully
reproduced in earlier generations.
The SuNP population, while small, holds the highest density of tigers, likely due to high prey density
[19]. This could help explain why SuNP is the source of many emigrants. However, it could be argued
that, due to the small size of the reserve and the high tiger density, there might not be space for
dispersing male tigers to establish territories within the reserve. Hence, it may not be possible to
receive migrants from surrounding areas. Lower levels of genetic variation, and the slight but weak
evidence of inbreeding relative to other protected areas in the landscape, suggests the need to increase
migration of tigers into the SuNP population to avert inbreeding depression and increase genetic
variation of the subpopulation. For example, leopards in the Russian Far East suffered significant loss
in genetic variation due to lack of connectivity to a source population and continue to suffer loss of
genetic variation [84]. The designation of 727 km2 of the Pilibhit Forest Division as a tiger reserve by
the Indian government is an important step towards increasing connectivity between the western TAL
in India and SuNP in Nepal (Dr. Dipankar Gosh WWF India: personal communication).
Population bottlenecks
While both analysis techniques revealed population bottlenecks in the TAL-Nepal, there was a
disagreement in the resulting number of detected population bottlenecks. The M-ratio test revealed a
population bottleneck in all populations, in contrast to the heterozygous excess test showing a
bottleneck only in the CNP population. Both tests have been found to be effective at detecting
bottlenecks, but each works under different assumptions. Peery et al. [95] suggested that despite
correctly assuming the mutation models (IAM, SSM or TPM), statistical power to detect a bottleneck
with the two methods might depend upon the pre-bottleneck genetic variation. Heterozygosity may be
less powerful than the M-ratio test when pre-bottleneck genetic diversity is high [95]. Alternatively,
the heterozygosity excess test may work best when the pre-bottleneck population is smaller or when
the bottleneck is milder and more recent[96]. Either way, there is evidence that at least one bottleneck
occurred in the TAL-Nepal.
Conclusions
We provide evidence of three genetically admixed sub-populations across the TAL-Nepal based on
spatial (TESS) and non-spatial (STRUCTURE) Bayesian clustering techniques, suggesting that tigers
have been able to move between the populations and breed, at least in the recent past. Contemporary
gene flow measures of tigers were estimated in the TAL based on both likelihood and Bayesian
approaches. Improved connectivity between the protected areas, facilitated by male and female tiger
dispersal, appears to be able to avert the negative consequences of inbreeding depression following
bottleneck events. Thus, there is a need to maintain connectivity throughout the TAL-Nepal landscape
and beyond. We did not find migrants from CNP into SuNP or vice versa in any of the migrant
detection tests. However, the dispersal among SuNP and CNP is more likely to be a stepping-stone
process [97].
In recent times, connectivity in the Nepali landscape has been improved by the protection of large
forest blocks after the nationalization of forests in the 1960s [77], improved governance, and
management of forest resources [98]. The launch of the community forest program in the ―Terai
forest‖ [99] in the early 1980s has been successful in building more forest habitat at forest edges as
well as buffers for the large forest blocks with the goal to increase tiger dispersal across the landscape.
The Government of Nepal (GoN) has also taken positive steps in restoring connectivity across the
TAL, including the adoption of a successful, community-based forest management approach [29]. The
GoN‘s declaration of all the identified forest corridor as a ―protected forest‖ status was also a
milestone [100]. Our results indicate that the landscape is currently functional with respect to the
dispersal of tigers among the protected areas, but there is evidence of genetic structure, indicating that
sub-populations exist and gene flow is limited between some protected areas. In the face of human
population growth, economic development post-insurgency, political unrest, and developmental road
projects, genetic connectivity seems likely to erode [101]. Consequently, gene flow of tigers across

the landscape will be impeded, thus lowering their persistence in the long run [90]. Therefore, it is
essential to secure tiger core areas and functional forest corridors between them to maintain and
enhance gene flow across the landscape, thereby ensuring that tiger populations exist for generations
to come. Securing tiger existence across the TAL-Nepal will require concerted stakeholder
cooperation, careful planning, and the prevention of detrimental development activities.
Acknowledgments
We would like to thank the Department of National Parks and Wildlife Conservation for permission to
conduct the first genetic study of tigers in Nepal. We thank all the field coordinators (chief wardens)
for their coordination of fieldwork and all the field assistants and volunteers for collection of samples.
We would like to thank National Trust for Nature Conservation for their support during the field
work. Thanks to Drs: Eric Hallerman, Jess Jones, and Jamie Roberts for their guidance in analyzing
the genetic data. Finally, thanks to Dr. Jennifer Adams and University of Idaho Laboratory for
Ecological, Evolutionary and Conservation Genetics for laboratory assistance.
Conflict of interest
The authors declare no conflicts of interest
Data availability
All data related to the study is included in the manuscript and the final Nepal Tiger Genome
Project final report is available at
https://figshare.com/articles/Assessment_of_genetic_diversity_population_structure_and_gene_
flow_of_tigers_Panthera_tigris_tigris_across_Nepal_s_Terai_Arc_Landscape/5896063
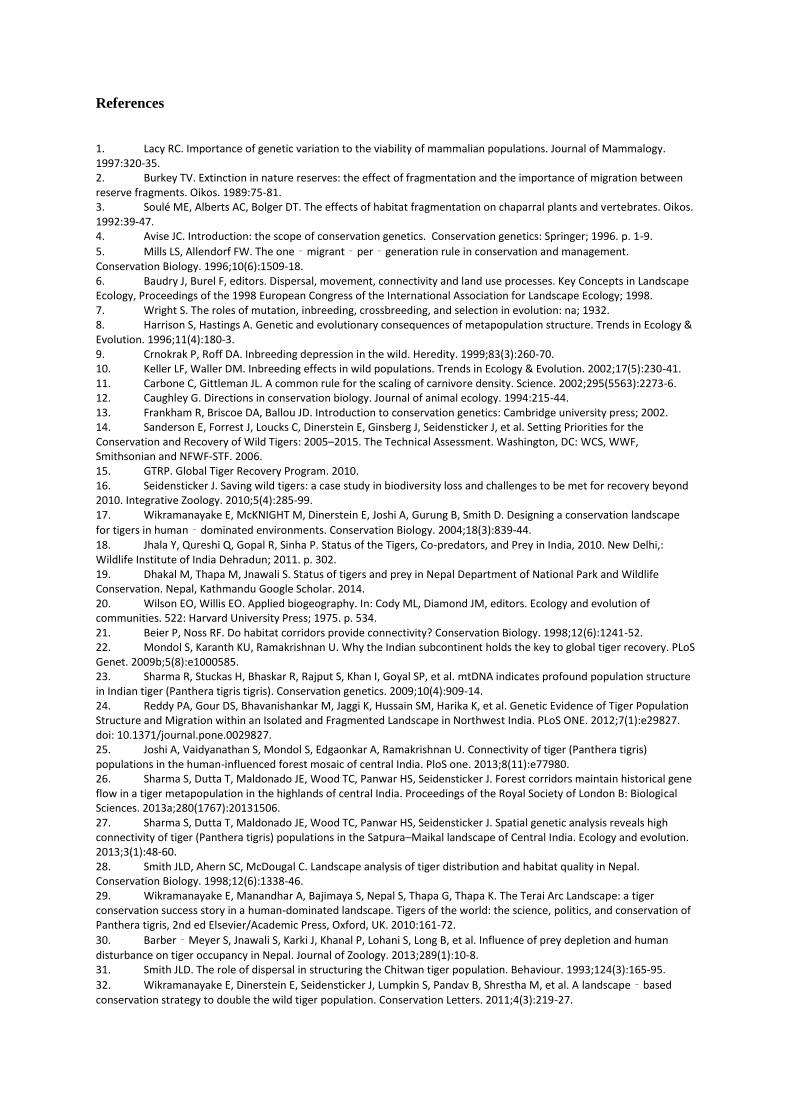
References
1. Lacy RC. Importance of genetic variation to the viability of mammalian populations. Journal of Mammalogy. 1997:320-35. 2. Burkey TV. Extinction in nature reserves: the effect of fragmentation and the importance of migration between reserve fragments. Oikos. 1989:75-81. 3. Soulé ME, Alberts AC, Bolger DT. The effects of habitat fragmentation on chaparral plants and vertebrates. Oikos. 1992:39-47. 4. Avise JC. Introduction: the scope of conservation genetics. Conservation genetics: Springer; 1996. p. 1-9.
5. Mills LS, Allendorf FW. The one‐migrant‐per‐generation rule in conservation and management. Conservation Biology. 1996;10(6):1509-18. 6. Baudry J, Burel F, editors. Dispersal, movement, connectivity and land use processes. Key Concepts in Landscape Ecology, Proceedings of the 1998 European Congress of the International Association for Landscape Ecology; 1998. 7. Wright S. The roles of mutation, inbreeding, crossbreeding, and selection in evolution: na; 1932. 8. Harrison S, Hastings A. Genetic and evolutionary consequences of metapopulation structure. Trends in Ecology & Evolution. 1996;11(4):180-3. 9. Crnokrak P, Roff DA. Inbreeding depression in the wild. Heredity. 1999;83(3):260-70. 10. Keller LF, Waller DM. Inbreeding effects in wild populations. Trends in Ecology & Evolution. 2002;17(5):230-41. 11. Carbone C, Gittleman JL. A common rule for the scaling of carnivore density. Science. 2002;295(5563):2273-6. 12. Caughley G. Directions in conservation biology. Journal of animal ecology. 1994:215-44. 13. Frankham R, Briscoe DA, Ballou JD. Introduction to conservation genetics: Cambridge university press; 2002. 14. Sanderson E, Forrest J, Loucks C, Dinerstein E, Ginsberg J, Seidensticker J, et al. Setting Priorities for the Conservation and Recovery of Wild Tigers: 2005–2015. The Technical Assessment. Washington, DC: WCS, WWF, Smithsonian and NFWF-STF. 2006. 15. GTRP. Global Tiger Recovery Program. 2010. 16. Seidensticker J. Saving wild tigers: a case study in biodiversity loss and challenges to be met for recovery beyond 2010. Integrative Zoology. 2010;5(4):285-99. 17. Wikramanayake E, McKNIGHT M, Dinerstein E, Joshi A, Gurung B, Smith D. Designing a conservation landscape
for tigers in human‐dominated environments. Conservation Biology. 2004;18(3):839-44. 18. Jhala Y, Qureshi Q, Gopal R, Sinha P. Status of the Tigers, Co-predators, and Prey in India, 2010. New Delhi,: Wildlife Institute of India Dehradun; 2011. p. 302. 19. Dhakal M, Thapa M, Jnawali S. Status of tigers and prey in Nepal Department of National Park and Wildlife Conservation. Nepal, Kathmandu Google Scholar. 2014. 20. Wilson EO, Willis EO. Applied biogeography. In: Cody ML, Diamond JM, editors. Ecology and evolution of communities. 522: Harvard University Press; 1975. p. 534. 21. Beier P, Noss RF. Do habitat corridors provide connectivity? Conservation Biology. 1998;12(6):1241-52. 22. Mondol S, Karanth KU, Ramakrishnan U. Why the Indian subcontinent holds the key to global tiger recovery. PLoS Genet. 2009b;5(8):e1000585. 23. Sharma R, Stuckas H, Bhaskar R, Rajput S, Khan I, Goyal SP, et al. mtDNA indicates profound population structure in Indian tiger (Panthera tigris tigris). Conservation genetics. 2009;10(4):909-14. 24. Reddy PA, Gour DS, Bhavanishankar M, Jaggi K, Hussain SM, Harika K, et al. Genetic Evidence of Tiger Population Structure and Migration within an Isolated and Fragmented Landscape in Northwest India. PLoS ONE. 2012;7(1):e29827. doi: 10.1371/journal.pone.0029827. 25. Joshi A, Vaidyanathan S, Mondol S, Edgaonkar A, Ramakrishnan U. Connectivity of tiger (Panthera tigris) populations in the human-influenced forest mosaic of central India. PloS one. 2013;8(11):e77980. 26. Sharma S, Dutta T, Maldonado JE, Wood TC, Panwar HS, Seidensticker J. Forest corridors maintain historical gene flow in a tiger metapopulation in the highlands of central India. Proceedings of the Royal Society of London B: Biological Sciences. 2013a;280(1767):20131506. 27. Sharma S, Dutta T, Maldonado JE, Wood TC, Panwar HS, Seidensticker J. Spatial genetic analysis reveals high connectivity of tiger (Panthera tigris) populations in the Satpura–Maikal landscape of Central India. Ecology and evolution. 2013;3(1):48-60. 28. Smith JLD, Ahern SC, McDougal C. Landscape analysis of tiger distribution and habitat quality in Nepal. Conservation Biology. 1998;12(6):1338-46. 29. Wikramanayake E, Manandhar A, Bajimaya S, Nepal S, Thapa G, Thapa K. The Terai Arc Landscape: a tiger conservation success story in a human-dominated landscape. Tigers of the world: the science, politics, and conservation of Panthera tigris, 2nd ed Elsevier/Academic Press, Oxford, UK. 2010:161-72.
30. Barber‐Meyer S, Jnawali S, Karki J, Khanal P, Lohani S, Long B, et al. Influence of prey depletion and human
disturbance on tiger occupancy in Nepal. Journal of Zoology. 2013;289(1):10-8. 31. Smith JLD. The role of dispersal in structuring the Chitwan tiger population. Behaviour. 1993;124(3):165-95.
32. Wikramanayake E, Dinerstein E, Seidensticker J, Lumpkin S, Pandav B, Shrestha M, et al. A landscape‐based conservation strategy to double the wild tiger population. Conservation Letters. 2011;4(3):219-27.
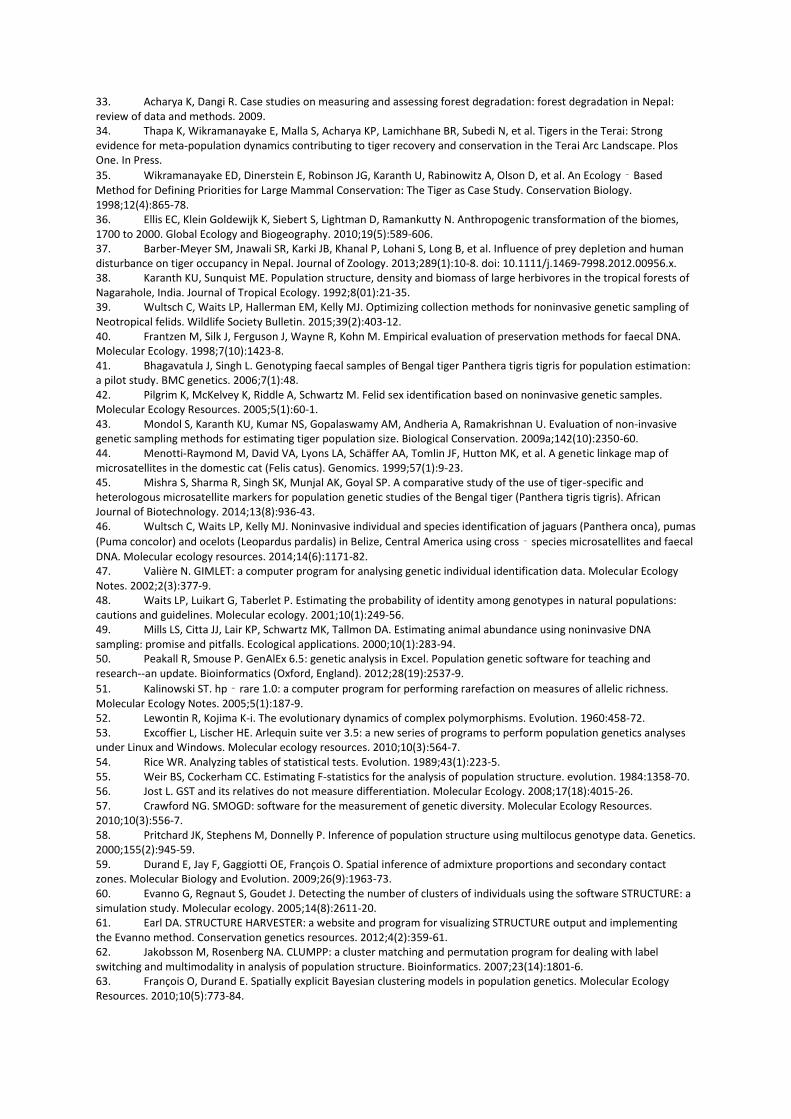
33. Acharya K, Dangi R. Case studies on measuring and assessing forest degradation: forest degradation in Nepal: review of data and methods. 2009. 34. Thapa K, Wikramanayake E, Malla S, Acharya KP, Lamichhane BR, Subedi N, et al. Tigers in the Terai: Strong evidence for meta-population dynamics contributing to tiger recovery and conservation in the Terai Arc Landscape. Plos One. In Press.
35. Wikramanayake ED, Dinerstein E, Robinson JG, Karanth U, Rabinowitz A, Olson D, et al. An Ecology‐Based Method for Defining Priorities for Large Mammal Conservation: The Tiger as Case Study. Conservation Biology. 1998;12(4):865-78. 36. Ellis EC, Klein Goldewijk K, Siebert S, Lightman D, Ramankutty N. Anthropogenic transformation of the biomes, 1700 to 2000. Global Ecology and Biogeography. 2010;19(5):589-606. 37. Barber-Meyer SM, Jnawali SR, Karki JB, Khanal P, Lohani S, Long B, et al. Influence of prey depletion and human disturbance on tiger occupancy in Nepal. Journal of Zoology. 2013;289(1):10-8. doi: 10.1111/j.1469-7998.2012.00956.x. 38. Karanth KU, Sunquist ME. Population structure, density and biomass of large herbivores in the tropical forests of Nagarahole, India. Journal of Tropical Ecology. 1992;8(01):21-35. 39. Wultsch C, Waits LP, Hallerman EM, Kelly MJ. Optimizing collection methods for noninvasive genetic sampling of Neotropical felids. Wildlife Society Bulletin. 2015;39(2):403-12. 40. Frantzen M, Silk J, Ferguson J, Wayne R, Kohn M. Empirical evaluation of preservation methods for faecal DNA. Molecular Ecology. 1998;7(10):1423-8. 41. Bhagavatula J, Singh L. Genotyping faecal samples of Bengal tiger Panthera tigris tigris for population estimation: a pilot study. BMC genetics. 2006;7(1):48. 42. Pilgrim K, McKelvey K, Riddle A, Schwartz M. Felid sex identification based on noninvasive genetic samples. Molecular Ecology Resources. 2005;5(1):60-1. 43. Mondol S, Karanth KU, Kumar NS, Gopalaswamy AM, Andheria A, Ramakrishnan U. Evaluation of non-invasive genetic sampling methods for estimating tiger population size. Biological Conservation. 2009a;142(10):2350-60. 44. Menotti-Raymond M, David VA, Lyons LA, Schäffer AA, Tomlin JF, Hutton MK, et al. A genetic linkage map of microsatellites in the domestic cat (Felis catus). Genomics. 1999;57(1):9-23. 45. Mishra S, Sharma R, Singh SK, Munjal AK, Goyal SP. A comparative study of the use of tiger-specific and heterologous microsatellite markers for population genetic studies of the Bengal tiger (Panthera tigris tigris). African Journal of Biotechnology. 2014;13(8):936-43. 46. Wultsch C, Waits LP, Kelly MJ. Noninvasive individual and species identification of jaguars (Panthera onca), pumas
(Puma concolor) and ocelots (Leopardus pardalis) in Belize, Central America using cross‐species microsatellites and faecal
DNA. Molecular ecology resources. 2014;14(6):1171-82. 47. Valière N. GIMLET: a computer program for analysing genetic individual identification data. Molecular Ecology Notes. 2002;2(3):377-9. 48. Waits LP, Luikart G, Taberlet P. Estimating the probability of identity among genotypes in natural populations: cautions and guidelines. Molecular ecology. 2001;10(1):249-56. 49. Mills LS, Citta JJ, Lair KP, Schwartz MK, Tallmon DA. Estimating animal abundance using noninvasive DNA sampling: promise and pitfalls. Ecological applications. 2000;10(1):283-94. 50. Peakall R, Smouse P. GenAlEx 6.5: genetic analysis in Excel. Population genetic software for teaching and research--an update. Bioinformatics (Oxford, England). 2012;28(19):2537-9.
51. Kalinowski ST. hp‐rare 1.0: a computer program for performing rarefaction on measures of allelic richness. Molecular Ecology Notes. 2005;5(1):187-9. 52. Lewontin R, Kojima K-i. The evolutionary dynamics of complex polymorphisms. Evolution. 1960:458-72. 53. Excoffier L, Lischer HE. Arlequin suite ver 3.5: a new series of programs to perform population genetics analyses under Linux and Windows. Molecular ecology resources. 2010;10(3):564-7. 54. Rice WR. Analyzing tables of statistical tests. Evolution. 1989;43(1):223-5. 55. Weir BS, Cockerham CC. Estimating F-statistics for the analysis of population structure. evolution. 1984:1358-70. 56. Jost L. GST and its relatives do not measure differentiation. Molecular Ecology. 2008;17(18):4015-26. 57. Crawford NG. SMOGD: software for the measurement of genetic diversity. Molecular Ecology Resources. 2010;10(3):556-7. 58. Pritchard JK, Stephens M, Donnelly P. Inference of population structure using multilocus genotype data. Genetics. 2000;155(2):945-59. 59. Durand E, Jay F, Gaggiotti OE, François O. Spatial inference of admixture proportions and secondary contact zones. Molecular Biology and Evolution. 2009;26(9):1963-73. 60. Evanno G, Regnaut S, Goudet J. Detecting the number of clusters of individuals using the software STRUCTURE: a simulation study. Molecular ecology. 2005;14(8):2611-20. 61. Earl DA. STRUCTURE HARVESTER: a website and program for visualizing STRUCTURE output and implementing the Evanno method. Conservation genetics resources. 2012;4(2):359-61. 62. Jakobsson M, Rosenberg NA. CLUMPP: a cluster matching and permutation program for dealing with label switching and multimodality in analysis of population structure. Bioinformatics. 2007;23(14):1801-6. 63. François O, Durand E. Spatially explicit Bayesian clustering models in population genetics. Molecular Ecology Resources. 2010;10(5):773-84.
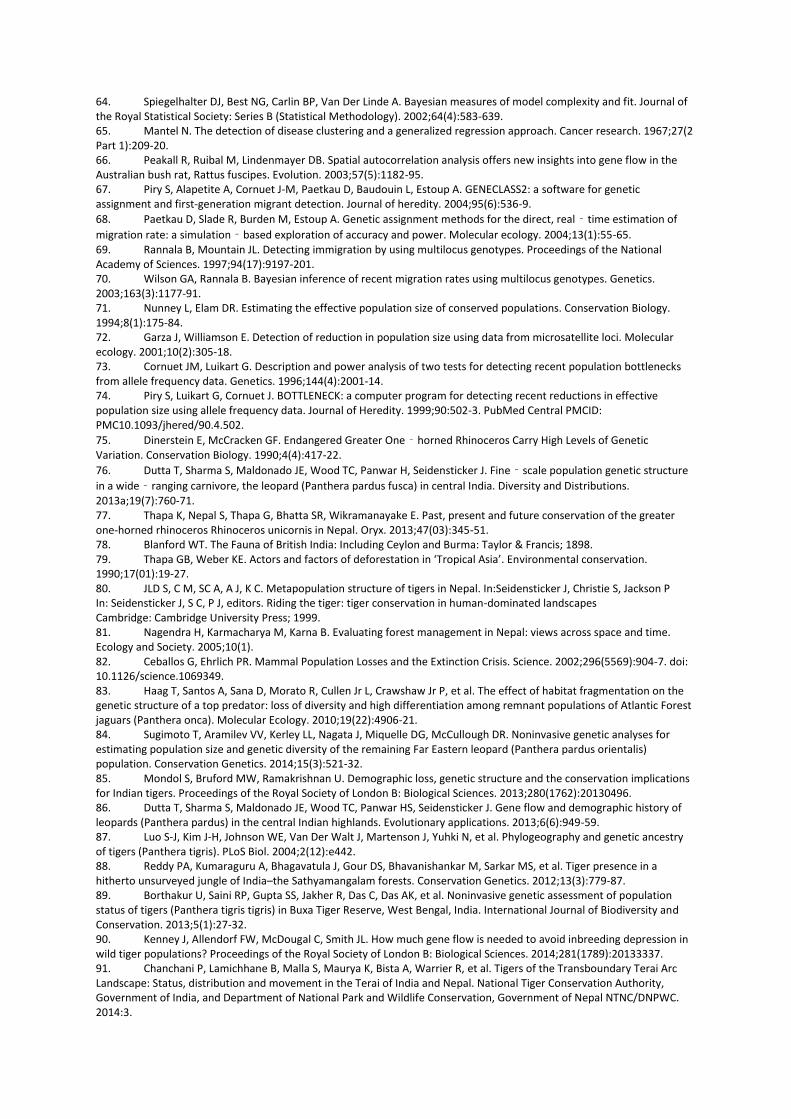
64. Spiegelhalter DJ, Best NG, Carlin BP, Van Der Linde A. Bayesian measures of model complexity and fit. Journal of the Royal Statistical Society: Series B (Statistical Methodology). 2002;64(4):583-639. 65. Mantel N. The detection of disease clustering and a generalized regression approach. Cancer research. 1967;27(2 Part 1):209-20. 66. Peakall R, Ruibal M, Lindenmayer DB. Spatial autocorrelation analysis offers new insights into gene flow in the Australian bush rat, Rattus fuscipes. Evolution. 2003;57(5):1182-95. 67. Piry S, Alapetite A, Cornuet J-M, Paetkau D, Baudouin L, Estoup A. GENECLASS2: a software for genetic assignment and first-generation migrant detection. Journal of heredity. 2004;95(6):536-9.
68. Paetkau D, Slade R, Burden M, Estoup A. Genetic assignment methods for the direct, real‐time estimation of
migration rate: a simulation‐based exploration of accuracy and power. Molecular ecology. 2004;13(1):55-65. 69. Rannala B, Mountain JL. Detecting immigration by using multilocus genotypes. Proceedings of the National Academy of Sciences. 1997;94(17):9197-201. 70. Wilson GA, Rannala B. Bayesian inference of recent migration rates using multilocus genotypes. Genetics. 2003;163(3):1177-91. 71. Nunney L, Elam DR. Estimating the effective population size of conserved populations. Conservation Biology. 1994;8(1):175-84. 72. Garza J, Williamson E. Detection of reduction in population size using data from microsatellite loci. Molecular ecology. 2001;10(2):305-18. 73. Cornuet JM, Luikart G. Description and power analysis of two tests for detecting recent population bottlenecks from allele frequency data. Genetics. 1996;144(4):2001-14. 74. Piry S, Luikart G, Cornuet J. BOTTLENECK: a computer program for detecting recent reductions in effective population size using allele frequency data. Journal of Heredity. 1999;90:502-3. PubMed Central PMCID: PMC10.1093/jhered/90.4.502.
75. Dinerstein E, McCracken GF. Endangered Greater One‐horned Rhinoceros Carry High Levels of Genetic Variation. Conservation Biology. 1990;4(4):417-22.
76. Dutta T, Sharma S, Maldonado JE, Wood TC, Panwar H, Seidensticker J. Fine‐scale population genetic structure
in a wide‐ranging carnivore, the leopard (Panthera pardus fusca) in central India. Diversity and Distributions. 2013a;19(7):760-71. 77. Thapa K, Nepal S, Thapa G, Bhatta SR, Wikramanayake E. Past, present and future conservation of the greater one-horned rhinoceros Rhinoceros unicornis in Nepal. Oryx. 2013;47(03):345-51. 78. Blanford WT. The Fauna of British India: Including Ceylon and Burma: Taylor & Francis; 1898. 79. Thapa GB, Weber KE. Actors and factors of deforestation in ‘Tropical Asia’. Environmental conservation. 1990;17(01):19-27. 80. JLD S, C M, SC A, A J, K C. Metapopulation structure of tigers in Nepal. In:Seidensticker J, Christie S, Jackson P In: Seidensticker J, S C, P J, editors. Riding the tiger: tiger conservation in human-dominated landscapes Cambridge: Cambridge University Press; 1999. 81. Nagendra H, Karmacharya M, Karna B. Evaluating forest management in Nepal: views across space and time. Ecology and Society. 2005;10(1). 82. Ceballos G, Ehrlich PR. Mammal Population Losses and the Extinction Crisis. Science. 2002;296(5569):904-7. doi: 10.1126/science.1069349. 83. Haag T, Santos A, Sana D, Morato R, Cullen Jr L, Crawshaw Jr P, et al. The effect of habitat fragmentation on the genetic structure of a top predator: loss of diversity and high differentiation among remnant populations of Atlantic Forest jaguars (Panthera onca). Molecular Ecology. 2010;19(22):4906-21. 84. Sugimoto T, Aramilev VV, Kerley LL, Nagata J, Miquelle DG, McCullough DR. Noninvasive genetic analyses for estimating population size and genetic diversity of the remaining Far Eastern leopard (Panthera pardus orientalis) population. Conservation Genetics. 2014;15(3):521-32. 85. Mondol S, Bruford MW, Ramakrishnan U. Demographic loss, genetic structure and the conservation implications for Indian tigers. Proceedings of the Royal Society of London B: Biological Sciences. 2013;280(1762):20130496. 86. Dutta T, Sharma S, Maldonado JE, Wood TC, Panwar HS, Seidensticker J. Gene flow and demographic history of leopards (Panthera pardus) in the central Indian highlands. Evolutionary applications. 2013;6(6):949-59. 87. Luo S-J, Kim J-H, Johnson WE, Van Der Walt J, Martenson J, Yuhki N, et al. Phylogeography and genetic ancestry of tigers (Panthera tigris). PLoS Biol. 2004;2(12):e442. 88. Reddy PA, Kumaraguru A, Bhagavatula J, Gour DS, Bhavanishankar M, Sarkar MS, et al. Tiger presence in a hitherto unsurveyed jungle of India–the Sathyamangalam forests. Conservation Genetics. 2012;13(3):779-87. 89. Borthakur U, Saini RP, Gupta SS, Jakher R, Das C, Das AK, et al. Noninvasive genetic assessment of population status of tigers (Panthera tigris tigris) in Buxa Tiger Reserve, West Bengal, India. International Journal of Biodiversity and Conservation. 2013;5(1):27-32. 90. Kenney J, Allendorf FW, McDougal C, Smith JL. How much gene flow is needed to avoid inbreeding depression in wild tiger populations? Proceedings of the Royal Society of London B: Biological Sciences. 2014;281(1789):20133337. 91. Chanchani P, Lamichhane B, Malla S, Maurya K, Bista A, Warrier R, et al. Tigers of the Transboundary Terai Arc Landscape: Status, distribution and movement in the Terai of India and Nepal. National Tiger Conservation Authority, Government of India, and Department of National Park and Wildlife Conservation, Government of Nepal NTNC/DNPWC. 2014:3.

92. Safner T, Miller MP, McRae BH, Fortin M-J, Manel S. Comparison of Bayesian clustering and edge detection methods for inferring boundaries in landscape genetics. International Journal of Molecular Sciences. 2011;12(2):865-89.
93. Blair C, Weigel DE, Balazik M, Keeley AT, Walker FM, Landguth E, et al. A simulation‐based evaluation of methods for inferring linear barriers to gene flow. Molecular Ecology Resources. 2012;12(5):822-33. 94. Patil N, Kumar N, Gopalaswamy AM, Karanth KU. Dispersing tiger makes a point. CAMBRIDGE UNIV PRESS 32 AVENUE OF THE AMERICAS, NEW YORK, NY 10013-2473 USA; 2011.
95. Peery MZ, Kirby R, Reid BN, Stoelting R, DOUCET‐BËER E, Robinson S, et al. Reliability of genetic bottleneck tests for detecting recent population declines. Molecular Ecology. 2012;21(14):3403-18. 96. Williamson-Natesan EG. Comparison of methods for detecting bottlenecks from microsatellite loci. Conservation Genetics. 2005;6(4):551-62. 97. Fabbri E, Caniglia R, Galov A, Arbanasid H, Lapini L, Boškovid I, et al. Genetic structure and expansion of golden jackals (Canis aureus) in the north-western distribution range (Croatia and eastern Italian Alps). Conservation genetics. 2014;15(1):187-99. 98. Nagendra H, Pareeth S, Sharma B, Schweik CM, Adhikari KR. Forest fragmentation and regrowth in an institutional mosaic of community, government and private ownership in Nepal. Landscape Ecology. 2008;23(1):41-54. 99. Acharya KP. Twenty-four years of community forestry in Nepal. International Forestry Review. 2002;4(2):149-56. 100. Shrestha TK, Aryal A, Rai RK, Lamsal RP, Koirala S, Jnawali D, et al. Balancing wildlife and human needs: the protected forest approach in Nepal. Natural Areas Journal. 2014;34(3):376-80. 101. GTI. Global tiger recovery program: implemetnation plan 2013-2014. Washington, DC: Global Tiger Initiative Secretariate.; 2013.
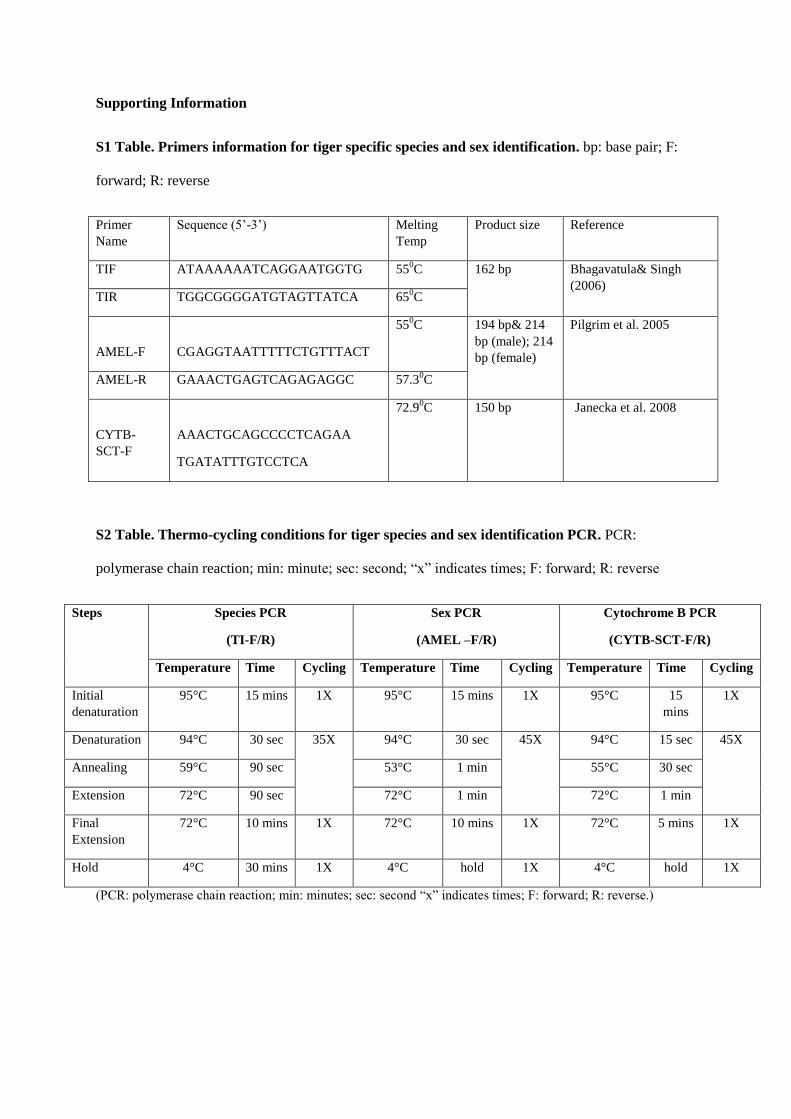
Supporting Information
S1 Table. Primers information for tiger specific species and sex identification. bp: base pair; F:
forward; R: reverse
Primer
Name
Sequence (5‘-3‘) Melting
Temp
Product size Reference
TIF ATAAAAAATCAGGAATGGTG 550C 162 bp Bhagavatula& Singh
(2006) TIR TGGCGGGGATGTAGTTATCA 65
0C
AMEL-F
CGAGGTAATTTTTCTGTTTACT
550C 194 bp& 214
bp (male); 214
bp (female)
Pilgrim et al. 2005
AMEL-R GAAACTGAGTCAGAGAGGC 57.30C
CYTB-
SCT-F
AAACTGCAGCCCCTCAGAA
TGATATTTGTCCTCA
72.90C 150 bp Janecka et al. 2008
S2 Table. Thermo-cycling conditions for tiger species and sex identification PCR. PCR:
polymerase chain reaction; min: minute; sec: second; ―x‖ indicates times; F: forward; R: reverse
Steps Species PCR
(TI-F/R)
Sex PCR
(AMEL –F/R)
Cytochrome B PCR
(CYTB-SCT-F/R)
Temperature Time Cycling Temperature Time Cycling Temperature Time Cycling
Initial
denaturation
95°C 15 mins 1X 95°C 15 mins 1X 95°C 15
mins
1X
Denaturation 94°C 30 sec 35X 94°C 30 sec 45X 94°C 15 sec 45X
Annealing 59°C 90 sec 53°C 1 min 55°C 30 sec
Extension 72°C 90 sec 72°C 1 min 72°C 1 min
Final
Extension
72°C 10 mins 1X 72°C 10 mins 1X 72°C 5 mins 1X
Hold 4°C 30 mins 1X 4°C hold 1X 4°C hold 1X
(PCR: polymerase chain reaction; min: minutes; sec: second ―x‖ indicates times; F: forward; R: reverse.)
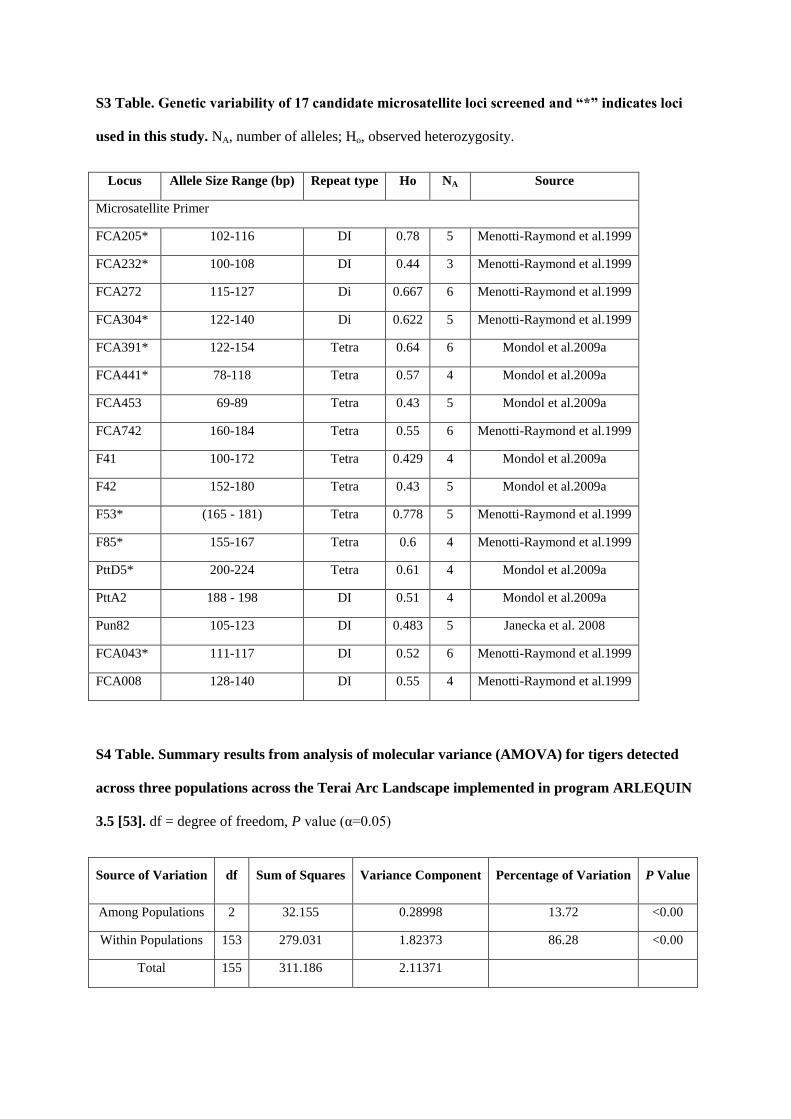
S3 Table. Genetic variability of 17 candidate microsatellite loci screened and “*” indicates loci
used in this study. NA, number of alleles; Ho, observed heterozygosity.
Locus Allele Size Range (bp) Repeat type Ho NA Source
Microsatellite Primer
FCA205* 102-116 DI 0.78 5 Menotti-Raymond et al.1999
FCA232* 100-108 DI 0.44 3 Menotti-Raymond et al.1999
FCA272 115-127 Di 0.667 6 Menotti-Raymond et al.1999
FCA304* 122-140 Di 0.622 5 Menotti-Raymond et al.1999
FCA391* 122-154 Tetra 0.64 6 Mondol et al.2009a
FCA441* 78-118 Tetra 0.57 4 Mondol et al.2009a
FCA453 69-89 Tetra 0.43 5 Mondol et al.2009a
FCA742 160-184 Tetra 0.55 6 Menotti-Raymond et al.1999
F41 100-172 Tetra 0.429 4 Mondol et al.2009a
F42 152-180 Tetra 0.43 5 Mondol et al.2009a
F53* (165 - 181) Tetra 0.778 5 Menotti-Raymond et al.1999
F85* 155-167 Tetra 0.6 4 Menotti-Raymond et al.1999
PttD5* 200-224 Tetra 0.61 4 Mondol et al.2009a
PttA2 188 - 198 DI 0.51 4 Mondol et al.2009a
Pun82 105-123 DI 0.483 5 Janecka et al. 2008
FCA043* 111-117 DI 0.52 6 Menotti-Raymond et al.1999
FCA008 128-140 DI 0.55 4 Menotti-Raymond et al.1999
S4 Table. Summary results from analysis of molecular variance (AMOVA) for tigers detected
across three populations across the Terai Arc Landscape implemented in program ARLEQUIN
3.5 [53]. df = degree of freedom, P value (α=0.05)
Source of Variation df Sum of Squares Variance Component Percentage of Variation P Value
Among Populations 2 32.155 0.28998 13.72 <0.00
Within Populations 153 279.031 1.82373 86.28 <0.00
Total 155 311.186 2.11371
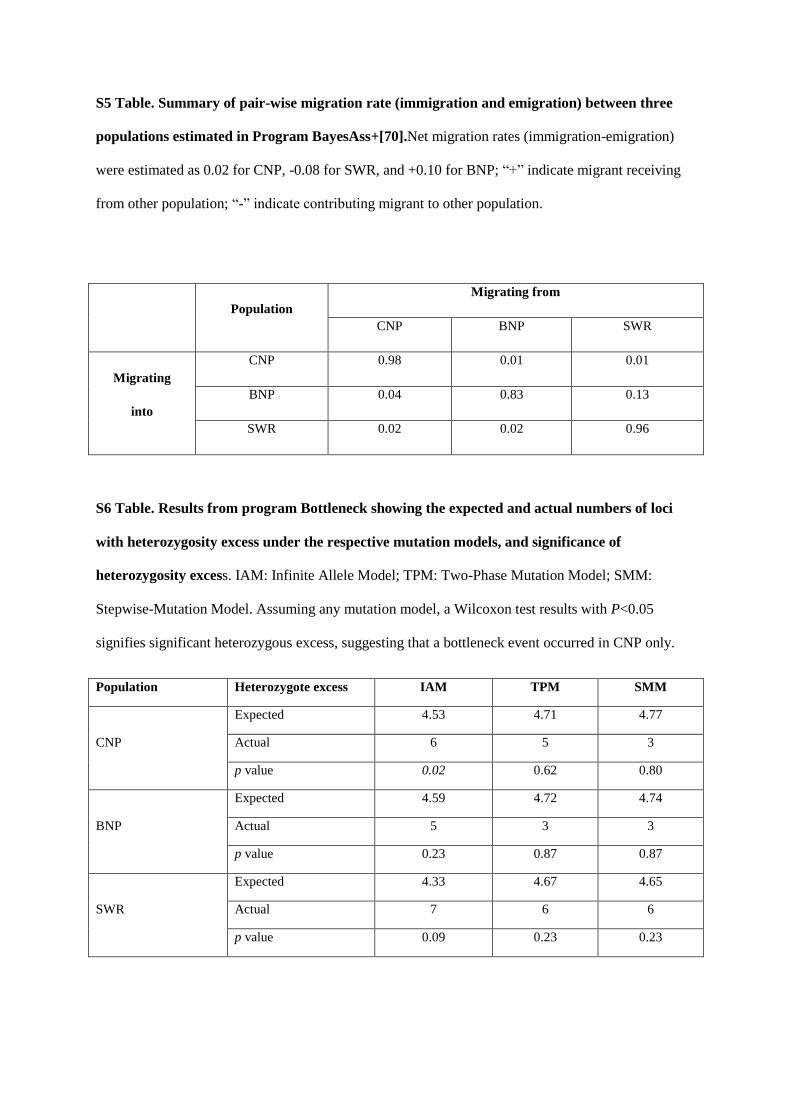
S5 Table. Summary of pair-wise migration rate (immigration and emigration) between three
populations estimated in Program BayesAss+[70].Net migration rates (immigration-emigration)
were estimated as 0.02 for CNP, -0.08 for SWR, and +0.10 for BNP; ―+‖ indicate migrant receiving
from other population; ―-‖ indicate contributing migrant to other population.
Population
Migrating from
CNP BNP SWR
Migrating
into
CNP 0.98 0.01 0.01
BNP 0.04 0.83 0.13
SWR 0.02 0.02 0.96
S6 Table. Results from program Bottleneck showing the expected and actual numbers of loci
with heterozygosity excess under the respective mutation models, and significance of
heterozygosity excess. IAM: Infinite Allele Model; TPM: Two-Phase Mutation Model; SMM:
Stepwise-Mutation Model. Assuming any mutation model, a Wilcoxon test results with P<0.05
signifies significant heterozygous excess, suggesting that a bottleneck event occurred in CNP only.
Population Heterozygote excess IAM TPM SMM
CNP
Expected 4.53 4.71 4.77
Actual 6 5 3
p value 0.02 0.62 0.80
BNP
Expected 4.59 4.72 4.74
Actual 5 3 3
p value 0.23 0.87 0.87
SWR
Expected 4.33 4.67 4.65
Actual 7 6 6
p value 0.09 0.23 0.23
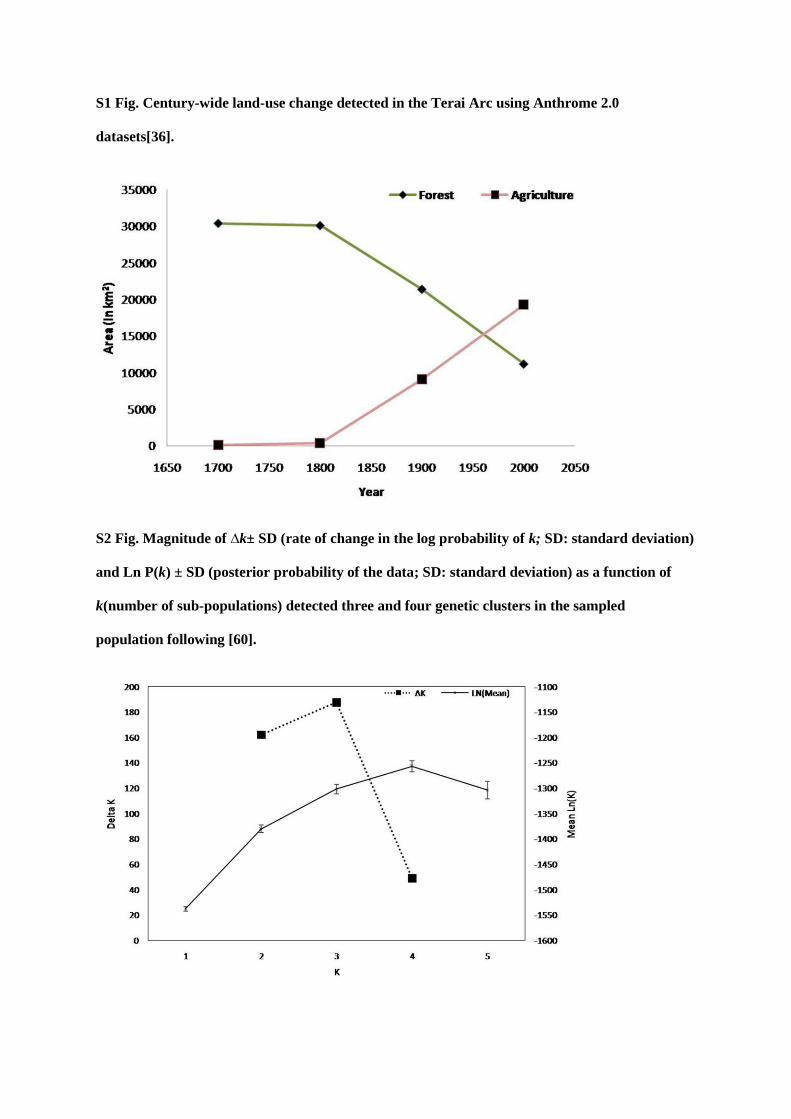
S1 Fig. Century-wide land-use change detected in the Terai Arc using Anthrome 2.0
datasets[36].
S2 Fig. Magnitude of ∆k± SD (rate of change in the log probability of k; SD: standard deviation)
and Ln P(k) ± SD (posterior probability of the data; SD: standard deviation) as a function of
k(number of sub-populations) detected three and four genetic clusters in the sampled
population following [60].
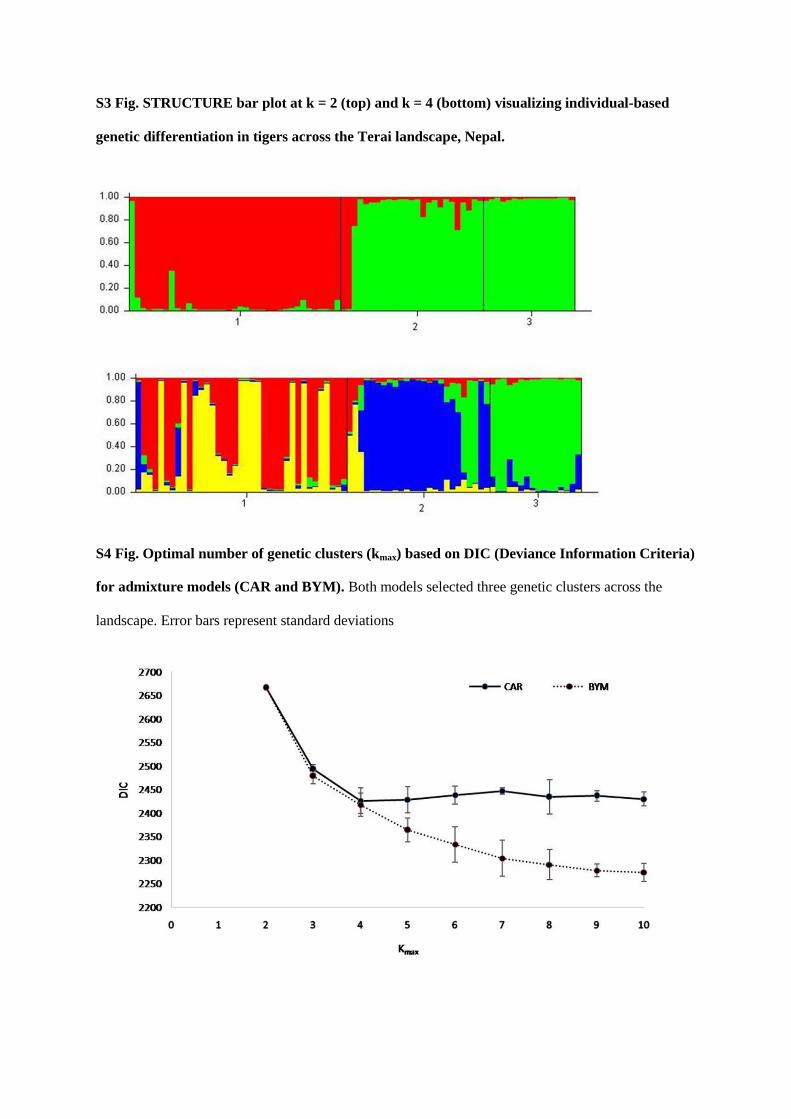
S3 Fig. STRUCTURE bar plot at k = 2 (top) and k = 4 (bottom) visualizing individual-based
genetic differentiation in tigers across the Terai landscape, Nepal.
S4 Fig. Optimal number of genetic clusters (kmax) based on DIC (Deviance Information Criteria)
for admixture models (CAR and BYM). Both models selected three genetic clusters across the
landscape. Error bars represent standard deviations
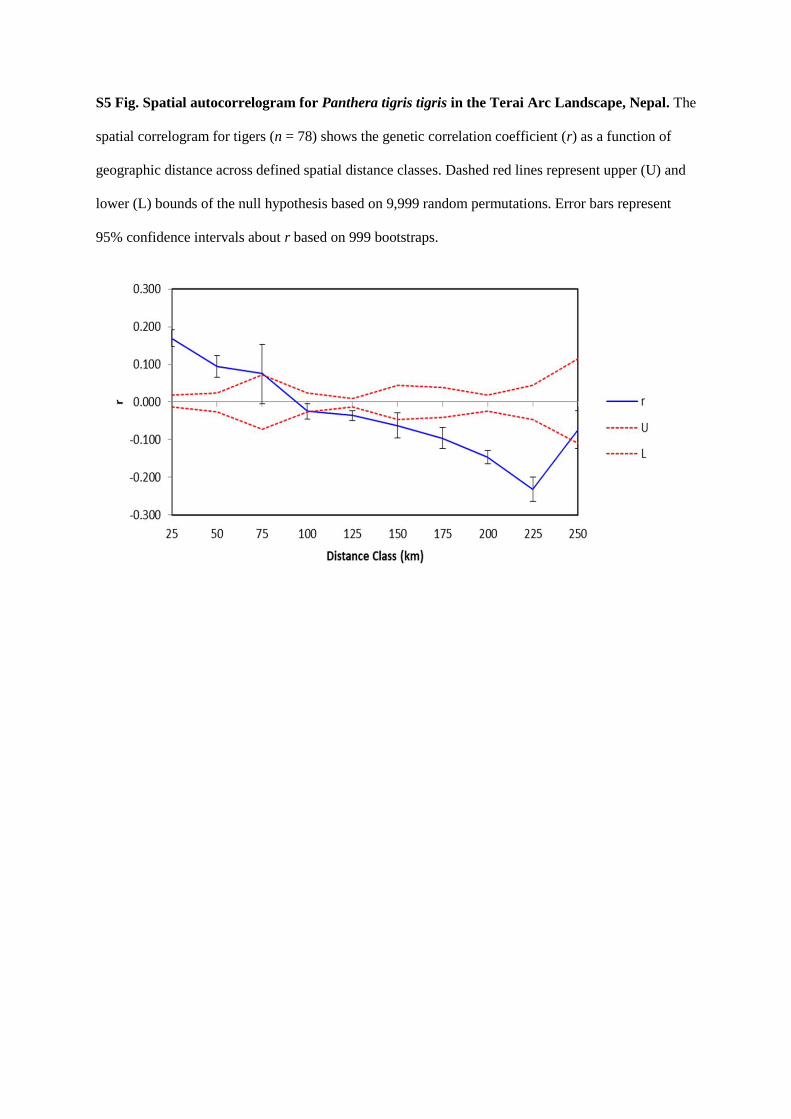
S5 Fig. Spatial autocorrelogram for Panthera tigris tigris in the Terai Arc Landscape, Nepal. The
spatial correlogram for tigers (n = 78) shows the genetic correlation coefficient (r) as a function of
geographic distance across defined spatial distance classes. Dashed red lines represent upper (U) and
lower (L) bounds of the null hypothesis based on 9,999 random permutations. Error bars represent
95% confidence intervals about r based on 999 bootstraps.
CHAPTER V
Species, sex and geo-location identification of seized tiger (Panthera tigris tigris) parts in Nepal-
a molecular forensic approach
Dibesh Karmacharya1,7
*, Adarsh M Sherchan1, Santosh Dulal
1, Prajwol Manandhar
1, Sulochana
Manandhar1, Jyoti Joshi
1, Susmita Bhattarai
1, Tarka R Bhatta
1, Nagendra Awasthi
1, Ajay N Sharma
1,
Manisha Bista1, Nawa R Silwal
2, Pravin Pokharel
2, Rom R Lamichhane
3, Netra Sharma
4, Bronwyn
Llewellyn4, Marcella J. Kelly
5, Digpal Gour
6, Lisette Waits
6, Jean M Hero
7, Jane Hughes
7
1 Center for Molecular Dynamics Nepal, Thapathali-11, Kathmandu, Nepal
2 Central Investigation Bureau (CIB), Pillar 4, Nepal Police, Kathmandu, Nepal
3 Bio-Diversity Section, Ministry of Forest and Soil Conservation, Kathmandu, Nepal
4 Environment Team, U.S. Agency for International Development (USAID), Kathmandu, Nepal
5Department of Fish and Wildlife Conservation, Virginia Tech, Blacksburg, Virginia, USA
6 Laboratory for Ecological, Evolutionary and Conservation Genetics, University of Idaho, USA
7School of Environment, Griffith University, Australia
(*Corresponding Author, Email: [email protected])
[This article has been submitted to PLOS One with a revised version based on review obtained: Jan
2018]
Abstract
Tiger (Panthera tigris) populations are in danger across their entire range due to habitat loss,
poaching and the demand of tiger parts. The Bengal tiger (Panthera tigris tigris) is an endangered
apex predator with a population size estimated to be less than 200 in Nepal. In spite of strict wildlife
protection laws, illegal trade in tiger parts has been increasing; and Nepal has become one of the
major sources and transit routes for poached wildlife parts. Identification of wildlife parts is often
challenging for law enforcement officials due to inadequate training and lack of available tools. Here
we describe a molecular forensic approach to gain insight into illegally trafficked tiger parts. We
created Nepal‘s first comprehensive reference genetic database of wild tigers through Nepal Tiger
Genome Project (2011-2013). This database has nuclear DNA microsatellite genotype and sex
profiles, including geo-spatial information, of over 60% (n=120) of the wild tigers of Nepal. We
analyzed 15 putative cases of confiscated poached tiger parts and all were confirmed to be tigers. Ten
were identified as males and five were females, and we determined probable geo-source location for 9
of 14 samples with 6-8 loci of nuclear DNA microsatellite data by combining inferences from three
different assignment methods. Six samples were assigned to Bardia National Park and one of these
was an exact match to a female tiger in our fecal DNA reference database. Two samples were
assigned to Shuklaphanta Wildlife Reserve. One sample was assigned to Chitwan National Park. We
are unable to definitively assign five samples which could be offspring of migrants or samples from
populations outside of Nepal. Our study revealed the western region, particularly Bardia National
Park, is a poaching hotspot for illegal tiger trade across the Terai Arc Landscape in Nepal. We present
scientific evidence to incriminate criminals in a court of law and advocate for the increased use of
molecular forensics in wildlife conservation efforts.
Keywords: Tiger, Wildlife crime, Terai arc landscape, Molecular Forensics, Tiger database
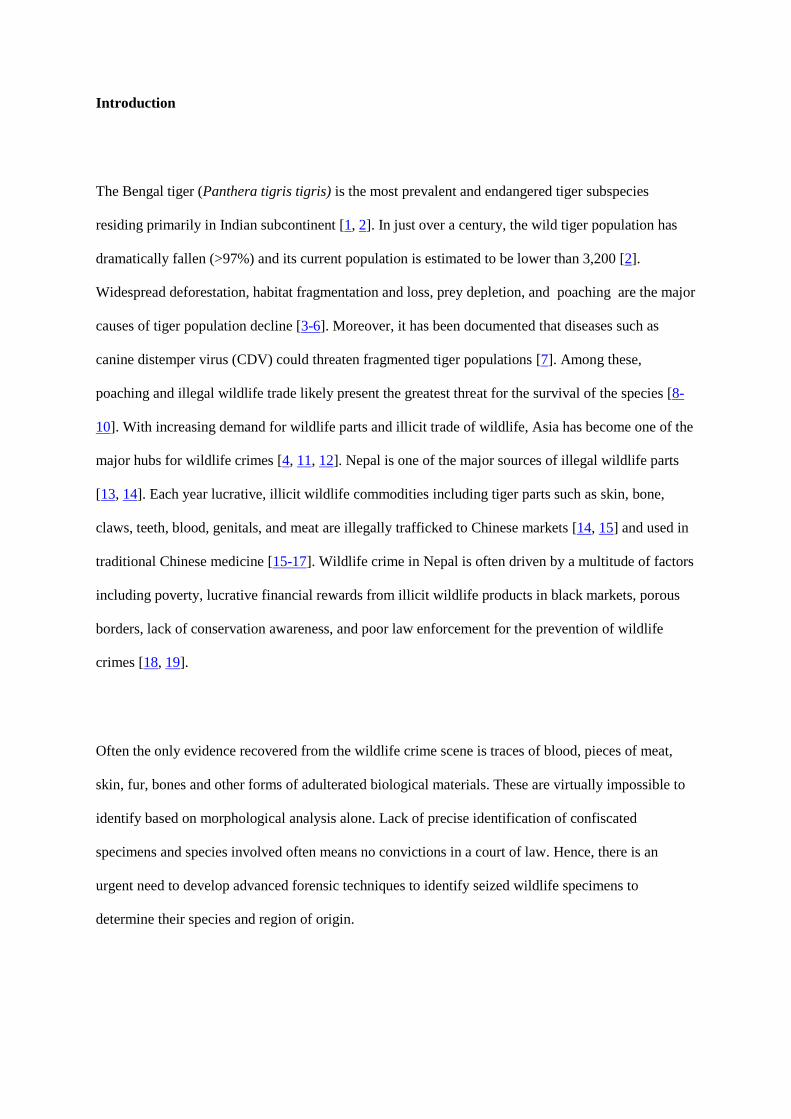
Introduction
The Bengal tiger (Panthera tigris tigris) is the most prevalent and endangered tiger subspecies
residing primarily in Indian subcontinent [1, 2]. In just over a century, the wild tiger population has
dramatically fallen (>97%) and its current population is estimated to be lower than 3,200 [2].
Widespread deforestation, habitat fragmentation and loss, prey depletion, and poaching are the major
causes of tiger population decline [3-6]. Moreover, it has been documented that diseases such as
canine distemper virus (CDV) could threaten fragmented tiger populations [7]. Among these,
poaching and illegal wildlife trade likely present the greatest threat for the survival of the species [8-
10]. With increasing demand for wildlife parts and illicit trade of wildlife, Asia has become one of the
major hubs for wildlife crimes [4, 11, 12]. Nepal is one of the major sources of illegal wildlife parts
[13, 14]. Each year lucrative, illicit wildlife commodities including tiger parts such as skin, bone,
claws, teeth, blood, genitals, and meat are illegally trafficked to Chinese markets [14, 15] and used in
traditional Chinese medicine [15-17]. Wildlife crime in Nepal is often driven by a multitude of factors
including poverty, lucrative financial rewards from illicit wildlife products in black markets, porous
borders, lack of conservation awareness, and poor law enforcement for the prevention of wildlife
crimes [18, 19].
Often the only evidence recovered from the wildlife crime scene is traces of blood, pieces of meat,
skin, fur, bones and other forms of adulterated biological materials. These are virtually impossible to
identify based on morphological analysis alone. Lack of precise identification of confiscated
specimens and species involved often means no convictions in a court of law. Hence, there is an
urgent need to develop advanced forensic techniques to identify seized wildlife specimens to
determine their species and region of origin.
Applications of DNA profiling in wildlife forensics remain rare, although they have been used
successfully in investigations for whales and dolphins conservation [20, 21]; in Canada with mule
deer, white-tailed deer, moose, caribou and black bear [22]; in Italy with poaching cases of wild boar
and wolves [23, 24]; in Africa with large seizures of elephant ivories [25-27] and in India with
seizures of leopard parts [28]. Use of this method in tiger conservation has been rare, though one
study demonstrated feasibility in a tiger bone smuggling case in China [29] and in the illegal sale of
tiger meat from a circus tiger [30]. In Nepal, utility of genetic tools in both population studies and
forensics have not yet been explored for tigers [31], although recently tiger population genetics study
was completed through Nepal Tiger Genome Project (NTGP) (2011-2013) [32].
Genetic tools combined with geo-location baseline data on species can discern geographic origin of
confiscated wildlife parts and their derivatives [22, 25-28, 33, 34]. This kind of information can be
useful for conservation managers to prioritize their efforts in effective anti-poaching activities. In
reviewing success of investments in tiger conservation, best practices in anti-poaching projects have
been those incorporating scientifically sound wildlife monitoring; projects that have been
unsuccessful failed to effectively disseminate data to management and other conservation institutions
[35]. The Government of Nepal (GoN) has asserted that volume of seized tiger parts is high. Nepal is
both a source and a conduit for wildlife parts trafficking into China/Tibet and other areas. Hence there
is a need to utilize new approaches to prevent poaching and illegal trade in tiger parts. The GoN has
proposed establishing a system to better track records of poaching incidences, confiscation and
enforcement of CITES by increasing capacity for identifying animal parts and their derivatives using
effective and modern DNA based forensic tools. [31]
Molecular forensics can provide DNA evidence from illegal wildlife seizures on species, sex and
individuals of poached animals with relatively high accuracy [25, 26, 28, 34, 36-41]. Using a geo-
spatial reference genetic database, we can determine individual or sub-population level source of the
seized parts. Various statistical and computational analyses can assign the most probable geographical
location from which the seized animal parts originated. In Nepal, the main habitat of the Bengal tiger
is the Terai Arc Landscape (TAL) which includes five protected areas (Banke National Park, Bardia
National Park (BNP), Chitwan National Park (CNP), Parsa Wildlife Reserve (PWR) and Suklaphanta
Wildlife Reserve(SWR)) [42, 43].
The primary goal of this study is to use a molecular forensic approach for species, sex and geo-source
location identification of seized tiger parts using our previously developed comprehensive geo-spatial
genetic (DNA) reference database of wild tigers of Nepal [32]. This database now has geo-spatial
information on sex and individual identification for 120 wild tigers of Nepal, which represent 60% of
the estimated 200 tigers in the country. We received 15 confiscated putative tiger parts from the
Central Investigation Bureau (CIB) of Nepal Police and carried out molecular forensic analysis to
determine their species, sex, and probable geo-location source.
Materials and Methods
Source of forensic samples
The laboratory of the Center for Molecular Dynamics Nepal (CMDN) received a total of fifteen
seized putative tiger parts which included thirteen skin pieces and two blood smeared knives (S1 Fig)
from the CIB (S1 Table ). These samples were labeled, photographed and stored with desiccant at
room temperature. Samples were seized from different parts of Nepal from 2014 to 2016.
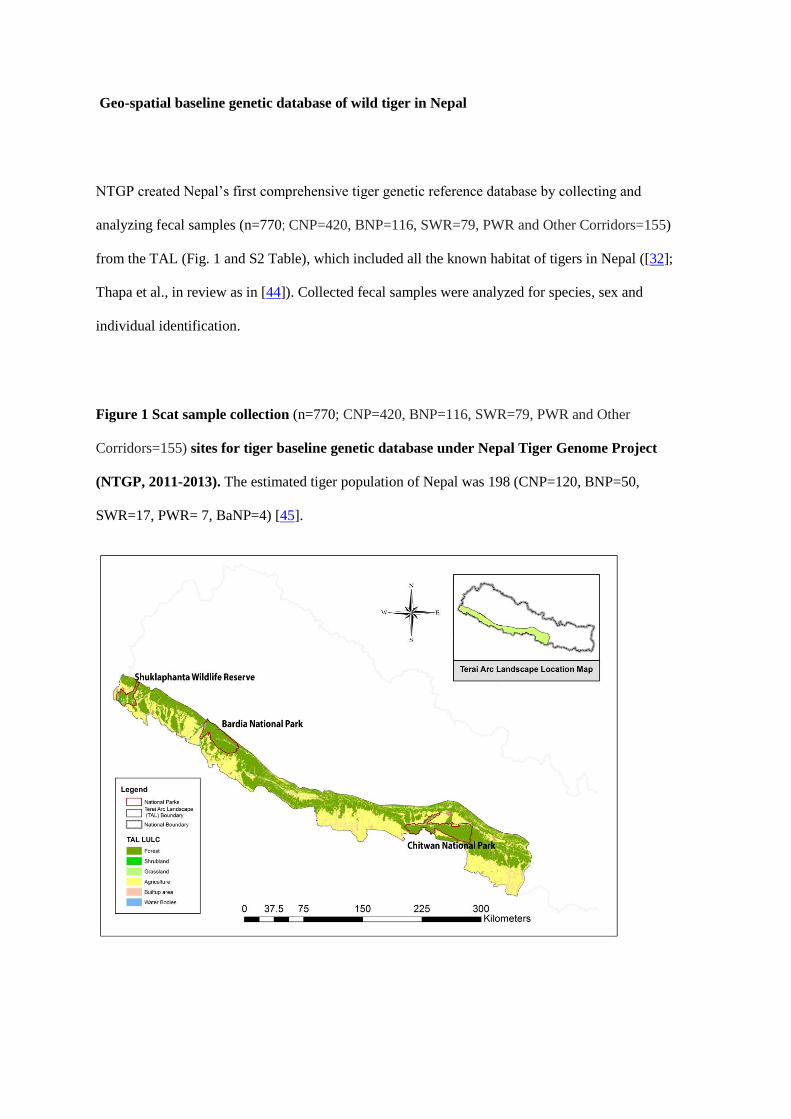
Geo-spatial baseline genetic database of wild tiger in Nepal
NTGP created Nepal‘s first comprehensive tiger genetic reference database by collecting and
analyzing fecal samples (n=770; CNP=420, BNP=116, SWR=79, PWR and Other Corridors=155)
from the TAL (Fig. 1 and S2 Table), which included all the known habitat of tigers in Nepal ([32];
Thapa et al., in review as in [44]). Collected fecal samples were analyzed for species, sex and
individual identification.
Figure 1 Scat sample collection (n=770; CNP=420, BNP=116, SWR=79, PWR and Other
Corridors=155) sites for tiger baseline genetic database under Nepal Tiger Genome Project
(NTGP, 2011-2013). The estimated tiger population of Nepal was 198 (CNP=120, BNP=50,
SWR=17, PWR= 7, BaNP=4) [45].
Genetic analyses of forensic samples-
DNA extraction
DNA was extracted using DNeasy Blood and Tissue Kit as per manufacturer‘s instruction (Qiagen
Inc., Germany) [46]. A 1 cm2 piece of skin (forensic) sample was cut using a sterile scissors and was
digested overnight at 56 C in 180 μL ATL and 20 μL Proteinase K solution. Extracted DNA was
precipitated with ethanol and purification conducted in a spin column following kit protocol. For
blood smeared knife, samples were taken by swabbing the smeared surface with a sterile cotton swab
saturated with phosphate buffer saline. DNA was extracted using protocol similar to that used for skin
samples. Each batch of DNA extraction included a negative extraction control. Precaution was taken
to avoid contamination. Extracted DNA was stored at -20 °C.
Tiger Identification
Tigers were identified using a PCR assay that used tiger specific mtDNA Cytochrome-b (CYT-B)
primers [47]. A total of 7 μL PCR reaction was prepared containing 3.5 μL of 2X Qiagen multiplex
mastermix, 0.7 μL Q-solution, 200 nM each CYT-B primer sets and 1.5 μL of extracted DNA. The
thermocycling condition was 95 ºC for 15 min followed by 35 cycles of 94 ºC for 30 sec, 59 ºC for 90
sec and 72 ºC for 90 sec with the final extension at 72 ºC for 10 min. Amplified 162 bp target PCR
product was visualized under 1.5% agarose gel electrophoresis (S2 Fig).
Tiger sex identification
Sex of identified tiger samples was determined by amplifying Amelogenin (AMEL) gene of sex
chromosomes developed by Pilgrim et al. [48]. A 7 μL PCR reaction was prepared containing 3.5 μL
of 2X Qiagen multiplex mastermix, 0.7 μL Q-solution, 200 nM each AMEL forward and reverse
primers and 1.5 μL of extracted DNA. The thermocycling condition was 95 ºC for 15 min followed by
45 total cycles of 94 ºC for 30 sec, 53 ºC for 60 sec and 72 ºC for 60 sec with final extension at 72 ºC
for 10 min. Amplified PCR products were visualized in 3% agarose gel electrophoresis. Female
samples yielded a single (214 bp) PCR band, while two bands (194 bp and 214 bp) identified male
samples . Each sample was run in triplicate. Samples that had amplification of X and Y alleles on at
least two out of three replicates were identified as male. Samples that had only X allele amplification
in all three replicates were assigned as female following protocol described by Janecka et al. (2008)
[49].
Individual identification
Individual tigers were identified using a panel of microsatellite markers (n=10) developed from the
domestic cat (Felis catus) and tiger (Panthera tigris tigris) genomes [50-52]. PCR amplification was
carried out in a 7 µL reaction volume containing 3.5 µL of Qiagen multiplex master-mix (Qiagen Inc.,
Germany), 0.7 µL of Q solution, each ten microsatellite primers (FCA391: 0.2 µM, PttD5: 0.07 µM,
FCA232: 0.14 µM, FCA304: 0.07 µM, F85: 0.30 µM, FCA441: 0.14 µM, FCA043: 0.09 µM, and
F53: 0.49 µM) and 2.5 µL of DNA template. The PCR thermocycling condition was 95 ºC for 15 min
with a 10 cycles of touchdown step (94 ºC for 30 sec, initial annealing at 62 ºC reduced by 0.5 ºC in
each cycle for 90 sec and extension at 72 ºC for 60 sec), followed by 25 cycles of 94 ºC for 30 sec, 57
ºC for 90 sec and 72 ºC for 60 sec, and a final extension at 72 ºC for 10 min. Amplified product (0.7
µL) was genotyped by adding 0.3 µL of LIZ-500 size standard in ABI 310 genetic analyzer (Applied
Biosystems, USA). Microsatellite alleles were scored in GENEMAPPER-4.1 (Applied Biosystems,
USA). To finalize the consensus genotypes, a multi-tube approach was used where at least three
identical homozygote PCR results were required for a genotype homozygote call; each allele was
observed in two independent PCRs to record a heterozygous genotype [53]. We calculated probability
of identification (PID) to be 1.5E-06 and probability of identity among siblings (PID(sibs)) to be 3.2E-03
(<0.01) for 8 loci, and achieved an overall genotyping success of 40%. Of all the evaluated
microsatellite markers, eight were selected for genetic analysis of all samples with fairly high overall
PCR amplification success (84%) and genotyping accuracy (82%) (S3 Table). Two additional
microsatellite markers (FCA205 and PttA2) were included in the PCR multiplex but were not
considered in the individual identification as one (Locus FCA205) did not amplify in the majority of
samples and the other (PttA2) was not polymorphic. Similarly, the mean allelic dropout rate was
2.46% and false alleles were around 15.85% (Thapa et al., in review).
Population genetic analysis
The 8 loci microsatellite genotypes from 120 identified individual tigers were used as the reference
baseline data obtained through NTGP [32]. A Bayesian clustering approach was used to determine the
genetic structure in tiger population using STRUCTURE version 2.3.4 software [54, 55]. The
Bayesian clustering was implemented using 2,000,000 Markov chain Monte Carlo (MCMC)
replications after initial 500,000 burn-in with repetitions of the analysis for 10 independent times per
each assumed population (K=1 to 6). This analysis was run using the admixture model with correlated
allele frequencies and was tested under supervised (with LOCPRIOR) and unsupervised (without
LOCPRIOR) learning algorithms. In supervised method, sampling location information consisting of
three geographical locations (N=3) were provided as a priori information, whereas it was not
provided in unsupervised method. The rate of change of likelihood (delta K) value was estimated by
Evanno method [56] to determine the optimal numbers of genetic clusters or populations present in
our reference genotype data for both supervised and unsupervised analysis using STRUCTURE
HARVESTER, a web-version program as described [57]. The percentage of inferred ancestry (Q-
scores) for each samples from 10 independent runs were aggregated into an average Q-scores using
CLUMPP version 1.1.2 software [58].
Forensic assignment of unknown samples
Forensic assignment was conducted using Bayesian clustering analyses with baseline data and
frequency and Bayesian assignment tests using reference populations. A STRUCTURE analysis with
same parameters as described above was performed by incorporating the genotype data from forensic
samples of unknown population of origin (PopInfo=0) and known population samples (PopInfo=1).
The membership of unknown samples to a sub-population was determined based on assignment to
distinct population cluster using percentage of Q-score distribution of each unknown samples. We
interpreted results as an assignment to one of the source populations when average q value scores ≥
70% and classified individuals with < 70% as unassigned and admixed [59]. Geneclass2 [60] was
used to estimate the probability of assignment to each source population with assignment threshold
score of 0.05 using the Paetkau et al 1995 frequency based method [61] with a missing allele
frequency of 0.01 and Rannala and Mountain‘s Bayesian method [62]. We assigned an individual to a
population of origin when the probability of assignment was >0.99 and classified as unassigned when
less than this value. To establish conservative criteria for forensic assignment, we required a sample to
meet the assignment criteria defined above for 2 of the 3 methods. These three methods were chosen
because they have been shown to perform well in accurately assigning individuals in multiple studies
[34, 63, 64].
Results
Genetic analyses
All forensic samples (n=15) were from tigers (S2 Fig). Sex identification revealed males (n=10) and
females (n=5) (S3 Fig) through AMEL gene PCR. There was 100% genotyping success on all forensic
samples across all eight loci (S4 Table), except for one of the blood-smeared knife samples (F-NP-
0012) in which more than half of the loci failed to amplify. An admixed genotype (microsatellite loci)
pattern was observed in F-NP-0012, where three different alleles were detected at three loci FCA391,
FCA232 and FCA043 hence, this sample was excluded from further analyses. By using matching tool
in GenAlEx [65], the genotypes of one of the forensic samples (F-NP-0004, determined as female
(Table 1)) was found to match completely across all loci (n=8) with a female tiger that is in the NTGP
baseline tiger reference database from BNP.
Reference population genetic structure
The supervised approach (with LOCPRIOR) of Bayesian clustering analysis performed in
STRUCTURE predicted two as the most probable number of genetic clusters (K=2) based on Evanno
methodology, where one group consisted of samples from CNP, while the other constituted of
samples from BNP and SWR (Fig 2 and S4 Fig). However, K=3 was the most supported structure
from mean likelihood (mean LnP(K) = -2097.47 and SD=9.6), and q value plots where the three
clusters corresponded to those samples from CNP, BNP and SWR. The latter structure pattern with
three genetic clusters (K=3) was also demonstrated to be the clearest to interpret from Q-score plots
across CNP, BNP and SWR, making an effective reference structure that would be essential for
forensic assignment of unknown samples.
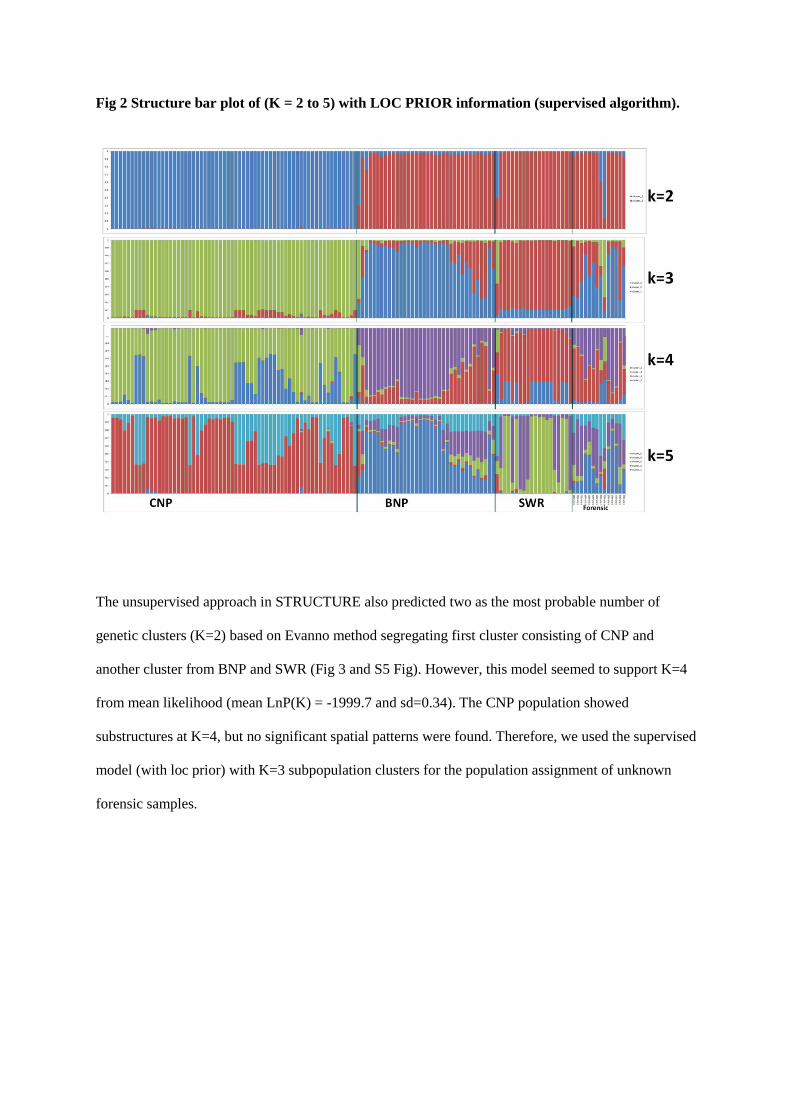
Fig 2 Structure bar plot of (K = 2 to 5) with LOC PRIOR information (supervised algorithm).
The unsupervised approach in STRUCTURE also predicted two as the most probable number of
genetic clusters (K=2) based on Evanno method segregating first cluster consisting of CNP and
another cluster from BNP and SWR (Fig 3 and S5 Fig). However, this model seemed to support K=4
from mean likelihood (mean LnP(K) = -1999.7 and sd=0.34). The CNP population showed
substructures at K=4, but no significant spatial patterns were found. Therefore, we used the supervised
model (with loc prior) with K=3 subpopulation clusters for the population assignment of unknown
forensic samples.
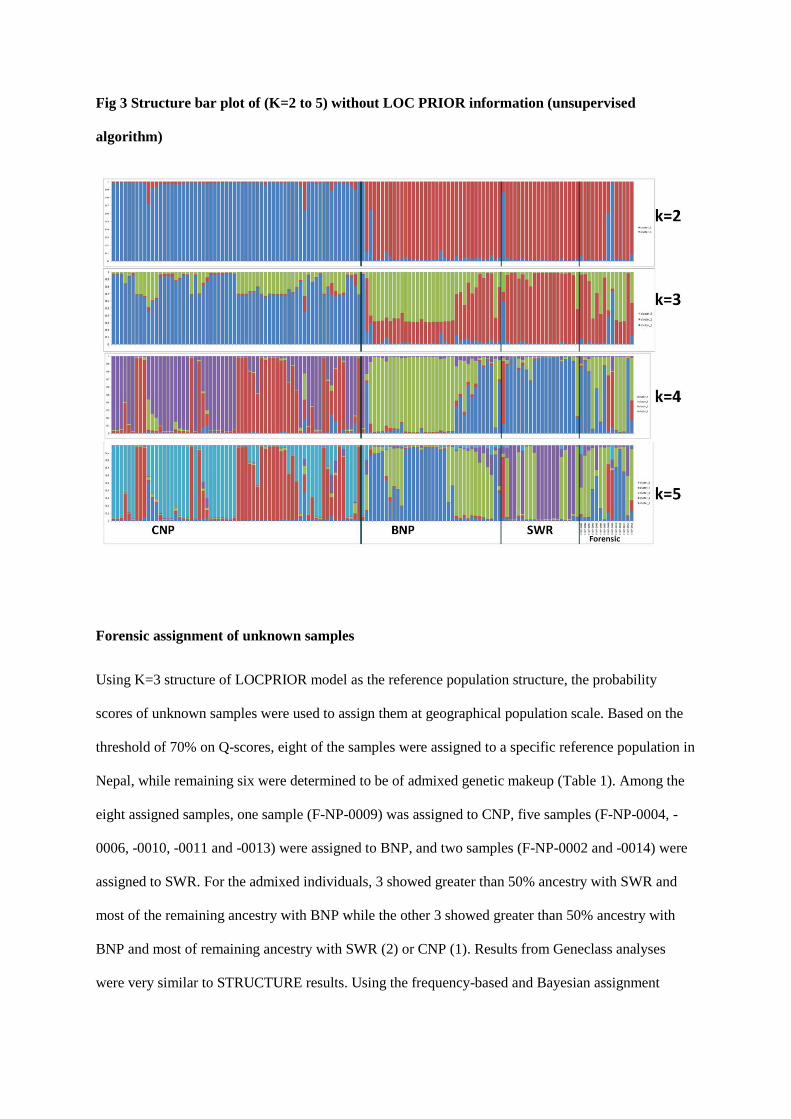
Fig 3 Structure bar plot of (K=2 to 5) without LOC PRIOR information (unsupervised
algorithm)
Forensic assignment of unknown samples
Using K=3 structure of LOCPRIOR model as the reference population structure, the probability
scores of unknown samples were used to assign them at geographical population scale. Based on the
threshold of 70% on Q-scores, eight of the samples were assigned to a specific reference population in
Nepal, while remaining six were determined to be of admixed genetic makeup (Table 1). Among the
eight assigned samples, one sample (F-NP-0009) was assigned to CNP, five samples (F-NP-0004, -
0006, -0010, -0011 and -0013) were assigned to BNP, and two samples (F-NP-0002 and -0014) were
assigned to SWR. For the admixed individuals, 3 showed greater than 50% ancestry with SWR and
most of the remaining ancestry with BNP while the other 3 showed greater than 50% ancestry with
BNP and most of remaining ancestry with SWR (2) or CNP (1). Results from Geneclass analyses
were very similar to STRUCTURE results. Using the frequency-based and Bayesian assignment
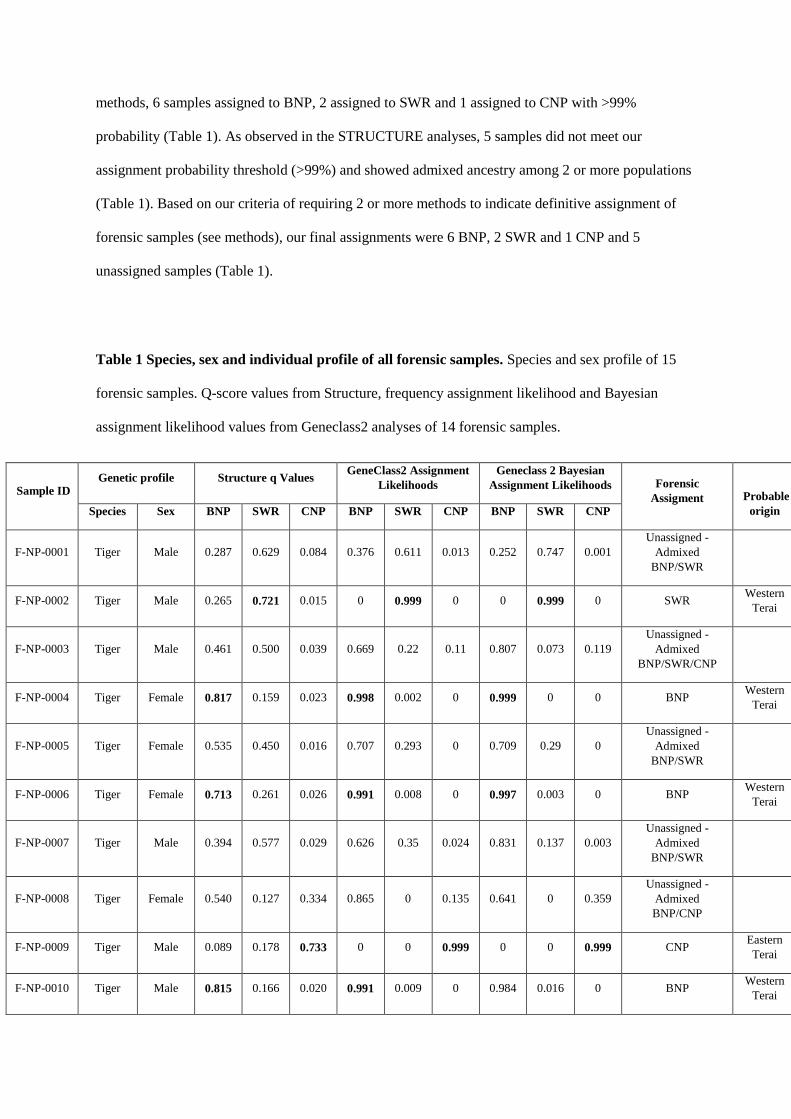
methods, 6 samples assigned to BNP, 2 assigned to SWR and 1 assigned to CNP with >99%
probability (Table 1). As observed in the STRUCTURE analyses, 5 samples did not meet our
assignment probability threshold (>99%) and showed admixed ancestry among 2 or more populations
(Table 1). Based on our criteria of requiring 2 or more methods to indicate definitive assignment of
forensic samples (see methods), our final assignments were 6 BNP, 2 SWR and 1 CNP and 5
unassigned samples (Table 1).
Table 1 Species, sex and individual profile of all forensic samples. Species and sex profile of 15
forensic samples. Q-score values from Structure, frequency assignment likelihood and Bayesian
assignment likelihood values from Geneclass2 analyses of 14 forensic samples.
Sample ID Genetic profile Structure q Values
GeneClass2 Assignment
Likelihoods
Geneclass 2 Bayesian
Assignment Likelihoods Forensic
Assigment
Probable
origin Species Sex BNP SWR CNP BNP SWR CNP BNP SWR CNP
F-NP-0001 Tiger Male 0.287 0.629 0.084 0.376 0.611 0.013 0.252 0.747 0.001
Unassigned -
Admixed
BNP/SWR
F-NP-0002 Tiger Male 0.265 0.721 0.015 0 0.999 0 0 0.999 0 SWR Western
Terai
F-NP-0003 Tiger Male 0.461 0.500 0.039 0.669 0.22 0.11 0.807 0.073 0.119
Unassigned -
Admixed
BNP/SWR/CNP
F-NP-0004 Tiger Female 0.817 0.159 0.023 0.998 0.002 0 0.999 0 0 BNP Western
Terai
F-NP-0005 Tiger Female 0.535 0.450 0.016 0.707 0.293 0 0.709 0.29 0
Unassigned -
Admixed
BNP/SWR
F-NP-0006 Tiger Female 0.713 0.261 0.026 0.991 0.008 0 0.997 0.003 0 BNP Western
Terai
F-NP-0007 Tiger Male 0.394 0.577 0.029 0.626 0.35 0.024 0.831 0.137 0.003
Unassigned -
Admixed
BNP/SWR
F-NP-0008 Tiger Female 0.540 0.127 0.334 0.865 0 0.135 0.641 0 0.359
Unassigned -
Admixed
BNP/CNP
F-NP-0009 Tiger Male 0.089 0.178 0.733 0 0 0.999 0 0 0.999 CNP Eastern
Terai
F-NP-0010 Tiger Male 0.815 0.166 0.020 0.991 0.009 0 0.984 0.016 0 BNP Western
Terai
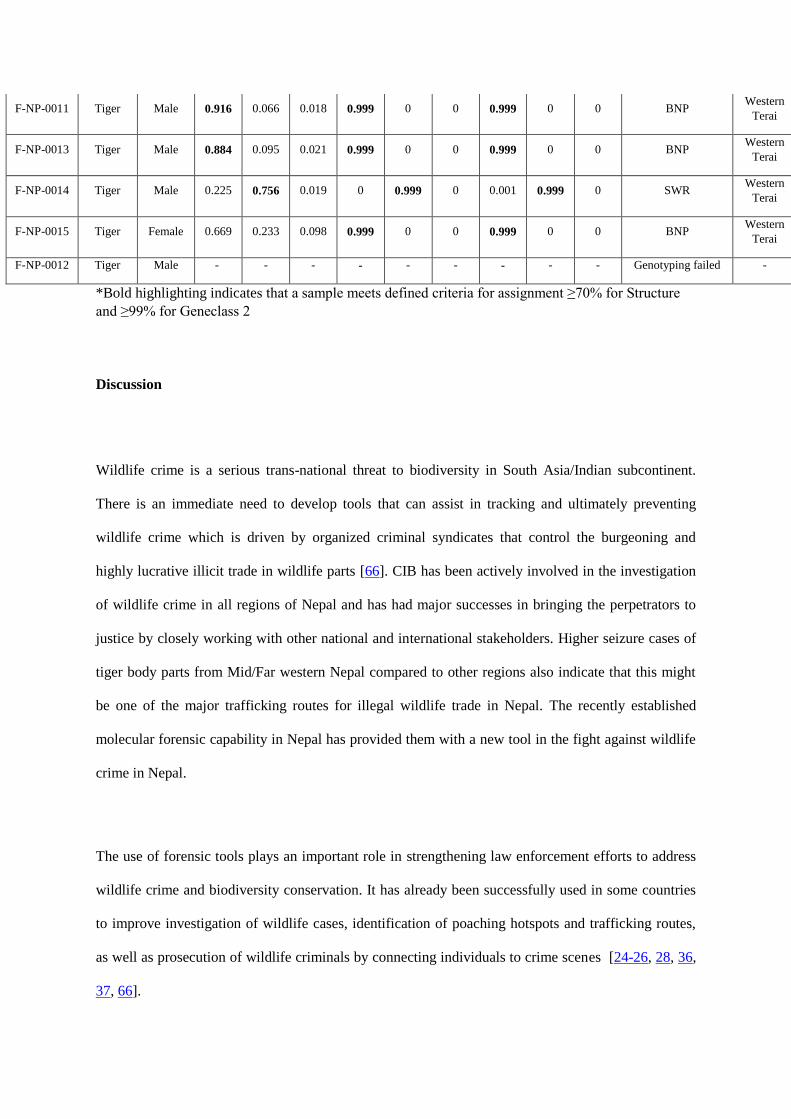
F-NP-0011 Tiger Male 0.916 0.066 0.018 0.999 0 0 0.999 0 0 BNP Western
Terai
F-NP-0013 Tiger Male 0.884 0.095 0.021 0.999 0 0 0.999 0 0 BNP Western
Terai
F-NP-0014 Tiger Male 0.225 0.756 0.019 0 0.999 0 0.001 0.999 0 SWR Western
Terai
F-NP-0015 Tiger Female 0.669 0.233 0.098 0.999 0 0 0.999 0 0 BNP Western
Terai
F-NP-0012 Tiger Male - - - - - - - - - Genotyping failed -
*Bold highlighting indicates that a sample meets defined criteria for assignment ≥70% for Structure
and ≥99% for Geneclass 2
Discussion
Wildlife crime is a serious trans-national threat to biodiversity in South Asia/Indian subcontinent.
There is an immediate need to develop tools that can assist in tracking and ultimately preventing
wildlife crime which is driven by organized criminal syndicates that control the burgeoning and
highly lucrative illicit trade in wildlife parts [66]. CIB has been actively involved in the investigation
of wildlife crime in all regions of Nepal and has had major successes in bringing the perpetrators to
justice by closely working with other national and international stakeholders. Higher seizure cases of
tiger body parts from Mid/Far western Nepal compared to other regions also indicate that this might
be one of the major trafficking routes for illegal wildlife trade in Nepal. The recently established
molecular forensic capability in Nepal has provided them with a new tool in the fight against wildlife
crime in Nepal.
The use of forensic tools plays an important role in strengthening law enforcement efforts to address
wildlife crime and biodiversity conservation. It has already been successfully used in some countries
to improve investigation of wildlife cases, identification of poaching hotspots and trafficking routes,
as well as prosecution of wildlife criminals by connecting individuals to crime scenes [24-26, 28, 36,
37, 66].
TAL is a biologically diverse habitat. Once alluvial grasslands and subtropical deciduous forests of
TAL has supported the highest recorded density of tigers in the world [67]. Poaching now remains a
great threat to tiger survival in this landscape. Dwindling tiger numbers in some protected areas call
into question the current protection strategy. Tiger populations in the western part of the TAL may
already have reached a dangerously low tipping-point, and further threat may push the sub-population
towards local extinction, as has occurred for rhino population across Babai River floodplain in BNP
[18, 68].
Application of molecular (DNA) forensics is relatively new and the rapidly evolving technology is
gaining acceptance in wildlife conservation efforts [69, 70]. The information obtained through the
forensic genetics is more robust and comprehensive than conventional methods [36, 71]. To fulfill the
urgency to address location of poached tigers, we created a wild tiger geo-spatial, genetic baseline
database through the NTGP [32]. This has provided valuable information on wildlife crime ―hot
spots‖ and presented scientific evidence to incriminate criminals in a court of law. We identified one
tiger skin (F-NP-0004; female) that had an exact DNA genotyping profile (PID (unrelated)1.5x10⁻⁶
; PID
(sibs) 3.2x10⁻³
) with one of our female reference NTGP tigers from BNP. We collected scats of that
individual in the winter of 2012; this particular individual was probably poached as recent as one to
two years ago. Of all the forensic evidence we analyzed, most were traced to BNP (Table 1),
highlighting this area as a wildlife crime hotspot. This is crucial information for Nepal‘s law
enforcement officials. After dissemination of these results (Table 1), the concerned stakeholders,
including the Nepal Police and the Nepal Army increased their patrols and intelligence activities
particularly in the BNP region. As a result, a few of the criminal networks involved in wildlife crime
in that area were discovered and necessary actions were taken supporting long term wildlife crime
prevention [72, 73]. Our analysis confirmed that 15 of 15 suspected tiger parts were from tigers and
10 of 15 samples were male.
The molecular assay we have used in our baseline tiger genetic database and forensic samples have
high probability of identification (PID; 1.5E-06) and probability of identification among siblings (PID
(sibs); 3.2E-03) with eight used highly polymorphic microsatellite loci [32]. Similarly, our species and
sex identification PCR assay was highly effective (Thapa et al., in review). Other studies have shown
that assignment tests can be very effective and accurate when pairwise Fst values between source
populations exceed 0.05 as is the case in this study [63] and (Thapa et al., in review). Using our
established criteria, we were able to definitely assign 9 of 14 individuals to a source population in
Nepal. Five individuals were unassigned and showed admixed genetic profiles between CNP, SWR
and BNP. These individuals may have been offspring of migrants. Previous research detected 3
migrants from SWR to BNP and showed higher gene flow from SWR into BNP than BNP to SWR.
This is also reflected in the STRUCTURE q value plots that show a larger proportion of admixed
individuals in BNP (Figure 2). Thus, these admixed individuals are more likely to have been poached
in BNP than SWR (Thapa et al., in review). Another possibility is that the samples came from across
the border in India where we did not have reference samples. To test this hypothesis, we generated
Nei‘s pairwise genetic distance values for all individuals and built a UPGMA phylogenetic tree to
search for outlier samples (S1 Supporting Information). Two of the unassigned samples (F-NP-0001
and -0008) in this analysis did not cluster with the 3 main groups and may represent individuals from
unsampled source populations in India.
Our tiger genetic database covers about 60% of estimated overall tiger population of Nepal and we do
not have any data from tiger habitats in India that share forest connectivity with Nepal. Hence, the
tiger source geo-location data and sub-population assignment analysis could have been more accurate
if we had a more comprehensive database of sampling including samples from the Indian tiger
population of TAL. We acknowledge that some of the samples assigned to regions in Nepal could
have been poached just across the border in India where tiger allele frequencies are likely similar.
There is now an urgent demand to have trans-boundary collaboration between tiger habitat countries
[74, 75] to build and to share standardized tiger genetic data so that comprehensive and cross-
referencing anti-poaching genetic database can be developed. We also recommend a molecular
forensic data validation process to evaluate accuracy of the technique and integrate this in courts of
law as admissible evidence in wildlife crime cases where this is not currently in place by conducting
multi-year scat surveys and building a robust baseline genetic database of wild tigers not only in
Nepal but throughout the tiger range countries in South Asia. There is an ongoing effort to have court
of law in Nepal accept DNA based evidence. To certain extent some DNA based evidence is accepted
(species identification). We are working with all the relevant stakeholders, including United States
Fish and Wildlife Services (USFWS) and INTERPOL to bring awareness on the utility of Molecular
Forensics in Nepal. This work is a major part of our effort in developing molecular forensic tool in the
fight against wildlife crime in the region.
Conclusions
The world is dealing with an unprecedented spike in illegal wildlife trade, threatening to overturn
decades of conservation gains. Wildlife trade is the fourth most lucrative illegal trade in the world
after drugs, human trafficking and the arms trade [76]. To combat wildlife crime through providing
scientifically accurate and reliable information, Nepal now has developed baseline geo-location based
genetic database of wild tigers and molecular forensic capacity. This database can be effectively used
to identify any tiger up to sub-population and/or individual level. With efforts like NTGP, developing
countries like Nepal have been making the significant progress in building capacity to gather
important biodiversity information on various wildlife species. This forensic study instructs the
crucial initiatives and activities to effective enforcement of laws for wildlife protection and
conservation by contributing a powerful tool in the fight against poaching and wildlife crime.
Acknowledgments
We would like to thank the Department of National Parks and Wildlife Conservation and the Ministry
of Forest and Soil Conservation (Nepal) for giving us permission to conduct the first genetic study of
tigers in Nepal. We would also like to thank CIB and the Nepal Police team for providing us with the
opportunity to analyze the samples. All our collaborators had important contributions in providing
valuable feedback while designing our study and analyzing data.
References
1. WWF. Overview and Threats of Tiger. Text. http://www.worldwildlife.org/species/tiger. World Wildlife Fund (WWF). 2016. 2. Perry R. The world of the tiger. Cassell and Comp. Ltd. London.1964. 264 p. 3. Seidensticker J. Saving wild tigers: a case study in biodiversity loss and challenges to be met for recovery beyond 2010. Integrative zoology. 2010;5(4):285-99. 4. Dinerstein E, Loucks C, Wikramanayake E, Ginsberg J, Sanderson E, Seidensticker J, et al. The fate of wild tigers. . BioScience. 2007;57(6):508-14.
5. Barber‐Meyer SM, Jnawali SR, Karki JB, Khanal P, Lohani S, Long B, et al. Influence of prey depletion and human
disturbance on tiger occupancy in Nepal. Journal of Zoology. 2013;289(1):10-8.
6. Kenney JS, Smith JL, Starfield AM, McDougal CW. The long‐term effects of tiger poaching on population viability. . Conservation Biology 1995 Oct 1;9(5):1127-33. 1995;9(5):1127-33. 7. Gilbert M, Soutyrina SV, Seryodkin IV, Sulikhan N, Uphyrkina OV, Goncharuk M, et al. Canine distemper virus as a threat to wild tigers in Russia and across their range. Integrative zoology. 2015;10(4):329-43. 8. McMurray CA. Testimony of Claudia A. McMurray to the Committee on Natural Resources of U.S. House of Representatives (5 March). Hearing on: poaching American security: impacts of illegal wildlife trade, Washington, D.C., USA. 2008. 9. Goodrich J, Lynam A, Miquelle D, Wibisono H, Kawanishi K, Pattanavibool A, et al. 2015. Panthera tigris. The IUCN Red List of Threatened Species 2015: e.T15955A50659951. http://dx.doi.org/10.2305/IUCN.UK.2015-2.RLTS.T15955A50659951.en. . 2015. 10. Brown P, Davies B. Trading to extinction. Dewi Lewis Publishing, UK. 2014. 11. Wyler LS, Sheikh PA. International illegal trade in wildlife: Threats and U.S. Policy. Congressional Research Service, USA. 2013. 12. Stoner SS, Pervushina N. Reduced to Skin and Bones Revisited: An Updated Analysis of Tiger Seizures from 12 Tiger Range Countries (2000–2012). TRAFFIC, Kuala Lumpur, Malaysia. 2013. 13. Yi-Ming L, Zenxiang G, Xinhai L, Sung W, Niemela J. Illegal wildlife trade in the Himalayan region of China.: Kluwer Academic Publishers, Netherlands; 2000. 901-18 p. 14. Moyle BJ. The black market in China for tiger products. Global Crime 2009;10(1-2):124-43. 15. Ellis R. Tiger bone & rhino horn: the destruction of wildlife for traditional Chinese medicine. Island Press. 2013. 16. Mainka SA, Mills JA. Wildlife and traditional Chinese medicine: supply and demand for wildlife species. Journal of zoo and wildlife medicine. 1995:193-200. 17. Gratwicke B, Mills J, Dutton A, Gabriel G, Long B, Seidensticker J, et al. Attitudes toward consumption and conservation of tigers in China. PloS one. 2008;3(7):e2544. 18. Martin EB, Martin C. Insurgency and poverty: recipe for rhino poaching in Nepal. Pachyderm. 2006;41:61-73. 19. Roe De. Conservation, crime and communities: case studies of efforts to engage local communities in tackling illegal wildlife trade. IIED, London. 2015. 20. Palumbi A, Cipriano F. Species identification using genetic tools: the value of nuclear and mitochondrial gene sequences in whale conservation. Journal of Heredity. 1998;89(5):459-64. 21. Baker C, Cipriano F, Palumbi S. Molecular genetic identification of whale and dolphin products from commercial markets in Korea and Japan. Molecular Ecology. 1996;5(5):671-85. 22. Ogden R, Dawnay N, McEwing R. Wildlife DNA forensics—bridging the gap between conservation genetics and law enforcement. Endangered Species Research. 2009;9(3):175-95. 23. Lorenzini R. DNA forensics and the poaching of wildlife in Italy: a case study. Forensic science international. 2005;153(2-3):218-21. 24. Caniglia R, Fabbri E, Greco C, Galaverni M, Randi E. Forensic DNA against wildlife poaching: identification of a serial wolf killing in Italy. Forensic science international Genetics. 2010;4(5):334-8. 25. Wasser SK, Shedlock AM, Comstock K, Ostrander EA, Mutayoba B, Stephens M. Assigning African elephant DNA to geographic region of origin: applications to the ivory trade. Proceedings of the National Academy of Sciences of the United States of America. 2004;101(41):14847-52. 26. Wasser SK, Mailand C, Booth R, Mutayoba B, Kisamo E, Clark B, et al. Using DNA to track the origin of the largest ivory seizure since the 1989 trade ban. Proceedings of the National Academy of Sciences. 2007;104(10):4228-33. 27. Wasser S, Brown L, Mailand C, Mondol S, Clark W, Laurie C, et al. Genetic assignment of large seizures of elephant ivory reveals Africa’s major poaching hotspots. Science. 2015;349(6243):84-7. 28. Mondol S, Sridhar V, Yadav P, Gubbi S, Ramakrishnan U. Tracing the geographic origin of traded leopard body parts in the indian subcontinent with DNA-based assignment tests. Conservation biology : the journal of the Society for Conservation Biology. 2015;29(2):556-64. 29. Xu YC, Li B, Li WS, Bai SY, Jin Y, Li XP, et al. Individualization of tiger by using microsatellites. Forensic science international. 2005;151(1):45-51. 30. Wan QH, Fang SG. Application of species-specific polymerase chain reaction in the forensic identification of tiger species. Forensic science international. 2003;131(1):75-8.
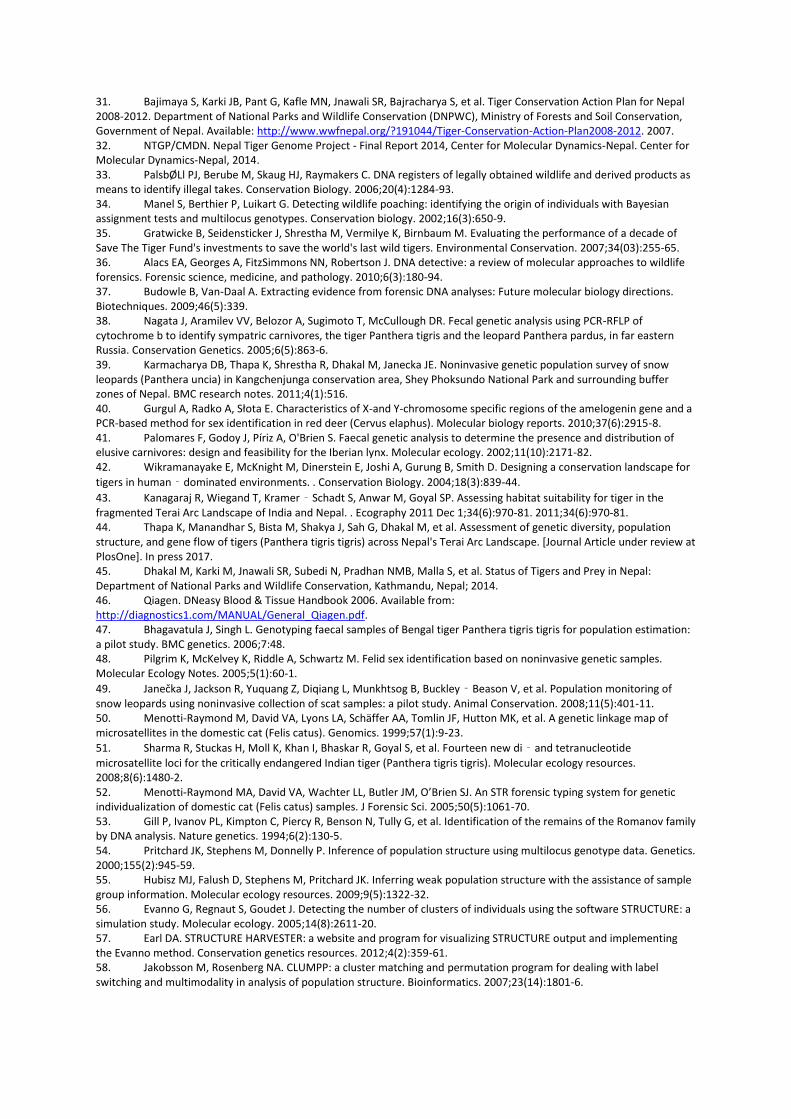
31. Bajimaya S, Karki JB, Pant G, Kafle MN, Jnawali SR, Bajracharya S, et al. Tiger Conservation Action Plan for Nepal 2008-2012. Department of National Parks and Wildlife Conservation (DNPWC), Ministry of Forests and Soil Conservation, Government of Nepal. Available: http://www.wwfnepal.org/?191044/Tiger-Conservation-Action-Plan2008-2012. 2007. 32. NTGP/CMDN. Nepal Tiger Genome Project - Final Report 2014, Center for Molecular Dynamics-Nepal. Center for Molecular Dynamics-Nepal, 2014. 33. PalsbØLl PJ, Berube M, Skaug HJ, Raymakers C. DNA registers of legally obtained wildlife and derived products as means to identify illegal takes. Conservation Biology. 2006;20(4):1284-93. 34. Manel S, Berthier P, Luikart G. Detecting wildlife poaching: identifying the origin of individuals with Bayesian assignment tests and multilocus genotypes. Conservation biology. 2002;16(3):650-9. 35. Gratwicke B, Seidensticker J, Shrestha M, Vermilye K, Birnbaum M. Evaluating the performance of a decade of Save The Tiger Fund's investments to save the world's last wild tigers. Environmental Conservation. 2007;34(03):255-65. 36. Alacs EA, Georges A, FitzSimmons NN, Robertson J. DNA detective: a review of molecular approaches to wildlife forensics. Forensic science, medicine, and pathology. 2010;6(3):180-94. 37. Budowle B, Van-Daal A. Extracting evidence from forensic DNA analyses: Future molecular biology directions. Biotechniques. 2009;46(5):339. 38. Nagata J, Aramilev VV, Belozor A, Sugimoto T, McCullough DR. Fecal genetic analysis using PCR-RFLP of cytochrome b to identify sympatric carnivores, the tiger Panthera tigris and the leopard Panthera pardus, in far eastern Russia. Conservation Genetics. 2005;6(5):863-6. 39. Karmacharya DB, Thapa K, Shrestha R, Dhakal M, Janecka JE. Noninvasive genetic population survey of snow leopards (Panthera uncia) in Kangchenjunga conservation area, Shey Phoksundo National Park and surrounding buffer zones of Nepal. BMC research notes. 2011;4(1):516. 40. Gurgul A, Radko A, Słota E. Characteristics of X-and Y-chromosome specific regions of the amelogenin gene and a PCR-based method for sex identification in red deer (Cervus elaphus). Molecular biology reports. 2010;37(6):2915-8. 41. Palomares F, Godoy J, Píriz A, O'Brien S. Faecal genetic analysis to determine the presence and distribution of elusive carnivores: design and feasibility for the Iberian lynx. Molecular ecology. 2002;11(10):2171-82. 42. Wikramanayake E, McKnight M, Dinerstein E, Joshi A, Gurung B, Smith D. Designing a conservation landscape for
tigers in human‐dominated environments. . Conservation Biology. 2004;18(3):839-44.
43. Kanagaraj R, Wiegand T, Kramer‐Schadt S, Anwar M, Goyal SP. Assessing habitat suitability for tiger in the fragmented Terai Arc Landscape of India and Nepal. . Ecography 2011 Dec 1;34(6):970-81. 2011;34(6):970-81. 44. Thapa K, Manandhar S, Bista M, Shakya J, Sah G, Dhakal M, et al. Assessment of genetic diversity, population structure, and gene flow of tigers (Panthera tigris tigris) across Nepal's Terai Arc Landscape. [Journal Article under review at PlosOne]. In press 2017. 45. Dhakal M, Karki M, Jnawali SR, Subedi N, Pradhan NMB, Malla S, et al. Status of Tigers and Prey in Nepal: Department of National Parks and Wildlife Conservation, Kathmandu, Nepal; 2014. 46. Qiagen. DNeasy Blood & Tissue Handbook 2006. Available from: http://diagnostics1.com/MANUAL/General_Qiagen.pdf. 47. Bhagavatula J, Singh L. Genotyping faecal samples of Bengal tiger Panthera tigris tigris for population estimation: a pilot study. BMC genetics. 2006;7:48. 48. Pilgrim K, McKelvey K, Riddle A, Schwartz M. Felid sex identification based on noninvasive genetic samples. Molecular Ecology Notes. 2005;5(1):60-1.
49. Janečka J, Jackson R, Yuquang Z, Diqiang L, Munkhtsog B, Buckley‐Beason V, et al. Population monitoring of snow leopards using noninvasive collection of scat samples: a pilot study. Animal Conservation. 2008;11(5):401-11. 50. Menotti-Raymond M, David VA, Lyons LA, Schäffer AA, Tomlin JF, Hutton MK, et al. A genetic linkage map of microsatellites in the domestic cat (Felis catus). Genomics. 1999;57(1):9-23.
51. Sharma R, Stuckas H, Moll K, Khan I, Bhaskar R, Goyal S, et al. Fourteen new di‐and tetranucleotide
microsatellite loci for the critically endangered Indian tiger (Panthera tigris tigris). Molecular ecology resources. 2008;8(6):1480-2. 52. Menotti-Raymond MA, David VA, Wachter LL, Butler JM, O’Brien SJ. An STR forensic typing system for genetic individualization of domestic cat (Felis catus) samples. J Forensic Sci. 2005;50(5):1061-70. 53. Gill P, Ivanov PL, Kimpton C, Piercy R, Benson N, Tully G, et al. Identification of the remains of the Romanov family by DNA analysis. Nature genetics. 1994;6(2):130-5. 54. Pritchard JK, Stephens M, Donnelly P. Inference of population structure using multilocus genotype data. Genetics. 2000;155(2):945-59. 55. Hubisz MJ, Falush D, Stephens M, Pritchard JK. Inferring weak population structure with the assistance of sample group information. Molecular ecology resources. 2009;9(5):1322-32. 56. Evanno G, Regnaut S, Goudet J. Detecting the number of clusters of individuals using the software STRUCTURE: a simulation study. Molecular ecology. 2005;14(8):2611-20. 57. Earl DA. STRUCTURE HARVESTER: a website and program for visualizing STRUCTURE output and implementing the Evanno method. Conservation genetics resources. 2012;4(2):359-61. 58. Jakobsson M, Rosenberg NA. CLUMPP: a cluster matching and permutation program for dealing with label switching and multimodality in analysis of population structure. Bioinformatics. 2007;23(14):1801-6.
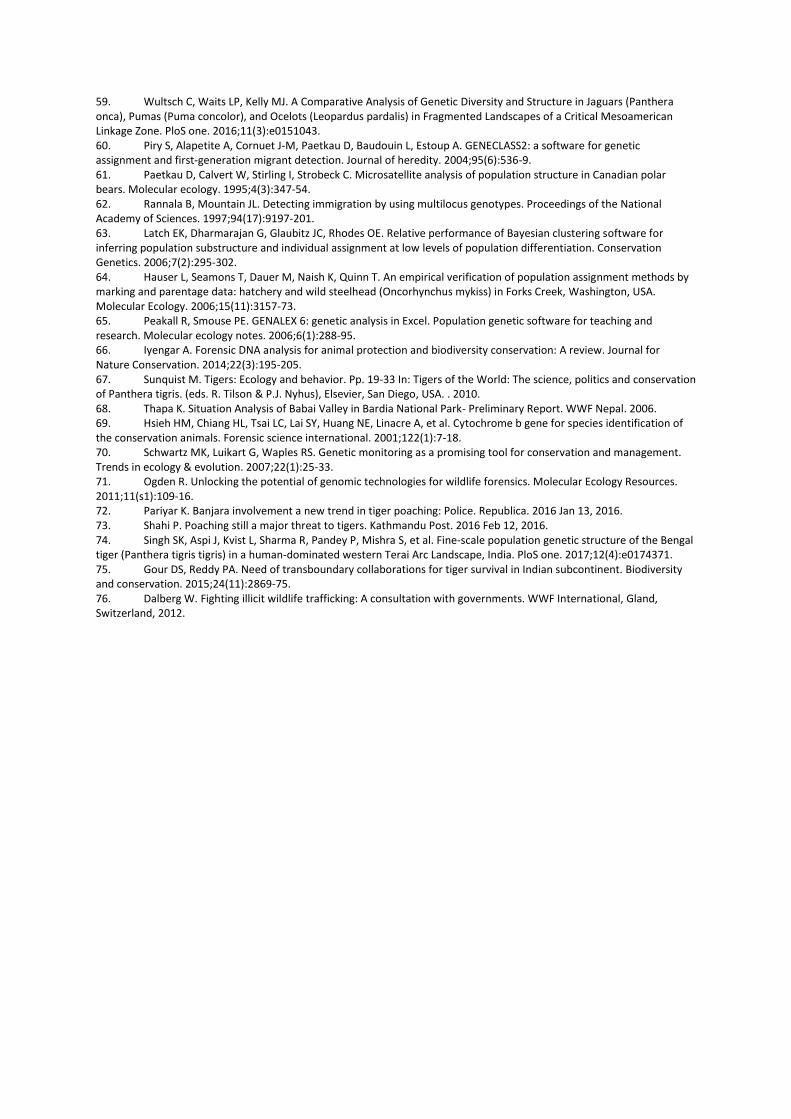
59. Wultsch C, Waits LP, Kelly MJ. A Comparative Analysis of Genetic Diversity and Structure in Jaguars (Panthera onca), Pumas (Puma concolor), and Ocelots (Leopardus pardalis) in Fragmented Landscapes of a Critical Mesoamerican Linkage Zone. PloS one. 2016;11(3):e0151043. 60. Piry S, Alapetite A, Cornuet J-M, Paetkau D, Baudouin L, Estoup A. GENECLASS2: a software for genetic assignment and first-generation migrant detection. Journal of heredity. 2004;95(6):536-9. 61. Paetkau D, Calvert W, Stirling I, Strobeck C. Microsatellite analysis of population structure in Canadian polar bears. Molecular ecology. 1995;4(3):347-54. 62. Rannala B, Mountain JL. Detecting immigration by using multilocus genotypes. Proceedings of the National Academy of Sciences. 1997;94(17):9197-201. 63. Latch EK, Dharmarajan G, Glaubitz JC, Rhodes OE. Relative performance of Bayesian clustering software for inferring population substructure and individual assignment at low levels of population differentiation. Conservation Genetics. 2006;7(2):295-302. 64. Hauser L, Seamons T, Dauer M, Naish K, Quinn T. An empirical verification of population assignment methods by marking and parentage data: hatchery and wild steelhead (Oncorhynchus mykiss) in Forks Creek, Washington, USA. Molecular Ecology. 2006;15(11):3157-73. 65. Peakall R, Smouse PE. GENALEX 6: genetic analysis in Excel. Population genetic software for teaching and research. Molecular ecology notes. 2006;6(1):288-95. 66. Iyengar A. Forensic DNA analysis for animal protection and biodiversity conservation: A review. Journal for Nature Conservation. 2014;22(3):195-205. 67. Sunquist M. Tigers: Ecology and behavior. Pp. 19-33 In: Tigers of the World: The science, politics and conservation of Panthera tigris. (eds. R. Tilson & P.J. Nyhus), Elsevier, San Diego, USA. . 2010. 68. Thapa K. Situation Analysis of Babai Valley in Bardia National Park- Preliminary Report. WWF Nepal. 2006. 69. Hsieh HM, Chiang HL, Tsai LC, Lai SY, Huang NE, Linacre A, et al. Cytochrome b gene for species identification of the conservation animals. Forensic science international. 2001;122(1):7-18. 70. Schwartz MK, Luikart G, Waples RS. Genetic monitoring as a promising tool for conservation and management. Trends in ecology & evolution. 2007;22(1):25-33. 71. Ogden R. Unlocking the potential of genomic technologies for wildlife forensics. Molecular Ecology Resources. 2011;11(s1):109-16. 72. Pariyar K. Banjara involvement a new trend in tiger poaching: Police. Republica. 2016 Jan 13, 2016. 73. Shahi P. Poaching still a major threat to tigers. Kathmandu Post. 2016 Feb 12, 2016. 74. Singh SK, Aspi J, Kvist L, Sharma R, Pandey P, Mishra S, et al. Fine-scale population genetic structure of the Bengal tiger (Panthera tigris tigris) in a human-dominated western Terai Arc Landscape, India. PloS one. 2017;12(4):e0174371. 75. Gour DS, Reddy PA. Need of transboundary collaborations for tiger survival in Indian subcontinent. Biodiversity and conservation. 2015;24(11):2869-75. 76. Dalberg W. Fighting illicit wildlife trafficking: A consultation with governments. WWF International, Gland, Switzerland, 2012.
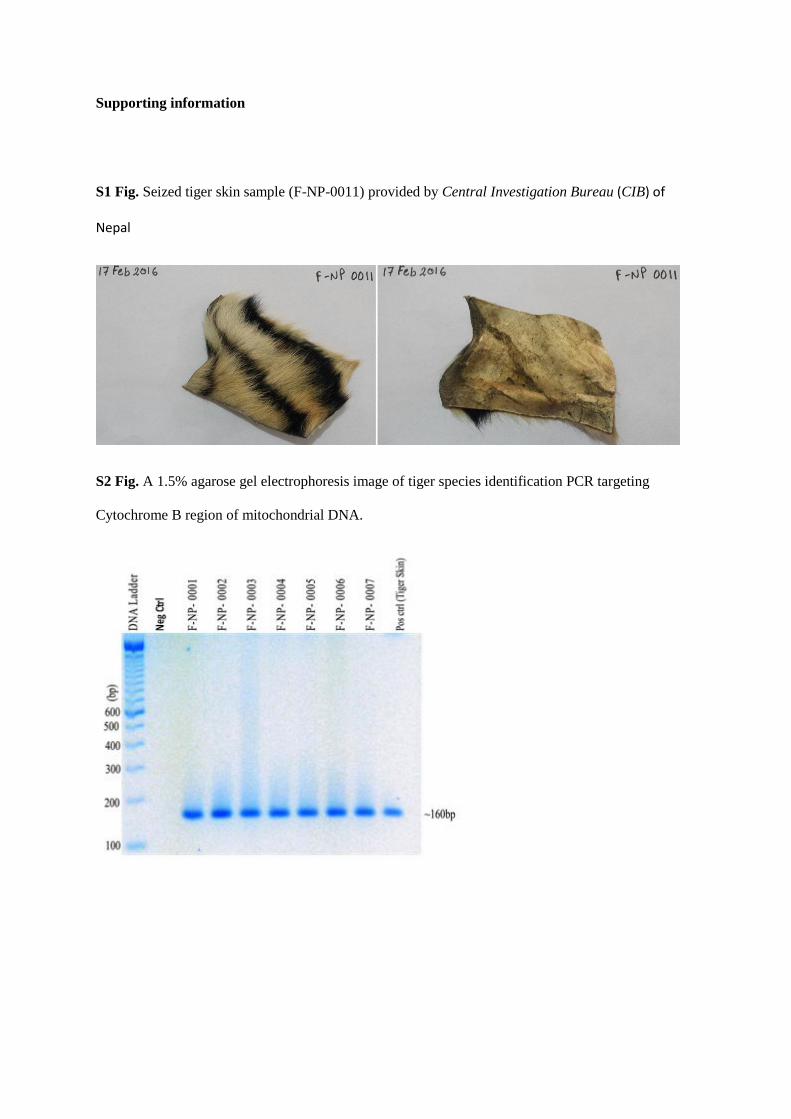
Supporting information
S1 Fig. Seized tiger skin sample (F-NP-0011) provided by Central Investigation Bureau (CIB) of
Nepal
S2 Fig. A 1.5% agarose gel electrophoresis image of tiger species identification PCR targeting
Cytochrome B region of mitochondrial DNA.
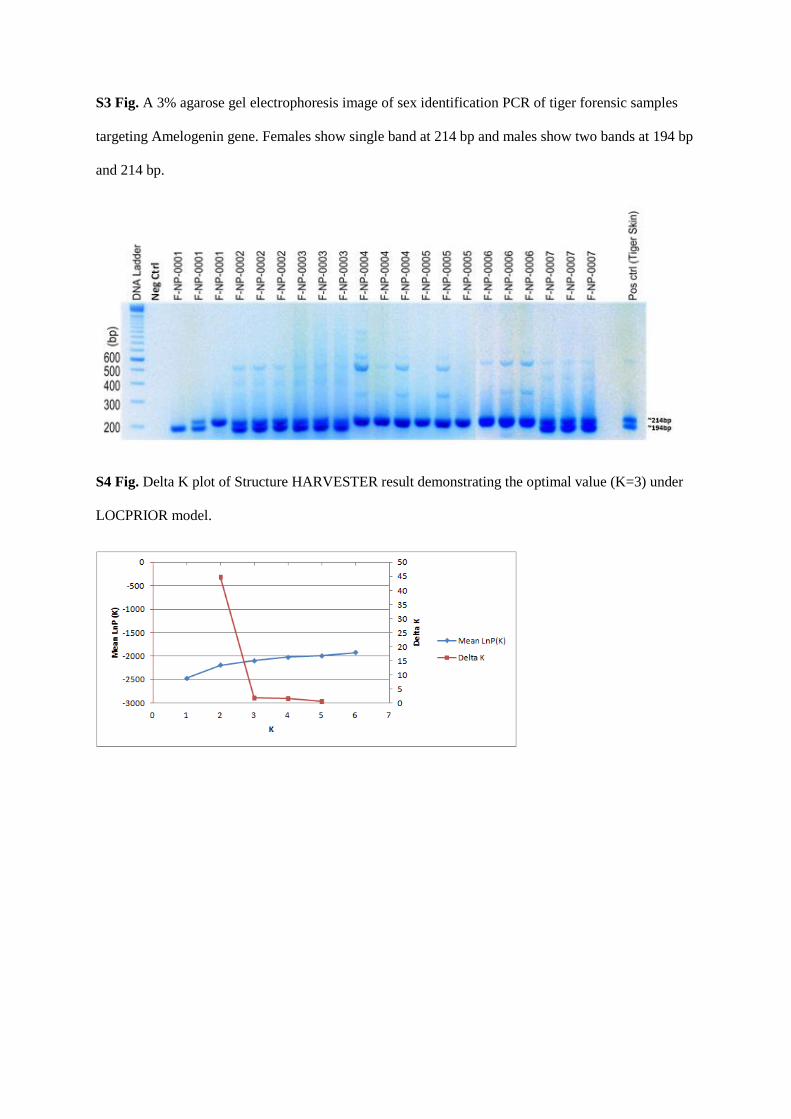
S3 Fig. A 3% agarose gel electrophoresis image of sex identification PCR of tiger forensic samples
targeting Amelogenin gene. Females show single band at 214 bp and males show two bands at 194 bp
and 214 bp.
S4 Fig. Delta K plot of Structure HARVESTER result demonstrating the optimal value (K=3) under
LOCPRIOR model.
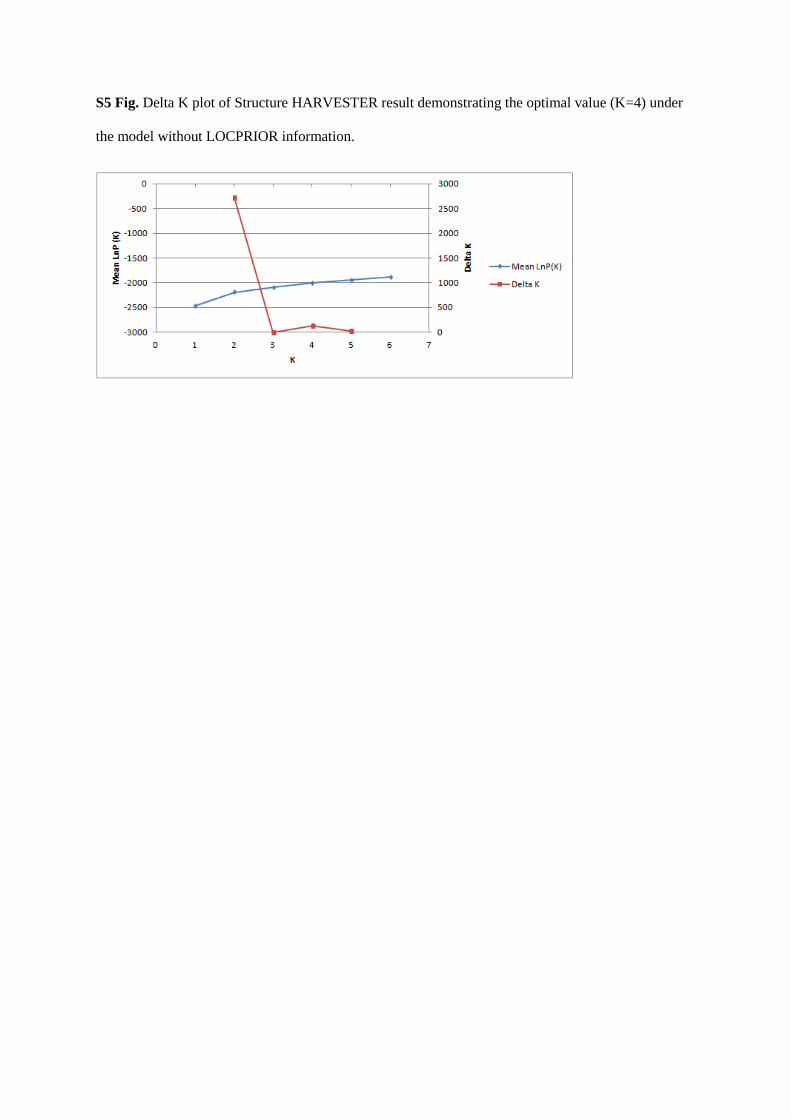
S5 Fig. Delta K plot of Structure HARVESTER result demonstrating the optimal value (K=4) under
the model without LOCPRIOR information.
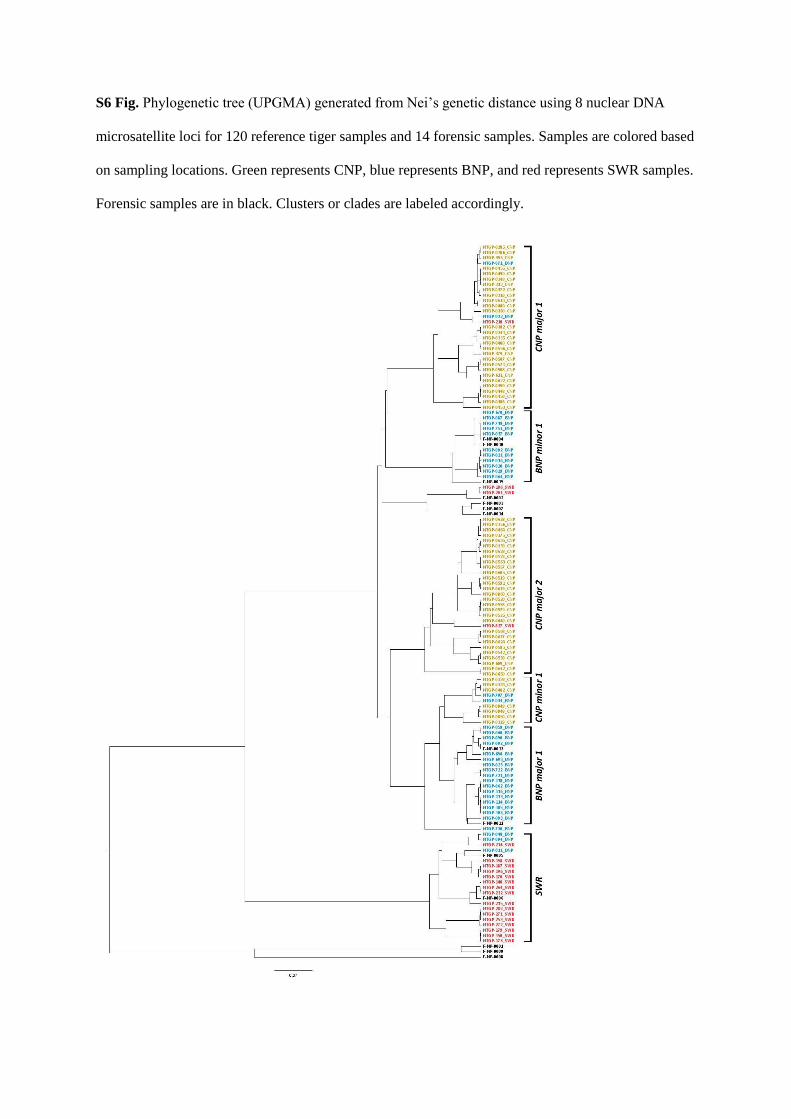
S6 Fig. Phylogenetic tree (UPGMA) generated from Nei‘s genetic distance using 8 nuclear DNA
microsatellite loci for 120 reference tiger samples and 14 forensic samples. Samples are colored based
on sampling locations. Green represents CNP, blue represents BNP, and red represents SWR samples.
Forensic samples are in black. Clusters or clades are labeled accordingly.
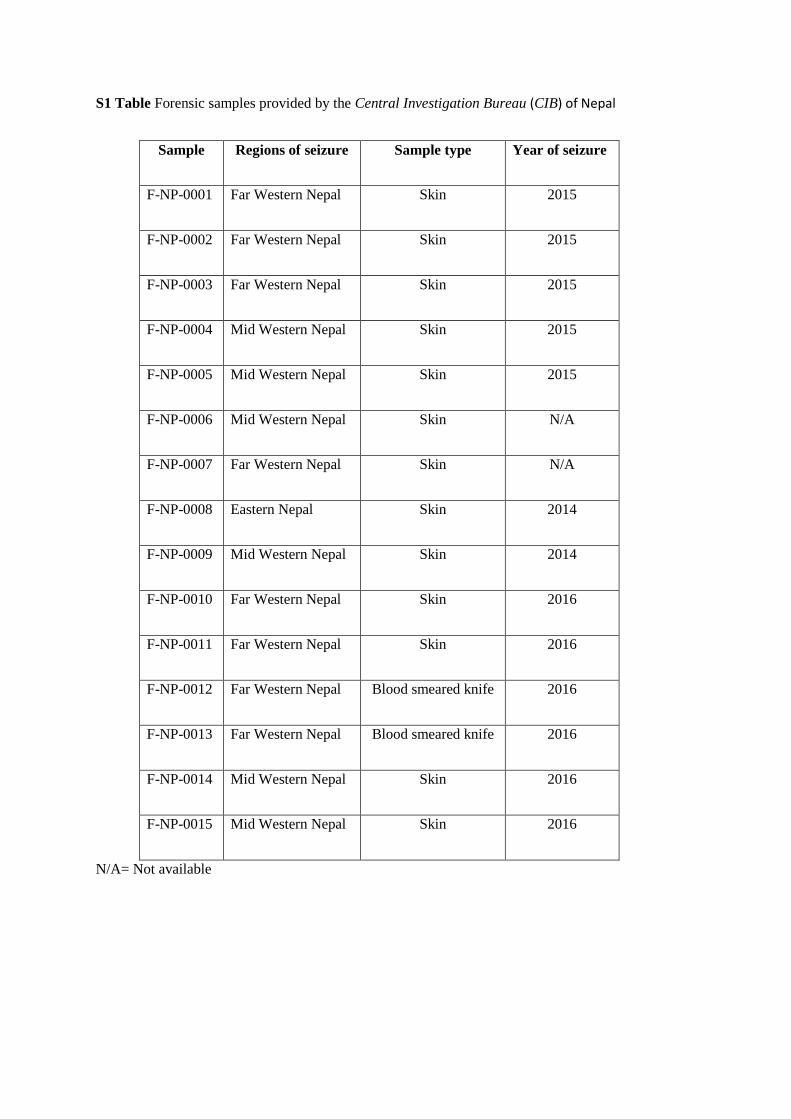
S1 Table Forensic samples provided by the Central Investigation Bureau (CIB) of Nepal
Sample Regions of seizure Sample type Year of seizure
F-NP-0001 Far Western Nepal Skin 2015
F-NP-0002 Far Western Nepal Skin 2015
F-NP-0003 Far Western Nepal Skin 2015
F-NP-0004 Mid Western Nepal Skin 2015
F-NP-0005 Mid Western Nepal Skin 2015
F-NP-0006 Mid Western Nepal Skin N/A
F-NP-0007 Far Western Nepal Skin N/A
F-NP-0008 Eastern Nepal Skin 2014
F-NP-0009 Mid Western Nepal Skin 2014
F-NP-0010 Far Western Nepal Skin 2016
F-NP-0011 Far Western Nepal Skin 2016
F-NP-0012 Far Western Nepal Blood smeared knife 2016
F-NP-0013 Far Western Nepal Blood smeared knife 2016
F-NP-0014 Mid Western Nepal Skin 2016
F-NP-0015 Mid Western Nepal Skin 2016
N/A= Not available
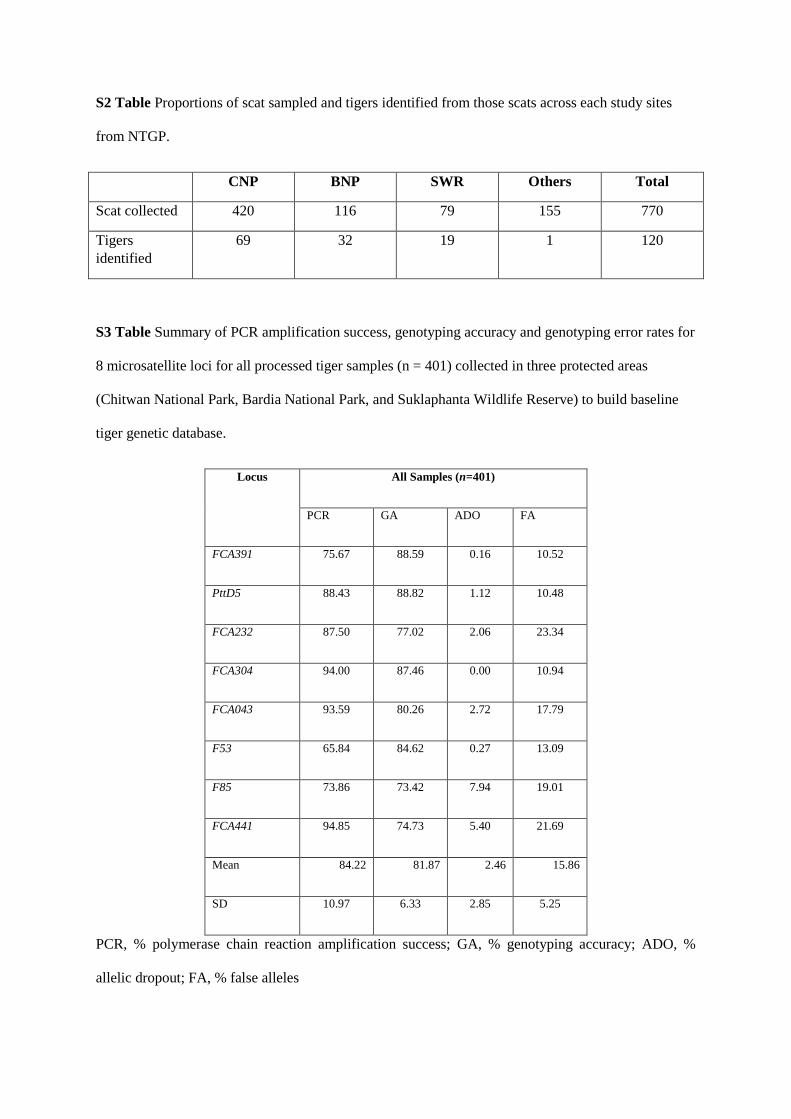
S2 Table Proportions of scat sampled and tigers identified from those scats across each study sites
from NTGP.
CNP BNP SWR Others Total
Scat collected 420 116 79 155 770
Tigers
identified
69 32 19 1 120
S3 Table Summary of PCR amplification success, genotyping accuracy and genotyping error rates for
8 microsatellite loci for all processed tiger samples (n = 401) collected in three protected areas
(Chitwan National Park, Bardia National Park, and Suklaphanta Wildlife Reserve) to build baseline
tiger genetic database.
Locus All Samples (n=401)
PCR GA ADO FA
FCA391 75.67 88.59 0.16 10.52
PttD5 88.43 88.82 1.12 10.48
FCA232 87.50 77.02 2.06 23.34
FCA304 94.00 87.46 0.00 10.94
FCA043 93.59 80.26 2.72 17.79
F53 65.84 84.62 0.27 13.09
F85 73.86 73.42 7.94 19.01
FCA441 94.85 74.73 5.40 21.69
Mean 84.22 81.87 2.46 15.86
SD 10.97 6.33 2.85 5.25
PCR, % polymerase chain reaction amplification success; GA, % genotyping accuracy; ADO, %
allelic dropout; FA, % false alleles
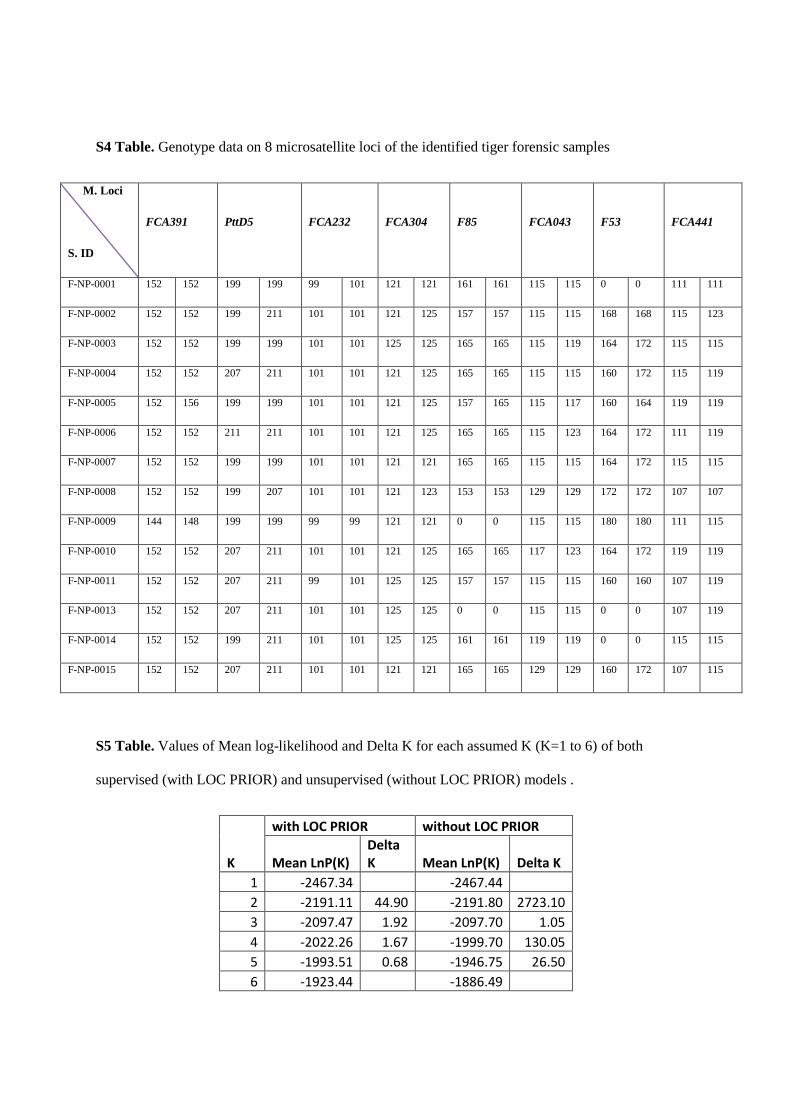
S4 Table. Genotype data on 8 microsatellite loci of the identified tiger forensic samples
M. Loci
S. ID
FCA391 PttD5 FCA232 FCA304 F85 FCA043 F53 FCA441
F-NP-0001 152 152 199 199 99 101 121 121 161 161 115 115 0 0 111 111
F-NP-0002 152 152 199 211 101 101 121 125 157 157 115 115 168 168 115 123
F-NP-0003 152 152 199 199 101 101 125 125 165 165 115 119 164 172 115 115
F-NP-0004 152 152 207 211 101 101 121 125 165 165 115 115 160 172 115 119
F-NP-0005 152 156 199 199 101 101 121 125 157 165 115 117 160 164 119 119
F-NP-0006 152 152 211 211 101 101 121 125 165 165 115 123 164 172 111 119
F-NP-0007 152 152 199 199 101 101 121 121 165 165 115 115 164 172 115 115
F-NP-0008 152 152 199 207 101 101 121 123 153 153 129 129 172 172 107 107
F-NP-0009 144 148 199 199 99 99 121 121 0 0 115 115 180 180 111 115
F-NP-0010 152 152 207 211 101 101 121 125 165 165 117 123 164 172 119 119
F-NP-0011 152 152 207 211 99 101 125 125 157 157 115 115 160 160 107 119
F-NP-0013 152 152 207 211 101 101 125 125 0 0 115 115 0 0 107 119
F-NP-0014 152 152 199 211 101 101 125 125 161 161 119 119 0 0 115 115
F-NP-0015 152 152 207 211 101 101 121 121 165 165 129 129 160 172 107 115
S5 Table. Values of Mean log-likelihood and Delta K for each assumed K (K=1 to 6) of both
supervised (with LOC PRIOR) and unsupervised (without LOC PRIOR) models .
K
with LOC PRIOR without LOC PRIOR
Mean LnP(K) Delta K Mean LnP(K) Delta K
1 -2467.34 -2467.44
2 -2191.11 44.90 -2191.80 2723.10
3 -2097.47 1.92 -2097.70 1.05
4 -2022.26 1.67 -1999.70 130.05
5 -1993.51 0.68 -1946.75 26.50
6 -1923.44 -1886.49
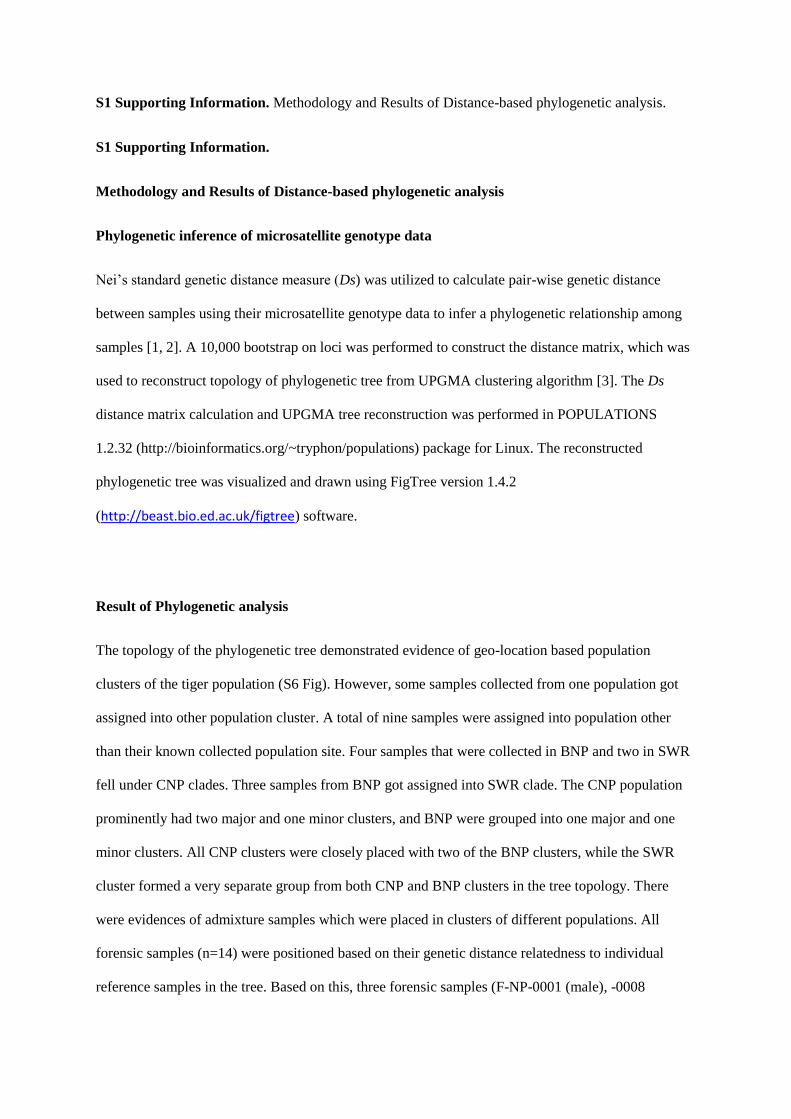
S1 Supporting Information. Methodology and Results of Distance-based phylogenetic analysis.
S1 Supporting Information.
Methodology and Results of Distance-based phylogenetic analysis
Phylogenetic inference of microsatellite genotype data
Nei‘s standard genetic distance measure (Ds) was utilized to calculate pair-wise genetic distance
between samples using their microsatellite genotype data to infer a phylogenetic relationship among
samples [1, 2]. A 10,000 bootstrap on loci was performed to construct the distance matrix, which was
used to reconstruct topology of phylogenetic tree from UPGMA clustering algorithm [3]. The Ds
distance matrix calculation and UPGMA tree reconstruction was performed in POPULATIONS
1.2.32 (http://bioinformatics.org/~tryphon/populations) package for Linux. The reconstructed
phylogenetic tree was visualized and drawn using FigTree version 1.4.2
(http://beast.bio.ed.ac.uk/figtree) software.
Result of Phylogenetic analysis
The topology of the phylogenetic tree demonstrated evidence of geo-location based population
clusters of the tiger population (S6 Fig). However, some samples collected from one population got
assigned into other population cluster. A total of nine samples were assigned into population other
than their known collected population site. Four samples that were collected in BNP and two in SWR
fell under CNP clades. Three samples from BNP got assigned into SWR clade. The CNP population
prominently had two major and one minor clusters, and BNP were grouped into one major and one
minor clusters. All CNP clusters were closely placed with two of the BNP clusters, while the SWR
cluster formed a very separate group from both CNP and BNP clusters in the tree topology. There
were evidences of admixture samples which were placed in clusters of different populations. All
forensic samples (n=14) were positioned based on their genetic distance relatedness to individual
reference samples in the tree. Based on this, three forensic samples (F-NP-0001 (male), -0008
(female), and -0009 (male)) formed a complete out-group from the tree, which reflected their distant
relatedness with our reference tiger genetic database. Among remaining eleven samples, six (F-NP-
0004, -0005,-0010, -0011, -0013, and -0015) were closely related to BNP samples while five (F-NP-
0002, -0003, -0006, -0007, and -0014) were closely related to SWR samples.
References
1. Nei M. Genetic distance between populations. American naturalist. 1972:283-92.
2. Nei M, Tajima F, Tateno Y. Accuracy of estimated phylogenetic trees from molecular data.
Journal of Molecular Evolution. 1983;19(2):153-70.
3. Sokol RR, Michener CD. A statistical method for evaluating systematic relationships, Univ.
Kansas Science Bulletin. 1958;28:1409-38.
CHAPTER VI
Gut microbiome and their putative metabolic functions in fragmented Bengal
tiger population of Nepal
Dibesh Karmacharya1,7
*, Prajwol Manandhar1, Sulochana Manandhar
1, Santosh Dulal
1, Nagendra P.
Awasthi1, Adarsh M. Sherchan
1, Ajay N. Sharma
1, Jyoti Joshi
1, Manisha Bista
1, Shailendra
Bajracharya1, Netra Sharma
2, Bronwyn Llewellyn
2, Lisette P. Waits
3, Kanchan Thapa
4, Marcella J.
Kelly4, Momchilo Vuyisich
5, Shawn R. Starkenburg
5, Jean-Marc Hero
6, Jane Hughes
7, Claudia
Wultsch8, Laura Bertola
9, 10, Nicholas M Fountain-Jones
11, Amit K. Sinha
1
1Center for Molecular Dynamics Nepal, Thapathali-11, Kathmandu, Nepal
2Environment Team, U.S. Agency for International Development-Nepal
3Department of Fish and Wildlife Sciences, University of Idaho, Idaho, USA
4Department of Fish and Wildlife Conservation, Virginia Tech, Blacksburg, Virginia, USA
5Applied Genomics, Los Alamos National Lab, New Mexico, USA
6School of Science & Education, University of the Sunshine Coast, Queensland, Australia
7School of Environment, Griffith University, Queensland, Australia
8Sackler Institute for Comparative Genomics, American Museum of Natural History, New York, USA
9Department of Biology, City College of New York, New York, USA
10Institute of Environmental Sciences, Leiden University, Leiden, The Netherlands
11Department of Veterinary Population Medicine, University of Minnesota, Minnesota, USA
(*Corresponding Author, Email: [email protected])
[This art icle has been submitted to Nature Micr obiome in Jan 2018]
Abstract
Bengal tigers (Panthera tigris tigris) serve a pivotal role as an apex predator in forest ecosystems. To
increase our knowledge on factors impacting the viability and health of this endangered species, we
studied the gut microbiomes in 32 individual Bengal tigers from three geographically separated
protected areas (Chitwan National Park, Bardia National Park and Suklaphanta Wildlife Reserve) in
Nepal, using noninvasive genetic sampling methods. Gut microbiome influence the immune system,
impact various physiological functions, and modulate metabolic reactions, that ultimately impact the
host health, fitness, behavior, digestion and development. Overall analysis of beta diversity revealed
significant differences in the composition of microbial communities across the populations and
bacterial communities clustered based on their geographic locations with moderate levels of overlap.
Microbial clustering across all areas was significant with pairwise tests showing significant
differences between Chitwan and the other two protected areas, but no differences between Bardia
and Suklaphanta. Predictive metagenome functional content analysis (PICRUSt) revealed a higher
functional enrichment and diversity in the Chitwan population and the lowest enrichment and
diversity in Suklaphanta. The Chitwan population contained a lower proportion of microbiome
associated with immune system and infectious diseases, but higher proportions that are associated
with xenobiotic biodegradation/metabolism, cellular processing and signaling, and neurodegenerative
diseases compared to the other two protected areas. We observe the tiger population structure, gut
microbiome profile and associated functional metabolic categories are correlated, with geographically
most separated Chitwan and Suklaphanta population having the most distinct and different host
genotype and microbiome profiles. These findings underscore the importance of conservation and
management programs for tigers and other wildlife species that seek to maximize genetic diversity at
different hierarchical levels, including hosts as well as their microbial communities.
Introduction
Gut microbiota is a complex community of microorganisms in the intestinal tract that has co-evolved
with the host 1,2
playing an important role in maintaining the host‘s health. Gut microbial communities
shape the immune system, impact various physiological functions, and modulate metabolic reactions,
that ultimately impact the host health, fitness, behavior, digestion and development 3-5
. The
composition of gut microbiota is largely determined by numerous intrinsic and extrinsic factors such
as the host‘s environment, health status, genotype, dietary habits, age, sex, social relationships and
disease prevalence 6-10
. The composition of gut microbiota may also change responding to
environmental stresses such as the loss and fragmentation of habitat 11-14
. Surrounding anthropogenic
pressure could be an important modulator of the gut microbiomes and could influence abundance of
various metabolites which are associated with metabolism of cellulose, phenolics, organic acids,
simple sugar and lipids 15
.
In the last decade, spurred by technological advances in DNA sequencing, multiple studies have
described gut microbiota of various terrestrial and aquatic species, including humans, primates,
whales and other mammals 16-18
. Disturbances in the bacterial microbiota might result in
immunological dysregulation that may underlie disorders such as inflammatory bowel disease,
Crohn's disease, and ulcerative colitis 19,20
. The mammalian immune system which appears to control
microbes, in fact, might be controlled by the microbes themselves 21
. By stimulating the immune
system and the development of gut structure, gut microbes play a crucial role in the regulation of host
health by aiding in the defense against invading pathogens and providing nutritional benefit to the
host such as production of short chain fatty acids and vitamin B12 22
. The overall balance in the
composition of the gut microbial community, as well as the presence or absence of key microbiome
species capable of affecting specific responses, is important in ensuring homeostasis or lack thereof at
the intestinal mucosa and beyond. The mechanisms through which microbiota exert beneficial or
detrimental influences remain largely undefined, but include elaboration of signaling molecules and
recognition of bacterial epitopes by both intestinal epithelial and mucosal immune cells 23
. As
microbial communities inhabiting wildlife species affect host health, nutrition, physiology and
immune systems, gut microbiome research has several significant implications for wildlife
conservation and management 7,24
. Therefore, it is recommended to include wildlife microbiome
studies into comprehensive wildlife conservation and management programs, especially for species of
conservation concern 25
.
Globally, the population of wild tigers is declining dramatically due to widespread habitat loss and
fragmentation, prey depletion, illegal hunting and various infectious diseases 26-29
. Within Nepal,
habitat loss and fragmentation have forced extant tigers to divide into distinct geographically
separated populations in Nepal, which has been extensively studied using long-term field data 30
and
noninvasive genetic sampling [Thapa et. al., 2017 in review]. The Bengal tiger‘s main habitat in
Nepal is restricted to five protected areas along the Terai Arc Landscape (TAL), including Chitwan
National Park (CNP), Parsa Wildlife Reserve (PWR), Bardia National Park (BNP), Banke National
Park (BaNP), and Suklaphanta Wildlife Reserve (SWR) 31,32
. The TAL has experienced significant
land use changes in the recent past 27,32
. Human settlements surround and encroach into tiger habitat
degrading natural areas and potentially increasing levels of environmental stress for tigers. This
region has also experienced severe socio-political unrest, which included 10 year civil war during the
Maoist insurgency, that has negatively impacted fragile ecosystems with weakened wildlife
conservation programs 33,34
. Considering the degree of environmental degradation in conjunction with
habitat loss and fragmentation over the last century, it is vital to take a multidimensional approach to
managing the health of wild tiger subpopulations.
The extent to which habitat loss and fragmentation alter the gut microbiome and in turn impact the
health of endangered wildlife is largely unknown. Small isolated wildlife populations may not only
have low genetic diversity but also have lower gut microbial diversity with altered functionality that
could adversely impact the health of these animals and potentially increase the risk of local extinction.
Red colubus monkey, an endangered species, residing around human settlements seemed to have
reduced gut microbial diversity compared to a population found in a wild habitat 12
. In our previous
work we identified 120 individual tigers using eight microsatellite markers and found that tigers in
SWR had the lowest genetic diversity and were the most isolated in terms of gene flow compared to
the other parks. Tigers from CNP and BNP had similar levels of genetic diversity even though CNP is
geographically distant from BNP and SWR [Thapa et.al., under review]. Based on this, we
hypothesized that SWR might have the least diverse microbiome compared to the other tiger
populations. However, as humans can substantially perturb the microbiota of wildlife35
we expect the
tigers in the CNP may have a unique microbial community as this park receives much higher human
visitation compared to the other parks. The aim of our study is to examine structural and functional
diversity of gut microbial communities in tiger populations of TAL (Fig 1).
As part of the Nepal Tiger Genome Project (NTGP) 36
, we conducted one of the largest scale
microbiome surveys of a wild carnivore spanning three populations with different degrees of
connectivity and human visitation. We found that even though microbiome alpha diversity was
similar across tiger populations, there were significant differences in microbial phylogenetic and
taxonomic composition and beta diversity, and these differences were potentially important in terms
of metabolic and immune function. This increased our knowledge of the gut microbiome and can
contribute towards the development of a more comprehensive strategy to conserve and manage wild
tiger populations occurring across fragmented landscapes.
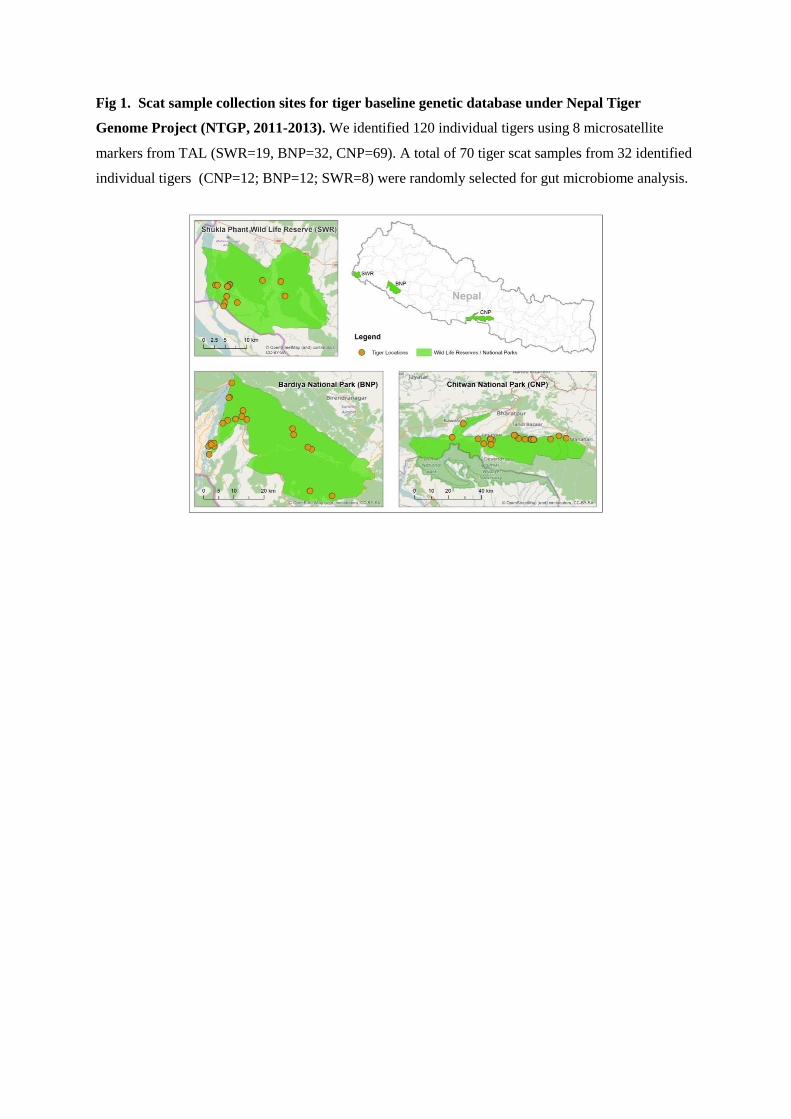
Fig 1. Scat sample collection sites for tiger baseline genetic database under Nepal Tiger
Genome Project (NTGP, 2011-2013). We identified 120 individual tigers using 8 microsatellite
markers from TAL (SWR=19, BNP=32, CNP=69). A total of 70 tiger scat samples from 32 identified
individual tigers (CNP=12; BNP=12; SWR=8) were randomly selected for gut microbiome analysis.
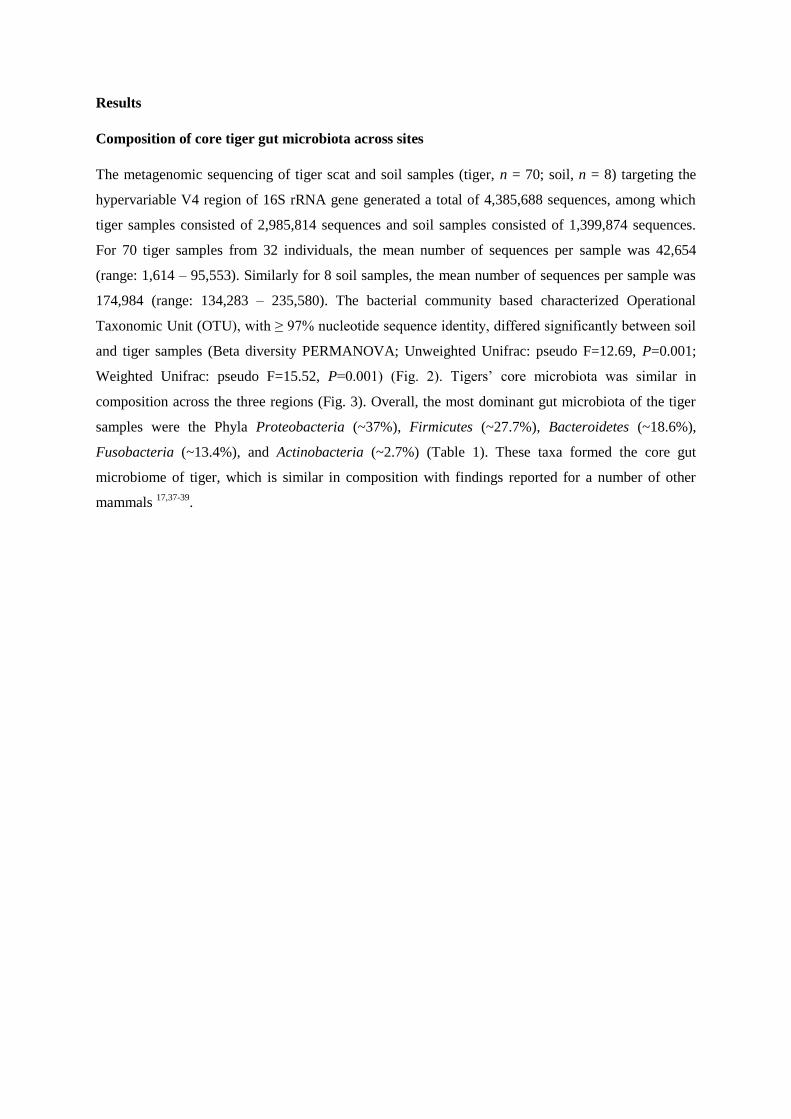
Results
Composition of core tiger gut microbiota across sites
The metagenomic sequencing of tiger scat and soil samples (tiger, n = 70; soil, n = 8) targeting the
hypervariable V4 region of 16S rRNA gene generated a total of 4,385,688 sequences, among which
tiger samples consisted of 2,985,814 sequences and soil samples consisted of 1,399,874 sequences.
For 70 tiger samples from 32 individuals, the mean number of sequences per sample was 42,654
(range: 1,614 – 95,553). Similarly for 8 soil samples, the mean number of sequences per sample was
174,984 (range: 134,283 – 235,580). The bacterial community based characterized Operational
Taxonomic Unit (OTU), with ≥ 97% nucleotide sequence identity, differed significantly between soil
and tiger samples (Beta diversity PERMANOVA; Unweighted Unifrac: pseudo F=12.69, P=0.001;
Weighted Unifrac: pseudo F=15.52, P=0.001) (Fig. 2). Tigers‘ core microbiota was similar in
composition across the three regions (Fig. 3). Overall, the most dominant gut microbiota of the tiger
samples were the Phyla Proteobacteria (~37%), Firmicutes (~27.7%), Bacteroidetes (~18.6%),
Fusobacteria (~13.4%), and Actinobacteria (~2.7%) (Table 1). These taxa formed the core gut
microbiome of tiger, which is similar in composition with findings reported for a number of other
mammals 17,37-39
.
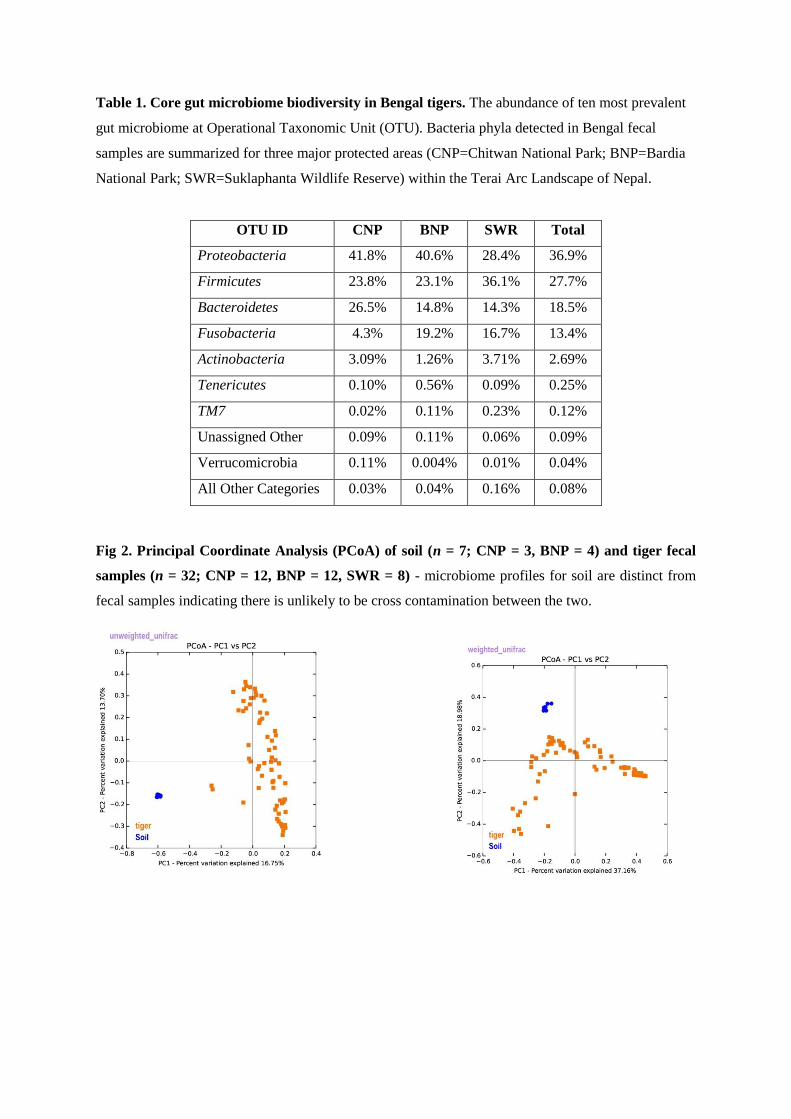
Table 1. Core gut microbiome biodiversity in Bengal tigers. The abundance of ten most prevalent
gut microbiome at Operational Taxonomic Unit (OTU). Bacteria phyla detected in Bengal fecal
samples are summarized for three major protected areas (CNP=Chitwan National Park; BNP=Bardia
National Park; SWR=Suklaphanta Wildlife Reserve) within the Terai Arc Landscape of Nepal.
OTU ID CNP BNP SWR Total
Proteobacteria 41.8% 40.6% 28.4% 36.9%
Firmicutes 23.8% 23.1% 36.1% 27.7%
Bacteroidetes 26.5% 14.8% 14.3% 18.5%
Fusobacteria 4.3% 19.2% 16.7% 13.4%
Actinobacteria 3.09% 1.26% 3.71% 2.69%
Tenericutes 0.10% 0.56% 0.09% 0.25%
TM7 0.02% 0.11% 0.23% 0.12%
Unassigned Other 0.09% 0.11% 0.06% 0.09%
Verrucomicrobia 0.11% 0.004% 0.01% 0.04%
All Other Categories 0.03% 0.04% 0.16% 0.08%
Fig 2. Principal Coordinate Analysis (PCoA) of soil (n = 7; CNP = 3, BNP = 4) and tiger fecal
samples (n = 32; CNP = 12, BNP = 12, SWR = 8) - microbiome profiles for soil are distinct from
fecal samples indicating there is unlikely to be cross contamination between the two.
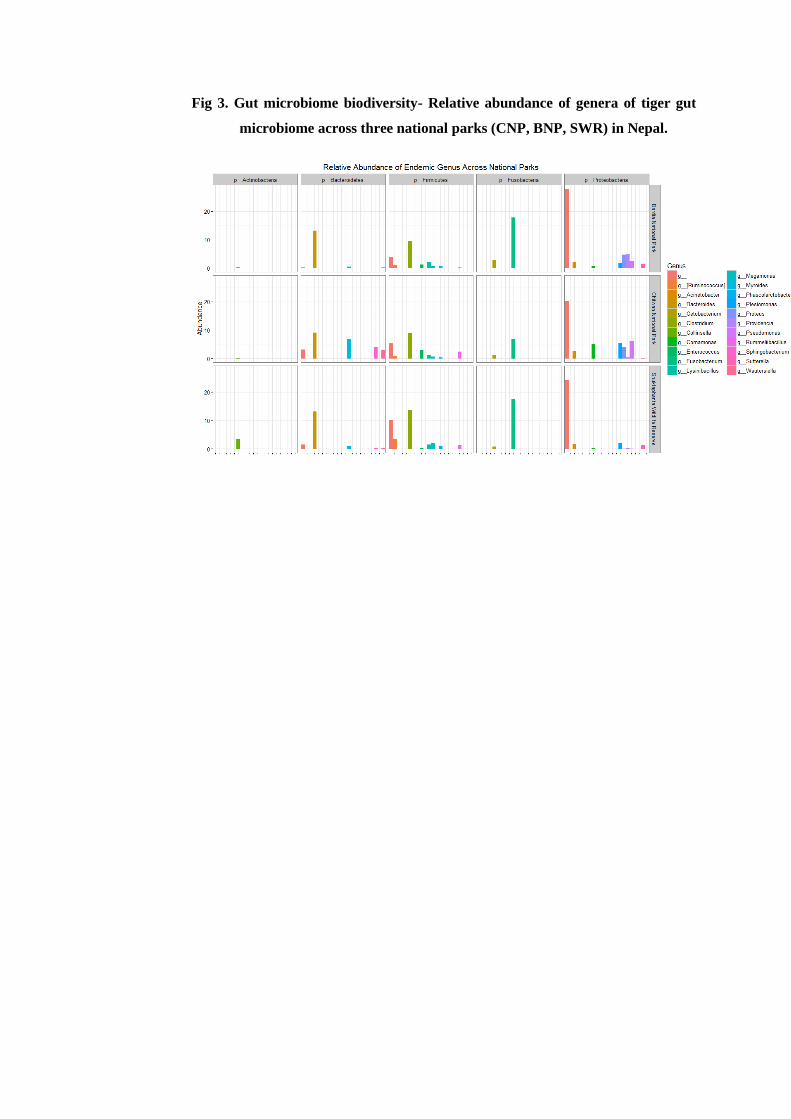
Fig 3. Gut microbiome biodiversity- Relative abundance of genera of tiger gut
microbiome across three national parks (CNP, BNP, SWR) in Nepal.
Alpha-diversity measures of gut microbiome
Overall there was no significant difference in alpha diversity (within population) of the microbiome
across all three populations independent of the index used (Chao1 and ACE metrics 40,41
, Shannon‘s
index 42
, Simpson‘s index 43
, Inverted Simpson and Fisher‘s indexes 44
) (Fig. 4). Analysis of each
index indicated that BNP was marginally less diverse in terms of species richness with CNP having
marginally higher alpha diversity (Fig. 4).
Fig 4. Alpha-diversity in tiger gut microbial communities is similar across different regions
studied.
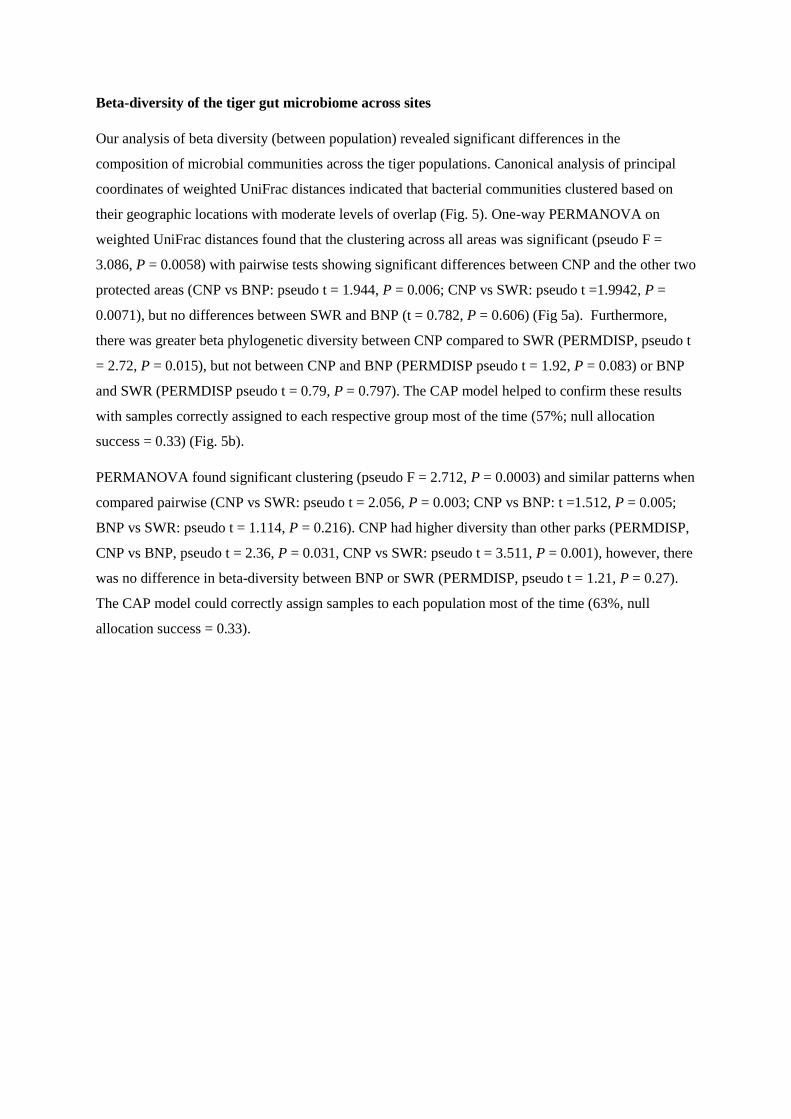
Beta-diversity of the tiger gut microbiome across sites
Our analysis of beta diversity (between population) revealed significant differences in the
composition of microbial communities across the tiger populations. Canonical analysis of principal
coordinates of weighted UniFrac distances indicated that bacterial communities clustered based on
their geographic locations with moderate levels of overlap (Fig. 5). One-way PERMANOVA on
weighted UniFrac distances found that the clustering across all areas was significant (pseudo F =
3.086, P = 0.0058) with pairwise tests showing significant differences between CNP and the other two
protected areas (CNP vs BNP: pseudo t = 1.944, P = 0.006; CNP vs SWR: pseudo t =1.9942, P =
0.0071), but no differences between SWR and BNP (t = 0.782, P = 0.606) (Fig 5a). Furthermore,
there was greater beta phylogenetic diversity between CNP compared to SWR (PERMDISP, pseudo t
= 2.72, P = 0.015), but not between CNP and BNP (PERMDISP pseudo t = 1.92, P = 0.083) or BNP
and SWR (PERMDISP pseudo t = 0.79, P = 0.797). The CAP model helped to confirm these results
with samples correctly assigned to each respective group most of the time (57%; null allocation
success = 0.33) (Fig. 5b).
PERMANOVA found significant clustering (pseudo F = 2.712, P = 0.0003) and similar patterns when
compared pairwise (CNP vs SWR: pseudo t = 2.056, P = 0.003; CNP vs BNP: t =1.512, P = 0.005;
BNP vs SWR: pseudo t = 1.114, P = 0.216). CNP had higher diversity than other parks (PERMDISP,
CNP vs BNP, pseudo t = 2.36, P = 0.031, CNP vs SWR: pseudo t = 3.511, P = 0.001), however, there
was no difference in beta-diversity between BNP or SWR (PERMDISP, pseudo t = 1.21, P = 0.27).
The CAP model could correctly assign samples to each population most of the time (63%, null
allocation success = 0.33).
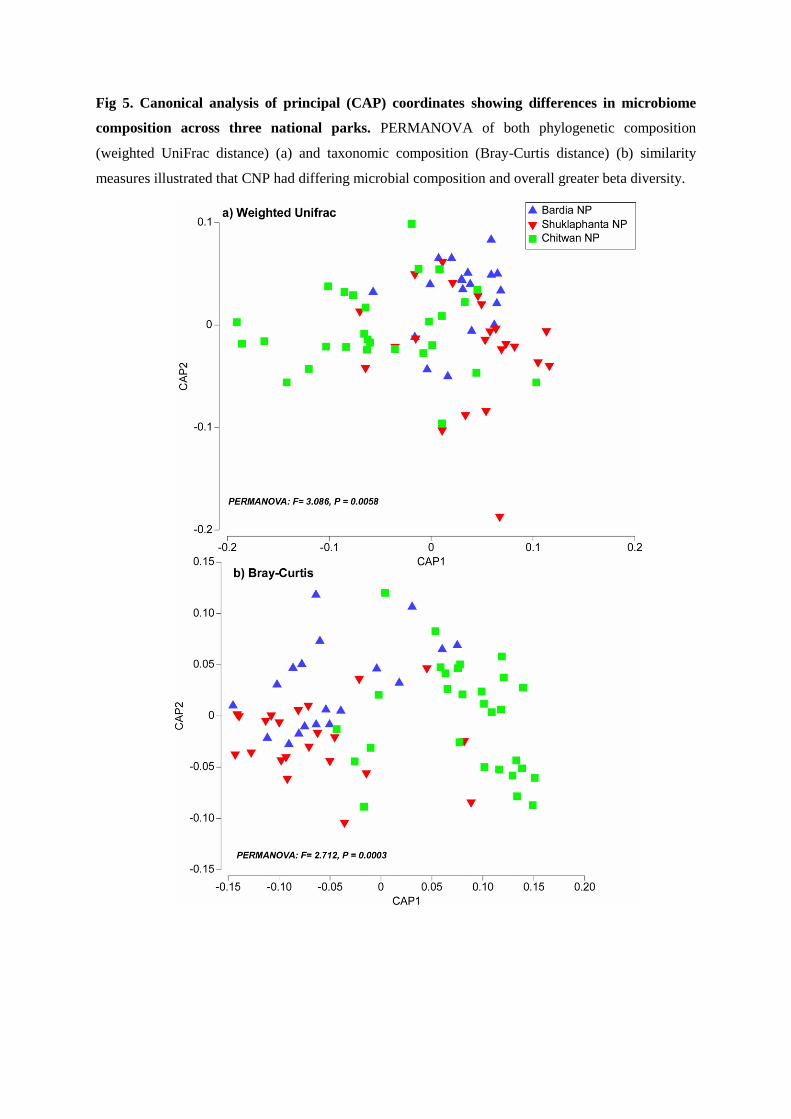
Fig 5. Canonical analysis of principal (CAP) coordinates showing differences in microbiome
composition across three national parks. PERMANOVA of both phylogenetic composition
(weighted UniFrac distance) (a) and taxonomic composition (Bray-Curtis distance) (b) similarity
measures illustrated that CNP had differing microbial composition and overall greater beta diversity.
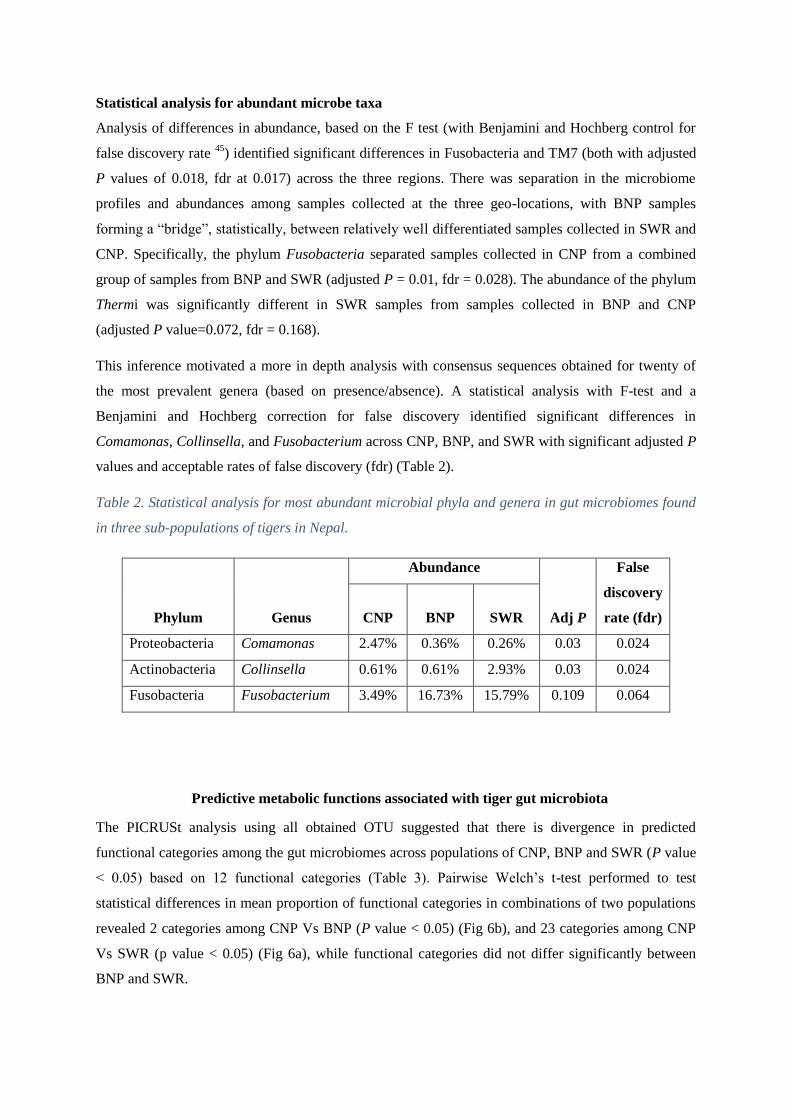
Statistical analysis for abundant microbe taxa
Analysis of differences in abundance, based on the F test (with Benjamini and Hochberg control for
false discovery rate 45
) identified significant differences in Fusobacteria and TM7 (both with adjusted
P values of 0.018, fdr at 0.017) across the three regions. There was separation in the microbiome
profiles and abundances among samples collected at the three geo-locations, with BNP samples
forming a ―bridge‖, statistically, between relatively well differentiated samples collected in SWR and
CNP. Specifically, the phylum Fusobacteria separated samples collected in CNP from a combined
group of samples from BNP and SWR (adjusted P = 0.01, fdr = 0.028). The abundance of the phylum
Thermi was significantly different in SWR samples from samples collected in BNP and CNP
(adjusted P value=0.072, fdr = 0.168).
This inference motivated a more in depth analysis with consensus sequences obtained for twenty of
the most prevalent genera (based on presence/absence). A statistical analysis with F-test and a
Benjamini and Hochberg correction for false discovery identified significant differences in
Comamonas, Collinsella, and Fusobacterium across CNP, BNP, and SWR with significant adjusted P
values and acceptable rates of false discovery (fdr) (Table 2).
Table 2. Statistical analysis for most abundant microbial phyla and genera in gut microbiomes found
in three sub-populations of tigers in Nepal.
Phylum Genus
Abundance
Adj P
False
discovery
rate (fdr) CNP BNP SWR
Proteobacteria Comamonas 2.47% 0.36% 0.26% 0.03 0.024
Actinobacteria Collinsella 0.61% 0.61% 2.93% 0.03 0.024
Fusobacteria Fusobacterium 3.49% 16.73% 15.79% 0.109 0.064
Predictive metabolic functions associated with tiger gut microbiota
The PICRUSt analysis using all obtained OTU suggested that there is divergence in predicted
functional categories among the gut microbiomes across populations of CNP, BNP and SWR (P value
< 0.05) based on 12 functional categories (Table 3). Pairwise Welch‘s t-test performed to test
statistical differences in mean proportion of functional categories in combinations of two populations
revealed 2 categories among CNP Vs BNP (P value < 0.05) (Fig 6b), and 23 categories among CNP
Vs SWR (p value < 0.05) (Fig 6a), while functional categories did not differ significantly between
BNP and SWR.
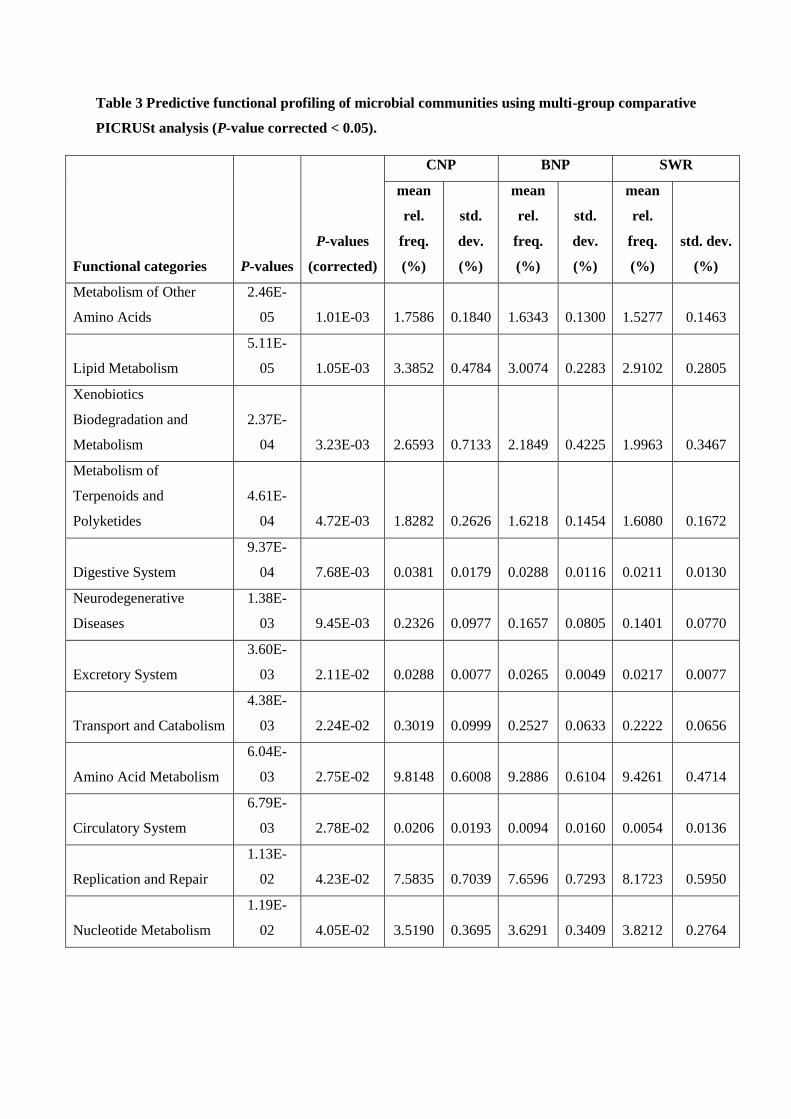
Table 3 Predictive functional profiling of microbial communities using multi-group comparative
PICRUSt analysis (P-value corrected < 0.05).
Functional categories P-values
P-values
(corrected)
CNP BNP SWR
mean
rel.
freq.
(%)
std.
dev.
(%)
mean
rel.
freq.
(%)
std.
dev.
(%)
mean
rel.
freq.
(%)
std. dev.
(%)
Metabolism of Other
Amino Acids
2.46E-
05 1.01E-03 1.7586 0.1840 1.6343 0.1300 1.5277 0.1463
Lipid Metabolism
5.11E-
05 1.05E-03 3.3852 0.4784 3.0074 0.2283 2.9102 0.2805
Xenobiotics
Biodegradation and
Metabolism
2.37E-
04 3.23E-03 2.6593 0.7133 2.1849 0.4225 1.9963 0.3467
Metabolism of
Terpenoids and
Polyketides
4.61E-
04 4.72E-03 1.8282 0.2626 1.6218 0.1454 1.6080 0.1672
Digestive System
9.37E-
04 7.68E-03 0.0381 0.0179 0.0288 0.0116 0.0211 0.0130
Neurodegenerative
Diseases
1.38E-
03 9.45E-03 0.2326 0.0977 0.1657 0.0805 0.1401 0.0770
Excretory System
3.60E-
03 2.11E-02 0.0288 0.0077 0.0265 0.0049 0.0217 0.0077
Transport and Catabolism
4.38E-
03 2.24E-02 0.3019 0.0999 0.2527 0.0633 0.2222 0.0656
Amino Acid Metabolism
6.04E-
03 2.75E-02 9.8148 0.6008 9.2886 0.6104 9.4261 0.4714
Circulatory System
6.79E-
03 2.78E-02 0.0206 0.0193 0.0094 0.0160 0.0054 0.0136
Replication and Repair
1.13E-
02 4.23E-02 7.5835 0.7039 7.6596 0.7293 8.1723 0.5950
Nucleotide Metabolism
1.19E-
02 4.05E-02 3.5190 0.3695 3.6291 0.3409 3.8212 0.2764
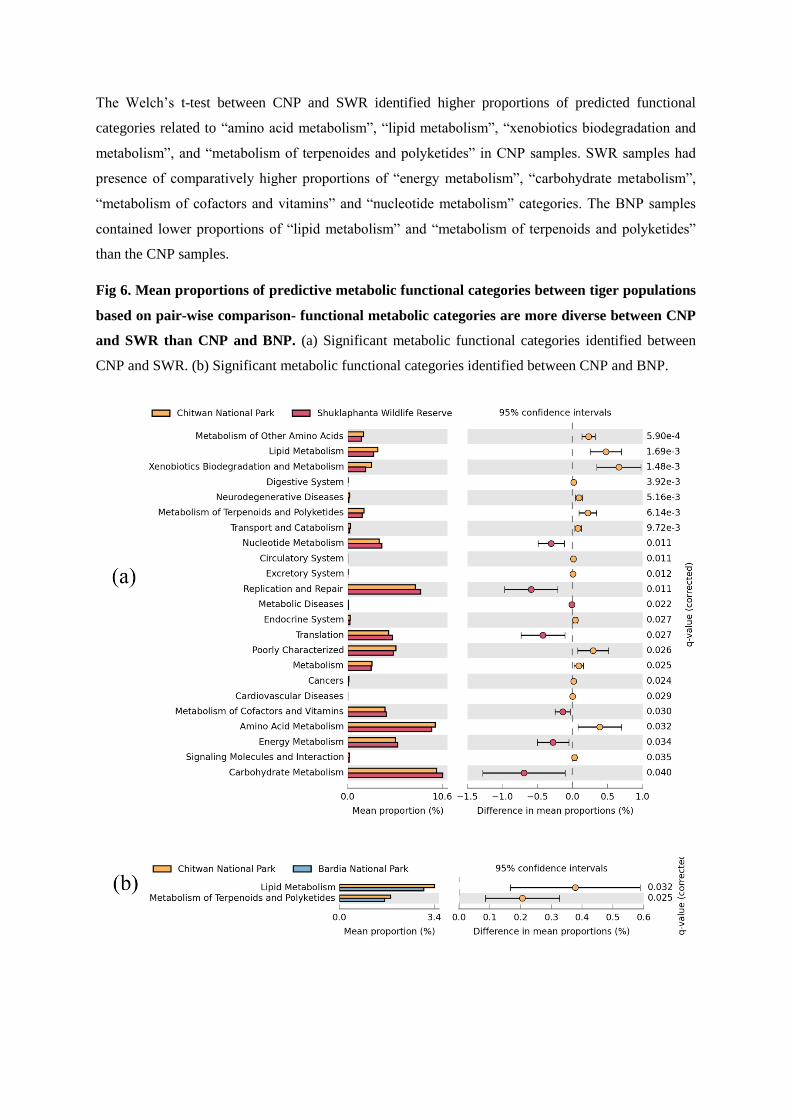
The Welch‘s t-test between CNP and SWR identified higher proportions of predicted functional
categories related to ―amino acid metabolism‖, ―lipid metabolism‖, ―xenobiotics biodegradation and
metabolism‖, and ―metabolism of terpenoides and polyketides‖ in CNP samples. SWR samples had
presence of comparatively higher proportions of ―energy metabolism‖, ―carbohydrate metabolism‖,
―metabolism of cofactors and vitamins‖ and ―nucleotide metabolism‖ categories. The BNP samples
contained lower proportions of ―lipid metabolism‖ and ―metabolism of terpenoids and polyketides‖
than the CNP samples.
Fig 6. Mean proportions of predictive metabolic functional categories between tiger populations
based on pair-wise comparison- functional metabolic categories are more diverse between CNP
and SWR than CNP and BNP. (a) Significant metabolic functional categories identified between
CNP and SWR. (b) Significant metabolic functional categories identified between CNP and BNP.
Overall significant differences were observed in predictive metabolic functions over the tiger
population of the three study regions. The pair-wise relationship between samples based on functional
analysis corresponded to the pair-wise relation between samples based on microbiome structure
(PROCRUSTES, m2 = 0.72, P value = 0.0009). This analysis further underscores the geo-location
specificity with the sample set from BNP overlapping with well-separated sample sets from CNP and
SWR.
Discussion
Fragmented population and variation in gut microbiome in tigers
Low population numbers in some tiger populations and increased levels of habitat loss and
fragmentation may contribute towards lowering of genetic diversity in host species, which in turn can
also adversely impact the microbiomes coevolving within their bodies. In the TAL region of Nepal,
there has been a 97% increase in agriculture and settlement areas of the past 200 years and forested
areas decreased by 47% between the 19th and 20
th centuries (Thapa et al 2017, in review). In our
study, we found some significant differences in gut microbial composition in three geo-spatially
separated tiger population. These differences were highest between CNP and SWR tiger populations
which are geographically most separated (Fig. 1). Differences in habitat including differences in
prey composition and tiger densities, as well as interactions across the fragmented population of these
national parks, might have role in shaping such microbiota composition and abundance. For example,
the microbiome diversity results mirror the results from neutral microsatellite diversity with SWR
having lower diversity than CNP (Thapa et.al., 2017 under review) and support our hypothesis that
SWR would have the lowest levels of microbiome diversity. Our study was also able to find that
there is a notable differences in microbiota diversity observed between CNP and other two protected
areas, as opposed to the differences observed between BNP and SWR, giving an indication that the
microbiota diversity in CNP is unique from that of BNP and SWR. This could be due to the reason
that CNP has more human visitor turnover and/or activity than other two protected areas which we
had hypothesized. Also, the other reason could be that habitat fragmentation in TAL has separated
CNP far away from BNP and SWR, while BNP and SWR still having connections through wildlife
corridors between them. Although this study is first of its kind in wild tigers, a study in an
endangered primate showed a direct correlation between higher habitat fragmentation with reduced
gut microbiota diversity as well as richness with some profound implications on health and long-term
viability of the species 12
.
Gut microbiome and its potential implication on health of tigers
Of the microbiome found in tigers, Proteobacteria was highly abundant in all tiger populations [CNP
(42%), BNP (41%) and SWR (28%)]. Proteobacteria are gram negative bacteria which include a
wide variety of species that are commensal and part of normal gut flora of higher organisms as well as
many true pathogens, such as Escherichia, Shigella, Salmonella, Yersinia, Buchnera, Ha emophilus,
Vibrio, Pseudomonas, and Helicobacter 46
. Helicobacter has been linked to chronic gastritis that can
lead to increased morbidity and mortality among captive cheetah around the globe 47
. Higher
abundance of Proteobacteria has been associated with increased incidences of gastrointestinal diseases
among human and animals like cats and dogs 48-51
.
Firmicutes were also abundant in tiger gut [CNP (24%), BNP (23%) and SWR (36%)]. Some of the
notable pathogens under this Phyla are Bacilli and Clostridia 52
. Firmicutes constitute one of the
predominant phyla (57 % of community) found in the gut of wild mammal species 53
. In Nambian free
ranging cheetahs, it was found to be the dominant phylum constituting 68.5% of total gut microbiota
54. In humans, Firmicutes accounts for more than 80% of bacterial population in colon
8. They were
observed to be dominant in both wild (76%) and captive animals (61%) in sea lions 55
and occupied
the largest portion of the bacterial profile (65–79%) in non-human primates 56
. Firmicutes was also
the predominant phylum (88%) in South American and Sub-antarctic fur seals 57
. Firmicutes along
with Bacteroidetes have predominantly been shown to be involved in energy resorption and
metabolism 58
. Increased ratio of Firmicutes and Bacteroidetes has been linked to potential
development of diabetes and obesity in human and other mammals 59,60
.
Although speculative, in view of studies done on humans, the pathogenic roles and activities of the
three significant virulent bacteria found in tigers (Comamonas, Collinsella, and Fusobacteria) may
have correlation with functional activities in the immune and digestive system and prevalence of
diseases such as neuro-degenerative diseases and cancer 61
.
CNP tiger microbiome had significantly higher (2.47%) presence of Comamonas than BNP (0.36%)
and SWR (0.26%) population (Table 2). Comamonas are aerobic, gram-negative, motile, oxidase-
positive bacilli which usually has low virulence potency and infrequently cause human disease 62
.
Comamonas kerstersii has been occasionally reported as causative agent of intra-abdominal infections
resulting peritonitis secondary to appendix rupture in human cases 62,63
.
SWR population had higher (2.93%) Collinsella than CNP (0.61%) and BNP .(61%). Collinsella
aerofaciens is the most abundant bacterium in the human intestine present in about 1010
cells/ gm of
faeces, and is found in more than 90% of human intestines 64
. A reduced abundance of this species has
been correlated with more severe symptoms in patients suffering from irritable bowel syndrome 65
.
Collinsella is often known to elevate alpha-aminoadipic acid, asparagine and pro-inflammatory
cytokine IL-17A which are known to cause diseases associated with immune system such as
rheumatoid arthritis 66
. Furthermore, Collinsella in combination with Fusobacterium nucleatum
fadA activity, alters gut permeability and disease severity on gastrointestinal and immune diseases 66-
68.
BNP and SWR tiger population had significantly greater presence of Fusobacterium than CNP
population. Fusobacterium is a gram-negative bacterium that ferment carbohydrates or amino acids
thereby producing various organic acids. Fusobacterium necrophorum has been recognized as a true
animal pathogen 69
. It is associated with liver abscesses in cattle, foot rot in many domestic animals,
calf diphtheria and necrotic lesions in the oral cavity 70,71
. It is also closely associated with
development of colon cancer 72
.
Gut microbiome and functional metabolic implication on tiger population
PICRUSt based predictive metabolic functionalities in tiger population revealed a consistent pattern
with higher functional enrichment and diversity in the CNP tiger population for the most categories
and the lowest enrichment and diversity in SWR population. We found significant differences in 2
functional categories among CNP Vs BNP (Fig 6b), and 23 categories among CNP Vs SWR (Fig 6a),
while functional categories did not differ significantly between BNP and SWR (Fig 6). Predictive
metabolic profile is just a rough indicator of possible functional implication of microbiota present. We
observe the tiger population structure, gut microbiome profile and associated functional metabolic
categories are correlated, with geographically most separated CNP and SWR population having the
most distinct and different host genotype and microbiome profiles.
This further highlights the necessity of more comprehensive systems biology based approach to study
conservation status of the species with a focus on monitoring and maintaining genetic diversity and a
healthy gut microbial composition. We are further investigating various other factors that might
influence gut microbiome and its influence on tiger's survival, including role of anthropogenic
proximity and activities. Any conservation effort to preserve highly endangered tiger needs to adopt a
holistic conservation approach with focus on the inter-dependencies between host genetic
differentiations and gut microbial diversity.
Methods
Methods for host genetic analysis
Genetic database of wild tiger in Nepal and fecal DNA sampling
NTGP created Nepal‘s first comprehensive tiger genetic reference database by collecting and
analyzing fecal samples (n = 770) from the TAL (Fig. 1), which included all the known habitat of
tigers in Nepal (Thapa et al in Review; NTGP project report). The TAL has a sub-tropical monsoonal
climate and mixed deciduous vegetation ranging from alluvial floodplain grasslands communities to
Climax Sal (Shorea robusta) forests and includes five protected areas, among which Suklaphanta
National Park (SWR, 28°50′25″N 80°13′44″E), Bardia National Park (BNP, 28°23′N 81°30′E), and
Chitwan National Park (CNP, 27°30'0.00" N 84°40'0.12" E) are the major tiger habitats (Fig. 1).
Putative tiger fecal (scat) samples were collected from protected areas and connecting wildlife
corridors across the TAL-Nepal (Thapa et al in Review). Ninety-eight grid cells each measuring 15 X
15 km (225 km2, sampling unit) were sampled using opportunistic field surveys. A few grams from
the upper surfaces of the scat were removed and stored at room temperature in sterile 2-ml vials filled
with DETs buffer dimethyl sulphoxide saline solution; 73
at 1:4 volume scat-to-solution ratio
following field sampling protocols by Wultsch, et al. 74
.
DNA extraction, species identification, and individual identification
We extracted DNA from scat samples using a commercially available QIAmp DNA Stool Kit
(QIAGEN Inc., Germany) following the manufacturer‘s instructions. Each batch of DNA extraction
included a negative extraction control. Extracted DNA was stored at -20 °C. Tigers were identified
using PCR assay that used tiger specific mtDNA Cytochrome-b (CYT-B) primers 75
. Individual tigers
were identified by microsatellite analysis using a panel of eight microsatellite markers developed from
the domestic cat (Felis catus) and tiger genomes 76-78
as described in Thapa et al. [In Review].
Gut microbiome analysis
We randomly selected a total of 70 scat samples from 32 unique individual tigers (n = 12, CNP; n =
12, BNP; n = 8, SWR) for gut microbiome analysis. Soil samples were also collected from two of the
study sites (n = 3, CNP; n = 5, BNP) with the goal to profile soil microbiomes to assess cross-
contamination between soil and fecal samples occurred.
Bacterial DNA was isolated from tiger fecal and soil samples using PowerSoil DNA Isolation Kit
(MoBio, Qiagen, Carlsbad, CA). DNA quality was checked by gel electrophoresis (mostly >10 kbps
fragments), and DNA concentration was measured by Qubit (Invitrogen, Carlsbad, CA). We
completed microbial community profiling (identification and composition) by amplifying and
sequencing the hyper-variable region (V4) of the 16S rRNA from both tiger scat and soil control
samples using a modified version of the protocol presented in Caporaso et. al 2012 79
, adapted for the
Illumina MiSeq platform. Using a two-step polymerase chain reaction (PCR), we amplified the V4
region of the 16S rRNA using the ‗universal‘ bacterial/archaeal primer pairs (515F and 806R) linked
to the forward and reverse Illumina flow cell adapter sequences. PCR was carried out in two steps,
both using the 2X KAPA HiFi HotStart ReadyMix (KAPA Biosystems/Roche, USA) and cycling at
initial denaturation at 950C/30sec followed by 95
0C/30sec, 55
0C/30sec, 72
0C/30sec. Post cycling,
samples were incubated at 720C for 5 min, followed by a hold at 4
0C. The first PCR was conducted in
25 cycles, adding a 6 bp barcode sequence to enable multiplexing. The second PCR was conducted in
8 cycles to amplify the PCR products and add the remaining full-length Illumina adapters. We
purified the resulting PCR products using Agencourt AMPure XP beads (Beckman Coulter, Brea,
CA), quantified with Qubit (Invitrogen, USA), normalized, and pooled prior to sequencing. Paired-
end sequencing (2 x 300bp) was completed on Illumina MiSeq (Illumina, Inc., San Diego, CA), using
V3 600 cycle kits according to the manufacturer‘s instructions.
After sequencing and de-multiplexing, we filtered all reads by quality (q>29 across 50% of the read
length with no ambiguous N base calls) and length (>75 bp). A custom Perl script was written to
execute several analysis modules of QIIME, version 1.9.1 80
. First, we joined raw paired-end Illumina
fastq files by fastq-join. We discarded all OTU containing less than 10 sequences. We chose the
cluster centroid for each OTU as the OTU representative sequence and taxonomically assigned each
sequence using homologous searches to 16S reference sequences found in the Greengenes database 81
at greater than or equal to 96% sequence identity. To construct a phylogenetic tree of the OTU
representative sequences, we aligned sequences using PyNAST, version 1.2.2 82
against an existing
alignment of the Greengenes database. Post alignment and construction of phylogenetic trees was
completed using FastTree, version 2.1 83
.
Alpha-diversity, beta-diversity estimates, and relative abundance analysis of each taxonomic group
were performed after rarefaction was applied with even sub-sampling of 10,000 sequences per
sample. The abundances of OTUs were normalized based on proportion and OTUs with very low
variability (1e-05
) were filtered out. Microbial diversity within (alpha diversity) and between tiger
subpopulations (beta diversity) were obtained and visualized with QIIME and the phyloseq package in
R 84,85
. We assessed alpha diversity using several metrics (Chao1, ACE, Shannon, Simpson,
InvSimpson, Fisher) 40-44
. Statistical evaluation of differential abundance was done with F test
supplemented in the mt function in phyloseq. The resulting P values were adjusted for multiple
comparisons using Benjamin and Hoechberg‘s False discovery method (Fig. 6).
To test if gut microbiota diversity was significantly differentiated across different study sites (beta
diversity), we employed Permutational Multivariate Analysis of Variance (PERMANOVA) 86
,
canonical analysis of principal coordinates (CAP) 87
, and permutational tests of homogeneity of
dispersions (PERMDISP) 88
. To test for differences in both UniFrac and Bray-Curtis similarity
distances, we performed a one-way PERMANOVA and used pair-wise contrasts to examine
differences between sites. We visualized analyzed compositional differences using CAP and DPCoA
(detrended principal coordinate analysis) and also used the CAP discriminant analysis to validate the
PERMANOVA results (i.e., how distinct was each site in multivariate space) by assessing allocation
success using the ‗leave-one-out‘ procedure 87
. PERMDISP was used to compare beta diversity
between sites for both metrics 88
and to test if differences detected by PERMANOVA were likely due
to differences in-group dispersions. All of the above analyses were conducted in PRIMER- E
PERMANOVA+89
.
Predictive metabolic functions associated with tiger gut microbiota:
We used PICRUSt (Phylogenetic Investigation of Communities by Reconstruction of Unobserved
States) 90
to predict functional roles played by the tiger gut microbiome communities. PICRUSt
predicts metabolic and functional profiles of a microorganism based on known functional roles of its
closely related microorganism 90
. It utilizes existing information from Integrated Microbial Genomes
(IMG) database 91
, which contains annotation of gene content and 16S copy number data of reference
bacterial and archaeal genomes. Then by implementing extended ancestral-state reconstruction
algorithm, the taxonomic composition and phylogenetic information of the observed OTUs are used
in estimating the comprehensive metagenome of the microbiome community classifying their
metabolic and functional categories in the KEGG Orthology (KO) classification scheme 92
. The
PICRUSt predictions were subjected to statistical analyses with Statistical Analysis of Metagenomic
Profiles (STAMP) 93
for identifying and characterizing significant functional categories across three
subpopulations CNP, BNP, and SWR. We conducted multiple group statistical tests with ANOVA
and pair-wise statistical tests using Welch‘s t-test to test for statistical differences in mean proportion
of functional categories among subpopulations. The p-value was adjusted by applying the Benjamini-
Hochberg false discovery rate (FDR) method to correct for multiple hypotheses testing. We conducted
Procrustes 94
analysis using QIIME to test correlations on beta-diversity obtained for gut microbiome
and predictive microbiome functionality contents using Bray-Curtis distance metrics.

Acknowledgments
We would like to thank the Department of National Parks and Wildlife Conservation and the Ministry
of Forest and Soil Conservation (Nepal) for giving us permission to conduct the first genetic study of
tigers in Nepal. We would also like to thank our collaborators at the Los Alamos National lab, Griffith
University and the University of Idaho for providing valuable technical support and resources. And
finally, this work would not have been possible without dedication and hard work from our team at
the Center for Molecular Dynamics Nepal.
Author contributions
Study Concept- DK
Research Design- DK, PM,SM, LPW, JH and AKS were involved in designing the study
Field study design & sample collection- DK, KT, MJK, and MB designed field sample collection plan
and were involved in sample collection.
Laboratory analysis- SM, NPA, AMS, ANS, JJ, MV and SRS performed the laboratory work.
Data analysis- DK, PM, NMFJ, CW, SB and AKS did bioinformatics, statistical and GIS data
analysis.
Manuscript preparation- DK, SD, NS, BL, LPW, MV, JMH and CW worked on manuscript
preparation.
Additional Information
Competing interests
The funder supporting this research had no role in study design, data collection, interpretation and
decision to submit the work for publication.
Data Availability
All data related to the study is included in the manuscript and are available through the npj Biofilms
and Microbiomes website.
REFERENCES
1 Ley, R. E. et al. Evolution of mammals and their gut microbes. Science 320, 1647-1651,
doi:10.1126/science.1155725 (2008).
2 Quercia, S. et al. From lifetime to evolution: timescales of human gut microbiota adaptation.
Frontiers in microbiology 5, 587, doi:10.3389/fmicb.2014.00587 (2014).
3 Sommer, F. & Bäckhed, F. The gut microbiota—masters of host development and
physiology. Nature Reviews Microbiology 11, 227-238 (2013).
4 Clemente, J. C., Ursell, L. K., Parfrey, L. W. & Knight, R. The impact of the gut microbiota
on human health: an integrative view. Cell 148, 1258-1270 (2012).
5 Nicholson, J. K. et al. Host-gut microbiota metabolic interactions. Science 336, 1262-1267
(2012).
6 Zoetendal, E. G., Akkermans, A. D., Akkermans-van Vliet, W. M., de Visser, J. A. G. & de
Vos, W. M. The host genotype affects the bacterial community in the human gastronintestinal
tract. Microbial ecology in health and disease 13, 129-134 (2001).
7 Redford, K. H., Segre, J. A., Salafsky, N., del Rio, C. M. & McAloose, D. Conservation and
the microbiome. Conserv. Biol. 26, 195-197 (2012).
8 Ley, R. E., Peterson, D. A. & Gordon, J. I. Ecological and evolutionary forces shaping
microbial diversity in the human intestine. Cell 124, 837-848 (2006).
9 Degnan, P. H. et al. Factors associated with the diversification of the gut microbial
communities within chimpanzees from Gombe National Park. Proceedings of the National
Academy of Sciences 109, 13034-13039 (2012).
10 Tung, J. et al. Social networks predict gut microbiome composition in wild baboons. Elife 4,
e05224 (2015).
11 Gomez, A. et al. Gut Microbiome of Coexisting BaAka Pygmies and Bantu Reflects
Gradients of Traditional Subsistence Patterns. Cell reports 14, 2142-2153,
doi:10.1016/j.celrep.2016.02.013 (2016).
12 Barelli, C. et al. Habitat fragmentation is associated to gut microbiota diversity of an
endangered primate: implications for conservation. Scientific reports 5, 14862,
doi:10.1038/srep14862 (2015).
13 Amato, K. R. et al. Habitat degradation impacts black howler monkey (Alouatta pigra)
gastrointestinal microbiomes. The ISME journal 7, 1344-1353, doi:10.1038/ismej.2013.16
(2013).
14 Schwab, C., Cristescu, B., Northrup, J., Stenhouse, G. & Gänzle, M. Diet and environment
shape fecal bacterial microbiota composition and enteric pathogen load of grizzly bears. PLoS
One 6, e27905 (2011).
15 Gomez, A. et al. Gut microbiome composition and metabolomic profiles of wild western
lowland gorillas (Gorilla gorilla gorilla) reflect host ecology. Molecular ecology 24, 2551-
2565 (2015).
16 Phillips, C. D. et al. Microbiome analysis among bats describes influences of host phylogeny,
life history, physiology and geography. Molecular ecology 21, 2617-2627 (2012).
17 Menke, S. et al. Oligotyping reveals differences between gut microbiomes of free-ranging
sympatric Namibian carnivores (Acinonyx jubatus, Canis mesomelas) on a bacterial species-
like level. Frontiers in microbiology 5, 526, doi:10.3389/fmicb.2014.00526 (2014).
18 Amato, K. Co-evolution in context: the importance of studying gut microbiomes in wild
animals. Microbiome Science and Medicine 1 (2013).
19 Podolsky, D. K. The current future understanding of inflammatory bowel disease. Best
practice & research Clinical gastroenterology 16, 933-943 (2002).
20 Targan, S. R. & Karp, L. C. Defects in mucosal immunity leading to ulcerative colitis.
Immunological reviews 206, 296-305 (2005).
21 Round, J. L. & Mazmanian, S. K. The gut microbiota shapes intestinal immune responses
during health and disease. Nature Reviews Immunology 9, 313-323 (2009).
22 Suchodolski, J. S. Intestinal microbiota of dogs and cats: a bigger world than we thought.
Veterinary Clinics of North America: Small Animal Practice 41, 261-272 (2011).
23 Sekirov, I., Russell, S. L., Antunes, L. C. M. & Finlay, B. B. Gut microbiota in health and
disease. Physiological reviews 90, 859-904 (2010).
24 Bahrndorff, S., Alemu, T., Alemneh, T. & Lund Nielsen, J. The microbiome of animals:
implications for conservation biology. International journal of genomics 2016 (2016).
25 Stumpf, R. et al. Microbiomes, metagenomics, and primate conservation: New strategies,
tools, and applications. Biological Conservation 199, 56-66 (2016).
26 Seidensticker, J. Saving wild tigers: a case study in biodiversity loss and challenges to be met
for recovery beyond 2010. Integrative zoology 5, 285-299, doi:10.1111/j.1749-
4877.2010.00214.x (2010).
27 Dinerstein, E. et al. The fate of wild tigers. . BioScience 57, 508-514 (2007).
28 Barber‐Meyer, S. M. et al. Influence of prey depletion and human disturbance on tiger
occupancy in Nepal. Journal of Zoology 289, 10-18 (2013).
29 Kenney, J. S., Smith, J. L., Starfield, A. M. & McDougal, C. W. The long‐term effects of tiger
poaching on population viability. . Conservation Biology. 1995 Oct 1;9(5):1127-33. 9, 1127-
1133 (1995).
30 Smith, J. L., Ahern, S. C. & McDougal, C. Landscape analysis of tiger distribution and
habitat quality in Nepal. . Conservation Biology. 1998 Dec 1;12(6):1338-46. 12, 1338-1346
(1998).
31 Wikramanayake, E. et al. Designing a conservation landscape for tigers in human‐dominated
environments. . Conservation Biology 18, 839-844 (2004).
32 Kanagaraj, R., Wiegand, T., Kramer‐Schadt, S., Anwar, M. & Goyal, S. P. Assessing habitat
suitability for tiger in the fragmented Terai Arc Landscape of India and Nepal. . Ecography.
2011 Dec 1;34(6):970-81. 34, 970-981 (2011).
33 Treves, A. a. K. U. K. Human-carnivore conflict and perspectives on carnivore management
worldwide. Conservation Biology 17, 1491-1499 (2003).
34 Zimmermann, A. et al. Contemporary views of human–carnivore conflicts on wild
rangelands. Wiley-Blackwell, Oxford. (2010).
35 Clayton, J. B. et al. Captivity humanizes the primate microbiome. Proceedings of the
National Academy of Sciences, 201521835 (2016).
36 NTGP/CMDN. Nepal Tiger Genome Project - Final Report 2014, Center for Molecular
Dynamics-Nepal. (Center for Molecular Dynamics-Nepal, 2014).
37 Becker, A. A., Janssens, G. P., Snauwaert, C., Hesta, M. & Huys, G. Integrated community
profiling indicates long-term temporal stability of the predominant faecal microbiota in
captive cheetahs. PLoS One 10, e0123933, doi:10.1371/journal.pone.0123933 (2015).
38 Zhang, H., Liu, G., Chen, L. & Sha, W. Composition and diversity of the bacterial community
in snow leopard (Uncia uncia) distal gut. Annals of Microbiology 65, 703-711 (2015).
39 Handl, S., Dowd, S., Garcia-Mazcorro, J., Steiner, J. & Suchodolski, J. Massive parallel 16S
rRNA gene pyrosequencing reveals highly diverse fecal bacterial and fungal communities in
healthy dogs and cats. FEMS microbiology ecology 76, 301-310 (2011).
40 Chao, A. Nonparametric estimation of the number of classes in a population. Scandinavian
Journal of statistics, 265-270 (1984).
41 Chao, A. Species estimation and applications. Encyclopedia of statistical sciences (2005).
42 Shannon, C. & Weaver, W. (University of Illinois Press IL, 1949).
43 Simpson, E. Measurement of diversity. Nature (1949).
44 Fisher, R. A., Corbet, A. S. & Williams, C. B. The relation between the number of species
and the number of individuals in a random sample of an animal population. The Journal of
Animal Ecology, 42-58 (1943).
45 Benjamini, Y. & Hochberg, Y. Controlling the false discovery rate: a practical and powerful
approach to multiple testing. Journal of the Royal Statistical Society. Series B
(Methodological), 289-300 (1995).
46 Woese, C. R. Bacterial evolution. Microbiological reviews 51, 221 (1987).
47 Eaton, K. et al. Gastric spiral bacilli in captive cheetahs. Scandinavian Journal of
Gastroenterology 26, 38-42 (1991).
48 Minamoto, Y., Dhanani, N., Markel, M. E., Steiner, J. M. & Suchodolski, J. S. Prevalence of
Clostridium perfringens, Clostridium perfringens enterotoxin and dysbiosis in fecal samples
of dogs with diarrhea. Veterinary microbiology 174, 463-473 (2014).
49 Frank, D. N. et al. Molecular-phylogenetic characterization of microbial community
imbalances in human inflammatory bowel diseases. Proceedings of the National Academy of
Sciences 104, 13780-13785 (2007).
50 Suchodolski, J. S. et al. The fecal microbiome in cats with diarrhea. PloS one 10, e0127378
(2015).
51 Shin, N.-R., Whon, T. W. & Bae, J.-W. Proteobacteria: microbial signature of dysbiosis in gut
microbiota. Trends in biotechnology 33, 496-503 (2015).
52 Ramakrishna, B. S. Role of the gut microbiota in human nutrition and metabolism. Journal of
gastroenterology and hepatology 28, 9-17 (2013).
53 Kohl, K. D., Sadowska, E. T., Rudolf, A. M., Dearing, M. D. & Koteja, P. Experimental
evolution on a wild mammal species results in modifications of gut microbial communities.
Frontiers in microbiology 7 (2016).
54 Menke, S. et al. Gut microbiomes of free‐ranging and captive Namibian cheetahs: diversity,
putative functions, and occurrence of potential pathogens. Molecular Ecology (2017).
55 Delport, T. C., Power, M. L., Harcourt, R. G., Webster, K. N. & Tetu, S. G. Colony location
and captivity influence the gut microbial community composition of the Australian sea lion
(Neophoca cinerea). Applied and environmental microbiology 82, 3440-3449 (2016).
56 Yildirim, S. et al. Characterization of the fecal microbiome from non-human wild primates
reveals species specific microbial communities. PloS one 5, e13963 (2010).
57 Medeiros, A. W. et al. Characterization of the faecal bacterial community of wild young
South American (Arctocephalus australis) and Subantarctic fur seals (Arctocephalus
tropicalis). FEMS Microbiol Ecol 92, doi:10.1093/femsec/fiw029 (2016).
58 Krajmalnik-Brown, R., Ilhan, Z.-E., Kang, D.-W. & DiBaise, J. K. Effects of gut microbes on
nutrient absorption and energy regulation. Nutrition in Clinical Practice 27, 201-214 (2012).
59 Ismail, N. A. et al. Frequency of Firmicutes and Bacteroidetes in gut microbiota in obese and
normal weight Egyptian children and adults. Archives of medical science: AMS 7, 501 (2011).
60 Boulangé, C. L., Neves, A. L., Chilloux, J., Nicholson, J. K. & Dumas, M.-E. Impact of the
gut microbiota on inflammation, obesity, and metabolic disease. Genome medicine 8, 42
(2016).
61 Maynard, C. L., Elson, C. O., Hatton, R. D. & Weaver, C. T. Reciprocal interactions of the
intestinal microbiota and immune system. Nature 489, 231-241 (2012).
62 Bayhan, G. İ., Tanır, G., Karaman, İ. & Özkan, Ş. Comamonas testosteroni: an unusual
bacteria associated with acute appendicitis. Balkan medical journal 30, 447 (2013).
63 Almuzara, M. N. et al. Intra-abdominal infections due to Comamonas kerstersii. Journal of
clinical microbiology 51, 1998-2000 (2013).
64 Kageyama, A., Sakamoto, M. & Benno, Y. Rapid identification and quantification of
Collinsella aerofaciens using PCR. FEMS microbiology letters 183, 43-47 (2000).
65 Kassinen, A. et al. The fecal microbiota of irritable bowel syndrome patients differs
significantly from that of healthy subjects. Gastroenterology 133, 24-33 (2007).
66 Chen, J. et al. An expansion of rare lineage intestinal microbes characterizes rheumatoid
arthritis. Genome Med 8, 43, doi:10.1186/s13073-016-0299-7 (2016).
67 Kostic, A. D. et al. Fusobacterium nucleatum potentiates intestinal tumorigenesis and
modulates the tumor-immune microenvironment. Cell host & microbe 14, 207-215,
doi:10.1016/j.chom.2013.07.007 (2013).
68 Dulal, S. & Keku, T. O. Gut microbiome and colorectal adenomas. Cancer journal 20, 225-
231, doi:10.1097/PPO.0000000000000050 (2014).
69 Langworth, B. F. Fusobacterium necrophorum: its characteristics and role as an animal
pathogen. Bacteriological Reviews 41, 373 (1977).
70 Edwards, J., Davis, D., Roffe, T., Ramiro-Ibanez, F. & Elzer, P. Fusobacteriosis in captive
wild-caught pronghorns (Antilocapra americana). Veterinary pathology 38, 549-552 (2001).
71 Smith, G., Wallace, L. & Noakes, D. Experimental observations on the pathogenesis of
necrobacillosis. Epidemiology & Infection 104, 73-78 (1990).
72 Rubinstein, M. R. et al. Fusobacterium nucleatum promotes colorectal carcinogenesis by
modulating E-cadherin/β-catenin signaling via its FadA adhesin. Cell host & microbe 14,
195-206 (2013).
73 Seutin, G., White, B. N. & Boag, P. T. Preservation of avian blood and tissue samples for
DNA analyses. Canadian Journal of Zoology 69, 82-90, doi:10.1139/z91-013 (1991).
74 Wultsch, C., Waits, L., Hallerman, E. & Kelly, M. Optimizing Collection Methods for
Noninvasive Genetic Sampling of Neotropical Felids. Wildlife Society Bulletin 39, 403-412
(2015).
75 Bhagavatula, J. & Singh, L. Genotyping faecal samples of Bengal tiger Panthera tigris tigris
for population estimation: a pilot study. BMC genetics 7, 48, doi:10.1186/1471-2156-7-48
(2006).
76 Menotti-Raymond, M. et al. A genetic linkage map of microsatellites in the domestic cat
(Felis catus). Genomics 57, 9-23 (1999).
77 Sharma, R. et al. Fourteen new di‐and tetranucleotide microsatellite loci for the critically
endangered Indian tiger (Panthera tigris tigris). Molecular ecology resources 8, 1480-1482
(2008).
78 Menotti-Raymond, M. A., David, V. A., Wachter, L. L., Butler, J. M. & O‘Brien, S. J. An
STR forensic typing system for genetic individualization of domestic cat (Felis catus)
samples. J Forensic Sci 50, 1061-1070 (2005).
79 Caporaso, J. et al. Global patterns of 16S rRNA diversity at a depth of millions of sequences
per sample. Proceedings of the National Academy of Sciences 108, 4516-4522 (2011).
80 Caporaso, J. et al. QIIME allows analysis of high-throughput community sequencing data.
Nature methods 7, 335-336 (2010).
81 DeSantis, T. et al. Greengenes, a chimera-checked 16S rRNA gene database and workbench
compatible with ARB. Applied and environmental microbiology 72, 5069-5072 (2006).
82 Caporaso, J. et al. PyNAST: a flexible tool for aligning sequences to a template alignment.
Bioinformatics 26, 266-267 (2010).
83 Price, M., Dehal, P. & Arkin, A. FastTree 2–approximately maximum-likelihood trees for
large alignments. PloS one 5, e9490 (2010).
84 RDCT. R Development Core Team (2014). R: a language and environment for statistical
computing (R Foundation for Statistical Computing). (2014).
85 McMurdie, P. J. & Holmes, S. phyloseq: an R package for reproducible interactive analysis
and graphics of microbiome census data. PloS one 8, e61217 (2013).
86 Anderson, M. J. A new method for non-parametric multivariate analysis of variance. Austral
Ecology 26, 32-46, doi:10.1111/j.1442-9993.2001.01070.pp.x (2001).
87 Anderson, M. J. & Willis, T. J. Canonical analysis of principal coordinates: a useful method
of constrained ordination for ecology. Ecology 84, 511-525 (2003).
88 Anderson, M. J., Ellingsen, K. E. & McArdle, B. H. Multivariate dispersion as a measure of
beta diversity. Ecology letters 9, 683-693 (2006).
89 Anderson, M., Gorley, R. N. & Clarke, R. K. Permanova+ for Primer: Guide to Software and
Statisticl Methods. (Primer-E Limited, 2008).
90 Langille, M. G. et al. Predictive functional profiling of microbial communities using 16S
rRNA marker gene sequences. Nature biotechnology 31, 814-821 (2013).
91 Markowitz, V. M. et al. IMG: the integrated microbial genomes database and comparative
analysis system. Nucleic acids research 40, D115-D122 (2011).
92 Kanehisa, M., Goto, S., Sato, Y., Furumichi, M. & Tanabe, M. KEGG for integration and
interpretation of large-scale molecular data sets. Nucleic acids research 40, D109-D114
(2011).
93 Parks, D. H., Tyson, G. W., Hugenholtz, P. & Beiko, R. G. STAMP: statistical analysis of
taxonomic and functional profiles. Bioinformatics 30, 3123-3124 (2014).
94 Gower, J. C. Generalized procrustes analysis. Psychometrika 40, 33-51 (1975).
CHAPTER VII
Conclusion and future direction
The results of my study provide a holistic perspective on conservation research of Bengal tiger in
particular and its symbiotic biodiversity in general using non-invasive genetics tools and technology.
Understanding general biodiversity while focusing on flagship species:
More research is needed to understand the type of interaction between the carnivore species existing
in the Terai and trans-himalaya landscapes. My study helps our understanding of other sympatric
species prevalent in the tiger habitat. As tiger is a flagship species, it often attracts both attention and
resources, leveraging on that, I have included efforts to also incorporate DNA analysis of samples
that were not found to be of tiger and by doing so I was able to create a biodiversity map of the terai
landscape. Biodiversity in general is not well studied in this part of the world, and I believe my study
has provided an opportunity to create baseline a biodiversity map of sympatric species in the tiger
habitat. Additionally, my analysis has also identified the presence of an unknown species of fox in the
Terai landscape. DNA sequence of identified species closely matched with the red fox (98% match;
100% query on 90bp PCR amplicon DNA sequence data) but red foxes are not known to occur in the
Terai landscape. We believe that we have detected Bengal fox (Vulpes bengalensis), which is known
to inhabit the Terai area of Nepal and India, but there were no DNA sequences for Bengal fox in the
NCBI database, so further study is needed to verify our assumption.
Identifying factors that impact species (tiger) conservation status:
High rates of anthropogenic transformation of landscapes play a major role in extinction of wild
mammal populations. This kind of land-use change has been devastating for predators like tiger with
the loss of habitat across their historical distribution, which often results in severe population decline
and local extirpations in the last few generations. Most wild tiger populations are now confined to
protected areas. Poaching and habitat loss are major threats to the tiger and other wildlife species in
the remaining 13,500 km2 of potential habitat in Nepal. Against this background, the results of my
genetic study of tigers are critical to understanding the current levels of genetic diversity and
connectivity which can play a significant role in prioritizing conservation efforts in the TAL species
like tigers.
Tigers in the TAL displayed moderate levels of genetic variation (He = 0.61) across the landscape,
perhaps due to moderate population size and/or gene flow. Overall, my results suggest low to
moderate levels of genetic diversity based on eight polymorphic loci across the tiger population in the
TAL. Lower levels of genetic diversity were detected in this population compared to other high-
diversity areas in the Satpura-Maikal landscape of India. Results suggest three distinct clusters of tiger
sub-populations within the landscape. Admixed models and concurrent results from both spatial and
non-spatial algorithms in the STRUCTURE and TESS programs suggest three (k = 3) clusters of tiger
sub-populations in the landscape, confirming my prior hypothesis. The field data suggested
demographic contiguity in and around the protected areas. However, in the absence of tiger samples
from the Indian side of the TAL, there is a lack of clarity in explaining the overall genetic structure of
tigers in the entire landscape; tigers could travel through the contiguous protected areas of India into
Nepal.
Tiger’s greatest threat- Poaching: developing of utility based research study
Wildlife crime is a serious transnational threat to biodiversity in South Asia. Driven by organized
criminal syndicates that control the burgeoning and highly lucrative illicit trade in wildlife parts, there
is an immediate need to develop tools that can assist in tracking and ultimately preventing wildlife
crime. The use of forensic tools plays an important role in strengthening law enforcement efforts to
address wildlife crime and biodiversity conservation. It has already been successfully used in some
countries to improve investigation of wildlife cases, identification of poaching hotspots and
trafficking routes as well as prosecution of wildlife criminals by connecting individuals to crime
scenes.
Application of molecular (DNA) forensics is relatively new and the rapidly evolving technology is
gaining acceptance in wildlife conservation efforts. The information obtained through the genetic-
forensic approach is more robust and comprehensive than conventional methods. To fulfill the urgent
need to address location of poached tigers, I created a wild tiger geo-spatial, genetic baseline database
through the Nepal Tiger Genome Project (2011-2013) which is probably the world's most
comprehensive genetic database. This has provided valuable information on wildlife crime ―hot spots‖
and presented scientific evidence to incriminate criminals in a court of law. I identified one tiger skin
that had an exact DNA profile with one of our reference NTGP tigers from BNP. I collected a fecal
sample of that individual in the winter season of 2012; and since I collected fecal samples that were
relatively fresh (<3 month), this particular individual was probably poached as recent as 1 to 2 years
ago. Of all the forensic evidence I analyzed, most were traced to Bardia, highlighting this area as a
wildlife crime hotspot.
This was crucial information for Nepal‘s law enforcement officials. After dissemination of these
results, the concerned stakeholders, including the Nepal Police and the Nepal Army increased their
patrols and intelligence activities particularly in the Bardia region. As a result, a few criminal
networks involved in wildlife crime in that area were discovered and necessary actions were taken
supporting long term wildlife crime prevention.
Comparative genomics study on host (tiger) and its gut micobiome:
The gut microbial composition obtained with fecal samples collected in the tiger sub-population
showed that while there is a core microbiome common to all the three subpopulations, the relative
abundance of various taxa is significantly different. These differences are highest between
subpopulations of CNP and SWR. This inference corresponds to the geo-specific locations of these
regions. However additionally, predicted metabolic functionalities also reveal a consistent pattern
with higher functional enrichment and diversity in CNP for most categories and the lowest enrichment
and diversity in SWR. The enrichment distribution based on samples from BNP overlap at two
extremes with the CNP and SWR based enrichment distributions. My results map the genetic
diversity, gut microbiome composition and predictive metabolic functionalities based on fecal
samples collected over the Terai region in Nepal. I find a consistent pattern in differentiation, gut
microbial composition and predicted functionality that corresponds to habitat fragmentation. My
findings highlight the necessity of a comprehensive systems biology based approach to conservation
with a focus on monitoring and maintaining genetic diversity and a healthy gut microbial
composition.

Overall implication, utility and future direction of my work:
My study, through Nepal Tiger Genome Project, has looked into all aspect of molecular approaches
and created the most comprehensive genetic baseline database of wild tigers in Nepal and helped
comprehend the tiger population from conservation genetics perspective. Information uncovered has
now been utilized to formulate effective conservation strategies. This kind of work and effort is
carried out for the first time in Nepal; and some work, especially molecular forensics and gut
microbiome study, are done for the first time. This has also created necessary capacity to do similar
work in other important endangered species in developing countries like Nepal. Additionally I am
also looking at creating viral and dietary profiles on some of these tiger fecal samples as part of my
commitment to understand this species further. Meanwhile, I have been able to train over 50
conservation biologists and laboratory specialists on various aspects of our study.
~~ END of REPORT~~


![[3]Molecular Approaches in General Anesthetics](https://img.pdfslide.net/doc/110x75/577d1cf31a28ab4e1e8b45c4/3molecular-approaches-in-general-anesthetics.jpg)