Embed Size (px)
Citation preview

1
Molecular Cell, Volume 49
Supplemental Information
LSD2/KDM1B and Its Cofactor NPAC/GLYR1
Endow a Structural and Molecular Model
for Regulation of H3K4 Demethylation
Rui Fang, Fei Chen, Zhenghong Dong, Di Hu, Andrew J. Barbera, Erin A. Clark, Jian Fang,
Ying Yang, Pinchao Mei, Michael Rutenberg, Ze Li, Ying Zhang, Youwei Xu, Huirong Yang,
Ping Wang, Matthew D. Simon, Qiongjie Zhou, Jing Li, Mark P. Marynick, Xiaotian Li, Haojie
Lu, Ursula B. Kaiser, Robert E. Kingston, Yanhui Xu, Yujiang Geno Shi

2

3
Figure S1. NPAC Specifically Regulates the H3K4 Demethylase Activity of LSD2,
Related to Figure 1
A. Determination of the threshold dosage of purified LSD2 required for nucleosomal
H3K4 demethylation. 2μg of nucleosomes purified from HeLa were incubated with
various amount of His-LSD2 proteins for 2 hours at 30ºC. The demethylation reactions
were analyzed by immunoblotting using indicated antibodies. 0.5μg of His-LSD2
showed no obvious demethylase activity under the experimental conditions, and was
used in all nucleosome demethylation assays to the examination of the cofactor
activities of wild-type and mutant NPAC proteins and peptides unless otherwise stated.
B. NPAC has no stimulatory effect on LSD1-mediated nucleosome demethylation. 2μg
LSD1 in combination with 5μg purified NPAC or CoREST protein was used for histone
demethylase assays. Even though LSD1 effectively demethylated H3K4me2 of bulk
histone substrates (compare lane 6&7), nucleosomal demethylation activity was only
observed in the presence of CoREST (compare lane 5 to lane 1). Both full-length (wt)
and the linker region (residues 152-268) of NPAC failed to stimulate LSD1
demethylation of nucleosomes (compare lane 3-4 to lane 2).
C. NPAC stimulates LSD2 H3K4me1 demethylase activity in vivo. Immunofluorescence
analyses of H3K4me1 demethylation in cells expressing LSD2 alone or in combination
with full-length NPAC. Green, GFP-LSD2; red, H3K4me1; blue, DAPI counterstain of
DNA. Transfected cells are marked by arrows; cells shown significant reduction of
H3K4me1 are marked by dotted circles. Ectopic expression of LSD2 alone shows weak
demethylation of H3K4me1. In contrast, coexpression of LSD2 and NPAC induces
obvious global decrease of H3K4me1. Ectopic expression of NPAC alone did not induce

4
detectable changes in H3K4me1 or H3K4me2 levels, possibly due to the limited amount
of endogenous LSD2 in cells (data not shown).
D. Immunofluorescence analyses of H3K9me2 demethylation in cells coexpressing
LSD2 and full-length NPAC. Green, GFP-LSD2; red, H3K9me2; blue, DAPI counterstain
of DNA. No H3K9me2 demethylation activity was observed in cells expressing either
LSD2 alone (data not shown), or coexpressing LSD2 and NPAC.

5
Figure S2. Electron Density Maps of H3K4M Peptide and NPAC in the Cocrystal
Structure, Related to Figure 3
Electron density maps of the H3K4M peptide and NPAC in the co-crystal structure of
LSD2-NPAC-H3K4M peptide ternary complex are shown in stick representation in (A)
6
and (B), respectively. The map is calculated at 2.25 Å and contoured at 0.8. Though
histone H3K4M 1-21 was used for crystallization, only residues 1-20 can be identified.
Residue L20 of the H3K4M peptide are clearly covered by electron density, indicating
that this critical residue making contact with the LSD2-NPAC complex was built
correctly in the structural model. The linker region of NPAC (residues 152-268) was
used for co-crystallization studies. Residues 214-225 of NPAC display nice electron
density and can be unambiguously identified, while other residues are disordered and
not found in the co-crystal structure.

7
8
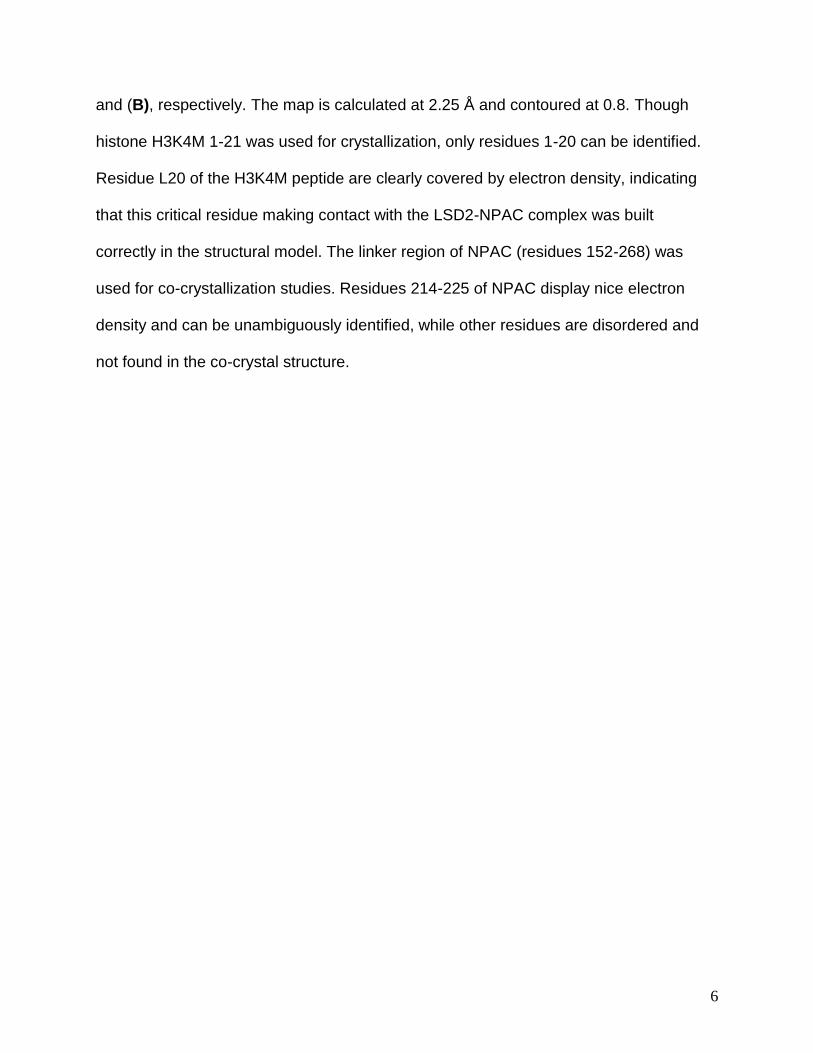
Figure S3. NPAC Binding Does Not Induce Significant Conformational Changes in
LSD2 to Allow H3K9 Demethylation, Related to Figure 3
A. Structural superimposition of LSD2 alone (grey) and the ternary complex of LSD2-
NPAC-H3K4M peptide (green) shown in ribbon representation. NPAC and H3K4M
peptide are shown in blue and yellow, respectively. The structures of LSD2 are nearly
identical.
B. Structure of the LSD2 catalytic site in the ternary complex of LSD2, NPAC and
H3K4M peptide. LSD2 is shown in ribbon representation and FAD in stick
representation. K4M and K9 of H3 peptide, and LSD2 catalytic residue K661 are shown
in stick representation. Distances are given in angstroms. The distance between K9 and
FAD is 13.96 angstrom, disfavoring H3K9 demethylation by LSD2 with or without NPAC
binding.
C. Mass spectrometry analyses of LSD2 demethylase activity on H3K9me2 peptides.
A high concentration of wild-type LSD2 (1.2μM) was incubated with biotinylated
H3K9me2 peptide of indicated length, and no demethylase activity was detected.
Biotinylation of H3K9me2 peptides at the C-terminus does not affect the interaction
between LSD2 and substrate (data not shown). Histone demethylation assays using
nucleosome or bulk histone substrates also failed to detect any H3K9me2 demethylase
activity of human LSD2, in the presence or absence of NPAC protein (data not shown).

9

10
Figure S4. Structural Comparisons of the Catalytic Domains of LSD2 and LSD1
and the Zf-CW Domains of LSD2 and ZCWPW1 that Bind to H3K4me3, Related to
Figure 4
A. Structural superimposition of the AO domains of LSD2 and LSD1, shown in ribbon
representation and colored in green and grey, respectively.
B. A close-up view of the substrate binding site of LSD2, with the H3K4M peptide
shown in yellow.
C. A close-up view of the substrate binding site of LSD1, with the H3K4M peptide
shown in purple. FAD coenzyme and residues involved in interactions are shown in
stick representations. Hydrogen bonds and salt bridge network are shown as dashed
lines. Residues contacting the N-terminus of H3K4M peptide are highly conserved in
both enzymes, indicating similar mechanisms of substrate recognition.
D. Structural superimposition of the Zf-CW domains of LSD2 and ZCWPW1
(2RR4.PDB, in complex with histone H3K4me3 peptide) (He et al., 2010), colored in
purple and gold, respectively. The SWIRM domain of LSD2 is colored in red. Histone
H3K4me3 peptide bound to the Zf-CW domain of ZCWPW1 is colored in green.
E. A close-up view of the interaction between H3K4me3 peptide and a hydrophobic
pocket in the Zf-CW domain of ZCWPW1, formed by three tryptophan residues shown
in stick representation.
F. A close-up view of the interaction between the SWIRM and Zf-CW domains in LSD2
structure. LSD2 Zf-CW domain superimposes with that of ZCWPW1, with a similar
hydrophobic patch formed by W139, W150 and V193. Interestingly, this hydrophobic
patch is filled with the side chain of residues L340 and I343 in the adjacent SWIRM

11
domain. Thus LSD2 Zf-CW is unlikely to interact with other proteins or histone
modifications on this surface unless significant conformational change occurs.

12
A
13
B

14
Figure S5. Summary of the Interactions among the LSD2 Enzyme, NPAC Cofactor,
and H3 Peptide Substrate, Related to Figure 6
A. Sequence alignment of human LSD1, LSD2, MAO and Maize PAO. The Zf-CW
domain of LSD2 is aligned with that of human ZCWPW1. Identical and highly conserved
residues are highlighted in dark green; conserved residues in light green. Secondary
structural elements of LSD2 are colored as in Figure 3 and are indicated above the
sequences. Residues that are involved in zinc coordination are connected by solid lines.
Residues that are involved in interactions with the H3K4M peptide and NPAC in the co-
crystal structure are indicated by red triangles and blue squares, respectively. Notably,
many residues in the α9-helix and the extended loop in LSD2 SWIRM domain make
contacts with NPAC and the C-terminal tail of H3K4M peptide, and are significantly
different from LSD1.
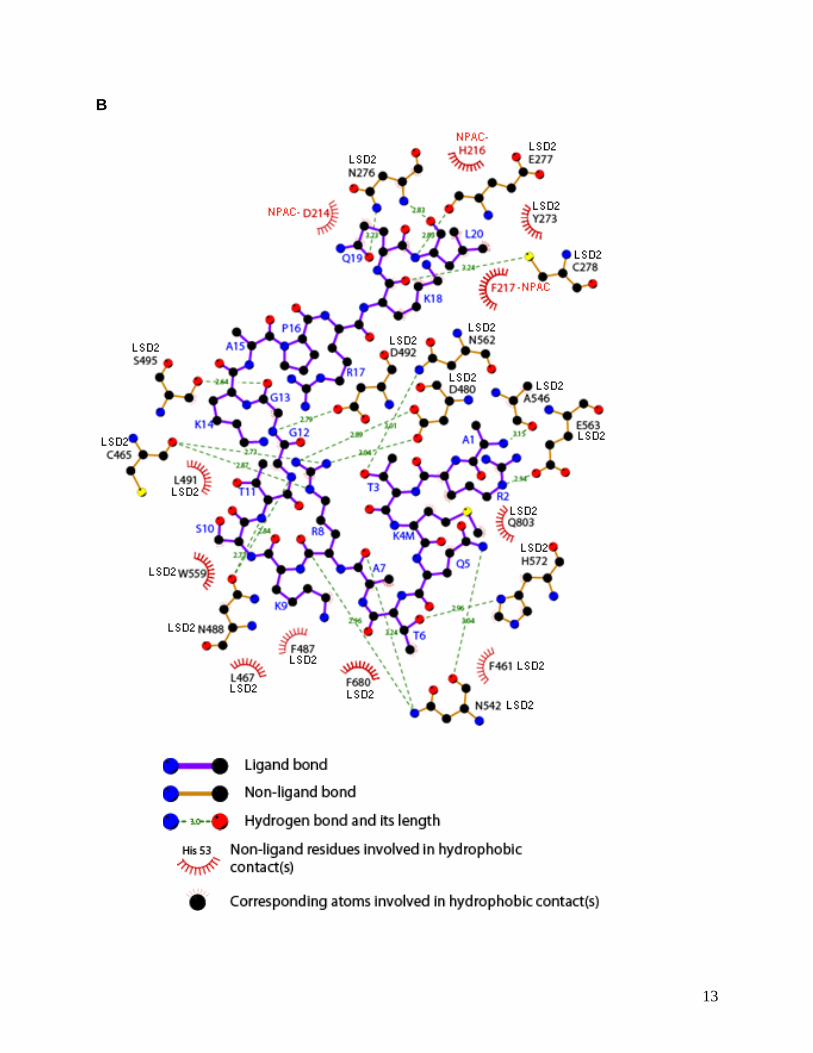
B. Ligplot of the interaction of the H3K4M peptide with LSD2 and NPAC in co-crystals
of the ternary complex. The carbon, oxygen, and nitrogen atoms are colored in black,
red, and blue, respectively. LSD2 residues are labeled in black, NPAC residues in red,
and residues of the H3K4M peptide in blue. Lengths of hydrogen bond (green dashed
lines) are given in angstroms. Internal hydrogen bonds are not shown. The N-terminus
of H3K4M peptide interacts with the AO domain of LSD2, while the C-terminal tail of
H3K4M peptide interacts with the LSD2 SWIRM domain and NPAC residues 214-217.

15
16
Figure S6. Characterizing the Effect of the Length of H3K4me2 Peptides on LSD2
Demethylase Activity and NPAC Cofactor Activity, the Cofactor Activity of Full-
Length NPAC F217A Protein, and the Wild-Type and Mutant NPAC Proteins,
Related to Figure 6
A-B. LSD2 demethylation and NPAC cofactor activity on H3K4me2 peptide 1-21 (A)
and 1-15 (B)
50μM H3K4me2 peptides (residues 1-21 in A and residues 1-15 in B) were incubated
with 0.15μM or 1.2μM purified LSD2 (residues 51-822) as indicated in 50mM Tris-HCl,
pH 8.5, 50mM KCl, 5mM MgCl2, 5% glycerol at 37°C for 30 min, in the presence or
absence of NPAC protein (residues 152-252). Demethylation products were analyzed
by MALDI-TOF mass spectrometry. 0.15μM LSD2 can efficiently demethylate the longer
H3K4me2 peptide (1-21), but has no detestable activity on the shorter histone peptide
(1-15), demethylation of which requires high concentration (1.2μM) of LSD2. In
comparison, while NPAC protein showed robust cofactor activity using the longer
H3K4me2 peptide (1-21) as expected, no stimulation effect was observed for the
shorter H3K4me2 peptide (1-15) even in the presence of high concentration of LSD2. It
indicates the importance of histone residue 16-21 to LSD2 enzymatic activity and NPAC
cofactor activity, supporting our model that NPAC assists enzyme-substrate interactions
by creating a new binding site for H3 L20 in the LSD2-NPAC complex.
C. LSD2 demethylation and NPAC cofactor activity on longer H3K4me2 peptide (1-44).
2μg H3K4me2 peptide (1-44) were incubated with 0.8μg GST-LSD2 (1-822) and 2μg
wild-type or F217A full-length GST-NPAC proteins in 100μl demethylation buffer (50mM
Tris-HCl pH 8.1, 1mM NAD+, 0.1Unit formaldehyde dehydrogenase) at 30ºC for 2 hours.

17
LSD2 alone can efficiently demethylate di-methyl H3K4 of the long peptides, converting
large majority of the substrate to H3K4me1. Wild-type NPAC protein can efficiently
stimulate LSD2 demethylation, producing unmethylated H3K4. F217A mutation impairs
NPAC cofactor activity as expected, showing little stimulatory effect if any. To compare
demethylation efficiency, 1.2μg bio-H3K4me2 peptide (H3 residue 1-21, equal molar
ratio to 2ug H3K4me2 1-44 peptide in above assays) was demethylated by LSD2 under
identical conditions (bottom panel). Significantly fewer H3K4me2 peptides (1-21) were
converted to H3K4me1. The result suggests that H3 residues 22-44 may make
additional contacts with LSD2 enzyme and are important for H3K4 demethylation
efficiency.
D. F217A mutation significantly impaired the cofactor activity of full-length NPAC on
nucleosomes. No obvious stimulatory activity of full-length NPAC F217A mutant was
detected in nucleosome demethylation assays using a threshold amount of LSD2, which
showed no obvious demethylation activity by LSD2 itself. The cofactor activity of wild-
type NPAC was readily detected under the same conditions.
E. Full-length NPAC F217A protein retains residue cofactor activity to H3K4
nucleosome demethylation mediated by LSD2. Stimulatory activity of full-length F217A
mutant was observed in lane 4 and 9, where more NPAC protein and LSD2 enzymes
were used than in (D) as indicated. Importantly, the demethylation of nucleosomal
H3K4me2 was much more efficient in the presence of wild-type NPAC under same
conditions (comparing lane 3 verse 4, and 8 verse 9). It is noted that no obvious
cofactor effect of F217A peptide or linker regions was detected in nucleosome and
peptide demethylation assays (Figure 6E and data not shown)

18
F. Coomassie staining of NPAC proteins used in histone demethylase assays. GST-
NPAC.d1-6 were shown in Figure 2D.

19
Table S1. Crystallographic Data and Structure Refinement Statistics of the LSD2-
NPAC-H3K4M Structure in P21 Form, Related to Table 1
Data Collection
Crystal LSD2-NPAC-H3K4M (4GUR)*
Wavelength (Å) 0.97908
Resolution (Å) 50.00-2.50(2.59-2.50)
Space group P21
Cell parameters (Å,°) a=62.2, b=89.0, c=88.8, = 103.3°
Completeness (%) 94.5(96.9)
Rmerge (%) 7.4(45.8)
I/σ (I) 15.7(2.5)
Redundancy 3.8(3.6)
No. of all reflections 116,622(11,286)
No. of unique reflections 30,690(3,135)
Refinement statistics
Resolution (Å) 50.00-2.50(2.59-2.50)
Rwork/Rfree (%) 18.79/20.45
Deviation from identity
Bonds, (Å) 0.012
Angles, (º) 1.372
Average B factor, (Å2) 51.685
Ramachandran plot statistics
Most favored regions (%) 88.1
Allowed regions (%) 11.6
Generously allowed regions (%) 0
Disallowed regions (%) 0.3
*, We have determined two LSD2-NPAC-H3K4M structures in two crystal forms, one
belongs to the P21 (2.5 Å resolution) and the other belongs to the P3221 (2.25 Å

20
resolution, Table 1) space group. The two structures are nearly identical with a largest
root mean square deviation (RMSD) of 0.321 Å for 687 Cα atoms. The major difference
is that LSD2 residues 171-182 in the co-crystal structure from the P21 form were not
built into the final model due to lacking electron density; while in the structure from the
P3221 form, the corresponding loop region was stabilized by crystal packing and thus
was built into the final model. Another difference is that residues 213-224 and residues
214-225 of NPAC were built according to the electron density in the crystal forms of P21
and P3221, respectively. Taking into consideration resolution and quality of final models,
the structure from the P3221 form was used for all structural descriptions and
comparisons.

21
Table S2. Summary of the Root-Mean-Square Deviation of Structural
Comparisons, Related to Figures 3 and 4
Structures compared RMSD (Å)
(atom number)
RMSD (Å)
(Cα number)
LSD2 alone vs LSD2-NPAC 1.089 (5317) 0.915 (679)
LSD2-NPAC vs LSD2-NPAC-H3 0.634 (5350) 0.531 (678)
LSD2-NPAC-H3K4 (P21 vs P3221) 0.306 (5626) 0.321 (687)
The AO domains of LSD1 and LSD2 2.199 (2501) 2.055 (385)
The SWIRM domains of LSD1 and
LSD2 1.089 (398) 0.833 (58)
Zf-CW domains of LSD2 and
ZCWPW1 1.954 (272) 2.098 (41)
RMSD, root-mean-square deviation.

22
Table S3. ITC-Derived Thermodynamic Parameters and Affinities of the Binding of
Wild-Type and Mutant NPAC Peptides with LSD2, Related to Figure 6
ID 1 2 3
Protein in
the syringe a
NPAC.214-
225.WT
NPAC.214-
225.
M6 (F217A)
NPAC.214-225.M8
(D214A/H216A/F217A
)
Temperature
(°C) 15 15 15
Binding ratio 1.06±0.01 1.10±0.01 1.09±0.01
Kd (μM) 0.92±0.08 0.93±0.07 0.99±0.08
Δ H (cal/mol) -8482±121 -8182±97 -8288±101
Δ S
(cal/mol/deg) -1.82 -0.783 -1.3
ITC enthalpy plots are shown in Figure 6G.
a 3mM wild-type or mutant NPAC peptides (residues 214-225) were injected into the
calorimetric cell containing 0.2mM LSD2 for ITC binding studies. Standard deviation
was shown.

23
Table S4. ITC-Derived Thermodynamic Parameters and Affinities of the Binding of
H3K4M Peptide with LSD2, or LSD2 in Complex with Wild-Type or Mutant NPAC
Peptides, Related to Figure 6
ID 1 2 3 4
Protein in cell b NPAC214-
225.WT LSD2
LSD2 and
NPAC.214-
225.WTa
LSD2 and
NPAC.214-
225.F217A
Concentration
(mM) 0.029 0.029 0.029/0.029 c 0.029/0.029 c
Temperature
(°C) 15 15 15 15
Binding ratio N.D.d 1.07±0.01 0.94±0.01 0.86±0.01
Kd (μM) N.D. d 0.99±0.06 0.68±0.07 0.89±0.06
Δ H
(cal/mol) N.D. d -5619±45 -1.147E4±134 -3938±37
Δ S
(cal/mol/deg) N.D. d 7.98 -11.6 14
a ITC enthalpy plots were shown in Figure 6H

24
b 0.4 mM H3K4M peptide in syringe was injected into the calorimetric cell containing
indicated proteins and peptides for ITC binding studies. Standard deviation was shown.
c LSD2 protein and NPAC peptides were pre-mixed at 1:1 molar ratio at 0.029 mM.
d N.D., not detected. No binding was detected between wild-type NPAC peptide
(NPAC.214-225.WT) and H3K4M peptide.

25
Supplemental Experimental Procedures
Protein Purification
cDNA of full-lengh human NPAC/GLYR1 (NM_032569) were amplified from HeLa by RT-
PCR. All constructs were generated using PCR-based cloning strategy and all mutants were
generated using Quick-Change Site-Directed Mutagenesis Kit (Stratagene) and verified by DNA
sequencing. For crystallography, the linker region of human NPAC (residues 152-268) were
subcloned into a pGEX-6P-1 derivative encoding a His6 tag upstream of a GST tag, then
transformed in Escherichia coli strain BL21(DE3) and were induced for over-expression at 15
°C. His6-tagged proteins were purified by Nickel Nitrilotriacetic Acid affinity chromatography
followed by 3C protease cleavage. Additional NPAC mutants and full-length protein were
subcloned into pGEX-4T-1, expressed and purified from BL21(DE3) using glutathione agarose
beads (Sigma-Aldrich). His6 tagged full-length NPAC were expressed from pET-14b and
purified from E. coli.
Human LSD2 (residues 51-822) was subcloned into a pFastBac1 derivative encoding a His6 tag
and a 3C protease cleavage site. Recombinant LSD2 was expressed in Sf9 insect cells using the
Bac-to-Bac baculoviral system (Invitrogen). LSD2 used for crystallization of the enzyme alone
contains N-terminal extra residues (PLGSEFKGLRRR), while LSD2 used for other
crystallization contain extra residues (GPGS) result from 3C cleavage. The proteins were
purified to homogeneity using anion exchange and gel filtration chromatography. The purified
LSD2 were concentrated and used for crystallization and isothermal titration calorimetry (ITC).
The LSD2-NPAC complex for crystallization was prepared by directly mixing equal molar

26
LSD2 and NPAC. Full-length human LSD2 were expressed and purified as previously described
(Fang et al., 2010)
Isothermal Titration Calorimetry (ITC) binding study
ITC binding study was performed using ITC-200 microcalorimeter (MicroCal, GE health care),
where 0.4mM H3K4M peptide (residues 1-21) was titrated into the calorimetric cell containing
0.029mM LSD2 (residues 51-822) or LSD2-NPAC complex at 15 °C. To study the interaction
between LSD2 and NPAC peptides, 3mM wild-type or mutant NPAC peptides (residues 214-
225) was injected into the cell containing 0.2mM LSD2 (residues 51-822). All proteins and
peptides were prepared in 10mM HEPES, pH 8.0, and 0.1M NaCl. The data were fitted by
software Origin 7.0.
.
Examine NPAC-LSD2 interaction by GST-pulldown
5-10µg GST or GST-NPAC fusion proteins were bound to glutathione agarose, and were
incubated with 2µg full-length His-LSD2 overnight in 50mM NaPO4 pH 7.4, 150mM NaCl,
0.5% NP-40, 5% glycerol, 10µM ZnSO4, 1mM MgCl2, 1mM DTT, 0.1mM PMSF at 4ºC. After
washed 4 times with same buffer at 4ºC, glutathione agarose beads were boiled in 1 SDS sample
loading buffer. Elute was resolved on a 15% SDS-PAGE gel and stained by coomassie blue.


![[Republic of Macedonia] Report M-r Zoran Popovskiweb.oie.int/RR-Europe/eng/Regprog/docs/docs/LSD2/LSD2 (Lisbon... · [Republic of Macedonia] Report M-r Zoran Popovski. Standing Group](https://img.pdfslide.net/doc/110x75/5a71673d7f8b9ab1538ccbe3/republic-of-macedonia-report-m-r-zoran-popovskiweboieintrr-europeengregprogdocsdocslsd2lsd2.jpg)