Embed Size (px)
Citation preview

Atmos. Chem. Phys., 10, 2663–2689, 2010www.atmos-chem-phys.net/10/2663/2010/© Author(s) 2010. This work is distributed underthe Creative Commons Attribution 3.0 License.
AtmosphericChemistry
and Physics
Molecular characterization of urban organic aerosol in tropicalIndia: contributions of primary emissions and secondaryphotooxidation
P. Q. Fu1, K. Kawamura1, C. M. Pavuluri 1, T. Swaminathan2, and J. Chen3,4,1
1Institute of Low Temperature Science, Hokkaido University, Sapporo, 060-0819, Japan2Department of Chemical Engineering, Indian Institute of Technology Madras, Chennai, 600036, India3State Key Laboratory of Environmental Geochemistry, Institute of Geochemistry, Chinese Academy of Sciences,Guiyang, 550002, China4Graduate School of the Chinese Academy of Sciences, Beijing, 100039, China
Received: 12 August 2009 – Published in Atmos. Chem. Phys. Discuss.: 15 October 2009Revised: 19 February 2010 – Accepted: 11 March 2010 – Published: 19 March 2010
Abstract. Organic molecular composition of PM10 sam-ples, collected at Chennai in tropical India, was studied us-ing capillary gas chromatography/mass spectrometry. Four-teen organic compound classes were detected in the aerosols,including aliphatic lipids, sugar compounds, lignin prod-ucts, terpenoid biomarkers, sterols, aromatic acids, hydroxy-/polyacids, phthalate esters, hopanes, Polycyclic AromaticHydrocarbons (PAHs), and photooxidation products frombiogenic Volatile Organic Compounds (VOCs). At daytime,phthalate esters were found to be the most abundant com-pound class; however, at nighttime, fatty acids were thedominant one. Di-(2-ethylhexyl) phthalate, C16 fatty acid,and levoglucosan were identified as the most abundant sin-gle compounds. The nighttime maxima of most organicsin the aerosols indicate a land/sea breeze effect in tropicalIndia, although some other factors such as local emissionsand long-range transport may also influence the composi-tion of organic aerosols. However, biogenic VOC oxidationproducts (e.g., 2-methyltetrols, pinic acid, 3-hydroxyglutaricacid andβ-caryophyllinic acid) showed diurnal patterns withdaytime maxima. Interestingly, terephthalic acid was max-imized at nighttime, which is different from those of ph-thalic and isophthalic acids. A positive relation was foundbetween 1,3,5-triphenylbenzene (a tracer for plastic burn-ing) and terephthalic acid, suggesting that the field burning
Correspondence to: K. Kawamura([email protected])
of municipal solid wastes including plastics is a significantsource of terephthalic acid. Organic compounds were furthercategorized into several groups to clarify their sources. Fossilfuel combustion (24–43%) was recognized as the most sig-nificant source for the total identified compounds, followedby plastic emission (16–33%), secondary oxidation (8.6–23%), and microbial/marine sources (7.2–17%). In con-trast, the contributions of terrestrial plant waxes (5.9–11%)and biomass burning (4.2–6.4%) were relatively small. Thisstudy demonstrates that, in addition to fossil fuel combustionand biomass burning, the open-burning of plastics in urbanarea also contributes to the organic aerosols in South Asia.
1 Introduction
Primary organic aerosol (POA, particle mass directly emittedfrom sources such as plant material, soil dust, biomass andfossil fuel burning) and secondary organic aerosol (SOA, par-ticle mass formed by the oxidation of gas-phase precursorsin the atmosphere) are ubiquitous in the atmosphere (e.g.,Robinson et al., 2007; de Gouw and Jimenez, 2009; Hallquistet al., 2009). These organics account for up to 70% of thefine aerosol mass, and potentially control the physicochem-ical properties of atmospheric particles (Kanakidou et al.,2005). Organic aerosols are highlighted for the past decadebecause they are important environmental issues related toglobal and regional climate, chemistry of the atmosphere,
Published by Copernicus Publications on behalf of the European Geosciences Union.

2664 P. Q. Fu et al.: Molecular characterization of urban organic aerosol in tropical India
biogeochemical cycling, and people’s health (Crutzen andAndreae, 1990; Kanakidou et al., 2005; Poschl, 2005; An-dreae and Rosenfeld, 2008).
India has experienced serious air pollution problem dueto its rapid economic growth and urbanization in the pastdecade. It is regarded as a major source region of theIndo-Asian haze, due to significant industrial emissions, coalburning, vehicular exhaust emission, and waste incineration(Lelieveld et al., 2001). Indo-Asian haze is also known asAtmospheric Brown Clouds (ABCs), which consist of a per-sistent and large-scale layer of air pollutants containing amixture of Black Carbon (BC), Organic Carbon (OC), anddust. ABCs significantly absorb and scatter solar radiation(Lelieveld et al., 2001; Ramanathan et al., 2005; Seinfeld,2008; Szidat, 2009), and thus impact on South Asian climateand hydrological cycle (Ramanathan et al., 2005). Effortsto reduce the extent of ABCs require the knowledge of theircomposition and sources (Szidat, 2009).
Biomass/biofuel (including wood, agricultural residues,and dried animal manure) burning and fossil fuel combus-tion are considered as the major sources of carbonaceousaerosols in this region (Lelieveld et al., 2001; Venkatara-man et al., 2005; Stone et al., 2007). Recently, Gustafssonet al. (2009) used radiocarbon (14C) as a tracer to quantifybiomass and fossil fuel contributions to the ABCs. Chowd-hury et al. (2007) reported the organic speciation and sourceapportionment of fine particles in four Indian cities using areceptor-based method. Furthermore, it is important to un-derstand the changes in the organic aerosol composition dueto photochemical oxidation at a molecular level (Robinson etal., 2006; Rudich et al., 2007). Tropical region may providea unique site to study the photochemical aging of organicaerosols because of the high ambient temperature and strongsunlight irradiation. However, knowledge about the organicmolecular composition of atmospheric aerosols in tropicalIndia is still limited.
In this study, we present the concentrations of 14 com-pound classes (174 organic species) in tropical Indianaerosols, including aliphatic hydrocarbons, sugar com-pounds, lignin and resin products, aromatic acids, poly-acids, plastic emission products, hopanes, PAHs, as well asSOA tracers from the photooxidation of biogenic volatileorganic compounds (BVOCs) such as isoprene,α/β-pineneandβ-caryophyllene. Based on the molecular distributions,their possible sources and seasonal/diurnal differences are re-ported. Contributions of each compound class to OC andWater-Soluble Organic Carbon (WSOC) in the samples arealso discussed. As far as we are aware, this is one of themost comprehensive studies of ambient organic aerosols ata molecular level. Our work adds to the increasing databaseon the chemical characterizations of organic aerosols in theatmosphere.
2 Experimental
2.1 Aerosol sampling
Day- and night-time PM10 samples were collected on thecampus of the Indian Institute of Technology Madras (IITM),Chennai (13.04◦ N; 80.17◦ E), tropical India during winter(23 January–6 February,n=29) and summer (23–31 May,n=20) 2007. IITM campus is located in a natural forest area,and is ca. 3 km away from the coast. An air sampler wasset up on the rooftop of the Mechanical Sciences building(18 m a.g.l. – above ground level). Sampling was conductedduring daytime (06:00–18:00 LT – local time) and nighttime(18:00–06:00 LT) using a high volume air sampler (Envi-rotech APM 460 DX, India) and pre-combusted (450◦C,4 h) quartz fiber filters (Pallflex 2500QAT-UP, 20×25 cm).The sample was placed in a pre-combusted glass jar with aTeflon-lined screw cap and stored in a dark freezer room at−20◦C prior to analysis. It should be noted that the samplingartefacts might occur due to the evaporation/adsorption pro-cesses of semi-volatile organics on the filter or particle sur-face during sampling. However, we consider that the evap-orative loss of semi-volatile organics should be minimal dueto the following reasons.
If the evaporative loss were significant, we could detecta serious molecular fractionation among different molecu-lar weight ranges. First, Low Molecular Weight (LMW)n-alkanes are more volatile than high molecular weightn-alkanes. If the evaporative loss ofn-alkanes were signifi-cant due to the temperature effect, then the ratios of LMWn-alkanes to HMWn-alkanes should be higher in winter thanin summer. However, lower ratios of LMWn-alkanes (C18–C24) to HMW n-alkanes (C25–C40) were detected in win-ter (0.22±0.27) than summer (0.26±0.23). This does notsupport a serious evaporative loss of semi-volatilen-alkanes.Second, phthalate esters that are well known as semi-volatileorganic pollutants in the atmosphere showed higher concen-trations in summer (295–857 ng m−3, average 553 ng m−3)than in winter (175–598 ng m−3, average 303 ng m−3). Thisagain denies a potential importance of the artefacts. Third,three- and four-ring PAHs (LMW-PAHs) are more volatilethan those of seven- and eight-ring PAHs (HMW-PAHs). Theratios of LMW-PAHs/HMW-PAHs in the present study were0.16±0.07 in winter versus 0.18±0.05 in summer. This simi-larity does not support a significant fractionation during sam-pling, suggesting that evaporative losses are negligible fordifferent rings of PAHs. Therefore, we feel that our samplingtechnique does not have serious sampling artefacts.
However, some semi-volatile compounds may be lost fromthe aerosol particles on the filter. Thus we think that the re-ported concentrations may still be underestimated. It is im-portant to note that there are a large number of documentedstudies that focused on the similar semi-volatile organics us-ing high-volume air samplers to collect atmospheric aerosolsat different geographical locations in the world including
Atmos. Chem. Phys., 10, 2663–2689, 2010 www.atmos-chem-phys.net/10/2663/2010/
P. Q. Fu et al.: Molecular characterization of urban organic aerosol in tropical India 2665
tropics,... (e.g., Simoneit et al., 1990; Kawamura and Sak-aguchi, 1999; Simoneit and Elias, 2000; Alves et al., 2001;Graham et al., 2002; Wang et al., 2006a).
2.2 Extraction, derivatization, and GC/MSdetermination
Detailed analytical method has been described elsewhere(Fu et al., 2008, 2009b). Briefly, filter aliquots wereextracted with dichloromethane/methanol (2:1, v/v), fol-lowed by concentration, and derivatization with 50 µlof N,O-bis-(trimethylsilyl)trifluoroacetamide (BSTFA) with1% trimethylsilyl chloride and 10 µl of pyridine at 70◦C for3 h. After reaction, the derivatives were diluted by the addi-tion of 140 µl ofn-hexane with 1.43 ng µl−1 of the internalstandard (C13 n-alkane) prior to GC/MS injection. GC/MSanalyses of the samples were performed on a Hewlett-Packard model 6890 GC coupled to a Hewlett-Packardmodel 5973 Mass-Selective Detector (MSD). The GC wasequipped with a split/splitless injector and a DB-5MS fusedsilica capillary column (30 m×0.25 mm i.d., 0.25 µm filmthickness). The mass spectrometer was operated on Elec-tron Ionization (EI) mode at 70 eV and scanned from 50 to650 Da. Data were acquired and processed with the Chem-station software. GC/MS response factors were determinedusing authentic standards. Recoveries of the quantified or-ganic compounds were in general better than 80%. Fieldblank filters were treated as real samples for quality assur-ance. The results showed contamination levels are less than5% of real samples for any species detected. The data re-ported here were corrected for the field blanks but not forrecoveries.
OC was determined using a Sunset Lab EC/OC Analyzerfollowing the Interagency Monitoring of Protected VisualEnvironments (IMPROVE) thermal evolution protocol. Analiquot of each filter was also analyzed for WSOC. The fil-ter aliquot was first extracted with 10 ml of organic-free purewater by ultrasonication for 10 min. The water extracts werethen filtered using a pre-rinsed syringe filter (Millex-GV with0.22 µm pore size, Millipore). WSOC in the water extractswas measured using a Shimadzu TOC-5000A (Pavuluri etal., 2010).
3 Results and discussion
3.1 Meteorology and air mass back trajectories
Detailed weather information has been mentioned elsewhere(Pavuluri et al., 2010). Briefly, the weather in Chennai isgenerally hot and humid. Ambient temperatures during thecampaigns varied from 14.2–34.9◦C (average 23◦C) in win-ter and 28.3–41◦C (32◦C) in summer. No rain was recordedduring sampling. A clear diurnal oscillation in wind speedand wind direction was found in Chennai due to a strong
land-sea thermal gradient. The onset of sea breeze at day-time that introduce cool marine air passing over a warm landsurface results in a Thermal Internal Boundary Layer (TIBL)below the Planetary Boundary Layer (PBL). In contrast, theonset of land breeze at nighttime may remove the TIBL. ThePBL moves down at night.
Ten-day air mass trajectory analysis (HYSPLIT, NOAA)showed that most of the air masses were transported longdistances from North India and the Middle East in early win-ter (23–28 January) and from Southeast Asia over the Bayof Bengal in late winter (29 January–6 February). In con-trast, the Arabian Sea, Indian Ocean and South Indian conti-nent are suggested as major source regions in summer (22–31 May) (Pavuluri et al., 2010). Back trajectory analysis alsoshowed that the air masses originated from mixed regions(North India and Southeast Asia) between 30 January and2 February. Following the air mass trajectory analysis, wepresent the seasonal differences of some compound classesand their discussions as three categories of air mass transportpatterns.
3.2 Speciation of particulate organic compounds
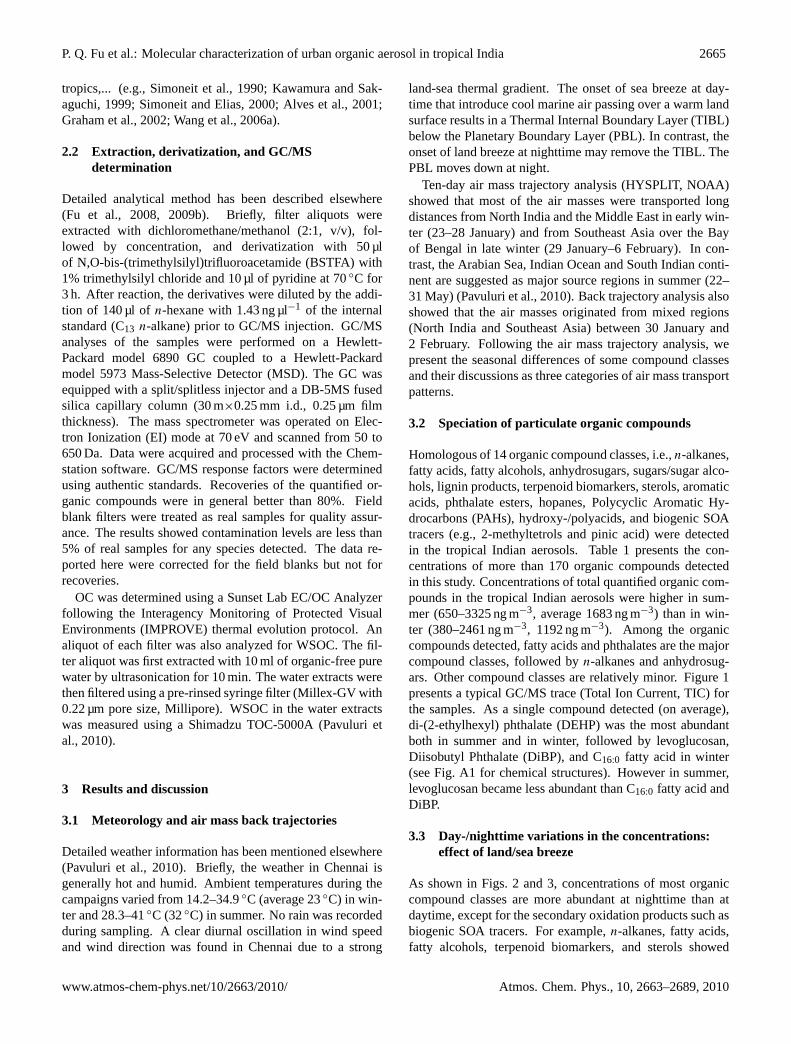
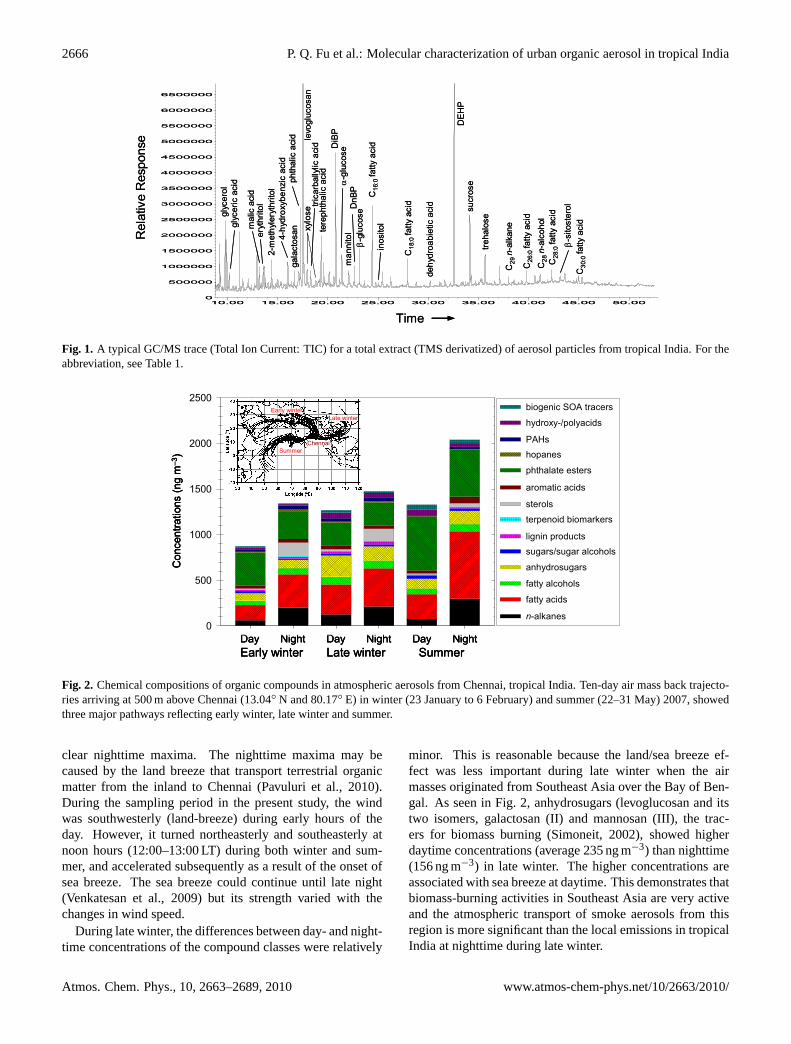
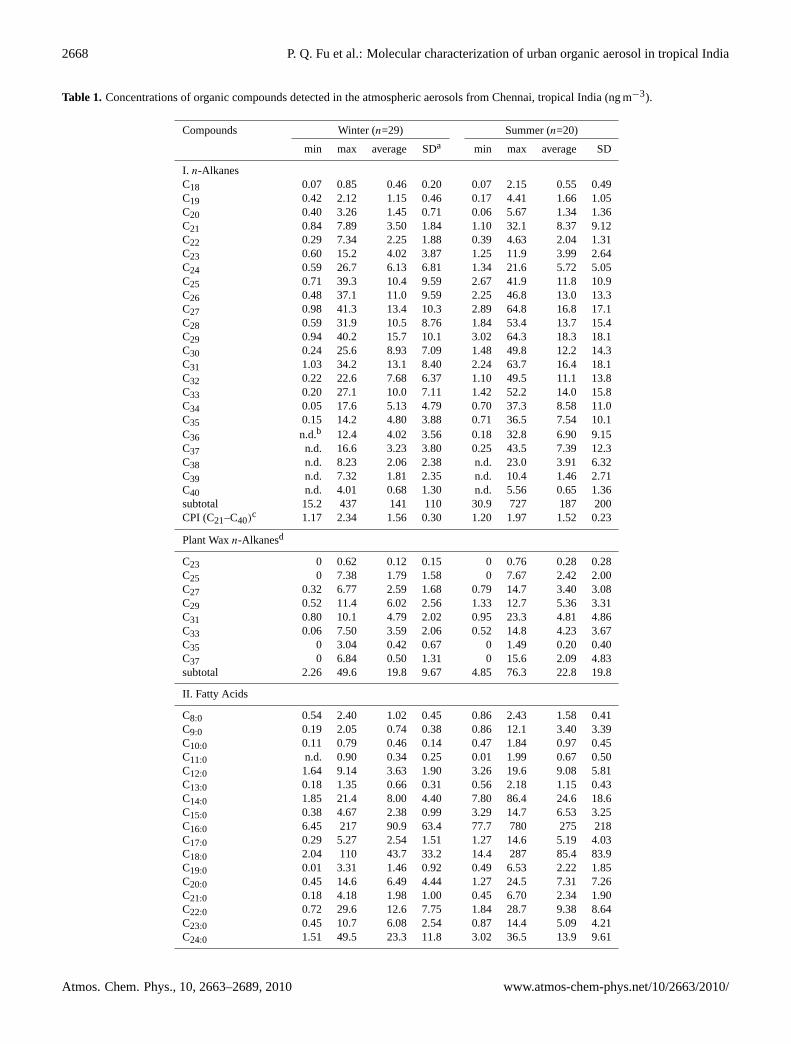
Homologous of 14 organic compound classes, i.e.,n-alkanes,fatty acids, fatty alcohols, anhydrosugars, sugars/sugar alco-hols, lignin products, terpenoid biomarkers, sterols, aromaticacids, phthalate esters, hopanes, Polycyclic Aromatic Hy-drocarbons (PAHs), hydroxy-/polyacids, and biogenic SOAtracers (e.g., 2-methyltetrols and pinic acid) were detectedin the tropical Indian aerosols. Table 1 presents the con-centrations of more than 170 organic compounds detectedin this study. Concentrations of total quantified organic com-pounds in the tropical Indian aerosols were higher in sum-mer (650–3325 ng m−3, average 1683 ng m−3) than in win-ter (380–2461 ng m−3, 1192 ng m−3). Among the organiccompounds detected, fatty acids and phthalates are the majorcompound classes, followed byn-alkanes and anhydrosug-ars. Other compound classes are relatively minor. Figure 1presents a typical GC/MS trace (Total Ion Current, TIC) forthe samples. As a single compound detected (on average),di-(2-ethylhexyl) phthalate (DEHP) was the most abundantboth in summer and in winter, followed by levoglucosan,Diisobutyl Phthalate (DiBP), and C16:0 fatty acid in winter(see Fig. A1 for chemical structures). However in summer,levoglucosan became less abundant than C16:0 fatty acid andDiBP.
3.3 Day-/nighttime variations in the concentrations:effect of land/sea breeze
As shown in Figs. 2 and 3, concentrations of most organiccompound classes are more abundant at nighttime than atdaytime, except for the secondary oxidation products such asbiogenic SOA tracers. For example,n-alkanes, fatty acids,fatty alcohols, terpenoid biomarkers, and sterols showed
www.atmos-chem-phys.net/10/2663/2010/ Atmos. Chem. Phys., 10, 2663–2689, 2010
2666 P. Q. Fu et al.: Molecular characterization of urban organic aerosol in tropical India
10.00 15.00 20.00 25.00 30.00 35.00 40.00 45.00 50.000
500000
1000000
1500000
2000000
2500000
3000000
3500000
4000000
4500000
5000000
5500000
6000000
6500000
levo
gluc
osan
Time
Rel
ativ
e R
espo
nse
treha
lose
DEH
P
C29
n-a
lkan
e
glyc
erol
C18
:0 fa
tty a
cid
C16
:0 fa
tty a
cid
α-g
luco
sem
anni
tol
C28
n-a
lcoh
olC
28:0
fatty
aci
d
dehy
droa
biet
ic a
cid
β-si
tost
erol
tere
phth
alic
acid
4-hy
drox
yben
zic
acid
glyc
eric
acid
2-m
ethy
lery
thrit
ol
trica
rbal
lylic
acid
sucr
ose
inos
itol
β-gl
ucos
eDnB
P
C26
:0 fa
tty a
cid
C30
:0 fa
tty a
cidmal
ic a
cid
eryt
hrito
l
phth
alic
acid
gala
ctos
an
DiB
P
xylo
se10.00 15.00 20.00 25.00 30.00 35.00 40.00 45.00 50.00
0
500000
1000000
1500000
2000000
2500000
3000000
3500000
4000000
4500000
5000000
5500000
6000000
6500000
levo
gluc
osan
Time
Rel
ativ
e R
espo
nse
treha
lose
DEH
P
C29
n-a
lkan
e
glyc
erol
C18
:0 fa
tty a
cid
C16
:0 fa
tty a
cid
α-g
luco
sem
anni
tol
C28
n-a
lcoh
olC
28:0
fatty
aci
d
dehy
droa
biet
ic a
cid
β-si
tost
erol
tere
phth
alic
acid
4-hy
drox
yben
zic
acid
glyc
eric
acid
2-m
ethy
lery
thrit
ol
trica
rbal
lylic
acid
sucr
ose
inos
itol
β-gl
ucos
eDnB
P
C26
:0 fa
tty a
cid
C30
:0 fa
tty a
cidmal
ic a
cid
eryt
hrito
l
phth
alic
acid
gala
ctos
an
DiB
P
xylo
se
1061 1062
1063
1064
1065
Fig. 1. A typical GC/MS trace (total ion current: TIC) for a total extract (TMS derivatized) of
aerosol particles from tropical India. For the abbreviation, see Table 1.
41
Fig. 1. A typical GC/MS trace (Total Ion Current: TIC) for a total extract (TMS derivatized) of aerosol particles from tropical India. For theabbreviation, see Table 1.
0
500
1000
1500
2000
2500
n-alkanes
fatty acids
fatty alcohols
anhydrosugars
sugars/sugar alcoholslignin products
terpenoid biomarkers
sterols
aromatic acids
phthalate esters
hopanesPAHs
hydroxy-/polyacids
biogenic SOA tracers
Con
cent
ratio
ns (n
gm
−3)
Day Night Day Night Day NightEarly winter Late winter Summer
Early winterLate winter
SummerChennai
0
500
1000
1500
2000
2500
n-alkanes
fatty acids
fatty alcohols
anhydrosugars
sugars/sugar alcoholslignin products
terpenoid biomarkers
sterols
aromatic acids
phthalate esters
hopanesPAHs
hydroxy-/polyacids
biogenic SOA tracers
Con
cent
ratio
ns (n
gm
−3)
Day Night Day Night Day NightEarly winter Late winter Summer
Early winterLate winter
SummerChennai
1066
1067
1068
1069
1070
1071
1072
Fig. 2. Chemical compositions of organic compounds in atmospheric aerosols from Chennai,
tropical India. Ten-day air mass back trajectories arriving at 500 m above Chennai (13.04°N
and 80.17°E) in winter (January 23 to February 6) and summer (May 22-31) 2007, showed
three major pathways reflecting early winter, late winter and summer.
42
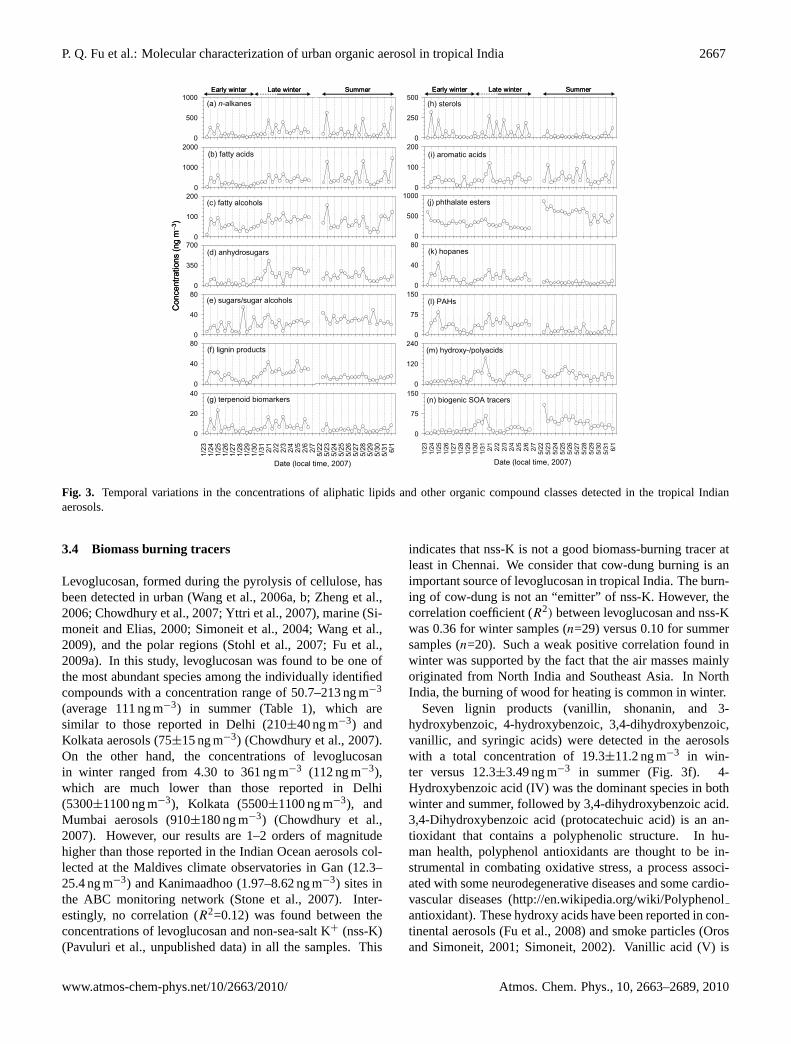
Fig. 2. Chemical compositions of organic compounds in atmospheric aerosols from Chennai, tropical India. Ten-day air mass back trajecto-ries arriving at 500 m above Chennai (13.04◦ N and 80.17◦ E) in winter (23 January to 6 February) and summer (22–31 May) 2007, showedthree major pathways reflecting early winter, late winter and summer.
clear nighttime maxima. The nighttime maxima may becaused by the land breeze that transport terrestrial organicmatter from the inland to Chennai (Pavuluri et al., 2010).During the sampling period in the present study, the windwas southwesterly (land-breeze) during early hours of theday. However, it turned northeasterly and southeasterly atnoon hours (12:00–13:00 LT) during both winter and sum-mer, and accelerated subsequently as a result of the onset ofsea breeze. The sea breeze could continue until late night(Venkatesan et al., 2009) but its strength varied with thechanges in wind speed.
During late winter, the differences between day- and night-time concentrations of the compound classes were relatively
minor. This is reasonable because the land/sea breeze ef-fect was less important during late winter when the airmasses originated from Southeast Asia over the Bay of Ben-gal. As seen in Fig. 2, anhydrosugars (levoglucosan and itstwo isomers, galactosan (II) and mannosan (III), the trac-ers for biomass burning (Simoneit, 2002), showed higherdaytime concentrations (average 235 ng m−3) than nighttime(156 ng m−3) in late winter. The higher concentrations areassociated with sea breeze at daytime. This demonstrates thatbiomass-burning activities in Southeast Asia are very activeand the atmospheric transport of smoke aerosols from thisregion is more significant than the local emissions in tropicalIndia at nighttime during late winter.
Atmos. Chem. Phys., 10, 2663–2689, 2010 www.atmos-chem-phys.net/10/2663/2010/
P. Q. Fu et al.: Molecular characterization of urban organic aerosol in tropical India 2667
Month/Date (local time, 2007)
1/23
1/
24
1/25
1/
26
1/27
1/
28
1/29
1/
30
1/31
2/
1
2/2
2/
3
2/4
2/
5
2/6
2/
7
0
250
500
5/22
5/
23
5/24
5/
25
5/26
5/
27
5/28
5/
29
5/30
5/
31
6/1
(h) sterols
Month/Date (local time, 2007)
1/23
1/
24
1/25
1/
26
1/27
1/
28
1/29
1/
30
1/31
2/
1
2/2
2/
3
2/4
2/
5
2/6
2/
7
0
100
200
5/22
5/
23
5/24
5/
25
5/26
5/
27
5/28
5/
29
5/30
5/
31
6/1
(i) aromatic acids
Month/Date (local time, 2007)
1/23
1/
24
1/25
1/
26
1/27
1/
28
1/29
1/
30
1/31
2/
1
2/2
2/
3
2/4
2/
5
2/6
2/
7
0
500
1000
5/22
5/
23
5/24
5/
25
5/26
5/
27
5/28
5/
29
5/30
5/
31
6/1
(j) phthalate esters
Month/Date (local time, 2007)
1/23
1/
24
1/25
1/
26
1/27
1/
28
1/29
1/
30
1/31
2/
1
2/2
2/
3
2/4
2/
5
2/6
2/
7
0
40
80
5/22
5/
23
5/24
5/
25
5/26
5/
27
5/28
5/
29
5/30
5/
31
6/1
(k) hopanes
Month/Date (local time, 2007)
1/23
1/
24
1/25
1/
26
1/27
1/
28
1/29
1/
30
1/31
2/
1
2/2
2/
3
2/4
2/
5
2/6
2/
7
0
500
1000
5/22
5/
23
5/24
5/
25
5/26
5/
27
5/28
5/
29
5/30
5/
31
6/1
(a) n-alkanes
Month/Date (local time, 2007)1/
23
1/24
1/
25
1/26
1/
27
1/28
1/
29
1/30
1/
31
2/1
2/
2
2/3
2/
4
2/5
2/
6
2/7
0
1000
2000
5/22
5/
23
5/24
5/
25
5/26
5/
27
5/28
5/
29
5/30
5/
31
6/1
(b) fatty acids
Month/Date (local time, 2007)
1/23
1/
24
1/25
1/
26
1/27
1/
28
1/29
1/
30
1/31
2/
1
2/2
2/
3
2/4
2/
5
2/6
2/
7
0
100
200
5/22
5/
23
5/24
5/
25
5/26
5/
27
5/28
5/
29
5/30
5/
31
6/1
(c) fatty alcohols
Month/Date (local time, 2007)
1/23
1/
24
1/25
1/
26
1/27
1/
28
1/29
1/
30
1/31
2/
1
2/2
2/
3
2/4
2/
5
2/6
2/
7
0
350
700
5/22
5/
23
5/24
5/
25
5/26
5/
27
5/28
5/
29
5/30
5/
31
6/1
(d) anhydrosugars
Early winter Late winter Summer Early winter Late winter Summer
Con
cent
ratio
ns (n
gm
−3)
Month/Date (local time, 2007)
1/23
1/
24
1/25
1/
26
1/27
1/
28
1/29
1/
30
1/31
2/
1
2/2
2/
3
2/4
2/
5
2/6
2/
7
0
40
80
5/22
5/
23
5/24
5/
25
5/26
5/
27
5/28
5/
29
5/30
5/
31
6/1
(e) sugars/sugar alcohols
Date (Local time, 2007)
1/23
1/
24
1/25
1/
26
1/27
1/
28
1/29
1/
30
1/31
2/
1
2/2
2/
3
2/4
2/
5
2/6
2/
7
0
40
80
5/22
5/
23
5/24
5/
25
5/26
5/
27
5/28
5/
29
5/30
5/
31
6/1
(f) lignin products
Date (Local time, 2007)
1/23
1/
24
1/25
1/
26
1/27
1/
28
1/29
1/
30
1/31
2/
1
2/2
2/
3
2/4
2/
5
2/6
2/
7
0
75
150
5/22
5/
23
5/24
5/
25
5/26
5/
27
5/28
5/
29
5/30
5/
31
6/1
(l) PAHs
Date (Local time, 2007)1/
23
1/24
1/
25
1/26
1/
27
1/28
1/
29
1/30
1/
31
2/1
2/
2
2/3
2/
4
2/5
2/
6
2/7
0
120
240
5/22
5/
23
5/24
5/
25
5/26
5/
27
5/28
5/
29
5/30
5/
31
6/1
(m) hydroxy-/polyacids
Date (local time, 2007)
1/23
1/
24
1/25
1/
26
1/27
1/
28
1/29
1/
30
1/31
2/
1
2/2
2/
3
2/4
2/
5
2/6
2/
7
0
75
150
5/22
5/
23
5/24
5/
25
5/26
5/
27
5/28
5/
29
5/30
5/
31
6/1
(n) biogenic SOA tracers
Date (local time, 2007)
1/23
1/
24
1/25
1/
26
1/27
1/
28
1/29
1/
30
1/31
2/
1
2/2
2/
3
2/4
2/
5
2/6
2/
7
0
20
40
5/22
5/
23
5/24
5/
25
5/26
5/
27
5/28
5/
29
5/30
5/
31
6/1
(g) terpenoid biomarkers
Month/Date (local time, 2007)
1/23
1/
24
1/25
1/
26
1/27
1/
28
1/29
1/
30
1/31
2/
1
2/2
2/
3
2/4
2/
5
2/6
2/
7
0
250
500
5/22
5/
23
5/24
5/
25
5/26
5/
27
5/28
5/
29
5/30
5/
31
6/1
(h) sterols
Month/Date (local time, 2007)
1/23
1/
24
1/25
1/
26
1/27
1/
28
1/29
1/
30
1/31
2/
1
2/2
2/
3
2/4
2/
5
2/6
2/
7
0
100
200
5/22
5/
23
5/24
5/
25
5/26
5/
27
5/28
5/
29
5/30
5/
31
6/1
(i) aromatic acids
Month/Date (local time, 2007)
1/23
1/
24
1/25
1/
26
1/27
1/
28
1/29
1/
30
1/31
2/
1
2/2
2/
3
2/4
2/
5
2/6
2/
7
0
500
1000
5/22
5/
23
5/24
5/
25
5/26
5/
27
5/28
5/
29
5/30
5/
31
6/1
(j) phthalate esters
Month/Date (local time, 2007)
1/23
1/
24
1/25
1/
26
1/27
1/
28
1/29
1/
30
1/31
2/
1
2/2
2/
3
2/4
2/
5
2/6
2/
7
0
40
80
5/22
5/
23
5/24
5/
25
5/26
5/
27
5/28
5/
29
5/30
5/
31
6/1
(k) hopanes
Month/Date (local time, 2007)
1/23
1/
24
1/25
1/
26
1/27
1/
28
1/29
1/
30
1/31
2/
1
2/2
2/
3
2/4
2/
5
2/6
2/
7
0
500
1000
5/22
5/
23
5/24
5/
25
5/26
5/
27
5/28
5/
29
5/30
5/
31
6/1
(a) n-alkanes
Month/Date (local time, 2007)1/
23
1/24
1/
25
1/26
1/
27
1/28
1/
29
1/30
1/
31
2/1
2/
2
2/3
2/
4
2/5
2/
6
2/7
0
1000
2000
5/22
5/
23
5/24
5/
25
5/26
5/
27
5/28
5/
29
5/30
5/
31
6/1
(b) fatty acids
Month/Date (local time, 2007)
1/23
1/
24
1/25
1/
26
1/27
1/
28
1/29
1/
30
1/31
2/
1
2/2
2/
3
2/4
2/
5
2/6
2/
7
0
100
200
5/22
5/
23
5/24
5/
25
5/26
5/
27
5/28
5/
29
5/30
5/
31
6/1
(c) fatty alcohols
Month/Date (local time, 2007)
1/23
1/
24
1/25
1/
26
1/27
1/
28
1/29
1/
30
1/31
2/
1
2/2
2/
3
2/4
2/
5
2/6
2/
7
0
350
700
5/22
5/
23
5/24
5/
25
5/26
5/
27
5/28
5/
29
5/30
5/
31
6/1
(d) anhydrosugars
Early winter Late winter Summer Early winter Late winter Summer
Con
cent
ratio
ns (n
gm
−3)
Month/Date (local time, 2007)
1/23
1/
24
1/25
1/
26
1/27
1/
28
1/29
1/
30
1/31
2/
1
2/2
2/
3
2/4
2/
5
2/6
2/
7
0
40
80
5/22
5/
23
5/24
5/
25
5/26
5/
27
5/28
5/
29
5/30
5/
31
6/1
(e) sugars/sugar alcohols
Date (Local time, 2007)
1/23
1/
24
1/25
1/
26
1/27
1/
28
1/29
1/
30
1/31
2/
1
2/2
2/
3
2/4
2/
5
2/6
2/
7
0
40
80
5/22
5/
23
5/24
5/
25
5/26
5/
27
5/28
5/
29
5/30
5/
31
6/1
(f) lignin products
Date (Local time, 2007)
1/23
1/
24
1/25
1/
26
1/27
1/
28
1/29
1/
30
1/31
2/
1
2/2
2/
3
2/4
2/
5
2/6
2/
7
0
75
150
5/22
5/
23
5/24
5/
25
5/26
5/
27
5/28
5/
29
5/30
5/
31
6/1
(l) PAHs
Date (Local time, 2007)1/
23
1/24
1/
25
1/26
1/
27
1/28
1/
29
1/30
1/
31
2/1
2/
2
2/3
2/
4
2/5
2/
6
2/7
0
120
240
5/22
5/
23
5/24
5/
25
5/26
5/
27
5/28
5/
29
5/30
5/
31
6/1
(m) hydroxy-/polyacids
Date (local time, 2007)
1/23
1/
24
1/25
1/
26
1/27
1/
28
1/29
1/
30
1/31
2/
1
2/2
2/
3
2/4
2/
5
2/6
2/
7
0
75
150
5/22
5/
23
5/24
5/
25
5/26
5/
27
5/28
5/
29
5/30
5/
31
6/1
(n) biogenic SOA tracers
Date (local time, 2007)
1/23
1/
24
1/25
1/
26
1/27
1/
28
1/29
1/
30
1/31
2/
1
2/2
2/
3
2/4
2/
5
2/6
2/
7
0
20
40
5/22
5/
23
5/24
5/
25
5/26
5/
27
5/28
5/
29
5/30
5/
31
6/1
(g) terpenoid biomarkers
1073
1074
1075
1076
1077
Fig. 3. Temporal variations in the concentrations of aliphatic lipids and other organic
compound classes detected in the tropical Indian aerosols.
43
Fig. 3. Temporal variations in the concentrations of aliphatic lipids and other organic compound classes detected in the tropical Indianaerosols.
3.4 Biomass burning tracers
Levoglucosan, formed during the pyrolysis of cellulose, hasbeen detected in urban (Wang et al., 2006a, b; Zheng et al.,2006; Chowdhury et al., 2007; Yttri et al., 2007), marine (Si-moneit and Elias, 2000; Simoneit et al., 2004; Wang et al.,2009), and the polar regions (Stohl et al., 2007; Fu et al.,2009a). In this study, levoglucosan was found to be one ofthe most abundant species among the individually identifiedcompounds with a concentration range of 50.7–213 ng m−3
(average 111 ng m−3) in summer (Table 1), which aresimilar to those reported in Delhi (210±40 ng m−3) andKolkata aerosols (75±15 ng m−3) (Chowdhury et al., 2007).On the other hand, the concentrations of levoglucosanin winter ranged from 4.30 to 361 ng m−3 (112 ng m−3),which are much lower than those reported in Delhi(5300±1100 ng m−3), Kolkata (5500±1100 ng m−3), andMumbai aerosols (910±180 ng m−3) (Chowdhury et al.,2007). However, our results are 1–2 orders of magnitudehigher than those reported in the Indian Ocean aerosols col-lected at the Maldives climate observatories in Gan (12.3–25.4 ng m−3) and Kanimaadhoo (1.97–8.62 ng m−3) sites inthe ABC monitoring network (Stone et al., 2007). Inter-estingly, no correlation (R2=0.12) was found between theconcentrations of levoglucosan and non-sea-salt K+ (nss-K)(Pavuluri et al., unpublished data) in all the samples. This
indicates that nss-K is not a good biomass-burning tracer atleast in Chennai. We consider that cow-dung burning is animportant source of levoglucosan in tropical India. The burn-ing of cow-dung is not an “emitter” of nss-K. However, thecorrelation coefficient (R2) between levoglucosan and nss-Kwas 0.36 for winter samples (n=29) versus 0.10 for summersamples (n=20). Such a weak positive correlation found inwinter was supported by the fact that the air masses mainlyoriginated from North India and Southeast Asia. In NorthIndia, the burning of wood for heating is common in winter.
Seven lignin products (vanillin, shonanin, and 3-hydroxybenzoic, 4-hydroxybenzoic, 3,4-dihydroxybenzoic,vanillic, and syringic acids) were detected in the aerosolswith a total concentration of 19.3±11.2 ng m−3 in win-ter versus 12.3±3.49 ng m−3 in summer (Fig. 3f). 4-Hydroxybenzoic acid (IV) was the dominant species in bothwinter and summer, followed by 3,4-dihydroxybenzoic acid.3,4-Dihydroxybenzoic acid (protocatechuic acid) is an an-tioxidant that contains a polyphenolic structure. In hu-man health, polyphenol antioxidants are thought to be in-strumental in combating oxidative stress, a process associ-ated with some neurodegenerative diseases and some cardio-vascular diseases (http://en.wikipedia.org/wiki/Polyphenolantioxidant). These hydroxy acids have been reported in con-tinental aerosols (Fu et al., 2008) and smoke particles (Orosand Simoneit, 2001; Simoneit, 2002). Vanillic acid (V) is
www.atmos-chem-phys.net/10/2663/2010/ Atmos. Chem. Phys., 10, 2663–2689, 2010
2668 P. Q. Fu et al.: Molecular characterization of urban organic aerosol in tropical India
Table 1. Concentrations of organic compounds detected in the atmospheric aerosols from Chennai, tropical India (ng m−3).
Compounds Winter (n=29) Summer (n=20)
min max average SDa min max average SD
I. n-AlkanesC18 0.07 0.85 0.46 0.20 0.07 2.15 0.55 0.49C19 0.42 2.12 1.15 0.46 0.17 4.41 1.66 1.05C20 0.40 3.26 1.45 0.71 0.06 5.67 1.34 1.36C21 0.84 7.89 3.50 1.84 1.10 32.1 8.37 9.12C22 0.29 7.34 2.25 1.88 0.39 4.63 2.04 1.31C23 0.60 15.2 4.02 3.87 1.25 11.9 3.99 2.64C24 0.59 26.7 6.13 6.81 1.34 21.6 5.72 5.05C25 0.71 39.3 10.4 9.59 2.67 41.9 11.8 10.9C26 0.48 37.1 11.0 9.59 2.25 46.8 13.0 13.3C27 0.98 41.3 13.4 10.3 2.89 64.8 16.8 17.1C28 0.59 31.9 10.5 8.76 1.84 53.4 13.7 15.4C29 0.94 40.2 15.7 10.1 3.02 64.3 18.3 18.1C30 0.24 25.6 8.93 7.09 1.48 49.8 12.2 14.3C31 1.03 34.2 13.1 8.40 2.24 63.7 16.4 18.1C32 0.22 22.6 7.68 6.37 1.10 49.5 11.1 13.8C33 0.20 27.1 10.0 7.11 1.42 52.2 14.0 15.8C34 0.05 17.6 5.13 4.79 0.70 37.3 8.58 11.0C35 0.15 14.2 4.80 3.88 0.71 36.5 7.54 10.1C36 n.d.b 12.4 4.02 3.56 0.18 32.8 6.90 9.15C37 n.d. 16.6 3.23 3.80 0.25 43.5 7.39 12.3C38 n.d. 8.23 2.06 2.38 n.d. 23.0 3.91 6.32C39 n.d. 7.32 1.81 2.35 n.d. 10.4 1.46 2.71C40 n.d. 4.01 0.68 1.30 n.d. 5.56 0.65 1.36subtotal 15.2 437 141 110 30.9 727 187 200CPI (C21–C40)
c 1.17 2.34 1.56 0.30 1.20 1.97 1.52 0.23
Plant Waxn-Alkanesd
C23 0 0.62 0.12 0.15 0 0.76 0.28 0.28C25 0 7.38 1.79 1.58 0 7.67 2.42 2.00C27 0.32 6.77 2.59 1.68 0.79 14.7 3.40 3.08C29 0.52 11.4 6.02 2.56 1.33 12.7 5.36 3.31C31 0.80 10.1 4.79 2.02 0.95 23.3 4.81 4.86C33 0.06 7.50 3.59 2.06 0.52 14.8 4.23 3.67C35 0 3.04 0.42 0.67 0 1.49 0.20 0.40C37 0 6.84 0.50 1.31 0 15.6 2.09 4.83subtotal 2.26 49.6 19.8 9.67 4.85 76.3 22.8 19.8
II. Fatty Acids
C8:0 0.54 2.40 1.02 0.45 0.86 2.43 1.58 0.41C9:0 0.19 2.05 0.74 0.38 0.86 12.1 3.40 3.39C10:0 0.11 0.79 0.46 0.14 0.47 1.84 0.97 0.45C11:0 n.d. 0.90 0.34 0.25 0.01 1.99 0.67 0.50C12:0 1.64 9.14 3.63 1.90 3.26 19.6 9.08 5.81C13:0 0.18 1.35 0.66 0.31 0.56 2.18 1.15 0.43C14:0 1.85 21.4 8.00 4.40 7.80 86.4 24.6 18.6C15:0 0.38 4.67 2.38 0.99 3.29 14.7 6.53 3.25C16:0 6.45 217 90.9 63.4 77.7 780 275 218C17:0 0.29 5.27 2.54 1.51 1.27 14.6 5.19 4.03C18:0 2.04 110 43.7 33.2 14.4 287 85.4 83.9C19:0 0.01 3.31 1.46 0.92 0.49 6.53 2.22 1.85C20:0 0.45 14.6 6.49 4.44 1.27 24.5 7.31 7.26C21:0 0.18 4.18 1.98 1.00 0.45 6.70 2.34 1.90C22:0 0.72 29.6 12.6 7.75 1.84 28.7 9.38 8.64C23:0 0.45 10.7 6.08 2.54 0.87 14.4 5.09 4.21C24:0 1.51 49.5 23.3 11.8 3.02 36.5 13.9 9.61
Atmos. Chem. Phys., 10, 2663–2689, 2010 www.atmos-chem-phys.net/10/2663/2010/

P. Q. Fu et al.: Molecular characterization of urban organic aerosol in tropical India 2669
Table 1. Continued.
Compounds Winter (n=29) Summer (n=20)
min max average SD min max average SD
C25:0 0.60 9.25 5.41 1.93 0.75 12.2 3.93 3.26C26:0 1.56 32.6 19.8 7.87 2.11 27.6 10.4 6.77C27:0 0.58 6.87 4.14 1.39 0.47 9.49 2.89 2.48C28:0 1.31 25.4 15.4 5.31 2.21 22.9 10.1 5.40C29:0 0.42 6.08 3.79 1.26 0.50 6.26 2.55 1.79C30:0 1.52 19.1 11.4 3.43 1.61 13.2 6.82 3.19C31:0 0.06 3.12 1.63 0.74 0.14 4.55 1.34 1.16C32:0 0.15 8.74 5.36 1.83 0.74 6.34 2.88 1.34C33:0 n.d. 1.13 0.47 0.36 n.d. 1.29 0.47 0.33C34:0 n.d. 2.67 1.30 0.76 0.42 2.54 1.27 0.58C16:1 n.d. 2.03 0.25 0.45 n.d. 1.85 0.12 0.42C18:1 0.13 116 22.4 35.2 n.d. 74.8 7.19 16.8C18:2 n.d. 17.0 3.29 5.30 n.d. 2.67 0.17 0.61C20:1 n.d. 3.01 0.63 1.08 n.d. n.d. n.d. n.d.C22:1 n.d. 3.34 0.45 0.93 n.d. n.d. n.d. n.d.subtotal 40.5 657 302 179 141 1448 504 400CPI (C20:0–C34:0)c 3.11 6.40 3.99 0.84 2.80 5.09 3.61 0.56
III. Fatty Alcohols
C14 n.d. 0.95 0.27 0.23 n.d. 6.96 1.51 1.67C15 n.d. 0.64 0.19 0.15 0.03 1.32 0.33 0.29C16 0.10 4.18 1.72 1.05 0.50 6.86 2.58 1.53C17 0.03 0.67 0.24 0.16 0.25 1.35 0.72 0.31C18 0.24 3.04 1.10 0.67 0.98 13.9 3.58 3.03C19 0.01 3.22 1.15 1.04 0.31 13.1 3.21 3.57C20 n.d. 3.20 1.12 0.67 0.38 4.34 1.46 1.06C21 0.01 1.79 0.58 0.43 0.02 3.40 0.87 0.81C22 0.04 3.30 1.62 0.93 0.07 4.36 1.67 1.34C23 0.24 1.92 0.95 0.48 0.02 4.55 1.15 1.24C24 0.26 4.79 2.65 1.31 0.14 10.8 2.68 2.60C25 0.05 2.22 0.93 0.68 0.08 7.97 1.55 1.98C26 0.78 10.6 6.24 2.47 0.36 10.2 3.85 2.29C27 0.07 3.44 1.26 0.86 0.03 5.90 1.49 1.62C28 3.82 32.5 18.9 7.82 4.21 30.1 13.4 6.59C29 0.24 3.20 1.37 0.79 0.23 8.88 1.43 1.92C30 1.73 30.7 17.9 7.42 4.69 49.7 20.3 11.1C31 n.d. 1.26 0.57 0.29 0.04 0.80 0.40 0.18C32 n.d. 14.8 7.81 3.17 2.53 15.2 7.21 3.37C33 n.d. 1.41 0.35 0.36 n.d. 1.04 0.28 0.30C34 n.d. 3.57 0.92 0.97 n.d. 2.13 0.67 0.51subtotal 11.0 116 67.9 26.6 21.0 155 70.4 34.2CPI (C20–C34)
c 4.68 16.8 9.75 2.94 3.34 27.7 10.9 6.77
IV. Anhydrosugars
galactosan 0.35 23.7 8.07 6.22 2.71 10.8 5.84 2.12mannosan 0.26 42.6 13.4 12.0 3.75 20.3 9.90 4.52levoglucosan 4.30 361 112 95.4 50.7 213 111 45.2subtotal 4.99 427 134 112 59.6 244 127 51.6
V. Sugars/Sugar Alcohols
glycerol 1.13 7.34 2.59 1.38 2.83 18.7 5.49 3.47erythritol 0.28 6.99 2.74 1.88 1.40 5.20 3.20 0.94xylose 0.32 9.03 3.13 2.13 1.80 6.81 3.91 1.49arabitol 0.16 2.49 1.05 0.67 0.78 4.06 1.51 0.70fructose 0.16 4.98 1.51 1.14 0.69 2.72 1.53 0.61glucose 0.49 20.6 3.86 4.00 2.61 14.8 6.82 3.24mannitol 0.06 2.38 0.54 0.52 0.82 5.56 2.20 1.11inositol 0.03 1.37 0.48 0.30 0.30 0.87 0.53 0.15sucrose 0.29 13.8 2.06 2.68 0.83 7.65 2.23 1.54
www.atmos-chem-phys.net/10/2663/2010/ Atmos. Chem. Phys., 10, 2663–2689, 2010

2670 P. Q. Fu et al.: Molecular characterization of urban organic aerosol in tropical India
Table 1. Continued.
Compounds Winter (n=29) Summer (n=20)
min max average SD min max average SD
maltose 0.01 7.27 0.81 1.40 0.44 3.14 1.08 0.58trehalose 0.06 2.66 1.22 0.81 0.34 1.63 1.00 0.33subtotal 4.39 54.2 20.0 11.8 19.9 48.8 29.5 7.83
VI. Lignin Products
3-hydroxybenzoic acid 0.14 2.24 0.86 0.43 0.46 3.33 1.11 0.854-hydroxybenzoic acid 0.49 29.5 9.93 6.58 2.46 9.60 5.29 1.933,4-dihydroxybenzoic acid 0.11 7.80 3.58 2.46 0.86 9.04 3.85 2.33vanillin 0.10 3.97 1.35 0.90 0.23 1.15 0.56 0.19vanillic acid 0.04 2.28 1.00 0.62 0.33 1.08 0.79 0.20syringic acid 0.03 4.21 2.07 1.27 0.24 1.13 0.62 0.25shonanin 0.02 1.26 0.54 0.38 n.d. 0.27 0.09 0.08subtotal 1.18 45.4 19.3 11.2 5.85 18.6 12.3 3.49
VII. Terpenoid Biomarkers
pimaric acid n.d. 0.59 0.15 0.18 0.01 0.13 0.05 0.03isopimaric acid n.d. 1.24 0.26 0.34 n.d. 0.19 0.05 0.04dehydroabietic acid 0.58 14.2 4.30 3.16 0.76 5.53 2.56 1.35abietic acid n.d. 0.64 0.13 0.18 0.01 0.05 0.02 0.017-oxodehydroabietic acid 0.15 1.16 0.38 0.28 0.09 0.59 0.19 0.10α+β-amyrin 0.07 5.96 1.93 1.50 0.34 3.60 1.22 0.86subtotal 0.98 23.3 7.16 5.37 1.32 9.64 4.09 2.24
VIII. Sterols
cholesterol 0.30 17.5 5.30 5.31 0.11 29.1 5.06 7.89stigmasterol 0.34 26.0 7.34 8.25 n.d. 12.4 2.48 3.57β−sitosterol 0.42 156 42.3 50.1 1.70 77.8 17.3 18.6subtotal 1.55 195 55.0 63.2 2.14 119 24.8 29.3
IX. Aromatic Acids
benzoic acid 0.54 2.16 1.25 0.39 0.95 2.56 1.44 0.40o-toluic acid 0.00 0.30 0.16 0.07 0.04 0.40 0.15 0.09m-toluic acid 0.07 0.38 0.22 0.08 0.13 0.35 0.22 0.07p-toluic acid 0.06 0.53 0.24 0.10 0.08 0.34 0.22 0.08phthalic acid 0.42 31.2 5.79 5.87 1.92 11.5 5.82 2.81isophthalic acid 0.11 2.47 0.75 0.51 0.18 0.78 0.50 0.17terephthalic acid 1.61 111 28.1 21.0 11.8 117 43.4 34.8subtotal 3.90 118 36.5 21.9 15.9 124 51.8 33.9
X. Hydroxy-/Polyacids
glycolic acid 4.03 50.5 16.3 10.6 5.30 29.7 14.1 6.08salicylic acid 0.11 1.07 0.38 0.22 0.15 0.42 0.27 0.07glyceric acid 0.15 7.88 2.51 2.34 1.91 9.85 5.69 2.00malic acid 1.00 36.9 9.29 8.97 7.74 44.8 24.0 10.1tartaric acid 0.02 13.4 2.52 3.42 1.98 13.0 5.66 3.33citric acid 0.06 3.68 0.74 0.84 0.14 2.35 0.92 0.62tricarballylic acid 0.35 39.1 6.33 8.28 0.78 4.91 2.45 1.06subtotal 7.83 152 38.1 32.2 18.1 103 53.1 21.0
XI. Biogenic SOA Tracers
2-methylglyceric acid 0.16 1.90 0.67 0.45 1.06 8.23 3.22 1.79C5-alkene triolse 0.08 11.5 2.18 2.93 0.71 27.1 7.63 6.332-methyltetrols 0.17 10.7 2.75 2.78 3.54 43.2 13.9 9.106 isoprene SOA tracers 0.45 22.4 5.60 5.93 5.74 78.6 24.7 16.23-hydroxyglutaric acid 0.59 30.3 6.24 6.68 2.80 18.1 9.04 3.96(3-HGA)cis-pinonic acid 0.10 1.69 0.82 0.36 1.49 14.2 4.31 3.23
Atmos. Chem. Phys., 10, 2663–2689, 2010 www.atmos-chem-phys.net/10/2663/2010/

P. Q. Fu et al.: Molecular characterization of urban organic aerosol in tropical India 2671
Table 1. Continued.
Compounds Winter (n=29) Summer (n=20)
min max average SD min max average SD
cis-norpinic acid 0.00 0.39 0.16 0.11 0.00 0.59 0.28 0.16pinic acid 0.14 3.14 1.00 0.82 0.67 3.78 2.08 0.80MBTCAf 0.00 1.27 0.25 0.30 0.19 1.32 0.76 0.356α/β-pinene SOA tracers 1.24 36.2 8.46 7.86 5.42 26.5 16.5 5.61β-caryophyllinic acid 0.41 9.52 2.76 1.92 1.01 5.44 2.69 0.98subtotal 2.69 66.9 16.8 14.7 18.3 107 43.9 20.0
XII. Plasticizers/Antioxidants
dimethyl phthalate (DMP) n.d. 0.12 0.04 0.04 0.04 0.16 0.09 0.03diethyl phthalate (DEP) 0.32 23.0 4.00 5.05 0.26 15.8 5.03 4.54diisobutyl phthalate (DiBP) 13.5 373 104 66.2 7.44 294 127 68.7di-n-butyl phthalate (DnBP) 6.80 103 24.9 17.8 10.5 211 42.4 44.7di-(2-ethylhexyl) phthalates 96.2 270 171 43.5 177 579 379 118(DEHP)subtotal of phthalates 175 598 303 89.0 295 857 553 140tris(2,4-di-tert-butyl-phenyl) n.d. 1.46 0.33 0.30 n.d. 1.54 0.42 0.48phosphateg
XIII. Hopanes
C27α n.d. 1.36 0.39 0.36 n.d. 0.32 0.08 0.08C27β n.d. 0.18 0.05 0.06 n.d. 0.11 0.01 0.03C29αβ 0.41 8.22 2.97 1.76 0.33 1.45 0.92 0.30C29βα n.d. 1.04 0.27 0.24 n.d. 0.22 0.08 0.07C30αβ 0.26 5.38 1.93 1.13 0.31 1.13 0.65 0.22C30βα n.d. 0.59 0.11 0.13 n.d. 0.28 0.05 0.06C31αβS n.d. 3.95 1.52 0.89 0.21 1.86 0.64 0.43C31αβR n.d. 4.14 1.32 0.88 0.17 1.29 0.47 0.27C31βα n.d. 0.94 0.24 0.24 n.d. 0.39 0.06 0.10C32αβS n.d. 3.20 1.25 0.77 0.17 1.06 0.50 0.26C32αβR n.d. 2.95 0.97 0.67 0.15 0.58 0.34 0.13C33αβS n.d. 2.50 0.80 0.56 0.10 0.67 0.29 0.13C33αβR n.d. 1.78 0.52 0.37 0.09 0.41 0.23 0.09C34αβS n.d. 2.28 0.67 0.50 n.d. 0.48 0.25 0.13C34αβR n.d. 2.05 0.52 0.43 n.d. 0.27 0.16 0.09C35αβS n.d. 1.95 0.51 0.42 n.d. 0.55 0.14 0.16C35αβR n.d. 1.56 0.38 0.32 n.d. 0.27 0.09 0.08subtotal 0.75 43.2 14.4 9.09 2.47 8.88 4.97 1.91
XIV. PAHs
1,2,4-triphenylbenzene n.d. 0.68 0.20 0.18 0.08 1.24 0.31 0.331,3,5-triphenylbenzene 0.08 15.4 4.24 3.54 0.78 38.7 9.22 11.3phenanthrene 0.01 0.60 0.20 0.14 0.01 0.15 0.05 0.03anthracene n.d. 0.16 0.05 0.04 n.d. 0.06 0.02 0.01fluoranthene 0.19 1.57 0.72 0.32 0.12 0.24 0.18 0.03pyrene 0.18 1.69 0.81 0.35 0.19 0.38 0.27 0.06benzo(b)fluorine 0.01 0.59 0.20 0.13 n.d. 0.15 0.06 0.05benz(a)anthracene 0.07 2.51 0.97 0.58 0.12 0.33 0.20 0.05chrysene/triphenylene 0.20 2.83 1.16 0.64 0.20 0.52 0.31 0.09benzo(b)fluoranthene 0.39 12.7 6.36 3.28 0.73 2.20 1.34 0.41benzo(k)fluoranthene 0.20 3.78 1.98 0.94 0.28 0.50 0.40 0.07benzo(e)pyrene 0.20 4.66 2.24 1.13 0.30 0.93 0.56 0.18benzo(a)pyrene 0.17 6.85 3.04 1.79 0.31 0.86 0.54 0.14perylene 0.01 1.70 0.74 0.45 0.11 0.24 0.16 0.04indeno(1,2,3-cd)pyrene 0.13 7.89 2.86 2.18 0.47 1.25 0.92 0.23dibenz(a,h)anthracene n.d. 10.8 0.90 1.93 0.09 0.29 0.17 0.05benzo(ghi)perylene 0.19 5.69 2.36 1.67 0.50 1.24 0.89 0.23anthanthrene n.d. 6.94 1.67 1.77 0.08 0.30 0.18 0.06
www.atmos-chem-phys.net/10/2663/2010/ Atmos. Chem. Phys., 10, 2663–2689, 2010

2672 P. Q. Fu et al.: Molecular characterization of urban organic aerosol in tropical India
Table 1. Continued.
Compounds Winter (n=29) Summer (n=20)
min max average SD min max average SD
coronene 0.05 19.0 4.23 4.60 0.30 0.89 0.60 0.16dibenzo(a,e)pyrene n.d. 1.78 0.74 0.41 0.05 0.30 0.18 0.08subtotal 2.23 83.4 35.7 18.7 5.50 47.3 16.5 12.3
Total Organics 380 2461 1192 472 650 3325 1683 763UCM hydrocarbonsh 56.4 1938 608 508 130 3281 823 903
Total Organics + UCM 436 4399 1800 960 780 6607 2506 1645
OC (µg m−3) 3.20 15.6 9.12 3.71 4.15 17.6 9.69 3.65WSOC (µg m−3) 1.71 6.95 3.76 1.28 2.15 6.03 4.10 0.90
a SD: standard deviation.b n.d.: not detected.c CPI, Carbon Preference Index: (C21+C23+C25+C27+C29+C31+C33+C35+C37+C39)/ (C22+C24+C26+C28+C30+C32+C34+C36+C38+C40)
for n-alkanes; (C20+C22+C24+C26+C28+C30+C32+C34)/(C21+C23+C25+C27+C29 +C31+C33) for fatty acids and fatty alcohols.d Plant waxn-alkanes are calculated as the excess odd homologues – adjacent homologues average, and the difference from the totaln-alkanes is the petroleum-derived amount. Negative values of plant waxn-alkanes were taken as zero.e C5-alkene triols: cis-2-methyl-1,3,4-trihydroxy-1-butene,trans-2-methyl-1,3,4-trihydroxy-1-butene, and 3-methyl-2,3,4-trihydroxy-1-butene.f MBTCA: 3-methyl-1,2,3-butanetricarboxylic acid.g Tris(2,4-di-tert-butyl-phenyl)phosphate (TBPP): due to a lack of the authentic standard, TBPP was quantified using 1,3,5-triphenylbenzene.h Unresolved Complex Mixture (UCM) of hydrocarbons. UCM estimated on the basis of U/R=5 (unresolved/resolved compounds) foremissions from vehicle traffic in a Los Angeles tunnel (Fraser et al., 1998).
a source specific tracer for conifers. Vanillin (VI) and sy-ringic acid (VII) are detectable in pine wood smoke (Si-moneit, 2002). Shonanin (VIII) is a predominant lignan ofsoft wood smoke (e.g., pine). These tracers showed simi-lar temporal trends each other with higher concentrations inwinter than in summer (Fig. 4d–i).
Terpenoid biomarkers are present in vegetation smoke,both as natural and thermally altered products (Medeiros andSimoneit, 2008). Dehydroabietic acid (IX) was the dominantditerpenoid in the aerosols, followed by 7-oxodehydroabieticacid (X), indicating a dominant softwood burning. Regu-lar diterpenoid acids such as abietic acid (XI) or pimaricacid (XII) were also detectable (Table 1).α/β-Amyrins (XIV,XV) have been reported in soft wood smokes (Oros andSimoneit, 2001; Simoneit, 2002; Medeiros and Simoneit,2008), Amazonian smoke aerosol (Bin Abas et al., 1995),and urban aerosols in China (Simoneit et al., 1991). Theyare triterpenoids that are important constituents of many vas-cular plants, especially in the gums and mucilages of an-giosperms. The concentration ranges ofα+β-amyrin were0.07–5.96 ng m−3 (average 1.93 ng m−3) in winter and 0.34–3.60 ng m−3 (1.22 ng m−3) in summer with a temporal pat-tern similar to those of dehydroabietic acid or shonanin(Fig. 4h–j).
In India, biofuel is a major domestic energy source forcooking and heating. Cholesterol (XVI) is a tracer forsmoke particles generated from meat cooking and also has
been proposed as a source marker of marine organisms (Si-moneit and Elias, 2000). Stigmasterol (XVII) is a tracerused to identify cow dung smoke (Sheesley et al., 2003).β-Sitosterol (XVIII), together with stigmasterol, is present interrestrial higher plants and emitted to the air via biomassburning (Simoneit, 2002; Kawamura et al., 2003). Thesesterols were more abundant at nighttime than daytime, es-pecially in winter (Fig. 4k–m). Their total concentrationswere 1.55–195 ng m−3 (55.0 ng m−3) in winter and 2.14–119 ng m−3 (24.8 ng m−3) in summer (Fig. 3h). The abun-dance of sterols, lignin products, and terpenoid biomarkers,as well as anhydrosugars, in the troposphere over tropicalIndia indicates that biomass/biofuel burning is an importantsource of organic aerosols in this region, especially duringnighttime in winter.
3.5 Emissions from plastics
Plastics are versatile polymeric materials produced and usedworldwide (Simoneit et al., 2005). Phthalic acid esters(phthalates) are used as plasticizers in resins and poly-mers. They can be released into the air from the matrixby evaporation because they are not chemically bonded tothe polymer. Attention has been paid to phthalates due totheir potential carcinogenic and endocrine disrupting prop-erties (Sidhu et al., 2005). Five phthalates were detectedin this study, i.e., dimethyl, diethyl, diisobutyl, di-n-butyl,
Atmos. Chem. Phys., 10, 2663–2689, 2010 www.atmos-chem-phys.net/10/2663/2010/

P. Q. Fu et al.: Molecular characterization of urban organic aerosol in tropical India 2673
Month/Date (local time, 2007)
1/23
1/
24
1/25
1/
26
1/27
1/
28
1/29
1/
30
1/31
2/
1
2/2
2/
3
2/4
2/
5
2/6
2/
7
0
250
500
5/22
5/
23
5/24
5/
25
5/26
5/
27
5/28
5/
29
5/30
5/
31
6/1
(a) levoglucosan
Month/Date (local time, 2007)
1/23
1/
24
1/25
1/
26
1/27
1/
28
1/29
1/
30
1/31
2/
1
2/2
2/
3
2/4
2/
5
2/6
2/
7
0
20
40
5/22
5/
23
5/24
5/
25
5/26
5/
27
5/28
5/
29
5/30
5/
31
6/1
(b) galactosan
Month/Date (local time, 2007)
1/23
1/
24
1/25
1/
26
1/27
1/
28
1/29
1/
30
1/31
2/
1
2/2
2/
3
2/4
2/
5
2/6
2/
7
0
30
60
5/22
5/
23
5/24
5/
25
5/26
5/
27
5/28
5/
29
5/30
5/
31
6/1
(c) mannosan
Month/Date (local time, 2007)
1/23
1/
24
1/25
1/
26
1/27
1/
28
1/29
1/
30
1/31
2/
1
2/2
2/
3
2/4
2/
5
2/6
2/
7
0
2
4
5/22
5/
23
5/24
5/
25
5/26
5/
27
5/28
5/
29
5/30
5/
31
6/1
(d) vanillic acid
Month/Date (local time, 2007)
1/23
1/
24
1/25
1/
26
1/27
1/
28
1/29
1/
30
1/31
2/
1
2/2
2/
3
2/4
2/
5
2/6
2/
7
0
3
6
5/22
5/
23
5/24
5/
25
5/26
5/
27
5/28
5/
29
5/30
5/
31
6/1
(e) vanillin
Month/Date (local time, 2007)
1/23
1/
24
1/25
1/
26
1/27
1/
28
1/29
1/
30
1/31
2/
1
2/2
2/
3
2/4
2/
5
2/6
2/
7
0
25
50
5/22
5/
23
5/24
5/
25
5/26
5/
27
5/28
5/
29
5/30
5/
31
6/1
(f) 4-hydroxybenzoic acid
Month/Date (local time, 2007)
1/23
1/
24
1/25
1/
26
1/27
1/
28
1/29
1/
30
1/31
2/
1
2/2
2/
3
2/4
2/
5
2/6
2/
7
0
3
6
5/22
5/
23
5/24
5/
25
5/26
5/
27
5/28
5/
29
5/30
5/
31
6/1
(g) syringic acid
Month/Date (local time, 2007)
1/23
1/
24
1/25
1/
26
1/27
1/
28
1/29
1/
30
1/31
2/
1
2/2
2/
3
2/4
2/
5
2/6
2/
7
0
15
30
5/22
5/
23
5/24
5/
25
5/26
5/
27
5/28
5/
29
5/30
5/
31
6/1
(h) dehydroabietic acid
Month/Date (local time, 2007)
1/23
1/
24
1/25
1/
26
1/27
1/
28
1/29
1/
30
1/31
2/
1
2/2
2/
3
2/4
2/
5
2/6
2/
7
0
150
300
5/22
5/
23
5/24
5/
25
5/26
5/
27
5/28
5/
29
5/30
5/
31
6/1
(k) b-sitosterol
Month/Date (local time, 2007)
1/23
1/
24
1/25
1/
26
1/27
1/
28
1/29
1/
30
1/31
2/
1
2/2
2/
3
2/4
2/
5
2/6
2/
7
0
20
40
5/22
5/
23
5/24
5/
25
5/26
5/
27
5/28
5/
29
5/30
5/
31
6/1
(l) cholesterol
Month/Date (local time, 2007)
1/23
1/
24
1/25
1/
26
1/27
1/
28
1/29
1/
30
1/31
2/
1
2/2
2/
3
2/4
2/
5
2/6
2/
7
0
25
50
5/22
5/
23
5/24
5/
25
5/26
5/
27
5/28
5/
29
5/30
5/
31
6/1
(m) stigmasterol
Month/Date (local time, 2007)
1/23
1/
24
1/25
1/
26
1/27
1/
28
1/29
1/
30
1/31
2/
1
2/2
2/
3
2/4
2/
5
2/6
2/
7
0
100
200
5/22
5/
23
5/24
5/
25
5/26
5/
27
5/28
5/
29
5/30
5/
31
6/1
(n) unsaturated fatty acids
Month/Date (local time, 2007)
1/23
1/
24
1/25
1/
26
1/27
1/
28
1/29
1/
30
1/31
2/
1
2/2
2/
3
2/4
2/
5
2/6
2/
7
0
20
40
5/22
5/
23
5/24
5/
25
5/26
5/
27
5/28
5/
29
5/30
5/
31
6/1
(o) fructose + glucose
Month/Date (local time, 2007)1/
23
1/24
1/
25
1/26
1/
27
1/28
1/
29
1/30
1/
31
2/1
2/
2
2/3
2/
4
2/5
2/
6
2/7
0
4
8
5/22
5/
23
5/24
5/
25
5/26
5/
27
5/28
5/
29
5/30
5/
31
6/1
(p) mannitol
Month/Date (local time, 2007)
1/23
1/
24
1/25
1/
26
1/27
1/
28
1/29
1/
30
1/31
2/
1
2/2
2/
3
2/4
2/
5
2/6
2/
7
0
10
20
5/22
5/
23
5/24
5/
25
5/26
5/
27
5/28
5/
29
5/30
5/
31
6/1
(q) sucrose
Month/Date (local time, 2007)
1/23
1/
24
1/25
1/
26
1/27
1/
28
1/29
1/
30
1/31
2/
1
2/2
2/
3
2/4
2/
5
2/6
2/
7
0
25
50
5/22
5/
23
5/24
5/
25
5/26
5/
27
5/28
5/
29
5/30
5/
31
6/1
(r) phthalic acid
Month/Date (local time, 2007)
1/23
1/
24
1/25
1/
26
1/27
1/
28
1/29
1/
30
1/31
2/
1
2/2
2/
3
2/4
2/
5
2/6
2/
7
0
100
200
5/22
5/
23
5/24
5/
25
5/26
5/
27
5/28
5/
29
5/30
5/
31
6/1
(s) terephthalic acid
Month/Date (local time, 2007)
1/23
1/
24
1/25
1/
26
1/27
1/
28
1/29
1/
30
1/31
2/
1
2/2
2/
3
2/4
2/
5
2/6
2/
7
0
1
2
5/22
5/
23
5/24
5/
25
5/26
5/
27
5/28
5/
29
5/30
5/
31
6/1
(i) shonanin
Early winter Late winter Summer Early winter Late winter Summer
(k) β-sitosterol
Con
cent
ratio
ns (n
gm
−3)
Date (local time, 2007)
1/23
1/
24
1/25
1/
26
1/27
1/
28
1/29
1/
30
1/31
2/
1
2/2
2/
3
2/4
2/
5
2/6
2/
7
0
5
10
5/22
5/
23
5/24
5/
25
5/26
5/
27
5/28
5/
29
5/30
5/
31
6/1
(j) a+b-amyrin (j) α+β-amyrin
Date (local time, 2007)
1/23
1/
24
1/25
1/
26
1/27
1/
28
1/29
1/
30
1/31
2/
1
2/2
2/
3
2/4
2/
5
2/6
2/
7
0
30
60
5/22
5/
23
5/24
5/
25
5/26
5/
27
5/28
5/
29
5/30
5/
31
6/1
(t) 1,3,5-triphenylbenzene
Month/Date (local time, 2007)
1/23
1/
24
1/25
1/
26
1/27
1/
28
1/29
1/
30
1/31
2/
1
2/2
2/
3
2/4
2/
5
2/6
2/
7
0
250
500
5/22
5/
23
5/24
5/
25
5/26
5/
27
5/28
5/
29
5/30
5/
31
6/1
(a) levoglucosan
Month/Date (local time, 2007)
1/23
1/
24
1/25
1/
26
1/27
1/
28
1/29
1/
30
1/31
2/
1
2/2
2/
3
2/4
2/
5
2/6
2/
7
0
20
40
5/22
5/
23
5/24
5/
25
5/26
5/
27
5/28
5/
29
5/30
5/
31
6/1
(b) galactosan
Month/Date (local time, 2007)
1/23
1/
24
1/25
1/
26
1/27
1/
28
1/29
1/
30
1/31
2/
1
2/2
2/
3
2/4
2/
5
2/6
2/
7
0
30
60
5/22
5/
23
5/24
5/
25
5/26
5/
27
5/28
5/
29
5/30
5/
31
6/1
(c) mannosan
Month/Date (local time, 2007)
1/23
1/
24
1/25
1/
26
1/27
1/
28
1/29
1/
30
1/31
2/
1
2/2
2/
3
2/4
2/
5
2/6
2/
7
0
2
4
5/22
5/
23
5/24
5/
25
5/26
5/
27
5/28
5/
29
5/30
5/
31
6/1
(d) vanillic acid
Month/Date (local time, 2007)
1/23
1/
24
1/25
1/
26
1/27
1/
28
1/29
1/
30
1/31
2/
1
2/2
2/
3
2/4
2/
5
2/6
2/
7
0
3
6
5/22
5/
23
5/24
5/
25
5/26
5/
27
5/28
5/
29
5/30
5/
31
6/1
(e) vanillin
Month/Date (local time, 2007)
1/23
1/
24
1/25
1/
26
1/27
1/
28
1/29
1/
30
1/31
2/
1
2/2
2/
3
2/4
2/
5
2/6
2/
7
0
25
50
5/22
5/
23
5/24
5/
25
5/26
5/
27
5/28
5/
29
5/30
5/
31
6/1
(f) 4-hydroxybenzoic acid
Month/Date (local time, 2007)
1/23
1/
24
1/25
1/
26
1/27
1/
28
1/29
1/
30
1/31
2/
1
2/2
2/
3
2/4
2/
5
2/6
2/
7
0
3
6
5/22
5/
23
5/24
5/
25
5/26
5/
27
5/28
5/
29
5/30
5/
31
6/1
(g) syringic acid
Month/Date (local time, 2007)
1/23
1/
24
1/25
1/
26
1/27
1/
28
1/29
1/
30
1/31
2/
1
2/2
2/
3
2/4
2/
5
2/6
2/
7
0
15
30
5/22
5/
23
5/24
5/
25
5/26
5/
27
5/28
5/
29
5/30
5/
31
6/1
(h) dehydroabietic acid
Month/Date (local time, 2007)
1/23
1/
24
1/25
1/
26
1/27
1/
28
1/29
1/
30
1/31
2/
1
2/2
2/
3
2/4
2/
5
2/6
2/
7
0
150
300
5/22
5/
23
5/24
5/
25
5/26
5/
27
5/28
5/
29
5/30
5/
31
6/1
(k) b-sitosterol
Month/Date (local time, 2007)
1/23
1/
24
1/25
1/
26
1/27
1/
28
1/29
1/
30
1/31
2/
1
2/2
2/
3
2/4
2/
5
2/6
2/
7
0
20
40
5/22
5/
23
5/24
5/
25
5/26
5/
27
5/28
5/
29
5/30
5/
31
6/1
(l) cholesterol
Month/Date (local time, 2007)
1/23
1/
24
1/25
1/
26
1/27
1/
28
1/29
1/
30
1/31
2/
1
2/2
2/
3
2/4
2/
5
2/6
2/
7
0
25
50
5/22
5/
23
5/24
5/
25
5/26
5/
27
5/28
5/
29
5/30
5/
31
6/1
(m) stigmasterol
Month/Date (local time, 2007)
1/23
1/
24
1/25
1/
26
1/27
1/
28
1/29
1/
30
1/31
2/
1
2/2
2/
3
2/4
2/
5
2/6
2/
7
0
100
200
5/22
5/
23
5/24
5/
25
5/26
5/
27
5/28
5/
29
5/30
5/
31
6/1
(n) unsaturated fatty acids
Month/Date (local time, 2007)
1/23
1/
24
1/25
1/
26
1/27
1/
28
1/29
1/
30
1/31
2/
1
2/2
2/
3
2/4
2/
5
2/6
2/
7
0
20
40
5/22
5/
23
5/24
5/
25
5/26
5/
27
5/28
5/
29
5/30
5/
31
6/1
(o) fructose + glucose
Month/Date (local time, 2007)1/
23
1/24
1/
25
1/26
1/
27
1/28
1/
29
1/30
1/
31
2/1
2/
2
2/3
2/
4
2/5
2/
6
2/7
0
4
8
5/22
5/
23
5/24
5/
25
5/26
5/
27
5/28
5/
29
5/30
5/
31
6/1
(p) mannitol
Month/Date (local time, 2007)
1/23
1/
24
1/25
1/
26
1/27
1/
28
1/29
1/
30
1/31
2/
1
2/2
2/
3
2/4
2/
5
2/6
2/
7
0
10
20
5/22
5/
23
5/24
5/
25
5/26
5/
27
5/28
5/
29
5/30
5/
31
6/1
(q) sucrose
Month/Date (local time, 2007)
1/23
1/
24
1/25
1/
26
1/27
1/
28
1/29
1/
30
1/31
2/
1
2/2
2/
3
2/4
2/
5
2/6
2/
7
0
25
50
5/22
5/
23
5/24
5/
25
5/26
5/
27
5/28
5/
29
5/30
5/
31
6/1
(r) phthalic acid
Month/Date (local time, 2007)
1/23
1/
24
1/25
1/
26
1/27
1/
28
1/29
1/
30
1/31
2/
1
2/2
2/
3
2/4
2/
5
2/6
2/
7
0
100
200
5/22
5/
23
5/24
5/
25
5/26
5/
27
5/28
5/
29
5/30
5/
31
6/1
(s) terephthalic acid
Month/Date (local time, 2007)
1/23
1/
24
1/25
1/
26
1/27
1/
28
1/29
1/
30
1/31
2/
1
2/2
2/
3
2/4
2/
5
2/6
2/
7
0
1
2
5/22
5/
23
5/24
5/
25
5/26
5/
27
5/28
5/
29
5/30
5/
31
6/1
(i) shonanin
Early winter Late winter Summer Early winter Late winter Summer
(k) β-sitosterol
Con
cent
ratio
ns (n
gm
−3)
Date (local time, 2007)
1/23
1/
24
1/25
1/
26
1/27
1/
28
1/29
1/
30
1/31
2/
1
2/2
2/
3
2/4
2/
5
2/6
2/
7
0
5
10
5/22
5/
23
5/24
5/
25
5/26
5/
27
5/28
5/
29
5/30
5/
31
6/1
(j) a+b-amyrin (j) α+β-amyrin
Date (local time, 2007)
1/23
1/
24
1/25
1/
26
1/27
1/
28
1/29
1/
30
1/31
2/
1
2/2
2/
3
2/4
2/
5
2/6
2/
7
0
30
60
5/22
5/
23
5/24
5/
25
5/26
5/
27
5/28
5/
29
5/30
5/
31
6/1
(t) 1,3,5-triphenylbenzene
1078 1079
1080
1081
1082
Fig. 4. Temporal variations in the concentrations of biomass-burning tracers and other
individual organic compounds detected in the tropical Indian aerosols.
44
Fig. 4. Temporal variations in the concentrations of biomass-burning tracers and other individual organic compounds detected in the tropicalIndian aerosols.
and di-(2-ethylhexyl) (DEHP, see XIX in Fig. A1) phtha-lates (Fig. 5). The concentrations of phthalates were 295–857 ng m−3 (553 ng m−3) in summer versus 175–598 ng m−3
(303 ng m−3) in winter (Table 1). Higher concentrationsobserved in summer (Fig. 3j) may be caused by enhancedemission of phthalates from plastics because of the higherambient temperatures. Similarly, Wang et al. (2006a) alsoreported that concentrations of phthalates in summer werehigher than those in winter. However, the nighttime concen-trations of DEHP in Chennai were higher than those at day-time (Fig. 5). This feature is different from other studies andwill be discussed below.
In India, most of the municipal solid wastes including alarge amount of plastics are generally disposed into openlandfills. Plastics are combustible. But under open-fire
conditions they can release numerous compounds into theatmosphere (Simoneit et al., 2005). Simoneit et al. (2005)reported that 1,3,5-triphenylbenzene (XXI) can be used asa specific tracer for the open-burning of plastics, especiallywhen coupled with the presence of the antioxidant tris(2,4-di-tert-butyl-phenyl)phosphate (TBPP, XX). A good corre-lation between 1,3,5-triphenylbenzene and TBPP was found(Fig. 6a). In this study, we detected TBPP in most of thesamples with higher concentrations at nighttime than at day-time (Fig. 7), indicating an enhanced plastic burning at night.This feature has also been reported in Algiers metropolitanarea (Yassaa et al., 2001). Such a refuse burning event mayexplain the higher concentrations of DEHP at nighttime thanat daytime.
www.atmos-chem-phys.net/10/2663/2010/ Atmos. Chem. Phys., 10, 2663–2689, 2010

2674 P. Q. Fu et al.: Molecular characterization of urban organic aerosol in tropical India
0
150
300
daytimenighttime
(a) early winter
0
150
300(b) late winter
DMP DEP DiBP DnBP DEHP0
300
600(c) summer
Con
cent
ratio
ns (n
gm
−3) 0
150
300
daytimenighttime
(a) early winter
0
150
300(b) late winter
DMP DEP DiBP DnBP DEHP0
300
600(c) summer
Con
cent
ratio
ns (n
gm
−3)
1083 1084
1085
1086
1087
Fig. 5. Molecular distributions of phthalate esters in PM10 aerosols collected in Chennai,
tropical India.
45
Fig. 5. Molecular distributions of phthalate esters in PM10 aerosolscollected in Chennai, tropical India.
3.6 Fossil fuel combustions
Hopanes (hopanoid hydrocarbons, XXIII) are specificbiomarkers of petroleum and coal (Simoneit et al., 1991;Rogge et al., 1993; Schauer et al., 1999, 2002). They maybe emitted into the atmosphere from internal combustion en-gines and the use of coal. A series of hopanes (C27–C35,but no C28, see Table 1 and Fig. 8) were detected in theChennai aerosols with the dominance of C29αβ. Such amolecular distribution has been reported in urban aerosols inChina (Simoneit et al., 1991). Their average concentrationswere 14.4±9.09 ng m−3 in winter and 4.97±1.91 ng m−3 insummer, which are higher than those reported in fourteenChinese mega-cities (3.1±4.6 ng m−3) (Wang et al., 2006a),Tokyo (0.7–15 ng m−3, average 5.5 ng m−3) (Kawamura etal., 1995), Auckland (5.7±4.3 ng m−3) and Christchurch(2.0±2.4 ng m−3) in New Zealand (Wang et al., 2006b), sug-gesting a severe air pollution in India. It should be notedthat hopanes are expected to react with OH radical in theatmosphere, causing a loss of these compounds in ambientparticles, especially in summer (Robinson et al., 2006).
Twenty PAHs (3- to 7-ring) were detected in the Chennaiaerosols ranging from phenanthrene to dibenzo(a,e)pyrene.Their total concentrations were 35.7±18.7 ng m−3 in win-ter versus 16.5±12.3 ng m−3 in summer, which are similarto those observed in Chinese mega-cities (28±4.8 ng m−3 insummer) (Wang et al., 2006a). The sources of PAHs includecoal and natural gas combustion, automobile emissions, and
biomass burning. The diagnostic ratios of IP/(IP+BghiP)were 0.44±0.04 at daytime and 0.45±0.03 at nighttime, sug-gesting a mixed source of traffic and coal burning. Amongthe PAHs detected, benzo(b)fluoranthene (BbF) was thedominant species in winter (Table 1 and Fig. 9). Howeverin summer, 1,3,5-triphenylbenzene became the most abun-dant, especially at night (Figs. 4t and 9). This suggests thatsevere plastic burning activities frequently happened duringsummer nighttime in tropical India as mentioned above.
3.7 Aromatic acids
Seven aromatic acids, i.e., benzoic acid, three toluic acids (o-, m-, andp-isomers), and three phthalic acids (o-, m-, andp-isomers), were detected in the samples. They can playan important role to enhance the atmospheric new particleformation (Zhang et al., 2004). The total concentrations ofaromatic acids on average were 36.5±21.9 ng m−3 in winterversus 51.8±33.9 ng m−3 in summer. Except for terephthalicacid (Fig. 4s), all the aromatic acids showed higher concen-trations at daytime than at nighttime (Fig. 10), indicating aphotochemical source.
Benzoic acid is proposed to be a primary pollutant in theexhaust of motor vehicles (Kawamura and Kaplan, 1987;Rogge et al., 1993; Kawamura et al., 2000) and a sec-ondary product from photochemical degradation of aro-matic hydrocarbons emitted by automobiles (Suh et al.,2003). The concentration ranges of benzoic acid were0.54–2.16 ng m−3 (average 1.25 ng m−3) in winter and 0.95–2.56 ng m−3 (1.44 ng m−3) in summer (Table 1). The con-centration ranges of total toluic acids were 0.15–1.18 ng m−3
(0.62 ng m−3) in winter and 0.33–1.09 ng m−3 (0.59 ng m−3)in summer. They may be derived from the oxidation of xy-lene (Forstner et al., 1997) or directly emitted from motorvehicle exhausts (Kawamura et al., 2000). The relatively lowconcentrations of benzoic and toluic acids in the tropical In-dian aerosols may be explained by their presence mainly ingas phase (Kawamura et al., 2000; Fraser et al., 2003). Themolecular distribution of phthalic acids was characterized bythe predominance of terephthalic acid (Fig. 10). This patternis different from those reported in aerosols from other studies(Wang et al., 2006a; Fu et al., 2008). Interestingly, a goodcorrelation was found between 1,3,5-triphenylbenzene andterephthalic acid, whereas no correlation was obtained be-tween 1,3,5-triphenylbenzene and phthalic acid in this study(Fig. 6b). This suggests that the open burning of plastics aswell can produce terephthalic acid. Terephthalic acid may inpart be produced by the hydrolysis of tere-phthalate duringthe open burning of municipal refuses including plastics.
3.8 Aliphatic lipids
Homologous n-alkanes (C18–C40) in the aerosol sam-ples were detected with higher concentrations at night-time (Fig. 11). Their concentrations were 30.9–727 ng m−3
Atmos. Chem. Phys., 10, 2663–2689, 2010 www.atmos-chem-phys.net/10/2663/2010/

P. Q. Fu et al.: Molecular characterization of urban organic aerosol in tropical India 2675
Malic acid (ng m-3)
0 10 20 30 40 500
10
20
303-HGAMBTCA
R2
= 0.59
R2
= 0.62
α
1,3,5-Triphenylbenzene (ng m-3)
0 10 20 30 40 50
Phth
alic
aci
ds (n
g m
-3)
0
100
200tere-phthalic acidphthalic acid
R2 = 0.78
R2 = 0.07
2-Methyltetrols (ng m_3)
0 10 20 30 40 50
C5-
alke
ne tr
iols
(ng
m-3
)
0
20
40
R2 = 0.80
2-Methylthreitol (ng m-3)
0 5 10 15
2-M
ethy
lery
thrit
ol (n
g m
-3)
0
20
40
R2 = 0.99
Non-sea-salt Ca (ng m-3)
0 500 1000 1500 2000
Suga
r Com
poun
ds (n
g m
-3)
0
4
8
12
16sucrosetrehalose
R2
= 0.59
R2
= 0.62
(c)
(d) (e) (f)
α-P
inen
e SO
A tra
cers
1,3,5-Triphenylbenzene (ng m-3)
0 10 20 30 40 50
TBPP
(ng
m-3
)
0
1
2
R2 = 0.82
(a) (b)
1088 1089
1090
1091
1092
1093
1094
1095
Fig. 6. Correlations between the concentrations of (a) 1,3,5-triphenylbenzene (a tracer for
plastics burning) and tris(2,4-di-tert-butyl-phenyl)phosphate (TBPP), (b) 1,3,5-
triphenylbenzene and phthalic acids, (c) non-sea-salt Ca and two sugar compounds (sucrose
and trehalose), (d) 2-methylthreitol and 2-methylerythritol, (e) 2-methyltetrols and C5-alkene
triols, and (f) malic acid and two α-pinene SOA tracers (3-HGA and MBTCA).
46
Fig. 6. Correlations between the concentrations of(a) 1,3,5-triphenylbenzene (a tracer for plastic burning) and tris(2,4-di-tert-butyl-phenyl)phosphate (TBPP),(b) 1,3,5-triphenylbenzene and phthalic acids,(c) non-sea-salt Ca and two sugar compounds (sucrose and tre-halose),(d) 2-methylthreitol and 2-methylerythritol,(e) 2-methyltetrols and C5-alkene triols, and(f) malic acid and twoα-pinene SOAtracers (3-HGA and MBTCA).
Early winter Late winter Summer
TBP
P (n
g m
_ 3 )
0
1
2
daytimenighttime
1096 1097
1098
1099
1100
Fig. 7. Concentrations of tris(2,4-di-tert-butyl-phenyl)phosphate (TBPP) in PM10 aerosols
collected in Chennai, tropical India.
47
Fig. 7. Concentrations of tris(2,4-di-tert-butyl-phenyl)phosphate (TBPP) in PM10 aerosols collected in Chennai,tropical India.
(average 187 ng m−3) in summer and 15.2–437 ng m−3
(141 ng m−3) in winter. Their molecular distributions arecharacterized by weak odd-carbon-numbered predominancewith a maximum at C29 (CPI ranged from 1.17–2.34). Such amolecular distribution suggests that they are mainly derivedfrom the incomplete combustion of fossil fuels, especially forlower molecular weightn-alkanes such as C20–C26. How-ever, higher molecular weightn-alkanes are likely derivedfrom higher plant waxes, in which C27, C29, C31 and C33are dominant species (Gagosian et al., 1982). Interestingly
0
1
2(c) summer
0
4
8daytimenighttime
(a) early winter
0
4
8(b) late winter
Con
cent
ratio
ns (n
gm
−3)
C27
αC
27β
C29
αβ
C29
βαC
30αβ
C30
βαC
31αβS
C31
αβR
C31
βαC
32αβS
C32
αβR
C33
αβS
C33
αβR
C34
αβS
C34
αβR
C35
αβS
C35
αβR
0
1
2(c) summer
0
4
8daytimenighttime
(a) early winter
0
4
8(b) late winter
Con
cent
ratio
ns (n
gm
−3)
C27
αC
27β
C29
αβ
C29
βαC
30αβ
C30
βαC
31αβS
C31
αβR
C31
βαC
32αβS
C32
αβR
C33
αβS
C33
αβR
C34
αβS
C34
αβR
C35
αβS
C35
αβR
1101
1102
1103
1104
1105
Fig. 8. Molecular distributions of hopanes in PM10 aerosols collected in Chennai, tropical
India.
48
Fig. 8. Molecular distributions of hopanes in PM10 aerosols col-lected in Chennai, tropical India.
www.atmos-chem-phys.net/10/2663/2010/ Atmos. Chem. Phys., 10, 2663–2689, 2010

2676 P. Q. Fu et al.: Molecular characterization of urban organic aerosol in tropical India
0
7
14daytimenighttime
(a) early winter
0
7
14(b) late winter
0
18
36(c) summer
Phe
nA
nthr Flu
Pyr
BbF
lrB
aAC
hry/
Trp
BbF BkF
BeP
BaP Per IP
DB
ahA
Bgh
iP AA
Cor
DB
aeP
1,2,
4-TP
B1,
3,5-
TPB
Con
cent
ratio
ns (n
gm
−3)
0
7
14daytimenighttime
(a) early winter
0
7
14(b) late winter
0
18
36(c) summer
Phe
nA
nthr Flu
Pyr
BbF
lrB
aAC
hry/
Trp
BbF BkF
BeP
BaP Per IP
DB
ahA
Bgh
iP AA
Cor
DB
aeP
1,2,
4-TP
B1,
3,5-
TPB
Con
cent
ratio
ns (n
gm
−3)
1106
1107
1108
1109
Fig. 9. Molecular distributions of PAHs in PM10 aerosols collected in Chennai, tropical India.
49
Fig. 9. Molecular distributions of PAHs in PM10 aerosols collectedin Chennai, tropical India.
has been successfully used for a series of, carbon numbers ofdetectedn-alkane were up to C40 (Fig. 11). Such a featurehas been reported in smokes from landfill plastic burning test(Simoneit et al., 2005). These long-chain alkanes (>C37)can also be interpreted by the high-molecular-weight paraf-fin wax, a petroleum product used to coat the inner surface offood containers (e.g., paper cartons for milk and juice) (Si-moneit et al., 2004). These findings again suggest that theopen-burning of municipal wastes is an important source oforganic aerosols in tropical India.
Plant wax n-alkanes are attributable to vascular plantwaxes. They are calculated as the excess of odd homologuesminus adjacent even homologues (Simoneit et al., 2004) andshown in Table 1. In summer, the concentration range of to-tal plant waxn-alkanes was 4.85–76.3 ng m−3 (22.8 ng m−3),which are comparable to those in winter (2.26–49.6 ng m−3,19.8 ng m−3), suggesting that there is no significant differ-ence in higher plant emissions between cold and warm sea-sons in tropical India. This feature may be associated withthe vegetation types and relatively high ambient temperatureeven in winter (14.2–34.9◦C, average 23◦C) during the cam-paign.
A homologous series of straight chain fatty acids, includ-ing C8:0–C34:0 saturated and unsaturated acids (e.g., C16:1and C18:1), were detected in the aerosols with higher night-time concentrations (Figs. 3b and 4n). Concentration ranges
c c c c c c c0
40
80
daytimenighttime
(a) early winter
0
25
50(b) late winter
benz
oic
o-tolu
ic
m-tolui
c
p-tolu
ic
phtha
lic
isoph
thalic
terep
hthali
c0
60
120(c) summer
Con
cent
ratio
ns (n
gm
−3)
c c c c c c c0
40
80
daytimenighttime
(a) early winter
0
25
50(b) late winter
benz
oic
o-tolu
ic
m-tolui
c
p-tolu
ic
phtha
lic
isoph
thalic
terep
hthali
c0
60
120(c) summer
Con
cent
ratio
ns (n
gm
−3)
1110
1111
1112
1113
1114
Fig. 10. Molecular distributions of aromatic acids in PM10 aerosols collected in Chennai,
tropical India.
50
Fig. 10.Molecular distributions of aromatic acids in PM10 aerosolscollected in Chennai, tropical India.
0
20
40daytime nighttime
(a) early winter
0
20
40(b) late winter
17 19 21 23 25 27 29 31 33 35 37 39 410
20
40
60(c) summerC
once
ntra
tions
(ng
m−3
)
Carbon number of n-alkanes
0
20
40daytime nighttime
(a) early winter
0
20
40(b) late winter
17 19 21 23 25 27 29 31 33 35 37 39 410
20
40
60(c) summerC
once
ntra
tions
(ng
m−3
)
Carbon number of n-alkanes 1115
1116
1117
1118
1119
Fig. 11. Molecular distributions of n-alkanes in PM10 aerosols collected in Chennai, tropical
India.
51
Fig. 11. Molecular distributions ofn-alkanes in PM10 aerosols col-lected in Chennai, tropical India.
Atmos. Chem. Phys., 10, 2663–2689, 2010 www.atmos-chem-phys.net/10/2663/2010/

P. Q. Fu et al.: Molecular characterization of urban organic aerosol in tropical India 2677
were 40.5–657 ng m−3 (302 ng m−3) in winter and 141–1448 ng m−3 (504 ng m−3) in summer, which are higher thanthose ofn-alkanes and fatty alcohols. Their molecular dis-tributions are characterized by a strong even carbon num-ber predominance with two maxima at C16:0 and C24:0 (CPIranged from 2.80–6.40, Table 1 and Fig. 12). A similar bi-modal distribution has been reported in continental and ma-rine aerosols (Mochida et al., 2002; Kawamura et al., 2003;Fu et al., 2008).
The concentration ratios of lower molecular weight fattyacids (LFAs, <C20:0) to higher molecular weight fattyacids (HFAs, C20:0–C34:0) were 5.3±1.8 in summer versus1.4±0.8 in winter. These values are higher than those re-ported in Mt. Tai aerosols (average ratio of LFAs/HFAs was1.02±0.80) in Central East China (Fu et al., 2008). HFAs arederived from terrestrial higher plant wax whereas LFAs havemultiple sources such as vascular plants, microbes, marinephytoplankton, and kitchen emissions (Rogge et al., 1991;Schauer et al., 2001). Thus, our results suggest that muchmore LFAs are emitted from microbial sources in tropicalIndia due to higher temperature and humidity, especially insummer.
The presence of unsaturated fatty acids in aerosols is in-dicative of recent biogenic inputs from higher plants as wellas microbial/marine sources. In urban environments, cook-ing, motor vehicles, and biomass burning can also be the ma-jor anthropogenic sources of these acids (Rogge et al., 1993,1996). They can be rapidly oxidized once emitted to the at-mosphere (Kawamura and Gagosian, 1987). Oleic (C18:1)and linoleic (C18:2) acids were detected as dominant speciesin the Chennai aerosols. Their total concentrations showeda clear diurnal trend with a peak at nighttime (Fig. 4n), sug-gesting an enhanced emission to the atmosphere. Moreover,significantly high concentrations of unsaturated fatty acidswere observed at nighttime during late winter when the airmass mainly originated from Southeast Asia over the Bay ofBengal, indicating that marine air masses enriched with un-saturated fatty acids should be transported to Chennai.
Oleic acid is also a good proxy for unsaturated organicmatter in atmospheric aerosols and a good model compoundfor studying aerosol reactivity (Rudich et al., 2007). Theratios of oleic acid to stearic acid (C18:1/C18:0) in winterranged from 0.01–0.18 (average 0.05) and 0.04–1.05 (0.61)during daytime and nighttime, respectively. On the otherhand, the ratios of C18:1/C18:0 were lower in summer rang-ing from 0–0.05 (0.01) at daytime and 0.04–0.35 (0.10) atnighttime. This again suggests an enhanced photochemi-cal degradation of oleic acid occurs during daytime, espe-cially in summer. Wang et al. (2006a) reported that the ra-tios of unsaturated fatty acids (C16:1+C18:1) to saturated fattyacids (C16:0+C18:0) in urban aerosols from fourteen Chinesemegacities were 1.14±0.98 in winter versus 0.43±0.09 insummer. In the Chennai aerosols, the values (0.12±0.15 inwinter versus 0.01±0.02 in summer) are about one order ofmagnitude lower than those reported in Chinese megacities,
0
125
250daytime nighttime
(a) early winter
0
125
250(b) late winter
8 10 12 14 16 18 20 22 24 26 28 30 32 340
400
800(c) summer
Con
cent
ratio
ns (n
gm
−3)
Carbon number of fatty acids
0
125
250daytime nighttime
(a) early winter
0
125
250(b) late winter
8 10 12 14 16 18 20 22 24 26 28 30 32 340
400
800(c) summer
Con
cent
ratio
ns (n
gm
−3)
Carbon number of fatty acids 1120
1121
1122
1123
1124
Fig. 12. Molecular distributions of fatty acids in PM10 aerosols collected in Chennai, tropical
India.
52
Fig. 12. Molecular distributions of fatty acids in PM10 aerosolscollected in Chennai, tropical India.
indicating that the photooxidation of unsaturated fatty acidsin tropical region is more significant under stronger radiationconditions.
Normal C14–C34 fatty alcohols were detected in theaerosols. Their distributions are characterized with strongeven carbon number predominance (CPIs are 9.75±2.94 inwinter and 10.9±6.77 in summer) with Cmax at C28 or C30(Fig. 13). Total concentrations ofn-alcohols were 11.0–116 ng m−3 (67.9 ng m−3) in winter and 21.0–155 ng m−3
(70.4 ng m−3) in summer (Fig. 3c). Long-chain fatty alco-hols are abundant in higher plant waxes, soils, and loess de-posits, whereas the homologues of<C20 are abundant insoil microbes and marine biota (Simoneit et al., 1991). Itshould be noted that biomass burning can also produce alarge amount of fatty alcohols, together withn-alkanes andfatty acids (Simoneit, 2002). The CPI values together withthe molecular distributions of fatty alcohols suggest that theyare mainly derived from higher plant waxes and partly frommicrobial and/or marine emissions both in winter and in sum-mer.
3.9 Sugars/sugar alcohols
Eleven sugar compounds (glycerol, erythritol, xylose, ara-bitol, fructose, glucose, mannitol, inositol, sucrose, tre-halose, and maltose) were detected in the tropical Indianaerosols (Fig. 14). These compounds are completely water-soluble and thus contribute to WSOC in aerosol. They have
www.atmos-chem-phys.net/10/2663/2010/ Atmos. Chem. Phys., 10, 2663–2689, 2010

2678 P. Q. Fu et al.: Molecular characterization of urban organic aerosol in tropical India
0
15
30
daytime nighttime
(a) early winter
0
20
40(b) late winter
14 16 18 20 22 24 26 28 30 32 340
20
40(c) summer
Con
cent
ratio
ns (n
gm
−3)
Carbon number of fatty alcohols
0
15
30
daytime nighttime
(a) early winter
0
20
40(b) late winter
14 16 18 20 22 24 26 28 30 32 340
20
40(c) summer
Con
cent
ratio
ns (n
gm
−3)
Carbon number of fatty alcohols 1125
1126
1127
1128
1129
Fig. 13. Molecular distributions of fatty alcohols in PM10 aerosols collected in Chennai,
tropical India.
53
Fig. 13. Molecular distributions of fatty alcohols in PM10 aerosolscollected in Chennai, tropical India.
been proposed as tracers for resuspension of surface soil andunpaved road dust, which contain biological materials in-cluding pollen, fungi and bacteria (Graham et al., 2003; Si-moneit et al., 2004; Yttri et al., 2007). Concentrations oftotal sugars/sugar alcohols were more abundant in summer(29.5±7.83 ng m−3) than in winter (20.0±11.8 ng m−3) (Ta-ble 1), suggesting higher biological activities in summer.
Most of them were found to be more abundant at daytimethan nighttime (Figs. 3e, 4o–q and 14). Fructose and glucose,together with sucrose (XXV), have been proposed to be re-leased as pollen, fern spores, and other “giant” bioaerosolparticles during daytime (Graham et al., 2003). The di-rect emission from developing leaves is also an importantsource of sugars and sugar alcohols. It should be noted thatsugar compounds can further be emitted through biomassburning. For example, maltose and sucrose have been re-ported in wood smoke (Nolte et al., 2001). Medeiros andSimoneit (2008) reported that a large amount of sugars (e.g.,maltose) and sugar alcohols (e.g., erythritol – XXIV, arabitol,and mannitol) can be emitted upon combustion of green veg-etation from temperate forests.
In order to get further insight to the sources of sugarsin the tropical Indian aerosols, Principal Component Anal-ysis (PCA) was performed using the concentrations of var-ious sugars (including anhydrosugars) as variables. PCAis a useful approach for verifying the sources of aerosols(Hopke, 1985) and has been successfully used for a series
0
8
16daytimenighttime
(a) early winter
0
8
16(b) late winter
glyc
erol
eryt
hrito
l
xylo
se
arab
itol
fruct
ose
gluc
ose
man
nito
l
inos
itol
sucr
ose
treha
lose
mal
tose
0
8
16(c) summer
Con
cent
ratio
ns (n
gm
−3) 0
8
16daytimenighttime
(a) early winter
0
8
16(b) late winter
glyc
erol
eryt
hrito
l
xylo
se
arab
itol
fruct
ose
gluc
ose
man
nito
l
inos
itol
sucr
ose
treha
lose
mal
tose
0
8
16(c) summer
Con
cent
ratio
ns (n
gm
−3)
1130
1131
1132
1133
1134
Fig. 14. Molecular distributions of sugar compounds in PM10 aerosols collected in Chennai,
tropical India.
54
Fig. 14. Molecular distributions of sugar compounds in PM10aerosols collected in Chennai, tropical India.
of Dicarboxylic Acids (DCAs) and other atmospheric tracespecies (Wolff and Korsog, 1985; Kawamura and Sakaguchi,1999; Mochida et al., 2003; Wan and Yu, 2007; Fu et al.,2008). The datasets of sugars for winter (n=29) and sum-mer (n=20) aerosol samples were subjected to PCA analy-sis based on their correlation matrix, followed by the vari-max rotation of the eigenvectors. Principal component load-ings, which are correlation coefficients between the concen-trations of individual saccharides with principal components,are shown in Table 2. Three components were set for bothwinter and summer samples by the scree tests.
For the winter dataset, three components were found toaccount for 87.2% of the total variance, with the first com-ponent corresponding to 48.1%. Levoglucosan, galactosan,mannosan, erythritol, xylose, inositol, and maltose showedloadings of>0.87 in component 1, which is mainly associ-ated with the emissions from biomass burning. In contrast,mannitol, sucrose, and trehalose showed loadings of>0.91in component 2 (29.1%). Arabitol, fructose, and glucose alsoshowed major loadings of>0.56 in component 2, suggestinga common biological origin. These sugar polyols are abun-dantly produced by many fungi. They are also the major sol-uble carbohydrates in the bark of trees, branches and leaves.Trehalose (glucose + glucose) is present in a large variety ofmicroorganisms (fungi, bacteria and yeast), and a few higher
Atmos. Chem. Phys., 10, 2663–2689, 2010 www.atmos-chem-phys.net/10/2663/2010/

P. Q. Fu et al.: Molecular characterization of urban organic aerosol in tropical India 2679
Table 2. Results of principal component analysis with Varimax rotation for the dataset of sugar compounds (including anhydrosugars) in theurban aerosols from Chennai, tropical India.
SugarsWinter Summer
Component 1 Component 2 Component 3 Component 1 Component 2 Component 3
galactosan 0.87 0.10 0.34 0.92 −0.23 −0.02mannosan 0.98 0.02 0.12 0.94 −0.23 −0.13levoglucosan 0.98 0.07 0.07 0.98 −0.11 −0.11glycerol 0.29 0.21 0.89 −0.06 −0.07 0.78erythritol 0.92 0.33 0.11 0.91 0.02 0.25xylose 0.93 −0.02 0.28 0.93 −0.03 −0.20arabitol 0.62 0.65 0.31 0.01 0.97 0.07fructose 0.55 0.63 −0.12 0.19 0.30 0.84glucose 0.20 0.56 0 0.10 0.86 −0.36mannitol 0.12 0.91 0.22 −0.09 0.92 −0.01inositol 0.87 0.11 0.37 0.82 0.29 0.14sucrose −0.03 0.98 0.02 −0.21 0.88 0.30trehalose −0.12 0.96 0.12 −0.01 0.92 0.25maltose 0.88 0.20 −0.28 0.74 0.08 0.23Variance (%) 48.1 29.1 10.0 40.8 31.8 12.9
plants and invertebrates (Medeiros et al., 2006). Sucrose isthe predominant sugar present in the phloem of plants and isimportant in developing flower buds (Bieleski, 1995). Theyare used to trace the resuspension of surface soil and unpavedroad dust (Simoneit et al., 2004). Arabitol and fructose alsoshow loadings of 0.62 and 0.55 in component 1, respectively.This suggests that during winter these compounds are emit-ted by biomass burning as well, as mentioned earlier in thissection. Glycerol showed a loading of>0.89 in component 3(10.0%). It is a reduced sugar primarily produced by fungalmetabolism in soils and is resuspended into the atmosphereby wind motion (Simoneit et al., 2004). However, the differ-ences of the estimated sources between components 2 and 3can not be elucidated at this moment.
In summer, three components were found to account for85.5% of the total variance, with the first component corre-sponding to 40.8%. Levoglucosan, galactosan, mannosan,erythritol, and xylose showed loadings of>0.91 in com-ponent 1 that is associated with biomass burning. Inositoland maltose also showed loadings of>0.74 in component 1,suggesting a significant contribution from biomass burning.Arabitol, glucose, mannitol, sucrose, and trehalose showedloadings of>0.86 in component 2 (31.8%). As mentionedabove, these primary saccharides and sugar polyols could bederived from biological sources or suspended soil dust. In-terestingly, positive correlations were obtained between theconcentrations of non-sea-salt Ca (nss-Ca), a tracer for soildust, and sucrose (R2=0.59) and trehalose (R2=0.62) in theChennai aerosols (Fig. 6c). Bauer et al. (2008) proposed ara-bitol and mannitol as tracers for the quantification of airbornefungal spores. Graham et al. (2003) reported that glucoseand fructose, together with sucrose, showed higher daytime
concentrations, which were explained by the specific daytimerelease of pollen, fern spores and other bioaerosols in sum-mer. Glycerol and fructose showed loadings of 0.78 and 0.84in component 3 (12.9%), respectively, suggesting that thesetwo compounds are derived from similar sources in tropicalIndia in summer.
3.10 Hydroxy-/polyacids
Seven hydroxy- or poly-acids were detected in the tropicalIndian aerosols, including glycolic, salicylic, glyceric, malic,tartaric, citric, and tricarballylic acids. Glycolic acid (hy-droxyacetic acid), the smallestα-hydroxy acid, is the mostabundant species in this group during winter. It is hygro-scopic and highly water-soluble. However in summer, malicacid is the most abundant hydroxyacid (Table 1). Salicylicacid (2-hydroxybenzoic acid) is highly CCN active (Hartzet al., 2006), although its solubility is low. Little is knownabout salicylic acid in the atmosphere. Van Pinxteren andHerrmann (2007) detected salicylic acid (0.1 ng m−3) in onePM10 sample collected in a rural site in Germany. Fu etal. (2009b) reported that the concentration range of salicylicacid was 0.002–0.102 ng m−3 (average 0.042 ng m−3) in theArctic aerosols. In the present study, the average concen-trations of salicylic acid were 0.38±0.22 ng m−3 in winterversus 0.27±0.07 ng m−3 in summer.
Glyceric, malic, tartaric and citric acids are suggestedas secondary oxidation products. These compounds areall characterized by a diurnal pattern with higher concen-trations during daytime than nighttime (Fig. 15c–f). Thistrend is opposite to most organic species (such as lipidclass compounds) as mentioned in Sect. 3.3, whose diurnal
www.atmos-chem-phys.net/10/2663/2010/ Atmos. Chem. Phys., 10, 2663–2689, 2010

2680 P. Q. Fu et al.: Molecular characterization of urban organic aerosol in tropical India
Month/Date (local time, 2007)
1/23
1/
24
1/25
1/
26
1/27
1/
28
1/29
1/
30
1/31
2/
1
2/2
2/
3
2/4
2/
5
2/6
2/
7
0
30
60
5/22
5/
23
5/24
5/
25
5/26
5/
27
5/28
5/
29
5/30
5/
31
6/1
(i) 2-methyltetrols
Date (local time, 2007)
1/23
1/
24
1/25
1/
26
1/27
1/
28
1/29
1/
30
1/31
2/
1
2/2
2/
3
2/4
2/
5
2/6
2/
7
0
40
80
5/22
5/
23
5/24
5/
25
5/26
5/
27
5/28
5/
29
5/30
5/
31
6/1
(a) glycolic acid
Month/Date (local time, 2007)
1/23
1/
24
1/25
1/
26
1/27
1/
28
1/29
1/
30
1/31
2/
1
2/2
2/
3
2/4
2/
5
2/6
2/
7
0
1
2
5/22
5/
23
5/24
5/
25
5/26
5/
27
5/28
5/
29
5/30
5/
31
6/1
(b) salicylic acid
Date (local time, 2007)
1/23
1/
24
1/25
1/
26
1/27
1/
28
1/29
1/
30
1/31
2/
1
2/2
2/
3
2/4
2/
5
2/6
2/
7
0
8
16
5/22
5/
23
5/24
5/
25
5/26
5/
27
5/28
5/
29
5/30
5/
31
6/1
(c) glyceric acid
Month/Date (local time, 2007)
1/23
1/
24
1/25
1/
26
1/27
1/
28
1/29
1/
30
1/31
2/
1
2/2
2/
3
2/4
2/
5
2/6
2/
7
0
30
60
5/22
5/
23
5/24
5/
25
5/26
5/
27
5/28
5/
29
5/30
5/
31
6/1
(d) malic acid
Date (local time, 2007)
1/23
1/
24
1/25
1/
26
1/27
1/
28
1/29
1/
30
1/31
2/
1
2/2
2/
3
2/4
2/
5
2/6
2/
7
0
10
20
5/22
5/
23
5/24
5/
25
5/26
5/
27
5/28
5/
29
5/30
5/
31
6/1
(e) tartaric acid
Date (local time, 2007)
1/23
1/
24
1/25
1/
26
1/27
1/
28
1/29
1/
30
1/31
2/
1
2/2
2/
3
2/4
2/
5
2/6
2/
7
0
3
6
5/22
5/
23
5/24
5/
25
5/26
5/
27
5/28
5/
29
5/30
5/
31
6/1
(f) citric acid
Date (local time, 2007)
1/23
1/
24
1/25
1/
26
1/27
1/
28
1/29
1/
30
1/31
2/
1
2/2
2/
3
2/4
2/
5
2/6
2/
7
0
30
60
5/22
5/
23
5/24
5/
25
5/26
5/
27
5/28
5/
29
5/30
5/
31
6/1
(g) tricarballylic acid
Date (local time, 2007)
1/23
1/
24
1/25
1/
26
1/27
1/
28
1/29
1/
30
1/31
2/
1
2/2
2/
3
2/4
2/
5
2/6
2/
7
0
6
12
5/22
5/
23
5/24
5/
25
5/26
5/
27
5/28
5/
29
5/30
5/
31
6/1
(h) 2-methylglyceric acid
Month/Date (local time, 2007)
1/23
1/
24
1/25
1/
26
1/27
1/
28
1/29
1/
30
1/31
2/
1
2/2
2/
3
2/4
2/
5
2/6
2/
7
0
20
40
5/22
5/
23
5/24
5/
25
5/26
5/
27
5/28
5/
29
5/30
5/
31
6/1
(j) C5-alkene triols
Month/Date (local time, 2007)
1/23
1/
24
1/25
1/
26
1/27
1/
28
1/29
1/
30
1/31
2/
1
2/2
2/
3
2/4
2/
5
2/6
2/
7
0
10
20
5/22
5/
23
5/24
5/
25
5/26
5/
27
5/28
5/
29
5/30
5/
31
6/1
(k) pinonic acid
Month/Date (local time, 2007)
1/23
1/
24
1/25
1/
26
1/27
1/
28
1/29
1/
30
1/31
2/
1
2/2
2/
3
2/4
2/
5
2/6
2/
7
5/22
5/
23
5/24
5/
25
5/26
5/
27
5/28
5/
29
5/30
5/
31
6/1
(l) norpinic acid
Date (local time, 2007)
1/23
1/
24
1/25
1/
26
1/27
1/
28
1/29
1/
30
1/31
2/
1
2/2
2/
3
2/4
2/
5
2/6
2/
7
0
3
6
5/22
5/
23
5/24
5/
25
5/26
5/
27
5/28
5/
29
5/30
5/
31
6/1
(m) pinic acid
Month/Date (local time, 2007)1/
23
1/24
1/
25
1/26
1/
27
1/28
1/
29
1/30
1/
31
2/1
2/
2
2/3
2/
4
2/5
2/
6
2/7
0
25
50
5/22
5/
23
5/24
5/
25
5/26
5/
27
5/28
5/
29
5/30
5/
31
6/1
(o) 3-hydroxyglutaric acid
Date (local time, 2007)
1/23
1/
24
1/25
1/
26
1/27
1/
28
1/29
1/
30
1/31
2/
1
2/2
2/
3
2/4
2/
5
2/6
2/
7
0
1
2
5/22
5/
23
5/24
5/
25
5/26
5/
27
5/28
5/
29
5/30
5/
31
6/1
(p) MBTCA
Date (local time, 2007)
Early winter Late winter Summer Early winter Late winter Summer
1.0
0.5
0
Con
cent
ratio
ns (n
gm
−3)
1/23
1/
24
1/25
1/
26
1/27
1/
28
1/29
1/
30
1/31
2/
1
2/2
2/
3
2/4
2/
5
2/6
2/
7
0
8
16
5/22
5/
23
5/24
5/
25
5/26
5/
27
5/28
5/
29
5/30
5/
31
6/1
(q) β-caryophyllinic acid
Month/Date (local time, 2007)
1/23
1/
24
1/25
1/
26
1/27
1/
28
1/29
1/
30
1/31
2/
1
2/2
2/
3
2/4
2/
5
2/6
2/
7
0
30
60
5/22
5/
23
5/24
5/
25
5/26
5/
27
5/28
5/
29
5/30
5/
31
6/1
(i) 2-methyltetrols
Date (local time, 2007)
1/23
1/
24
1/25
1/
26
1/27
1/
28
1/29
1/
30
1/31
2/
1
2/2
2/
3
2/4
2/
5
2/6
2/
7
0
40
80
5/22
5/
23
5/24
5/
25
5/26
5/
27
5/28
5/
29
5/30
5/
31
6/1
(a) glycolic acid
Month/Date (local time, 2007)
1/23
1/
24
1/25
1/
26
1/27
1/
28
1/29
1/
30
1/31
2/
1
2/2
2/
3
2/4
2/
5
2/6
2/
7
0
1
2
5/22
5/
23
5/24
5/
25
5/26
5/
27
5/28
5/
29
5/30
5/
31
6/1
(b) salicylic acid
Date (local time, 2007)
1/23
1/
24
1/25
1/
26
1/27
1/
28
1/29
1/
30
1/31
2/
1
2/2
2/
3
2/4
2/
5
2/6
2/
7
0
8
16
5/22
5/
23
5/24
5/
25
5/26
5/
27
5/28
5/
29
5/30
5/
31
6/1
(c) glyceric acid
Month/Date (local time, 2007)
1/23
1/
24
1/25
1/
26
1/27
1/
28
1/29
1/
30
1/31
2/
1
2/2
2/
3
2/4
2/
5
2/6
2/
7
0
30
60
5/22
5/
23
5/24
5/
25
5/26
5/
27
5/28
5/
29
5/30
5/
31
6/1
(d) malic acid
Date (local time, 2007)
1/23
1/
24
1/25
1/
26
1/27
1/
28
1/29
1/
30
1/31
2/
1
2/2
2/
3
2/4
2/
5
2/6
2/
7
0
10
20
5/22
5/
23
5/24
5/
25
5/26
5/
27
5/28
5/
29
5/30
5/
31
6/1
(e) tartaric acid
Date (local time, 2007)
1/23
1/
24
1/25
1/
26
1/27
1/
28
1/29
1/
30
1/31
2/
1
2/2
2/
3
2/4
2/
5
2/6
2/
7
0
3
6
5/22
5/
23
5/24
5/
25
5/26
5/
27
5/28
5/
29
5/30
5/
31
6/1
(f) citric acid
Date (local time, 2007)
1/23
1/
24
1/25
1/
26
1/27
1/
28
1/29
1/
30
1/31
2/
1
2/2
2/
3
2/4
2/
5
2/6
2/
7
0
30
60
5/22
5/
23
5/24
5/
25
5/26
5/
27
5/28
5/
29
5/30
5/
31
6/1
(g) tricarballylic acid
Date (local time, 2007)
1/23
1/
24
1/25
1/
26
1/27
1/
28
1/29
1/
30
1/31
2/
1
2/2
2/
3
2/4
2/
5
2/6
2/
7
0
6
12
5/22
5/
23
5/24
5/
25
5/26
5/
27
5/28
5/
29
5/30
5/
31
6/1
(h) 2-methylglyceric acid
Month/Date (local time, 2007)
1/23
1/
24
1/25
1/
26
1/27
1/
28
1/29
1/
30
1/31
2/
1
2/2
2/
3
2/4
2/
5
2/6
2/
7
0
20
40
5/22
5/
23
5/24
5/
25
5/26
5/
27
5/28
5/
29
5/30
5/
31
6/1
(j) C5-alkene triols
Month/Date (local time, 2007)
1/23
1/
24
1/25
1/
26
1/27
1/
28
1/29
1/
30
1/31
2/
1
2/2
2/
3
2/4
2/
5
2/6
2/
7
0
10
20
5/22
5/
23
5/24
5/
25
5/26
5/
27
5/28
5/
29
5/30
5/
31
6/1
(k) pinonic acid
Month/Date (local time, 2007)
1/23
1/
24
1/25
1/
26
1/27
1/
28
1/29
1/
30
1/31
2/
1
2/2
2/
3
2/4
2/
5
2/6
2/
7
5/22
5/
23
5/24
5/
25
5/26
5/
27
5/28
5/
29
5/30
5/
31
6/1
(l) norpinic acid
Date (local time, 2007)
1/23
1/
24
1/25
1/
26
1/27
1/
28
1/29
1/
30
1/31
2/
1
2/2
2/
3
2/4
2/
5
2/6
2/
7
0
3
6
5/22
5/
23
5/24
5/
25
5/26
5/
27
5/28
5/
29
5/30
5/
31
6/1
(m) pinic acid
Month/Date (local time, 2007)1/
23
1/24
1/
25
1/26
1/
27
1/28
1/
29
1/30
1/
31
2/1
2/
2
2/3
2/
4
2/5
2/
6
2/7
0
25
50
5/22
5/
23
5/24
5/
25
5/26
5/
27
5/28
5/
29
5/30
5/
31
6/1
(o) 3-hydroxyglutaric acid
Date (local time, 2007)
1/23
1/
24
1/25
1/
26
1/27
1/
28
1/29
1/
30
1/31
2/
1
2/2
2/
3
2/4
2/
5
2/6
2/
7
0
1
2
5/22
5/
23
5/24
5/
25
5/26
5/
27
5/28
5/
29
5/30
5/
31
6/1
(p) MBTCA
Date (local time, 2007)
Early winter Late winter Summer Early winter Late winter Summer
1.0
0.5
0
Con
cent
ratio
ns (n
gm
−3)
1/23
1/
24
1/25
1/
26
1/27
1/
28
1/29
1/
30
1/31
2/
1
2/2
2/
3
2/4
2/
5
2/6
2/
7
0
8
16
5/22
5/
23
5/24
5/
25
5/26
5/
27
5/28
5/
29
5/30
5/
31
6/1
(q) β-caryophyllinic acid
1135
1136
1137
1138
1139
Fig. 15. Temporal variations in the concentrations of hydroxy-/polyacids and biogenic
secondary organic aerosol tracers detected in the tropical Indian aerosols.
55
Fig. 15. Temporal variations in the concentrations of hydroxy-/polyacids and biogenic secondary organic aerosol tracers detected in thetropical Indian aerosols.
distributions are controlled by the land/sea breeze patternsin Chennai. In addition, the diurnal patterns of glycolic,salicylic and tricarballylic acids were also characterized byhigher concentrations during daytime (Fig. 15), indicatingthat they are mainly produced by photochemical oxidation.However, the temporal variations of these acids were differ-ent from polyacids such as malic acid. Malic acid can beproduced by the photochemical oxidation of succinic acid(Kawamura and Ikushima, 1993), which is one of the oxi-dation products of biogenic unsaturated fatty acids in the at-mosphere (Matsunaga et al., 1999). One possible source forsalicylic acid is benzoic acid that may react with hydroxylradicals (Nakajima et al., 2008).
3.11 Biogenic SOA tracers
Biogenic VOCs that are released from vegetation include iso-prene, monoterpenes, sesquiterpenes, and oxygenated hydro-carbons such as alcohols, aldehydes and ketones (Guentheret al., 2006; Goldstein and Galbally, 2007; Duhl et al., 2008).Considerable efforts have been devoted in the last decadeto understand secondary organic aerosol formation from the
photooxidation of biogenic VOCs (Hoffmann et al., 1997;Yu et al., 1999; Claeys et al., 2004a; Hallquist et al., 2009),because SOA is an important component in the Earth’s at-mosphere to influence the atmospheric radiation budget di-rectly by scattering sunlight and indirectly by acting as CloudCondensation Nuclei (CCN) (Kanakidou et al., 2005). Ona global scale, the contribution of biogenic VOCs to SOA(18.5–270 Tg/yr) is one order of magnitude greater than thatof anthropogenic VOCs (1–30 Tg/yr) (Andreae and Crutzen,1997).
Isoprene (2-methyl-1,3-butadiene, C5H8) is highly reac-tive because of the presence of C=C bonds, which makesit susceptible to react with oxidants (e.g., OH, O3, andNO3). The global emissions of biogenic terpenes and an-thropogenic hydrocarbons are both far lower than that ofisoprene (500–750 Tg yr−1) (Guenther et al., 2006). Iso-prene oxidation products can partition in the gas phaseand particles and lead to SOA formation (Claeys et al.,2004a; Hallquist et al., 2009). Six organic compoundswere identified as isoprene SOA tracers in the Chennaiaerosols, including 2-methylglyceric acid (XXVI), threeC5-alkene triols (XXVII–XXIX), and two 2-methyltetrols
Atmos. Chem. Phys., 10, 2663–2689, 2010 www.atmos-chem-phys.net/10/2663/2010/

P. Q. Fu et al.: Molecular characterization of urban organic aerosol in tropical India 2681
(2-methylthreitol and 2-methylerythritol) (XXX). Their con-centrations were higher in summer than in winter (Ta-ble 1). The levels of 2-methyltetrols in the Chennai aerosols(2.75±2.78 ng m−3 in winter versus 13.8±9.10 ng m−3 insummer) are lower than those reported in aerosols frommountain sites in China (Wang et al., 2008; Fu et al., 2009c),and forested sites in Amazon (Claeys et al., 2004a), Hun-gary (Ion et al., 2005), Finland (Kourtchev et al., 2008a),and Germany (Kourtchev et al., 2008b). 2-Methylerythritolwas about 2.5-fold more abundant than 2-methylthreitol (Ta-ble 1). This ratio is similar to those observed in other studies(Claeys et al., 2004a; Ion et al., 2005; Cahill et al., 2006). Astrong correlation was found between 2-methylthreitol and 2-methylerythritol (R2=0.99, Fig. 6d), suggesting a very simi-lar formation pathway and/or atmospheric fate.
C5-Alkene triols, which are also photooxidation productsof isoprene (Wang et al., 2005; Surratt et al., 2006), weredetected in all the samples with average concentrations sim-ilar to those of 2-methyltetrols. However, they are lowerthan those (∼50 ng m−3) reported in subtropical Hong Kong(Hu et al., 2008), but are comparable to those reported inother studies from midlatitudes, e.g., a Californian pine for-est, USA (3.47 ng m−3) (Cahill et al., 2006), and Julich, Ger-many (1.6–4.9 ng m−3) (Kourtchev et al., 2008b), and about2 orders of magnitude higher than those reported in the Arc-tic region (Fu et al., 2009b). A good correlation was foundbetween 2-methyltetrols and C5-alkene triols in the Chen-nai samples (Fig. 6e). It is reasonable because they are bothderived from the oxidation of isoprene. However, their for-mation processes are different. Wang et al. (2005) reportedthat 2-methyltetrols are formed through diepoxy derivativesof isoprene, which can be converted into 2-methyltetrolsthrough acid-catalyzed hydrolysis. Alternatively, the forma-tion of C5-alkene triols can be explained through rearrange-ment reactions of hydroxyperoxy radicals that are formed inthe initial photooxidation of isoprene (Surratt et al., 2006). 2-Methylglyceric acid is possibly formed by further oxidationof methacrolein and methacrylic acid from isoprene (Claeyset al., 2004b; Surratt et al., 2006). Its concentrations werelower than those of 2-methyltetrols and C5-alkene triols (Ta-ble 1).
Five organic acids were detected asα/β-pinene oxida-tion products, including 3-hydroxyglutaric acid (3-HGA,XXXI), pinonic acid (XXXII), norpinic acid (XXXIII), pinicacid (XXXIV), and 3-methyl-1,2,3-butanetricarboxylic acid(MBTCA, XXXV). These acids are produced by the oxida-tion of α/β-pinene via reactions with O3 and OH radicals(Hallquist et al., 2009). Concentrations of pinic and pinonicacids were similar during winter whereas in summer the con-centrations of pinonic acid were higher than those of pinicacid (Table 1), although the vapor pressure of pinonic acid isabout 2 orders of magnitude higher than pinic acid. This pat-tern is consistent with those found in tropospheric aerosolsover Mt. Tai, in which pinonic acid was twice more abundantthan pinic acid. Similar patterns have been reported in other
studies (Kavouras et al., 1999; Cahill et al., 2006; Bhat andFraser, 2007; Yan et al., 2008). However, higher concentra-tions of pinic acid than pinonic acid have been reported inthe aerosols from a coniferous forest in Germany (Plewka etal., 2006) and Research Triangle Park (RTP), USA (Kleindi-enst et al., 2007). Both 3-HGA and MBTCA are generated insmog chamber experiments ofα-pinene with an irradiation ofUV in the presence of NOx (Claeys et al., 2007; Szmigielskiet al., 2007). 3-HGA was the most abundant species amongtheα/β-pinene oxidation products.
β−Caryophyllinic acid (XXXVI), an ozonolysis or photo-oxidation product ofβ-caryophyllene (Jaoui et al., 2007),was identified at both winter and summer samples withoutany significant differences (Table 1). However, relativelyhigher levels ofβ-caryophyllinic acid were observed duringlate winter (Fig. 15q) when the air masses were originatedfrom Southeast Asia and transported over the Bay of Ben-gal (Pavuluri et al., 2010), indicating that Southeast Asia is astrong “emitter” ofβ-caryophyllene.
Most of the biogenic SOA tracers gave diurnal trendswith higher concentrations at daytime (Fig. 15), suggest-ing a photochemical production of these compounds. Thispattern is different from those of biomass burning tracers(e.g., levoglucosan) and other anthropogenic organics suchas hopanes and PAHs. The nighttime maxima of these or-ganic compounds are mainly associated with the land/seabreeze circulation in Chennai. The temporal pattern of2-methylglyceric acid (Fig. 15h) was similar to those of2-methyltetrols (Fig. 15i) and C5-alkene triols (Fig. 15j).In addition, a clear diurnal variation can be found for 2-methylglyceric acid during summer with higher concentra-tions at daytime. In winter, one concentration peak was ob-served during 30 January–1 February (Fig. 15h–j). Such apeak can also be found for other SOA tracers and hydroxy-/polyacids (Fig. 15). The temporal variations ofα/β-pineneoxidation tracers (Fig. 15k–p) were different from those ofisoprene oxidation tracers (Fig. 15h–j). In addition, the tem-poral patterns of pinonic acid and norpinic acid were differ-ent from those of pinic acid, 3-HGA and MBTCA. 3-HGAand MBTCA are later-generation photooxidation products ofα/β-pinene (Hallquist et al., 2009). These two species werewell correlated each other (R2=0.67,n=49). In addition, both3-HGA and MBTCA were well correlated with malic acid(Fig. 6f), indicating a similar formation pathway or similarsource regions. The temporal variations ofβ-caryophyllinicacid (Fig. 15q) showed a clear diurnal pattern with day-time maxima. One concentration peak was observed during30 January–1 February. This pattern was different from thoseof isoprene orα/β-pinene SOA tracers.
Figure 16a shows the temporal trends of the total biogenicSOA tracers detected in the tropical Indian aerosols. In win-ter, α/β-pinene oxidation products were the most abundantspecies, followed by isoprene andβ-caryophyllene oxidationproducts. However in summer, isoprene oxidation productswere found to be the most abundant, followed byα/β-pinene
www.atmos-chem-phys.net/10/2663/2010/ Atmos. Chem. Phys., 10, 2663–2689, 2010

2682 P. Q. Fu et al.: Molecular characterization of urban organic aerosol in tropical India
Table 3. Contribution of individual organic compound classes to OC and WSOC in the aerosols from Chennai, tropical India (%)a.
Compound classWinter Summer
min max average SDb min max average SD
To OC
n-alkanes 0.25 2.39 1.18 0.55 0.50 3.72 1.37 0.91UCM hydrocarbons 1.05 10.6 5.00 2.61 1.89 16.8 5.98 4.17fatty acids 0.58 3.51 2.37 0.72 1.65 6.56 3.54 1.44fatty alcohols 0.17 0.90 0.62 0.14 0.36 0.85 0.57 0.14anhydrosugars 0.04 1.50 0.59 0.40 0.36 0.88 0.59 0.16sugars/sugar alcohols 0.02 0.34 0.10 0.07 0.05 0.28 0.14 0.05lignin products 0.01 0.23 0.12 0.05 0.05 0.11 0.08 0.02terpenoid biomarkers 0.02 0.13 0.06 0.03 0.02 0.05 0.03 0.01sterols 0.02 1.15 0.43 0.39 0.03 0.60 0.18 0.14aromatic acids 0.05 0.55 0.26 0.13 0.20 0.50 0.32 0.10hydroxy-/polyacids 0.02 0.72 0.16 0.15 0.08 0.36 0.20 0.09biogenic SOA tracers 0.01 0.43 0.11 0.10 0.05 0.54 0.24 0.12plasticizers/antioxidants 0.99 7.95 2.97 1.73 2.20 8.39 4.50 1.53hopanes 0.01 0.27 0.14 0.06 0.03 0.06 0.05 0.01PAHs 0.04 0.68 0.37 0.16 0.07 0.27 0.15 0.06diacids and related compoundsc 0.77 7.26 2.98 1.74 0.85 2.87 1.80 0.58
Total Quantified 11.0 24.2 17.5 3.37 13.6 32.8 19.7 5.21
To WSOC
sugars/sugar alcohols 0.08 0.65 0.21 0.12 0.21 0.58 0.30 0.09levoglucosan 0.07 3.49 1.17 0.84 0.70 1.97 1.20 0.39galactosan + mannosan 0.01 0.64 0.23 0.16 0.09 0.29 0.17 0.06hydroxy-/polyacids 0.09 1.03 0.32 0.20 0.28 0.60 0.44 0.11biogenic SOA tracers 0.05 0.62 0.21 0.13 0.24 0.96 0.51 0.16benzoic acid 0.01 0.05 0.02 0.01 0.01 0.04 0.02 0.01phthalic acid 0.01 0.59 0.10 0.12 0.04 0.22 0.09 0.04vanillic acidd 0.001 0.031 0.015 0.009 0.007 0.017 0.011 0.0034-hydroxybenzoic acidd 0.01 0.35 0.16 0.09 0.04 0.12 0.08 0.03diacids and related compoundsc 3.63 11.5 6.37 2.64 2.58 5.91 3.92 0.72
Total Soluble 5.10 13.0 8.80 2.07 5.82 8.44 6.75 0.61
a OC, organic carbon; WSOC, water-soluble organic carbon. All the quantified organic compounds were converted to carbon contents tocalculate the OC and WSOC ratios.b Standard deviation.c Including dicarboxylic acids (C2–C11), ketoacids andα-dicarbonyls that were reported by Pavuluri et al. (2010). Malic acid and phthalicacids were excluded because they have been reported in the present study.d Slightly soluble in water.
and β-caryophyllene oxidation products. The total con-centrations of biogenic SOA tracers were 18.3–107 ng m−3
(average 43.9 ng m−3) in summer versus 2.69–66.9 ng m−3
(16.8 ng m−3) in winter (Table 1). These values are lowerthan those from forested sites (Kourtchev et al., 2008a, b;Wang et al., 2008; Fu et al., 2009c), and urban sites in HongKong (Hu et al., 2008). This suggests that in tropical In-dia, biogenic SOA tracers (e.g., 2-methyltetrols, 3-HGA andMBTCA) may be further oxidized to lower molecular weightcompounds such as oxalic acid under strong sunlight radia-tion, a point warrants future study.
Contributions of isoprene, α/β-pinene and β-caryophyllene oxidation products to OC were examinedto better understand the chemical composition of SOA intropical India. Mean contributions of total SOA tracersto OC in summer (0.24±0.12%) were about twice higherthan those in winter (0.11±0.10%) (Table 3). Fig. 16bshows the temporal contributions of isoprene,α/β-pineneandβ-caryophyllene oxidation products to OC with highertotal percentages in summer when photochemical activityis high. Isoprene andα/β-pinene SOA tracers contributedalmost equally to OC in early winter. In late winter, the
Atmos. Chem. Phys., 10, 2663–2689, 2010 www.atmos-chem-phys.net/10/2663/2010/

P. Q. Fu et al.: Molecular characterization of urban organic aerosol in tropical India 2683
5/22
5/23
5/24
5/25
5/26
5/27
5/28
5/29
5/30
5/31
6/1
Date (local time, 2007)
1/23
1/24
1/25
1/26
1/27
1/28
1/29
1/30
1/31
2/1
2/2
2/3
2/4
2/5
2/6
2/7
Con
cent
ratio
n (n
g m
-3)
0
50
100
150
isoprene SOA tracersα/β-pinene SOA tracers β-caryophyllene SOA tracer
5/22
5/23
5/24
5/25
5/26
5/27
5/28
5/29
5/30
5/31
6/1
Date (local time, 2007)
1/23
1/24
1/25
1/26
1/27
1/28
1/29
1/30
1/31
2/1
2/2
2/3
2/4
2/5
2/6
2/7
0.8
0.6
0.4
0.2
0
Car
bon
% in
OC
(a)
(b)
Early winter Late winter SummerEarly winter Late winter Summer
5/22
5/23
5/24
5/25
5/26
5/27
5/28
5/29
5/30
5/31
6/1
Date (local time, 2007)
1/23
1/24
1/25
1/26
1/27
1/28
1/29
1/30
1/31
2/1
2/2
2/3
2/4
2/5
2/6
2/7
Con
cent
ratio
n (n
g m
-3)
0
50
100
150
isoprene SOA tracersα/β-pinene SOA tracers β-caryophyllene SOA tracer
5/22
5/23
5/24
5/25
5/26
5/27
5/28
5/29
5/30
5/31
6/1
Date (local time, 2007)
1/23
1/24
1/25
1/26
1/27
1/28
1/29
1/30
1/31
2/1
2/2
2/3
2/4
2/5
2/6
2/7
0.8
0.6
0.4
0.2
0
Car
bon
% in
OC
(a)
(b)
5/22
5/23
5/24
5/25
5/26
5/27
5/28
5/29
5/30
5/31
6/1
Date (local time, 2007)
1/23
1/24
1/25
1/26
1/27
1/28
1/29
1/30
1/31
2/1
2/2
2/3
2/4
2/5
2/6
2/7
Con
cent
ratio
n (n
g m
-3)
0
50
100
150
isoprene SOA tracersα/β-pinene SOA tracers β-caryophyllene SOA tracer
5/22
5/23
5/24
5/25
5/26
5/27
5/28
5/29
5/30
5/31
6/1
Date (local time, 2007)
1/23
1/24
1/25
1/26
1/27
1/28
1/29
1/30
1/31
2/1
2/2
2/3
2/4
2/5
2/6
2/7
0.8
0.6
0.4
0.2
0
Car
bon
% in
OC
(a)
(b)
Early winter Late winter SummerEarly winter Late winter Summer
1140
1141
1142
1143
1144
1145
Fig. 16. Temporal variations of (a) the total concentrations of isoprene, α/β-pinene and β-
caryophyllene SOA tracers, and (b) the carbon percentage of biogenic SOA tracers in organic
carbon (OC) in the tropical Indian aerosols.
56
Fig. 16. Temporal variations of(a) the total concentrations of iso-prene,α/β-pinene andβ-caryophyllene SOA tracers, and(b) thecarbon percentage of biogenic SOA tracers in Organic Carbon (OC)in the tropical Indian aerosols.
contribution ofα/β-pinene SOA tracers to OC was found tobe higher than those of isoprene SOA tracers. However insummer, the largest contributor is isoprene SOA tracers. Therelative abundances ofβ-caryophyllene SOA tracer (i.e.,β-caryophyllinic acid) in OC are similar in winter and sum-mer (Fig. 16b), which suggests that there is no significantseasonal difference for the emissions of sesquiterpenes intropical India. However in late winter when the air massesmainly originated from South Asia over the Bay of Bengal tothe city of Chennai, the mean carbon % ofβ-caryophyllinicacid is comparable to those of isoprene SOA tracers.
3.12 Source strengths of organic matter in the urbanaerosols
Based on the above discussion and previously studied emis-sion profiles of organic compounds (Schauer et al., 1996; Si-moneit et al., 2004), organic compound classes quantified inthe Chennai aerosols, including Unresolved Complex Mix-ture (UCM) of branched and cyclic hydrocarbons, can beroughly apportioned to six emission sources and a group ofsecondary oxidation products as follows: (a) plant emissioncharacterized by higher plant waxn-alkanes, HMW fattyacids and fatty alcohols; (b) microbial lipids or marine in-put mainly reflected from LMW fatty acids and fatty alco-hols (<C20); (c) biomass burning characterized by levoglu-cosan and its isomers,β-sitosterol, lignin products and ter-penoid biomarkers; (d) fossil fuel combustion characterizedby petroleum-derivedn-alkanes, UCM, hopanes and PAHs;(e) soil resuspension characterized by primary saccharidesand reduced sugars; (f) plastic emission including phthalates,
Higher plant waxes Microbial/marine sourcesBiomass burning Fossil fuel combustionSoil resuspension PlasticsSecondary oxidation
43%
8.6% 5.9%
17%
4.2%
20%
0.6%
11.2%23.3%
21.3%
7.2%
6.3%
29.9%0.8% 42.8%
15.2% 9.8%
10.0%
6.4%15.5%
0.4%
1.0%
32.7%
4.6%
12.7%
7.1%17.6%
24.4%
(a) Daytime (Winter) (b) Nighttime (Winter)
(c) Daytime (Summer) (d) Nighttime (Summer)
21%
23%11%
7.2%
6.3%
30%0.8%
16%
0.4%
16%
43%
6.4%
10%
9.8%
18%7.1%
13%
4.6%
33% 24%
1.0%
1146
1147
1148
1149
1150
1151
Fig. 17. Source strengths of organic matter in the urban aerosols from Chennai, tropical India.
The sizes of the pie diagrams are proportional to the average ambient OC concentrations
during each period.
57
Fig. 17. Source strengths of organic matter in the urban aerosolsfrom Chennai, tropical India. The sizes of the pie diagrams areproportional to the average ambient OC concentrations during eachperiod.
TBPP, terephthalic acid, 1,3,5-triphenylbenzene and 1,2,4-triphenylbenzene; and (g) secondary oxidation productscharacterized by aromatic acids, hydroxy-/polyacids, bio-genic SOA tracers, and dicarboxylic acids and related com-pounds.
The source strengths are apportioned based on organictracers for selected samples, as shown in Fig. 17. In winter,the most abundant group was fossil fuel combustion prod-ucts (30–43%), followed by secondary oxidation products,plastics and higher plant waxes. During the summer day-time, plastic emission was the most significant source to theorganic aerosols, followed by fossil fuel combustion and sec-ondary oxidation. During the summer nighttime, fossil fuelcombustion was the most important source, followed by plas-tic emission and microbial/marine sources. Secondary ox-idation products are more important at daytime than night-time for both winter and summer seasons. However, theircontributions to OC were higher in winter (23% at day-time versus 16% at nighttime) than summer (18% versus8.6%). The abundant secondary oxidation products in ur-ban aerosols is equivalent to the biomass burning tracers,suggesting that biomass burning may enhance the forma-tion of SOA in winter. Grieshop et al. (2009) reported thatSOA can be efficiently formed from gas-phase precursorsin biomass burning emissions. It should be noted that this
www.atmos-chem-phys.net/10/2663/2010/ Atmos. Chem. Phys., 10, 2663–2689, 2010

2684 P. Q. Fu et al.: Molecular characterization of urban organic aerosol in tropical India
source apportionment approach is useful to roughly estimatethe relative contribution from different emission sources tothe organic aerosols, because some organic species maycome from multiple sources, and thus a potential overlappingproblem cannot be excluded (Simoneit et al., 2004).
3.13 Contributions to OC and WSOC
Contributions of each compound class to OC and WSOCin the samples were examined (Table 3). Sugar com-pounds (including anhydrosugars and sugar alcohols) ac-counted for 0.09–1.67% (0.69%) of OC in winter and 0.40–1.06% (0.73%) of OC in summer. They are lower than thosereported in urban aerosols from Hong Kong (0.3–3.6%, av-erage 1.3%) (Wan and Yu, 2007). Although anhydrosug-ars comprise a similar fraction in OC (average 0.59% inwinter and summer), contributions of other biomass burn-ing tracers such as lignin products, terpenoid biomarkers,and sterols to OC are 2–3 times higher in winter than insummer. This indicates that intensive biomass/biofuel burn-ing can more significantly affect the chemical compositionof organic aerosols in tropical India during winter. In con-trast, summertime samples showed more contributions offatty acids and aromatic acids to OC. This suggests that bothbiological emission and photochemical production are moreimportant in summer than winter. Similarly, plastic-derivedproducts showed higher contribution to OC in summer dueto a fugitive evaporation of plasticizers. UCM hydrocarbonsof fossil fuel combustion origin are found to compose 1.05–10.6% (average 5.00%) of aerosol OC in winter and 1.89–16.8% (5.98%) of OC in summer. These values are higherthan those (1.0–6.6%, average 3.4%) reported in Sapporo,Japan, and are much higher than those (0.37–1.5%, aver-age 0.86%) in Chichi-Jima, a remote island in the westernNorth Pacific (Simoneit et al., 2004). With the considerationof dicarboxylic acids and related compounds (ketoacids andα-dicarbonyls) that were detected in the same sample sets asreported in Pavuluri et al. (2010), the total organics identifiedin the tropical Indian aerosols accounted for 17.5±3.37% ofOC in winter versus 19.7±5.21% in summer with a maxi-mum of 32.8% (Table 3). This indicates that approximatelyone third of organic aerosols studied in the tropical Indianregion can be identified at a molecular level.
The percentage of levoglucosan in WSOC ranged from0.07–3.49% (average 1.17%) in winter versus 0.70–1.97%(1.20%) in summer. These values are comparative to thosereported in Mt. Tai aerosols in Central East China (aver-age 1.50% at daytime versus 1.13% at nighttime) (Fu et al.,2008). The contributions of sugars/sugar alcohols to WSOCwere 0.21±0.12% in winter and 0.30±0.09% in summer.The higher contribution of primary saccharides to WSOCin summer than in winter indicates that atmospheric sugarcompounds may be associated with an enhanced emission ofprimary bioaerosols or soil resuspension in hot season. Bio-genic SOA tracers accounted for 0.51±0.16% of WSOC in
summer, which double those in winter (0.21±0.13%). Thisagain suggests that the photochemical production of SOAis more important in summer than in winter. Total water-soluble organics detected in the Chennai aerosols accountedfor 8.80±2.07% and 6.75±0.61% of WSOC in winter andsummer, respectively. It is of interest to note that the majorspecies contributed to WSOC are small dicarboxylic acids(Table 3), which have been reported as dominant organiccompounds in atmospheric aerosols from different locationsin the world (Kawamura and Ikushima, 1993; Kawamura etal., 1996; Kawamura and Sakaguchi, 1999).
4 Conclusions
Concentrations of total quantified organic compounds, to-gether with UCM hydrocarbons in the tropical Indianaerosols were higher in summer (780–6607 ng m−3, av-erage 2506 ng m−3) than in winter (436–4399 ng m−3,1800 ng m−3). With the consideration of dicarboxylic acidsand related compounds (ketoacids andα-dicarbonyls), thetotal identified organics accounted for 11.0–24.2% (aver-age 17.5%) and 13.6–32.8% (19.7%) of OC in winter andsummer, respectively. Although these values may be un-derestimated due to a potential evaporative loss of semi-volatile compounds, this study suggests that the major por-tion (70–80%) of organic aerosols is still not specified interms of molecular levels, which may include humic-likesubstances, oligmers, organosulfates, organic nitrates, andothers (Kanakidou et al., 2005; Graber and Rudich, 2006;Goldstein and Galbally, 2007; Hallquist et al., 2009).
The abundances of anhydrosugars, lignin products, ter-penoid biomarkers, sterols, hopanes, and PAHs suggest thatboth biomass/biofuel burning and fossil fuel combustion areimportant primary sources of organic aerosols in tropical In-dia. Microbial/marine sources also contribute to primaryorganic aerosols in tropical India, especially in summer.Meanwhile, high abundances of 1,3,5-triphenylbenzene andtris(2,4-di-tert-butyl-phenyl)phosphate, together with pre-vailing concentrations of terephthalic acid at nighttime thandaytime, suggest that the open burning of municipal solidwastes including plastics is also a significant source for pri-mary atmospheric aerosols in this region. These anthro-pogenic particles in South Asia should cause further envi-ronmental concerns. Secondary products derived from theoxidation of biogenic VOCs and other organic precursors,for example, from biomass burning also contribute signifi-cantly to organic aerosols. They consist of isoprene,α/β-pinene andβ-caryophyllene SOA tracers, dicarboxylic acidsand polyacids, aromatic acids, hydroxyacids etc. Such infor-mation may be helpful to better understand the sources andformation processes of atmospheric brown clouds in SouthAsia.
Atmos. Chem. Phys., 10, 2663–2689, 2010 www.atmos-chem-phys.net/10/2663/2010/

P. Q. Fu et al.: Molecular characterization of urban organic aerosol in tropical India 2685
Appendix A: Chemical structures cited in the text 709
COOH
XI. Abietic acid
XXI. 1,3,5-Triphenylbenzene
HO
COOH
IV. 4-Hydroxybenzoic acid
HO
XIV. α-Amyrin
HO
XVI. Cholesterol
VIII. Shonanin
HOOH
OH
OH
XXIV. Erythritol
O
OHHO
OHO
III. Galactosan
O
OHHO
OHO
II. Mannosan
O
OHHO
OHO
I. Levoglucosan VI. VanillinV. Vanillic acid
O
H3CO
HO
OCH3
OH
IX. Dehydroabietic acid
VII. Syringic acid
O
HO OH
O
OH
HOO
HO OH
HOOH
XXV. Sucrose
HO
XVIII. β-Sitosterol
HOXVII. Stigmasterol
P
O
O OO
XX. Tris(2,4-di-tert-butyl-phenyl)phosphate (TBPP)
O CH3
O CH3
O
O
H3C
CH3
XIX. Di-(2-ethylhexyl) phthalate(DEHP)
X. 7-Oxodehydroabietic acid
R
R = H, CH3 - C6H13
XXIII. 17α(H)-Hopanes
COOH
XII. Pimaric acid
COOH
XIII.Iso-pimaric acid
HO
XV. β-Amyrin
XXII. 1,2,4-Triphenylbenzene
COOHCOOH
O
OH
OH
OH
HO
OHOH
HOOH
OH
HOOC COOH
OH
COOHHOOC
COOHO
HOOC
COOH HOOC COOH
COOH
HOOC
HOOC
XXVII. Cis-2-methyl-1,3,4-trihydroxy-1-butene
XXIX. Trans-2-methyl-1,3,4-trihydroxy-1-butene
XXXIII. Norpinic acid
XXXI. 3-Hydroxyglutaric acid
XXXVI. β-Caryophyllinic acidXXXIV. Pinic acid
HOCOOH
OH
XXXV. MBTCA
XXVI. 2-Methylglyceric acid
XXVIII. 3-Methyl-2,3,4-trihydroxy-1-butene
XXX. 2-Methyltetrols
HO
H3CO COOH
HO
H3CO
O
HO
H3CO COOH
OCH3
XXXII. Pinonic acid
HO
OHOH
OH
COOH
XI. Abietic acid
XXI. 1,3,5-Triphenylbenzene
HO
COOH
IV. 4-Hydroxybenzoic acid
HO
XIV. α-Amyrin
HO
XVI. Cholesterol
VIII. Shonanin
HOOH
OH
OH
XXIV. Erythritol
O
OHHO
OHO
III. Galactosan
O
OHHO
OHO
II. Mannosan
O
OHHO
OHO
I. Levoglucosan VI. VanillinV. Vanillic acid
O
H3CO
HO
OCH3
OH
IX. Dehydroabietic acid
VII. Syringic acid
O
HO OH
O
OH
HOO
HO OH
HOOH
XXV. Sucrose
HO
XVIII. β-Sitosterol
HOXVII. Stigmasterol
P
O
O OO
XX. Tris(2,4-di-tert-butyl-phenyl)phosphate (TBPP)
O CH3
O CH3
O
O
H3C
CH3
XIX. Di-(2-ethylhexyl) phthalate(DEHP)
X. 7-Oxodehydroabietic acid
R
R = H, CH3 - C6H13
XXIII. 17α(H)-Hopanes
COOH
XII. Pimaric acid
COOH
XIII.Iso-pimaric acid
HO
XV. β-Amyrin
XXII. 1,2,4-Triphenylbenzene
COOHCOOH
O
OH
OH
OH
HO
OHOH
HOOH
OH
HOOC COOH
OH
COOHHOOC
COOHO
HOOC
COOH HOOC COOH
COOH
HOOC
HOOC
XXVII. Cis-2-methyl-1,3,4-trihydroxy-1-butene
XXIX. Trans-2-methyl-1,3,4-trihydroxy-1-butene
XXXIII. Norpinic acid
XXXI. 3-Hydroxyglutaric acid
XXXVI. β-Caryophyllinic acidXXXIV. Pinic acid
HOCOOH
OH
XXXV. MBTCA
XXVI. 2-Methylglyceric acid
XXVIII. 3-Methyl-2,3,4-trihydroxy-1-butene
XXX. 2-Methyltetrols
HO
H3CO COOH
HO
H3CO
O
HO
H3CO COOH
OCH3
XXXII. Pinonic acid
HO
OHOH
OH
710
711
712
713
714
715
716
Acknowledgements
This study is partly supported by the Japanese Ministry of Education, Culture, Sports, Science
and Technology (MEXT) through grant-in-aid nos. 17340166 and 19204055. P.F. appreciates
the Japan Society for the Promotion of Science (JSPS) for a research fellowship. We also
thank R. A. Damodar and K. Jagannathan for their help during the sample collection.
24
Fig. A1. Chemical structures cited in the text.
www.atmos-chem-phys.net/10/2663/2010/ Atmos. Chem. Phys., 10, 2663–2689, 2010

2686 P. Q. Fu et al.: Molecular characterization of urban organic aerosol in tropical India
Acknowledgements.This study is partly supported by theJapanese Ministry of Education, Culture, Sports, Scienceand Technology (MEXT) through grant-in-aid nos. 17340166and 19204055. P. F. appreciates the Japan Society for the Promo-tion of Science (JSPS) for a research fellowship. We also thankR. A. Damodar and K. Jagannathan for their help during the samplecollection.
Edited by: R. Holzinger
References
Alves, C., Pio, C., and Duarte, A.: Composition of extractable or-ganic matter of air particles from rural and urban Portuguese ar-eas, Atmos. Environ., 35, 5485–5496, 2001.
Andreae, M. O. and Crutzen, P. J.: Atmospheric aerosols: Bio-geochemical sources and role in atmospheric chemistry, Science,276, 1052–1058, 1997.
Andreae, M. O. and Rosenfeld, D.: Aerosol-cloud-precipitationinteractions. Part 1, The nature and sources of cloud-activeaerosols, Earth-Sci. Rev., 89, 13–41, 2008.
Bauer, H., Claeys, M., Vermeylen, R., Schueller, E., Weinke, G.,Berger, A., and Puxbaum, H.: Arabitol and mannitol as tracersfor the quantification of airborne fungal spores, Atmos. Environ.,42, 588–593, 2008.
Bhat, S. and Fraser, M. P.: Primary source attribution and analy-sis of α-pinene photooxidation products in Duke Forest, NorthCarolina, Atmos. Environ., 41, 2958–2966, 2007.
Bieleski, R. L.: Onset of phloem export from senescent petals ofdaylily, Plant Physiol., 109, 557–565, 1995.
Bin Abas, M. R., Simoneit, B. R. T., Elias, V., Cabral, J. A., andCardoso, J. N.: Composition of higher molecular weight organicmatter in smoke aerosol from biomass combustion in Amazonia,Chemosphere, 30, 995–1015, 1995.
Cahill, T. M., Seaman, V. Y., Charles, M. J., Holzinger, R., andGoldstein, A. H.: Secondary organic aerosols formed from ox-idation of biogenic volatile organic compounds in the SierraNevada Mountains of California, J. Geophys. Res.-Atmos., 111,D16312, doi:10.1029/2006JD007178, 2006.
Chowdhury, Z., Zheng, M., Schauer, J. J., Sheesley, R. J.,Salmon, L., Cass, G. R., and Russell, A.: Speciation of ambi-ent fine organic carbon particles and source apportionment ofPM2.5 in Indian cities, J. Geophys. Res.-Atmos., 112, D15303,doi:10.1029/2007JD008386, 2007.
Claeys, M., Graham, B., Vas, G., Wang, W., Vermeylen, R., Pashyn-ska, V., Cafmeyer, J., Guyon, P., Andreae, M. O., Artaxo, P., andMaenhaut, W.: Formation of secondary organic aerosols throughphotooxidation of isoprene, Science, 303, 1173–1176, 2004a.
Claeys, M., Wang, W., Ion, A. C., Kourtchev, I., Gelencser, A.,and Maenhaut, W.: Formation of secondary organic aerosolsfrom isoprene and its gas-phase oxidation products through reac-tion with hydrogen peroxide, Atmos. Environ., 38, 4093–4098,2004b.
Claeys, M., Szmigielski, R., Kourtchev, I., van der Veken, P.,Vermeylen, R., Maenhaut, W., Jaoui, M., Kleindienst, T. E.,Lewandowski, M., Offenberg, J., and Edney, E. O.: Hydroxydi-carboxylic acids: Markers for secondary organic aerosol from thephotooxidation ofα-pinene, Environ. Sci. Technol., 41, 1628–1634, 2007.
Crutzen, P. J. and Andreae, M. O.: Biomass burning in the trop-ics: Impact on atmospheric chemistry and biogeochemical cy-cles, Science, 250, 1669–1678, 1990.
de Gouw, J. and Jimenez, J. L.: Organic aerosols in the Earth’satmosphere, Environ. Sci. Technol., 43, 7614–7618, 2009.
Duhl, T. R., Helmig, D., and Guenther, A.: Sesquiterpene emissionsfrom vegetation: a review, Biogeosciences, 5, 761–777, 2008,http://www.biogeosciences.net/5/761/2008/.
Forstner, H. J. L., Flagan, R. C., and Seinfeld, J. H.: Secondary or-ganic aerosol from the photooxidation of aromatic hydrocarbons:Molecular composition, Environ. Sci. Technol., 31, 1345–1358,1997.
Fraser, M. P., Cass, G. R., and Simoneit, B. R. T.: Gas-phase andparticle-phase organic compounds emitted from motor vehicletraffic in a Los Angeles roadway tunnel, Environ. Sci. Technol.,32, 2051–2060, 1998.
Fraser, M. P., Cass, G. R., and Simoneit, B. R. T.: Air quality modelevaluation data for organics, 6. C3-C24 organic acids, Environ.Sci. Technol., 37, 446–453, 2003.
Fu, P. Q., Kawamura, K., Okuzawa, K., Aggarwal, S. G., Wang,G., Kanaya, Y., and Wang, Z.: Organic molecular composi-tions and temporal variations of summertime mountain aerosolsover Mt. Tai, North China Plain, J. Geophys. Res.-Atmos., 113,D19107, doi:10.1029/2008JD009900, 2008.
Fu, P. Q., Kawamura, K., and Barrie, L. A.: Photochemical andother sources of organic compounds in the Canadian high Arcticaerosol pollution during winter-spring, Environ. Sci. Technol.,43, 286–292, 2009a.
Fu, P. Q., Kawamura, K., Chen, J., and Barrie, L. A.: Isoprene,monoterpene, and sesquiterpene oxidation products in the highArctic aerosols during late winter to early summer, Environ. Sci.Technol., 43, 4022–4028, 2009b.
Fu, P. Q., Kawamura, K., Pochanart, P., Tanimoto, H., Kanaya,Y., and Wang, Z. F.: Summertime contributions of isoprene,monoterpenes, and sesquiterpene oxidation to the formation ofsecondary organic aerosol in the troposphere over Mt. Tai, Cen-tral East China during MTX2006, Atmos. Chem. Phys. Discuss.,9, 16941–16972, 2009c,http://www.atmos-chem-phys-discuss.net/9/16941/2009/.
Gagosian, R. B., Zafiriou, O. C., Peltzer, E. T., and Alford, J. B.:Lipid in aerosols from the tropical North Pacific: Temporal vari-ability, J. Geophys. Res., 87, 11133–11144, 1982.
Goldstein, A. H. and Galbally, I. E.: Known and unexplored organicconstituents in the Earth’s atmosphere, Environ. Sci. Technol.,41, 1514–1521, 2007.
Graber, E. R. and Rudich, Y.: Atmospheric HULIS: How humic-like are they? A comprehensive and critical review, Atmos.Chem. Phys., 6, 729–753, 2006,http://www.atmos-chem-phys.net/6/729/2006/.
Graham, B., Mayol-Bracero, O. L., Guyon, P., Robert, G. C.,Decesari, S., Facchini, M. C., Artaxo, P., Maenhaut, W. P.K., and Andreae, M. O.: Water-soluble organic compoundsin biomass burning aerosols over Amazonia: 1. Characteriza-tion by NMR and GC-MS, J. Geophys. Res., 107(D20), 8047,doi:8010.1029/2001JD000336, 2002.
Graham, B., Guyon, P., Taylor, P. E., Artaxo, P., Maenhaut, W.,Glovsky, M. M., Flagan, R. C., and Andreae, M. O.: Organiccompounds present in the natural Amazonian aerosol: Character-ization by gas chromatography-mass spectrometry, J. Geophys.
Atmos. Chem. Phys., 10, 2663–2689, 2010 www.atmos-chem-phys.net/10/2663/2010/

P. Q. Fu et al.: Molecular characterization of urban organic aerosol in tropical India 2687
Res.-Atmos., 108(D24), 4766, doi:4710.1029/2003JD003990,2003.
Grieshop, A. P., Logue, J. M., Donahue, N. M., and Robinson, A.L.: Laboratory investigation of photochemical oxidation of or-ganic aerosol from wood fires 1: measurement and simulation oforganic aerosol evolution, Atmos. Chem. Phys., 9, 1263–1277,2009,http://www.atmos-chem-phys.net/9/1263/2009/.
Guenther, A., Karl, T., Harley, P., Wiedinmyer, C., Palmer, P. I.,and Geron, C.: Estimates of global terrestrial isoprene emissionsusing MEGAN (Model of Emissions of Gases and Aerosols fromNature), Atmos. Chem. Phys., 6, 3181–3210, 2006,http://www.atmos-chem-phys.net/6/3181/2006/.
Gustafsson,O., Krusa, M., Zencak, Z., Sheesley, R. J., Granat, L.,Engstrom, E., Praveen, P. S., Rao, P. S. P., Leck, C., and Rodhe,H.: Brown clouds over South Asia: Biomass or fossil fuel com-bustion?, Science, 323, 495–498, 2009.
Hallquist, M., Wenger, J. C., Baltensperger, U., Rudich, Y., Simp-son, D., Claeys, M., Dommen, J., Donahue, N. M., George,C., Goldstein, A. H., Hamilton, J. F., Herrmann, H., Hoff-mann, T., Iinuma, Y., Jang, M., Jenkin, M. E., Jimenez, J. L.,Kiendler-Scharr, A., Maenhaut, W., McFiggans, G., Mentel, Th.F., Monod, A., Prevot, A. S. H., Seinfeld, J. H., Surratt, J. D.,Szmigielski, R., and Wildt, J.: The formation, properties and im-pact of secondary organic aerosol: current and emerging issues,Atmos. Chem. Phys., 9, 5155–5236, 2009,http://www.atmos-chem-phys.net/9/5155/2009/.
Hartz, K. E. H., Tischuk, J. E., Chan, M. N., Chan, C. K., Donahue,N. M., and Pandis, S. N.: Cloud condensation nuclei activationof limited solubility organic aerosol, Atmos. Environ., 40, 605–617, 2006.
Hoffmann, T., Odum, J. R., Bowman, F., Collins, D., Klockow, D.,Flagan, R. C., and Seinfeld, J. H.: Formation of organic aerosolsfrom the oxidation of biogenic hydrocarbons, J. Atmos. Chem.,26, 189–222, 1997.
Hopke, P. K.: Receptor Modeling in Environmental Chemistry,John Wiley & Sons, New York, 1985.
Hu, D., Bian, Q., Li, T. W. Y., Lau, A. K. H., and Yu, J. Z.:Contributions of isoprene, monoterpenes,β-caryophyllene, andtoluene to secondary organic aerosols in Hong Kong duringthe summer of 2006, J. Geophys. Res.-Atmos., 113, D22206,doi:10.1029/2008JD010437, 2008.
Ion, A. C., Vermeylen, R., Kourtchev, I., Cafmeyer, J., Chi, X., Ge-lencser, A., Maenhaut, W., and Claeys, M.: Polar organic com-pounds in rural PM2.5 aerosols from K-puszta, Hungary, duringa 2003 summer field campaign: Sources and diel variations, At-mos. Chem. Phys., 5, 1805–1814, 2005,http://www.atmos-chem-phys.net/5/1805/2005/.
Jaoui, M., Lewandowski, M., Kleindienst, T. E., Offenberg, J. H.,and Edney, E. O.:β-Caryophyllinic acid: An atmospheric tracerfor β-caryophyllene secondary organic aerosol, Geophys. Res.Lett., 34, L05816, doi:10.1029/2006GL028827, 2007.
Kanakidou, M., Seinfeld, J. H., Pandis, S. N., Barnes, I., Dentener,F. J., Facchini, M. C., Van Dingenen, R., Ervens, B., Nenes, A.,Nielsen, C. J., Swietlicki, E., Putaud, J. P., Balkanski, Y., Fuzzi,S., Horth, J., Moortgat, G. K., Winterhalter, R., Myhre, C. E.L., Tsigaridis, K., Vignati, E., Stephanou, E. G., and Wilson, J.:Organic aerosol and global climate modelling: a review, Atmos.Chem. Phys., 5, 1053–1123, 2005,
http://www.atmos-chem-phys.net/5/1053/2005/.Kavouras, I. G., Mihalopoulos, N., and Stephanou, E. G.: For-
mation and gas/particle partitioning of monoterpenes photo-oxidation products over forests, Geophys. Res. Lett., 26, 55–58,1999.
Kawamura, K. and Gagosian, R. B.: Implications ofω-oxocarboxylic acids in the remote marine atmosphere for photo-oxidation of unsaturated fatty acids, Nature, 325, 330–332, 1987.
Kawamura, K. and Kaplan, I. R.: Motor exhaust emissions as aprimary source for dicarboxylic acids in Los Angels ambient air,Environ. Sci. Technol., 21, 105–110, 1987.
Kawamura, K. and Ikushima, K.: Seasonal changes in the distribu-tion of dicarboxylic acids in the urban atmosphere, Environ. Sci.Technol., 27, 2227–2235, 1993.
Kawamura, K., Kosaka, M., and Sempere, R.: Distributions andseasonal changes of hydrocarbons in urban aerosols and rainwa-ters,Chikyukagaku, Geochemistry, 29, 1–15, 1995.
Kawamura, K., Kasukabe, H., and Barrie, L. A.: Source and reac-tion pathways of dicarboxylic acids, ketoacids and dicarbonyls inarctic aerosols: One year of observations, Atmos. Environ., 30,1709–1722, 1996.
Kawamura, K. and Sakaguchi, F.: Molecular distributions of wa-ter soluble dicarboxylic acids in marine aerosols over the Pa-cific Ocean including tropics, J. Geophys. Res.-Atmos., 104(D3),3501–3509, 1999.
Kawamura, K., Steinberg, S., and Kaplan, I. R.: Homologous seriesof C1–C10 monocarboxylic acids and C1–C6 carbonyls in LosAngeles air and motor vehicle exhausts, Atmos. Environ., 34,4175–4191, 2000.
Kawamura, K., Ishimura, Y., and Yamazaki, K.: Four years’ obser-vations of terrestrial lipid class compounds in marine aerosolsfrom the western North Pacific, Global Biogeochem. Cy., 17,1003, doi:1010.1029/2001GB001810, 2003.
Kleindienst, T. E., Jaoui, M., Lewandowski, M., Offenberg, J. H.,Lewis, C. W., Bhave, P. V., and Edney, E. O.: Estimates ofthe contributions of biogenic and anthropogenic hydrocarbons tosecondary organic aerosol at a southeastern US location, Atmos.Environ., 41, 8288–8300, 2007.
Kourtchev, I., Ruuskanen, T. M., Keronen, P., Sogacheva, L., DalMaso, M., Reissell, A., Chi, X., Vermeylen, R., Kulmala, M.,Maenhaut, W., and Claeys, M.: Determination of isoprene andα-/β-pinene oxidation products in boreal forest aerosols fromHyytiala, Finland: diel variations and possible link with particleformation events, Plant Biol., 10, 138–149, 2008a.
Kourtchev, I., Warnke, J., Maenhaut, W., Hoffmann, T., and Claeys,M.: Polar organic marker compounds in PM2.5 aerosol from amixed forest site in western Germany, Chemosphere, 73, 1308–1314, 2008b.
Lelieveld, J., Crutzen, P. J., Ramanathan, V., Andreae, M. O., Bren-ninkmeijer, C. A. M., Campos, T., Cass, G. R., Dickerson, R. R.,Fischer, H., de Gouw, J. A., Hansel, A., Jefferson, A., Kley, D.,de Laat, A. T. J., Lal, S., Lawrence, M. G., Lobert, J. M., Mayol-Bracero, O. L., Mitra, A. P., Novakov, T., Oltmans, S. J., Prather,K. A., Reiner, T., Rodhe, H., Scheeren, H. A., Sikka, D., andWilliams, J.: The Indian Ocean Experiment: Widespread air pol-lution from South and Southeast Asia, Science, 291, 1031–1036,2001.
Matsunaga, S., Kawamura, K., Nakatsuka, T., and Ohkouchi, N.:Preliminary study on laboratory photochemical formation of low
www.atmos-chem-phys.net/10/2663/2010/ Atmos. Chem. Phys., 10, 2663–2689, 2010

2688 P. Q. Fu et al.: Molecular characterization of urban organic aerosol in tropical India
molecular weight dicarboxylic acids from unsaturated fatty acid(oleic acid), Res. Org. Geochem., 14, 19–25, 1999.
Medeiros, P. M., Conte, M. H., Weber, J. C., and Simoneit, B.R. T.: Sugars as source indicators of biogenic organic carbonin aerosols collected above the Howland Experimental Forest,Maine, Atmos. Environ., 40, 1694–1705, 2006.
Medeiros, P. M. and Simoneit, B. R. T.: Source profiles of or-ganic compounds emitted upon combustion of green vegetationfrom temperate climate forests, Environ. Sci. Technol., 42, 8310–8316, 2008.
Mochida, M., Kitamori, Y., Kawamura, K., Nojiri, Y., and Suzuki,K.: Fatty acids in the marine atmosphere: Factors govern-ing their concentrations and evaluation of organic films onsea-salt particles, J. Geophys. Res.-Atmos., 107(D17), 4325,doi:4310.1029/2001JD001278, 2002.
Mochida, M., Kawabata, A., Kawamura, K., Hatsushika, H.,and Yamazaki, K.: Seasonal variation and origins of di-carboxylic acids in the marine atmosphere over the west-ern North Pacific, J. Geophys. Res.-Atmos., 108(D6), 4193,doi:4110.1029/2002JD002355, 2003.
Nakajima, H., Okada, K., Kuroki, Y., Nakama, Y., Handa, D.,Arakaki, T., and Tanahara, A.: Photochemical formation of per-oxides and fluorescence characteristics of the water-soluble frac-tion of bulk aerosols collected in Okinawa, Japan, Atmos. Envi-ron., 42, 3046–3058, 2008.
Nolte, C. G., Schauer, J. J., Cass, G. R., and Simoneit, B. R. T.:Highly polar organic compounds present in wood smoke and inthe ambient atmosphere, Environ. Sci. Technol., 35, 1912–1919,2001.
Oros, D. R. and Simoneit, B. R. T.: Identification and emission fac-tors of molecular tracers in organic aerosols from biomass burn-ing Part 2, Deciduous trees, Appl. Geochem., 16, 1545–1565,2001.
Poschl, U.: Atmospheric aerosols: Composition, transformation,climate and health effects, Angew. Chem. Int. Edit., 44, 7520–7540, 2005.
Pavuluri, C. M., Kawamura, K., and Swaminathan, T.: Water-soluble organic carbon, dicarboxylic acids, ketoacids andα-dicarbonyls in the tropical Indian aerosols, J. Geophys. Res.-Atmos., 115, doi:10.1029/2009JD012661, in press, 2010.
Plewka, A., Gnauk, T., Bruggemann, E., and Herrmann, H.: Bio-genic contributions to the chemical composition of airborne par-ticles in a coniferous forest in Germany, Atmos. Environ., 40,S103–S115, 2006.
Ramanathan, V., Chung, C., Kim, D., Bettge, T., Buja, L., Kiehl,J. T., Washington, W. M., Fu, Q., Sikka, D. R., and Wild, M.:Atmospheric brown clouds: Impacts on South Asia climate andhydrological cycle, P. Natl. Acad. Sci., 102, 5326–5333, 2005.
Robinson, A. L., Donahue, N. M., and Rogge, W. F.: Photochem-ical oxidation and changes in molecular composition of organicaerosol in the regional context, J. Geophys. Res.-Atmos., 111,D03302, doi:10.1029/2005JD006265, 2006.
Robinson, A. L., Donahue, N. M., Shrivastava, M. K., Weitkamp,E. A., Sage, A. M., Grieshop, A. P., Lane, T. E., Pierce, J. R., andPandis, S. N.: Rethinking organic aerosols: Semivolatile emis-sions and photochemical aging, Science, 315, 1259–1262, 2007.
Rogge, W. F., Hildemann, L. M., Mazurek, M. A., Cass, G. R.,and Simoneit, B. R. T.: Source of fine organic aerosols: 1. Char-broilers and meat cooking operations, Environ. Sci. Technol., 25,
1112–1125, 1991.Rogge, W. F., Hildemann, L. M., Mazurek, M. A., Cass, G. R., and
Simoneit, B. R. T.: Sources of fine organic aerosol, 2. Noncat-alyst and catalyst-equipped automobiles and heavy-duty dieseltrucks, Environ. Sci. Technol., 27, 636–651, 1993.
Rogge, W. F., Hildemann, L. M., Mazurek, M. A., Cass, G. R., andSimoneit, B. R. T.: Mathematical modeling of atmospheric fineparticle-associated primary organic compound concentrations, J.Geophys. Res.-Atmos., 101(D14), 19379–19394, 1996.
Rudich, Y., Donahue, N. M., and Mentel, T. F.: Aging of organicaerosol: Bridging the gap between laboratory and field studies,Annu. Rev. Phys. Chem., 58, 321–352, 2007.
Schauer, J. J., Rogge, W. F., Hildemann, L. M., Mazurek, M. A.,and Cass, G. R.: Source apportionment of airborne particulatematter using organic compounds as tracers, Atmos. Environ., 30,3837–3855, 1996.
Schauer, J. J., Kleeman, M. J., Cass, G. R., and Simoneit, B.R. T.: Measurement of emissions from air pollution sources,2. C1 through C30 organic compounds from medium duty dieseltrucks, Environ. Sci. Technol., 33, 1578–1587, 1999.
Schauer, J. J., Kleeman, M. J., Cass, G. R., and Simoneit, B. R. T.:Measurement of emissions from air pollution sources, 3. C1-C29organic compounds from fireplace combustion of wood, Environ.Sci. Technol., 35, 1716–1728, 2001.
Schauer, J. J., Kleeman, M. J., Cass, G. R., and Simoneit, B. R.T.: Measurement of emissions from air pollution sources, 5. C1-C32 organic compounds from gasoline-powered motor vehicles,Environ. Sci. Technol., 36, 1169–1180, 2002.
Seinfeld, J. H.: Black carbon and brown clouds, Nat. Geosci., 1,15–16, 2008.
Sheesley, R. J., Schauer, J. J., Chowdhury, Z., Cass, G.R., and Simoneit, B. R. T.: Characterization of organicaerosols emitted from the combustion of biomass indigenousto South Asia, J. Geophys. Res.-Atmos., 108(D9), 4285,doi:10.1029/2002JD002981, 2003.
Sidhu, S., Gullett, B., Striebich, R., Klosterman, J., Contreras, J.,and DeVito, M.: Endocrine disrupting chemical emissions fromcombustion sources: diesel particulate emissions and domesticwaste open burn emissions, Atmos. Environ., 39, 801–811, 2005.
Simoneit, B. R. T., Cardoso, J. N., and Robinson, N.: An assess-ment of the origin and composition of higher molecular-weightorganic-matter in aerosols over Amazonia, Chemosphere, 21,1285–1301, 1990.
Simoneit, B. R. T., Sheng, G. Y., Chen, X. J., Fu, J. M., Zhang, J.,and Xu, Y. P.: Molecular marker study of extractable organic-matter in aerosols from urban areas of China, Atmos. Environ.,25, 2111–2129, 1991.
Simoneit, B. R. T. and Elias, V. O.: Organic tracers from biomassburning in atmospheric particulate matter over the ocean, Mar.Chem., 69, 301–312, 2000.
Simoneit, B. R. T.: Biomass burning-a review of organic tracers forsmoke from incomplete combustion, Appl. Geochem., 17, 129–162, 2002.
Simoneit, B. R. T., Kobayashi, M., Mochida, M., Kawamura, K.,Lee, M., Lim, H. J., Turpin, B. J., and Komazaki, Y.: Composi-tion and major sources of organic compounds of aerosol particu-late matter sampled during the ACE-Asia campaign, J. Geophys.Res.-Atmos., 109, D19S10, doi:10.1029/2004JD004598, 2004.
Atmos. Chem. Phys., 10, 2663–2689, 2010 www.atmos-chem-phys.net/10/2663/2010/

P. Q. Fu et al.: Molecular characterization of urban organic aerosol in tropical India 2689
Simoneit, B. R. T., Medeiros, P. M., and Didyk, B. M.: Combus-tion products of plastics as indicators for refuse burning in theatmosphere, Environ. Sci. Technol., 39, 6961–6970, 2005.
Stohl, A., Berg, T., Burkhart, J. F., Fjæraa, A. M., Forster, C., Her-ber, A., Hov, Ø., Lunder, C., McMillan, W. W., Oltmans, S.,Shiobara, M., Simpson, D., Solberg, S., Stebel, K., Strom, J.,Tørseth, K., Treffeisen, R., Virkkunen, K., and Yttri, K. E.: Arc-tic smoke - record high air pollution levels in the European Arcticdue to agricultural fires in Eastern Europe in spring 2006, Atmos.Chem. Phys., 7, 511–534, 2007,http://www.atmos-chem-phys.net/7/511/2007/.
Stone, E. A., Lough, G. C., Schauer, J. J., Praveen, P. S., Cor-rigan, C. E., and Ramanathan, V.: Understanding the ori-gin of black carbon in the atmospheric brown cloud overthe Indian Ocean, J. Geophys. Res.-Atmos., 122, D22S23,doi:10.1029/2006JD008118, 2007.
Suh, I., Zhang, R., Molina, L. T., and Molina, M. J.: Oxidationmechanism of aromatic peroxy and bicyclic radicals from OH-toluene reactions, J. Am. Chem. Soc., 125, 12655–12665, 2003.
Surratt, J. D., Murphy, S. M., Kroll, J. H., Ng, N. L., Hildebrandt,L., Sorooshian, A., Szmigielski, R., Vermeylen, R., Maenhaut,W., Claeys, M., Flagan, R. C., and Seinfeld, J. H.: Chemi-cal composition of secondary organic aerosol formed from thephotooxidation of isoprene, J. Phys. Chem. A, 110, 9665–9690,2006.
Szidat, S.: Sources of Asian Haze, Science, 323, 470–471, 2009.Szmigielski, R., Surrat, J. D., Gonzalez, G., Van der Veken, P.,
Kourtchev, I., Vermeylen, R., Blockhuys, F., Jaoui, M., Klein-dienst, T. E., Lewandowski, M., Offenberg, J. H., Edney, E.O., Seinfeld, J. H., Maenhaut, W., and Claeys, M.: 3-Methyl-1,2,3-butanetricarboxylic acid: An atmospheric tracer for terpenesecondary organic aerosol, Geophys. Res. Lett., 34, L24811,doi:10.1029/2007GL031338, 2007.
van Pinxteren, D. and Herrmann, H.: Determination of function-alised carboxylic acids in atmospheric particles and cloud wa-ter using capillary electrophoresis/mass spectrometry, J. Chro-matogr. A, 1171, 112–123, 2007.
Venkataraman, C., Habib, G., Eiguren-Fernandez, A., Miguel, A.H., and Friedlander, S. K.: Residential biofuels in South Asia:Carbonaceous aerosol emissions and climate impacts, Science,307, 1454–1456, 2005.
Venkatesan, R., Rajendran, M., and Dasgupta, S.: Analysis and nu-merical simulation of the meteorological observations at a trop-ical coastal site Chennai in India, Atmos. Res., 92, 505–521,2009.
Wan, E. C. H. and Yu, J. Z.: Analysis of sugars and sugar polyolsin atmospheric aerosols by chloride attachment in Liquid Chro-matography/Negative Ion Electrospray Mass Spectrometry, Env-iron. Sci. Technol., 41, 2459–2466, 2007.
Wang, G., Kawamura, K., Lee, S., Ho, K. F., and Cao, J. J.: Molec-ular, seasonal, and spatial distributions of organic aerosols fromfourteen Chinese cities, Environ. Sci. Technol., 40, 4619–4625,2006a.
Wang, G., Kawamura, K., and Lee, M.: Comparison of organiccompositions in dust storm and normal aerosol samples collectedat Gosan, Jeju Island, during spring 2005, Atmos. Environ., 43,219–227, 2009.
Wang, H. B., Kawamura, K., and Shooter, D.: Wintertime organicaerosols in Christchurch and Auckland, New Zealand: Contribu-tions of residential wood and coal burning and petroleum utiliza-tion, Environ. Sci. Technol., 40, 5257–5262, 2006b.
Wang, W., Kourtchev, I., Graham, B., Cafmeyer, J., Maenhaut, W.,and Claeys, M.: Characterization of oxygenated derivatives ofisoprene related to 2-methyltetrols in Amazonian aerosols usingtrimethylsilylation and gas chromatography/ion trap mass spec-trometry, Rapid Commun. Mass Sp., 19, 1343–1351, 2005.
Wang, W., Wu, M. H., Li, L., Zhang, T., Liu, X. D., Feng, J. L., Li,H. J., Wang, Y. J., Sheng, G. Y., Claeys, M., and Fu, J. M.: Polarorganic tracers in PM2.5 aerosols from forests in eastern China,Atmos. Chem. Phys., 8, 7507–7518, 2008,http://www.atmos-chem-phys.net/8/7507/2008/.
Wolff, G. T. and Korsog, P. E.: Estimates of the contributions ofsources to inhalable particulate concentrations in Detroit, Atmos.Environ., 19, 1399–1409, 1985.
Yan, B., Zheng, M., Hu, Y. T., Lee, S., Kim, H. K., and Russell,A. G.: Organic composition of carbonaceous aerosols in an agedprescribed fire plume, Atmos. Chem. Phys., 8, 6381–6394, 2008,http://www.atmos-chem-phys.net/8/6381/2008/.
Yassaa, N., Meklati, B. Y., Cecinato, A., and Marino, F.: Organicaerosols in urban and waste landfill of Algiers metropolitan area:Occurrence and sources, Environ. Sci. Technol., 35, 306–311,2001.
Yttri, K. E., Dye, C., and Kiss, G.: Ambient aerosol concentrationsof sugars and sugar-alcohols at four different sites in Norway,Atmos. Chem. Phys., 7, 4267–4279, 2007,http://www.atmos-chem-phys.net/7/4267/2007/.
Yu, J. Z., Cocker, D. R., Griffin, R. J., Flagan, R. C., and Se-infeld, J. H.: Gas-phase ozone oxidation products of monoter-penes: gaseous and particulate products, J. Atmos. Chem., 34,207–258, 1999.
Zhang, R. Y., Suh, I., Zhao, J., Zhang, D., Fortner, E. C., Tie, X.X., Molina, L. T., and Molina, M. J.: Atmospheric new particleformation enhanced by organic acids, Science, 304, 1487–1490,2004.
Zheng, M., Hagler, G. S. W., Ke, L., Bergin, M. H., Wang, F., Louie,P. K. K., Salmon, L., Sin, D. W. M., Yu, J. Z., and Schauer, J.J.: Composition and sources of carbonaceous aerosols at threecontrasting sites in Hong Kong, J. Geophys. Res.-Atmos., 111,D20313, doi:10.1029/2006JD007074, 2006.
www.atmos-chem-phys.net/10/2663/2010/ Atmos. Chem. Phys., 10, 2663–2689, 2010