Embed Size (px)
Citation preview
Molecular Distances Determined with Resonant Vibrational EnergyTransfersHailong Chen,† Xiewen Wen,† Jiebo Li, and Junrong Zheng*
Department of Chemistry, Rice University, 6100 Main Street, Houston, Texas 77005-1892, United States
*S Supporting Information
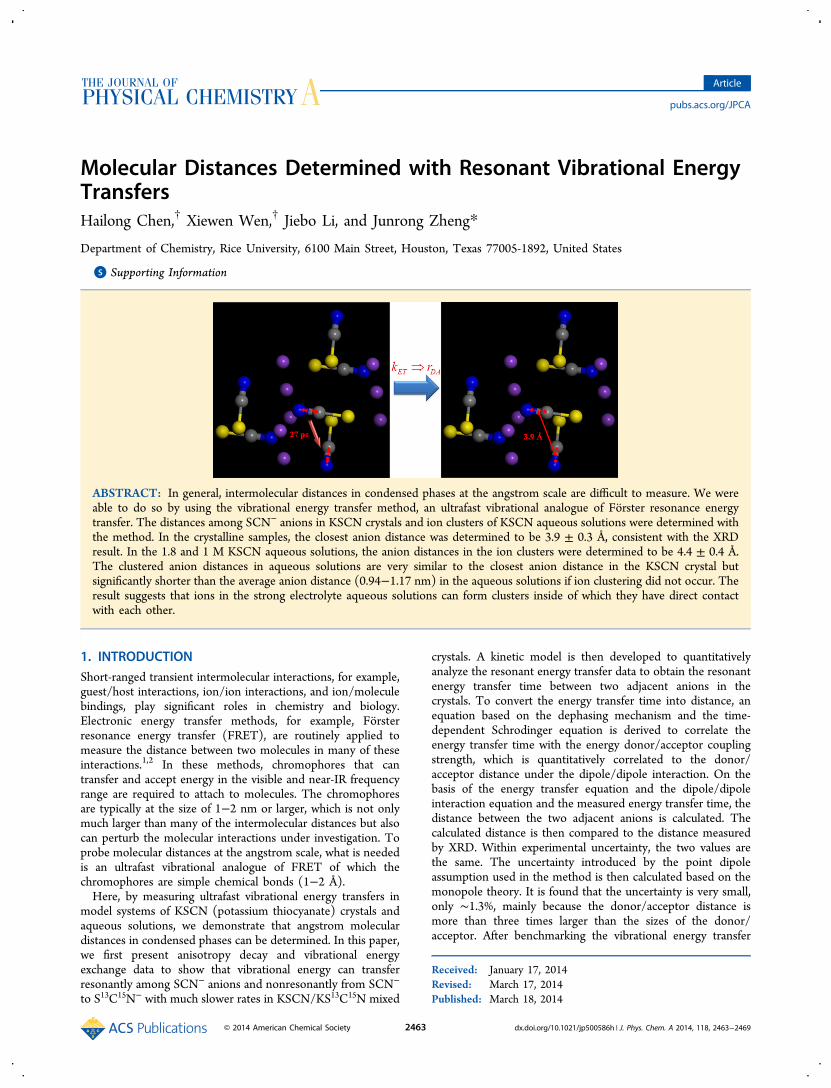
ABSTRACT: In general, intermolecular distances in condensed phases at the angstrom scale are difficult to measure. We wereable to do so by using the vibrational energy transfer method, an ultrafast vibrational analogue of Forster resonance energytransfer. The distances among SCN− anions in KSCN crystals and ion clusters of KSCN aqueous solutions were determined withthe method. In the crystalline samples, the closest anion distance was determined to be 3.9 ± 0.3 Å, consistent with the XRDresult. In the 1.8 and 1 M KSCN aqueous solutions, the anion distances in the ion clusters were determined to be 4.4 ± 0.4 Å.The clustered anion distances in aqueous solutions are very similar to the closest anion distance in the KSCN crystal butsignificantly shorter than the average anion distance (0.94−1.17 nm) in the aqueous solutions if ion clustering did not occur. Theresult suggests that ions in the strong electrolyte aqueous solutions can form clusters inside of which they have direct contactwith each other.
1. INTRODUCTIONShort-ranged transient intermolecular interactions, for example,guest/host interactions, ion/ion interactions, and ion/moleculebindings, play significant roles in chemistry and biology.Electronic energy transfer methods, for example, Forsterresonance energy transfer (FRET), are routinely applied tomeasure the distance between two molecules in many of theseinteractions.1,2 In these methods, chromophores that cantransfer and accept energy in the visible and near-IR frequencyrange are required to attach to molecules. The chromophoresare typically at the size of 1−2 nm or larger, which is not onlymuch larger than many of the intermolecular distances but alsocan perturb the molecular interactions under investigation. Toprobe molecular distances at the angstrom scale, what is neededis an ultrafast vibrational analogue of FRET of which thechromophores are simple chemical bonds (1−2 Å).Here, by measuring ultrafast vibrational energy transfers in
model systems of KSCN (potassium thiocyanate) crystals andaqueous solutions, we demonstrate that angstrom moleculardistances in condensed phases can be determined. In this paper,we first present anisotropy decay and vibrational energyexchange data to show that vibrational energy can transferresonantly among SCN− anions and nonresonantly from SCN−
to S13C15N− with much slower rates in KSCN/KS13C15N mixed
crystals. A kinetic model is then developed to quantitativelyanalyze the resonant energy transfer data to obtain the resonantenergy transfer time between two adjacent anions in thecrystals. To convert the energy transfer time into distance, anequation based on the dephasing mechanism and the time-dependent Schrodinger equation is derived to correlate theenergy transfer time with the energy donor/acceptor couplingstrength, which is quantitatively correlated to the donor/acceptor distance under the dipole/dipole interaction. On thebasis of the energy transfer equation and the dipole/dipoleinteraction equation and the measured energy transfer time, thedistance between the two adjacent anions is calculated. Thecalculated distance is then compared to the distance measuredby XRD. Within experimental uncertainty, the two values arethe same. The uncertainty introduced by the point dipoleassumption used in the method is then calculated based on themonopole theory. It is found that the uncertainty is very small,only ∼1.3%, mainly because the donor/acceptor distance ismore than three times larger than the sizes of the donor/acceptor. After benchmarking the vibrational energy transfer
Received: January 17, 2014Revised: March 17, 2014Published: March 18, 2014
Article
pubs.acs.org/JPCA
© 2014 American Chemical Society 2463 dx.doi.org/10.1021/jp500586h | J. Phys. Chem. A 2014, 118, 2463−2469
method with the crystalline sample, the method is used todetermine the anion distance in the ion clusters of KSCNaqueous solutions. It is found that within experimentaluncertainty, the anion distance in the clusters is the same asthat in the crystal.
2. EXPERIMENTS AND METHODS2.1. Laser System. A ps amplifier and a fs amplifier are
synchronized with the same seed pulse. The ps amplifier pumpsan OPA to produce ∼0.8 ps (vary from 0.7−0.9 ps in differentfrequencies) mid-IR pulses with a bandwidth of 10−35 cm−1 ina tunable frequency range from 400 to 4000 cm−1 with anenergy of 1−40 μJ/pulse (1−10 μJ/pulse for 400−900 cm−1
and >10 μJ/pulse for higher frequencies) at 1 kHz. Light fromthe fs amplifier is used to generate a high-intensity mid-IR andterahertz supercontinuum pulse with a duration of <100 fs inthe frequency range from <10 to >3500 cm−1 at 1 kHz. Innonlinear IR experiments, the ps IR pulse is the excitation beam(the excitation power is adjusted based on need, and theinteraction spot varies from 100 to 500 μm). The super-continuum pulse is the probe beam that is frequency-resolvedby a spectrograph (the resolution is 1−3 cm−1, dependent onthe frequency), yielding the detection axis of a 2D IR spectrum.Two polarizers are added into the detection beam path toselectively measure the parallel or perpendicular polarizedsignal relative to the excitation beam.2.2. Vibrational Energy Transfer Measurements. Vibra-
tional lifetimes are obtained from the rotation-free 1−2transition signal Plife = P|| + 2 × P⊥, where P|| and P⊥ areparallel and perpendicular data, respectively. The time-depend-ent anisotropy values are acquired from r(t) = (P|| − P⊥)/(P|| +2 × P⊥), with the definition of time zero being a pump−probedelay of zero. The resonant energy transfer rate constants andthe molecular rotational time constants in the samples areobtained from the anisotropy measurements. The isotropicdistribution of a sample within the laser focus spot is tested bymeasuring the initial anisotropy values of the sample at differentangles relative to the polarization of the excitation beam.The nonresonant vibrational energy transfers among the
regular KSCN and isotope-labeled KS13C15N and KS13CN aremeasured with the vibrational energy exchange method.3−5 Inthe measurements, the donor vibrational mode, for example,the CN (nitrile) stretch of KSCN is excited to its firstvibrational excited state with an ultrafast IR pulse. The time-dependent decay of this CN first excited-state population isthen monitored in real time with another laser pulse.Simultaneously, the first excited-state population of theacceptor mode, for example, the 13C15N stretch of KS13C15N,is also monitored in real time right after the donor is excited toits first excited state. Simultaneous analyses of the decay of thedonor first excited-state population and the growth and decayof the acceptor first excited-state population according to theenergy transfer kinetic model3−5 quantitatively yield thevibrational energy transfer rate constant from the donor tothe acceptor. Here, the vibrational mode that is excited by thelaser is defined as the “donor”. The mode that is not excited bylaser but can accept energy from the donor is defined as the“acceptor”. Experimentally, we can change the frequencies ofthe laser to selectively excite either the CN or 13C15N stretch sothat both forward and backward energy transfers between thesetwo stretches can be determined. The resonant energy transfersamong the thiocyanate anions are measured with the resonantenergy transfer induced anisotropy decay method.4,6 In these
measurements, the nitrile stretch of one anion, for example,SCN−, is excited to its first excited state. The decay of theanisotropy value of this vibrational excitation signal is thenmonitored in real time. Simultaneous analyses on theanisotropy decays in samples with different mixed KSCN/KS13C15N ratios quantitatively yield both the resonant energytransfer rate constant and the rotational time constant of theanion.
2.3. Samples. Unless specified, chemicals were purchasedfrom Sigma−Aldrich and used without further purification.KS13C15N was purchased from Cambridge Isotope Laboratory.The samples were thin films of polycrystalline KSCN/KS13C15N mixed crystals with different molar ratios blendedwith ∼50 wt % PMMA. The thickness of the sample isestimated to be a few hundred nm based on the CN stretchoptical density. An optical image of a sample is provided inFigure S1 in the Supporting Information (SI). The function ofPMMA was to suppress scattered light. The samples wereplaced in a vacuum chamber during measurements. There arefour reasons to use KSCN and KS13C15N and KS13CN asmodel systems: (1) the vibrational lifetimes of the nitrilestretches are relatively long (longer than 30 ps in D2O solutionsand even longer in the crystals as included in the SI);4 (2) thetransition dipole moments of the nitrile stretches are relativelylarge (0.3−0.4 D);4 (3) the distance between any two anions inthe KSCN crystal is well-characterized with XRD and neutronscattering, which can be used to benchmark the distancedetermined by the vibrational energy transfer method;7 and (4)the phonon dispersion in the KSCN crystal was well-characterized before.8,9
The purpose of using different-isotope-labeled thiocyanateanion mixed samples, for example, a KSCN/KS13C15N mixedcrystal with different molar ratios, is 2-fold, (1) to shift thevibrational frequency of the nitrile stretch as the vibrationalfrequency of the CN stretch is different from that of the 13C15Nstretch and (2) to change the number of resonant energytransfer acceptors in the samples without changing thecrystalline structure or ion cluster structure because the isotopelabeling has negligible effects on the intermolecular interactionbetween two thiocyanate anions that determines their distanceand relative orientation.10
3. RESULTS AND DISCUSSION3.1. Vibrational Energy Transferring among SCN−
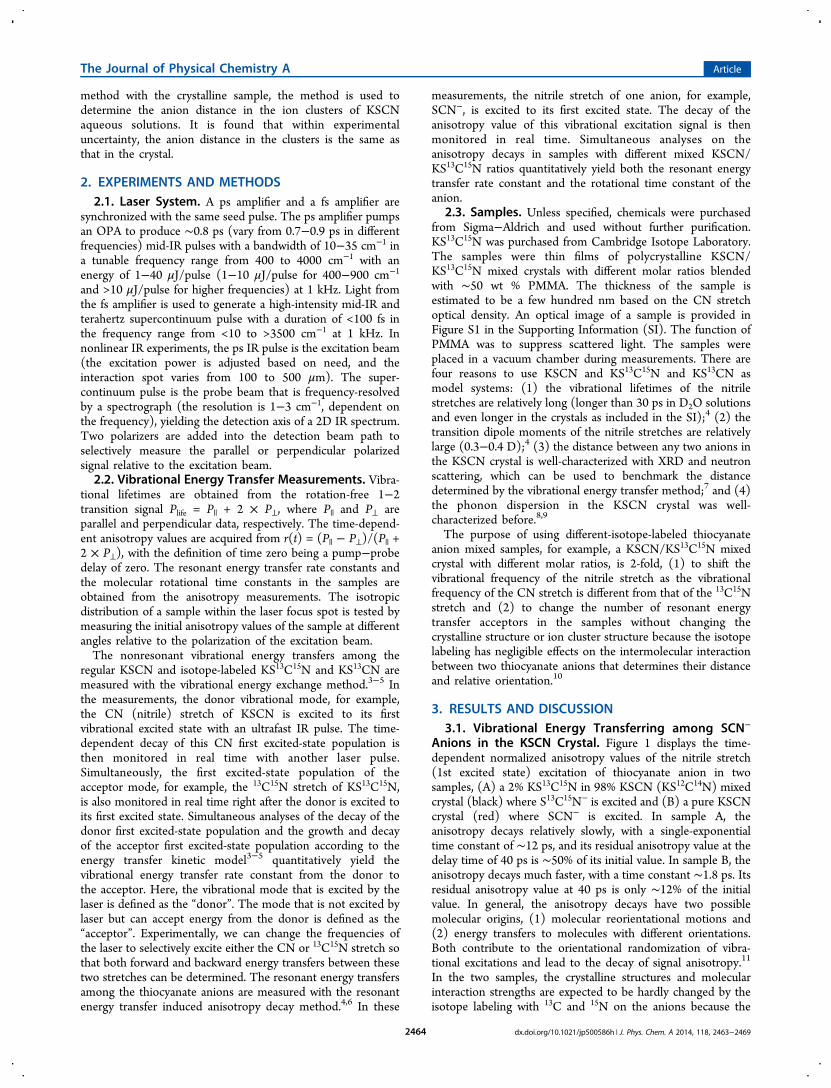
Anions in the KSCN Crystal. Figure 1 displays the time-dependent normalized anisotropy values of the nitrile stretch(1st excited state) excitation of thiocyanate anion in twosamples, (A) a 2% KS13C15N in 98% KSCN (KS12C14N) mixedcrystal (black) where S13C15N− is excited and (B) a pure KSCNcrystal (red) where SCN− is excited. In sample A, theanisotropy decays relatively slowly, with a single-exponentialtime constant of ∼12 ps, and its residual anisotropy value at thedelay time of 40 ps is ∼50% of its initial value. In sample B, theanisotropy decays much faster, with a time constant ∼1.8 ps. Itsresidual anisotropy value at 40 ps is only ∼12% of the initialvalue. In general, the anisotropy decays have two possiblemolecular origins, (1) molecular reorientational motions and(2) energy transfers to molecules with different orientations.Both contribute to the orientational randomization of vibra-tional excitations and lead to the decay of signal anisotropy.11
In the two samples, the crystalline structures and molecularinteraction strengths are expected to be hardly changed by theisotope labeling with 13C and 15N on the anions because the
The Journal of Physical Chemistry A Article
dx.doi.org/10.1021/jp500586h | J. Phys. Chem. A 2014, 118, 2463−24692464
electronic structures of the atoms are expected to be littleaffected by the small changes of the atomic mass of theisotopes10 and thus are essentially the same. Therefore, theanisotropy decays caused by molecular reorientational motions(wobbling) are very similar for the two samples. The observedlarge difference in anisotropy decay rate can only be caused bydifferent energy transfer dynamics in the two samples.In sample A, most of the neighbors of any excited S13C15N−
are SCN− (S12C14N−). In sample B, all neighbors of the excited
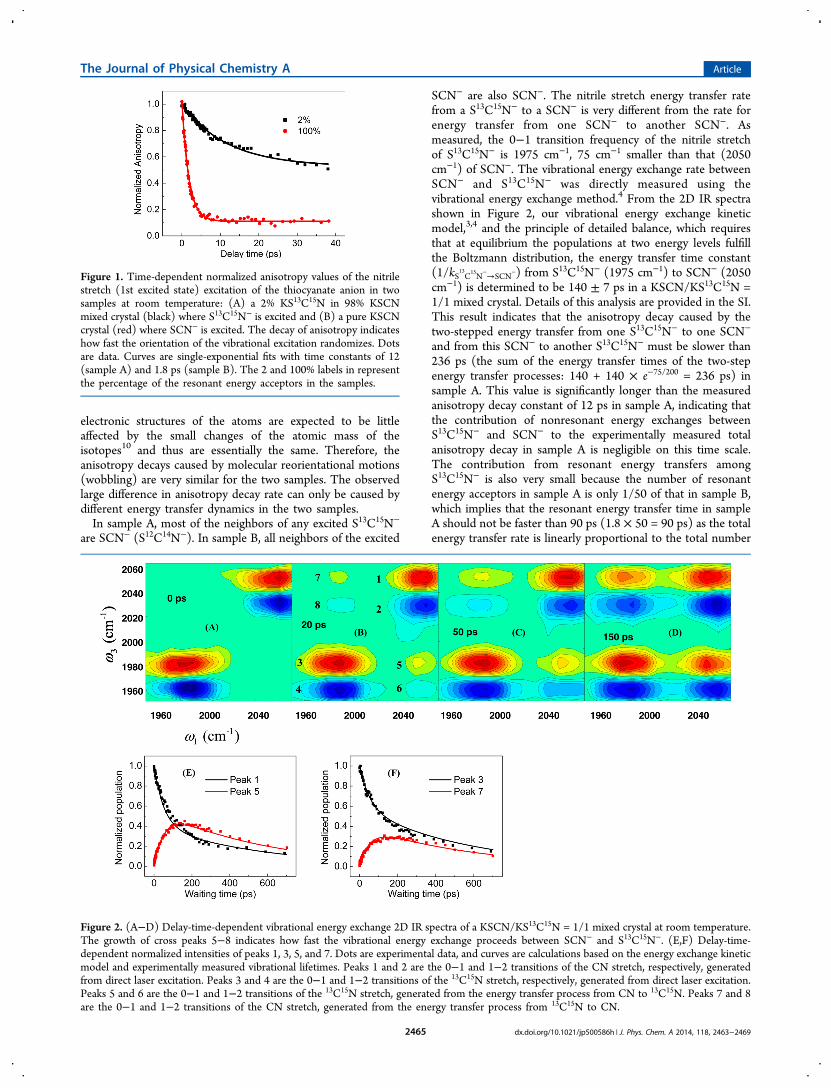
SCN− are also SCN−. The nitrile stretch energy transfer ratefrom a S13C15N− to a SCN− is very different from the rate forenergy transfer from one SCN− to another SCN−. Asmeasured, the 0−1 transition frequency of the nitrile stretchof S13C15N− is 1975 cm−1, 75 cm−1 smaller than that (2050cm−1) of SCN−. The vibrational energy exchange rate betweenSCN− and S13C15N− was directly measured using thevibrational energy exchange method.4 From the 2D IR spectrashown in Figure 2, our vibrational energy exchange kineticmodel,3,4 and the principle of detailed balance, which requiresthat at equilibrium the populations at two energy levels fulfillthe Boltzmann distribution, the energy transfer time constant(1/kS13C15
N−→SCN
−) from S13C15N− (1975 cm−1) to SCN− (2050cm−1) is determined to be 140 ± 7 ps in a KSCN/KS13C15N =1/1 mixed crystal. Details of this analysis are provided in the SI.This result indicates that the anisotropy decay caused by thetwo-stepped energy transfer from one S13C15N− to one SCN−
and from this SCN− to another S13C15N− must be slower than236 ps (the sum of the energy transfer times of the two-stepenergy transfer processes: 140 + 140 × e−75/200 = 236 ps) insample A. This value is significantly longer than the measuredanisotropy decay constant of 12 ps in sample A, indicating thatthe contribution of nonresonant energy exchanges betweenS13C15N− and SCN− to the experimentally measured totalanisotropy decay in sample A is negligible on this time scale.The contribution from resonant energy transfers amongS13C15N− is also very small because the number of resonantenergy acceptors in sample A is only 1/50 of that in sample B,which implies that the resonant energy transfer time in sampleA should not be faster than 90 ps (1.8 × 50 = 90 ps) as the totalenergy transfer rate is linearly proportional to the total number
Figure 1. Time-dependent normalized anisotropy values of the nitrilestretch (1st excited state) excitation of the thiocyanate anion in twosamples at room temperature: (A) a 2% KS13C15N in 98% KSCNmixed crystal (black) where S13C15N− is excited and (B) a pure KSCNcrystal (red) where SCN− is excited. The decay of anisotropy indicateshow fast the orientation of the vibrational excitation randomizes. Dotsare data. Curves are single-exponential fits with time constants of 12(sample A) and 1.8 ps (sample B). The 2 and 100% labels in representthe percentage of the resonant energy acceptors in the samples.
Figure 2. (A−D) Delay-time-dependent vibrational energy exchange 2D IR spectra of a KSCN/KS13C15N = 1/1 mixed crystal at room temperature.The growth of cross peaks 5−8 indicates how fast the vibrational energy exchange proceeds between SCN− and S13C15N−. (E,F) Delay-time-dependent normalized intensities of peaks 1, 3, 5, and 7. Dots are experimental data, and curves are calculations based on the energy exchange kineticmodel and experimentally measured vibrational lifetimes. Peaks 1 and 2 are the 0−1 and 1−2 transitions of the CN stretch, respectively, generatedfrom direct laser excitation. Peaks 3 and 4 are the 0−1 and 1−2 transitions of the 13C15N stretch, respectively, generated from direct laser excitation.Peaks 5 and 6 are the 0−1 and 1−2 transitions of the 13C15N stretch, generated from the energy transfer process from CN to 13C15N. Peaks 7 and 8are the 0−1 and 1−2 transitions of the CN stretch, generated from the energy transfer process from 13C15N to CN.
The Journal of Physical Chemistry A Article
dx.doi.org/10.1021/jp500586h | J. Phys. Chem. A 2014, 118, 2463−24692465
of available resonant energy acceptors. Therefore, the observedinitial anisotropy decay with a time constant of 12 ps in sampleA is mainly from the molecular wobbling motions inside of thecrystal plus a small contribution from vibrational energytransfers. The observed anisotropy decay with a time constantof 1.8 ps in sample B is mainly caused by resonant energytransfers among SCN− anions plus a small contribution frommolecular wobbling.In contrast with the resonant vibrational energy transfer from
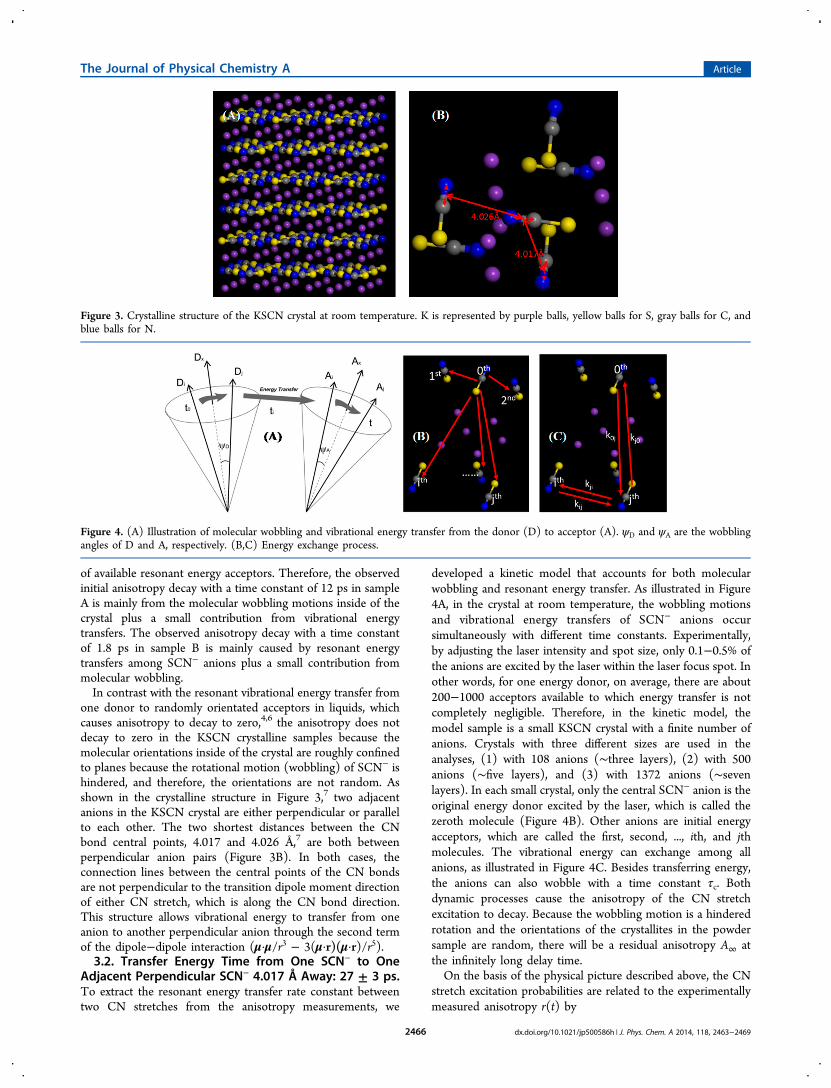
one donor to randomly orientated acceptors in liquids, whichcauses anisotropy to decay to zero,4,6 the anisotropy does notdecay to zero in the KSCN crystalline samples because themolecular orientations inside of the crystal are roughly confinedto planes because the rotational motion (wobbling) of SCN− ishindered, and therefore, the orientations are not random. Asshown in the crystalline structure in Figure 3,7 two adjacentanions in the KSCN crystal are either perpendicular or parallelto each other. The two shortest distances between the CNbond central points, 4.017 and 4.026 Å,7 are both betweenperpendicular anion pairs (Figure 3B). In both cases, theconnection lines between the central points of the CN bondsare not perpendicular to the transition dipole moment directionof either CN stretch, which is along the CN bond direction.This structure allows vibrational energy to transfer from oneanion to another perpendicular anion through the second termof the dipole−dipole interaction (μ·μ/r3 − 3(μ·r)(μ·r)/r5).3.2. Transfer Energy Time from One SCN− to One
Adjacent Perpendicular SCN− 4.017 Å Away: 27 ± 3 ps.To extract the resonant energy transfer rate constant betweentwo CN stretches from the anisotropy measurements, we
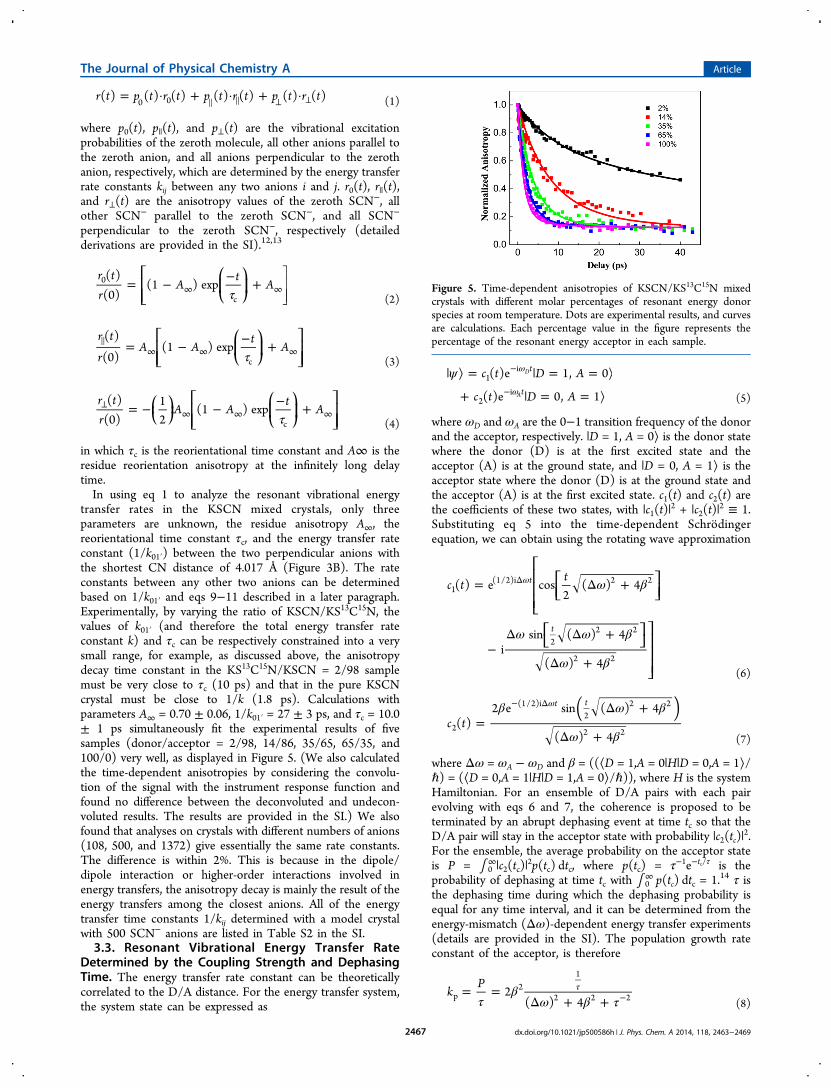
developed a kinetic model that accounts for both molecularwobbling and resonant energy transfer. As illustrated in Figure4A, in the crystal at room temperature, the wobbling motionsand vibrational energy transfers of SCN− anions occursimultaneously with different time constants. Experimentally,by adjusting the laser intensity and spot size, only 0.1−0.5% ofthe anions are excited by the laser within the laser focus spot. Inother words, for one energy donor, on average, there are about200−1000 acceptors available to which energy transfer is notcompletely negligible. Therefore, in the kinetic model, themodel sample is a small KSCN crystal with a finite number ofanions. Crystals with three different sizes are used in theanalyses, (1) with 108 anions (∼three layers), (2) with 500anions (∼five layers), and (3) with 1372 anions (∼sevenlayers). In each small crystal, only the central SCN− anion is theoriginal energy donor excited by the laser, which is called thezeroth molecule (Figure 4B). Other anions are initial energyacceptors, which are called the first, second, ..., ith, and jthmolecules. The vibrational energy can exchange among allanions, as illustrated in Figure 4C. Besides transferring energy,the anions can also wobble with a time constant τc. Bothdynamic processes cause the anisotropy of the CN stretchexcitation to decay. Because the wobbling motion is a hinderedrotation and the orientations of the crystallites in the powdersample are random, there will be a residual anisotropy A∞ atthe infinitely long delay time.On the basis of the physical picture described above, the CN
stretch excitation probabilities are related to the experimentallymeasured anisotropy r(t) by
Figure 3. Crystalline structure of the KSCN crystal at room temperature. K is represented by purple balls, yellow balls for S, gray balls for C, andblue balls for N.
Figure 4. (A) Illustration of molecular wobbling and vibrational energy transfer from the donor (D) to acceptor (A). ψD and ψA are the wobblingangles of D and A, respectively. (B,C) Energy exchange process.
The Journal of Physical Chemistry A Article
dx.doi.org/10.1021/jp500586h | J. Phys. Chem. A 2014, 118, 2463−24692466
= · + · + ·⊥ ⊥r t p t r t p t r t p t r t( ) ( ) ( ) ( ) ( ) ( ) ( )0 0 (1)
where p0(t), p||(t), and p⊥(t) are the vibrational excitationprobabilities of the zeroth molecule, all other anions parallel tothe zeroth anion, and all anions perpendicular to the zerothanion, respectively, which are determined by the energy transferrate constants kij between any two anions i and j. r0(t), r||(t),and r⊥(t) are the anisotropy values of the zeroth SCN−, allother SCN− parallel to the zeroth SCN−, and all SCN−
perpendicular to the zeroth SCN−, respectively (detailedderivations are provided in the SI).12,13
τ= − − +∞ ∞
⎡⎣⎢⎢
⎛⎝⎜
⎞⎠⎟
⎤⎦⎥⎥
r tr
At
A( )(0)
(1 ) exp0
c (2)
τ= − − +∞ ∞ ∞
⎡⎣⎢⎢
⎛⎝⎜
⎞⎠⎟
⎤⎦⎥⎥
r t
rA A
tA
( )
(0)(1 ) exp
c (3)
τ= − − − +⊥
∞ ∞ ∞⎜ ⎟⎛⎝
⎞⎠
⎡⎣⎢⎢
⎛⎝⎜
⎞⎠⎟
⎤⎦⎥⎥
r tr
A At
A( )
(0)12
(1 ) expc (4)
in which τc is the reorientational time constant and A∞ is theresidue reorientation anisotropy at the infinitely long delaytime.In using eq 1 to analyze the resonant vibrational energy
transfer rates in the KSCN mixed crystals, only threeparameters are unknown, the residue anisotropy A∞, thereorientational time constant τc, and the energy transfer rateconstant (1/k01′) between the two perpendicular anions withthe shortest CN distance of 4.017 Å (Figure 3B). The rateconstants between any other two anions can be determinedbased on 1/k01′ and eqs 9−11 described in a later paragraph.Experimentally, by varying the ratio of KSCN/KS13C15N, thevalues of k01′ (and therefore the total energy transfer rateconstant k) and τc can be respectively constrained into a verysmall range, for example, as discussed above, the anisotropydecay time constant in the KS13C15N/KSCN = 2/98 samplemust be very close to τc (10 ps) and that in the pure KSCNcrystal must be close to 1/k (1.8 ps). Calculations withparameters A∞ = 0.70 ± 0.06, 1/k01′ = 27 ± 3 ps, and τc = 10.0± 1 ps simultaneously fit the experimental results of fivesamples (donor/acceptor = 2/98, 14/86, 35/65, 65/35, and100/0) very well, as displayed in Figure 5. (We also calculatedthe time-dependent anisotropies by considering the convolu-tion of the signal with the instrument response function andfound no difference between the deconvoluted and undecon-voluted results. The results are provided in the SI.) We alsofound that analyses on crystals with different numbers of anions(108, 500, and 1372) give essentially the same rate constants.The difference is within 2%. This is because in the dipole/dipole interaction or higher-order interactions involved inenergy transfers, the anisotropy decay is mainly the result of theenergy transfers among the closest anions. All of the energytransfer time constants 1/kij determined with a model crystalwith 500 SCN− anions are listed in Table S2 in the SI.3.3. Resonant Vibrational Energy Transfer Rate
Determined by the Coupling Strength and DephasingTime. The energy transfer rate constant can be theoreticallycorrelated to the D/A distance. For the energy transfer system,the system state can be expressed as
ψ| ⟩ = | = = ⟩
+ | = = ⟩
ω
ω
−
−
c t D A
c t D A
( )e 1, 0
( )e 0, 1
t
t1
i
2i
D
A (5)
where ωD and ωA are the 0−1 transition frequency of the donorand the acceptor, respectively. |D = 1, A = 0⟩ is the donor statewhere the donor (D) is at the first excited state and theacceptor (A) is at the ground state, and |D = 0, A = 1⟩ is theacceptor state where the donor (D) is at the ground state andthe acceptor (A) is at the first excited state. c1(t) and c2(t) arethe coefficients of these two states, with |c1(t)|
2 + |c2(t)|2 ≡ 1.
Substituting eq 5 into the time-dependent Schrodingerequation, we can obtain using the rotating wave approximation
ω β
ω ω β
ω β
= Δ +
−Δ Δ +
Δ +
ωΔ
⎡
⎣⎢⎢⎢
⎡⎣⎢
⎤⎦⎥
⎡⎣ ⎤⎦⎤
⎦⎥⎥⎥
c tt
( ) e cos2
( ) 4
isin ( ) 4
( ) 4
t
t
1(1/2)i 2 2
22 2
2 2
(6)
β ω β
ω β=
Δ +
Δ +
ω− Δ ( )c t( )
2 e sin ( ) 4
( ) 4
t t
2
(1/2)i2
2 2
2 2(7)
where Δω = ωA − ωD and β = ((⟨D = 1,A = 0|H|D = 0,A = 1⟩/ℏ) = (⟨D = 0,A = 1|H|D = 1,A = 0⟩/ℏ)), where H is the systemHamiltonian. For an ensemble of D/A pairs with each pairevolving with eqs 6 and 7, the coherence is proposed to beterminated by an abrupt dephasing event at time tc so that theD/A pair will stay in the acceptor state with probability |c2(tc)|
2.For the ensemble, the average probability on the acceptor stateis P = ∫ 0
∞|c2(tc)|2p(tc) dtc, where p(tc) = τ−1e−tc/τ is the
probability of dephasing at time tc with ∫ 0∞ p(tc) dtc = 1.14 τ is
the dephasing time during which the dephasing probability isequal for any time interval, and it can be determined from theenergy-mismatch (Δω)-dependent energy transfer experiments(details are provided in the SI). The population growth rateconstant of the acceptor, is therefore
τβ
ω β τ= =
Δ + +τ
−kP
2( ) 4p
21
2 2 2(8)
Figure 5. Time-dependent anisotropies of KSCN/KS13C15N mixedcrystals with different molar percentages of resonant energy donorspecies at room temperature. Dots are experimental results, and curvesare calculations. Each percentage value in the figure represents thepercentage of the resonant energy acceptor in each sample.
The Journal of Physical Chemistry A Article
dx.doi.org/10.1021/jp500586h | J. Phys. Chem. A 2014, 118, 2463−24692467
Because the population growth rate constant is the sum ofthe energy transfer rate constant from the donor to theacceptor and acceptor to donor (the derivation is provided inthe SI) and the rate of acceptor to donor is determined bydetailed balance, the observable transfer rate constant from thedonor to the acceptor is
βω β τ
=+
=+ Δ + +ω ω
τΔ Δ −k
k
1 e2
1 e ( ) 4DA kT kTp
/ /2
1
2 2 2
(9)
Equation 9 is for the weak coupling limit. In other words, it isnot suitable to describe coherent energy transfers. If thecoupling is weak, (2β)2 ≪ τ−2 (τ−2 is in energy units), and kDAis proportional to β2, which is proportional to rDA
−6 under thetransition−dipole/transition−dipole interaction mechanism2
βμ μπε
κ=n r1
(4 )D A
DA
24
2 2
02
2
6(10)
where n is the refractive index. The local field correction factorfor the refractive index2 is not used in the analysis because allD/A pairs in the studied systems are separated by other ions(even the closest pair has K+ cations between them). ε0 is thevacuum permittivity. μD and μA are the transition dipolemoments of the donor and acceptor respectively. rDA is thedistance between the donor and acceptor, which is defined asthe distance between the CN center points of two SCN− anionsin the crystals. κ is the orientation factor defined in eq 11
κ κ⟨ ⟩ = ⟨ ⟩⟨ ⟩ + − ⟨ ⟩ + − ⟨ ⟩
+ Θ ⟨ ⟩ − ⟨ ⟩ + Θ ⟨ ⟩ − ⟨ ⟩
d d d d
d d d d
13
(1 )13
(1 )
cos (1 ) cos (1 )
D A D A
D D A A A D
202
2 2
(11)
where κ02 = (sinΘD sinΘA cosΦ − 2 cosΘD cosΘA)
2, ΘD, ΘA,and Φ are the angles defined in Figure S2 (SI), and ⟨dD⟩ = ⟨dA⟩= (A∞)
1/2. Equation 11 is averaged over all wobbling angles.15
(The derivation is provided in the SI.)Equations9−11 thus connect the resonant energy transfer
rate constant kDA with the D/A distance rDA. All parameters inthe equations are experimentally accessible.3.4. Energy Donor/Acceptor Distance Determined to
Be 3.9 ± 0.3 Å from the Transfer Time Constant. Fromboth 1D IR and 2D IR, the transition dipole moment of the CNstretch of SCN− in KSCN crystals was determined to be μD =μA = 0.31 ± 0.03D. From eq 11 and XRD data and thedetermined A∞ = 0.70 ± 0.06, the orientation factor betweenthe two closest SCN− anions is determined to be (⟨κ2⟩)1/2 =0.378. The refractive index is n = 1.5 ± 0.05.16 The dephasingtime is τ = 0.66 ps (8 cm−1, τ = (1/2π)(100/8 × 3) ps). On thebasis of these experimental parameters and the energy transfertime constant 1/kDA = 27 ± 3 ps, the calculation from eqs 9−11gives the energy donor/acceptor distance (taken as the distancebetween the CN central points of the donor and acceptorbecause the CN stretch is mainly localized within the CN bondaccording to DFT calculations) rDA = 3.9 ± 0.3 Å. This value isvery close to the XRD-determined distance of 4.017 Å.3.5. Minor Corrections from High-Order Interactions.
In calculating electronic energy transfers, if the D/A distance iscomparable to the sizes of chromopores, the assumption of thepoint dipole in the dipole/dipole interaction can cause asignificant uncertainty.17 Corrections from higher-order inter-actions are needed to obtain more precise results. An efficient
way to solve this problem is the monopole/monopoleinteraction, which counts for the charge interactions amongindividual atoms.17 In the KSCN crystals studied in this work,the two closest D/A distances are about 4 Å, which is larger butnot significantly larger than the CN bond length (1.1−1.2 Å). Itis conceivable that higher-order interactions could matter. Toaddress this issue, we calculated the coupling constant from themonopole/monopole interaction and found that it is only 1.3%different from that calculated from the dipole/dipoleinteraction, which is the first-order approximation of themonopole/monopole interaction. The calculations show thatthe higher-order interactions play minor roles in the systemsstudied. Detailed calculations are provided in the SI.
3.6. Anion Distances in Ion Clusters in KSCN AqueousSolutions: rDA = 4.4 ± 0.4 Å. Using eqs 9−11 to determineangstrom distances from vibrational energy transfer rateconstants is not limited only to solid samples. The approachis also applicable for liquids. We have determined that in the 1and 1.8 M KSCN aqueous solutions, more than 25% of the ionsform clusters, and on average, the clusters contain three (1 M)and four (1.8 M) SCN− anions.4 The resonant one-donor-to-one-acceptor energy transfer time constants were determinedto be 15 (1 M) and 18 ps (1.8 M), respectively (Figures S6 andS7 in the SI), based on the method introduced previously.4 Thetransfer time in the 1.8 M solution seems slightly slower thanthat in the 1 M solution, but the difference is within theexperimental uncertainty. On the basis of these energy transfertime constants and eqs 9−11, the distances between two SCN−
anions in the clusters in the two solutions are determined to berDA = 4.4 ± 0.4 Å. Calculation details and experimental data areprovided in the SI. The determined clustered anion distancesare significantly shorter than the average anion distance (∼1nm) in the aqueous solutions if ion clustering did not occur butvery close to the four closest anion distances (4.0 Å) in theKSCN crystal. The result suggests that the ions inside of theclusters have direct contact with each other.
4. CONCLUDING REMARKS
The results presented in the work demonstrate the potential ofusing vibrational energy transfers as a ruler to determine bothstatic and transient intermolecular distances at the angstromscale in both liquid and solid samples. The results also showthat ions can form direct-contact ion clusters in relatively dilutestrong electrolyte aqueous solutions. We expect that the studiesof many fundamental problems in various fields will benefitfrom applying the vibrational energy transfer method, forexample, the prenucleation of ions or molecules during thegrowth of crystals and nanomaterials, the formations ofminerals in nature and bioinorganic composites (shells andbones) in living creatures, and the ion/biomolecularinteractions. To achieve the ultimate goal of an “angstrommolecular ruler”, many more studies on more delocalizedsystems with shorter D/A distances and various D/A energymismatches are needed. Advances in laser and detectiontechnology for the fingerprint frequency region below 1000cm−1 are also highly desirable for more sophisticated molecularsystems.
■ ASSOCIATED CONTENT
*S Supporting InformationSupporting figures and data about FTIR, 2D-IR measurements,detailed derivation of equations, and data analyses. This
The Journal of Physical Chemistry A Article
dx.doi.org/10.1021/jp500586h | J. Phys. Chem. A 2014, 118, 2463−24692468
material is available free of charge via the Internet at http://pubs.acs.org.
■ AUTHOR INFORMATION
Corresponding Author*E-mail: [email protected].
Author Contributions†H.C. and X.W. contributed equally to the work.
NotesThe authors declare no competing financial interest.
■ ACKNOWLEDGMENTS
This material is based upon work supported by the Welchfoundation under Award No. C-1752 and AFOSR Award No.FA9550-11-1-0070. J.Z. also thanks the David and LucilePackard Foundation for a Packard fellowship. Insightfuldiscussions with Profs. Robert, F. Curl, Anatoly B. Kolomeisky,David Jonas, Greg Angel, Qiang Shi, and Donghui Zhang areappreciated.
■ REFERENCES(1) Forster, T. Zwischenmolekulare Energiewanderung UndFluoreszenz. Ann. Phys. 1948, 437, 55−75.(2) Scholes, G. D. Long-Range Resonance Energy Transfer inMolecular Systems. Annu. Rev. Phys. Chem. 2003, 54, 57−87.(3) Bian, H. T.; Li, J. B.; Wen, X. W.; Zheng, J. R. Mode-SpecificIntermolecular Vibrational Energy Transfer. I. Phenyl Selenocyanateand Deuterated Chloroform Mixture. J. Chem. Phys. 2010, 132,184505.(4) Bian, H. T.; Wen, X. W.; Li, J. B.; Chen, H. L.; Han, S. Z.; Sun, X.Q.; Song, J. A.; Zhuang, W.; Zheng, J. R. Ion Clustering in AqueousSolutions Probed with Vibrational Energy Transfer. Proc. Natl. Acad.Sci. U.S.A. 2011, 108, 4737−4742.(5) Bian, H.; Chen, H.; Li, J.; Wen, X.; Zheng, J. Nonresonant andResonant Mode-Specific Intermolecular Vibrational Energy Transfersin Electrolyte Aqueous Solutions. J. Phys. Chem. A 2011, 115, 11657−11664.(6) Woutersen, S.; Bakker, H. J. Resonant Intermolecular Transfer ofVibrational Energy in Liquid Water. Nature 1999, 402, 507−509.(7) Akers, C.; Peterson, S. W.; Willett, R. D. A Refinement of CrystalStructure of KSCN. Acta Crystallogr., Sect. B 1968, 24, 1125−1126.(8) Cookson, D.; Finlayson, T.; Elcombe, M. Phonon DispersionRelations for Potassium Thiocyanate. Solid State Commun. 1987, 64,357−359.(9) Cookson, D.; Elcombe, M.; Finlayson, T. Phonon DispersionRelations for Potassium Thiocyanate at and above Room Temper-ature. J. Phys.: Condens. Matter 1992, 4, 7851−7864.(10) Nagy, S. Radiochemistry and Nuclear Chemistry; Eolss PublishersCompany Limited: Oxford, U.K., 2009.(11) Lakowicz, J. Principles of Fluorescence Spectroscopy, 3rd ed.;Springer: New York, 2006.(12) Kinosita, K.; Kawato, S.; Ikegami, A. A Theory of FluorescencePolarization Decay in Membranes. Biophys. J. 1977, 20, 289−305.(13) Lipari, G.; Szabo, A. Effect of Librational Motion onFluorescence Depolarization and Nuclear Magnetic ResonanceRelaxation in Macromolecules and Membranes. Biophys. J. 1980, 30,489−506.(14) Curl, R. F.; Kasper, J. V. V; Pitzer, K. S. Nuclear Spin StateEquilibration through Nonmagnetic Collisions. J. Chem. Phys. 1967,46, 3220−3228.(15) Dale, R. E.; Eisinger, J.; Blumberg, W. The OrientationalFreedom of Molecular Probes. The Orientation Factor in Intra-molecular Energy Transfer. Biophys. J. 1979, 26, 161−193.(16) Savoie, R.; Tremblay, J. Raman Spectra of Crystals Immersed inLiquids. J. Opt. Soc. Am. 1967, 57, 329−332.
(17) Chang, J. C. Monopole Effects on Electronic ExcitationInteractions between Large Molecules. I. Application to EnergyTransfer in Chlorophylls. J. Chem. Phys. 1977, 67, 3901−3909.
The Journal of Physical Chemistry A Article
dx.doi.org/10.1021/jp500586h | J. Phys. Chem. A 2014, 118, 2463−24692469