Embed Size (px)
Citation preview

1
Molecular Interactions
Lecture 4 - QSAR
Jonathan Hirsthttp://comp.chem.nottingham.ac.uk/teaching/F14NMI
Freak-onomics
• Genomics
• Proteomics
• Pharmacogenomics
• Metabolomics

2
Economics
• Genomics
• Proteomics
• Pharmacogenomics
• Metabolomics
• Economics
Salvage F (2002) Chem Br May issue.
Coping with a data explosion
The on switch
must be round
here somewhere!

3
Quantitative Structure-Activity
Relationship
Hammett equation
(1940)
log(KX/KH) = ρσX
property
act
ivit
y
OH
O
R
Hansch equation
log(1/C) =
Σ c0j + c1jσ + c2jπ + c3jπ2+
c4jEs
property
act
ivit
y
prop 2
Quantitative Structure-Activity
Relationship

4
Current activity
• Non-parametric
statistics
• Artificial intelligence
• Machine learning
• Neural networks
• Genetic algorithms
Quantitative Structure-Activity
Relationship
• Regression applied to drugs
),,( 321 Kxxxfy =
how good a
drug is it?
properties of
a molecule
Quantitative Structure-Activity
Relationship

5
A typical QSAR dataset has…
• few observations
– measurements of drugs are expensive
– 10s – 100s
• (too) many variables
– properties of molecules generated in silico
– 100s – 1000s
– 10,000s if you get really carried away
– no silver bullet
A good QSAR
5.35.50.10 21 +−= xxactivity

6
A less-good QSAR
∑ = −+=
NH
j net
jebactivity
11
1α
∑+=i
ii xwwnet 0where
Small datasets
Quantitative Structure-Relationships (QSAR)
“Activity” = f(molecular structure)
Real valued: a regression problem
7
Quantifying molecular structure: 2D
Me
[ ]000101010000000011011
Quantifying molecular structure: 3D
8
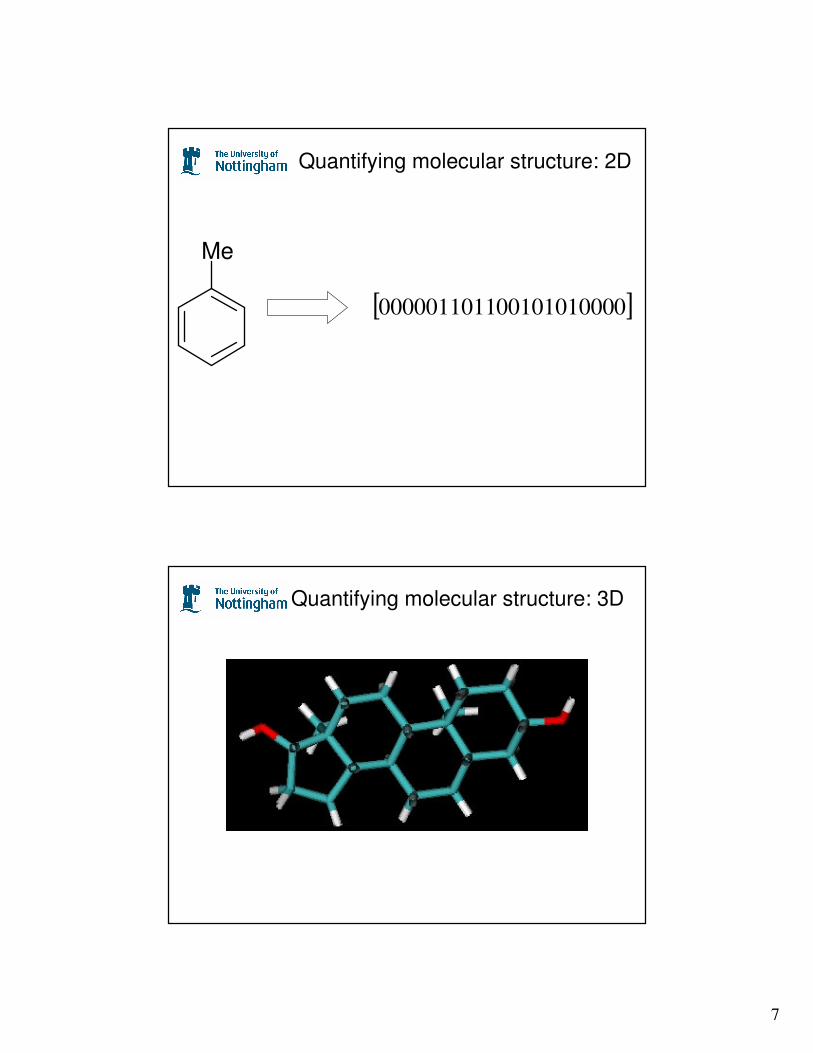
Comparative Molecular Field Analysis (CoMFA)
• Make 3D models of molecules
• Align them
• Sample molecular field values
• Correlate field values with activity
• Electrostatic f(r,charge)
• Steric f(r,bulk)
A field of dreams

9
• Typical number of observations, n = 30-50
• Typical number of variables, p = 1000
p >> n
Solution: use Partial Least Squares (PLS)
Some chemometric nuts and bolts
• Latent variable technique
• Requires a stopping rule
Use cross-validation
• Resistant to collinearities
• Linear
• Sensitive to noise
But it does seem to work

10
Partial Least Squares in brief
• Like Principal Component Analysis (PCA)
• But takes into account the y-variable
PCA
0
2
4
6
8
10
12
14
0 2 4 6 8 10 12
x1
x2

11
After the PCA magic
0
2
4
6
8
10
12
14
0 2 4 6 8 10 12
t1
t2
One slight problem…
0
2
4
6
8
10
12
14
0 2 4 6 8 10 12
t1
t2this is the
important
direction!

12
The PCA way of doing things
• extract orthogonal components
• maximise the variance in X
• use components in multiple linear regression
The PLS way of doing things
• extract orthogonal components.
• maximise the covariance between X and y
• regression is part of the algorithm

13
PLS is a rotation
0
2
4
6
8
10
12
14
0 2 4 6 8 10 12
t1
t2
PLS is interpretable
K+++= 332211 ttty βββ
K+++= 3322111 xwxwxwt
the original variables

14
Fragment-based QSAR
OH
NH
N
O
OH
O
OH
OH
OH
OH
O
OH
OH
OHNH
N
O
OH
O
OH
OH
OH
OH
O
Fragment-based QSAR

15
NH
N
O
OH
O
OH
OH
OH
OH
O
NH
N
OH
O
Fragment-based QSAR
NH
N
O
OH
O
OH
OH
OH
OH
O
0,1,0,0,0,0,0,0,10,5,2,3,1,0,0,0,2,10…

16
How many fragments?
• Size: 4-7 atoms
• 60-400 molecules per dataset
• 1,000 – 20,000 fragments
• PLS derives a predictive model
• error ~0.7 log units
N
N
O
O
O
OH
OH
OH
OH
O
The equation visualised
17
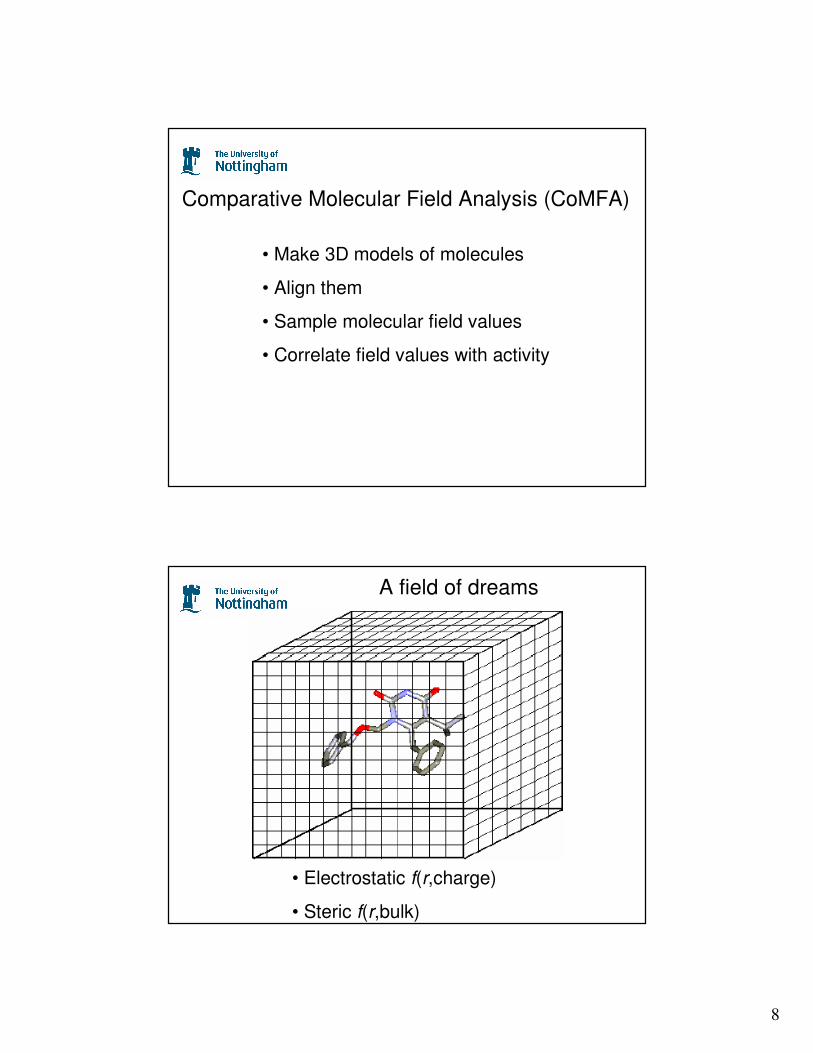
Conclusions
• QSAR datasets: few observations (10s-100s)
• Many variables (100s-10,000s)
• Interpretability favoured
• PLS can do the job
– but not incremental
– memory limitations have been reached
– hierarchical approaches may be the way forward