Embed Size (px)
Citation preview

Yuri E. Nikiforov, MD, PhDDivision of Molecular & Genomic PathologyUniversity of Pittsburgh Medical Center
Molecular Markers for Management of Patients with Thyroid Nodules
and Cancer

Disclosures
• Quest Diagnostics (consultant)• UPMC/CBLPath contract (compensation
from employer)
United States; SEER data
South KoreaThyroid Cancer Incidence and Mortality
Ahn HS et al. NEJM (2014)
Nodules by Palpation
Nodules by Ultrasound or
Autopsy
Cancer
Thyroid Nodule and Cancer

5%
Management of Patients with Thyroid Nodules
FNA
Cancer
FNA cytology
70%
25%Cancer (30%)
Benign
Indeter‐minate
•Cancer risk varies•Repeat FNA?•Observation?•Diagnostic surgery?
Benign (70%)
•Cancer risk high•Thyroidectomy• (+/‐) RAI
•Cancer risk low•Observation

Diagnostic Category Risk Usualof cancer management
I. Nondiagnostic or Unsatisfactory 1‐4% Repeat FNA with US
II. Benign 0‐3% Clinical follow‐up
III. Atypia of Undetermined Significance 5‐15% Repeat FNAor Follicular Lesion of UndeterminedSignificance (AUS/FLUS)
IV. Follicular Neoplasm or Suspicious 15‐30% Surgical lobectomyfor a Follicular Neoplasm (FN/SFN)
V. Suspicious for malignancy 60‐75% Total or lobectomy
VI.Malignant 97‐99% Total thyroidectomy
Baloch ZW et al. Diagn Cytopathol 2008;36:425Cibas ES & Ali SZ. Am J Clin Pathol 2009;132:658
The Bethesda System for Reporting Thyroid Cytopathology

Thyroid cancer incidence and mortality
Cramer JD et al. Surgery. 2010;148:1147
PTC incidence rates by tumor size (1983–2006)
Davies L &Welch HG. JAMA (2006)
Thyroid Cancer Incidence and Mortality in the U.S.
Data are age-adjusted to the 2000 U.S. Census with 95% CI.
Vaccarella S et al. NEJM (2016)
Observed
Expected

Ideal molecular markers should:
• provide accurate cancer diagnosis in nodules with indeterminate cytology
• predict cancer aggressiveness pre-operatively

Proof of the principle
Progress in molecular tests for thyroid nodules/cancer
1990 2000 2005 2015
SINGLE GENE TESTS
GENOMICS TESTS
Proof of principle
Discovery of driver mutations in thyroid cancer
Progress in Thyroid Cancer Genetics and Molecular Markers
20% 30%
70% >90%

Genomic Landscape of PTC
The Cancer Genome Atlas Research Network. Cell 159:676-690 (2014)
74%
15%
9%
Point mutations
Gene fusions
Copy number variations

Thyroid differentiation status in PTC and tumor groups
The Cancer Genome Atlas Research Network. Cell 159:676-690 (2014)
BRAF V600ERAS
fusions

Molecular Markers for Cancer Diagnosis
• Mutational markers• Gene expression (mRNA) markers• miRNA markers
• Circulating TSHR mRNA• Proteomics
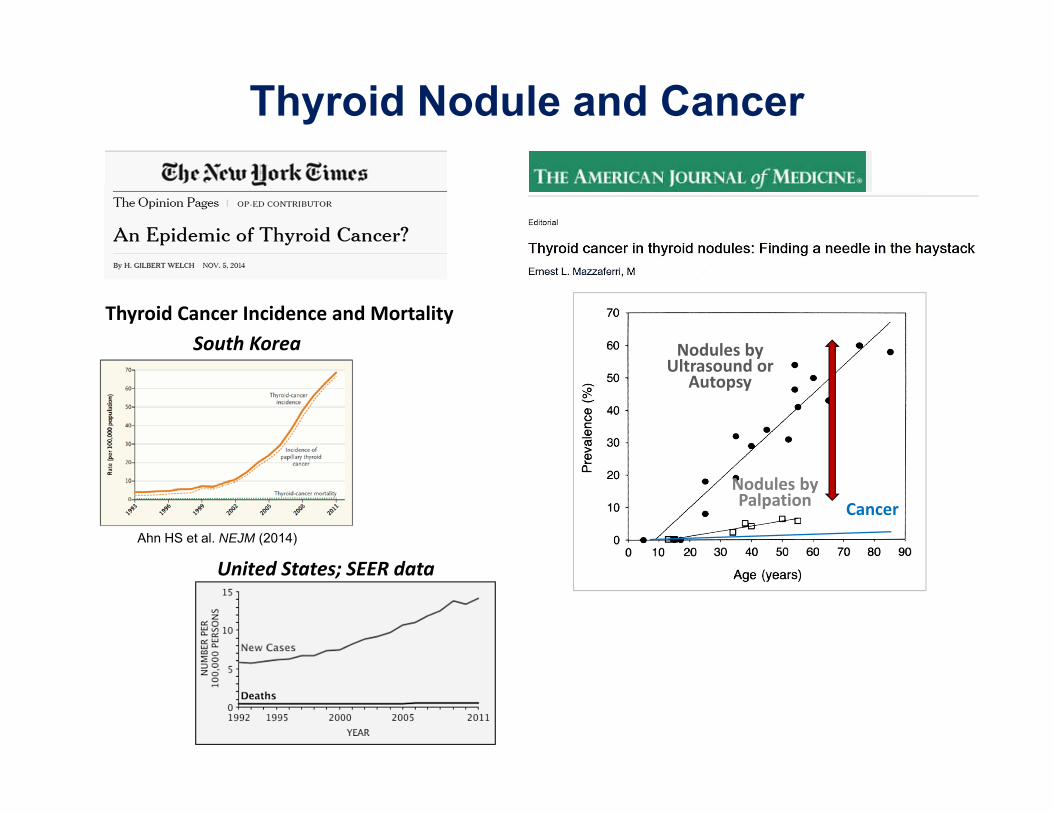
Expansion of Diagnostic Mutational Panels for Thyroid FNA Samples
Small gene
panels
Single gene tests
Large gene
panels
BRAFV600E35-40% 50-65%
Conventional sequencing
NGS
~90%
Conventional sequencing
•Very high PPV• Low NPV
•High PPV• Intermediate NPV
•High PPV•High NPV
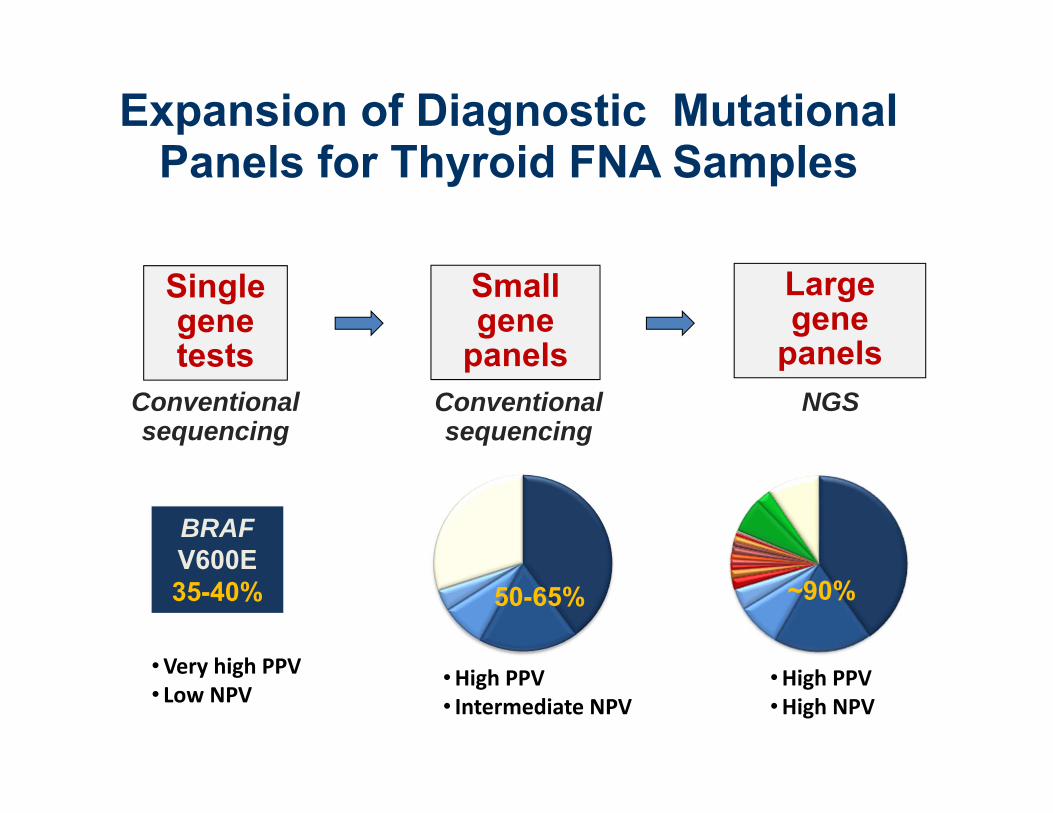
Gene Fusions(mRNA) RETPPARG
NTRK1
NTRK3
BRAF
ALK
Other (proprietary)
Gene Mutations(DNA)BRAF RET
NRAS TSHR
HRAS AKT1
KRAS TP53
PIK3CA GNAS
PTEN CTNNB1
TERT EIF1AX
56‐genes: 14 genes for mutations; 42 fusion types; 16 genes for expression
Gene expression(mRNA)PGK1KRT7TGTTF1NISCalcitonin
PTH
KRT20
Other (proprietary)
– pan-cell marker
Thyroid epithelial cells
– MTC– parathyroid
– metastatic
NGS-Based ThyroSeq® v2 Genomic Classifier
QA
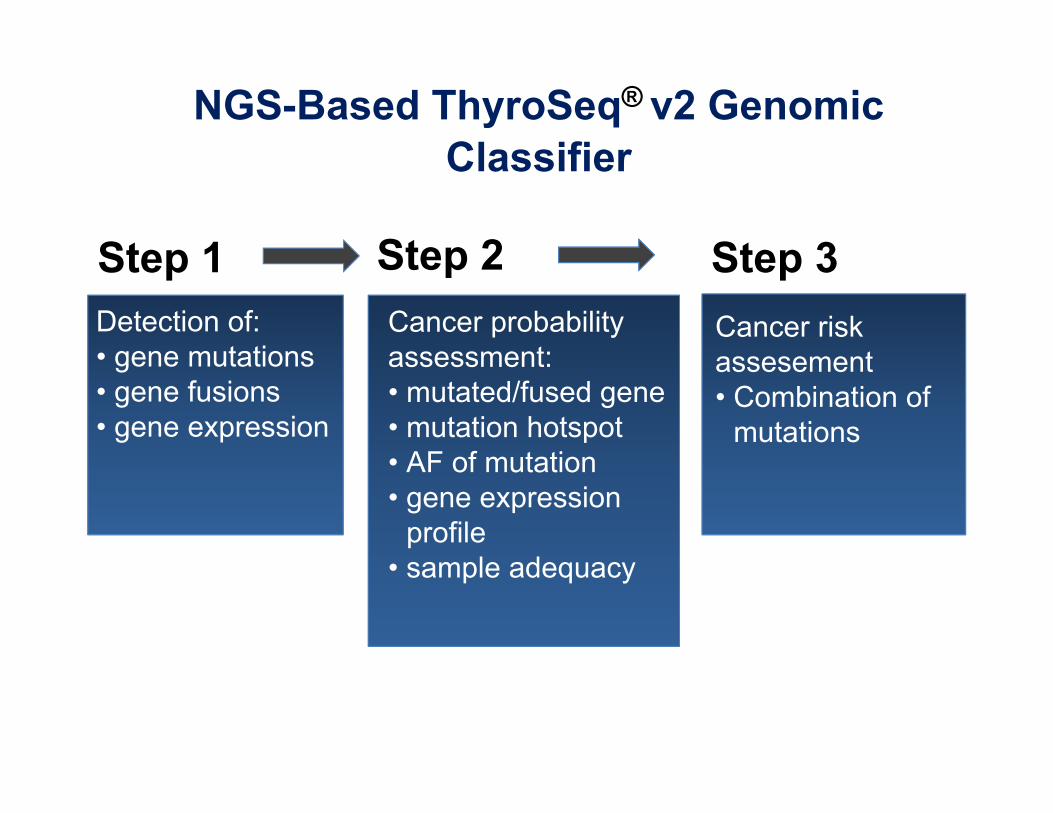
Step 1 Step 2 Step 3Detection of:• gene mutations• gene fusions• gene expression
Cancer probability assessment:• mutated/fused gene• mutation hotspot• AF of mutation• gene expression
profile• sample adequacy
Cancer risk assesement• Combination of
mutations
NGS-Based ThyroSeq® v2 Genomic Classifier

• Patients with FN/SFN (Bethesda IV) cytology and known surgical outcome
• 143 consecutive FNA samples
• Retrospective and prospective arms
• Cancer prevalence – 27.3%
Sensitivity 90% (CI: 80-99%)Specificity 93% (CI: 88-98%)NPV 96% (CI: 92-95%)PPV 83% (CI: 72-95%)
Accuracy 92% (CI: 88-97%)
Nikiforov et al. Cancer 2014,120:3627-34
ThyroSeq performance in Bethesda IV nodules

Sensitivity 91% (CI: 78-100%)Specificity 92% (CI: 86-98%)NPV 97% (CI: 93-100%)PPV 77% (CI: 61-93%)Accuracy 92% (CI: 86-97%)
Nikiforov et al. Thyroid 2015;25:1217-23
• 465 consecutive FNA samples with AUS/FLUS (Bethesda III) cytology
• 96 patients with surgical outcome• Prospectively evaluated • Cancer prevalence – 22.5%
ThyroSeq performance in Bethesda III nodules
High sensitivity/NPV, high specificity/PPV – good “rule out” and “rule in” test

Independent validation of ThyroSeq v2 performance
Toraldo et al. ATA 2016
• 156 nodules with Bethesda III and IV cytology from Boston medical Center• Sensitivity – 95%, specificity – 60%, PPV – 66%, NPV – 94%

N Engl J Med 2012; 367:705-715
Afirma Gene Expression Classifier

Afirma Gene Expression Classifier
Alexander E et al. N Engl J Med (2012)
• Multi-institutional double-blind prospective study of indeterminate cytology FNA samples
• Sample size – 265 FNAs
Cytologicdiagnosis
n Sensitivity Specificity NPV PPV
AUS/FLUS 129 90% 53% 95% 38%
FN/SFN 81 90% 49% 94% 37%
SUSP 55 94% 52% 85% 76%
High sensitivity/NPV, low specificity/PPV – good “rule out” test

Afirma Gene Expression Classifier

ThyroSeq v2 NPV
Afirma NPV
Afirma PPV
ThyroSeq v2 PPV
Nikiforov et al. Thyroid 2015;25:1217-23
Comparison of Afirma and ThyroSeq Test Performance in Bethesda III (AUS) Cytology
ThyroSeq v2
Afirma
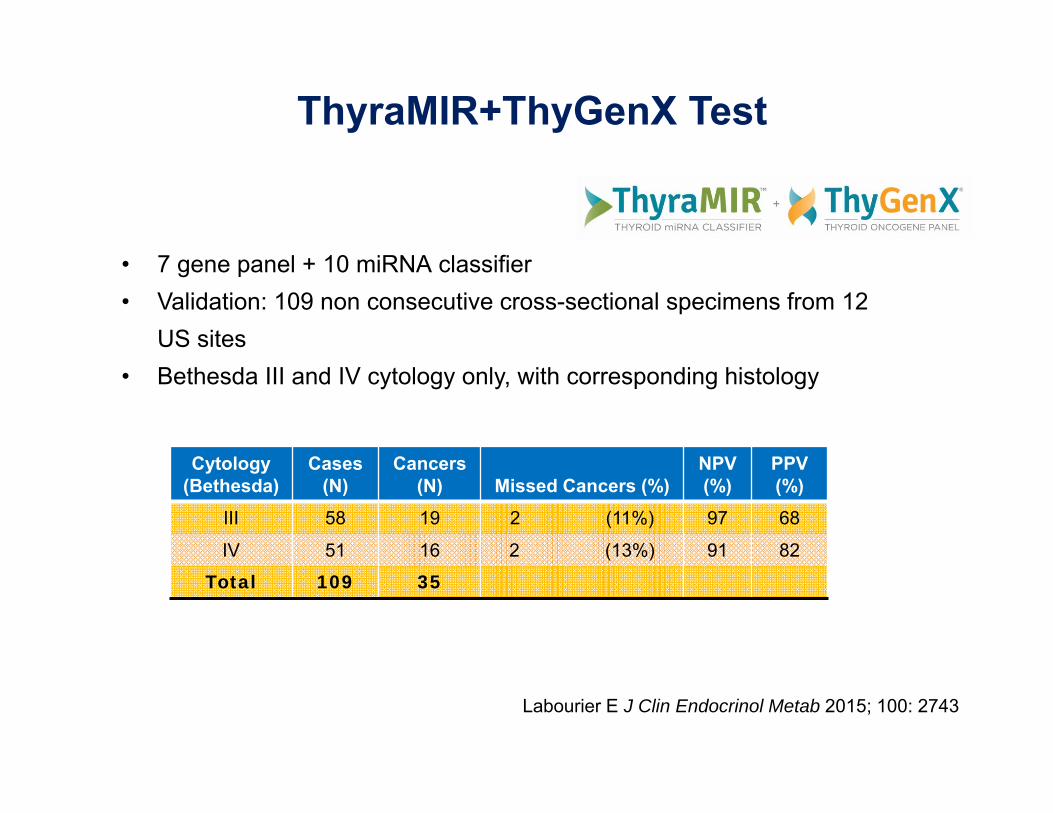
• 7 gene panel + 10 miRNA classifier• Validation: 109 non consecutive cross-sectional specimens from 12
US sites• Bethesda III and IV cytology only, with corresponding histology
Labourier E J Clin Endocrinol Metab 2015; 100: 2743
Cytology(Bethesda)
Cases (N)
Cancers (N) Missed Cancers (%)
NPV (%)
PPV(%)
III 58 19 2 (11%) 97 68
IV 51 16 2 (13%) 91 82Total 109 35
ThyraMIR+ThyGenX Test

Lithwick-Yanai G J Clin Pathol published online 10/2016
Cytology(Bethesda)
Cases (N)
Cancers (N)
Missed Cancers
NPV (%)
PPV(%)
Entire Data Set III+IV 150 31 26% 92 43
“Agreement” Data III+IV 116 14 <1% 100 41
• 24 miRNA Classifier• Training set of 375 FNA specimens• Validation with 201 of which 189 stained microscope slide specimens met RNA
control• No Hurtle cell cancers in validation set• “Agreement” data - 17 of 31 cancers (55%) and 8 of 9 (89%) false negatives
excluded
Rosetta GX Reveal miRNA classifier
Cytology(Bethesda) Cases (N)
Cancers (N) NPV (%)
PPV(%)
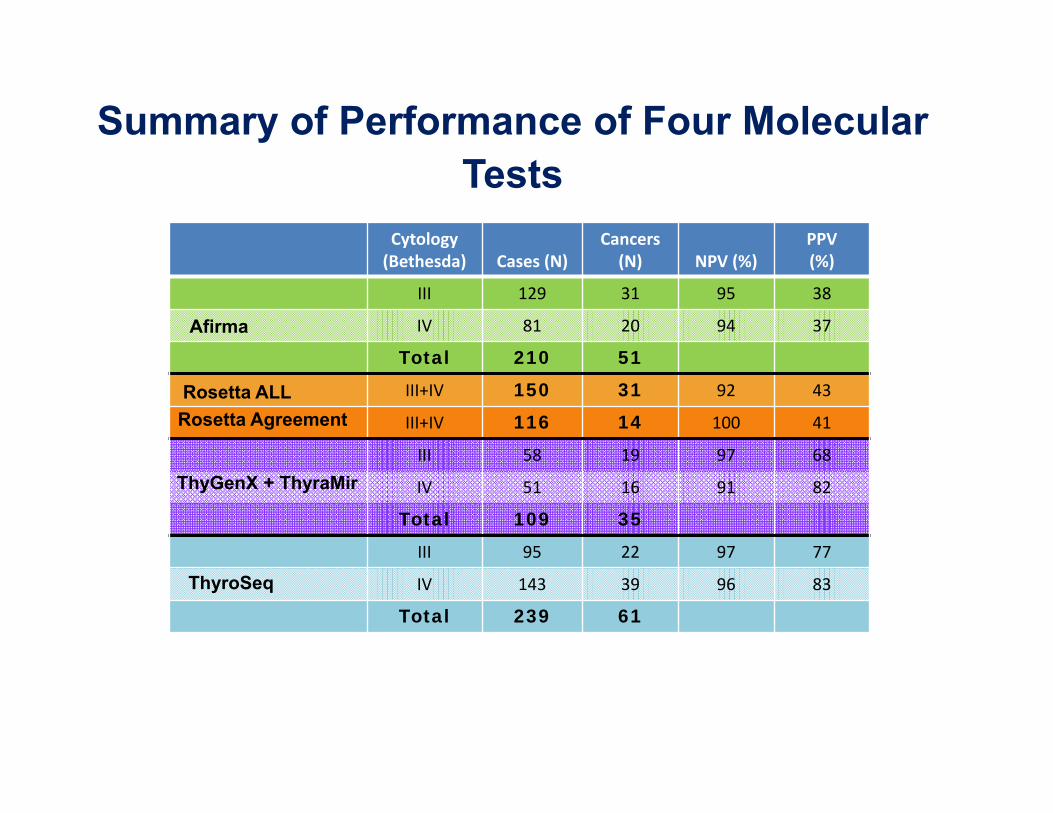
III 129 31 95 38
IV 81 20 94 37
Total 210 51III+IV 150 31 92 43
III+IV 116 14 100 41
III 58 19 97 68
IV 51 16 91 82
Total 109 35III 95 22 97 77
IV 143 39 96 83
Total 239 61
Afirma
Rosetta ALLRosetta Agreement
ThyGenX + ThyraMir
ThyroSeq
Summary of Performance of Four Molecular Tests
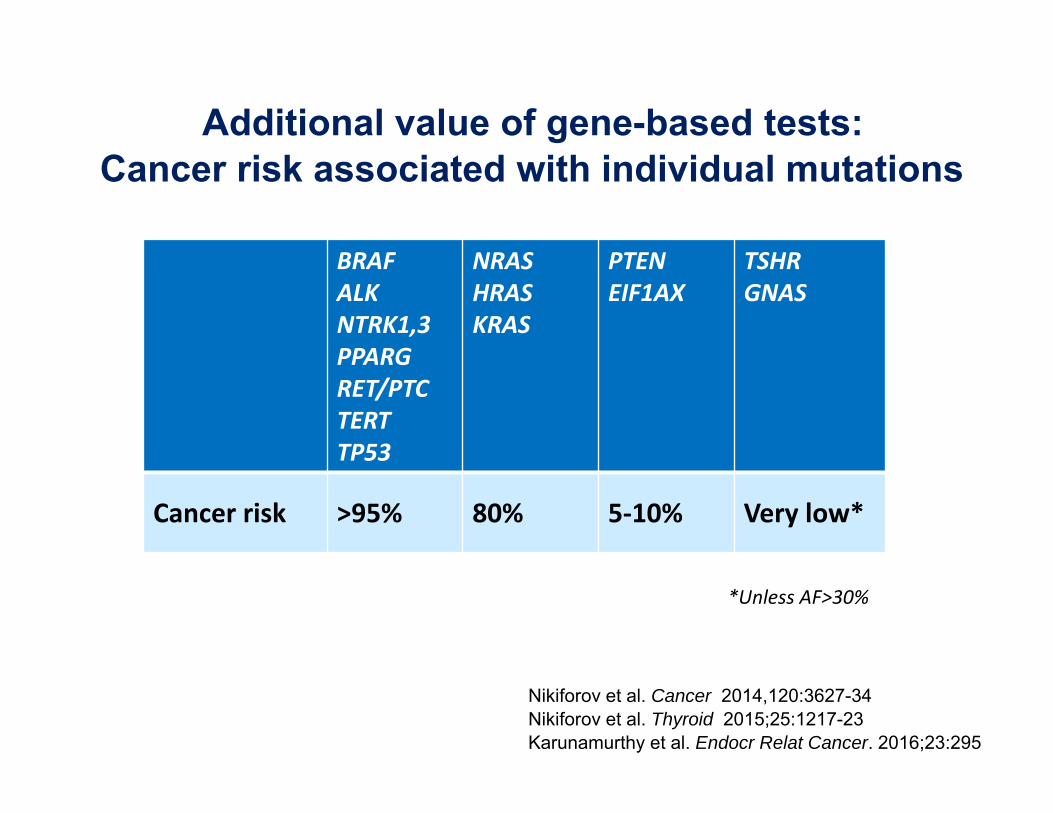
*Unless AF>30%
BRAFALKNTRK1,3PPARGRET/PTCTERTTP53
NRASHRASKRAS
PTENEIF1AX
TSHRGNAS
Cancer risk >95% 80% 5‐10% Very low*
Additional value of gene-based tests:Cancer risk associated with individual mutations
Nikiforov et al. Cancer 2014,120:3627-34Nikiforov et al. Thyroid 2015;25:1217-23Karunamurthy et al. Endocr Relat Cancer. 2016;23:295

Cancer Risk in Nodules with RAS Mutations
Medicine 2015;94:1-6
Total FNA samples 198
Total RAS+ 31
RAS+ Cancer 7 (23%)
RAS+ Benign 24 (77%)
BioMed Res Int 2015;2015:697068
Total FNA samples 132
Total RAS+ 27
RAS+ Cancer 26 (96%)
RAS+ Benign 1 (4%)

Breast cancer
Colon cancer
Normalepithelium Adenoma
InvasivecarcinomaCarcinoma
in situ
APCTP53TGFBBAX
RASBRAFSMAD4
Normal breastepithelium
MetastasisInvasive carcinomaCarcinomain situ
Initiated cells
Craene B. & Berx G. (2013); Brisken C. (2013)
Multi-step cancer progression

BENIGN MALIGNANT
BENIGN MALIGNANTPREMALIGNANT
IN SITU
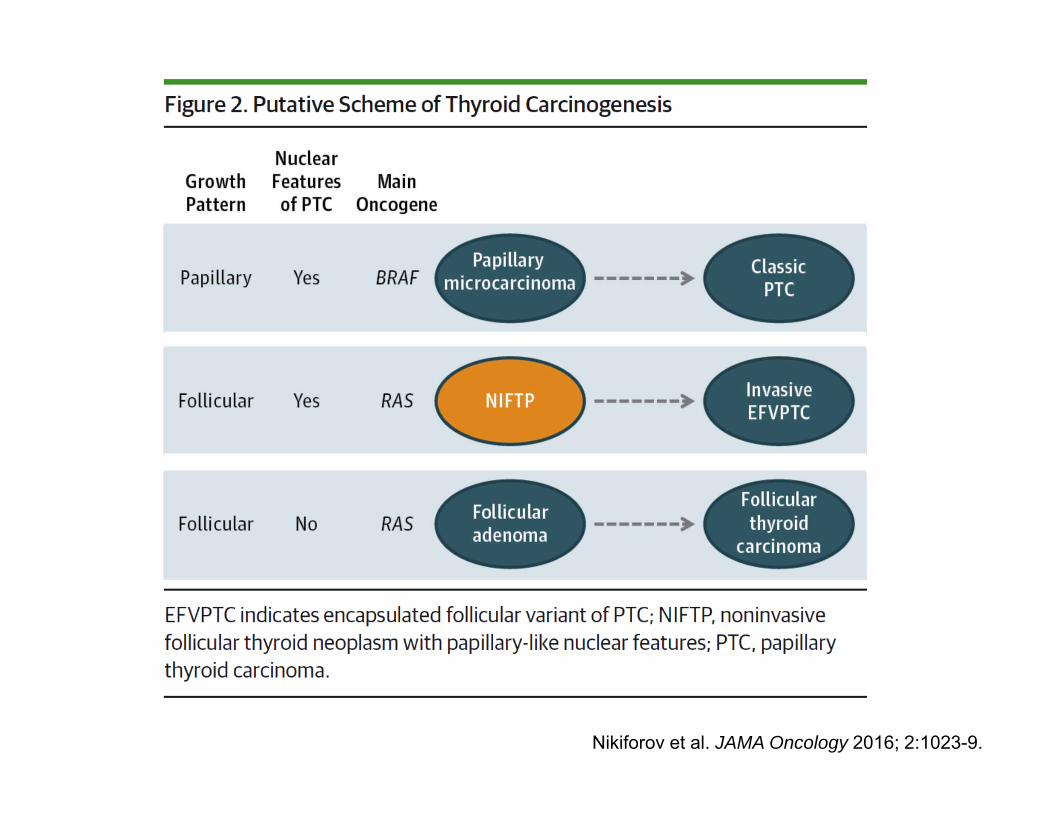
Multi-step cancer progression

Nikiforov et al. JAMA Oncology 2016; 2:1023-9.

*352 non‐invasive EFVPTC reported in the literature, 2/352 (0.6%) recurred
Nikiforov et al. JAMA Oncology 2016; 2:1023-9.

A distinct class of thyroid tumors:• Non‐invasive, follicular‐patterned, moderately to well developed nuclear features of PTC (nuclear score 2‐3)
• Clonal process driven by distinct oncogenic mutations (RAS and RAS‐like gene mutations)
• Highly favorable outcome (<1% risk of recurrence in 15 y)
Recommended new terminology:“Non‐Invasive Follicular Thyroid neoplasm with Papillary‐like nuclear features“ (NIFTP)
Nikiforov et al. JAMA Oncology 2016; 2:1023-9.
Nikiforov et al. JAMA Oncology 2016; 2:1023-9.

Non‐clonal
Clonal
Benign follicular adenoma
Atypical FA
PTC
FTC
NIFTP
Benign hyperplastic nodule
Not all benign thyroid nodules are created equal: Variability in malignant potential
No mutations
Mutation +(eg. RAS)

Wang N, et al.Cancer. 2014 Oct 1;120(19):2965-79

Cancer diagnosis – challenging the gold standard
“The current update breaks with the century-old principle of diagnosis based entirely on microscopy by incorporating molecular parameters into the classification of CNS tumors”

Yip et al. Ann Surg 262:519-25 (2015)
• 1510 patients, 97% with PTC• Excised tumors tested for 7 common mutations
• 70% of tumors found mutation‐positive
• Mean follow‐up 33 ± 21.2 months with PTC
Use of Molecular Markers for Cancer Risk Assessment

Molecular markers of cancer risk stratification
Xing M et al. JCO (2014)
BRAF+TERT
PTC, n=507
Song YS et al. Cancer (2016)
DTC, n=551
Song YS et al. Cancer (2016)
DTC, n=551
ATA risk groups
Melo M et al. JCEM (2014)Follow‐up (years)
DTC, n=469Cu
m Survival
TERT wt
TERT mut

Cancer risk assessment using ThyroSeq v2
0.6 cm nodule
2016 ATA abstract #210
AUS cytology
BRAF+/TERT+AKT1+/PIK3CA+
mPTC with extrathyroid ext
35 (55%) BRAF + Another HR mutation
18 (29%) RAS + Another HR mutation
3 (5%) Other Multiple HR mutations
55 (98%) Thyroid Cancer
51 (93%) Cancers with Aggressive Features:• Extrathyroidal extension (55%)• Vascular invasion (53%)• Lymph node macrometastasis (47%)• Poorly differentiated/anaplastic carcinoma
areas (14%)• Distant metastasis (8%)

Molecular Signature
• BRAF+TERT, RAS+TERT• Multiple driver mutations (eg. NRAS and PIK3CA or TP53)
• TERT
• ALK fusions• NTRK1 fusions• NTRK3 fusions• BRAF V600E• RET/PTC
• RAS
• BRAF K601E
• PAX8/PPARG
RAS‐like mutations
BRAF V600E‐like mutations
Molecular markers to predict cancer risk
High RiskGross extrathyroidal extension,
incomplete tumor resection, distant metastases, or lymph node >3cm
Intermediate RiskAggressive histology, minor extrathyroidal
extension, vascular invasion,or > 5 involved lymph nodes (0.2-3 cm)
Low RiskIntrathyroidal DTC
≤ 5 LN micrometastases (< 0.2 cm)
Risk of Structural Disease Recurrence(In patients without structurally identifiable disease after initial therapy)
PTC, >1 cm, TERT mutated ± BRAF mutated* (>40%)
PTC, extrathyroidal, BRAF mutated* (≈ 10-40%)
Intrathyroidal PTC, < 4 cm, BRAF mutated* (≈10%)
Intrathyroidal, < 4 cm, BRAF wild type* (≈ 1-2%)Intrathyroidal unifocal PTMC, BRAF mutated*, (≈ 1-2%)
FTC, extensive vascular invasion (≈ 30-55%)pT4a gross ETE (≈ 30-40%)pN1 with extranodal extension, >3 LN involved (≈ 40%)
pN1, any LN > 3 cm (≈ 30%)
PTC, vascular invasion (≈ 15-30%)Clinical N1 (≈20%)pN1, > 5 LN involved (≈20%)
pT3 minor ETE (≈ 3-8%)pN1, all LN < 0.2 cm (≈5%)pN1, ≤ 5 LN involved (≈5%)Intrathyroidal PTC, 2-4 cm (≈ 5%)Multifocal PMC (≈ 4-6%)pN1 without extranodal extension, ≤ 3 LN involved (2%)Minimally invasive FTC (≈ 2-3%)
Unifocal PMC (≈ 1-2%)Intrathyroidal, encapsulated, FV-PTC (≈1-2%)
NIFTP (<1%)
Haugen BR et al. Thyroid. 2016, 26:1-133

Bethesda III‐IV Cytology
Test result
Probability of Cancer or NIFTP
Tumor type, risk of recurrence
Patient management
ThyroSeq v2
Summary: Clinical management based on the results of cytology and molecular testing
Currently Negative:low level LR mutations
Currently Negative:low level LR mutations
NIFTP or low‐risk cancer
NIFTP or low‐risk cancer
Active surveillanceActive surveillance
<10%<10%
Negative: no mutationsNegative:
no mutations
N/AN/A
ObservationObservation
3‐4%3‐4%
Positive: RAS‐like mutation
Positive: RAS‐like mutation
Positive: BRAF‐like mutation
Positive: BRAF‐like mutation
NIFTP or low‐risk cancer
NIFTP or low‐risk cancer
Intermediate‐risk cancer
Intermediate‐risk cancer
LobectomyLobectomyTotal
thyroidectomyor lobectomy
Total thyroidectomyor lobectomy
Positive: multiple HR mutations
Positive: multiple HR mutations
High‐risk cancerHigh‐risk cancer
Total thyroidectomy
+/‐ CCLND
Total thyroidectomy
+/‐ CCLND
80‐90%80‐90% 95‐99%95‐99% 98%98%

Role of Molecular Markers in Thyroid Nodule Management
•Demise of indeterminate cytology•Departure from the diagnosis based entirely on microscopic pathology
•Cancer prognostication preoperatively
Personalized management of patients with thyroid nodules or cancer

AcknowledgementsNikiforov’s Research LaboratoryLindsey KellyRebecca Leeman-Neill Chan Kwon JungViktoria EvdokimovaManoj GandhiRaffaele Ciampi
University of Pittsburgh PathologyMarina NikiforovaPaul OhoriRaja Seethala
Endocrine SurgerySally CartyLinwah YipMichael Stang (now at Duke)Kelly McCoy
Head and Neck SurgeryRobert FerrisUmamaheswar Duvvuri
EndocrinologyShane LeBeauStephen Hodak (now at NYU)Christopher Coyne
RadiologyMitchell Tublin
PharmacologyDanny Altschuler
Grants/Research support:• NIH, ACS, University of Pittsburgh Cancer Institute• Philanthropic support from grateful patients