Embed Size (px)
Citation preview

244
Atherosclerosis is a chronic inflammatory disease of the vascular wall driven by the progressive intimal accumu-
lation of leukocytes, consisting mainly of monocyte-derived macrophages that subsequently give rise to lipid-laden foam cells.1 However, it is now well recognized that also local and systemic adaptive immune responses play a critical role in atherogenesis.2 Since the first description of a localization of CD4+ and CD8+ T cells in human atherosclerotic plaques,3 pro- and antiatherogenic CD4+ T-helper cell subsets have been defined.4 In particular, CD4+ T-helper cells 1 (Th1) and their major cytokine interferon (IFN)-γ promote atherosclerosis, whereas Foxp3+CD25+ regulatory T cells inhibit vascular inflammation and atherogenesis.5 Although still under de-bate, Th2 cells and their signature cytokines (eg, interleukin [IL]-13) may predominantly be protective.4,6 The function of
Th17 cells and their cytokine IL-17 is still unclear because contradicting reports have been published in past years.7 Surprisingly, however, the role of CD8+ T cells in atherogen-esis is still largely unknown.
CD8+ T cells have been described to constitute a variable but substantial proportion of the cellular plaque infiltrate in human and murine atherosclerosis.8–10 Treatment of apoli-poprotein E–deficient (Apoe−/−) mice with a CD137 agonist strongly increased vascular CD8+ T cell infiltration, associated with exacerbated atherosclerosis. In addition, we11 and others12 also demonstrated drastically elevated CD8+ T cell levels and atherosclerotic lesion formation in Ldlr−/−Pd1−/− mice, further suggesting a proatherogenic role of CD8+ T cells in atherogen-esis.13 Similarly, CD8+ T cell activation by antigen-presenting cells toward an artificial antigen specifically expressed in the
Molecular Medicine
© 2015 American Heart Association, Inc.
Circulation Research is available at http://circres.ahajournals.org DOI: 10.1161/CIRCRESAHA.117.304611
Rationale: Proinflammatory adaptive immune responses are recognized as major drivers of atherosclerotic lesion formation. Although CD8+ T cells have recently been proposed as a proatherogenic cell subset, their full scope of actions remains to be elucidated.
Objective: We here addressed the contribution of CD8+ T cells to monocyte trafficking in atherosclerosis.Method and Results: We observed that CD8+ T cells express proinflammatory cytokines (interferon-γ, tumor
necrosis factor-α, and interleukin-12) within atherosclerotic lesions and spleens of high-fat diet–fed low-density lipoprotein receptor–deficient (Ldlr−/−) mice. Antibody-mediated CD8+ T-cell depletion in high-fat diet–fed Ldlr−/− mice decreased atherosclerotic plaque formation, associated with decreased macrophage accumulation within lesions. Despite a reduction in vascular chemokine (CC-motif) ligand 2 and chemokine (CXC-motif) ligand 1 expression, CD8+ T-cell depletion did not directly affect monocyte recruitment to inflamed vessels. However, CD8+ T-cell depletion decreased chemokine (CC-motif) ligand serum concentrations and circulating Ly6Chigh monocyte counts. We further evidenced that CD8+ T-cell depletion decreased levels of mature monocytes and myeloid granulocyte–monocyte progenitors in the bone marrow and spleen of hypercholesterolemic mice, effects that were partially reproduced by interferon-γ neutralization, showing a role for interferon-γ.
Conclusions: These data suggest that CD8+ T cells promote atherosclerosis by controlling monopoiesis and circulating monocyte levels, which ultimately contributes to plaque macrophage burden without affecting direct monocyte recruitment, identifying this cell subset as a critical regulator of proatherogenic innate immune cell responses in atherosclerosis. (Circ Res. 2015;117:244-253. DOI: 10.1161/CIRCRESAHA.117.304611.)
Key Words: atherosclerosis ■ inflammation ■ lymphocytes ■ monocytes
Original received June 16, 2014; revision received May 13, 2015; accepted May 19, 2015. In April 2015, the average time from submission to first decision for all original research papers submitted to Circulation Research was 13.84 days.
From the Institute of Clinical Biochemistry and Pathobiochemistry, University Hospital Würzburg (C.C., M.K., S.M.C., A.Z.) and Rudolf Virchow Center (M.B.), University of Würzburg, Würzburg, Germany; Department of Vascular Surgery, Klinikum rechts der Isar, Technical University Munich, Munich, Germany (J.P.); and Bioceros, Utrecht, The Netherlands (L.B.).
Current address (M.B.): Section of Molecular and Translational Cardiology, Department of Internal Medicine III, Heidelberg University Hospital, Heidelberg University, Heidelberg, Germany.
The online-only Data Supplement is available with this article at http://circres.ahajournals.org/lookup/suppl/doi:10.1161/CIRCRESAHA. 117.304611/-/DC1.
Correspondence to Alma Zernecke, MD, Universitätsklinikum Würzburg, Institut für Klinische Biochemie und Pathobiochemie, Josef-Schneider-Str 2, 97080 Würzburg, Germany. E-mail [email protected]
CD8+ T Cells Regulate Monopoiesis and Circulating Ly6Chigh Monocyte Levels in Atherosclerosis in MiceClément Cochain, Miriam Koch, Sweena M. Chaudhari, Martin Busch, Jaroslav Pelisek,
Louis Boon, Alma Zernecke
by guest on Novem
ber 26, 2017http://circres.ahajournals.org/
Dow
nloaded from
by guest on Novem
ber 26, 2017http://circres.ahajournals.org/
Dow
nloaded from
by guest on Novem
ber 26, 2017http://circres.ahajournals.org/
Dow
nloaded from
by guest on Novem
ber 26, 2017http://circres.ahajournals.org/
Dow
nloaded from
by guest on Novem
ber 26, 2017http://circres.ahajournals.org/
Dow
nloaded from
by guest on Novem
ber 26, 2017http://circres.ahajournals.org/
Dow
nloaded from
by guest on Novem
ber 26, 2017http://circres.ahajournals.org/
Dow
nloaded from
by guest on Novem
ber 26, 2017http://circres.ahajournals.org/
Dow
nloaded from
by guest on Novem
ber 26, 2017http://circres.ahajournals.org/
Dow
nloaded from
by guest on Novem
ber 26, 2017http://circres.ahajournals.org/
Dow
nloaded from
by guest on Novem
ber 26, 2017http://circres.ahajournals.org/
Dow
nloaded from
by guest on Novem
ber 26, 2017http://circres.ahajournals.org/
Dow
nloaded from
by guest on Novem
ber 26, 2017http://circres.ahajournals.org/
Dow
nloaded from
by guest on Novem
ber 26, 2017http://circres.ahajournals.org/
Dow
nloaded from
by guest on Novem
ber 26, 2017http://circres.ahajournals.org/
Dow
nloaded from
by guest on Novem
ber 26, 2017http://circres.ahajournals.org/
Dow
nloaded from
by guest on Novem
ber 26, 2017http://circres.ahajournals.org/
Dow
nloaded from
by guest on Novem
ber 26, 2017http://circres.ahajournals.org/
Dow
nloaded from
by guest on Novem
ber 26, 2017http://circres.ahajournals.org/
Dow
nloaded from
by guest on Novem
ber 26, 2017http://circres.ahajournals.org/
Dow
nloaded from
by guest on Novem
ber 26, 2017http://circres.ahajournals.org/
Dow
nloaded from
by guest on Novem
ber 26, 2017http://circres.ahajournals.org/
Dow
nloaded from
by guest on Novem
ber 26, 2017http://circres.ahajournals.org/
Dow
nloaded from
by guest on Novem
ber 26, 2017http://circres.ahajournals.org/
Dow
nloaded from
by guest on Novem
ber 26, 2017http://circres.ahajournals.org/
Dow
nloaded from

Cochain et al CD8+ T Cells in Atherosclerosis 245
vessel wall induced arteritis and increased atherosclerosis, possibly via classical cell toxicity mechanism directed toward vessel wall cells.14 CD8+ T cells could, in addition, potenti-ate systemic and vascular inflammation through the secretion of proatherogenic cytokines. For instance, CD8+ T cells were shown to highly secrete IFN-γ in aortic root-draining lymph nodes of hypercholesterolemic mice.15 Moreover, Kyaw et al16 recently proposed that CD8+ T cells were able to promote ath-erogenesis and the development of vulnerable plaques through cytotoxic and proinflammatory effects, mediated by granzyme B, perforin, and tumor necrosis factor (TNF)-α expression.
It should be noted, however, that several studies have pro-posed a nonessential role of CD8+ T cells in atherosclerosis. In Apoe−/− mice, deficiency in CD8 did not significantly affect atherosclerosis, whereas total TCRβ+ T cell or CD4+ T-cell de-ficiency decreased or increased atherosclerosis, respectively. CD4 deficiency, besides abrogating atheroprotective regulatory T-cell responses, was speculated to lead to defects and proin-flammatory properties of CD8+ T cells.17 Hypercholesterolemic mice deficient in transporter associated with antigen process-ing-1, which is required for major histocompatibility complex (MHC) class I antigen presentation, displayed dramatically re-duced CD8+ T-cell numbers but unaltered atherogenesis. These effects, however, may have been masked by a compensatory increase in CD4+ T-cell infiltrates in atherosclerotic lesions of Apoe−/−TAP1−/− mice, leading to total lesional CD3+ T-cell con-tents comparable with controls.18 Furthermore, a recent study proposed that a small subset of regulatory CD8+ T cells inhib-ited proatherogenic activation of follicular helper T cells (Tfh), thereby limiting lesion development.19
Recently, CD8+ T cells were shown to indirectly promote monocyte production in the bone marrow through IFN-γ–mediated activation of bone marrow stromal cells during viral infection.20 Considering that CD8+ T-cell depletion leads to a reduced macrophage accumulation in atherosclerotic lesions,16 we here re-evaluated the function of CD8+ T cells during ath-erogenesis. Using a model of antibody-mediated depletion of CD8+ T cells in atherosclerotic low-density lipoprotein receptor–deficient (Ldlr−/−) mice, we here show that CD8+ T cells control Ly6Chigh (Ly6Chi) monocyte levels in circulating blood, spleen, and bone marrow, ultimately leading to reduced
macrophage accumulation in plaques and decreased lesion formation without directly affecting monocyte recruitment. Furthermore, we show that CD8+ T cells promote medullar monopoiesis during atherogenesis, uncovering a previously unrecognized mechanism of CD8+ T-cell–driven atherogenesis.
MethodsAnimalsLdlr−/− mice (C57BL/6J background, obtained from the Jackson Laboratory) were bred and housed under specific pathogen free conditions. Eight- to 10-week-old male mice were placed on an atherogenic diet (15% milk fat, 1.25% cholesterol; Altromin) for 6 weeks, and treated with weekly intraperitoneal injections of 250 μg of rat antimouse-CD8α (clone YTS-169, referred to as anti-CD8α or a-CD8α), rat antimouse-CD8β (clone YTS-156.7.7, referred to as anti-CD8β or a-CD8β), or isotype-matched irrelevant rat-anti-Phyt1 (clone AFRC-MAC51, referred to as control). To analyze monocyte recruitment to the vascular wall, mice fed an atherogenic diet and treated with control or anti-CD8α for 5 weeks received intravenous injections of 10×106 bone marrow mononuclear cells (prepared by gradient density centrifugation on Histopaque 1083) from mice ex-pressing the CD45.1 haplotype. Forty-eight hours after cell transfer, aortae and aortic roots were collected and prepared for flow cytometry. For in vivo IFN-γ-neutralization, mice received intraperitoneal injec-tions of 250 μg of rat antimouse IFN-γ antibody (clone XMG1.2) or irrelevant isotype-matched rat anti–β-galactosidase antibody (clone GL113) every 48 hours for 3 weeks. All animal experiments were ap-proved by local authorities (Regierung von Unterfranken, Würzburg, Germany) to comply with German animal protection law.
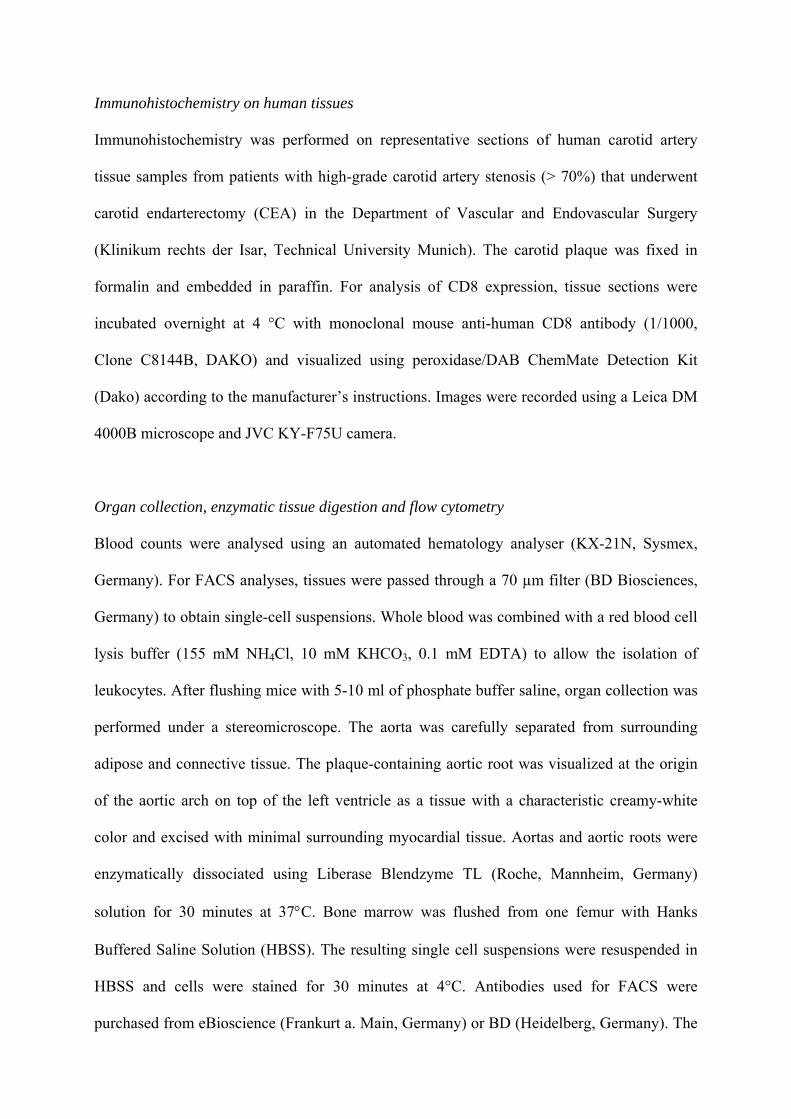
Immunohistochemistry on Human TissuesImmunohistochemistry was performed on representative sections of hu-man carotid artery tissue samples from patients with high-grade carotid artery stenosis (>70%) who underwent carotid endarterectomy in the Department of Vascular and Endovascular Surgery (Klinikum Rechts der Isar, Technical University Munich). The carotid plaque was fixed in formalin and embedded in paraffin. For analysis of CD8 expression, tissue sections were incubated overnight at 4°C with monoclonal mouse antihuman CD8 antibody visualized using peroxidase/DAB.
Enzymatic Tissue Digestion and Flow CytometryBlood counts were analyzed using an automated hematology analyser (Sysmex). For fluorescence activated cell sorting analyses, single-cell suspensions from blood, whole aortae, and aortic root after enzy-matic dissociation using Liberase Blendzyme TL solution (Roche) or bone marrow were resuspended in HBSS, and cells were stained for 30 minutes at 4°C using specific antibodies from Becton Dickinson Biosciences or eBioscience. Intracellular labeling of TNF-α, IL-12, IL-17A, and IFN-γ was performed after PMA (phorbol-12-myristat-13-ac-etat)/ionomycine/brefeldin stimulation for 4 hours using the Becton Dickinson Cytofix/Cytoperm Kit (Becton Dickinson Biosciences). Bone marrow cells were incubated for 4 hours with brefeldin before intracellular staining for granulocyte-macrophage colony-stimulating factor (GM-CSF) and IL-6. Probes were analyzed using a FACSCanto II (Becton Dickinson) and FlowJo 7.6 software (Treestar Inc).
Analysis of Atherosclerotic Lesion DevelopmentArteries were perfusion-fixed in situ with phosphate buffered saline (PBS) followed by 4% buffered paraformaldehyde in PBS. The aortic root was cut in 5-μm transverse cryosections. Aortic root sections and the en face prepared aortae were assessed for atherosclerotic plaque size after staining with Oil-Red-O. Plaque size was quantified by computerized image analysis (Diskus Software).
Quantitative Real-Time Polymerase Chain ReactionTotal RNA was extracted from tissues using a Nucleo Spin RNAII extraction Kit (Macherey-Nagel, Düren, Germany) in accordance with the manufacturer’s instructions. Equal amounts of template
Nonstandard Abbreviations and Acronyms
CCL chemokine (CC-motif) ligand
CMP common myeloid progenitors
CXCL chemokine (CXC-motif) ligand
DCs dendritic cells
GM-CSF granulocyte-macrophage colony-stimulating factor
GMP granulocyte–monocyte progenitor
HFD high-fat diet
IFN interferon
IL interleukin
Ldlr low-density lipoprotein receptor
MP myeloid progenitor
Th T helper cell
TNF tumor necrosis factor
by guest on Novem
ber 26, 2017http://circres.ahajournals.org/
Dow
nloaded from

246 Circulation Research July 17, 2015
RNA were used for cDNA synthesis; RNA was reverse transcribed using random hexamer primers. Quantitative SYBR-green real-time polymerase chain reaction was performed on duplicate samples of template cDNA on an Applied Biosystems 7900HT fast real-time polymerase chain reaction system using specific primer pairs. Quantitative measurements were determined using the ΔCt method, with Hprt as the housekeeping gene.
In Vitro Coculture AssaysBone marrow–derived macrophages were obtained by culturing to-tal bone marrow cells from Ldlr−/− mice in Roswell Park Memorial Institute (RPMI) medium containing 10% heat-inactivated FCS, antibiotics, and 15% L929 cell-conditioned medium as a source of macrophage colony-stimulating factor (M-CSF). CD8+ T cells were isolated from the spleen of Ldlr−/− mice using antimouse CD8α mi-crobeads and magnetic cell sorting according to the manufacturer’s instructions (Miltenyi). Bone marrow–derived macrophages or SV40-transformed mouse endothelial cells (SVEC) were serum starved and cultured alone or with isolated CD8+ T cells at a 1:1 ratio in RPMI containing 0.5% FCS, 5 μg/mL anti-CD3, and 1 μg anti-CD28 an-tibody, with the addition of 10 μg/mL anti–IFN-γ-neutralizing an-tibody or 10 μg/mL of isotype control antibody. After 24 hours of incubation, conditioned medium was collected and chemokine ex-pression assessed by ELISA.
ELISAChemokine (CC-motif) ligand 2 (CCL2), chemokine (CXC-motif) ligand 1 (CXCL1), and CCL5 levels in serum and cell culture super-natants were measured using the corresponding ELISA Development Kits according to the manufacturer’s instructions (Peprotech).
Statistical AnalysisResults are expressed as mean±SEM and were analyzed by Student t test or 1-way ANOVA followed by Bonferonni post-testing for mul-tiple comparisons using Prism GraphPad 6.0 software. Differences with P<0.05 were considered to be statistically significant.
ResultsCD8+ T Cells Are Present in Human and Murine Atherosclerotic PlaquesGiven findings of CD8+ T-cell infiltrates within atherosclerosic plaques,8 we first assessed the presence of this cell population in human and murine atherosclerotic vessels. Consistent with previous reports, immunostaining of human carotid artery ath-erosclerotic plaque tissue revealed abundant CD8+ T-cell infil-trates at various locations within lesions, including the plaque shoulder (Figure 1A) and around necrotic cores (Figure 1B). CD8+ T-cell infiltrates were also detected by fluorescence activated cell sorting analysis in the enzymatically digested aortic root (Figure 1C) and aorta (Online Figure I) in Ldlr−/− mice after 6 weeks of high-fat diet (HFD) feeding, and CD8+ T-cell levels were increased at these sites when compared with chow-fed mice without alterations within the distribution of CD4+ versus CD8+ T-cell subsets among total CD3+TCRβ+ T cells (Online Figure IA–IC). Analysis of the cytokine produc-tion profile of aortic root CD8+ T cells in atherosclerotic mice
A B
38%
SSC-A
CD
45
SSC-A
CD
3
CD4
CD
8
C
x400
50
100 m
m
x200
x50
%po
sitiv
e ce
llsin
tota
l CD
8+T
cells
%po
sitiv
e ce
llsin
tota
l CD
8+T
cells
D E100
80
60
40
20
0
IL12
TN
F
IFN
IL17
A
50
40
30
20
10
0
Aortic Root Spleen
IL12
TN
F
IFN
IL17
A
L
45%
x200
500 m
100 m
NC
L
Figure 1. CD8+ T cells are present in atherosclerotic plaques and express proinflammatory cytokines. Representative immunostaining of CD8+ T cells (arrows) in human carotid artery atherosclerotic plaques (A) near the plaque shoulder and (B) around necrotic core plaque areas (L=vessel lumen and NC=necrotic core). C, Successive gatings of CD45+ leukocytes, CD3+ T cells, and CD4+ vs CD8+ T cells in cell suspensions obtained from the aortic root of a Ldlr−/− mouse after 6 weeks of high-fat diet (HFD). Cytokine expression levels in CD8+ T cells from (D) the aortic root and (E) the spleen of Ldlr−/− mice after 6 weeks of HFD (n=4–5 per group). IFN indicates interferon; IL, interleukin; and TNF, tumor necrosis factor.
by guest on Novem
ber 26, 2017http://circres.ahajournals.org/
Dow
nloaded from

Cochain et al CD8+ T Cells in Atherosclerosis 247
revealed large proportions of CD8+ T cells to produce TNF-α (43.0% of CD8+ T cells) and IFN-γ (17.9%), whereas only few cells expressed IL-12 (1.0% of CD8+) and no staining could be detected for IL-17A (Figure 1D). Systemically, splenic CD8+ T cells expressed TNF-α (82.1% of CD8+ T cells), IFN-γ (22.2%), and IL-12 (19.8%; Figure 1E). These data show that CD8+ T cells infiltrate human and murine lesions, and in addition produce proinflammatory cytokines both in inflamed vessels and systemically in atherosclerotic mice.
CD8+ T-Cell Depletion Reduces Atherosclerosis and Plaque Macrophage AccumulationTo evaluate the functional role of CD8+ T cells in atherosclero-sis, this cell subset was continuously depleted in Ldlr−/− mice. Repeated injections with a monoclonal-depleting anti-CD8α antibody reduced CD8+ T-cell infiltrates in the aortic root and aorta (Figure 2A and 2B; Online Figure ID and IE) and sys-temically in circulating blood and spleen without affecting CD4+ T-cell numbers (Figure 2A and 2B; Online Figure II) or
their activation and polarization toward Th1 or regulatory T cell lineages (Online Figure III) compared with mice receiv-ing a control antibody. As a subset of dendritic cells (DCs) in lymphoid organs expresses CD8α, we furthermore analyzed the DC compartment in treated mice. Frequencies of CD8α+ and CD11b+ DCs in the spleen, as well as total numbers of CD11c+MHCII+ DCs in atherosclerotic vessels, were not af-fected in anti–CD8α-treated mice (Online Figure IVA–IVC). In addition, isolated splenic CD11c+ DCs from anti–CD8α-treated mice loaded with OVA323-339 peptide did not show any alterations in their capacity to trigger antigen-dependent proliferation of naïve OTII CD4+ T cells, or regulatory T cell and Th1 polarization compared with control-treated mice (Online Figure IVD–IVF), further confirming the specificity of our CD8+ T-cell depletion strategy.
CD8+ T-cell depletion entailed a significant 33% reduc-tion in atherosclerotic lesion size in the aortic root (Figure 2C and 2D) and a 15% decrease in lesion formation in the aortic arch (Figure 2E) compared with mice injected with control
Figure 2. CD8+ T-cell depletion reduces atherosclerosis. A, Representative CD8+ vs CD4+ T-cell gating in pregated CD45+CD3+TCRβ+ cells (left) and (B) quantitative analysis of absolute CD8+ and CD4+ T-cell counts in single cell suspensions obtained from the aortic root. C, Representative oil-red-O–stained aortic root sections and (D) quantification of aortic root lesion area. E, Quantification of lesion area in the aortic arch; quantification of (F) collagen positive area, (G) necrotic core area, and (H) macrophage content in % of total aortic root plaque area. I, Absolute counts of CD45+CD11b+F4/80+ macrophages in the aortic root, as measured by fluorescence activated cell sorting analysis. mRNA expression of (J) Ifng, (K) Tnfa, and (L) Il12 in the aortic root. All data were obtained from Ldlr−/− mice fed a high-fat diet and treated with control (Ctrl) or a-CD8α antibody (n=5–10 per group) for 6 weeks. *P<0.05, **P<0.01, ***P<0.001.
by guest on Novem
ber 26, 2017http://circres.ahajournals.org/
Dow
nloaded from

248 Circulation Research July 17, 2015
antibody after 6 weeks of HFD feeding. No differences in serum cholesterol (control antibody, 7728±521 μg/mL; an-ti-CD8, 7214±31 μg/mL) or triglyceride levels (control an-tibody, 5.5±0.3 mmol/L; α-CD8, 5.5±0.2 mmol/L) were observed between groups. Histological analyses of the plaque furthermore revealed an unaltered plaque collagen content, but a 2.5-fold reduction in the relative necrotic core area and a 1.2-fold reduction in macrophage content (Figure 2F–2H). CD45+CD11b+F4/80+ macrophage numbers were also reduced by 1.8-fold in the aortic root (Figure 2I) and by 1.6-fold in the aorta (Online Figure IF) in anti–CD8α-treated Ldlr−/− mice as assessed by fluorescence activated cell sorting analyses. These data indicate that CD8+ T cells control lesional macrophage accumulation in atherosclerosis.
As lesion-infiltrating CD8+ T cells express IFN-γ, TNF-α, and IL-12, we furthermore assessed local mRNA expres-sion of these cytokines. However, only Ifng but not Tnfa or Il12 transcripts were reduced in the aortic root of anti–CD8α-treated Ldlr−/− mice (Figure 2J–2L).
As IFN-γ promotes M1 macrophage polarization,21 we furthermore analyzed the effects of CD8+ T cells on macro-phage polarization. In vitro, coculture of bone marrow–de-rived macrophages with activated CD8+ T cells promoted M1 polarization, as reflected by increased inducibe nitric oxide synthase (Nos2) expression, an effect that was largely but not completely prevented in the presence of a neutralizing anti–IFN-γ antibody (Online Figure V). In vivo, however, mRNA expression of Nos2 and of the M2 markers Peroxisome prolif-erator-activated receptor gamma (Pparg), Arginase-1 (Arg1), and mannose receptor, C type 1 (Mrc1) were not significantly altered in atherosclerotic vessels from anti–CD8α-treated Ldlr−/− mice compared with controls (Online Figure V).
CD8+ T Cells Control Chemokine ExpressionMacrophage accumulation within atherosclerotic plaques is affected by both circulating monocyte levels and the extent of their recruitment into the inflamed vessel wall. Both pro-cesses are dependent on specific chemokines.22 Reduced Ccl2 and Cxcl1 but not Ccl5 transcript levels were observed in the aortic root (Figure 3A–3C) in mice depleted of CD8+ T cells compared with controls, whereas no changes were noted for adhesion molecules Vcam1, Icam1, Pecam1, and P-selectin between groups (Online Figure VI).
To explore a possible direct function of CD8+ T cells in con-trolling chemokine expression in vitro and the role of IFN-γ in this setting, activated splenic CD8+ T cells were cocultured with bone marrow–derived macrophages or a transformed endothe-lial cell line (SVEC), which represent surrogates for relevant target cells in the atherosclerotic plaques, in the absence or pres-ence of an IFN-γ–neutralizing antibody. Indeed, CD8+ T cells induced the secretion of CCL2, CXCL1, and CCL5 protein into the supernatants of bone marrow–derived macrophages and induced CCL2 and CCL5 secretion in SVEC cells when compared with cell cultures without CD8+ T cells or the mar-ginal expression in CD8+ T cells. Neutralization of IFN-γ inter-fered with the induction of CCL2 expression in macrophages but not in endothelial cells and did not affect the expression of CXCL1 and CCL5 in either of the cell types (Figure 3D–3I). This indicates that CD8+ T cells can directly trigger chemokine
expression by macrophages and endothelial cells and IFN-γ de-pendently promote CCL2 expression in macrophages.
In parallel with altered chemokine expression in the vessel wall, we evidenced a 1.7-fold decrease in CCL2 serum levels in the blood of Ldlr−/− mice depleted of CD8+ T cells, whereas no changes were observed for CCL5 and CXCL1 (Figure 3J–3L).
CD8+ T-Cell Depletion Specifically Reduces Circulating Inflammatory Monocyte Counts but Not Their Recruitment to Inflamed VesselsReduced CCL2 and CXCL1 expressions in atherosclerotic ves-sels from anti–CD8α-treated Ldlr−/− mice raised the possibility that decreased macrophage accumulation in plaques resulted from impaired monocyte recruitment from the bloodstream. To
J L
Ser
um C
XC
L1(p
g/m
l) 80
60
0
40
20
Ser
um C
CL2
(pg
/ml) 1500
1000
500
0
**
Ctrl a-CD8 Ctrl a-CD8
Ser
um C
CL5
(pg/
ml) 1500
1000
500
0
ns
Ctrl a-CD8
Ccl
5m
RN
A(f
old
Ctr
l)1.5
1.0
0.5
0
1.5
1.0
0.5
0Cxc
l1m
RN
A(f
old
Ctr
l)
1.5
1.0
0.5
0Ccl
2 m
RN
A(f
old
Ctr
l)
Ctrl
A B C
a-CD8 Ctrl a-CD8 Ctrl a-CD8
CC
L5(p
g/m
l)
CX
CL1
(pg/
ml)
CC
L5(p
g/m
l)
CX
CL1
(pg/
ml)
macrophagesCD8 T cells
anti-IFNγ
+-
++
++
-+
- - + -
+-
++
++
-+
- - + -
+-
++
++
-+
- - + -
E F
IH
SVECCD8 T cells
anti-IFNγ
+-
++
++
- - +
+-
++
++
- - +
+-
++
++
- - +
K
10
8
6
4
2
0
800
600
400
200
0
150
100
50
0
400 6015
10
5
0
40
20
0
300
200
100
0C
CL2
(ng/
ml)
CC
L2(n
g/m
l)
******
**
*** *** *** ***
* *
*** *****
G
D
Figure 3. CD8+ T cells induce chemokine expression. mRNA levels of (A) Ccl2, (B) Cxcl1, and (C) Ccl5 in the aortic root of Ldlr−/− mice fed a high-fat diet (HFD) and treated or not with a-CD8α for 6 weeks (n=9–11 per group). D, chemokine (CC-motif) ligand (CCL) 2, (E) chemokine (CXC-motif) ligand (CXCL) 1, and (F) CCL5 levels in cell culture medium conditioned by bone marrow–derived macrophages alone, CD8+ T cells alone, or macrophages cocultured with CD8+ T cells in the presence or not of a interferon-γ (IFN-γ)–neutralizing antibody. G, CCL2, (H) CXCL1, and (I) CCL5 levels in cell culture medium conditioned by SV40-transformed mouse endothelial cells (SVECs) cocultured with CD8+ T cells in the presence or not of a IFN-γ–neutralizing antibody. Serum levels of (J) CCL2, (K) CXCL1, and (L) CCL5 in blood from Ldlr−/− mice fed a HFD and treated or not with a-CD8α for 6 weeks (n=9–11 per group).
by guest on Novem
ber 26, 2017http://circres.ahajournals.org/
Dow
nloaded from

Cochain et al CD8+ T Cells in Atherosclerosis 249
test this, Ldlr−/− mice (which express the CD45.2 haplotype) treated with control or anti-CD8α antibody for 5 weeks re-ceived intravenous injections of mononuclear cells extracted from the bone marrow of mice carrying the CD45.1 haplotype. After 48 hours, flow cytometry of atherosclerotic vessels re-vealed similar levels of adoptively transferred CD45.1+CD45.2-
CD11b+Ly6G- monocytes in anti–CD8α- and control-treated mice (Figure 4A and 4B), indicating that CD8+ T-cell depletion did not directly affect monocyte recruitment from the blood to the inflamed vessel wall.
Macrophage influx into atherosclerotic lesions is also highly dependent on blood monocyte counts.23 Circulating levels of inflammatory Ly6Chi monocytes were decreased in anti–CD8α-treated Ldlr−/− mice at 6 weeks of HFD feeding, whereas numbers of Ly6Clow (Ly6Clo) monocytes remained unaffected (Figure 5A–5C). Chow-fed Ldlr−/− mice submitted to the same regimen of CD8+ T-cell depletion did not show any alterations in blood monocyte counts after 6 weeks, or changes in CCL2 serum levels (Online Figure VII), showing that CD8+ T cells contribute to monocytosis under conditions of hypercholesterolemia.
In inflammatory settings, monocytes can be mobilized to the blood from different compartments, namely the spleen and the bone marrow. Therefore, we analyzed levels of ma-ture Ly6Chi monocytes in these organs. Anti-CD8α treat-ment reduced levels of Ly6Chi monocytes in the bone marrow (Figure 5D–5F) and spleen (Figure 5G) of Ldlr−/− mice at 6 weeks of HFD feeding, demonstrating that CD8+ T cells con-trol the size of the medullar and splenic monocyte pool in hypercholesterolemia.
CD8+ T-Cell Depletion Affects Monopoiesis During HypercholesterolemiaTo investigate whether CD8+ T cells may control monopoi-esis, we assessed levels of total Lin-ckit+sca1+ hematopoietic stem cells, total Lin-ckit+sca1- myeloid progenitors (MPs), Lin-
ckit+sca1-CD34+CD16/32low common MPs (CMPs), and Lin-
ckit+sca1-CD34+CD16/32high granulocyte-MPs (GMPs) in the bone marrow of anti-CD8α and control antibody-treated mice after 6 weeks of HFD feeding. Levels of total hematopoietic
stem cells and MPs were unaltered, both in frequencies among total bone marrow cells and in absolute cell counts (Figure 6A–6D). In contrast, frequencies of GMPs among MPs (Figure 6E–6G) and absolute cell counts of GMPs per femur (Figure 6H and 6I) were strongly reduced in the bone marrow of anti–CD8α-treated mice, whereas CMP numbers were unaltered but showed a relative increase in their frequencies (Figure 6E–6I). Similarly, a significant reduction in GMP cell counts was ob-tained in the spleen of these mice (Online Figure VIII). These data suggest that CD8+ T cells promote monocyte expansion by promoting the differentiation of common myeloid to GMPs or through promotion of GMP proliferation.
As GMPs also give rise to neutrophils, we furthermore analyzed their distributions in different organs. Neutrophil counts were significantly diminished in the bone marrow, but not in the blood, spleen, or in atherosclerotic vessels (Online Figure IX).
Absolute cell counts of MPs, CMPs, and GMPs were unaf-fected in bone marrow of Ldlr−/− mice treated with anti-CD8α for 6 weeks and fed a normal chow although a minute 3.9% in-crease in CMP frequencies reached significance (Online Figure X). Likewise, MP, CMP, and GMP levels were not affected in the spleen of chow-fed mice (Online Figure XI). These find-ings show that CD8+ T cells promote monopoiesis specifically under conditions of hypercholesterolemia. In line, anti-CD8α treatment did not affect Ly6Chi monocyte levels in the bone marrow of Ldlr−/− mice fed a normal chow (Online Figure XIIA). However, low counts of inflammatory monocytes in spleen were further diminished by anti-CD8α treatment in Ldlr−/− mice fed a normal chow (Online Figure XIIB), suggest-ing that CD8+ T cells control monocyte accumulation in the spleen both under normal and hypercholesterolemic conditions by mechanisms independent of direct effects on monopoiesis.
CD8+ T-Cell Depletion Using Anti-CD8β Antibodies Reduces Ly6Chi Monocyte Levels and MonopoiesisEven though our data indicate that CD8+ T-cell depletion us-ing anti-CD8α antibodies had no effect on the DC compart-ment or on CD4+ T-cell levels or activation, we wanted to further validate our findings using an alternative monoclonal
CD45.2
CD
45.1
Ly6G
CD
11b
Ctr
lan
ti-C
D8
CD45.2
CD
45.1
Ly6G
CD
11b
Ctrl a-CD8
100
80
60
40
20
0
Rec
ruite
dm
onoc
ytes
per
vess
el
A
B
45.1%
51.5%
0.3%
0.3%
Figure 4. CD8+ T-cell depletion does not affect monocyte recruitment to atherosclerotic vessels. A, Representative dot plots (pregated on CD11b+ cells) of single cell suspensions obtained from vessels (aorta and aortic sinus) of control and anti–CD8α-treated mice that were injected with CD45.1 bone marrow mononuclear cells. Data from all mice per group were pooled for illustrative dot plots. B, Quantitative analysis of the number of recruited CD45.1+CD45.2-
CD11b+Ly6G- monocytes in vessels of control and anti–CD8α-treated mice (n=7 per group).
by guest on Novem
ber 26, 2017http://circres.ahajournals.org/
Dow
nloaded from

250 Circulation Research July 17, 2015
antibody targeting CD8β. After 6 weeks of HFD, Ldlr−/− mice treated weekly with 250 μg of anti-CD8β antibody showed an efficient depletion of CD8+ T cells in blood and spleen (Online Figure XIIIA and XIIIB). Atherosclerotic lesion develop-ment was reduced by 18.4% in the aortic arch of anti-CD8β
compared to control-treated treated mice although it remained borderline significant (P=0.06; Online Figure XIIIC). In the aortic root, lesion size also tended to be reduced although this was not statistically significant (P=0.16; Online Figure XIIID). Plaque macrophage content was significantly reduced
B
Ly6C
him
onoc
ytes
/µl
Ly6C
lom
onoc
ytes
/µl300
200
100
0
300
200
100
0
*
Ctrl a-CD8 Ctrl a-CD8
Ctrl anti-CD8α
Ly6C
CD
115
Ly6C
CD
115
1.5
1.0
0.5
0Ctrl a-CD8
Mon
ocyt
esx1
06/1
fem
ur
Mon
ocyt
es(%
tota
l cel
ls) 8
0
6
4
2
D E F
Ctrl a-CD8
******
G 4000
0
3000
2000
1000
Mon
ocyt
es/m
g of
tissu
e
**
Ctrl a-CD8
Ly6C
CD
115
Ly6C
CD
115
Ctrl anti-CD8αA
0.9% 4.0% 0.9% 2.2%
6.2% 3.2%
C
Figure 5. CD8+ T cells control systemic monocyte homeostasis. A, Representative fluorescence activated cell sorting (FACS) plots of CD115 vs Ly6C expression on total blood cells; absolute counts of (B) Ly6Chi and (C) Ly6Clo monocytes in circulating blood in Ldlr−/− mice treated or not with a-CD8α after 6 weeks of high-fat diet (HFD). D, Representative FACS plots of CD115 vs Ly6C expression in total bone marrow cells allow identification of CD115+Ly6chi monocytes in control and a-CD8α–treated Ldlr−/− mice after 6 weeks of HFD. Quantification of (E) percentages of CD115+Ly6Chi monocytes in total bone marrow cells and (F) absolute counts of CD115+Ly6Chi monocytes in bone marrow, and (G) Ly6Chi monocytes in the spleen from control and a-CD8α–treated Ldlr−/− mice after 6 weeks of HFD (n=5–8 per group). *P<0.05, ***P<0.001.
HS
C (
% to
tal c
ells
)
0
0.15
0.10
0.05
Ctrl a-CD8
MP
(%
tota
l cel
ls)
C0.4
0.3
0
0.2
0.1
Ctrl a-CD8
Ctr
lan
ti-C
D8α
CD16/32
CD
34
CD16/32
CD
34
F
40
30
20
10
0
E
Ctrl a-CD8
*
CMP%MP
0.16
B DA
H I GMP #CMP #
10030
20
10
0
80
60
40
20
0
MP
x10
3 /1
fem
ur
HS
C x
103 /
1fe
mur
25
CM
P x
103 /
1fe
mur
50
GM
P x
103 /
1fe
mur
CM
P%
MP
G
Ctrl a-CD8
60
40
20
0
**
GMP%MP
GM
P%
MP
20
15
10
5
0
40
30
20
10
0Ctrl a-CD8Ctrl a-CD8
Ctrl a-CD8 Ctrl a-CD8
22.5% 52.0%
34.9% 39.7%
Figure 6. a-CD8α treatment reduces medullar granulocyte–monocyte progenitor (GMP) levels in high-fat diet (HFD) fed Ldlr−/− mice. Levels of hematopoietic stem cell (HSC) in (A) percentage of total cells and (B) absolute cell numbers; levels of myeloid progenitors (MP) in (C) percentage of total cells and (D) absolute cell numbers; (E) representative fluorescence activated cell sorting (FACS) plots of CD34 vs CD16/32 expression on gated Lin-ckit+sca1- MP allows identification of CD34+CD16/32hi GMP and CD34+CD16/32lo common myeloid progenitors (CMP). Proportions of (F) CMP and (G) GMP among gated MP; absolute cell counts of (H) CMP and (I) GMP in the bone marrow from control and a-CD8α treated Ldlr−/− mice after 6 weeks of HFD (n=7–8 per group).
by guest on Novem
ber 26, 2017http://circres.ahajournals.org/
Dow
nloaded from
Cochain et al CD8+ T Cells in Atherosclerosis 251
in anti–CD8β-treated mice (Online Figure XIIIE), indicating a reduced lesional macrophage accumulation.
Anti–CD8β-treated mice displayed reduced blood Ly6Chi monocyte counts, whereas Ly6Clo monocyte and neutrophil numbers were similar to controls (Online Figure XIVA–XIVC). Bone marrow and spleen Ly6Chi monocyte levels were also significantly reduced (Online Figure XIVD and XIVG). Moreover, a reduction in the number of GMPs but no alterations in CMPs was noted in bone marrow of anti–CD8β-treated mice (Online Figure XIVE and XIVF). These data fur-ther corroborate our findings that during atherogenesis, CD8+ T cells control monopoiesis, circulating and splenic mono-cyte levels, and ultimately macrophage accumulation within plaques.
CD8+ T-Cell Depletion Reduces GM-CSF and IL-6 Expression in Bone Marrow CellsIt was recently proposed that CD8+ T cells promote monopoi-esis during acute viral infection through induction of IL-6 expression by bone marrow mesenchymal stromal cells.20 GM-CSF has also been proposed as a regulator of the my-eloid lineage during inflammation.24 In Ldlr−/− mice fed a HFD for 6 weeks, expression of GM-CSF (Online Figure XVA and XVB) and IL-6 (Online Figure XVD and XVE) was sig-nificantly reduced in total bone marrow cells by 28.3% and 16.5%, respectively, in anti–CD8β- compared to control-treated mice. Expression of both cytokines was low in CD8+ T cells, representing 0.6±0.1% and 0.8±0.2% of GM-CSF and IL-6 expressing cells, respectively. Although most GM-CSF and IL-6 expression was found in CD45+ cells, we in addition detected a significant 41.8% reduction in IL-6 expression in CD45- cells; low frequencies of GM-CSF+ cells among CD45- cells were comparable between groups (Online Figure XVC and XVF).
IFN Neutralization Partially Recapitulates the Effects of CD8+ T-Cell DepletionIFN-γ has been proposed as the main mediator of CD8+ T-cell–induced monopoiesis during viral infection.20 CD8+ T cells were the major IFN-γ–expressing cell population in the bone marrow, and anti-CD8α treatment significantly reduced fre-quencies of total medullar IFN-γ+ cells (Online Figure XVI). Notably, short-term treatment of HFD-fed Ldlr−/− mice with an IFN-γ–neutralizing antibody for 3 weeks induced a similar shift in medullar MP subpopulations and increased CMP but decreased GMP frequencies (Online Figure XVIIA–XVIIC), accompanied by a trend towards decreased Ly6Chi and re-duced Ly6Clo monocytes in blood (Online Figure XVIID and XVIIE). In contrast, however, IFN-γ neutralization was as-sociated with a significant expansion of mature monocytes in the bone marrow (Online Figure XVIIF). Although IFN-γ may thus, in part, be responsible for effects of CD8+ T cells on bone marrow monopoiesis during hypercholesterolemia, these findings also suggest that short-term IFN-γ blockade in-terferes with monocyte mobilization.
DiscussionIn the present study, we demonstrate a novel mechanism by which CD8+ T cells contribute to atherogenesis through
modulation of medullar monopoiesis and circulating Ly6Chi monocyte levels, thereby indirectly controlling macrophage accumulation within lesions.
Previous studies addressing the role of CD8+ T cells in atherogenesis have mostly used genetically engineered mouse models of CD8+ T-cell deficiency with contradictory re-sults,17,18 which may be because of compensatory mechanisms in these mice. We circumvented this hurdle by treating Ldlr−/− mice with an anti-CD8α monoclonal antibody, which effi-ciently depleted CD8+ T cells while not altering DCs levels, including CD8α+ DCs, and functionality of splenic CD11c+ DCs, as well as leaving CD4+ T cell numbers, activation and polarization untouched, thus confirming the specificity of our depletion strategy.
CD8+ T-cell depletion with the anti-CD8α antibody en-tailed a significant decrease in atherosclerotic lesion forma-tion in the aortic root and the aortic arch, in line with a recent study using a similar approach in Apoe−/− mice,16 corroborating a proatherogenic role of CD8+ T cells. Lesions of anti–CD8α-treated mice had smaller necrotic cores, which is consistent with cytotoxic properties of CD8+ T cells in plaques that may depend on perforin and granzyme B expression.16 Also co-herent with previous findings, this reduction in lesion forma-tion was associated with a reduction in lesional macrophage accumulation. Furthermore, we here observed diminished expression of CCL2 and CXCL1 in atherosclerotic tissue, che-mokines that are known to attract monocytes.22,23,25,26 Reduced chemokine expression in plaque tissue may reflect changes in lesion cellular composition (ie, reduced macrophage con-tent) or reduced chemokine expression by individual plaque cells. In vitro, activated CD8+ T cells promoted expression of CCL2, CXCL1, and CCL5 in macrophages and endothelial cells, and IFN-γ dependently induced CCL2 in macrophages, suggesting that CD8+ T cells may also promote chemokine expression by neighboring cells within plaques. These results also raised the possibility that CD8+ T cell may indirectly pro-mote monocyte recruitment to the plaque. The recruitment of adoptively transferred monocytes, however, was unaffected in anti–CD8α-treated atherosclerotic mice, ruling out this hypothesis.
Circulating Ly6Chi monocytes are known to give rise to macrophages in atherosclerotic lesions,26 and their circulating levels dictate the extent of macrophage accumulation within plaques.23 Anti–CD8α-treated mice displayed reduced circu-lating Ly6Chi monocyte counts. Considering that direct mono-cyte recruitment to plaques was unaffected by CD8+ T-cell depletion, this suggests that reduced circulating Ly6Chi mono-cyte levels in CD8+ T-cell depleted mice caused the reduction in macrophage accumulation within plaques. A recent study suggested that lesional proliferation of macrophages is re-sponsible for their accumulation during late phases of plaque development,27 and one could speculate that CD8+ T cells may interfere with macrophage proliferation at this stage. Our model of atherosclerosis after 6 weeks of HFD feeding, how-ever, is rather representative of the early steps of atherogen-esis, when monocyte recruitment prevails.27
Significantly decreased serum CCL2 concentrations in anti–CD8α-treated mice may indicate a possible impairment
by guest on Novem
ber 26, 2017http://circres.ahajournals.org/
Dow
nloaded from

252 Circulation Research July 17, 2015
of CCL2-mediated monocyte mobilization from the bone mar-row28,29 or spleen.30,31 Contrary to this notion, however, levels of mature monocytes were similarly reduced in bone marrow and spleen of anti–CD8α-treated hypercholesterolemic mice, suggesting that CD8+ T cells control myelopoiesis. Spleen but not bone marrow monocyte levels were also reduced in nor-mocholesterolemic mice, suggesting that CD8+ T cells control the size of the splenic monocyte pool also under homeostatic conditions; the mechanisms underlying this phenomenon re-quire further investigations.
Recent evidence indicates that hypercholesterolemia primes hematopoietic stem and progenitor cells toward my-elopoiesis, including monopoiesis,32 and that CD8+ T cells can promote emergency monopoiesis during viral infection.20 We here evidenced that CD8+ T-cell depletion led to decreased levels of GMPs, which represent a late stage of myeloid cell differentiation, both in the bone marrow and the spleen, an ef-fect that occurred specifically in hypercholesterolemic mice. Consistent with lower GMP levels, bone marrow neutrophil levels were also decreased, but their counts at other sites (blood, spleen, and atherosclerotic vessels) were unchanged, suggesting that the size of the medullar neutrophil pool re-mained sufficient to provide for unaltered neutrophil counts at peripheral sites.
Our data thus suggest that CD8+ T-cell depletion limits the medullar production of mature monocytes, which are then mo-bilized to the bloodstream at lower numbers. Reduced CCL2 blood levels may contribute to lower circulating Ly6Chi mono-cyte counts in CD8+ T-cell depleted mice. Reduced blood Ly6Chi monocyte numbers then, in turn, lead to diminished macrophage accumulation within plaques. Corroborating these findings, similar evidence was obtained using a different depleting antibody targeting CD8β.
In a recent study, Schürch et al20 proposed that CD8+ T cells promote medullar monopoiesis through an IFN-γ–dependent induction of IL-6 in bone marrow mesenchymal stromal cells in acute viral infection. In our study, CD8+ T-cell–depleted mice displayed reduced IL-6 expression in bone marrow cells, including CD45- bone marrow cells. CD8+ T cells themselves displayed minimal IL-6 expression in bone marrow, indicat-ing that CD8+ T cells control IL-6 expression in other bone marrow cells and in turn may promote monopoiesis also in hyperlipidemia-associated chronic inflammation. Short-term IFN-γ neutralization in atherosclerotic mice reduced medul-lar GMP and circulating monocyte levels, similar to findings in CD8+ T-cell–depleted mice. In contrast, it also entailed an increased accumulation of monocytes in the bone marrow. Although IFN-γ secretion by CD8+ T cells may, thus in part, contribute to monopoiesis and Ly6Chi monocytosis during ath-erogenesis, this suggests that other mechanisms are involved that remain to be elucidated. Of note, Kyaw et al16 proposed that proatherogenic effects of CD8+ T cells were IFN-γ inde-pendent. Expression of GM-CSF was also reduced in bone marrow cells in CD8+ T-cell–depleted mice, which may fur-ther contribute to the observed phenotype.24
Recently, Clement et al19 showed that a small subset of regulatory CD8+ T cells limited atherosclerosis through in-hibition of Tfh cells. Our results and those of Kyaw et al16
demonstrate that depletion of total CD8+ T cells leads to ath-eroprotective effects, indicating that when considering the CD8+ T-cell compartment in its entirety, proatherogenic ef-fects prevail.
In conclusion, we here show that CD8+ T cells promote the expansion of the monocytic compartment in bone mar-row, spleen, and blood and lead to an increased accumulation of macrophages in the arterial intima promoting atheroscle-rotic lesion formation. Our work identifies CD8+ T cells as a potential therapeutic target for immune modulation of atherosclerosis.
AcknowledgmentsWe thank Melanie Schott for excellent technical assistance.
Sources of FundingThis work was supported by the Deutsche Forschungsgemeinschaft (SFB688 TPA22, and ZE 827/1–2 to A.Z.).
DisclosuresNone.
References 1. Weber C, Zernecke A, Libby P. The multifaceted contributions of leu-
kocyte subsets to atherosclerosis: lessons from mouse models. Nat Rev Immunol. 2008;8:802–815. doi: 10.1038/nri2415.
2. Lahoute C, Herbin O, Mallat Z, Tedgui A. Adaptive immunity in athero-sclerosis: mechanisms and future therapeutic targets. Nat Rev Cardiol. 2011;8:348–358. doi: 10.1038/nrcardio.2011.62.
3. Hansson GK, Jonasson L. The discovery of cellular immunity in the ath-erosclerotic plaque. Arterioscler Thromb Vasc Biol. 2009;29:1714–1717. doi: 10.1161/ATVBAHA.108.179713.
4. Tedgui A, Mallat Z. Cytokines in atherosclerosis: pathogenic and regulatory pathways. Physiol Rev. 2006;86:515–581. doi: 10.1152/physrev.00024.2005.
5. Ait-Oufella H, Salomon BL, Potteaux S, Robertson AK, Gourdy P, Zoll J, Merval R, Esposito B, Cohen JL, Fisson S, Flavell RA, Hansson GK, Klatzmann D, Tedgui A, Mallat Z. Natural regulatory T cells control the development of atherosclerosis in mice. Nat Med. 2006;12:178–180. doi: 10.1038/nm1343.
6. Cardilo-Reis L, Gruber S, Schreier SM, Drechsler M, Papac-Milicevic N, Weber C, Wagner O, Stangl H, Soehnlein O, Binder CJ. Interleukin-13 protects from atherosclerosis and modulates plaque composition by skew-ing the macrophage phenotype. EMBO Mol Med. 2012;4:1072–1086. doi: 10.1002/emmm.201201374.
7. Taleb S, Tedgui A, Mallat Z. Interleukin-17: friend or foe in ath-erosclerosis? Curr Opin Lipidol. 2010;21:404–408. doi: 10.1097/MOL.0b013e32833dc7f9.
8. Hansson GK. Immune mechanisms in atherosclerosis. Arterioscler Thromb Vasc Biol. 2001;21:1876–1890.
9. Xu QB, Oberhuber G, Gruschwitz M, Wick G. Immunology of athero-sclerosis: cellular composition and major histocompatibility complex class II antigen expression in aortic intima, fatty streaks, and athero-sclerotic plaques in young and aged human specimens. Clin Immunol Immunopathol. 1990;56:344–359.
10. Kleindienst R, Xu Q, Willeit J, Waldenberger FR, Weimann S, Wick G. Immunology of atherosclerosis. Demonstration of heat shock protein 60 expression and T lymphocytes bearing alpha/beta or gamma/delta receptor in human atherosclerotic lesions. Am J Pathol. 1993;142:1927–1937.
11. Cochain C, Chaudhari SM, Koch M, Wiendl H, Eckstein HH, Zernecke A. Programmed cell death-1 deficiency exacerbates T cell activation and ath-erogenesis despite expansion of regulatory T cells in atherosclerosis-prone mice. PLoS One. 2014;9:e93280. doi: 10.1371/journal.pone.0093280.
12. Reizis B, Bunin A, Ghosh HS, Lewis KL, Sisirak V. Plasmacytoid den-dritic cells: recent progress and open questions. Annu Rev Immunol. 2011;29:163–183. doi: 10.1146/annurev-immunol-031210-101345.
13. Olofsson PS, Söderström LA, Wågsäter D, Sheikine Y, Ocaya P, Lang F, Rabu C, Chen L, Rudling M, Aukrust P, Hedin U, Paulsson-Berne
by guest on Novem
ber 26, 2017http://circres.ahajournals.org/
Dow
nloaded from

Cochain et al CD8+ T Cells in Atherosclerosis 253
G, Sirsjö A, Hansson GK. CD137 is expressed in human atherosclero-sis and promotes development of plaque inflammation in hypercho-lesterolemic mice. Circulation. 2008;117:1292–1301. doi: 10.1161/CIRCULATIONAHA.107.699173.
14. Ludewig B, Freigang S, Jäggi M, Kurrer MO, Pei YC, Vlk L, Odermatt B, Zinkernagel RM, Hengartner H. Linking immune-mediated arterial in-flammation and cholesterol-induced atherosclerosis in a transgenic mouse model. Proc Natl Acad Sci U S A. 2000;97:12752–12757. doi: 10.1073/pnas.220427097.
15. Kolbus D, Ramos OH, Berg KE, Persson J, Wigren M, Björkbacka H, Fredrikson GN, Nilsson J. CD8+ T cell activation predominate early immune responses to hypercholesterolemia in Apoe−(/)− mice. BMC Immunol. 2010;11:58. doi: 10.1186/1471-2172-11-58.
16. Kyaw T, Winship A, Tay C, Kanellakis P, Hosseini H, Cao A, Li P, Tipping P, Bobik A, Toh BH. Cytotoxic and proinflammatory CD8+ T lympho-cytes promote development of vulnerable atherosclerotic plaques in apoE-deficient mice. Circulation. 2013;127:1028–1039. doi: 10.1161/CIRCULATIONAHA.112.001347.
17. Elhage R, Gourdy P, Brouchet L, Jawien J, Fouque MJ, Fiévet C, Huc X, Barreira Y, Couloumiers JC, Arnal JF, Bayard F. Deleting TCR alpha beta+ or CD4+ T lymphocytes leads to opposite effects on site-specific atherosclerosis in female apolipoprotein E-deficient mice. Am J Pathol. 2004;165:2013–2018.
18. Kolbus D, Ljungcrantz I, Söderberg I, Alm R, Björkbacka H, Nilsson J, Fredrikson GN. TAP1-deficiency does not alter atherosclerosis develop-ment in Apoe-/- mice. PLoS One. 2012;7:e33932. doi: 10.1371/journal.pone.0033932.
19. Clement M, Guedj K, Andreata F, Morvan M, Bey L, Khallou-Laschet J, Gaston AT, Delbosc S, Alsac JM, Bruneval P, Deschildre C, Le Borgne M, Castier Y, Kim HJ, Cantor H, Michel JB, Caligiuri G, Nicoletti A. Control of the t follicular helper-germinal center b-cell axis by cd8+ regulatory t cells limits atherosclerosis and tertiary lymphoid organ development. Circulation. 2015;131:560–570
20. Schürch CM, Riether C, Ochsenbein AF. Cytotoxic CD8+ T cells stimu-late hematopoietic progenitors by promoting cytokine release from bone marrow mesenchymal stromal cells. Cell Stem Cell. 2014;14:460–472. doi: 10.1016/j.stem.2014.01.002.
21. Sica A, Mantovani A. Macrophage plasticity and polarization: in vivo veri-tas. J Clin Invest. 2012;122:787–795. doi: 10.1172/JCI59643.
22. Soehnlein O, Drechsler M, Döring Y, et al. Distinct functions of chemo-kine receptor axes in the atherogenic mobilization and recruitment of
classical monocytes. EMBO Mol Med. 2013;5:471–481. doi: 10.1002/emmm.201201717.
23. Combadière C, Potteaux S, Rodero M, Simon T, Pezard A, Esposito B, Merval R, Proudfoot A, Tedgui A, Mallat Z. Combined inhibition of CCL2, CX3CR1, and CCR5 abrogates Ly6C(hi) and Ly6C(lo) monocytosis and al-most abolishes atherosclerosis in hypercholesterolemic mice. Circulation. 2008;117:1649–1657. doi: 10.1161/CIRCULATIONAHA.107.745091.
24. Gutknecht MF, Bouton AH. Functional significance of mononuclear phagocyte populations generated through adult hematopoiesis. J Leukoc Biol. 2014;96:969–980. doi: 10.1189/jlb.1RI0414-195R.
25. Zernecke A, Weber C. Chemokines in atherosclerosis: proceedings re-sumed. Arterioscler Thromb Vasc Biol. 2014;34:742–750. doi: 10.1161/ATVBAHA.113.301655.
26. Tacke F, Alvarez D, Kaplan TJ, Jakubzick C, Spanbroek R, Llodra J, Garin A, Liu J, Mack M, van Rooijen N, Lira SA, Habenicht AJ, Randolph GJ. Monocyte subsets differentially employ CCR2, CCR5, and CX3CR1 to accumulate within atherosclerotic plaques. J Clin Invest. 2007;117:185–194. doi: 10.1172/JCI28549.
27. Robbins CS, Hilgendorf I, Weber GF, et al. Local proliferation domi-nates lesional macrophage accumulation in atherosclerosis. Nat Med. 2013;19:1166–1172. doi: 10.1038/nm.3258.
28. Serbina NV, Pamer EG. Monocyte emigration from bone marrow dur-ing bacterial infection requires signals mediated by chemokine receptor CCR2. Nat Immunol. 2006;7:311–317. doi: 10.1038/ni1309.
29. Tsou CL, Peters W, Si Y, Slaymaker S, Aslanian AM, Weisberg SP, Mack M, Charo IF. Critical roles for CCR2 and MCP-3 in monocyte mobili-zation from bone marrow and recruitment to inflammatory sites. J Clin Invest. 2007;117:902–909. doi: 10.1172/JCI29919.
30. Swirski FK, Nahrendorf M, Etzrodt M, Wildgruber M, Cortez-Retamozo V, Panizzi P, Figueiredo JL, Kohler RH, Chudnovskiy A, Waterman P, Aikawa E, Mempel TR, Libby P, Weissleder R, Pittet MJ. Identification of splenic reservoir monocytes and their deployment to inflammatory sites. Science. 2009;325:612–616. doi: 10.1126/science.1175202.
31. Robbins CS, Chudnovskiy A, Rauch PJ, et al. Extramedullary he-matopoiesis generates Ly-6C(high) monocytes that infiltrate ath-erosclerotic lesions. Circulation. 2012;125:364–374. doi: 10.1161/CIRCULATIONAHA.111.061986.
32. Seijkens T, Hoeksema MA, Beckers L, Smeets E, Meiler S, Levels J, Tjwa M, de Winther MP, Lutgens E. Hypercholesterolemia-induced priming of hematopoietic stem and progenitor cells aggravates atherosclerosis. FASEB J. 2014;28:2202–2213. doi: 10.1096/fj.13-243105.
What Is Known?
• Macrophage accumulation within atherosclerotic lesions is depen-dent on blood monocyte counts and determines atherosclerotic lesion growth.
• CD8+ T cells are present in atherosclerotic lesions in humans and mice and can promote atherosclerosis by cytotoxic and proinflammatory mechanisms.
What New Information Does This Article Contribute?
• We revealed that CD8+ T cells control monopoiesis in bone marrow and spleen and systemic levels of inflammatory Ly6Chigh monocytes in hypercholesterolemic mice.
• By controlling circulating monocyte counts, CD8+ T cells promote lesional macrophage accumulation and atherosclerotic lesion growth.
Atherosclerotic lesion development is driven by the progres-sive intimal accumulation of monocyte-derived macrophages, which is likely to be highly dependent on blood monocyte counts.
Despite their presence within atherosclerotic lesions, the role of CD8+ T cells in atherogenesis remains unclear. Recent evidence from murine models suggests that CD8+ T cells may promote atherosclerosis through cytotoxic and proinflammatory mecha-nisms and may contribute to macrophage accumulation within plaques. Using a model of antibody-mediated depletion of CD8+ T cells in hypercholesterolemic low-density lipoprotein receptor–deficient mice, we found that CD8+ T cells control systemic levels of Ly6Chigh monocytes and promote macrophage accumulation within plaques in atherosclerotic mice. The CD8+ T cells did not affect direct monocyte recruitment to plaques, but controlled monocyte generation in the spleen and bone marrow. These find-ings reveal a novel mechanism of hypercholesterolemia-induced monocytosis by which proatherogenic CD8+ T cells contribute to macrophage accumulation within plaques and drive atherogen-esis. The CD8+ T cells may thus constitute a potential therapeutic target for immune modulation of atherosclerosis.
Novelty and Significance
by guest on Novem
ber 26, 2017http://circres.ahajournals.org/
Dow
nloaded from

Boon and Alma ZerneckeClément Cochain, Miriam Koch, Sweena M. Chaudhari, Martin Busch, Jaroslav Pelisek, Louis
Atherosclerosis in Mice Monocyte Levels inhigh T Cells Regulate Monopoiesis and Circulating Ly6C+CD8
Print ISSN: 0009-7330. Online ISSN: 1524-4571 Copyright © 2015 American Heart Association, Inc. All rights reserved.is published by the American Heart Association, 7272 Greenville Avenue, Dallas, TX 75231Circulation Research
doi: 10.1161/CIRCRESAHA.117.3046112015;117:244-253; originally published online May 19, 2015;Circ Res.
http://circres.ahajournals.org/content/117/3/244World Wide Web at:
The online version of this article, along with updated information and services, is located on the
http://circres.ahajournals.org/content/suppl/2015/05/19/CIRCRESAHA.117.304611.DC1Data Supplement (unedited) at:
http://circres.ahajournals.org//subscriptions/
is online at: Circulation Research Information about subscribing to Subscriptions:
http://www.lww.com/reprints Information about reprints can be found online at: Reprints:
document. Permissions and Rights Question and Answer about this process is available in the
located, click Request Permissions in the middle column of the Web page under Services. Further informationEditorial Office. Once the online version of the published article for which permission is being requested is
can be obtained via RightsLink, a service of the Copyright Clearance Center, not theCirculation Researchin Requests for permissions to reproduce figures, tables, or portions of articles originally publishedPermissions:
by guest on Novem
ber 26, 2017http://circres.ahajournals.org/
Dow
nloaded from

SUPPLEMENTAL MATERIAL
Material and methods
Animals
Ldlr-/- mice (C57BL/6J background, obtained from the Jackson Laboratory) were bred and
housed in specific pathogen free conditions. 8 to 10 week old males were put on an
atherogenic diet (15% milk fat, 1.25% cholesterol, Altromin, Lage, Germany) for 6 weeks,
and treated with weekly intraperitoneal (i.p.) injections of 250µg of 250 µg of rat anti-mouse-
CD8α (clone YTS-169, referred to as anti-CD8α or a-CD8α), rat anti-mouse-CD8β (clone
YTS-156.7.7, referred to as anti-CD8β or a-CD8β) or isotype-matched irrelevant rat-anti-
Phyt1 (clone AFRC-MAC51, referred to as Ctrl). At the end of the treatment, mouse anti-rat
IgG antibodies could be detected at similar levels in the serum of mice treated with anti-
CD8α, anti-CD8β or control antibody (not shown), indicating that anti-rat antibody
production does not constitute an invalidating bias for this experimental design. For analysis
of monocyte recruitment to the vascular wall, mice fed an atherogenic diet and treated with
Ctrl or anti-CD8α for 5 weeks received intravenous (i.v.) injections of 10x106 bone marrow
mononuclear cells (prepared by gradient density centrifugation on Histopaque 1083) from
mice expressing the CD45.1 haplotype. 48 hours after cell transfer, aortae and aortic roots
were collected together and prepared for flow cytometry. For in vivo IFNγ neutralization,
mice received i.p. injections of 250µg of rat anti-mouse IFNγ antibody (clone XMG1.2) or
irrelevant isotype matched rat anti-β-Galactosidase (clone GL113) every 48 hours for 3
weeks. All animal experiments were approved by local authorities (Regierung von
Unterfranken, Würzburg, Germany) to comply with German animal protection law.
Immunohistochemistry on human tissues
Immunohistochemistry was performed on representative sections of human carotid artery
tissue samples from patients with high-grade carotid artery stenosis (> 70%) that underwent
carotid endarterectomy (CEA) in the Department of Vascular and Endovascular Surgery
(Klinikum rechts der Isar, Technical University Munich). The carotid plaque was fixed in
formalin and embedded in paraffin. For analysis of CD8 expression, tissue sections were
incubated overnight at 4 °C with monoclonal mouse anti-human CD8 antibody (1/1000,
Clone C8144B, DAKO) and visualized using peroxidase/DAB ChemMate Detection Kit
(Dako) according to the manufacturer’s instructions. Images were recorded using a Leica DM
4000B microscope and JVC KY-F75U camera.
Organ collection, enzymatic tissue digestion and flow cytometry
Blood counts were analysed using an automated hematology analyser (KX-21N, Sysmex,
Germany). For FACS analyses, tissues were passed through a 70 µm filter (BD Biosciences,
Germany) to obtain single-cell suspensions. Whole blood was combined with a red blood cell
lysis buffer (155 mM NH4Cl, 10 mM KHCO3, 0.1 mM EDTA) to allow the isolation of
leukocytes. After flushing mice with 5-10 ml of phosphate buffer saline, organ collection was
performed under a stereomicroscope. The aorta was carefully separated from surrounding
adipose and connective tissue. The plaque-containing aortic root was visualized at the origin
of the aortic arch on top of the left ventricle as a tissue with a characteristic creamy-white
color and excised with minimal surrounding myocardial tissue. Aortas and aortic roots were
enzymatically dissociated using Liberase Blendzyme TL (Roche, Mannheim, Germany)
solution for 30 minutes at 37C. Bone marrow was flushed from one femur with Hanks
Buffered Saline Solution (HBSS). The resulting single cell suspensions were resuspended in
HBSS and cells were stained for 30 minutes at 4°C. Antibodies used for FACS were
purchased from eBioscience (Frankurt a. Main, Germany) or BD (Heidelberg, Germany). The
following antibodies were used: CD45 (clone 30-F11), CD45.1 (clone A20), CD45.2 (clone
104), CD3 (clone 500A2 or 17A2), TCRβ (H57-597), CD8a (clone 53-6.7), Ly6C (clone AL-
21), Ly6G (Clone 1A8), NK1.1 (PK136), IFNγ (clone XMG1.2), CD4 (clone RM4-5 or
GK1.5), CD11b (clone M1/70), CD11c (clone N418), IL-17a (clone eBio17B7), F4/80 (BM-
8), CD25 (PC61.5), Foxp3 (FJK-16S), CD44 (IM7), CD62L (MEL-14), TNFα (clone MP6-
XT22), IL12 (clone C15.6), CD16/32 (clone 93), c-kit (clone 2B8), Sca1 (clone D7), CD34
(clone RAM34), CD90 (clone 53-2.1), B220 (clone RA3-6B2), CD49b (clone DX5), Ter119
(clone Ter119), Gr1 (clone RB6-8C5), IL7Rα (clone A7R34), IL-6 (clone MP5-20F3), GM-
CSF (clone MP1-22E9). For analysis of bone marrow progenitor populations, lineage
antibody cocktail contained antibodies against CD90, B220, CD19, CD49b, Ter119, Gr1,
NK1.1 and IL7Rα. Intracellular labelling of TNFα, IL12, IL17A and IFNγ was performed
after PMA/Ionomycine/Brefeldin stimulation for 4 hours using the BD Cytofix/Cytoperm™
Kit (BD Biosciences). Bone marrow cells were incubated for 4 hours with Brefeldin before
GM-CSF and IL-6 intracellular stainings. Probes were analyzed using a FACSCanto II
(Becton Dickson, USA) and FlowJo 7.6 software (Treestar Inc., USA).
Analysis of atherosclerotic lesion development
Arteries were perfusion-fixed in situ with phosphate buffered saline (PBS) followed by 4%
buffered formaldehyde paraformaldehyde in PBS (PFA; Sigma Aldrich, USA). The heart and
whole aorta were removed and carefully cleaned of extraneous fat before being post-fixed in
4% PFA. The aortic root was then cut 5-μm transverse cryosections. Aortic root sections were
assessed for atherosclerotic plaque size after staining with Oil-Red-O. All images were
recorded with a Leica DM 4000B fluorescence microscope and JVC KY-F75U camera.
Plaque size was quantified by computerized image analysis (Diskus Software, Hilgers,
Germany).

Quantitative Real-Time PCR
Total RNA was extracted from tissues using a Nucleo Spin RNAII extraction Kit (Macherey-
Nagel, Düren, Germany) in accordance with the manufacturer’s instructions. Equal amounts
of template RNA (1 µg) were used for cDNA synthesis; RNA was reverse transcribed using
random hexamer primers (Thermo Scientific, St. Leon-Rot, Germany). Quantitative SYBR-
green real-time PCR was performed on duplicate samples of template cDNA on an Applied
Biosystems 7900HT fast real-time PCR system using specific primer pairs (Eurofins MWG
Operon, Germany): Ifng forward 5’-GCTGTTTCTGGCTGTTACTGC-3’, reverse 5’-
TCACCATCCTTTTGCCAGTTCC-3’ ; Tnfa forward 5’-CTGTAGCCCACGTCGTAGC-3’,
reverse 5’-GGTTGTCTTTGAGATCCATGC-3’; Il12 quantitec primer assay QT01048334
(Qiagen, Hilden, Germany); Ccl2 forward 5’-CCCCACTCACCTGCTA-3’, reverse 5’-
TTACGGGTCAACTTCACATTCAAA-3’; Cxcl1 forward 5’-
ATGAGCTGCGCTGTCAGTGC-3’, reverse 5’-CACCAGACGGTGCCATCAGA-3’; Ccl5
forward 5’-GCTGCCCTCACCATCATCCTCACT-3’, reverse 5’-
GGCACACACTTGGCGGTTCCTTC-3’; Vcam1 forward 5’-
TGATTGGGAGAGACAAAGCA-3’, reverse 5’-AACAACCGAATCCCCAACTT-3’;
Icam1 forward 5’-TGGCCTGGGGGATGCACACT-3’, reverse 5’-
GGCTGTAGGTGGGTCCGGGT-3’; Pecam1 forward 5’-
GGAACGAGAGCCACAGAGACGG-3’, reverse 5’-GCTTTCGGTGGGGACAGGCTC-3’;
Pselectin forward 5’-CTGCCCCATGCTCTGTTGGGC-3’, reverse 5’-
CCCCAACCACCTGCCTCCGT-3’. Nos2 forward 5’-
GTTCTCAGCCCAACAATACAAGA-3’, reverse 5’-GTGGACGGGTCGATGTCAC-3’;
Pparg forward 5’-TTATAGCTGTCATTATTCTCAGTGGAG-3’, reverse 5’-
GACTCTGGGTGATTCAGCTTG-3’; Arg1 forward 5’-GGAAAGCCAATGAAGAGCTG-
3’, reverse 5’-GATGCTTCCAACTGCCAGAC-3’, reverse
5’GATGCTTCCAACTGCCAGAC-3’; Mrc1 forward 5’-

CACTCATCCATTACAACCAAAGC-3’, reverse 5’- CAGGAGGACCACGGTGAC-3’.
After an initial denaturation at 95°C for 10 minutes, 40 cycles of denaturation at 95°C for 15
secsonds and annealing at 60°C for 60 seconds was carried out. After PCR amplification,
dissociation curves were constructed to confirm formation of the intended PCR products.
Quantitative measurements were determined using the Ct method, with Hprt as the
housekeeping gene.
In vitro co-culture assays
Bone marrow derived macrophages were obtained by culturing total bone marrow cells from
Ldlr-/- mice in RPMI medium containing 10% heat inactivated FCS, antibiotics and 15% L929
Cells Conditioned Medium as a source of M-CSF. CD8+ T cells were isolated from the spleen
of Ldlr-/- mice using anti-mouse CD8a microbeads and magnetic cell sorting according to the
manufacturer’s instructions (Miltenyi, Bergisch Gladbach, Germany). Bone marrow derived
macrophages or SVEC endothelial cells were serum starved and cultured alone or with
isolated CD8+ T cells at a 1:1 ratio in RPMI containing 0.5% FCS, 5 µg/ml anti-CD3 and 1
µg anti-CD28 antibody, with addition of 10 µg/ml anti-IFNγ neutralizing antibody or 10
µg/ml of isotype control antibody. After a 24h incubation, conditioned medium were collected
and chemokine expression assayed by ELISA. Dendritic cells (DCs) and naïve OTII CD4+ T
cells were isolated from spleens using magnetic selection kits (CD11c and Naïve T cell
Isolation Kit) from Miltenyi, according to the manufacturer’s instructions. DCs were loaded
with 250 ng/ml OVA323-339 peptide and naïve OTII CD4+ T cells labeled with 5 µM CFSE,
and cultured at a 1:3 ratio for 3 days. Proliferation was assessed by CFSE dilution while
intracellular staining for IFNγ (as described above) and Foxp3 were used for Th1 and Treg
polarization analysis.

ELISA
Blood was extracted by retro-orbital puncture and placed in a Serum Collection Tube
(Sarstedt, Nümbrecht, Germany). Serum was then collected according to the manufacturer’s
instruction. CCL2, CXCL1 and CCL5 levels in serum and cell culture supernatants were
measured using the corresponding ELISA development kits according to the manufacturer’s
instructions (Peprotech, Hamburg, Germany).
Statistical Analysis
Results are expressed as mean ± SEM and were analyzed by a Student’s t-test or 1-way
analysis of variance (ANOVA) followed by Bonferonni post-testing for multiple comparisons
using Prism GraphPad 6.0 software. Differences with p values < 0.05 were considered to be
statistically significant.

Figure S I: CD8+ T cells in atherosclerotic vessels and macrophage levels in aortae of anti-CD8α treated hypercholesterolemic mice A) Quantitative analysis of absolute CD8+ T cell counts in single cell suspensions obtained from the aorta of Ldlr-/-
mice on normal chow and after 6 weeks of HFD feeding. B) Distribution of CD4+ and CD8+ subsets in total T cells in the aortic root and aorta of chow and HFD-fed Ldlr-/- mice and C) representative FACS plot of T cell subsets in the aorta of chow or HFD fed Ldlr-/- mice. D) Representative CD8+ vs. CD4+ T cell gating in pre-gated CD45+CD3+TCRβ+ T cells and E) quantitative analysis of absolute CD8+ and CD4+ T cell counts in the aorta of Ldlr-
/- mice fed a HFD and treated with Control (Ctrl) or a-CD8α antibody for 6 weeks (n=5-10/ group). F) Absolute counts of CD45+CD11b+F4/80+ macrophages in single cell suspensions obtained from the aorta of Ldlr-/- mice fed a HFD and treated with Control (Ctrl) or a-CD8α antibody for 6 weeks (n=5-10/ group). **p<0.01, ***p<0.001.
Ctrl anti-CD8α
Aort
a
CD4
CD
8
D
CD
4+ T
cel
ls (x
103 /o
rgan
)
CD
8+ T
cel
ls (x
103 /o
rgan
) 60
40
20
0
150
100
50
0 Ctrl a-CD8α Ctrl a-CD8α
100
80
60
40
20
0
Mac
roph
ages
(x
103 c
ells
/org
an)
**
Ctrl a-CD8α
E
CD
8+ T
cel
ls (x
103 /o
rgan
) 50
40
30
10
0
20
Ao. root Aorta
***
F
A
46.3%
48.0%
12.9%
77.5%
**
B
CD4 CD8 CD4 CD8
C
Aortic root Aorta
p=0.05
Chow HFD
Chow HFD Chow HFD
CD4
CD
8
% o
f CD
45+ C
D3+
TCRβ+
60
40
0
20
30.2%
57.7%
35.1%
55.3%
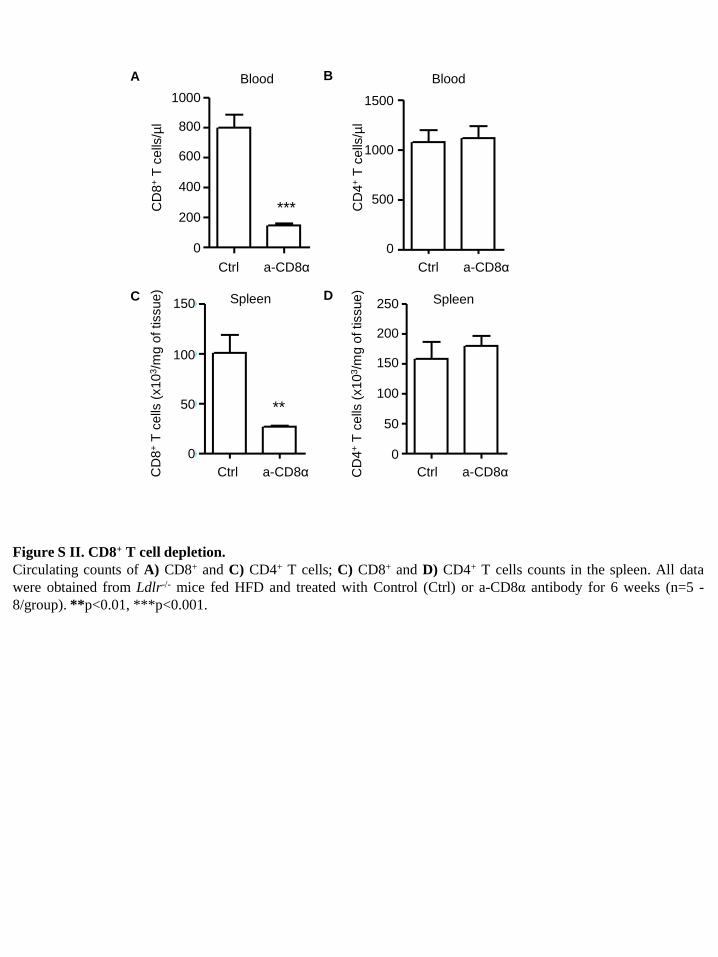
Figure S II. CD8+ T cell depletion. Circulating counts of A) CD8+ and C) CD4+ T cells; C) CD8+ and D) CD4+ T cells counts in the spleen. All data were obtained from Ldlr-/- mice fed HFD and treated with Control (Ctrl) or a-CD8α antibody for 6 weeks (n=5 -8/group). **p<0.01, ***p<0.001.
Blood 1500
1000
500
0 Ctrl a-CD8α
CD
4+ T
cel
ls/µ
l
B A Blood 1000
CD
8+ T
cel
ls/µ
l 800
600
400
200
0 Ctrl a-CD8α
d Spleen 250
CD
4+ T
cel
ls (x
103 /m
g of
tiss
ue)
200
150
100
50
0 Ctrl a-CD8α
c Spleen 150
CD
8+ T
cel
ls (x
103 /m
g of
tiss
ue)
100
50
0 Ctrl a-CD8α
D C
***
**

Blood Spleen
Figure S III: CD4+ T cell activation in anti-CD8α treated hypercholesterolemic mice Percentages of activated (CD44+CD62L-) cells in the A) spleen and B) blood, CD25+Foxp3+ regulatory T cells in the C) spleen and D) blood and IFNγ+ cells in the E) spleen and F) blood among CD4+ T cells in Ldlr-/- mice fed a HFD for 6 weeks and treated with Control (Ctrl) or a-CD8α antibody (n=5-8/ group).
Ctrl a-CD8α Ctrl a-CD8α
Ctrl a-CD8α Ctrl a-CD8α
Ctrl a-CD8α Ctrl a-CD8α
CD
44hiC
D62
L- (%
of C
D4+
) C
D25
+ Fox
p3+
(% o
f CD
4+)
IFNγ+
(%
of C
D4+
)
CD
44hiC
D62
L- (%
of C
D4+
) C
D25
+ Fox
p3+
(% o
f CD
4+)
IFNγ+
% (%
of C
D4+
)
0.057
ns
A B
C D
E F

Figure S IV: Effect of anti-CD8α treatment on the DCs. Percentages) of A) CD8α+ and b) CD11b+ DCs among CD11c+MHCII+ dendritic cells in the spleen and C) absolute counts of CD11c+MHCII+ DCs in total aorta and aortic roots of Ldlr-/- mice fed a HFD for 6 weeks and treated with control or anti-CD8α antibodies. (D-F) CD11c+ DCs were isolated from the spleens of Ldlr-/- mice fed a HFD for 6 weeks and treated with control or anti-CD8α antibodies with anti-CD11c magnetic beads, loaded with OVA323-339 peptide and assayed for their ability to induce D) proliferation of naive OTII splenic CD4+ T cells, and E) IFNγ+ Th1 or F) Foxp3+ Treg polarization.
A B C
D E F
Ctrl a-CD8α
CD
8α+
(% D
Cs)
20
10
0
15
5
Ctrl a-CD8α
CD
11b+
(% D
Cs)
80
40
0
60
20
Ctrl a-CD8α CD
11c+
MH
CII+
DC
s x1
03/ v
esel
150
0
100
50
Ctrl a-CD8α Ctrl a-CD8α Ctrl a-CD8α
4
2
0
3
1
% IF
Nγ+
% F
oxp3
+
% p
rolif
erat
ed C
D4+
T c
ells
0.8
0.4
0
0.6
0.2
10
0
15
5

B C D E
Nos
2 m
RN
A (fo
ld C
trl)
Arg
1 m
RN
A (fo
ld C
trl)
Mrc
1 m
RN
A (fo
ld C
trl)
Ppa
rg m
RN
A (fo
ld C
trl)
Ctrl a-CD8α Ctrl a-CD8α Ctrl a-CD8α Ctrl a-CD8α
A
Nos
2/H
prt (
fold
Ctrl
)
macrophages CD8 T cells
anti-IFNγ
+ -
+ +
+ +
- - +
Figure S V: Role of CD8+ T cells in macrophage polarization. A) Expression of iNOS (Nos2) mRNA relative to Hprt in macropohages cultured alone (Ctrl), with activated CD8+ T cells or with activated CD8+ T cells in presence of an a-IFNγ neutralizing antibody. Expression of B) iNOS (Nos2), C) Arg1, D) Mrc1 and E) Pparg mRNA relative to Hprt in the aortic sinus of Control (Ctrl) or anti-CD8α-treated Ldlr-/- mice fed a HFD for 6 weeks (n=6/ group).

A B C D
Vca
m1
mR
NA
(fol
d C
trl)
Figure S VI: Adhesion molecule expression in the aortic sinus Expression of A) Vcam1, B) Icam1, C) Pecam1 and D) Pselectin mRNA relative to Hprt in the aortic sinus of Control (Ctrl) or anti-CD8α Ldlr-/- mice fed a HFD for 6 weeks (n=7-9/ group).
Icam
1 m
RN
A (f
old
Ctrl
)
Pec
am1
mR
NA
(fol
d C
trl)
Pse
lect
in m
RN
A (f
old
Ctrl
)
Ctrl a-CD8α Ctrl a-CD8α Ctrl a-CD8α Ctrl a-CD8α

Figure S VII: Blood monocytes and CCL2 serum levels in chow fed mice A) Circulating levels of Ly6Chi monocytes and B) serum levels of CCL2 in normocholesterolemic mice treated with Control (Ctrl) or anti-CD8α antibody for 6 weeks (n=3-5/ group).
B A
Ctrl a-CD8α Ctrl a-CD8α
Ly6C
hi m
onoc
ytes
/µl
Seru
m C
CL2
(pg/
ml)

MP/
mg
of ti
ssue
CM
P (%
MP)
Ctrl a-CD8α
Ctrl a-CD8α
Ctrl a-CD8α
CM
P/m
g of
tiss
ue
GM
P/m
g of
tiss
ue
Ctrl a-CD8α G
MP
(% M
P)
Ctrl a-CD8α
A B
C
D
E
Figure S VIII: Myeloid progenitors in spleens of HFD-fed mice. A) Absolute numbers of MP; B) frequencies of CMP among MP and C) absolute cell numbers; D) frequencies of GMP among MP and E) absolute cell numbers in spleens of Control (Ctrl) or anti-CD8α-treated Ldlr-/- mice fed a HFD for 6 weeks (n=7-8/ group). *p<0.05.
0.07
*
**

Figure S IX: Effect of CD8+ T cells depletion on neutrophil levels. Absolute numbers of neutrophils in A) bone marrow, B) blood, C) spleen, D) aortic root and E) aorta of control (Ctrl) or anti-CD8α treated Ldlr-/- mice fed a HFD for 6 weeks (n=6-8/ group). *p<0.05.
A
0 Ctrl a-CD8α
Neu
troph
ils
x103 /m
g of
tiss
ue
Neu
troph
ils/µ
l
800
600
400
200
Neu
troph
ils /o
rgan
30
Ctrl a-CD8α Ctrl a-CD8α Ctrl a-CD8α
20
10
0
B C D Bone Marrow Blood Spleen Aortic root
Neu
troph
ils /o
rgan
E Aorta
Ctrl a-CD8α
6000
4000
2000
0
Neu
troph
ils
x106 /1
fem
ur

Figure S X: Myeloid progenitors in chow fed mice bone marrow. A) Frequencies of MP among total cells and B) absolute numbers of MP in the femur; C) frequencies of CMP among MP and D) absolute cell numbers; E) frequencies of GMP among MP and F) absolute cell numbers in bone marrow of control (Ctrl) or anti-CD8α-treated Ldlr-/- mice fed a normal chow for 6 weeks (n=6/group). *p<0.05.
C
A
E
*
MP
(% to
tal c
ells
) C
MP
(% M
P)
GM
P (%
MP)
Ctrl
Ctrl a-CD8α Ctrl a-CD8α
30 40
CM
P x1
03/1
fem
ur
GM
P x1
03/1
fem
ur
20
10
0
30
20
10
0 Ctrl a-CD8α Ctrl a-CD8α
100
80
60
40
20
0 M
P x1
03/1
fem
ur
B
D F
a-CD8α Ctrl a-CD8α
n.s.
n.s.

CM
P (%
MP)
GM
P (%
MP)
MP
/mg
of ti
ssue
CM
P /m
g of
tiss
ue
GM
P /m
g of
tiss
ue
Ctrl a-CD8α Ctrl a-CD8α
Ctrl a-CD8α
Ctrl a-CD8α
Ctrl a-CD8α
A B
D
C
E
Figure S XI: Myeloid progenitors in spleens of chow fed mice. A) Absolute numbers of MP; B) frequencies of CMP among MP and C) absolute cell numbers; D) frequencies of GMP among MP and E) absolute cell numbers in spleens of control (Ctrl) or anti-CD8α-treated Ldlr-/- mice fed a HFD for 6 weeks (n=6/ group).

Figure S XII: Monocyte levels in bone marrow and spleens of chow fed mice. a) Percent of CD115+Ly6Chi monocytes in bone marrow cells and B) splenic counts of CD115+Ly6Chi monocytes in control (Ctrl) or anti-CD8α treated Ldlr-/- mice fed a normal chow for 6 weeks (n=6/group). **p<0.01.
Ly6C
hi m
onoc
ytes
/mg
sple
en B A
Ly6C
hi m
onoc
ytes
(%
tota
l cel
ls)
Ctrl a-CD8α Ctrl a-CD8α
**

Figure S XIII: CD8+ T cell depletion and plaque formation in anti-CD8β treated mice. CD8+ T cells counts in the A) blood and B) spleen; C) Lesion coverage in the aortic arch, D) lesion size in the aortic root and E) macrophage content of aortic root plaques in mice treated with Ctrl or anti-CD8β antibodies and fed a HFD for 6 weeks. n=7-11/group. *p<0.05, ***p<0.001.
A B
C D E
0.16 0.06
200
150
100
50
0
Plaq
ue a
rea
x103
µm2
Ctrl a-CD8β Ctrl a-CD8β
Ctrl a-CD8β Ctrl a-CD8β Ctrl a-CD8β
CD
8+ T
cel
ls x
103 /
mg 150
100
50
0
Lesi
on a
rea
(% to
tal a
rea)
Mac
roph
age
area
(%
tota
l pla
que
area
)
30
20
10
0
80
60
40
0
20

A B C
*
Ctrl a-CD8β Ctrl a-CD8β Ctrl a-CD8β
Ly6C
high
mon
ocyt
es/µ
l
Ly6C
low m
onoc
ytes
/µl
CM
P x1
03/1
fem
ur
GM
P x1
03/ 1
fem
ur
20
25
15
10
5
0
40
30
20
10
0
D E F
*
Ctrl a-CD8β Ctrl a-CD8β Ctrl a-CD8β
Ly6C
hi m
onoc
ytes
/fe
mur
(x10
5 )
20
15
10
5
0
G
Ctrl a-CD8β
Mon
ocyt
es/m
g of
tiss
ue
Figure S XIV: Monocytes and bone marrow myeloid progenitors in anti-CD8β treated mice. Blood counts of A) Ly6Chi and B) Ly6Clo monocytes and of C) neutrophils; bone marrow counts of D) Ly6Chi monocytes, E) common myeloid progenitors (CMP) and F) granulocyte-monocyte progenitors; and G) splenic counts of Ly6Chi monocytes in mice treated with Ctrl or anti-CD8β antibodies and fed HFD for 6 weeks. n=8-9/group.

0.5 0.010
0.020
0.4
0.3
0.2 0.1 0.0
0.008
0.006
0.004 0.002 0.000
GM
-CSF
+ (%
tota
l cel
ls)
CD
45- G
M-C
SF+
(% to
tal c
ells
)
0.015
0.010
0.050
0.000 IL-6
+ (%
tota
l cel
ls)
CD
45- IL
-6+ (
% to
tal c
ells
)
1.5
1.0
0.5
0.0
Figure S XV: CD8+ T cell depletion reduces levels of GM-CSF and IL-6 producing cells in the bone marrow. Representative FACS plots of A) GM-CSF and D) IL-6 expression in total bone marrow cells and quantification of B) GM-CSF+ cells, E) IL-6+ cells, C) CD45-GM-CSF+ and F) CD45-IL-6+ cells in the bone marrow of Ldlr-/- mice fed a HFD for 6 weeks and treated with control (Ctrl) or anti-CD8β antibodies. n=10-11/group. *p<0.05, **p<0.01.
Ctrl anti-CD8β
GM-CSF
SSC
-A
GM-CSF
SSC
-A
Ctrl anti-CD8β
IL-6
SSC
-A
IL-6
SSC
-A
C B A
F E D
Ctrl a-CD8β Ctrl a-CD8β
Ctrl a-CD8β Ctrl a-CD8β
0.7% 0.2%
1.3% 0.7%

Ctrl a-CD8α
IFNγ+ cells IFNγ+ %CD45+
% o
f CD
45+ I
FNγ+
CD8+ CD8-
IFNγ
SS
C-A
CD45 C
D8
Figure S XVI: CD8+ T cells are the main source of IFNγ in the bone marrow. Representative gating of A) IFNγ-producing cells among total CD45+ leukocytes and B) CD8+ vs. CD8- cells; C) distribution of CD8+ vs. CD8- cells among IFNγ-producing cells in the bone marrow of Control (Ctrl) antibody treated mice after 6 weeks of HFD feeding. D) Percentages of IFNγ-producing cells among total CD45+ cells in the bone marrow of Ctrl vs. or anti-CD8α treated Ldlr-/- mice after 6 weeks of HFD feeding (n=7-8/group). **p<0.01, ***p<0.001.
B A
C D
IFNγ+
cel
ls
(% o
f CD
45+ c
ells
)
2.4%
58.6%
41.0%
** ***

Figure S XVII: IFNγ neutralization in hypercholesterolemic mice Analysis of A) MP frequencies in percent of total bone marrow cells and B) CMP and C) GMP frequencies among MP in bone marrow, absolute counts of D) Ly6Chi and e) Ly6Clo monocytes in blood and F) total monocytes in percent of total bone marrow cells in control and anti-IFNγ treated Ldlr-/- mice after 3 weeks of HFD feeding (n=5-12/ group); *p<0.05, **p<0.01.
0.3
0.2
0.1
0
MP
(% to
tal c
ells
)
Ctrl a-IFNγ
%MP
A
60
40
20
0 C
MP
(% M
P)
Ctrl a-IFNγ
*
CMP (%MP) B
40
30
20
10
0
GM
P (%
MP)
Ctrl a-IFNγ
0.06
GMP (%MP) C
CD
115+
Ly6C
hi m
onoc
ytes
(%
tota
l cel
ls)
BM monocytes
Ctrl a-IFNγ
Blood Ly6Clo monocytes
Ly6C
lo m
onoc
ytes
/µl
Ctrl a-IFNγ
Blood Ly6Chi monocytes
Ly6C
hi m
onoc
ytes
/µl
Ctrl a-IFNγ
D E F
**
** 0.07