Embed Size (px)
Citation preview
lrmNtto(ampXcsdAspntADmphlptLlfcAdAia
4
Molecular Phylogenetics and EvolutionVol. 12, No. 3, August, pp. 250–272, 1999Article ID mpev.1999.0615, available online at http://www.idealibrary.com on
1CA
Molecular Phylogenetics, tRNA Evolution, and HistoricalBiogeography in Anguid Lizards and Related Taxonomic Families
J. Robert Macey,*,1 James A. Schulte II,* Allan Larson,* Boris S. Tuniyev,†Nikolai Orlov,‡ and Theodore J. Papenfuss§
*Department of Biology, Box 1137, Washington University, St. Louis, Missouri 63130; †Caucasian State Biosphere Reserve,Sochi, Russia; ‡Zoological Institute, Russian Academy of Sciences, St. Petersburg, Russia;and §Museum of Vertebrate Zoology, University of California, Berkeley, California 94720
Received December 24, 1997; revised October 15, 1998
pqppatMcrdpeepTs
Arp
hptffarAeiEAE
f(g
Phylogenetic relationships among lizards of the fami-iesAnguidae,Anniellidae, Xenosauridae, and Shinisau-idae are investigated using 2001 aligned bases ofitochondrial DNA sequence from the genes encodingD1 (subunit one of NADH dehydrogenase), tRNAIle,
RNAGln, tRNAMet, ND2, tRNATrp, tRNAAla, tRNAAsn,RNACys, tRNATyr, and COI (subunit I of cytochrome cxidase), plus the origin for light-strand replicationOL) between the tRNAAsn and the tRNACys genes. Theligned sequences contain 1013 phylogenetically infor-ative characters. A well-resolved phylogenetic hy-
othesis is obtained. Because monophyly of the familyenosauridae (Shinisaurus and Xenosaurus) is statisti-ally rejected, we recommend placing Shinisaurus in aeparate family, the Shinisauridae. The family Annielli-ae and the anguid subfamilies Gerrhonotinae andnguinae each form monophyletic groups receivingtatistical support. The Diploglossinae*, which ap-ears monophyletic, is retained as a metataxon (de-oted with an asterisk) because its monophyly is statis-ically neither supported nor rejected. The familynguidae appears monophyletic in analyses of theNA sequence data, and statistical support for itsonophyly is provided by reanalysis of previously
ublished allozymic data. Anguid lizards appear toave had a northern origin in Laurasia. Taxa currently
ocated on Gondwanan plates arrived there by dis-ersal from the north in two separate events, one fromhe West Indies to South America and another from aaurasian plate to Morocco. Because basal anguine
ineages are located in western Eurasia and Morocco,ormation of the Atlantic Ocean (late Eocene) is impli-ated in the separation of the Anguinae from its Northmerican sister taxon, the Gerrhonotinae. Subsequentispersal of anguine lizards to East Asia and Northmerica appears to have followed the Oligocene dry-
ng of the Turgai Sea. The alternative hypothesis, thatnguine lizards originated in North America and dis-
1 To whom correspondence should be addressed. Fax: (314) 935-
N432. E-mail: [email protected].250055-7903/99 $30.00opyright r 1999 by Academic Pressll rights of reproduction in any form reserved.
ersed to Asia via the Bering land bridge with subse-uent colonization of Europe and Morocco, requires ahylogenetic tree seven steps longer than the mostarsimonious hypothesis. North African, European,nd West Asian anguines were isolated from others byhe rapid uplift of Tibet in the late Oligocene to
iocene. Phylogenetic analysis of evolutionaryhanges in the gene encoding tRNACys suggests gradualeduction of dihydrouridine (D) stems by successiveeletion of bases in some lineages. This evolutionaryattern contrasts with the one observed for parallellimination of the D-stem in mitochondrial tRNAs ofight other reptile groups, in which replication slip-age produces direct repeats. An unusual, enlargedcC (T) stem is inferred for tRNACys in mostpecies. r 1999 Academic Press
Key Words: Reptilia; Sauria; Anguimorpha; Anguidae;nniellidae; Shinisauridae; Xenosauridae; Asia; Eu-ope; Morocco; North America; historical biogeogra-hy; mitochondrial DNA; cysteine tRNA; phylogenetics
Anguid lizards, found predominately in the northernemisphere, are an exciting group for a molecularhylogenetic study of biogeographic fragmentation be-ween North America and Eurasia. The anguimorphamily Anguidae contains three subfamilies. The sub-amily Gerrhonotinae occurs strictly in North Americand Central America. The subfamily Diploglossinaeanges from Mexico and the West Indies to Southmerica. The subfamily Anguinae, comprising the gen-ra Anguis and Ophisaurus, is the only anguid subfam-ly that occurs in the Old World. Anguis is restricted tourope, whereas Ophisaurus is found in eastern Northmerica, eastern Asia, western Asia, and adjacenturope and Morocco.Some taxonomists consider the anguimorph lizard
amily Anniellidae a fourth subfamily of the Anguidaesee Gauthier, 1982). It comprises two species, Anniellaeronimensis and A. pulchra, from the west coast of
orth America. Three major hypotheses have been
cdgt((
NSt1r
nalOiipOO
esnfEAcGCoakcBfaGp
noetcaI
ts(g
Wd
paddq
aDtdtt(rt
1oct
smKeqsVcD(albaDgDbptabps(thtbAthb
251PHYLOGENETICS AND BIOGEOGRAPHY OF ANGUID LIZARDS
onsidered for the phylogenetic position of the Annielli-ae relative to the Anguidae: (1) Anniella is the sisterroup to all anguid taxa (Good, 1987), (2) Anniella ishe sister group to the Anguinae (Gauthier, 1982), and3) Anniella is the sister taxon to Anguis of EuropeKeqin and Norell, 1998).
The anguimorph family Xenosauridae occurs in theew World (Xenosaurus) and Old World (Shinisaurus).ome authors consider Shinisaurus a separate mono-ypic family, the Shinisauridae (see Zhao and Adler,993). No previous molecular study has examined theelationships of these taxa.A major question within the Anguinae is the phyloge-
etic position of Anguis fragilis, Ophisaurus apodus,nd O. koellikeri, which occur between two extremelyarge barriers to faunal distributions, the Atlanticcean and the Tibetan Plateau. Current taxonomy
mplies at least two separate origins of anguid lizardsn this region. Mitochondrial DNA sequences are re-orted for these taxa as well as for the East Asian. harti and the North American O. attenuatus and. ventralis.We examine all genera within the Gerrhonotinae
xcept Coloptychon, which is known from only threepecimens. Abronia oaxacae, Barisia imbricata, Gerrho-otus liocephalus, and Mesaspis moreleti represent the
our tropical genera in our analysis. Five species oflgaria, primarily from the temperate part of Northmerica, are examined. Elgaria coerulea, sampled fromoastal California, is the most northern species of theerrhonotinae. Two other species are included fromalifornia, E. multicarinata collected from the east sidef the Sierra Nevada and E. panamintina from andjacent population in the Inyo Mountains. Elgariaingii, sampled from Arizona, occurs along the westoast of Mexico in the Sierra Madre Occidental oppositeaja California where E. paucicarinata was obtained
rom the Sierra de La Laguna. This choice of speciesllows an examination of taxa from both sides of theulf of California, a region of rifting between tectoniclates.All genera of the neotropical subfamily Diploglossi-
ae are examined. Ophiodes striatus represents thenly endemic anguid genus in South America. Celestusnneagrammus from Mexico and Diploglossus biloba-us from Costa Rica represent mainland North Ameri-an diploglossines, and Diploglossus pleei, Sauresiagasepsoides, and Wetmorena haetiana represent Westndian taxa.
Our sampling includes a comprehensive representa-ion of species in the Anniellidae (Anniella geronimen-is and A. pulchra) and genera of the XenosauridaeShinisaurus crocodilurus from China and Xenosaurusrandis from Mexico).Heloderma suspectum and Varanus griseus, Neworld and Old World representatives of the Varanoi-
ea, serve as outgroups to root the tree. Previous d
hylogenetic analyses of morphological data (Estes etl., 1988; Macey et al., 1997a; Schwenk, 1988) cannotetermine whether the Varanoidea or the Xenosauri-ae is closer to the anguid and anniellid clade; thisuestion, however, is not a focus of this study.Phylogenetic relationships are examined using 2001
ligned positions (1013 informative) of mitochondrialNA sequence. The region sequenced extends from
he protein-coding gene, ND1 (subunit one of NADHehydrogenase), through the genes encoding tRNAIle,RNAGln, tRNAMet, ND2, tRNATrp, tRNAAla, tRNAAsn,RNACys, and tRNATyr to the protein-coding gene COIsubunit I of cytochrome c oxidase), and includes theeplication origin for the light strand (OL) between theRNAAsn and the tRNACys genes.
Previously published allozymic data (Good, 1987,988) are reanalyzed and compared with the resultsbtained from the new DNA sequence data to provide aomprehensive assessment of relationships among theaxa investigated.
The mitochondrial genomic region sequenced demon-trates several unusual characteristics among squa-ate reptiles (Kumazawa and Nishida, 1995;umazawa et al., 1996; Macey et al., 1997a,b,c; Seutin
t al., 1994). Within anguimorph lizards, gene se-uences encoding tRNACys lack a dihydrouridine (D)tem and instead contain a D-arm replacement loop inaranus (Macey et al., 1997b). A model involving repli-ation slippage has been proposed for the formation of-arm replacement loops in mitochondrial tRNAs
Macey et al., 1997b). Under this model direct repeatsre expected and the size of the D-arm replacementoop should be less than 12 bases, the minimum num-er of bases normally found between the amino acid-cceptor (AA) and the anticodon (AC) stems when a-stem is present (Macey et al., 1997b). Alternatively,radual relaxation of pairing among bases in the-stem would not produce either repeats or deletion ofases. Gradual deletion of bases or base pairs would notroduce repeats but could produce length variationhat may result in less than 12 bases between the AA-nd AC stems. Under a model of gradual deletion ofases or base pairs, a tRNA that has a single baseairing in the D-stem could result, as has been ob-erved in the tRNAAsn gene of the frog, Xenopus laevisDirheimer et al., 1995; Roe et al., 1985). MitochondrialRNAs that have a single base pairing in the D-stemave a tertiary structure distinct from both standardRNAs and tRNAs in which no pairings are observedetween the AA- and AC-stems (Steinberg et al., 1994).
phylogenetic analysis of secondary structure forRNACys within the Anguimorpha serves to test theypothesis that D-arm replacement loops are formedy replication slippage versus gradual relaxation or
eletion of bases within the D-stem.
S
maCMCtoSRadanmMhtG
a(ijMMbMbNANBC2ttCAp5Ad4WkR3lcAHO
AScWCACpSmNCC(PktAB3asw4mA3OsCS
L
QDiwNfiaR2DwCmaaif
pLLB
252 MACEY ET AL.
MATERIALS AND METHODS
pecimen Information
Museum numbers and localities for voucher speci-ens from which DNA was extracted, and GenBank
ccession numbers are presented below. Acronyms areAS for California Academy of Sciences, San Francisco;VZ for Museum of Vertebrate Zoology, University ofalifornia at Berkeley; USNM for United States Na-
ional Museum, Washington, DC; UTA-R for Universityf Texas at Arlington; and ZISP for Zoological Institute,t. Petersburg, Russia. Acronyms followed by a dashM or TP represent field numbers of the first or sixthuthor, respectively, for uncatalogued specimens beingeposited in the Museum of Vertebrate Zoology. Thecronym followed by a dash SBH represents a fieldumber of S. Blair Hedges for an uncatalogued speci-en being deposited in the United States Nationaluseum. The three previously reported sequences
ave been extended by 303 bases to include 101 addi-ional amino acid positions of the ND1 gene, and theenBank accessions have been updated accordingly.Heloderma suspectum: no voucher, AF085603, prob-
bly Arizona. Varanus griseus: ZISP 19576, U71334Macey et al., 1997a), east side of Nephtezavodsk whichs 30 km WNW of Deynau (39° 158N 63° 118E), Chard-ou Region, Turkmenistan. Shinisaurus crocodilurus:
VZ 204291, AF085604, China. Xenosaurus grandis:VZ 137789, U71333 (Macey et al., 1997a), slopes
ehind Casa de Miguel Ceron, Cuatlapan, Veracruz,exico. Anniella geronimensis: MVZ 134196,AF085605,
each, 3.5 miles W of Colonia Guerrero, Baja Californiaorte, Mexico. Anniella pulchra: MVZ-TP24334,F085606, SW 1/4 Sec. 23, T. 2 N., R. 2 E., sand dune onside of railroad tracks, 0.2 miles SE Jct of Hwy 4 and
ig Break Road, Oakley, Contra Costa Co., California.elestus enneagrammus: MVZ 191045, AF085607, Elev.125 m, La Joya, Veracruz, Mexico. Diploglossus biloba-us: MVZ 207334, AF085608, 3.3 km E ranch headquar-ers at Moravia on road to indian reservation, Prov.artago, Costa Rica. Diploglossus pleei: MVZ-TP24475,F085609, Bosque de Guajataca, Vereda Salome, ap-rox. 7 km airline SW Quebradillas (18° 24.58 N 66°7.88 W), Puerto Rico. Ophiodes striatus: MVZ 191047,F085610, Edo. Sao Paulo, Brazil. Sauresia agasepsoi-es: USNM-SBH194829, AF085611, Bucan Detwi (17°4.08 N 71° 30.38 W), Pedernales, Dominican Republic.etmorena haetiana: USNM 328858, AF085612, 15.3m S, 6.7 km E (by road) Cabral, Barahona, Dominicanepublic. Barisia imbricata: MVZ 191048, AF085613,070 m, Mex. Hwy 190, Mexico, Mexico. Gerrhonotusiocephalus: UTA-R-12225, AF085614, 2377 m, El Tejo-ote, Oaxaca, Mexico. Abronia oaxacae: MVZ 144197,F085615, Cerro San Felipe, 20 km NNE of Oaxaca (bywy 175) to La Cumbre then 4 km NW (by dirt road),
axaca, Mexico. Mesaspis moreleti: MVZ 143472, TF085616, Elev. 9550 ft., 4.5 km by Road E of Todosantos, Depto. Huehuetenango, Guatemala. Elgariaoerulea: MVZ-TP24365, AF085617, San Pablo Ridge,ildcat Canyon Road at Inspiration Point, Contraosta Co., California. E. kingii: MVZ-RM1192,F085618, 10.2 miles NE of Tanque Verde Road onatalina Hwy (Mt. Lemmon Rd.), Pima Co., Arizona. E.aucicarinata: MVZ 191079, AF085619, La Laguna,ierra de La Laguna, Baja California Sur, Mexico. E.ulticarinata: MVZ 227733, AF085620, Elev. 5700 ft.,E 1/4 Sec. 16, T. 13 S., R. 34 E., south fork of Oakreek, 5.0 miles west (airline) of Independence, Inyoo., California. E. panamintina: MVZ 227761, U82692
Macey et al., 1997c), Elev. 2030 m, 10.1 miles E of Bigine on Hwy 168, Inyo Co., California. Ophisaurusoellikeri: MVZ 178120, AF085621, 10.1 km S of Keni-ra (34° 168 N 6° 368 W) on P-29A, Kenitra, Morocco.nguis fragilis: MVZ 219518, AF085622, 2 km SE ofabukal, also 53 km ENE of Dagomys (43° 408 N 39°88 E) on road, Krasnodarsky Territory, Russia. Ophis-urus apodus: CAS 182911, AF085623, Tersko-Kum-kaya Nizmennast, 3 km WNW of Voskresenskaya,hich is approx. 25 km NNW of Gudermes (43° 218 N6° 068 E), Schelkovskaya District, Chechenia Autono-ous Republic, Russia. O. harti: MVZ 224111,F085624, Elev. 900–1100 m, Tam Dao (21° 278 N 105°78 E), Vihn Yen District, Vihn Thu Province, Vietnam.. attenuatus: MVZ-RM10468, AF085625, 2.4 miles
outh of Weldon Springs at I-40 on Hwy 94, St. Charleso., Missouri. O. ventralis: MVZ 137541, AF085626,urf City, Pender Co., North Carolina.
aboratory Protocols
Genomic DNA was extracted from liver using theiagen QIAamp tissue kit. Amplification of genomicNA featured a denaturation at 94°C for 35 s, anneal-
ng at 50°C for 35 s, and extension at 70°C for 150 sith 4 s added to the extension per cycle, for 30 cycles.egative controls were run for all amplifications. Ampli-ed products were purified on 2.5% Nusieve GTGgarose gels and reamplified under similar conditions.eamplified double-stranded products were purified on.5% acrylamide gels (Maniatis et al., 1982). TemplateNA was eluted from acrylamide passively over 3 daysith Maniatis elution buffer (Maniatis et al., 1982).ycle-sequencing reactions were run using the Pro-ega fmol DNA-sequencing system with a denatur-
tion at 95°C for 35 s, annealing at 45–60°C for 35 s,nd extension at 70°C for 1 min for 30 cycles. Sequenc-ng reactions were run on Long Ranger sequencing gelsor 5–12 h at 38–40°C.
Amplifications from genomic DNA used differentrimer combinations (Table 1): (1) L3002-H4419b, (2)4160-H4980, (3) L4437-H5934, (4) L3878-H4980, (5)3881-H5934, (6) L4221-H5934, and (7) L4437-H6564.oth strands were sequenced using the primers in
able 1. Primer numbers refer to the 38 end on the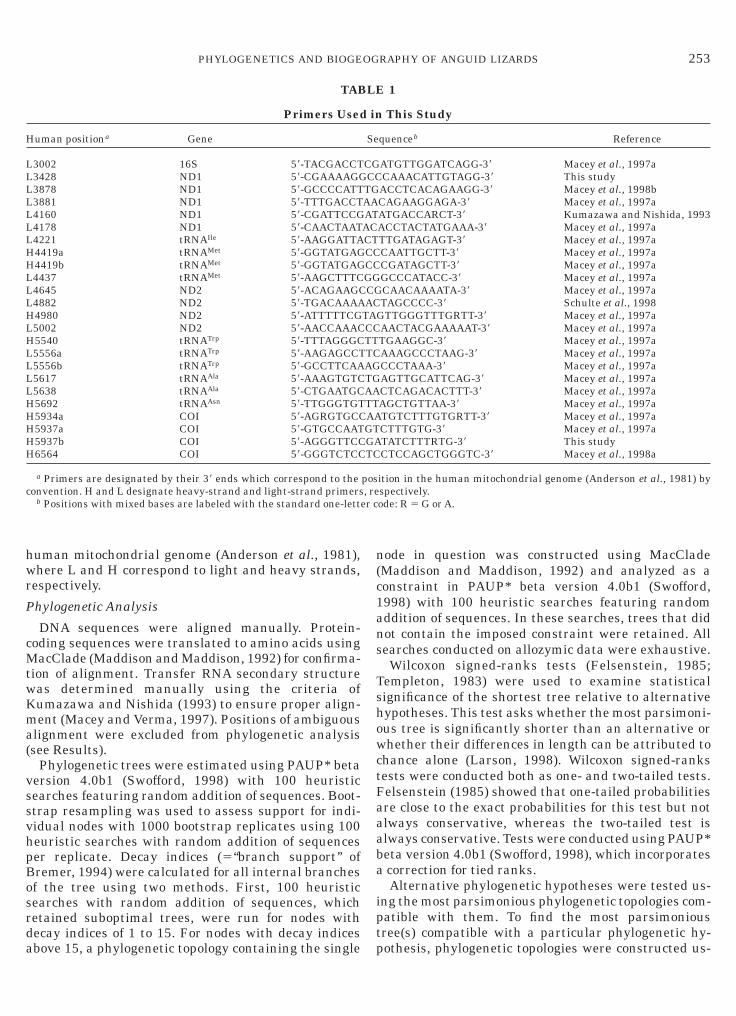
hwr
P
cMtwKma(
vssvhpBosrda
n(c1ans
TshowctFaaaba
ipt
H
LLLLLLLHHLLLHLHLLLLHHHHH
cer c
253PHYLOGENETICS AND BIOGEOGRAPHY OF ANGUID LIZARDS
uman mitochondrial genome (Anderson et al., 1981),here L and H correspond to light and heavy strands,
espectively.
hylogenetic Analysis
DNA sequences were aligned manually. Protein-oding sequences were translated to amino acids usingacClade (Maddison and Maddison, 1992) for confirma-
ion of alignment. Transfer RNA secondary structureas determined manually using the criteria ofumazawa and Nishida (1993) to ensure proper align-ent (Macey and Verma, 1997). Positions of ambiguous
lignment were excluded from phylogenetic analysissee Results).
Phylogenetic trees were estimated using PAUP* betaersion 4.0b1 (Swofford, 1998) with 100 heuristicearches featuring random addition of sequences. Boot-trap resampling was used to assess support for indi-idual nodes with 1000 bootstrap replicates using 100euristic searches with random addition of sequenceser replicate. Decay indices (5‘‘branch support’’ ofremer, 1994) were calculated for all internal branchesf the tree using two methods. First, 100 heuristicearches with random addition of sequences, whichetained suboptimal trees, were run for nodes withecay indices of 1 to 15. For nodes with decay indices
TAB
Primers Used
uman positiona Gene
3002 16S 58-TACGACCT3428 ND1 58-CGAAAAGG3878 ND1 58-GCCCCATT3881 ND1 58-TTTGACCT4160 ND1 58-CGATTCCG4178 ND1 58-CAACTAAT4221 tRNAIle 58-AAGGATTA4419a tRNAMet 58-GGTATGAG4419b tRNAMet 58-GGTATGAG4437 tRNAMet 58-AAGCTTTC4645 ND2 58-ACAGAAGC4882 ND2 58-TGACAAAA4980 ND2 58-ATTTTTCG5002 ND2 58-AACCAAAC5540 tRNATrp 58-TTTAGGGC5556a tRNATrp 58-AAGAGCCT5556b tRNATrp 58-GCCTTCAA5617 tRNAAla 58-AAAGTGTC5638 tRNAAla 58-CTGAATGC5692 tRNAAsn 58-TTGGGTGT5934a COI 58-AGRGTGCC5937a COI 58-GTGCCAAT5937b COI 58-AGGGTTCC6564 COI 58-GGGTCTCC
a Primers are designated by their 38 ends which correspond to theonvention. H and L designate heavy-strand and light-strand primers
b Positions with mixed bases are labeled with the standard one-lett
bove 15, a phylogenetic topology containing the single p
ode in question was constructed using MacCladeMaddison and Maddison, 1992) and analyzed as aonstraint in PAUP* beta version 4.0b1 (Swofford,998) with 100 heuristic searches featuring randomddition of sequences. In these searches, trees that didot contain the imposed constraint were retained. Allearches conducted on allozymic data were exhaustive.Wilcoxon signed-ranks tests (Felsenstein, 1985;
empleton, 1983) were used to examine statisticalignificance of the shortest tree relative to alternativeypotheses. This test asks whether the most parsimoni-us tree is significantly shorter than an alternative orhether their differences in length can be attributed to
hance alone (Larson, 1998). Wilcoxon signed-ranksests were conducted both as one- and two-tailed tests.elsenstein (1985) showed that one-tailed probabilitiesre close to the exact probabilities for this test but notlways conservative, whereas the two-tailed test islways conservative. Tests were conducted using PAUP*eta version 4.0b1 (Swofford, 1998), which incorporatescorrection for tied ranks.Alternative phylogenetic hypotheses were tested us-
ng the most parsimonious phylogenetic topologies com-atible with them. To find the most parsimoniousree(s) compatible with a particular phylogenetic hy-
1
This Study
quenceb Reference
ATGTTGGATCAGG-38 Macey et al., 1997aCAAACATTGTAGG-38 This studyACCTCACAGAAGG-38 Macey et al., 1998bCAGAAGGAGA-38 Macey et al., 1997aATGACCARCT-38 Kumazawa and Nishida, 1993ACCTACTATGAAA-38 Macey et al., 1997aTTGATAGAGT-38 Macey et al., 1997aCAATTGCTT-38 Macey et al., 1997aCGATAGCTT-38 Macey et al., 1997aGCCCATACC-38 Macey et al., 1997aCAACAAAATA-38 Macey et al., 1997aTAGCCCC-38 Schulte et al., 1998
GTTGGGTTTGRTT-38 Macey et al., 1997aAACTACGAAAAAT-38 Macey et al., 1997aTGAAGGC-38 Macey et al., 1997aAAAGCCCTAAG-38 Macey et al., 1997aCCCTAAA-38 Macey et al., 1997aAGTTGCATTCAG-38 Macey et al., 1997aCTCAGACACTTT-38 Macey et al., 1997aAGCTGTTAA-38 Macey et al., 1997aTGTCTTTGTGRTT-38 Macey et al., 1997aCTTTGTG-38 Macey et al., 1997aTATCTTTRTG-38 This studyCTCCAGCTGGGTC-38 Macey et al., 1998a
ition in the human mitochondrial genome (Anderson et al., 1981) byspectively.ode: R 5 G or A.
LE
in
Se
CGCCTGAAATACCTCCCCGGCGACTACCTTTCAGTGAATTAAGTGATC
pos, re
othesis, phylogenetic topologies were constructed us-
rrSaad
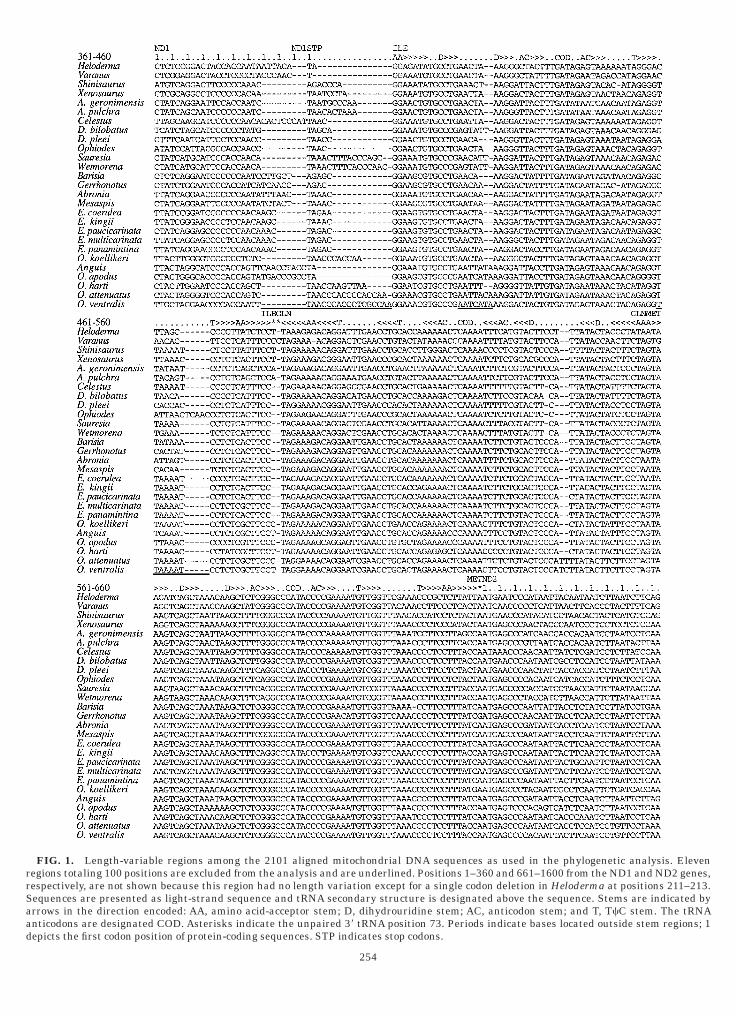
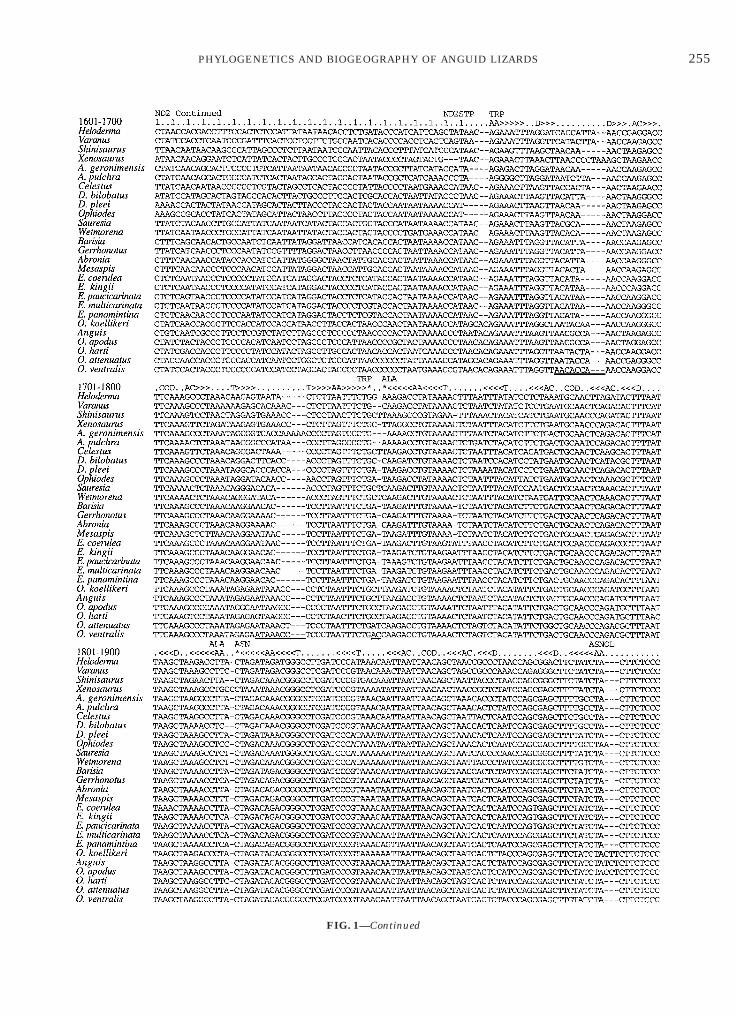
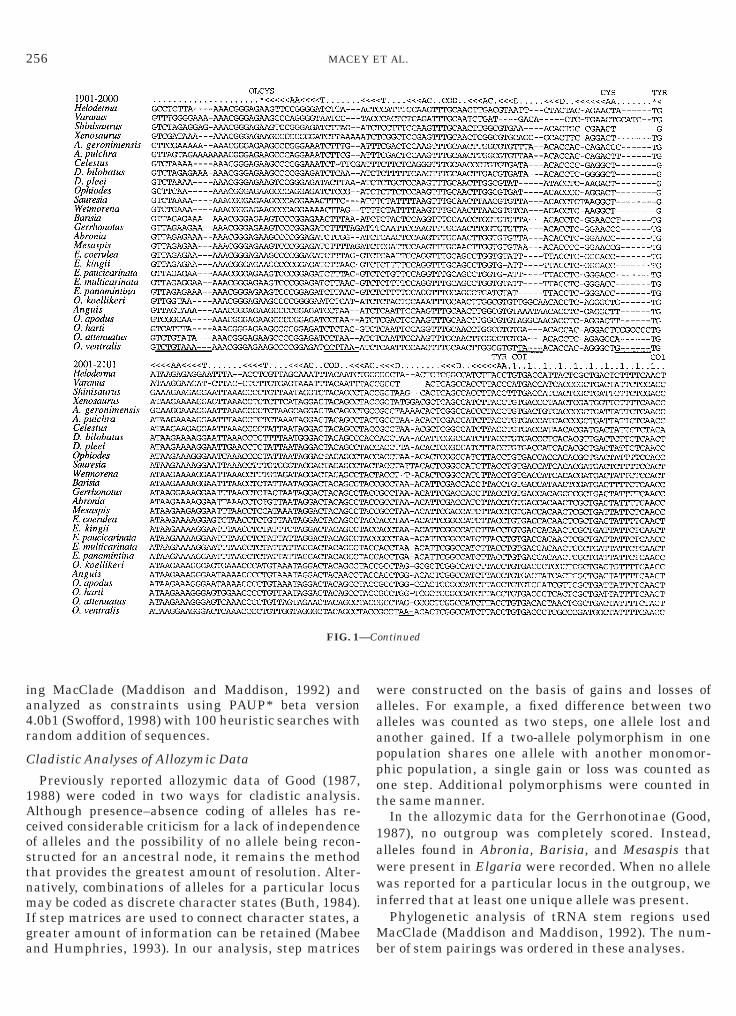
FIG. 1. Length-variable regions among the 2101 aligned mitochegions totaling 100 positions are excluded from the analysis and are uespectively, are not shown because this region had no length variatioequences are presented as light-strand sequence and tRNA secondarrows in the direction encoded: AA, amino acid-acceptor stem; D, dnticodons are designated COD. Asterisks indicate the unpaired 38 t
ondrial DNA sequences as used in the phylogenetic analysis. Elevennderlined. Positions 1–360 and 661–1600 from the ND1 and ND2 genes,n except for a single codon deletion in Heloderma at positions 211–213.ry structure is designated above the sequence. Stems are indicated byihydrouridine stem; AC, anticodon stem; and T, TcC stem. The tRNA
RNA position 73. Periods indicate bases located outside stem regions; 1epicts the first codon position of protein-coding sequences. STP indicates stop codons.
254
Continued
255PHYLOGENETICS AND BIOGEOGRAPHY OF ANGUID LIZARDS
FIG. 1—
ia4r
C
1AcostnmIga
waaappot
1awwi
M
256 MACEY ET AL.
ng MacClade (Maddison and Maddison, 1992) andnalyzed as constraints using PAUP* beta version.0b1 (Swofford, 1998) with 100 heuristic searches withandom addition of sequences.
ladistic Analyses of Allozymic Data
Previously reported allozymic data of Good (1987,988) were coded in two ways for cladistic analysis.lthough presence–absence coding of alleles has re-eived considerable criticism for a lack of independencef alleles and the possibility of no allele being recon-tructed for an ancestral node, it remains the methodhat provides the greatest amount of resolution. Alter-atively, combinations of alleles for a particular locusay be coded as discrete character states (Buth, 1984).
f step matrices are used to connect character states, areater amount of information can be retained (Mabee
FIG. 1—
nd Humphries, 1993). In our analysis, step matrices b
ere constructed on the basis of gains and losses oflleles. For example, a fixed difference between twolleles was counted as two steps, one allele lost andnother gained. If a two-allele polymorphism in oneopulation shares one allele with another monomor-hic population, a single gain or loss was counted asne step. Additional polymorphisms were counted inhe same manner.
In the allozymic data for the Gerrhonotinae (Good,987), no outgroup was completely scored. Instead,lleles found in Abronia, Barisia, and Mesaspis thatere present in Elgaria were recorded. When no alleleas reported for a particular locus in the outgroup, we
nferred that at least one unique allele was present.Phylogenetic analysis of tRNA stem regions usedacClade (Maddison and Maddison, 1992). The num-
ontinued
Cer of stem pairings was ordered in these analyses.
ma
A
qgccscptsDds1wn1rd
A
5aNttogpddgtpse4pcf
aPt(11De
atip(oDDC
ne1bnnitDo
AVTtsi
g(nou1
ce
V
tasrD
iafpTohtt
257PHYLOGENETICS AND BIOGEOGRAPHY OF ANGUID LIZARDS
RESULTS
Sequences ranging in size from 2034 to 2061 bases ofitochondrial DNA for 27 taxa of anguimorph lizards
re presented as 2101 aligned positions in Fig. 1.
uthentic Mitochondrial DNA
Several observations suggest that the DNA se-uences analyzed here are from the mitochondrialenome and are not nuclear-integrated copies of mito-hondrial genes (see Zhang and Hewitt, 1996). Protein-oding genes do not have premature stop codons,uggesting that these sequences represent functionalopies that encode a protein. Transfer-RNA genes ap-ear to code for tRNAs with stable secondary struc-ures, indicating functional genes. The presence oftrand bias further supports our conclusion that the 27NA sequences reported here are from the mitochon-rial genome. The sequences reported here show strongtrand bias against guanine on the light strand (G 5 11–4%, A 5 30–36%, T 5 22–29%, and C 5 25–35%),hich is characteristic of the mitochondrial genome butot the nuclear genome. See Macey et al. (1997a,c,998a) for similar strand bias across most squamate-eptile families for the same region of the mitochon-rial genome.
ssessment of Homology and Sequence Alignment
Sequences reported correspond to positions 3874 to936 on the human mitochondrial genome (Anderson etl., 1981). This sequence contains the genes encodingD1 (subunit one of NADH dehydrogenase), tRNAIle,
RNAGln, tRNAMet, ND2, tRNATrp, tRNAAla, tRNAAsn,RNACys, tRNATyr, and COI (subunit I of cytochrome cxidase), plus the OL between the tRNAAsn and tRNACys
enes (Fig. 1). Except for the last couple of codonositions in the ND1 and ND2 genes and a singleeletion of a codon position in the ND1 gene of Helo-erma, no length variation is found in protein-codingenes, making alignment straightforward. Among pro-ein-coding sequences, only the last few amino acidositions encoding ND1, the stop codon, and noncodingequences between the ND1 and tRNAIle genes arexcluded from phylogenetic analyses (positions 382–07) because of considerable length variation. Gaps arelaced in the Heloderma sequence in positions 211–213orresponding to codon position 71 of the ND1 generagment included in this study.
Among tRNA genes, a few loop regions are unalign-ble as are some noncoding sequences between genes.hylogenetic analyses do not include regions encodinghe dihydrouridine (D) and TcC (T) loops of the tRNAIle
positions 421–427, 460–471), tRNATrp (positions 1680–689, 1721–1730), and tRNACys (positions 1973–1977,935–1941) genes. Part of the region encoding the-loop of the tRNATyr gene (positions 2050–2052) also is
xcluded. cThe tRNACys gene can be particularly problematic tolign for phylogenetic analyses because gene sequenceshat do not encode a D-stem can have stem realignmentn the AA- and T-stems (Macey et al., 1997b). Thereviously published sequence for Varanus griseusMacey et al., 1997a,b) appears to be homologous tother sequences analyzed. Most of the bases from the-arm replacement loop are placed in the excluded-loop region in the alignment. In addition, the tRNA-
ys gene sequences from Elgaria kingii and E. paucicari-ata appear to have a T base deleted from the regionncoding the D-stem and a gap is placed at position970. In the tRNACys gene, the T-stem in some taxa maye extended beyond the normal five pairs. The phyloge-etic analysis includes only the five paired positionsormally observed. Sauresia has an unusual tRNACys
n which a T has been inserted in the region encodinghe AA-stem, forcing three bases between the AA- and-stems in the encoded tRNA. A gap is placed in allther taxa at position 1985.In the tRNAGln gene a deletion of an A from the
A-stem at position 486 appears to have occurred inaranus. This deletion has resulted in a realigned-stem. In the phylogenetic analysis a gap is placed inhe Varanus sequence at position 492, and the Varanusequence is aligned to the secondary structure observedn the other taxa.
Sequences between the tRNATrp and the tRNAAla
enes and between the tRNACys and the tRNATyr genespositions 1744–1745 and 1992–1998, respectively) areot used in the phylogenetic analyses. The loop regionf the replication origin for the light strand is mostlynalignable and therefore not used (positions 1902–912).Among the 2101 aligned positions only 100 sites,
onstituting less than 5% of the aligned sequences, arexcluded from the phylogenetic analyses.
ariation of Stems in tRNACys
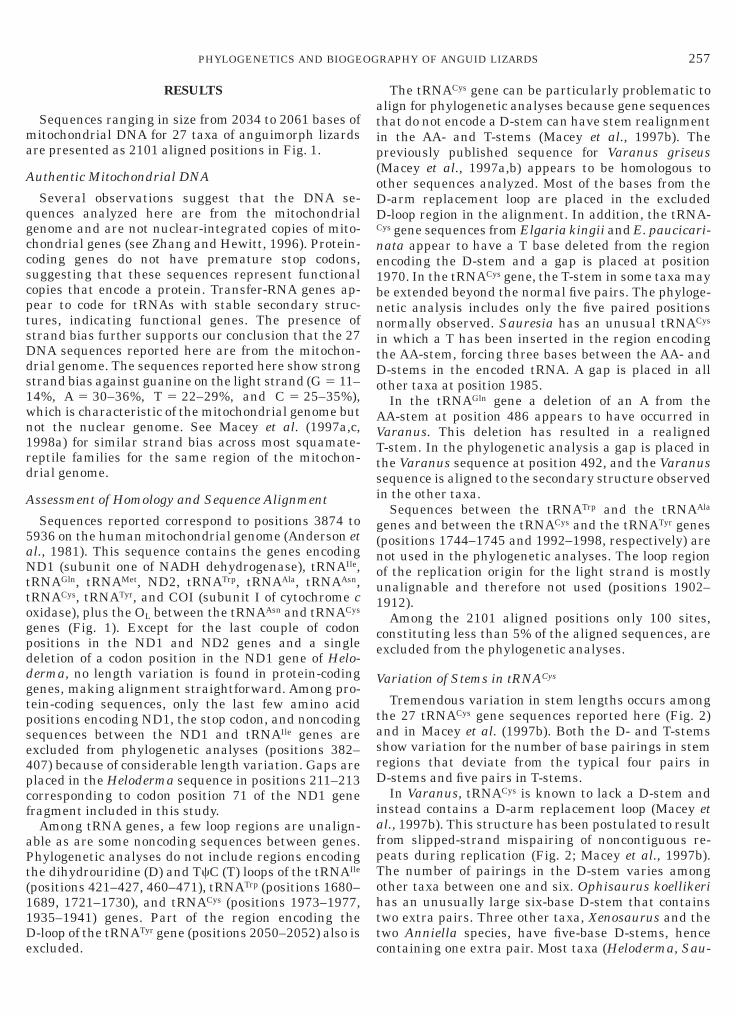
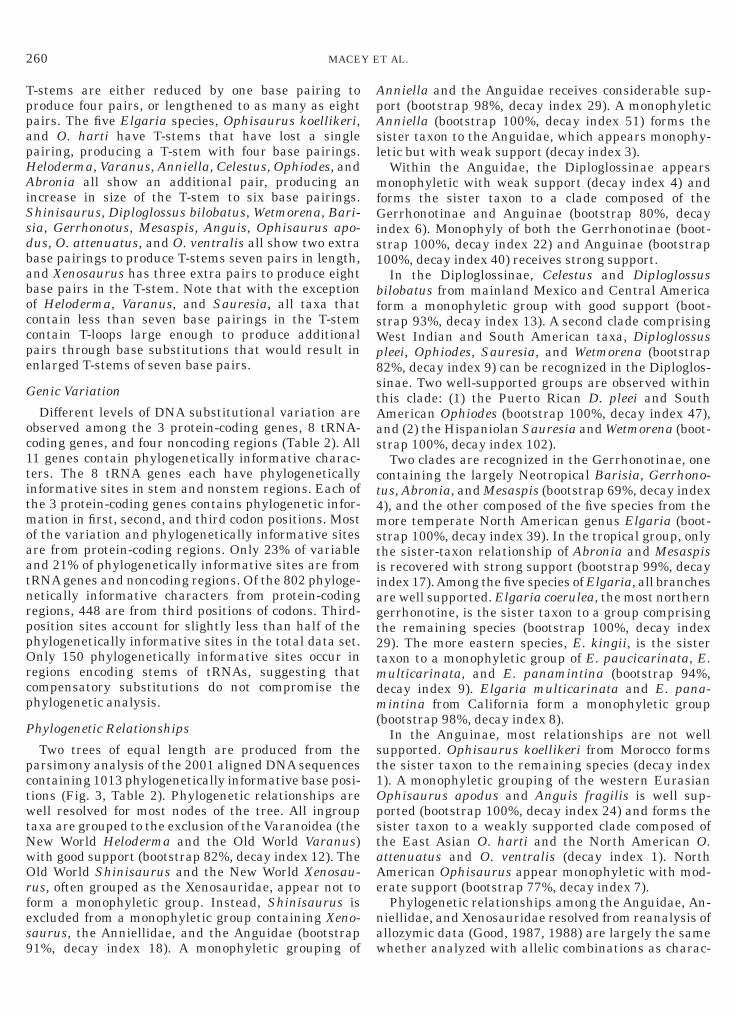
Tremendous variation in stem lengths occurs amonghe 27 tRNACys gene sequences reported here (Fig. 2)nd in Macey et al. (1997b). Both the D- and T-stemshow variation for the number of base pairings in stemegions that deviate from the typical four pairs in-stems and five pairs in T-stems.In Varanus, tRNACys is known to lack a D-stem and
nstead contains a D-arm replacement loop (Macey etl., 1997b). This structure has been postulated to resultrom slipped-strand mispairing of noncontiguous re-eats during replication (Fig. 2; Macey et al., 1997b).he number of pairings in the D-stem varies amongther taxa between one and six. Ophisaurus koellikerias an unusually large six-base D-stem that containswo extra pairs. Three other taxa, Xenosaurus and thewo Anniella species, have five-base D-stems, hence
ontaining one extra pair. Most taxa (Heloderma, Sau-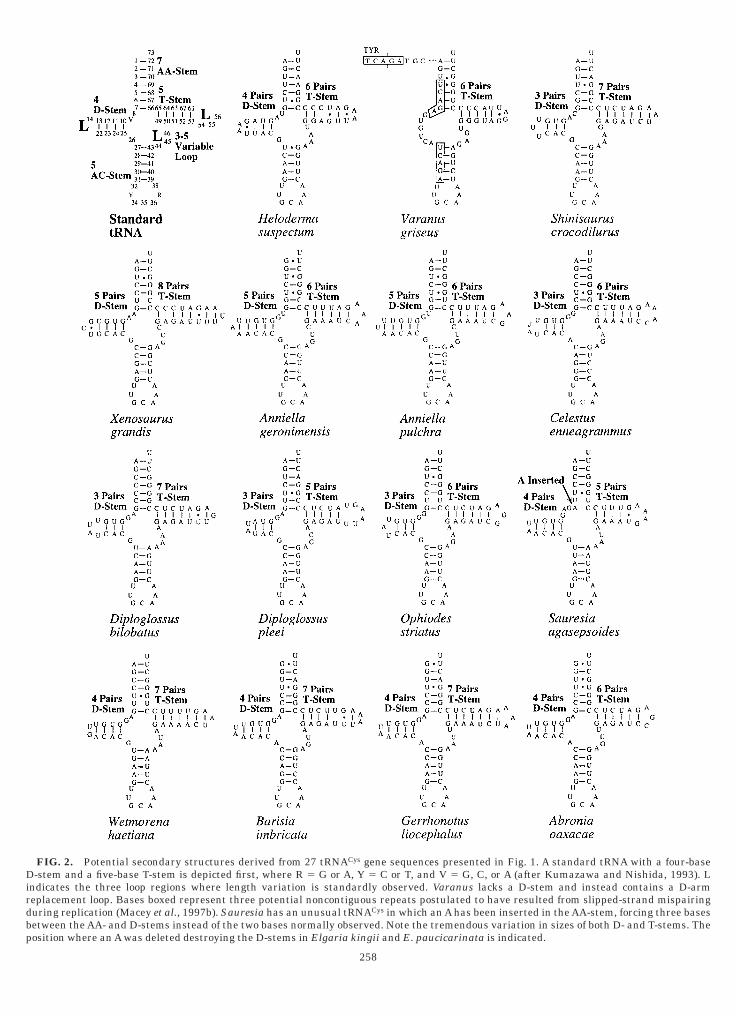
Dirdbp
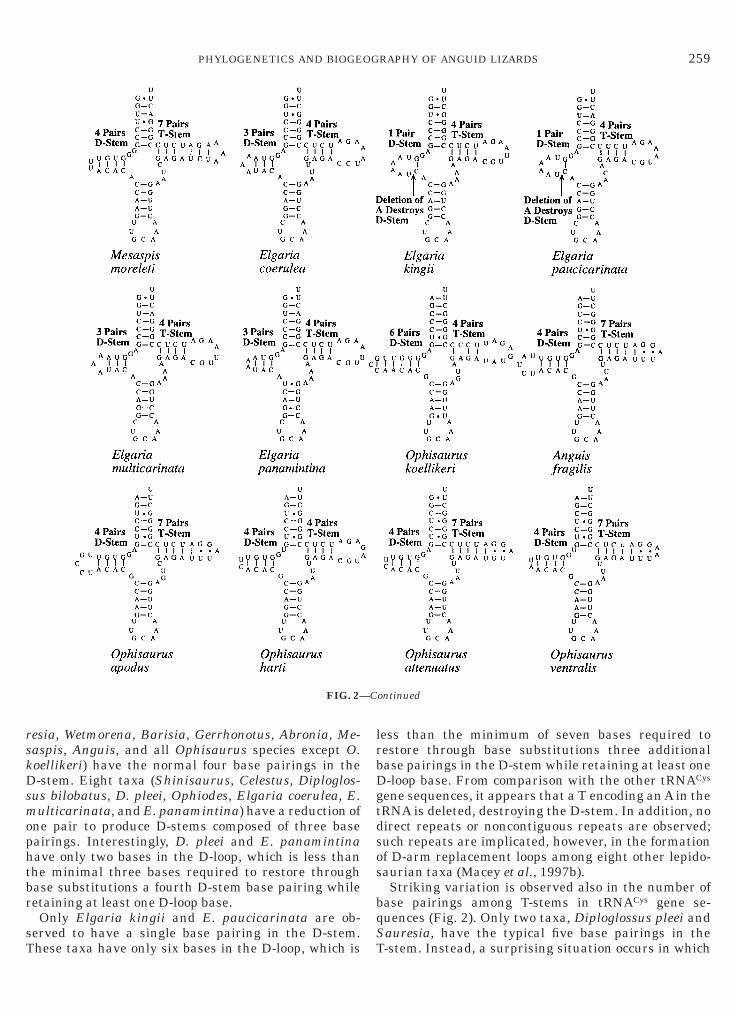
FIG. 2. Potential secondary structures derived from 27 tRNACys gene sequences presented in Fig. 1. A standard tRNA with a four-base-stem and a five-base T-stem is depicted first, where R 5 G or A, Y 5 C or T, and V 5 G, C, or A (after Kumazawa and Nishida, 1993). L
ndicates the three loop regions where length variation is standardly observed. Varanus lacks a D-stem and instead contains a D-armeplacement loop. Bases boxed represent three potential noncontiguous repeats postulated to have resulted from slipped-strand mispairinguring replication (Macey et al., 1997b). Sauresia has an unusual tRNACys in which an A has been inserted in the AA-stem, forcing three basesetween the AA- and D-stems instead of the two bases normally observed. Note the tremendous variation in sizes of both D- and T-stems. Theosition where an A was deleted destroying the D-stems in Elgaria kingii and E. paucicarinata is indicated.
258
rskDsmophtbr
sT
lrbDgtdsos
bqS
259PHYLOGENETICS AND BIOGEOGRAPHY OF ANGUID LIZARDS
esia, Wetmorena, Barisia, Gerrhonotus, Abronia, Me-aspis, Anguis, and all Ophisaurus species except O.oellikeri) have the normal four base pairings in the-stem. Eight taxa (Shinisaurus, Celestus, Diploglos-
us bilobatus, D. pleei, Ophiodes, Elgaria coerulea, E.ulticarinata, and E. panamintina) have a reduction of
ne pair to produce D-stems composed of three baseairings. Interestingly, D. pleei and E. panamintinaave only two bases in the D-loop, which is less thanhe minimal three bases required to restore throughase substitutions a fourth D-stem base pairing whileetaining at least one D-loop base.Only Elgaria kingii and E. paucicarinata are ob-
erved to have a single base pairing in the D-stem.
FIG. 2—
hese taxa have only six bases in the D-loop, which is T
ess than the minimum of seven bases required toestore through base substitutions three additionalase pairings in the D-stem while retaining at least one-loop base. From comparison with the other tRNACys
ene sequences, it appears that a T encoding an A in theRNA is deleted, destroying the D-stem. In addition, noirect repeats or noncontiguous repeats are observed;uch repeats are implicated, however, in the formationf D-arm replacement loops among eight other lepido-aurian taxa (Macey et al., 1997b).Striking variation is observed also in the number of
ase pairings among T-stems in tRNACys gene se-uences (Fig. 2). Only two taxa, Diploglossus pleei andauresia, have the typical five base pairings in the
ontinued
C-stem. Instead, a surprising situation occurs in which
TppapHAiSsdbaboccpe
G
oc1titmoaatnrppOrcp
P
pctwtNwOrfes9
ApAsl
mfGis1
bfsWp8stAas
ct4mstiiagt2tmdm(
st1OpstaAe
na
260 MACEY ET AL.
-stems are either reduced by one base pairing toroduce four pairs, or lengthened to as many as eightairs. The five Elgaria species, Ophisaurus koellikeri,nd O. harti have T-stems that have lost a singleairing, producing a T-stem with four base pairings.eloderma, Varanus, Anniella, Celestus, Ophiodes, andbronia all show an additional pair, producing an
ncrease in size of the T-stem to six base pairings.hinisaurus, Diploglossus bilobatus, Wetmorena, Bari-ia, Gerrhonotus, Mesaspis, Anguis, Ophisaurus apo-us, O. attenuatus, and O. ventralis all show two extraase pairings to produce T-stems seven pairs in length,nd Xenosaurus has three extra pairs to produce eightase pairs in the T-stem. Note that with the exceptionf Heloderma, Varanus, and Sauresia, all taxa thatontain less than seven base pairings in the T-stemontain T-loops large enough to produce additionalairs through base substitutions that would result innlarged T-stems of seven base pairs.
enic Variation
Different levels of DNA substitutional variation arebserved among the 3 protein-coding genes, 8 tRNA-oding genes, and four noncoding regions (Table 2). All1 genes contain phylogenetically informative charac-ers. The 8 tRNA genes each have phylogeneticallynformative sites in stem and nonstem regions. Each ofhe 3 protein-coding genes contains phylogenetic infor-ation in first, second, and third codon positions. Most
f the variation and phylogenetically informative sitesre from protein-coding regions. Only 23% of variablend 21% of phylogenetically informative sites are fromRNA genes and noncoding regions. Of the 802 phyloge-etically informative characters from protein-codingegions, 448 are from third positions of codons. Third-osition sites account for slightly less than half of thehylogenetically informative sites in the total data set.nly 150 phylogenetically informative sites occur in
egions encoding stems of tRNAs, suggesting thatompensatory substitutions do not compromise thehylogenetic analysis.
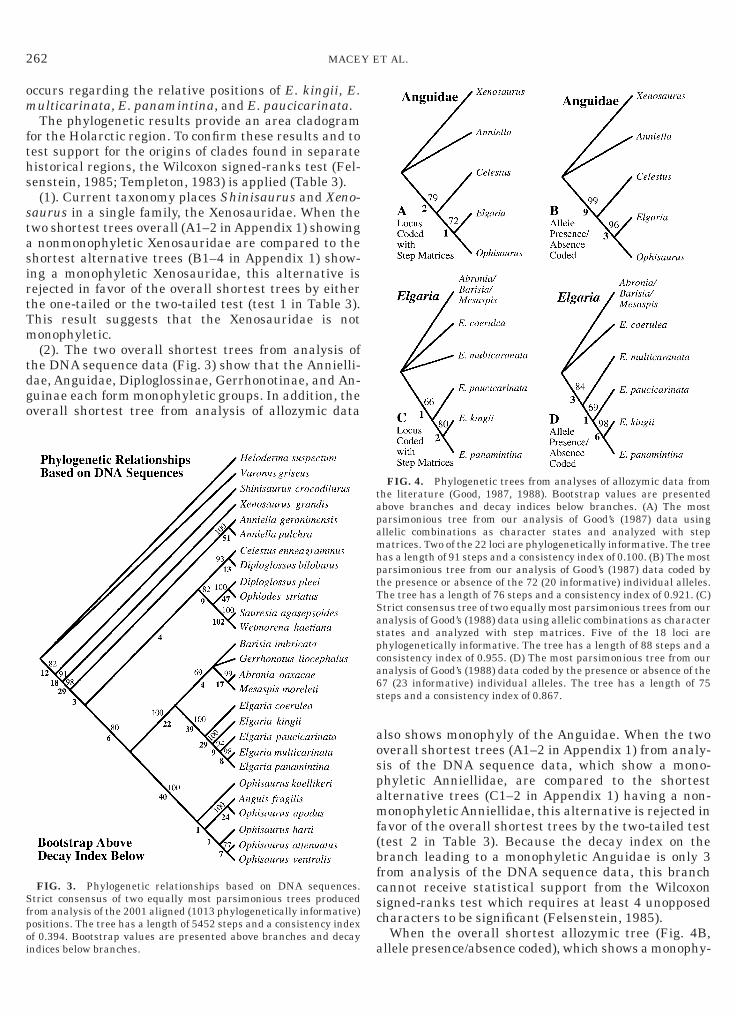
hylogenetic Relationships
Two trees of equal length are produced from thearsimony analysis of the 2001 aligned DNA sequencesontaining 1013 phylogenetically informative base posi-ions (Fig. 3, Table 2). Phylogenetic relationships areell resolved for most nodes of the tree. All ingroup
axa are grouped to the exclusion of the Varanoidea (theew World Heloderma and the Old World Varanus)ith good support (bootstrap 82%, decay index 12). Theld World Shinisaurus and the New World Xenosau-
us, often grouped as the Xenosauridae, appear not toorm a monophyletic group. Instead, Shinisaurus isxcluded from a monophyletic group containing Xeno-aurus, the Anniellidae, and the Anguidae (bootstrap
1%, decay index 18). A monophyletic grouping of wnniella and the Anguidae receives considerable sup-ort (bootstrap 98%, decay index 29). A monophyleticnniella (bootstrap 100%, decay index 51) forms theister taxon to the Anguidae, which appears monophy-etic but with weak support (decay index 3).
Within the Anguidae, the Diploglossinae appearsonophyletic with weak support (decay index 4) and
orms the sister taxon to a clade composed of theerrhonotinae and Anguinae (bootstrap 80%, decay
ndex 6). Monophyly of both the Gerrhonotinae (boot-trap 100%, decay index 22) and Anguinae (bootstrap00%, decay index 40) receives strong support.In the Diploglossinae, Celestus and Diploglossus
ilobatus from mainland Mexico and Central Americaorm a monophyletic group with good support (boot-trap 93%, decay index 13). A second clade comprisingest Indian and South American taxa, Diploglossus
leei, Ophiodes, Sauresia, and Wetmorena (bootstrap2%, decay index 9) can be recognized in the Diploglos-inae. Two well-supported groups are observed withinhis clade: (1) the Puerto Rican D. pleei and Southmerican Ophiodes (bootstrap 100%, decay index 47),nd (2) the Hispaniolan Sauresia and Wetmorena (boot-trap 100%, decay index 102).Two clades are recognized in the Gerrhonotinae, one
ontaining the largely Neotropical Barisia, Gerrhono-us, Abronia, and Mesaspis (bootstrap 69%, decay index), and the other composed of the five species from theore temperate North American genus Elgaria (boot-
trap 100%, decay index 39). In the tropical group, onlyhe sister-taxon relationship of Abronia and Mesaspiss recovered with strong support (bootstrap 99%, decayndex 17).Among the five species of Elgaria, all branchesre well supported. Elgaria coerulea, the most northernerrhonotine, is the sister taxon to a group comprisinghe remaining species (bootstrap 100%, decay index9). The more eastern species, E. kingii, is the sisteraxon to a monophyletic group of E. paucicarinata, E.ulticarinata, and E. panamintina (bootstrap 94%,
ecay index 9). Elgaria multicarinata and E. pana-intina from California form a monophyletic group
bootstrap 98%, decay index 8).In the Anguinae, most relationships are not well
upported. Ophisaurus koellikeri from Morocco formshe sister taxon to the remaining species (decay index). A monophyletic grouping of the western Eurasianphisaurus apodus and Anguis fragilis is well sup-orted (bootstrap 100%, decay index 24) and forms theister taxon to a weakly supported clade composed ofhe East Asian O. harti and the North American O.ttenuatus and O. ventralis (decay index 1). Northmerican Ophisaurus appear monophyletic with mod-rate support (bootstrap 77%, decay index 7).Phylogenetic relationships among the Anguidae, An-
iellidae, and Xenosauridae resolved from reanalysis ofllozymic data (Good, 1987, 1988) are largely the same
hether analyzed with allelic combinations as charac-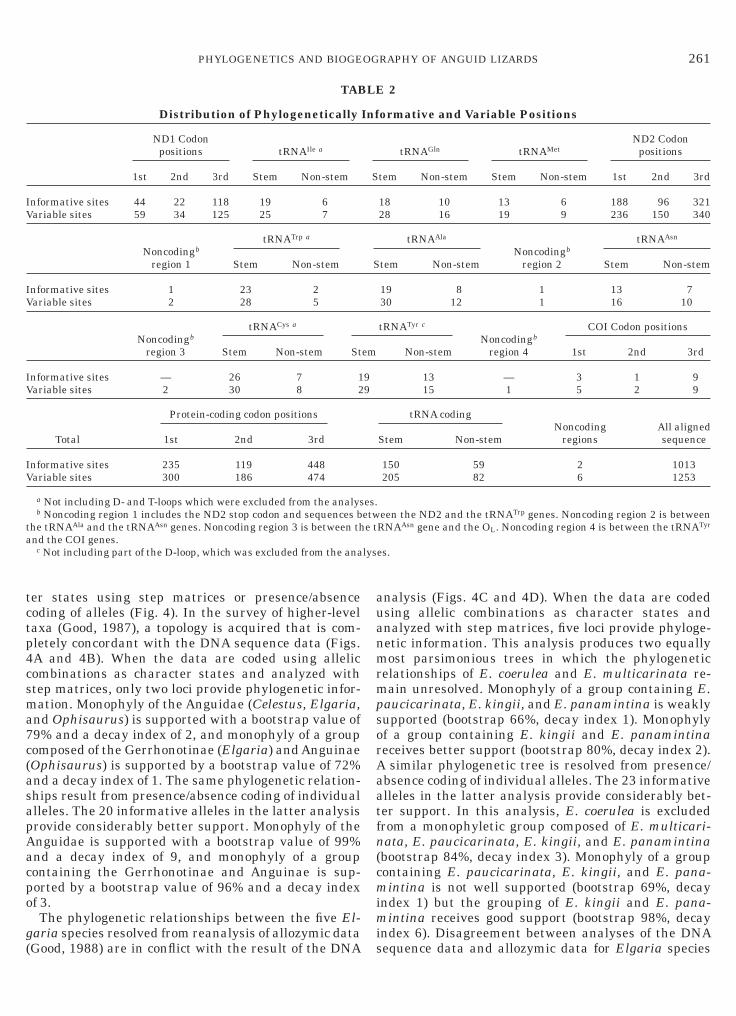
tctp4csma7c(asapAacpo
g(
auanmrmpsorAaatfn(cmimi
IV
IV
IV
IV
ta
261PHYLOGENETICS AND BIOGEOGRAPHY OF ANGUID LIZARDS
er states using step matrices or presence/absenceoding of alleles (Fig. 4). In the survey of higher-levelaxa (Good, 1987), a topology is acquired that is com-letely concordant with the DNA sequence data (Figs.A and 4B). When the data are coded using allelicombinations as character states and analyzed withtep matrices, only two loci provide phylogenetic infor-ation. Monophyly of the Anguidae (Celestus, Elgaria,
nd Ophisaurus) is supported with a bootstrap value of9% and a decay index of 2, and monophyly of a groupomposed of the Gerrhonotinae (Elgaria) and AnguinaeOphisaurus) is supported by a bootstrap value of 72%nd a decay index of 1. The same phylogenetic relation-hips result from presence/absence coding of individuallleles. The 20 informative alleles in the latter analysisrovide considerably better support. Monophyly of thenguidae is supported with a bootstrap value of 99%nd a decay index of 9, and monophyly of a groupontaining the Gerrhonotinae and Anguinae is sup-orted by a bootstrap value of 96% and a decay indexf 3.The phylogenetic relationships between the five El-
aria species resolved from reanalysis of allozymic data
TAB
Distribution of Phylogenetically
ND1 Codonpositions tRNAIle a
1st 2nd 3rd Stem Non-stem
nformative sites 44 22 118 19 6ariable sites 59 34 125 25 7
Noncodingb
region 1
tRNATrp a
Stem Non-stem
nformative sites 1 23 2ariable sites 2 28 5
Noncodingb
region 3
tRNACys a
Stem Non-stem St
nformative sites — 26 7 1ariable sites 2 30 8 2
Total
Protein-coding codon positions
1st 2nd 3rd
nformative sites 235 119 448ariable sites 300 186 474
a Not including D- and T-loops which were excluded from the analysb Noncoding region 1 includes the ND2 stop codon and sequences b
he tRNAAla and the tRNAAsn genes. Noncoding region 3 is between thnd the COI genes.
c Not including part of the D-loop, which was excluded from the ana
Good, 1988) are in conflict with the result of the DNA s
nalysis (Figs. 4C and 4D). When the data are codedsing allelic combinations as character states andnalyzed with step matrices, five loci provide phyloge-etic information. This analysis produces two equallyost parsimonious trees in which the phylogenetic
elationships of E. coerulea and E. multicarinata re-ain unresolved. Monophyly of a group containing E.
aucicarinata, E. kingii, and E. panamintina is weaklyupported (bootstrap 66%, decay index 1). Monophylyf a group containing E. kingii and E. panamintinaeceives better support (bootstrap 80%, decay index 2).
similar phylogenetic tree is resolved from presence/bsence coding of individual alleles. The 23 informativelleles in the latter analysis provide considerably bet-er support. In this analysis, E. coerulea is excludedrom a monophyletic group composed of E. multicari-ata, E. paucicarinata, E. kingii, and E. panamintina
bootstrap 84%, decay index 3). Monophyly of a groupontaining E. paucicarinata, E. kingii, and E. pana-intina is not well supported (bootstrap 69%, decay
ndex 1) but the grouping of E. kingii and E. pana-intina receives good support (bootstrap 98%, decay
ndex 6). Disagreement between analyses of the DNA
2
ormative and Variable Positions
tRNAGln tRNAMetND2 Codon
positions
tem Non-stem Stem Non-stem 1st 2nd 3rd
18 10 13 6 188 96 32128 16 19 9 236 150 340
tRNAAla
Noncodingb
region 2
tRNAAsn
tem Non-stem Stem Non-stem
19 8 1 13 730 12 1 16 10
tRNATyr c
Noncodingb
region 4
COI Codon positions
Non-stem 1st 2nd 3rd
13 — 3 1 915 1 5 2 9
tRNA codingNoncoding
regionsAll alignedsequenceStem Non-stem
150 59 2 1013205 82 6 1253
een the ND2 and the tRNATrp genes. Noncoding region 2 is betweenRNAAsn gene and the OL. Noncoding region 4 is between the tRNATyr
es.
LE
Inf
S
S
em
99
es.etwe t
lys
equence data and allozymic data for Elgaria species
om
fths
stasirtTm
tdgo
aospamf(bfcsc
Sfpoi
tapamhptTSaspca6s
262 MACEY ET AL.
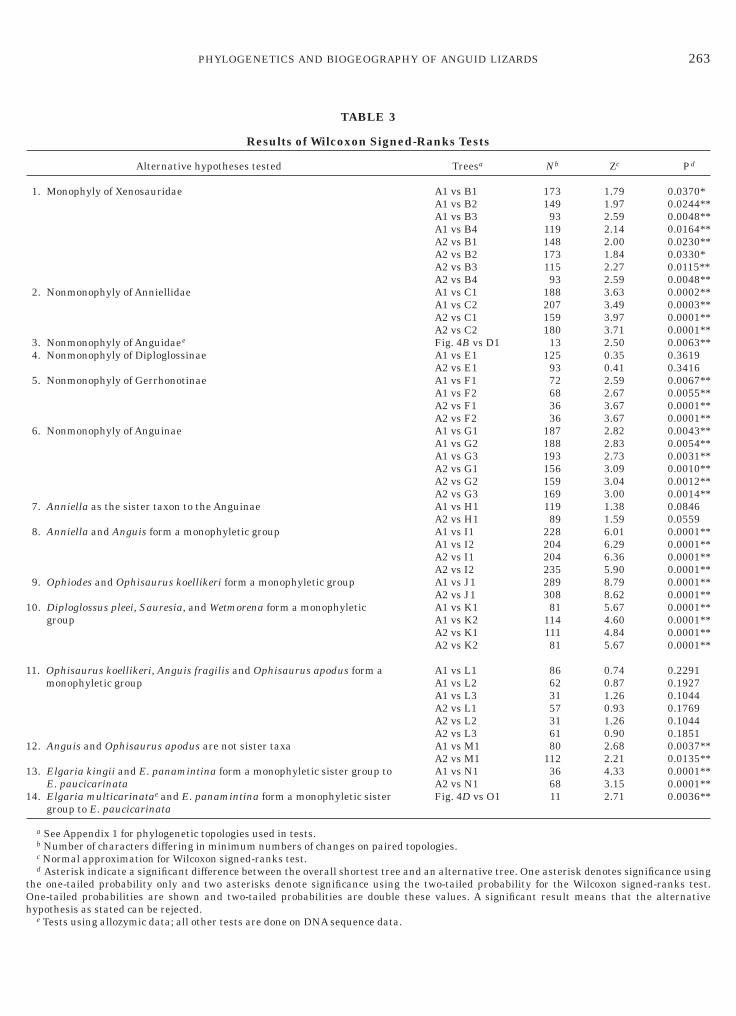
ccurs regarding the relative positions of E. kingii, E.ulticarinata, E. panamintina, and E. paucicarinata.The phylogenetic results provide an area cladogram
or the Holarctic region. To confirm these results and toest support for the origins of clades found in separateistorical regions, the Wilcoxon signed-ranks test (Fel-enstein, 1985; Templeton, 1983) is applied (Table 3).(1). Current taxonomy places Shinisaurus and Xeno-
aurus in a single family, the Xenosauridae. When thewo shortest trees overall (A1–2 in Appendix 1) showingnonmonophyletic Xenosauridae are compared to the
hortest alternative trees (B1–4 in Appendix 1) show-ng a monophyletic Xenosauridae, this alternative isejected in favor of the overall shortest trees by eitherhe one-tailed or the two-tailed test (test 1 in Table 3).his result suggests that the Xenosauridae is notonophyletic.(2). The two overall shortest trees from analysis of
he DNA sequence data (Fig. 3) show that the Annielli-ae, Anguidae, Diploglossinae, Gerrhonotinae, and An-uinae each form monophyletic groups. In addition, theverall shortest tree from analysis of allozymic data
FIG. 3. Phylogenetic relationships based on DNA sequences.trict consensus of two equally most parsimonious trees produced
rom analysis of the 2001 aligned (1013 phylogenetically informative)ositions. The tree has a length of 5452 steps and a consistency indexf 0.394. Bootstrap values are presented above branches and decay
andices below branches.
lso shows monophyly of the Anguidae. When the twoverall shortest trees (A1–2 in Appendix 1) from analy-is of the DNA sequence data, which show a mono-hyletic Anniellidae, are compared to the shortestlternative trees (C1–2 in Appendix 1) having a non-onophyletic Anniellidae, this alternative is rejected in
avor of the overall shortest trees by the two-tailed testtest 2 in Table 3). Because the decay index on theranch leading to a monophyletic Anguidae is only 3rom analysis of the DNA sequence data, this branchannot receive statistical support from the Wilcoxonigned-ranks test which requires at least 4 unopposedharacters to be significant (Felsenstein, 1985).When the overall shortest allozymic tree (Fig. 4B,
FIG. 4. Phylogenetic trees from analyses of allozymic data fromhe literature (Good, 1987, 1988). Bootstrap values are presentedbove branches and decay indices below branches. (A) The mostarsimonious tree from our analysis of Good’s (1987) data usingllelic combinations as character states and analyzed with stepatrices. Two of the 22 loci are phylogenetically informative. The tree
as a length of 91 steps and a consistency index of 0.100. (B) The mostarsimonious tree from our analysis of Good’s (1987) data coded byhe presence or absence of the 72 (20 informative) individual alleles.he tree has a length of 76 steps and a consistency index of 0.921. (C)trict consensus tree of two equally most parsimonious trees from ournalysis of Good’s (1988) data using allelic combinations as charactertates and analyzed with step matrices. Five of the 18 loci arehylogenetically informative. The tree has a length of 88 steps and aonsistency index of 0.955. (D) The most parsimonious tree from ournalysis of Good’s (1988) data coded by the presence or absence of the7 (23 informative) individual alleles. The tree has a length of 75teps and a consistency index of 0.867.
llele presence/absence coded), which shows a monophy-
1
1
1
1
1
tOh
263PHYLOGENETICS AND BIOGEOGRAPHY OF ANGUID LIZARDS
TAB
Results of Wilcoxon
Alternative hypotheses tested
1. Monophyly of Xenosauridae
2. Nonmonophyly of Anniellidae
3. Nonmonophyly of Anguidaee
4. Nonmonophyly of Diploglossinae
5. Nonmonophyly of Gerrhonotinae
6. Nonmonophyly of Anguinae
7. Anniella as the sister taxon to the Anguinae
8. Anniella and Anguis form a monophyletic group
9. Ophiodes and Ophisaurus koellikeri form a monophyletic group
0. Diploglossus pleei, Sauresia, and Wetmorena form a monophyletigroup
1. Ophisaurus koellikeri, Anguis fragilis and Ophisaurus apodus formonophyletic group
2. Anguis and Ophisaurus apodus are not sister taxa
3. Elgaria kingii and E. panamintina form a monophyletic sister grE. paucicarinata
4. Elgaria multicarinatae and E. panamintina form a monophyleticgroup to E. paucicarinata
a See Appendix 1 for phylogenetic topologies used in tests.b Number of characters differing in minimum numbers of changes oc Normal approximation for Wilcoxon signed-ranks test.d Asterisk indicate a significant difference between the overall shor
he one-tailed probability only and two asterisks denote significancne-tailed probabilities are shown and two-tailed probabilities areypothesis as stated can be rejected.
e Tests using allozymic data; all other tests are done on DNA sequen
LE 3
Signed-Ranks Tests
Treesa Nb Zc Pd
A1 vs B1A1 vs B2
173149
1.791.97
0.0370*0.0244**
A1 vs B3 93 2.59 0.0048**A1 vs B4 119 2.14 0.0164**A2 vs B1 148 2.00 0.0230**A2 vs B2 173 1.84 0.0330*A2 vs B3 115 2.27 0.0115**A2 vs B4 93 2.59 0.0048**A1 vs C1A1 vs C2
188207
3.633.49
0.0002**0.0003**
A2 vs C1 159 3.97 0.0001**A2 vs C2 180 3.71 0.0001**Fig. 4B vs D1 13 2.50 0.0063**A1 vs E1A2 vs E1
12593
0.350.41
0.36190.3416
A1 vs F1A1 vs F2
7268
2.592.67
0.0067**0.0055**
A2 vs F1 36 3.67 0.0001**A2 vs F2 36 3.67 0.0001**A1 vs G1A1 vs G2
187188
2.822.83
0.0043**0.0054**
A1 vs G3 193 2.73 0.0031**A2 vs G1 156 3.09 0.0010**A2 vs G2 159 3.04 0.0012**A2 vs G3 169 3.00 0.0014**A1 vs H1A2 vs H1
11989
1.381.59
0.08460.0559
A1 vs I1A1 vs I2A2 vs I1A2 vs I2
228204204235
6.016.296.365.90
0.0001**0.0001**0.0001**0.0001**
A1 vs J1A2 vs J1
289308
8.798.62
0.0001**0.0001**
c A1 vs K1A1 vs K2A2 vs K1A2 vs K2
8111411181
5.674.604.845.67
0.0001**0.0001**0.0001**0.0001**
m a A1 vs L1A1 vs L2A1 vs L3A2 vs L1A2 vs L2A2 vs L3
866231573161
0.740.871.260.931.260.90
0.22910.19270.10440.17690.10440.1851
A1 vs M1A2 vs M1
80112
2.682.21
0.0037**0.0135**
oup to A1 vs N1A2 vs N1
3668
4.333.15
0.0001**0.0001**
sister Fig. 4D vs O1 11 2.71 0.0036**
n paired topologies.
test tree and an alternative tree. One asterisk denotes significance usinge using the two-tailed probability for the Wilcoxon signed-ranks test.double these values. A significant result means that the alternative
ce data.
TA
BL
E4
Pai
rwis
eC
omp
aris
ons
ofD
NA
Seq
uen
ces
amon
gth
eA
ngu
idae
and
Rel
ated
Tax
aa
12
34
56
78
910
1112
1314
1516
1718
1920
2122
2324
2526
27
1.H
elod
erm
a—
30.3
%29
.5%
28.8
%29
.3%
29.6
%30
.3%
30.9
%29
.5%
28.9
%29
.5%
30.1
%28
.0%
27.4
%27
.2%
27.8
%28
.0%
27.7
%28
.1%
27.8
%27
.4%
28.2
%28
.8%
29.5
%28
.2%
29.3
%28
.6%
2.Va
ran
us
597
—31
.3%
31.0
%31
.8%
30.8
%32
.4%
32.8
%31
.1%
31.9
%31
.7%
31.0
%31
.3%
31.9
%30
.6%
31.5
%30
.8%
30.6
%30
.7%
30.7
%30
.5%
31.4
%31
.4%
30.5
%30
.7%
30.6
%30
.2%
3.S
hin
i-sa
uru
s58
461
8—
29.6
%27
.0%
27.9
%27
.1%
28.4
%27
.7%
28.1
%28
.2%
28.2
%27
.1%
27.8
%27
.3%
27.4
%27
.3%
27.5
%27
.4%
27.2
%27
.1%
27.8
%28
.0%
28.9
%28
.5%
29.2
%27
.8%
4.X
eno-
sau
rus
571
611
586
—27
.1%
25.2
%26
.6%
27.4
%26
.0%
25.5
%27
.4%
26.9
%25
.8%
25.4
%24
.9%
25.7
%25
.3%
25.5
%25
.7%
25.9
%25
.6%
26.1
%26
.4%
26.6
%26
.1%
26.2
%25
.5%
5.A
.ger
on-
imen
sis
580
627
536
537
—12
.2%
21.3
%24
.4%
23.0
%22
.7%
23.3
%22
.7%
20.4
%20
.5%
20.5
%20
.8%
20.0
%20
.8%
20.5
%20
.5%
20.1
%21
.3%
20.9
%22
.1%
21.1
%21
.7%
20.2
%6.
A.p
ulc
hra
588
608
553
500
243
—21
.4%
23.4
%23
.1%
22.8
%23
.7%
22.7
%21
.3%
20.4
%20
.2%
20.5
%20
.4%
21.3
%21
.1%
21.1
%21
.2%
21.4
%20
.7%
21.9
%21
.0%
21.2
%20
.4%
7.C
eles
tus
600
639
537
527
422
425
—21
.7%
21.5
%21
.9%
22.8
%22
.7%
22.0
%21
.8%
22.0
%22
.8%
21.6
%21
.6%
21.6
%21
.0%
21.1
%22
.8%
22.4
%23
.8%
23.6
%23
.4%
22.1
%8.
D.b
ilo-
batu
s61
364
756
454
348
346
443
1—
23.1
%23
.5%
25.3
%24
.3%
23.8
%22
.3%
22.5
%23
.1%
23.2
%23
.5%
23.8
%23
.5%
23.3
%23
.2%
23.3
%24
.4%
24.2
%22
.8%
23.5
%9.
D.p
leei
584
613
548
514
455
458
427
457
—14
.4%
22.3
%20
.9%
22.7
%22
.5%
21.8
%23
.3%
22.4
%22
.5%
22.7
%22
.5%
22.3
%22
.8%
22.5
%22
.9%
23.0
%23
.2%
22.3
%0.
Oph
iod
es57
162
855
750
645
145
243
446
628
6—
22.3
%21
.7%
22.8
%22
.4%
22.2
%23
.6%
21.9
%22
.1%
22.4
%22
.2%
22.0
%23
.4%
22.5
%22
.7%
22.1
%23
.2%
20.9
%1.
Sau
resi
a58
562
556
054
346
347
145
350
244
344
2—
9.1%
23.6
%24
.2%
24.0
%24
.3%
23.6
%24
.0%
24.7
%24
.1%
24.2
%24
.4%
24.4
%24
.0%
24.2
%23
.9%
22.5
%2.
Wet
mor
ena
597
611
559
533
450
451
452
483
414
430
181
—22
.3%
23.2
%22
.3%
22.7
%22
.9%
23.1
%23
.3%
23.5
%23
.3%
23.9
%23
.1%
23.5
%23
.5%
23.5
%21
.7%
3.B
aris
ia55
661
753
751
340
542
343
747
244
945
146
844
2—
13.6
%13
.7%
15.6
%14
.0%
14.4
%14
.4%
14.3
%13
.8%
18.6
%18
.6%
20.0
%20
.0%
18.3
%17
.9%
4.G
err-
hon
otu
s54
463
055
150
540
740
543
244
244
544
348
146
027
1—
13.0
%14
.3%
14.2
%14
.6%
15.1
%15
.3%
14.8
%19
.4%
19.4
%20
.7%
19.9
%18
.6%
18.6
%5.
Abr
onia
540
604
542
495
407
402
437
446
433
441
476
442
273
258
—11
.8%
13.8
%15
.5%
15.1
%14
.7%
14.7
%18
.0%
17.8
%19
.7%
19.6
%17
.6%
17.7
%6.
Mes
aspi
s55
262
254
451
141
240
745
345
946
246
748
245
031
028
523
4—
15.3
%15
.7%
15.4
%15
.5%
15.1
%20
.0%
19.6
%21
.3%
20.7
%19
.4%
19.1
%7.
E.c
oeru
lea
556
609
541
503
398
405
430
461
444
435
469
455
279
283
275
304
—8.
6%8.
8%8.
4%8.
5%18
.3%
17.2
%19
.1%
18.7
%18
.0%
17.3
%8.
E.k
ingi
i54
960
554
650
741
242
442
946
744
643
947
745
928
629
030
831
217
1—
5.9%
4.8%
4.8%
19.1
%18
.4%
19.8
%18
.9%
19.2
%17
.8%
9.E
.pau
ci-
cari
nat
a55
760
754
351
040
741
943
047
345
044
449
146
228
729
930
030
717
511
7—
4.4%
4.5%
18.9
%18
.9%
20.3
%19
.0%
19.3
%18
.0%
0.E
.mu
lti-
cari
nat
a55
160
654
051
540
742
041
846
644
644
147
946
728
530
429
330
916
795
87—
2.0%
18.3
%18
.0%
19.8
%18
.8%
18.6
%17
.9%
1.E
.pan
a-m
inti
na
544
603
538
509
400
421
420
462
442
436
481
463
274
295
292
300
170
9690
39—
18.3
%18
.5%
19.8
%19
.1%
18.6
%18
.1%
2.O
.koe
l-li
keri
559
620
552
518
423
426
454
461
453
464
484
475
370
386
357
397
364
379
376
364
365
—13
.5%
15.8
%14
.7%
14.4
%13
.6%
3.A
ngu
is57
262
055
652
441
541
244
646
244
744
748
545
936
938
535
439
034
236
537
535
836
926
9—
11.7
%14
.8%
14.7
%12
.8%
4.O
.apo
du
s58
560
357
352
843
943
647
348
545
545
147
746
739
841
139
242
438
039
340
439
339
331
523
3—
15.6
%16
.1%
14.1
%5.
O.h
arti
560
606
566
519
420
418
469
480
457
439
481
468
397
395
389
411
372
376
377
375
379
292
295
311
—14
.0%
13.3
%6.
O.a
tten
-u
atu
s58
260
557
952
143
142
146
645
346
046
147
646
736
337
035
038
535
938
238
437
037
028
629
332
027
8—
11.6
%7.
O.v
en-
tral
is56
759
755
250
640
140
643
946
644
241
544
743
235
537
035
138
034
535
435
735
636
027
125
528
126
523
1—
aP
erce
nta
gese
quen
cedi
verg
ence
issh
own
abov
eth
edi
agon
alan
dn
um
ber
ofba
sesu
bsti
tuti
ons
betw
een
sequ
ence
sis
show
nbe
low
the
diag
onal
.Tax
aar
eab
brev
iate
dw
ith
A.r
epre
sen
tin
gA
nn
iell
a,D
.rep
rese
nti
ng
Dip
logl
ossu
s,E
.ep
rese
nti
ng
Elg
aria
,an
dO
.rep
rese
nti
ng
Oph
isau
rus.
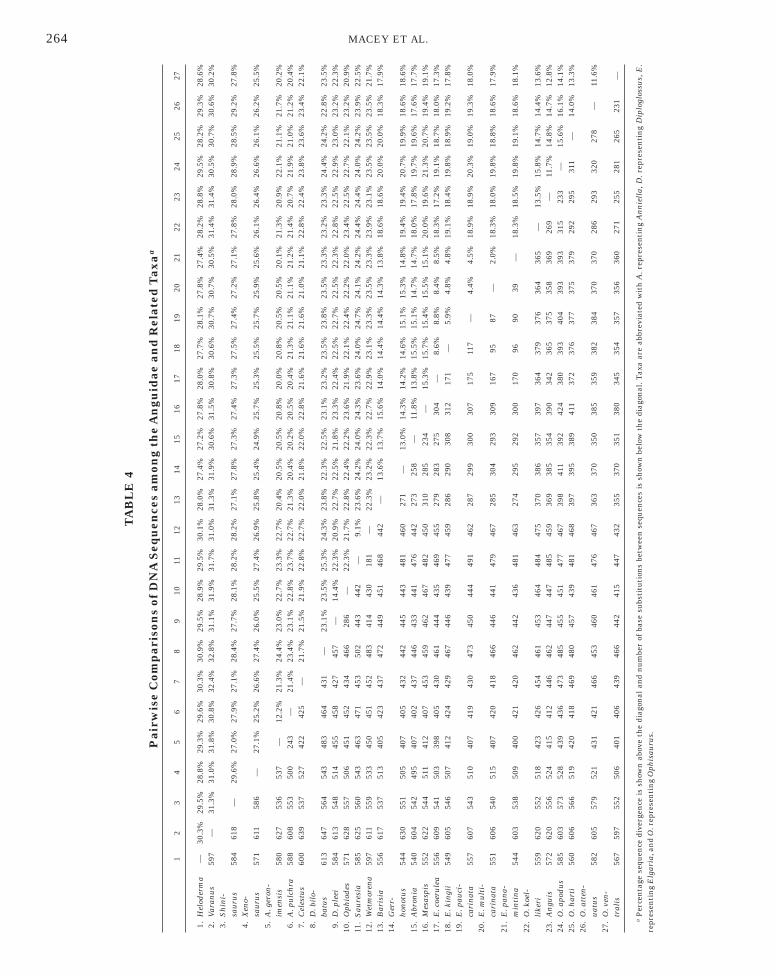
264 MACEY ET AL.
1 1 1 1 1 1 1 1 1 1 2 2 2 2 2 2 2 2 r
ltAptT
dstic((qn(roTAwtsitdmts
d(taacb((tahtftt
Ow(Opsit
ww
lismamrtid
AktekmasssowhhMaogcdatc
ainosptslroiapptEp
265PHYLOGENETICS AND BIOGEOGRAPHY OF ANGUID LIZARDS
etic Anguidae, is compared to the shortest alternativeree (D1 in Appendix 1) having a nonmonophyleticnguidae, this alternative is rejected using the alleleresence/absence coded data (Good, 1987) in favor ofhe overall shortest tree by the two-tailed test (test 2 inable 3).When the two overall shortest trees (A1–2 in Appen-
ix 1) from analysis of the DNA sequence data, whichhow a monophyletic Diploglossinae, are compared tohe shortest alternative tree (E1 in Appendix 1) show-ng a nonmonophyletic Diploglossinae, this alternativeannot be rejected in favor of the overall shortest treestest 4 in Table 3). When the two overall shortest treesA1–2 in Appendix 1) from analysis of the DNA se-uence data, which show a monophyletic Gerrho-otinae, are compared to the shortest alternative treesF1–2 in Appendix 1) showing a nonmonophyletic Ger-honotinae, this alternative is rejected in favor of theverall shortest trees by the two-tailed test (test 5 inable 3). When the two overall shortest trees (A1–2 inppendix 1) from analysis of the DNA sequence data,hich show a monophyletic Anguinae, are compared to
he shortest alternative trees (G1–3 in Appendix 1)howing a nonmonophyletic Anguinae, this alternatives rejected in favor of the overall shortest trees by thewo-tailed test (test 6 in Table 3). Hence, the Annielli-ae, Anguidae, Gerrhonotinae, and Anguinae each formonophyletic groups with statistical support, but statis-
ical support is lacking for monophyly of the Diploglos-inae.(3). The phylogenetic position of Anniella is a point of
isagreement. When the two overall shortest treesA1–2 in Appendix 1), which show Anniella as the sisteraxon to the Anguidae, are compared to the shortestlternative tree (H1 in Appendix 1) showing Anniellas the sister taxon to the Anguinae, this alternativeannot be rejected in favor of the overall shortest trees,ut it is close to significance using the one-tailed testtest 7 in Table 3). When the two overall shortest treesA1–2 in Appendix 1), which show Anniella as the sisteraxon to the Anguidae, are compared to the shortestlternative trees (I1–2 in Appendix 1) showing theypothesis of Keqin and Norell (1998) that Anniella ishe sister taxon to Anguis, this alternative is rejected inavor of the overall shortest trees using the two-tailedest (test 8 in Table 3). Anniella is unlikely to representhe sister taxon to either Anguinae or Anguis.
(4). Only Ophisaurus koellikeri from Morocco andphiodes from South America are endemic to Gond-anan continents. When the two overall shortest trees
A1–2 in Appendix 1), in which O. koellikeri andphiodes do not form a monophyletic group, are com-ared to the shortest alternative tree (J1 in Appendix 1)howing them as sister taxa, this alternative is rejectedn favor of the overall shortest trees using the two-
ailed test (test 9 in Table 3). Taxa inhabiting Gond- panan plates therefore do not share a common Gond-anan origin.(5). West Indian taxa appear not to form a monophy-
etic group. When the two overall shortest trees (A1–2n Appendix 1), in which West Indian taxa (Diploglos-us pleei, Sauresia, and Wetmorena) do not form aonophyletic group, are compared to the shortest
lternative trees (K1–2 in Appendix 1) showing aonophyletic grouping of these taxa, this alternative is
ejected in favor of the overall shortest trees using thewo-tailed test (test 10 in Table 3). These resultsndicate that the South American genus Ophiodes iserived from the West Indies.(6). The three Old World taxa that occur between the
tlantic Ocean and the Tibetan Plateau, Ophisaurusoellikeri, Anguis fragilis, and O. apodus, are found noto form a monophyletic group. When the overall short-st trees (A1–2 in Appendix 1), in which Ophisaurusoellikeri, Anguis fragilis, and O. apodus do not form aonophyletic group, are compared to the shortest
lternative trees (L1–3 in Appendix 1) showing thesepecies as a monophyletic group, this alternative costseven steps but cannot be rejected in favor of the overallhortest trees (test 11 in Table 3). The most parsimoni-us trees suggest that the history of anguine lizards inestern Eurasia and Morocco is older than anguineistory in North America, contrary to the alternativeypothesis grouping taxa from western Eurasia andorocco as closest relatives. Anguis fragilis and O.
podus form a monophyletic group. When the twoverall shortest trees (A1–2 in Appendix 1), whichroup A. fragilis and O. apodus as sister taxa, areompared to the shortest alternative tree (M1 in Appen-ix 1) in which these species are not sister taxa, thislternative is rejected in favor of the overall shortestrees using the two-tailed test (test 12 in Table 3). Asurrently recognized, Ophisaurus is not monophyletic.
(7). The only point of disagreement between thenalyses of the DNA sequence data and allozymic datas the relative placement of Elgaria kingii, E. multicari-ata, E. panamintina, and E. paucicarinata. When theverall shortest DNA trees (A1–2 in Appendix 1), whichhow E. multicarinata and E. panamintina as a mono-hyletic sister group to E. paucicarinata, are comparedo the shortest alternative tree (N1 in Appendix 1)howing E. kingii and E. panamintina as a monophy-etic sister group to E. paucicarinata, this alternative isejected by the DNA sequence data in favor of theverall shortest trees using the two-tailed test (test 13n Table 3). When the shortest allozymic tree (Fig. 4D,llele presence/absence coded) showing E. kingii and E.anamintina as a monophyletic sister group to E.aucicarinata is compared to the shortest alternativeree (O1 in Appendix 1) showing E. multicarinata and. panamintina as a monophyletic sister group to E.aucicarinata, this alternative is rejected by the allele
resence/absence coded data (Good, 1988) in favor of
t1atmttin(tEoetrbm
P
nbjfoGagrGsowWiottAAilAL
[pGtemm
tt
wcppre(pttEm1awpE
ea
TAAeOOEAtpgbO
266 MACEY ET AL.
he overall shortest tree using the two-tailed test (test4 in Table 3). The DNA sequence and allozymic datare in conflict with regard to the relative grouping ofhe species Elgaria kingii, E. multicarinata, E. pana-intina, and E. paucicarinata. Two explanations for
his discordance can be given. First, it is possible thathe mitochondrial genome has undergone lineage sort-ng (Pamilo and Nei, 1988) and is misleading phyloge-etically. Alternatively, the allozymic data of Good1988) may be misleading because of small sample size;he sample size for E. paucicarinata is four individuals,. kingii is two individuals, and for E. panamintina isnly one individual. These sample sizes are not ad-quate for evaluating occurrence of alleles in a popula-ion or a species. Further work is needed to confirm ouresults inferred from mitochondrial DNA sequences,ut we suggest that this hypothesis of phylogeny is theore reliable estimate.
DISCUSSION
hylogeny and Biogeography of Extant Forms and theFossil Record
Anguid lizards are inferred to have originated in theorthern hemisphere. Our data considered in light ofiogeographic and paleontological evidence clearly re-ect a Gondwanan origin for the Anguidae. No anguidossils are known from tectonic regions of Gondwananrigin. Only two taxa occur exclusively on separateondwanan continents, Ophiodes in South Americand Ophisaurus koellikeri in Morocco (Fig. 5). A sisterroup relationship between these taxa is statisticallyejected, indicating that they do not share a commonondwanan origin. The molecular phylogenetic analy-
is places these taxa in different clades of Laurasianrigin in the northern hemisphere. Ophiodes is nestedithin West Indian diploglossines and monophyly ofest Indian diploglossines is statistically rejected,
ndicating that Ophiodes descends from a lineage thatriginated in the West Indies and subsequently movedo South America. Ophisaurus koellikeri appears to behe sister taxon to the remaining members of thenguinae. All other anguines occur in Europe, Westsia, EastAsia, or NorthAmerica, which consist primar-
ly of Laurasian plates. Because other anguids, anniel-ids, and Xenosaurus occur in North America, thenguinae is nested within a clade of northern forms ofaurasian origin (Fig. 5).The opening of the Atlantic Ocean in the late Eocene
50 million years before present (MYBP)] may haveroduced the divergence between the Anguinae and theerrhonotinae, which are sister taxa. The location of
he most basal anguine lineages in Morocco and west-rn Eurasia supports this explanation. Miocene cli-atic changes and montane uplifting in North America
ay have separated the two major clades of gerrhono- Nines, one primarily tropical and the other primarilyemperate.
Phylogenetic relationships (Fig. 3) are surprisinglyell resolved for branches ranging from the late Creta-
eous (95–75 MYBP) to the Pleistocene (1.5 MYBP) androvide insights for interpreting biogeographic andaleontological data. Two groups of fossil lizards occur-ing in Europe have been referred to the Anguidae. Thextinct Glyptosaurinae dates to the late Cretaceous95–75 MYBP; Gauthier, 1982), and its phylogeneticosition is not well understood. Fossils in Europe fromwo later periods may be related to extant forms withinhe Anguinae. The earliest fossils from the middleocene (40–50 MYBP) are either grouped with theodern Old World anguines (Meszoely and Haubold,
975) or considered the sister lineage to all modernnguines (Gauthier, 1982). If these fossils are groupedith a modern Old World anguine lineage (Fig. 3), theylace modern anguine lineages in Europe during theocene prior to the Oligocene drying of the Turgai Sea.Our phylogenetic tree and interpretation of historical
vents suggest rapid separation of the western Eur-sian anguine lineages from eastern Eurasian and
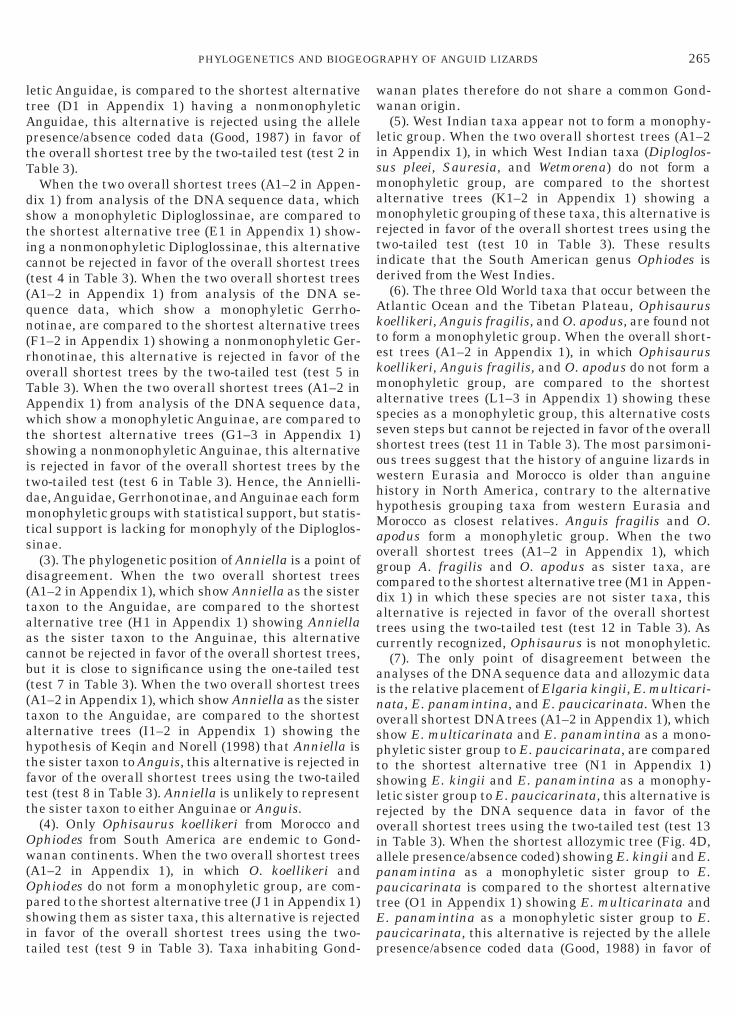
FIG. 5. Area cladogram for anguid lizards and related taxa.axonomy is shown to the right. Note deep divergences in Northmerica with a dispersal event from the West Indies to Southmerica and a nested position for Old World anguines. The shorteststimate of phylogeny suggests that the formation of the Atlanticcean separated the Gerrhonotinae and Anguinae. Following theligocene drying of the Turgai Sea, dispersal of anguine lizards fromurope to East Asia and across the Bering land bridge to Northmerica was possible, but would have been interrupted rapidly by
he uplift of the Tibetan Plateau. It costs seven steps on ourhylogenetic estimate to construct a topology compatible with an-uine taxa originating in North America and crossing the Bering landridge to East Asia, with continued dispersal to Europe following theligocene drying of the Turgai Sea.
orth American anguines by the Tibetan uplift during
ttc(wftfsTr1eu(p5eaAf
EfdiOeBobdNwtlpEep1OaatooBb
NBTEtMa
gAsptcENtfscsfr
D
DaecasiyWEdlEmrn
awsidsbr
o(r(gl
drfce
267PHYLOGENETICS AND BIOGEOGRAPHY OF ANGUID LIZARDS
he Oligocene–Miocene. Within the Anguinae, fossilshat are assigned to the Anguis–Ophisaurus apoduslade appear in Europe first in the late Oligocene25–30 MYBP; Gauthier, 1982). This date coincidesith the connection of Europe with Asia–America
ollowing drying of the Turgai Sea (Briggs, 1987). Athis time a continuous land connection was availablerom Europe through Asia to North America. At thisame time (30 MYBP), the first phase of uplifting of theibetan Plateau was coming to a close with the plateaueaching an average elevation of 3000 m (Dewey et al.,989). The second phase of uplifting maintained thislevation of 3000 m until 10 MYBP when faulting andplifting of the Tibetan Plateau exceeded erosion
Shackleton and Chang, 1988), resulting in a thirdhase of uplifting to produce an average elevation of000 m (Dewey et al., 1989). By the late Oligocene toarly Miocene, taxa in Europe and western Asia prob-bly were isolated from taxa in eastern Asia and Northmerica after sharing a brief connection immediately
ollowing the drying of the Turgai Sea.The ancestral anguine lineage may have enteredurope from North America in the Eocene prior to
ormation of the North Atlantic and then expanded itsistribution southward to North Africa and eastwardnto West Asia. The drying of the Turgai Sea in theligocene could have permitted taxa to migrate toastern Asia and then back to North America via theering land bridge. The Oligocene-to-Miocene upliftingf Tibet would have formed a barrier to migrationetween eastern and western Eurasia shortly after therying of the Turgai Sea. This scenario predicts thatorth African, European, and West Asian anguinesould not necessarily form a monophyletic group but
hat North American anguines should be a monophy-etic group. This scenario is compatible with both ourhylogenetic hypothesis and the hypothesis that Eoceneuropean fossils of the Anguinae are affiliated withither the modern North African lineage or the Euro-ean and West Asian lineage (Meszoely and Haubold,975). The European fossil anguines of the lateligocene–Miocene are assigned to the Anguis–Ophis-urus apodus clade (Gauthier, 1982). The first fossilppearance of Ophisaurus in North America occurs inhe late Miocene of Saskatchewan (Holman, 1970). Thisbservation is consistent with a post-Oligocene arrivalf Ophisaurus in North America by dispersal from theering land bridge across Canada to its current distri-ution in southeastern North America.In an alternative scenario, the Anguinae arose inorth America and spread to eastern Asia via theering land bridge prior to the Oligocene drying of theurgai Sea. When the Turgai Sea was dry, westernurasia would have been invaded and quickly blocked
o the east by the uplifting of Tibet (Oligocene toiocene). This scenario predicts that North American
nguines would not necessarily form a monophyletic p
roup but that North African, European, and Westsian anguines would. Phylogenetic predictions of thisecond scenario are not compatible with our mostarsimonious tree. This second scenario also requireshat Eocene European fossil anguines are phylogeneti-ally outside a group containing Oligocene–Mioceneuropean fossil anguines and all extant anguines fromorth Africa, Europe, and West Asia. A tree showing
he North African and western Eurasian anguinesorming a monophyletic group as predicted by theecond scenario was not statistically rejected but wasostly (seven extra steps required). Both hypothesesuggest that the drying of the Turgai Sea and theormation of Tibet were instrumental in shaping cur-ent biogeographic patterns.
NA Sequence Divergence and the Fossil Record
Rate of molecular evolution for the mitochondrialNA region sequenced here has been estimated forgamid lizards, bufonid frogs, and fishes (Berminghamt al., 1997; Macey et al., 1998a,b) as 0.65–0.69%hange per lineage per million years. If this rate ispproximately correct for anguid, anniellid, and xeno-aurid lizards, then taxa sampled here are extraordinar-ly old. Relatively few divergences are under 10 millionears (between Anniella species; between Sauresia andetmorena; between Abronia and Mesaspis; amonglgaria species; between Anguis and Ophisaurus apo-us; and between Ophisaurus attenuatus and O. ventra-is; Table 4). Of these taxa, only divergences amonglgaria species are less than 7 million years. After 10illion years, mitochondrial DNA is expected to satu-
ate (Moritz et al., 1987); hence, a linear relationship ofucleotide substitutions and time is not anticipated.The branching event separating Ophisaurus apodus
nd Anguis appears to be approximately 9 MYBP,hich may be an underestimate if some substitutional
aturation has occurred. The fossil record for these taxas difficult to interpret because small Ophisaurus apo-us-like specimens can be confused with Anguis-likepecimens (Gauthier, 1982). Note that the divergenceetween these taxa and Ophisaurus koellikeri of Mo-occo is greater than 10 MYBP.The fossil record is consistent with our interpretation
f very old divergences among the major lineagesGauthier, 1982). Fossils of New and Old World xenosau-ids and anguids are known from the late Cretaceous95–75 MYBP). The taxa Anniellidae, Anguinae, Diplo-lossinae, and Gerrhonotinae all are known from ateast the early Eocene (50–55 MYBP).
Within Elgaria, the molecular data estimate theivergence between the northern E. coerulea and theemaining taxa at 6.6 MYBP. The Gulf of Californiaormed 5–6 MYBP (reviewed in Murphy, 1983) andould have separated E. kingii from the clade of west-rn species (E. paucicarinata, E. multicarinata, and E.
anamintina); the DNA sequences estimate 4.0 MYBP,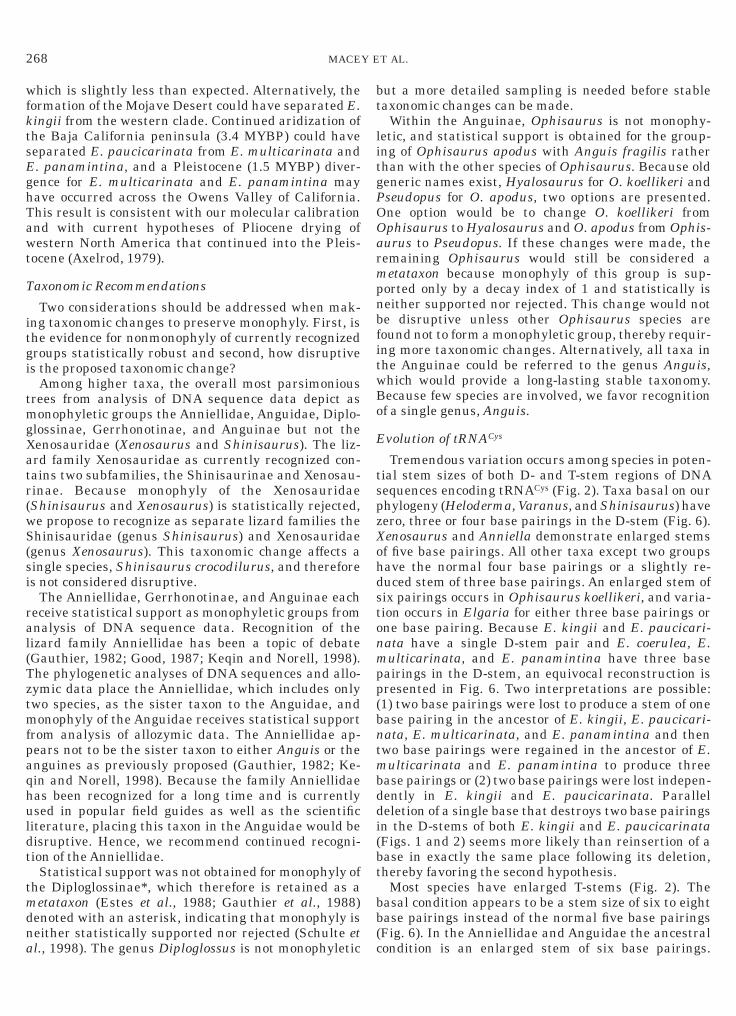
wfktsEghTawt
T
itgi
tmgXatr(wS(si
ral(Tztmfpaqhuldt
tmdna
bt
litgPOOarmpnbfitwBo
E
tspzXohdstonmpp(bntmbddi(bt
bb(
268 MACEY ET AL.
hich is slightly less than expected. Alternatively, theormation of the Mojave Desert could have separated E.ingii from the western clade. Continued aridization ofhe Baja California peninsula (3.4 MYBP) could haveeparated E. paucicarinata from E. multicarinata and. panamintina, and a Pleistocene (1.5 MYBP) diver-ence for E. multicarinata and E. panamintina mayave occurred across the Owens Valley of California.his result is consistent with our molecular calibrationnd with current hypotheses of Pliocene drying ofestern North America that continued into the Pleis-
ocene (Axelrod, 1979).
axonomic Recommendations
Two considerations should be addressed when mak-ng taxonomic changes to preserve monophyly. First, ishe evidence for nonmonophyly of currently recognizedroups statistically robust and second, how disruptives the proposed taxonomic change?
Among higher taxa, the overall most parsimoniousrees from analysis of DNA sequence data depict asonophyletic groups the Anniellidae, Anguidae, Diplo-
lossinae, Gerrhonotinae, and Anguinae but not theenosauridae (Xenosaurus and Shinisaurus). The liz-rd family Xenosauridae as currently recognized con-ains two subfamilies, the Shinisaurinae and Xenosau-inae. Because monophyly of the XenosauridaeShinisaurus and Xenosaurus) is statistically rejected,e propose to recognize as separate lizard families thehinisauridae (genus Shinisaurus) and Xenosauridae
genus Xenosaurus). This taxonomic change affects aingle species, Shinisaurus crocodilurus, and therefores not considered disruptive.
The Anniellidae, Gerrhonotinae, and Anguinae eacheceive statistical support as monophyletic groups fromnalysis of DNA sequence data. Recognition of theizard family Anniellidae has been a topic of debateGauthier, 1982; Good, 1987; Keqin and Norell, 1998).he phylogenetic analyses of DNA sequences and allo-ymic data place the Anniellidae, which includes onlywo species, as the sister taxon to the Anguidae, andonophyly of the Anguidae receives statistical support
rom analysis of allozymic data. The Anniellidae ap-ears not to be the sister taxon to either Anguis or thenguines as previously proposed (Gauthier, 1982; Ke-in and Norell, 1998). Because the family Anniellidaeas been recognized for a long time and is currentlysed in popular field guides as well as the scientific
iterature, placing this taxon in the Anguidae would beisruptive. Hence, we recommend continued recogni-ion of the Anniellidae.
Statistical support was not obtained for monophyly ofhe Diploglossinae*, which therefore is retained as aetataxon (Estes et al., 1988; Gauthier et al., 1988)
enoted with an asterisk, indicating that monophyly iseither statistically supported nor rejected (Schulte et
l., 1998). The genus Diploglossus is not monophyletic cut a more detailed sampling is needed before stableaxonomic changes can be made.
Within the Anguinae, Ophisaurus is not monophy-etic, and statistical support is obtained for the group-ng of Ophisaurus apodus with Anguis fragilis ratherhan with the other species of Ophisaurus. Because oldeneric names exist, Hyalosaurus for O. koellikeri andseudopus for O. apodus, two options are presented.ne option would be to change O. koellikeri fromphisaurus to Hyalosaurus and O. apodus from Ophis-urus to Pseudopus. If these changes were made, theemaining Ophisaurus would still be considered aetataxon because monophyly of this group is sup-
orted only by a decay index of 1 and statistically iseither supported nor rejected. This change would note disruptive unless other Ophisaurus species areound not to form a monophyletic group, thereby requir-ng more taxonomic changes. Alternatively, all taxa inhe Anguinae could be referred to the genus Anguis,hich would provide a long-lasting stable taxonomy.ecause few species are involved, we favor recognitionf a single genus, Anguis.
volution of tRNACys
Tremendous variation occurs among species in poten-ial stem sizes of both D- and T-stem regions of DNAequences encoding tRNACys (Fig. 2). Taxa basal on ourhylogeny (Heloderma, Varanus, and Shinisaurus) haveero, three or four base pairings in the D-stem (Fig. 6).enosaurus and Anniella demonstrate enlarged stemsf five base pairings. All other taxa except two groupsave the normal four base pairings or a slightly re-uced stem of three base pairings. An enlarged stem ofix pairings occurs in Ophisaurus koellikeri, and varia-ion occurs in Elgaria for either three base pairings orne base pairing. Because E. kingii and E. paucicari-ata have a single D-stem pair and E. coerulea, E.ulticarinata, and E. panamintina have three base
airings in the D-stem, an equivocal reconstruction isresented in Fig. 6. Two interpretations are possible:1) two base pairings were lost to produce a stem of onease pairing in the ancestor of E. kingii, E. paucicari-ata, E. multicarinata, and E. panamintina and thenwo base pairings were regained in the ancestor of E.ulticarinata and E. panamintina to produce three
ase pairings or (2) two base pairings were lost indepen-ently in E. kingii and E. paucicarinata. Paralleleletion of a single base that destroys two base pairingsn the D-stems of both E. kingii and E. paucicarinataFigs. 1 and 2) seems more likely than reinsertion of aase in exactly the same place following its deletion,hereby favoring the second hypothesis.
Most species have enlarged T-stems (Fig. 2). Theasal condition appears to be a stem size of six to eightase pairings instead of the normal five base pairingsFig. 6). In the Anniellidae and Anguidae the ancestral
ondition is an enlarged stem of six base pairings.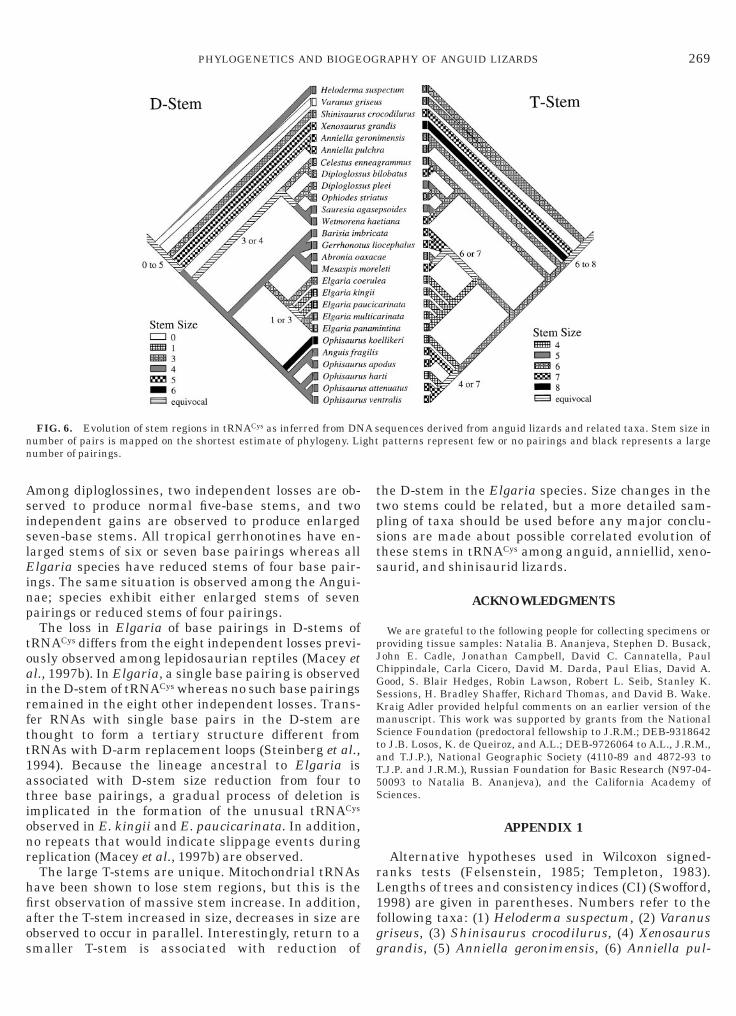
AsislEinp
toairftt1ationr
hfiaos
ttpsts
pJCGSKmStaT5S
rL1fg
nn
269PHYLOGENETICS AND BIOGEOGRAPHY OF ANGUID LIZARDS
mong diploglossines, two independent losses are ob-erved to produce normal five-base stems, and twondependent gains are observed to produce enlargedeven-base stems. All tropical gerrhonotines have en-arged stems of six or seven base pairings whereas alllgaria species have reduced stems of four base pair-
ngs. The same situation is observed among the Angui-ae; species exhibit either enlarged stems of sevenairings or reduced stems of four pairings.The loss in Elgaria of base pairings in D-stems of
RNACys differs from the eight independent losses previ-usly observed among lepidosaurian reptiles (Macey etl., 1997b). In Elgaria, a single base pairing is observedn the D-stem of tRNACys whereas no such base pairingsemained in the eight other independent losses. Trans-er RNAs with single base pairs in the D-stem arehought to form a tertiary structure different fromRNAs with D-arm replacement loops (Steinberg et al.,994). Because the lineage ancestral to Elgaria isssociated with D-stem size reduction from four tohree base pairings, a gradual process of deletion ismplicated in the formation of the unusual tRNACys
bserved in E. kingii and E. paucicarinata. In addition,o repeats that would indicate slippage events duringeplication (Macey et al., 1997b) are observed.The large T-stems are unique. Mitochondrial tRNAs
ave been shown to lose stem regions, but this is therst observation of massive stem increase. In addition,fter the T-stem increased in size, decreases in size arebserved to occur in parallel. Interestingly, return to a
FIG. 6. Evolution of stem regions in tRNACys as inferred from DNumber of pairs is mapped on the shortest estimate of phylogeny. Liumber of pairings.
maller T-stem is associated with reduction of g
he D-stem in the Elgaria species. Size changes in thewo stems could be related, but a more detailed sam-ling of taxa should be used before any major conclu-ions are made about possible correlated evolution ofhese stems in tRNACys among anguid, anniellid, xeno-aurid, and shinisaurid lizards.
ACKNOWLEDGMENTS
We are grateful to the following people for collecting specimens orroviding tissue samples: Natalia B. Ananjeva, Stephen D. Busack,ohn E. Cadle, Jonathan Campbell, David C. Cannatella, Paulhippindale, Carla Cicero, David M. Darda, Paul Elias, David A.ood, S. Blair Hedges, Robin Lawson, Robert L. Seib, Stanley K.essions, H. Bradley Shaffer, Richard Thomas, and David B. Wake.raig Adler provided helpful comments on an earlier version of theanuscript. This work was supported by grants from the Nationalcience Foundation (predoctoral fellowship to J.R.M.; DEB-9318642o J.B. Losos, K. de Queiroz, and A.L.; DEB-9726064 to A.L., J.R.M.,nd T.J.P.), National Geographic Society (4110-89 and 4872-93 to.J.P. and J.R.M.), Russian Foundation for Basic Research (N97-04-0093 to Natalia B. Ananjeva), and the California Academy ofciences.
APPENDIX 1
Alternative hypotheses used in Wilcoxon signed-anks tests (Felsenstein, 1985; Templeton, 1983).engths of trees and consistency indices (CI) (Swofford,998) are given in parentheses. Numbers refer to theollowing taxa: (1) Heloderma suspectum, (2) Varanusriseus, (3) Shinisaurus crocodilurus, (4) Xenosaurus
equences derived from anguid lizards and related taxa. Stem size inpatterns represent few or no pairings and black represents a large
A sght
randis, (5) Anniella geronimensis, (6) Anniella pul-
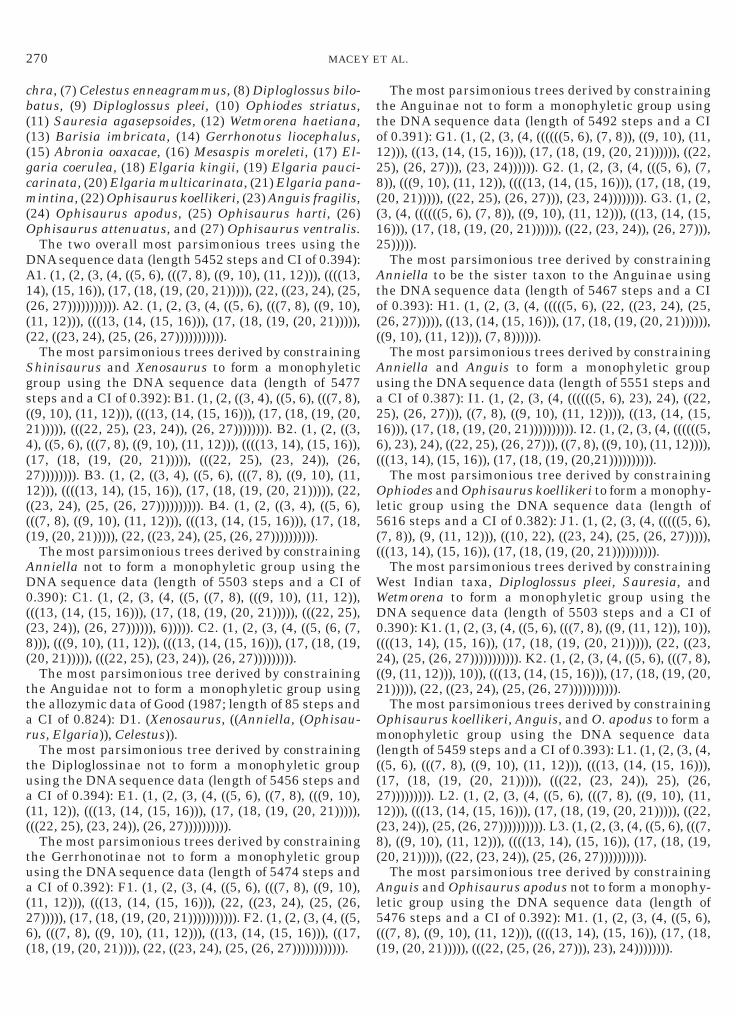
cb(((gcm(O
DA1(((
Sgs(24(21(((
AD0((8(
ttar
tua((
tua(26(
tto128((12
Ato((
Aua216(
Ol5((
WWD0(2(2
Om(((21(8(
Al5(
270 MACEY ET AL.
hra, (7) Celestus enneagrammus, (8) Diploglossus bilo-atus, (9) Diploglossus pleei, (10) Ophiodes striatus,11) Sauresia agasepsoides, (12) Wetmorena haetiana,13) Barisia imbricata, (14) Gerrhonotus liocephalus,15) Abronia oaxacae, (16) Mesaspis moreleti, (17) El-aria coerulea, (18) Elgaria kingii, (19) Elgaria pauci-arinata, (20) Elgaria multicarinata, (21) Elgaria pana-intina, (22) Ophisaurus koellikeri, (23) Anguis fragilis,
24) Ophisaurus apodus, (25) Ophisaurus harti, (26)phisaurus attenuatus, and (27) Ophisaurus ventralis.The two overall most parsimonious trees using theNA sequence data (length 5452 steps and CI of 0.394):1. (1, (2, (3, (4, ((5, 6), (((7, 8), ((9, 10), (11, 12))), ((((13,4), (15, 16)), (17, (18, (19, (20, 21))))), (22, ((23, 24), (25,26, 27))))))))))). A2. (1, (2, (3, (4, ((5, 6), (((7, 8), ((9, 10),11, 12))), (((13, (14, (15, 16))), (17, (18, (19, (20, 21))))),22, ((23, 24), (25, (26, 27))))))))))).
The most parsimonious trees derived by constraininghinisaurus and Xenosaurus to form a monophyleticroup using the DNA sequence data (length of 5477teps and a CI of 0.392): B1. (1, (2, ((3, 4), ((5, 6), (((7, 8),(9, 10), (11, 12))), (((13, (14, (15, 16))), (17, (18, (19, (20,1))))), (((22, 25), (23, 24)), (26, 27)))))))). B2. (1, (2, ((3,), ((5, 6), (((7, 8), ((9, 10), (11, 12))), ((((13, 14), (15, 16)),17, (18, (19, (20, 21))))), (((22, 25), (23, 24)), (26,7)))))))). B3. (1, (2, ((3, 4), ((5, 6), (((7, 8), ((9, 10), (11,2))), ((((13, 14), (15, 16)), (17, (18, (19, (20, 21))))), (22,(23, 24), (25, (26, 27)))))))))). B4. (1, (2, ((3, 4), ((5, 6),((7, 8), ((9, 10), (11, 12))), (((13, (14, (15, 16))), (17, (18,19, (20, 21))))), (22, ((23, 24), (25, (26, 27)))))))))).
The most parsimonious trees derived by constrainingnniella not to form a monophyletic group using theNA sequence data (length of 5503 steps and a CI of.390): C1. (1, (2, (3, (4, ((5, ((7, 8), (((9, 10), (11, 12)),((13, (14, (15, 16))), (17, (18, (19, (20, 21))))), (((22, 25),23, 24)), (26, 27)))))), 6))))). C2. (1, (2, (3, (4, ((5, (6, (7,))), (((9, 10), (11, 12)), (((13, (14, (15, 16))), (17, (18, (19,20, 21))))), (((22, 25), (23, 24)), (26, 27))))))))).
The most parsimonious tree derived by constraininghe Anguidae not to form a monophyletic group usinghe allozymic data of Good (1987; length of 85 steps andCI of 0.824): D1. (Xenosaurus, ((Anniella, (Ophisau-
us, Elgaria)), Celestus)).The most parsimonious tree derived by constraining
he Diploglossinae not to form a monophyletic groupsing the DNA sequence data (length of 5456 steps andCI of 0.394): E1. (1, (2, (3, (4, ((5, 6), ((7, 8), (((9, 10),
11, 12)), (((13, (14, (15, 16))), (17, (18, (19, (20, 21))))),((22, 25), (23, 24)), (26, 27)))))))))).
The most parsimonious trees derived by constraininghe Gerrhonotinae not to form a monophyletic groupsing the DNA sequence data (length of 5474 steps andCI of 0.392): F1. (1, (2, (3, (4, ((5, 6), (((7, 8), ((9, 10),
11, 12))), (((13, (14, (15, 16))), (22, ((23, 24), (25, (26,7))))), (17, (18, (19, (20, 21))))))))))). F2. (1, (2, (3, (4, ((5,), (((7, 8), ((9, 10), (11, 12))), ((13, (14, (15, 16))), ((17,
18, (19, (20, 21)))), (22, ((23, 24), (25, (26, 27)))))))))))). (The most parsimonious trees derived by constraininghe Anguinae not to form a monophyletic group usinghe DNA sequence data (length of 5492 steps and a CIf 0.391): G1. (1, (2, (3, (4, ((((((5, 6), (7, 8)), ((9, 10), (11,2))), ((13, (14, (15, 16))), (17, (18, (19, (20, 21)))))), ((22,5), (26, 27))), (23, 24)))))). G2. (1, (2, (3, (4, (((5, 6), (7,)), (((9, 10), (11, 12)), ((((13, (14, (15, 16))), (17, (18, (19,20, 21))))), ((22, 25), (26, 27))), (23, 24)))))))). G3. (1, (2,3, (4, ((((((5, 6), (7, 8)), ((9, 10), (11, 12))), ((13, (14, (15,6))), (17, (18, (19, (20, 21)))))), ((22, (23, 24)), (26, 27))),5))))).The most parsimonious tree derived by constraining
nniella to be the sister taxon to the Anguinae usinghe DNA sequence data (length of 5467 steps and a CIf 0.393): H1. (1, (2, (3, (4, (((((5, 6), (22, ((23, 24), (25,26, 27))))), ((13, (14, (15, 16))), (17, (18, (19, (20, 21)))))),(9, 10), (11, 12))), (7, 8)))))).
The most parsimonious trees derived by constrainingnniella and Anguis to form a monophyletic groupsing the DNA sequence data (length of 5551 steps andCI of 0.387): I1. (1, (2, (3, (4, ((((((5, 6), 23), 24), ((22,
5), (26, 27))), ((7, 8), ((9, 10), (11, 12)))), ((13, (14, (15,6))), (17, (18, (19, (20, 21)))))))))). I2. (1, (2, (3, (4, ((((((5,), 23), 24), ((22, 25), (26, 27))), ((7, 8), ((9, 10), (11, 12)))),((13, 14), (15, 16)), (17, (18, (19, (20,21)))))))))).
The most parsimonious tree derived by constrainingphiodes and Ophisaurus koellikeri to form a monophy-
etic group using the DNA sequence data (length of616 steps and a CI of 0.382): J1. (1, (2, (3, (4, (((((5, 6),7, 8)), (9, (11, 12))), ((10, 22), ((23, 24), (25, (26, 27))))),((13, 14), (15, 16)), (17, (18, (19, (20, 21)))))))))).
The most parsimonious trees derived by constrainingest Indian taxa, Diploglossus pleei, Sauresia, andetmorena to form a monophyletic group using theNA sequence data (length of 5503 steps and a CI of.390): K1. (1, (2, (3, (4, ((5, 6), (((7, 8), ((9, (11, 12)), 10)),(((13, 14), (15, 16)), (17, (18, (19, (20, 21))))), (22, ((23,4), (25, (26, 27))))))))))). K2. (1, (2, (3, (4, ((5, 6), (((7, 8),(9, (11, 12))), 10)), (((13, (14, (15, 16))), (17, (18, (19, (20,1))))), (22, ((23, 24), (25, (26, 27))))))))))).The most parsimonious trees derived by constrainingphisaurus koellikeri, Anguis, and O. apodus to form aonophyletic group using the DNA sequence data
length of 5459 steps and a CI of 0.393): L1. (1, (2, (3, (4,(5, 6), (((7, 8), ((9, 10), (11, 12))), (((13, (14, (15, 16))),17, (18, (19, (20, 21))))), (((22, (23, 24)), 25), (26,7))))))))). L2. (1, (2, (3, (4, ((5, 6), (((7, 8), ((9, 10), (11,2))), (((13, (14, (15, 16))), (17, (18, (19, (20, 21))))), ((22,23, 24)), (25, (26, 27)))))))))). L3. (1, (2, (3, (4, ((5, 6), (((7,), ((9, 10), (11, 12))), ((((13, 14), (15, 16)), (17, (18, (19,20, 21))))), ((22, (23, 24)), (25, (26, 27)))))))))).
The most parsimonious tree derived by constrainingnguis and Ophisaurus apodus not to form a monophy-
etic group using the DNA sequence data (length of476 steps and a CI of 0.392): M1. (1, (2, (3, (4, ((5, 6),((7, 8), ((9, 10), (11, 12))), ((((13, 14), (15, 16)), (17, (18,
19, (20, 21))))), (((22, (25, (26, 27))), 23), 24)))))))).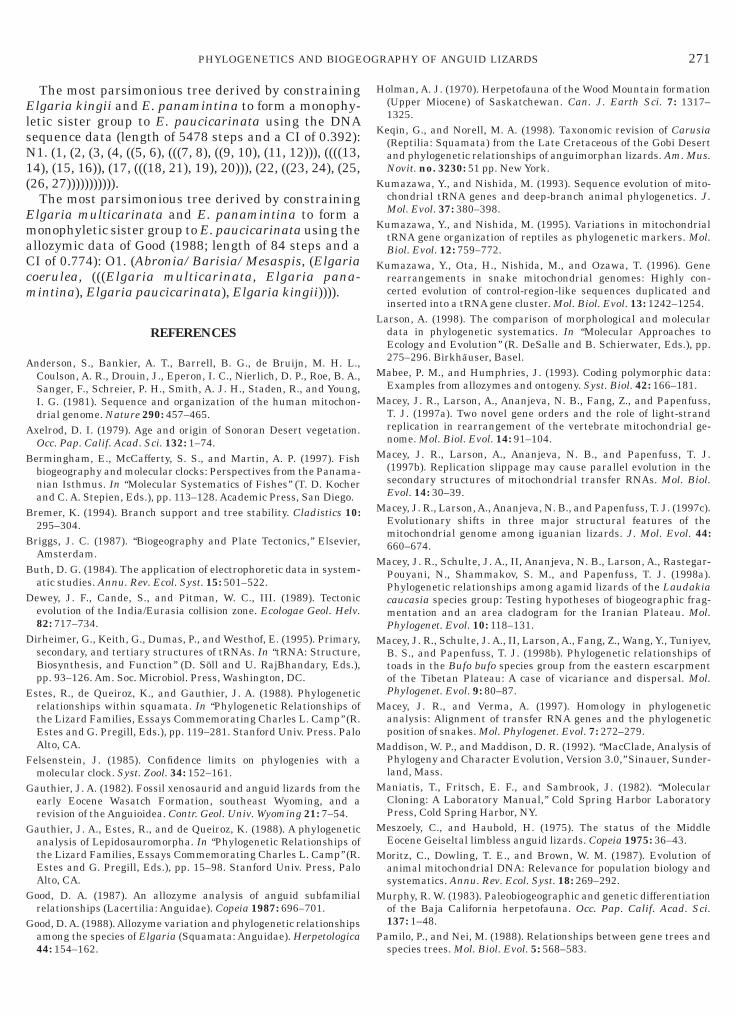
ElsN1(
EmaCcm
A
A
B
B
B
B
D
D
E
F
G
G
G
G
H
K
K
K
K
L
M
M
M
M
M
M
M
M
M
M
M
M
P
271PHYLOGENETICS AND BIOGEOGRAPHY OF ANGUID LIZARDS
The most parsimonious tree derived by constraininglgaria kingii and E. panamintina to form a monophy-
etic sister group to E. paucicarinata using the DNAequence data (length of 5478 steps and a CI of 0.392):1. (1, (2, (3, (4, ((5, 6), (((7, 8), ((9, 10), (11, 12))), ((((13,4), (15, 16)), (17, (((18, 21), 19), 20))), (22, ((23, 24), (25,26, 27))))))))))).
The most parsimonious tree derived by constraininglgaria multicarinata and E. panamintina to form aonophyletic sister group to E. paucicarinata using the
llozymic data of Good (1988; length of 84 steps and aI of 0.774): O1. (Abronia/Barisia/Mesaspis, (Elgariaoerulea, (((Elgaria multicarinata, Elgaria pana-intina), Elgaria paucicarinata), Elgaria kingii)))).
REFERENCES
nderson, S., Bankier, A. T., Barrell, B. G., de Bruijn, M. H. L.,Coulson, A. R., Drouin, J., Eperon, I. C., Nierlich, D. P., Roe, B. A.,Sanger, F., Schreier, P. H., Smith, A. J. H., Staden, R., and Young,I. G. (1981). Sequence and organization of the human mitochon-drial genome. Nature 290: 457–465.xelrod, D. I. (1979). Age and origin of Sonoran Desert vegetation.Occ. Pap. Calif. Acad. Sci. 132: 1–74.
ermingham, E., McCafferty, S. S., and Martin, A. P. (1997). Fishbiogeography and molecular clocks: Perspectives from the Panama-nian Isthmus. In ‘‘Molecular Systematics of Fishes’’ (T. D. Kocherand C. A. Stepien, Eds.), pp. 113–128. Academic Press, San Diego.remer, K. (1994). Branch support and tree stability. Cladistics 10:295–304.
riggs, J. C. (1987). ‘‘Biogeography and Plate Tectonics,’’ Elsevier,Amsterdam.uth, D. G. (1984). The application of electrophoretic data in system-atic studies. Annu. Rev. Ecol. Syst. 15: 501–522.ewey, J. F., Cande, S., and Pitman, W. C., III. (1989). Tectonicevolution of the India/Eurasia collision zone. Ecologae Geol. Helv.82: 717–734.irheimer, G., Keith, G., Dumas, P., and Westhof, E. (1995). Primary,secondary, and tertiary structures of tRNAs. In ‘‘tRNA: Structure,Biosynthesis, and Function’’ (D. Soll and U. RajBhandary, Eds.),pp. 93–126. Am. Soc. Microbiol. Press, Washington, DC.stes, R., de Queiroz, K., and Gauthier, J. A. (1988). Phylogeneticrelationships within squamata. In ‘‘Phylogenetic Relationships ofthe Lizard Families, Essays Commemorating Charles L. Camp’’ (R.Estes and G. Pregill, Eds.), pp. 119–281. Stanford Univ. Press. PaloAlto, CA.
elsenstein, J. (1985). Confidence limits on phylogenies with amolecular clock. Syst. Zool. 34: 152–161.authier, J. A. (1982). Fossil xenosaurid and anguid lizards from theearly Eocene Wasatch Formation, southeast Wyoming, and arevision of the Anguioidea. Contr. Geol. Univ. Wyoming 21: 7–54.authier, J. A., Estes, R., and de Queiroz, K. (1988). A phylogeneticanalysis of Lepidosauromorpha. In ‘‘Phylogenetic Relationships ofthe Lizard Families, Essays Commemorating Charles L. Camp’’ (R.Estes and G. Pregill, Eds.), pp. 15–98. Stanford Univ. Press, PaloAlto, CA.ood, D. A. (1987). An allozyme analysis of anguid subfamilialrelationships (Lacertilia: Anguidae). Copeia 1987: 696–701.ood, D. A. (1988). Allozyme variation and phylogenetic relationshipsamong the species of Elgaria (Squamata: Anguidae). Herpetologica
44: 154–162.olman, A. J. (1970). Herpetofauna of the Wood Mountain formation(Upper Miocene) of Saskatchewan. Can. J. Earth Sci. 7: 1317–1325.eqin, G., and Norell, M. A. (1998). Taxonomic revision of Carusia(Reptilia: Squamata) from the Late Cretaceous of the Gobi Desertand phylogenetic relationships of anguimorphan lizards. Am. Mus.Novit. no. 3230: 51 pp. New York.umazawa, Y., and Nishida, M. (1993). Sequence evolution of mito-chondrial tRNA genes and deep-branch animal phylogenetics. J.Mol. Evol. 37: 380–398.umazawa, Y., and Nishida, M. (1995). Variations in mitochondrialtRNA gene organization of reptiles as phylogenetic markers. Mol.Biol. Evol. 12: 759–772.umazawa, Y., Ota, H., Nishida, M., and Ozawa, T. (1996). Generearrangements in snake mitochondrial genomes: Highly con-certed evolution of control-region-like sequences duplicated andinserted into a tRNA gene cluster. Mol. Biol. Evol. 13: 1242–1254.
arson, A. (1998). The comparison of morphological and moleculardata in phylogenetic systematics. In ‘‘Molecular Approaches toEcology and Evolution’’ (R. DeSalle and B. Schierwater, Eds.), pp.275–296. Birkhauser, Basel.abee, P. M., and Humphries, J. (1993). Coding polymorphic data:Examples from allozymes and ontogeny. Syst. Biol. 42: 166–181.acey, J. R., Larson, A., Ananjeva, N. B., Fang, Z., and Papenfuss,T. J. (1997a). Two novel gene orders and the role of light-strandreplication in rearrangement of the vertebrate mitochondrial ge-nome. Mol. Biol. Evol. 14: 91–104.acey, J. R., Larson, A., Ananjeva, N. B., and Papenfuss, T. J.(1997b). Replication slippage may cause parallel evolution in thesecondary structures of mitochondrial transfer RNAs. Mol. Biol.Evol. 14: 30–39.acey, J. R., Larson, A., Ananjeva, N. B., and Papenfuss, T. J. (1997c).Evolutionary shifts in three major structural features of themitochondrial genome among iguanian lizards. J. Mol. Evol. 44:660–674.acey, J. R., Schulte, J. A., II, Ananjeva, N. B., Larson, A., Rastegar-Pouyani, N., Shammakov, S. M., and Papenfuss, T. J. (1998a).Phylogenetic relationships among agamid lizards of the Laudakiacaucasia species group: Testing hypotheses of biogeographic frag-mentation and an area cladogram for the Iranian Plateau. Mol.Phylogenet. Evol. 10: 118–131.acey, J. R., Schulte, J. A., II, Larson, A., Fang, Z., Wang, Y., Tuniyev,B. S., and Papenfuss, T. J. (1998b). Phylogenetic relationships oftoads in the Bufo bufo species group from the eastern escarpmentof the Tibetan Plateau: A case of vicariance and dispersal. Mol.Phylogenet. Evol. 9: 80–87.acey, J. R., and Verma, A. (1997). Homology in phylogeneticanalysis: Alignment of transfer RNA genes and the phylogeneticposition of snakes. Mol. Phylogenet. Evol. 7: 272–279.addison, W. P., and Maddison, D. R. (1992). ‘‘MacClade, Analysis ofPhylogeny and Character Evolution, Version 3.0,’’ Sinauer, Sunder-land, Mass.aniatis, T., Fritsch, E. F., and Sambrook, J. (1982). ‘‘MolecularCloning: A Laboratory Manual,’’ Cold Spring Harbor LaboratoryPress, Cold Spring Harbor, NY.eszoely, C., and Haubold, H. (1975). The status of the MiddleEocene Geiseltal limbless anguid lizards. Copeia 1975: 36–43.oritz, C., Dowling, T. E., and Brown, W. M. (1987). Evolution ofanimal mitochondrial DNA: Relevance for population biology andsystematics. Annu. Rev. Ecol. Syst. 18: 269–292.urphy, R. W. (1983). Paleobiogeographic and genetic differentiationof the Baja California herpetofauna. Occ. Pap. Calif. Acad. Sci.137: 1–48.
amilo, P., and Nei, M. (1988). Relationships between gene trees and
species trees. Mol. Biol. Evol. 5: 568–583.
R
S
S
S
S
S
S
T
Z
Z
272 MACEY ET AL.
oe, B. A., Ma, D.-P., Wilson, R. K., and Wong, J. F.-H. (1985). Thecomplete sequence of the Xenopus laevis mitochondrial genome. J.Biol. Chem. 260: 9759–9774.
chulte, J. A., II, Macey, J. R., Larson, A., and Papenfuss, T. J. (1998).Molecular tests of phylogenetic taxonomies: A general procedureand example using four subfamilies of the lizard family Iguanidae.Mol. Phylogenet. Evol., 10:367–376.
chwenk, K. (1988). Comparative morphology of the lepidosaurtongue and its relevance to squamate phylogeny. In ‘‘PhylogeneticRelationships of the Lizard Families, Essays CommemoratingCharles L. Camp’’ (R. Estes and G. Pregill, Eds.), pp. 569–598.Stanford Univ. Press, Palo Alto, CA.
eutin, G., Lang, B. F., Mindell, D. P., and Morais, R. (1994).Evolution of the WANCY region in amniote mitochondrial DNA.Mol. Biol. Evol. 11: 329–340.
hackleton, R. M., and Chang, C. (1988). Cenozoic uplift and deforma-
tion of the Tibetan Plateau: The geomorphological evidence. Phil.Trans. R. Soc. Lond. A 327: 365–377.
teinberg, S., Gautheret, D., and Cedergren, R. (1994). Fitting thestructurally diverse animal mitochondrial tRNAsSer to commonthree-dimensional constraints. J. Mol. Biol. 236: 982–989.
wofford, D. L. (1998). ‘‘PAUP*. Phylogenetic Analysis Using Parsi-mony (*and Other Methods), Beta Version 4.0b1,’’ Sinauer, Sunder-land, Mass.
empleton, A. R. (1983). Phylogenetic inference from restrictionendonuclease cleavage site maps with particular reference to theevolution of humans and the apes. Evolution 37: 221–244.
hao, E.-M., and Adler, K. (1993). Herpetology of China. Soc. StudyAmphib. Reptiles Contr. Herpetol. 10: 1–522.
hang, D.-X., and Hewitt, G. M. (1996). Nuclear integrations: Chal-lenges for mitochondrial DNA markers. Trends Ecol. Evol. 11:247–251.


![[MP] 02 - Phylogenetics - biologia.campusnet.unito.it · Molecular Phylogenetics Basis of Molecular Phylogenies Overview ¾Phylogenetics Definitions ¾Genetic Variation and Evolution](https://img.pdfslide.net/doc/110x75/5c6216d809d3f238158b4601/mp-02-phylogenetics-molecular-phylogenetics-basis-of-molecular-phylogenies.jpg)
![RESEARCH ARTICLE Open Access Fragmentation of ... - SLU.SE · 18–46 nt pieces derived from mature tRNA or the 3 ′ end of precursor-tRNA (pre-tRNA) [14-16]. tRNA fragmenta-tion](https://img.pdfslide.net/doc/110x75/60474a078cb48655a57c0958/research-article-open-access-fragmentation-of-sluse-18a46-nt-pieces-derived.jpg)