Embed Size (px)
Citation preview

Molecular Phylogeny and Biogeographic History of theArmored Neotropical Catfish SubfamiliesHypoptopomatinae, Neoplecostominae and Otothyrinae(Siluriformes: Loricariidae)Fabio F. Roxo1*, James S. Albert2, Gabriel S. C. Silva1, Claudio H. Zawadzki3, Fausto Foresti1,
Claudio Oliveira1
1 Laboratorio de Biologia e Genetica de Peixes, Departamento de Morfologia, Universidade Estadual Paulista, UNESP, Botucatu, SP, Brazil, 2 Department of Biology,
University of Louisiana at Lafayette, Lafayette, Louisiana, United States of America, 3 Nupelia, Universidade Estadual de Maringa, UEM, Maringa, PR, Brazil
Abstract
The main objectives of this study are estimate a species-dense, time-calibrated molecular phylogeny of Hypoptopomatinae,Neoplecostominae, and Otothyrinae, which together comprise a group of armoured catfishes that is widely distributedacross South America, to place the origin of major clades in time and space, and to demonstrate the role of river capture onpatterns of diversification in these taxa. We used maximum likelihood and Bayesian methods to estimate a time-calibratedphylogeny of 115 loricariid species, using three mitochondrial and one nuclear genes to generate a matrix of 4,500 basepairs, and used parametric biogeographic analyses to estimate ancestral geographic ranges and to infer the effects of rivercapture events on the geographic distributions of these taxa. Our analysis recovered Hypoptopomatinae, Neoplecosto-minae, and Otothyrinae as monophyletic with strong statistical support, and Neoplecostominae as more closely related toOtothyrinae than to Hypoptopomatinae. Our time-calibrated phylogeny and ancestral-area estimations indicate an origin ofHypoptopomatinae, Neoplecostominae, and Otothyrinae during the Lower Eocene in the Atlantic Coastal Drainages, fromwhich it is possible to infer several dispersal events to adjacent river basins during the Neogene. In conclusion we infer astrong influence of river capture in: (1) the accumulation of modern clade species-richness values; (2) the formation of themodern basin-wide species assemblages, and (3) the presence of many low-diversity, early-branching lineages restricted tothe Atlantic Coastal Drainages. We further infer the importance of headwater stream capture and marine transgressions inshaping patterns in the distributions of Hypoptopomatinae, Neoplecostominae and Otothyrinae throughout South America.
Citation: Roxo FF, Albert JS, Silva GSC, Zawadzki CH, Foresti F, et al. (2014) Molecular Phylogeny and Biogeographic History of the Armored Neotropical CatfishSubfamilies Hypoptopomatinae, Neoplecostominae and Otothyrinae (Siluriformes: Loricariidae). PLoS ONE 9(8): e105564. doi:10.1371/journal.pone.0105564
Editor: Helge Thorsten Lumbsch, Field Museum of Natural History, United States of America
Received May 14, 2014; Accepted July 21, 2014; Published August 22, 2014
Copyright: � 2014 Roxo et al. This is an open-access article distributed under the terms of the Creative Commons Attribution License, which permitsunrestricted use, distribution, and reproduction in any medium, provided the original author and source are credited.
Data Availability: The authors confirm that all data underlying the findings are fully available without restriction. Data are available from the GenBank sequencedatabase and accession numbers are listed in the supporting information.
Funding: This research was supported by the Brazilian agency FAPESP (Fundacao de Amparo a Pesquisa do Estado de Sao Paulo, proc. 2010/01610-9 to FFR andproc. 2012/01622-2 to GSCS). The funders had no role in study design, data collection and analysis, decision to publish, or preparation of the manuscript.
Competing Interests: The authors have declared that no competing interests exist.
* Email: [email protected]
Introduction
A central aim of research in modern historical biogeography is
to understand the distributions of species and ecosystems in light of
historical processes that shape landscape evolution [1,2]. This
effort has made rapid progress over the past decade in the study of
Neotropical freshwater fishes. The continental fishes of tropical
South America represent about one fifth of the world’s fish species,
or 10% of all vertebrate species [3,4]. The evolutionary and
ecological reasons for the origins and maintenance of this high
diversity remain poorly understood. However, for obligate
freshwater organisms, river capture is an important landscape-
level process that can isolate lineages and promote diversification
[5–7] by changing patterns in the connectivity of adjacent river
basins [8–11].
River capture (also called stream capture or stream piracy) is a
geomorphological process by which the flow of part of a stream or
river drainage basin is diverted into that of a neighbouring basin.
River capture may arise from the influence of several geomor-
phological processes, including tectonic uplift or tilting, damming
by the actions of glaciers or landslides, denudation of watershed
margins by erosion, or avulsion of watershed margins by sediment
accumulation in fans and estuaries [12–16]. The process of
headwater or lateral watershed erosion has the remarkable effect
of simultaneously separating portions of river basins that were
formerly connected (i.e., vicariance), and of connecting portions of
river basins that were formerly isolated (i.e., geodispersal). In other
words, river capture moves the physical location of watershed
barriers [7,17]. For obligate aquatic taxa, such as freshwater fishes,
amphibians, and other animal and plant groups that inhabit
riparian or floodplain habitats, river capture facilitates the
dispersal of species between adjacent drainage basins.
The biogeographic consequences of river capture can be
profound for species that are restricted to river basins, and for
PLOS ONE | www.plosone.org 1 August 2014 | Volume 9 | Issue 8 | e105564
which watershed boundaries strongly limit dispersal [17–19]. As in
all vicariance events, the separation of formerly adjacent river
basin segments promotes allopatric divergence, and may ultimate-
ly lead to speciation. However, in addition, and unlike many
vicariance-only events, river capture always results in both theseparation and the merging of adjacent river basin segments [4,20].
In other words, in the special case of river capture, vicariance and
geodispersal are near simultaneous and complementary biogeo-
graphic processes. Further, both vicariance and geodispersal may
result in concordant biogeographic patterns among many lineages
that constitute a regional biota, (see fig. 10 in Lieberman [21],
[22]). Importantly, in the case of river capture, and under the
widely-used convention that geographic range is defined in terms
of the river basin(s) a species occupies (e.g. [23,24]), geodispersal
can result in geographic range expansion without necessarily
involving biotic dispersal [25].
Among Neotropical freshwater fishes, members of the family
Loricariidae, armoured catfishes, represent an excellent model to
study the effects of landscape evolution on lineage diversification.
Loricariids inhabit most aquatic habitats and geographic regions
of tropical South and Central America. About 869 loricariid
species are currently recognized as valid [26], which makes this
taxon the second-most species-rich family of Neotropical fresh-
water fishes (after Characidae). Loricariids also exhibit a broad
range of ecological tolerances and geographic distributions. Many
species are extreme habitat or trophic specialists [27–31], and
many species are highly endemic, with small geographic ranges
[16,22,33].
Within the Loricariidae the three subfamilies, Hypoptopoma-
tinae, Neoplecostominae and Otothyrinae, have long been
recognized together as natural group using morphological and
molecular data [32,34–38]. Separately, these three subfamilies
were hypothesized to form monophyletic groups in Chiachio et al.
[36] using molecular data. No formal infrafamily name has yet
been applied to this clade, which we will refer to here as the HNO-
clade. Each of these three subfamily-level clades is also species-
rich, and the HNO-clade as a whole has 182 nominal species
currently recognized [39]. Each of these subfamilies exhibits a
wide geographic distribution throughout tropical cis-Andean
South America, and has a lengthy and complex taxonomic
history, including studies using both morphological and molecular
datasets [32,36–38,40–49].
Here, we present a time-calibrated phylogenetic analysis of the
loricariid catfish subfamilies Hypoptopomatinae, Neoplecostomi-
nae and Otothyrinae, using a combination of three mitochondrial
and one nuclear gene markers, and the most species-dense taxon
sampling of these groups to date. We then use parametric
biogeographic methods to estimate ancestral geographic ranges,
and to document several historical river-capture events in the
region of Southeastern Brazil. Our results highlight the special role
of river capture in the formation of the modern species richness
and geographic distributions of the Hypoptopomatinae, Neople-
costominae and Otothyrinae.
Materials and Methods
Taxon SamplingDiplomystes mesembrinus (Diplomystidae) was used as a distant
outgroup to root all phylogenies. Diplomystidae has been
alternatively been reported as the sister group to all other catfishes,
or as the sister group to Siluroidea, a clade of catfishes that
excludes Loricarioidea [50–56]. Additionally, samples of Cory-doras imitator, Corydoras oiapoquensis, Hoplosternum littorale,Callichthys callichthys (Callichthyidae), Astroblepus sp. 1 and
Astroblepus sp. 2 (Astroblepidae), Hemipsilichthys gobio, H.papillatus, Delturus parahybae (Loricariidae, subfamily Deltur-
inae), Rineloricaria lanceolata, Spatuloricaria sp. 1 (Loricariidae,
subfamily Loricariinae), Hypostomus ancistroides, H. nigromacu-latus and H. microstomus (Loricariidae, subfamily Hypostominae)
were included in the analysis as additional outgroups. We included
in the analysis 155 specimens representing 115 loricariid species
(see table S1 to all species names, localities and deposits in
museums and table S2 to taxonomic summary of ingroup species).
Ethics StatementAll fishes collected for this study were collected in accordance
with Brazilian laws, under a permanent scientific collection license
in the name of Dr. Claudio Oliveira (SISBIO). Additionally, our
laboratory has special federal permission to keep animals and
tissues from a public collection under our care. To work with the
animals, we follow all the ethical prescriptions stated by our
internal committee of ethic called ‘‘Comissao de Etica na
Experimentacao Animal’’ (CEEA) involving animal experiments
(protocol number 388) that approved this study. After collection,
animals were anesthetized with benzocaine, and a piece of muscle
tissue was extracted from the right side of the body and preserved
in 95% ethanol. Voucher specimens were fixed in 10% formalin
for two weeks, and then transferred to 70% ethanol for permanent
storage.
Vouchers of all samples were deposited in the collection of the
Laboratorio de Biologia e Genetica de Peixes (LBP), Departa-
mento de Morfologia, Instituto de Biociencias, Universidade
Estadual Paulista, Botucatu, Sao Paulo, Brazil, Museu de Ciencias
e Tecnologia, Pontifıcia Universidade Catolica do Rio Grande do
Sul (MCP), Porto Alegre, Rio Grande do Sul, Brazil; Nucleo
de Pesquisas em Limnologia, Ictiologia e Aquicultura (NUP),
Universidade Estadual de Maringa, Parana, Brazil, or the
Museum of Natural History of the City of Geneva (MHNG),
Geneva, Switzerland.
DNA Extraction and SequencingTotal DNA was extracted from ethanol preserved muscle
samples with the DNeasy Tissue Kit (Qiagen), following manu-
facturer’s instructions. Partial sequences of the genes 16S rRNA
[57], cytochrome b (Cytb) [58], cytochrome c oxidase subunit I
(COI) [59] and F-reticulon 4 [36] were amplified using polymerase
chain reaction (PCR) with the primers described in Table S3.
Amplifications were performed in a total volume of 12.5 ml with
1.25 ml of 106 buffer (10 mM Tris-HCl+15 mM MgCl2), 0.5 ml
dNTPs (200 nM of each), 0.5 ml each 5 mM primer, 0.05 ml
Platinum Taq Polymerase (Invitrogen), 1 ml template DNA
(12 ng), and 8.7 ml ddH2O. The PCR reactions consisted of
30–40 cycles, 30 s at 95uC, 15–30 s at 48–58uC (according to
primer and species), and 45–90 s at 72uC (according to gene
primers). Nested-PCRs were used to amplify the nuclear marker;
the first amplification was performed using the primers Freticul4-
D and Freticul4-R with a total volume of 12.5 ml for 30–40 cycles
(30 s at 95uC, 30 s at 48uC, and 135 s at 72uC); the second
amplification was performed using the primers Freticul4 D2 and
Freticul4 R2 with a total volume of 12.5 ml for 30–40 cycles (30 s
at 95uC, 30 s at 53–54uC, and 135 s at 72uC). All PCR products
were first visually identified on a 1% agarose gel and then purified
using ExoSap-IT (USB Corporation) following instructions of the
manufacturer. The purified PCR products were sequenced using
the ‘‘Big DyeTM Terminator v 3.1 Cycle Sequencing Ready
Reaction Kit’’ (Applied Biosystems), purified again by ethanol
precipitation and loaded on an automatic sequencer 3130-Genetic
Molecular Phylogeny and Biogeographic History of Cascudinhos
PLOS ONE | www.plosone.org 2 August 2014 | Volume 9 | Issue 8 | e105564
Analyzer (Applied Biosystems) in the Instituto de Biociencias,
Universidade Estadual Paulista, Botucatu, Sao Paulo.
Sequence and Phylogenetic AnalysisAll individual sequences for each species were initially analysed
using the software program BioEdit 5.0.9 [60] and consensus
sequences were obtained. All sequences for each gene were
independently aligned using MUSCLE [61] under default
parameters and the alignments inspected by eye for any obvious
misalignments. Only alignment errors were corrected, where
indels of 1 bp were added to introns of the reticulon gene. A
quality control step was included in our workflow to detect
potential cases of sequencing errors due to contamination or
paralogy. Alignments for each gene were initially analysed by
maximum likelihood (ML) [62] using the web servers RAxML
BlackBox [63] for a previous phylogenetic analysis, and controlling
potential sequencing errors involving pseudogenes, paralogous
copies or even laboratory cross-contamination or mistakes during
the sequencing process. After that, sequences of all genes were
concatenated to perform all phylogenetic and biogeography
analysis (e.g. all four genes for all specimens).
Sequences that were found misplaced in the resulting gene tree
(as, for example, species of one subfamily grouped with species of
an obviously non-related subfamily) were re-sequenced. Nucleo-
tide variation, substitution patterns, and genetic distances were
examined using MEGA 5.0 [64]. To evaluate the occurrence of
substitution saturation for each gene separately, we estimated the
index of substitution saturation (Iss) as described by Xia et al. [65]
and Xia and Lemey [66] and the rate of transitions/transversions,
both evaluated in the software DAMBE 5.2.31 [67]. The Iss
estimation was performed without taking into account gaps
because unresolved sites reduce the ability of the method to test
for phylogenetic signal. The best-fit partitioning schemes and the
best nucleotide evolution model for each partition were evaluated
in the software PartitionFinder [68] under the information-
theoretic measure of Akaike Information Criterion (AICc).
Maximum likelihood analyses were performed using RAxML
Web-Servers [62]. RAxML implements a faster algorithm of
heuristic searches with bootstrap pseudoreplicates (RBS). Boot-
strap (BS) resampling [69] was applied to assess support for
individual nodes using 1,000 replicates. Random starting trees
were used for each independent ML tree search and all other
parameters were set on default values. The ML analyses were
conducted under different models for each partition of the matrix
as evaluated for the software PartitionFinder [68] (Table S4).
Bayesian inference (BI) [70] was performed evaluating alternative
tree topologies through the estimation of posterior probabilities (P)
using MrBayes v.3.0 [71]. The Bayesian inference was conducted
under different models for each partition of the matrix as
evaluated for the software PartitionFinder [68] (Table S4). The
ML tree was used as a starting tree for the Markov chain Monte
Carlo searches. Eight chains were run simultaneously for
100,000,000 generations and every 1000th generation a tree was
sampled. The above analysis was performed twice. The distribu-
tion of log-likelihood scores was examined to determine stationary
phase for each search and to decide if extra runs were required to
achieve convergence, using the program Tracer 1.5 [72]. All
sampled topologies beneath the asymptote (25,000,000 genera-
tions) were discarded as part of a burn-in procedure, and the
remaining trees were used to construct a 50% majority-rule
consensus tree in Paup* [73].
Alternative tree topologies were evaluated in the program
Treefinder [74] using the Shimodaira and Hasegawa (SH) test
[75], the Approximately Unbiased (AU) test [76], and the
Expected Likelihood Weights (ELW) method [77]. All tests were
conducted under ML with a 14 partition scheme and with the
same model implemented in RAxML analysis (Table S4).
Time Calibration and Ancestral-area estimationThe uncorrelated relaxed molecular clock (lognormal) was
estimated using BEAST v.1.7.5. All clade-age estimates are
presented as the mean and 95% highest posterior density (HPD)
values, which are the upper and lower bounds of the HPD
interval. We included two calibration points to constrain
divergence dates for the 154 clades identified in our phylogenetic
tree. The first calibration point was implemented as a normally-
distributed prior, with an offset of 125 million years ago (Mya), and
a standard deviation of 15 million years. These date-estimate
parameters were selected to match current knowledge of the
timing of siluriform origins and were implemented in the root of
the tree. Information from the stratigraphic record and geographic
distributions of living taxa indicate an origin for Siluriformes as a
whole during the Lower Cretaceous (145–100 Mya; [56,78,79]).
The second calibration point was implemented using a log-
normal prior offset to 55 Mya with a mean and standard deviation
of 1 for the origin of the genus Corydoras lineage (node including
Corydoras imitator, Corydoras oiapoquensis, Hoplosternum littoraleand Callichthys callichthys). The oldest known callichthyid fossil,
Corydoras revelatus [80] was dated by Marshall et al. [81] as
Paleocene. This prior assumed 55 Mya as a minimum age. We
used a macroevolutionary Birth–Death model for the diversifica-
tion likelihood values and a starting tree obtained from the
RAxML analysis. The analyses were conducted under different
models of molecular evolution for each partition of the data matrix
as evaluated by the software PartitionFinder [68] (Table S4). The
ML tree obtained was used as a starting tree for the MCMC
searches. The analysis was run for 50 million generations and
sampled every 1000th generation. Stationarity and sufficient
mixing of parameters (ESS.200) was checked using Tracer v1.5
[72]. A consensus tree was built using TreeAnnotator v1.7.5 [82].
Data on the geographic distributions of species in each of the
three subfamilies analysed here (Hypoptopomatinae, Neoplecos-
tominae and Otothyrinae) were taken from the original species
descriptions and information available at catalog of Eschmeyer
[26]. We assigned taxa to geographic areas using the ecoregion
classifications of Vari and Malabarba [3] and Chiachio et al. [36],
within the following five biogeographic regions: A, Atlantic
Coastal Drainages of Southeastern Brazil; B, Upper Parana Basin;
C, Paraguay, Lower Parana and Uruguay basins; D, Amazon and
Orinoco basins; E, Sao Francisco basin and Coastal Drainages of
Northeastern of Brazil.
A maximum-likelihood analysis of biogeographic history was
also performed in Lagrange v2.0 [(Ree et al., 2005; Ree and
Smith, 2008) using a DEC model of geographic range evolution.
The DEC model specifies instantaneous transition rates between
discrete distribution areas along the branches of a phylogenetic
tree, and uses these rates to assess the likelihoods of ancestral
distributions at cladogenetic events [83,84]. Four DEC models
were tested to estimate distribution ranges inherited by the
descending lineages at each node of the tree. The differences
between the models are in the rate of dispersal among adjacent
and no adjacent areas (see Table S5 for the likelihood values and
dispersal rate among adjacent and no adjacent areas for each
model). The model that obtained the highest ML values was model
3 (M3) that constrained the dispersal rates between adjacent areas
at 0.5 and areas separated by one or more intercalated areas at
0.0001.
Molecular Phylogeny and Biogeographic History of Cascudinhos
PLOS ONE | www.plosone.org 3 August 2014 | Volume 9 | Issue 8 | e105564
Results
Phylogenetic AnalysisPartial sequences of three mitochondrial genes (16S rRNA,
COI, Cytb) and one nuclear gene (F-reticulon 4) were obtained
from 155 specimens representing 115 loricariid species (Table S1).
The combined sequence data resulted in a matrix of exactly 4,500
base pairs (bp), of which 1,482 bp (33%) were non-variable
(conserved), 2,677 bp (59%) were variable and included in the
analysis, and 341 bp (8%) were variable indels excluded from the
analysis. This matrix was used to perform all phylogenetic and
biogeographic analyses and was partitioned by gene and coding
positions into 14 sections (Table S4). These data were not
saturated considering that the Iss.c value is greater than the Iss,
and the R2 value is greater than 0.70 for transitions and
transversions for all the genes (Table S6).
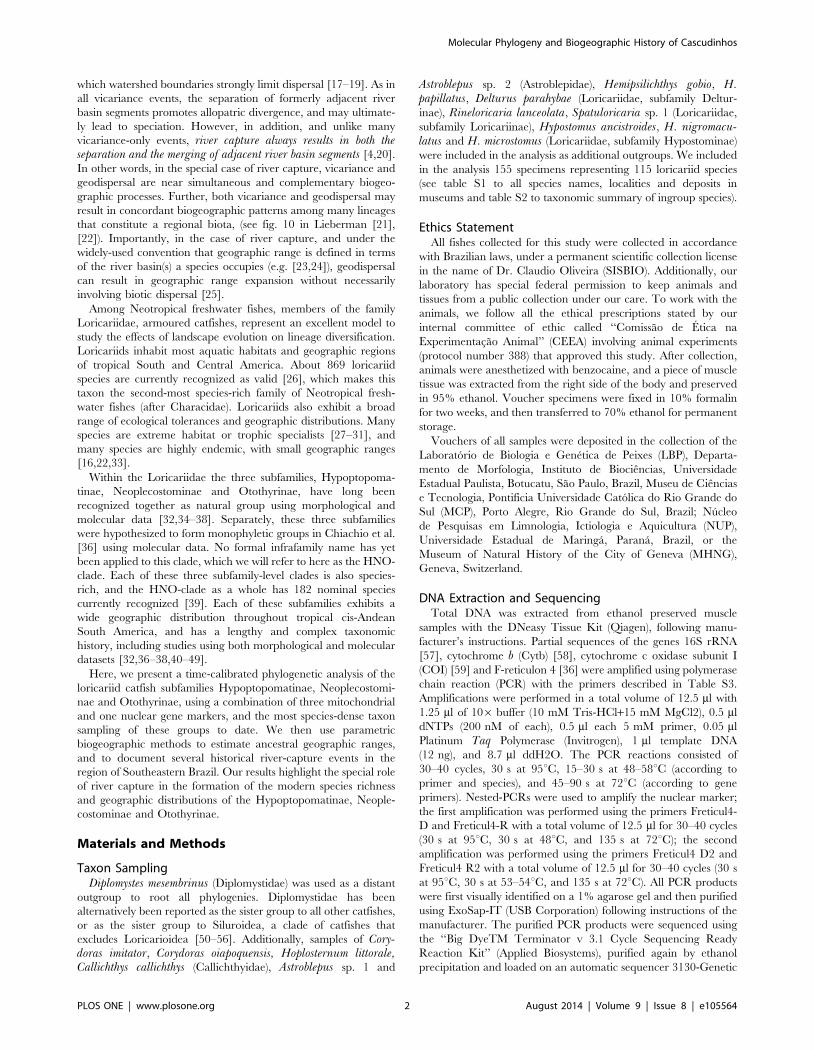
Bayesian and ML phylogenetic analyses resulted in very similar
topologies (Figs. 1–4). Our results illustrate that the clades
Hypoptopomatinae, Neoplecostominae and Otothyrinae are
monophyletic with strong statistical support (BS = 96, P = 0.99
for Hypoptopomatinae; BS = 99, P = 1.00 for Neoplecostominae;
BS = 96, P = 0.99 with BI for Otothyrinae). Additionally, our
results suggest that Neoplecostominae is more closely related to
Otothyrinae than to Hypoptopomatinae (BS = 98, P = 0.99), and
that these two clades together form the sister group to
Hypoptopomatinae to the exclusion of other Loricariidae
(BS = 97, P = 1.00). Tree topology tests rejected the hypothesis
that Otothyrinae and Hypoptopomatinae are sister groups
(as proposed by Schaefer 1991 and 1998) in two (ELW and AU)
of the three tests performed (Table S7). The hypothesis that
Otothyrinae and Hypoptopomatinae are sister taxa was not
supported by the SH test, but this test is considered less reliable
than the AU test for the same datasets [76].
Within Hypoptopomatinae all examined genera were recovered
as monophyletic with strong statistical support values (BS = 69,
P = 1.0 for Otocinclus; BS = 97, P = 1.0 for Oxyropsis; BS = 100,
P = 1 for Acestridium; BS = 100, P = 1 for Hypoptopoma). Otocin-clus was recovered as the sister group of Lampiella gibbosa, and
these taxa together formed the sister group to a clade consisting of
Oxyropsis, Acestridium and Hypoptopoma. Acestridium and
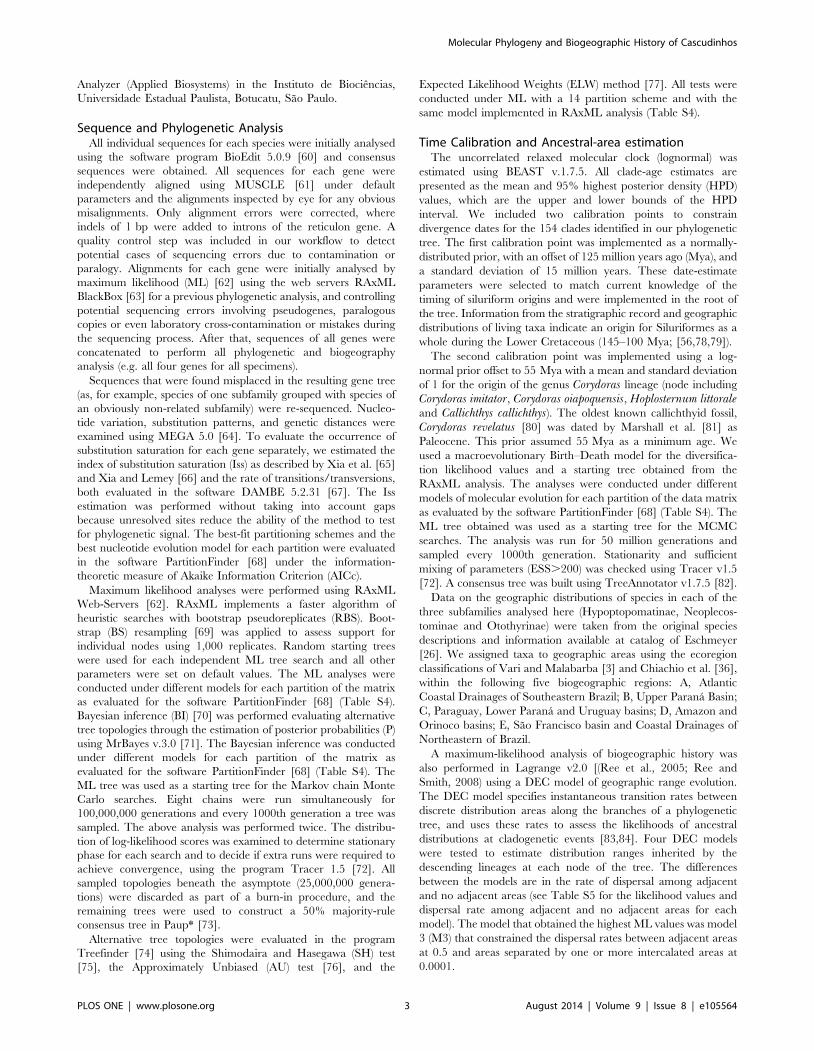
Hypoptopoma group together as the sister group to Oxyropsis.Within Neoplecostominae Kronichthys and Isbrueckerichthys
were recovered as monophyletic with high statistical support
(BS = 100, P = 1.0 for Kronichthys; BS = 69, P = 0.99 for Isbrueck-erichthys), however Pareiorhaphis, Pareiorhina and Neoplecosto-mus were not recovered as monophyletic. The topology tests
rejected the hypothesis of a monophyletic Neoplecostomus and
Pareiorhina (Table S7). Pareiorhaphis splendens formed the sister
group to species of Kronichthys, and this group formed the sister
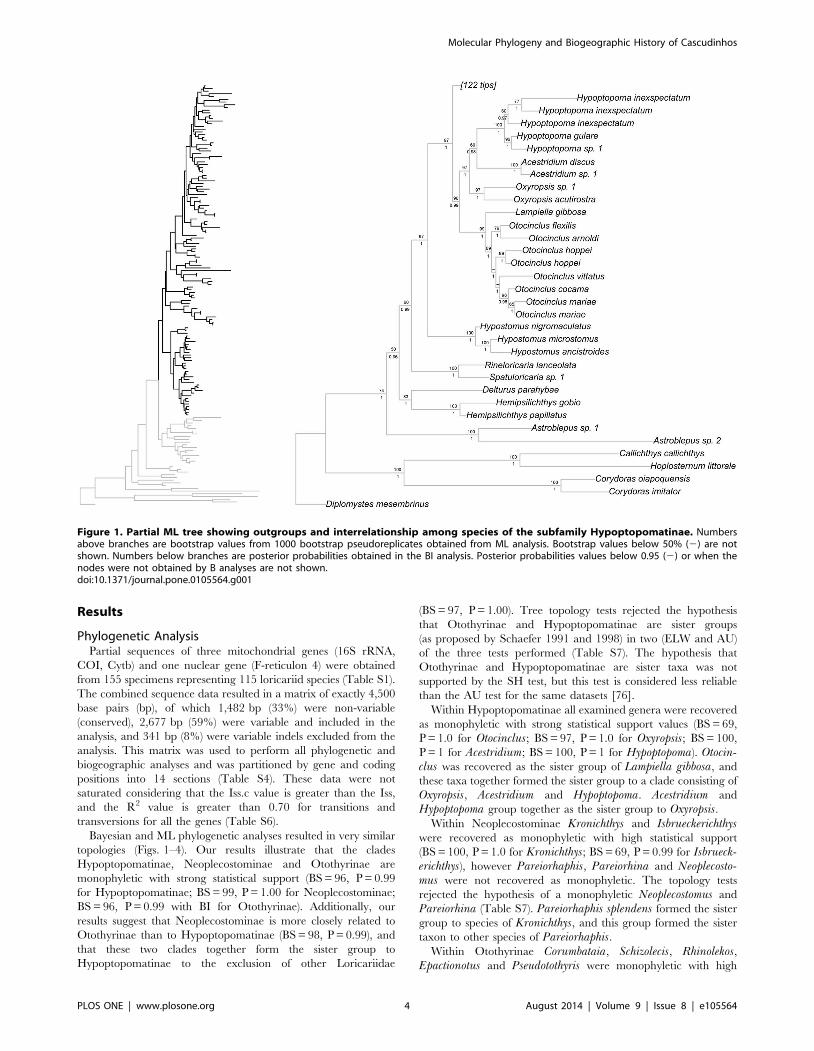
taxon to other species of Pareiorhaphis.Within Otothyrinae Corumbataia, Schizolecis, Rhinolekos,
Epactionotus and Pseudotothyris were monophyletic with high
Figure 1. Partial ML tree showing outgroups and interrelationship among species of the subfamily Hypoptopomatinae. Numbersabove branches are bootstrap values from 1000 bootstrap pseudoreplicates obtained from ML analysis. Bootstrap values below 50% (2) are notshown. Numbers below branches are posterior probabilities obtained in the BI analysis. Posterior probabilities values below 0.95 (2) or when thenodes were not obtained by B analyses are not shown.doi:10.1371/journal.pone.0105564.g001
Molecular Phylogeny and Biogeographic History of Cascudinhos
PLOS ONE | www.plosone.org 4 August 2014 | Volume 9 | Issue 8 | e105564
statistical support (BS = 100, P = 1.0 for Corumbataia; BS = 100,
P = 1.0 for Schizolecis; BS = 100, P = 1.0 with BI for Rhinolekos;BS = 92, P = 1.0 for Epactionotus, BS = 85, P = 0.99 for Pseudo-tothyris). The genera Hisonotus and Parotocinclus were not
monophyletic. There are four lineages within the subfamily
Otothyrinae that include species currently assigned to Hisonotus.The first lineage includes the species Hisonotus insperatus, H.oliveirai, H. paresi, H. piracanjuba, Hisonotus sp. 4, and
Hisonotus sp. 5 and is supported by high statistical support values
(BS = 100 with ML and P = 1). The second lineage is composed of
the species Hisonotus chromodontus, Hisonotus sp. 1, Hisonotus sp.
2, Hisonotus sp. 3, Parotocinclus aripuanensis, Parotocinclus aff.
spilurus, and Parotocinclus sp. 3. The third lineage is composed of
Hisonotus depressicauda, H. francirochai and H. paulinus, and is
supported by high statistical support values (BS = 99, P = 1.0). The
fourth lineage is composed of the most number of Hisonotusspecies in this analysis, including Hisonotus aky, H. iota, H.montanus, H. megaloplax, H. prata, H. carreiro, H. ringueleti, H.nigricauda, H. notopagos, H. cf. charrua, H. laevior, H. charrua,
H. leucophrys, H. leucofrenatus, H. cf. taimensis, H. notatus and
Figure 2. Partial ML tree showing interrelationship among species of the subfamily Neoplecostominae. Numbers above branches arebootstrap values from 1000 bootstrap pseudoreplicates obtained from ML analysis. Bootstrap values below 50% (2) are not shown. Numbers belowbranches are posterior probabilities obtained in the BI analysis. Posterior probabilities values below 0.95 (2) or when the nodes were not obtained byB analyses are not shown.doi:10.1371/journal.pone.0105564.g002
Molecular Phylogeny and Biogeographic History of Cascudinhos
PLOS ONE | www.plosone.org 5 August 2014 | Volume 9 | Issue 8 | e105564
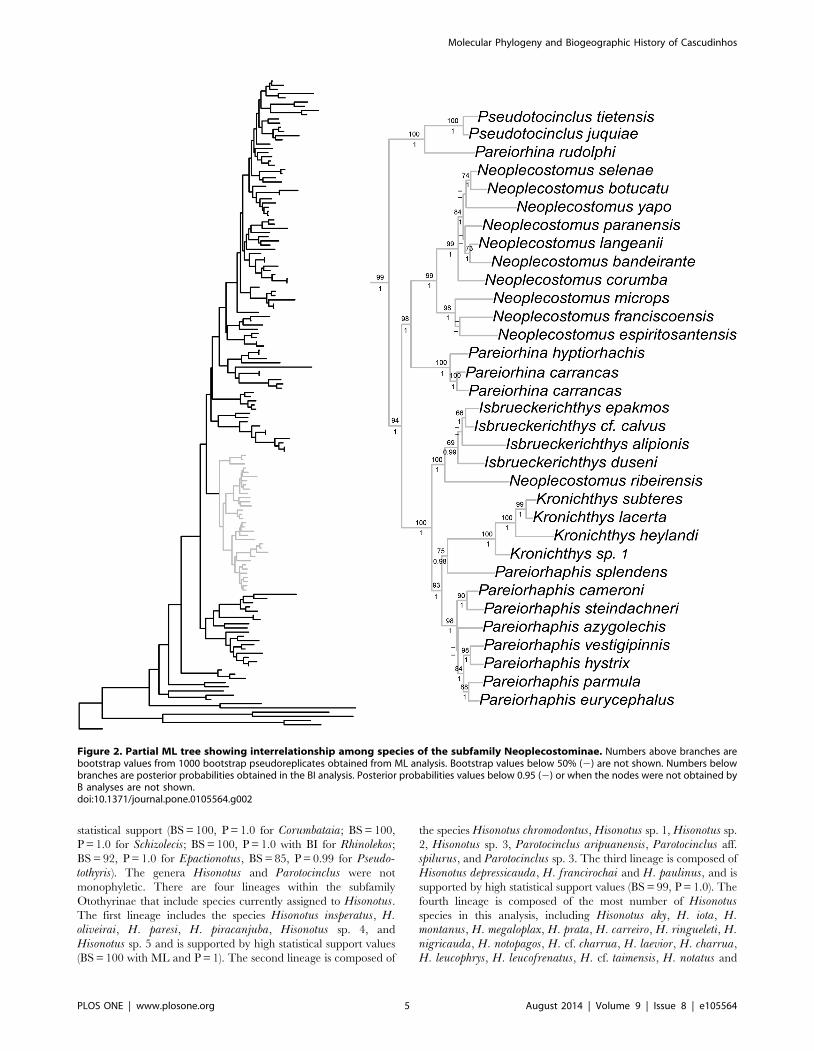
H. armatus, and for species Otothyropsis marapoama, Eurychei-lichthys sp. 1, Epactionotus bilineatus, E. itaimbezinho and E.gracilis, and is supported by high statistical support values
(BS = 72, P = 0.99).
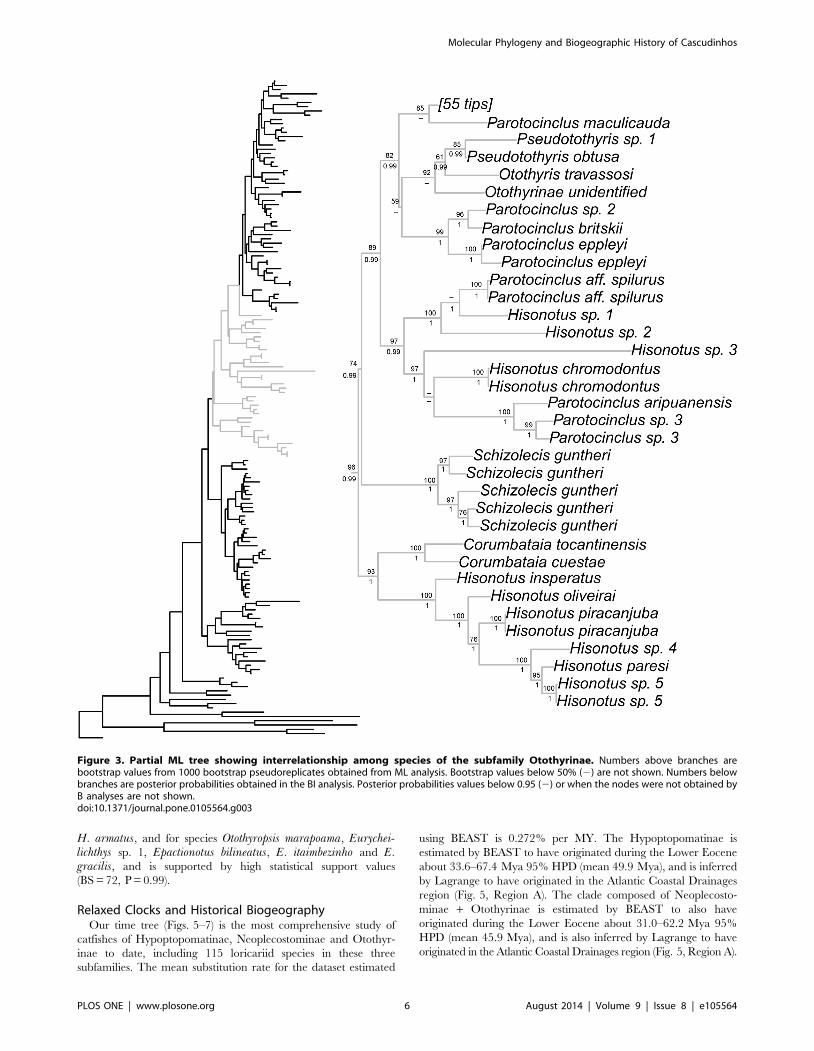
Relaxed Clocks and Historical BiogeographyOur time tree (Figs. 5–7) is the most comprehensive study of
catfishes of Hypoptopomatinae, Neoplecostominae and Otothyr-
inae to date, including 115 loricariid species in these three
subfamilies. The mean substitution rate for the dataset estimated
using BEAST is 0.272% per MY. The Hypoptopomatinae is
estimated by BEAST to have originated during the Lower Eocene
about 33.6–67.4 Mya 95% HPD (mean 49.9 Mya), and is inferred
by Lagrange to have originated in the Atlantic Coastal Drainages
region (Fig. 5, Region A). The clade composed of Neoplecosto-
minae + Otothyrinae is estimated by BEAST to also have
originated during the Lower Eocene about 31.0–62.2 Mya 95%
HPD (mean 45.9 Mya), and is also inferred by Lagrange to have
originated in the Atlantic Coastal Drainages region (Fig. 5, Region A).
Figure 3. Partial ML tree showing interrelationship among species of the subfamily Otothyrinae. Numbers above branches arebootstrap values from 1000 bootstrap pseudoreplicates obtained from ML analysis. Bootstrap values below 50% (2) are not shown. Numbers belowbranches are posterior probabilities obtained in the BI analysis. Posterior probabilities values below 0.95 (2) or when the nodes were not obtained byB analyses are not shown.doi:10.1371/journal.pone.0105564.g003
Molecular Phylogeny and Biogeographic History of Cascudinhos
PLOS ONE | www.plosone.org 6 August 2014 | Volume 9 | Issue 8 | e105564
Molecular Phylogeny and Biogeographic History of Cascudinhos
PLOS ONE | www.plosone.org 7 August 2014 | Volume 9 | Issue 8 | e105564
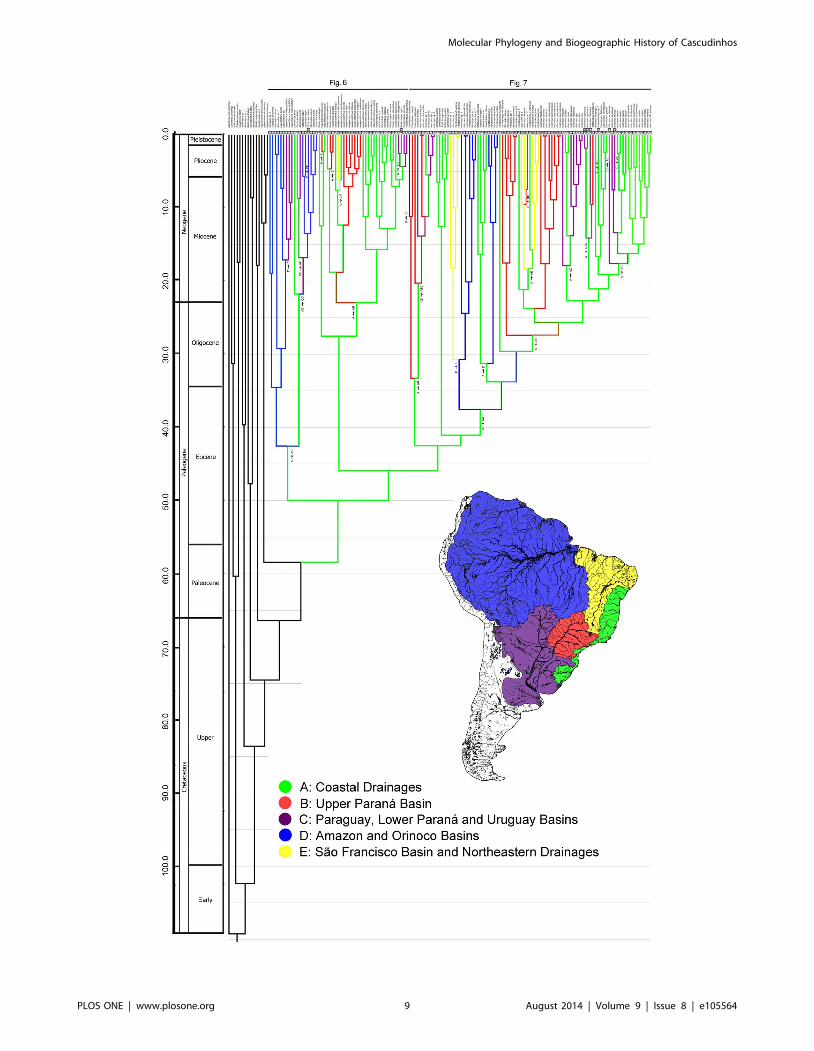
Hypoptopomatinae is distributed across three of the geographic
regions in Fig. 5: Atlantic Coastal Drainages (Region A),
Paraguay, Lower Parana and Uruguay Basins (Region C), and
Amazon and Orinoco Basins (Region D). The ancestral-area
estimations suggest that the Hypoptopomatinae moved from
Coastal Drainages (Region A) to the Amazon and Orinoco Basins
(Region D) between 26.7–58.6 Mya 95% HPD (mean 42.5 Mya).
The relationships among hypoptopomatine taxa in the Amazon
and Paraguay basins also suggest that these two regions were either
connected or exchanged headwaters at about 15 Mya (Fig. 6).
Neoplecostominae is also distributed across three of the regions
in Fig. 5: Coastal Drainages (Region A), Upper Parana Basin
(Region B) and Sao Francisco Basin and Northeastern Drainages
(Region E). The ancestral lineage of Neoplecostomus (except N.ribeirensis), Pareiorhina carrancas is inferred to have reached the
Upper Parana Basin from the Coastal Drainages at c. 14.2–
33.4 Mya 95% HPD (mean 22.9 Mya). The ancestor of
Pareiorhina carrancas reached the Upper Parana Basin from
the Coastal Drainages at c. 1.7–8.7 Mya 95% HPD (mean
4.6 Mya). The ancestor of Neoplecostomus franciscoensis reached
the Sao Francisco basin from Coastal Drainages at c. 3.9–
13.1 Mya 95% HPD (mean 7.5 Mya). The ancestor of Pseudo-tocinclus tietensis reached the Upper Parana Basin (B) from the
Coastal Drainages region (A) about 0.4–5.5 Mya 95% HPD (mean
2.3 Mya). The ancestral lineage of Pareiorhaphis eurycephalus, P.hystrix, P. parmula and P. vestigipinnis reached the Uruguay
Basins about 2.0–7.5 Mya 95% HPD (mean 4.3 Mya) (Fig. 6).
The ancestral-area estimations (Fig. 7) suggest that Otothyrinae
originated in the Atlantic Coastal Drainages (Region A) and then
subsequently expanded its range into the other regions by means
of biotic dispersal, geodispersal (river capture), or both. The first
group to diverge within Otothyrinae is composed for species of the
genus Corumbataia and six species of the genus Hisonotus (H.insperatus, Hisonotus oliveirai, Hisonotus paresi, H. piracanjuba,
Hisonotus sp. 4 and Hisonotus sp. 5). The ancestral lineage of this
group originated in Coastal Drainages region (A) at 29.0–
57.1 Mya 95% HPD (mean 42.5 Mya). The second group to
diverge is composed of Schizolecis guntheri, the only known
species of Schizolecis. Our results suggest that the ancestor of this
species originated in the Coastal Drainages region (A) about 28.7–
55.8 Mya 95% HPD (mean 41.0 Mya). The third group to
diverge within Otothyrinae is composed four species of Hisonotus(Hisonotus sp. 1, Hisonotus sp. 2, Hisonotus sp. 3 and Hisonotuschromodontus) and three species of Parotocinclus (Parotocinclus sp.
3, P. aripuanensis and Parotocinclus aff. spilurus). The ancestor of
this group dispersed from the Coastal Drainages region (A) to the
Amazon and Orinoco Basins (D) about 25.6–51.0 Mya 95% HPD
(mean 37.5 Mya). Subsequently, the ancestor of the clade
composed of Hisonotus sp. 1, Hisonotus sp. 2 and Parotocinclusaff. spilurus reached the Sao Francisco Basin and Northeastern
Basins (E) about 19.3–43.2 Mya 95% HPD (mean 30.7 Mya).
The fourth group to diverge within Otothyrinae is composed of
species of the genus Pseudotothyris, Otothyris, a Otothyrinae
unidentified and the species Parotocinclus sp. 2, P. britskii and P.eppleyi. The ancestor of this group originated in the Coastal
Drainages region (A) about 23.3–46.1 Mya 95% HPD (mean
33.7 Mya). Subsequently, the ancestor of Parotocinclus sp. 2, P.britskii and P. eppleyi dispersed from to the Amazon and Orinoco
Basins (D) about 19.8–42.6 Mya 95% HPD (mean 31.2 Mya).
The ancestor of the group composed of the species Microlepido-gaster dimorpha, Rhinolekos sp. 1, R. britskii and R. garavelloidispersed from the Coastal Drainages region (A) to the Upper
Parana Basin (B) about 18.3–37.3 Mya 95% HPD (mean
27.3 Mya). The ancestor of the clade composed of Hisonotusdepressicauda, H. francirochai and H. paulinus originated in
Upper Parana Basin (B) about 15.7–33.2 95% HPD (mean
23.7 Mya). The ancestor of the clade composed of Parotocinclussp. 1, Parotocinclus cf. bahiensis, P. robustus and P. prata, New
taxon sp. 1, New taxon sp. 2 and Hisonotus bocaiuva, originated in
the Coastal Drainages region (A) about 15.7–33.2 Mya 95% HPD
(mean 23.7 Mya). The ancestral of the clade composed of the most
species of Hisonotus and it type species H. notatus its closest
relatives (Hisonotus aky, H. iota, H. montanus, H. megaloplax, H.prata, H. carreiro, H. ringueleti, H. nigricauda, H. notopagos, H.cf. charrua, H. laevior, H. charrua, H. leucophrys, H. leuco-frenatus, H. cf. taimensis, H. notatus and H. armatus), and the
species Otothyropsis marapoama, Eurycheilichthys sp. 1, Epactio-notus bilineatus, E. itaimbezinho and E. gracilis originated in the
Coastal Drainage region about 17.0–35.0 Mya 95% HPD (mean
25.6 Mya).
Additionally, two important dispersal events can be inferred
from the Coastal Drainages region (A) to the Paraguay, Lower
Parana and Uruguay Basins (C). The first is the ancestor of
Hisonotus iota, H. aky, H. montanus, H. megaloplax, H. prata, H.carreiro and H. ringueleti about 10.7–26.3 Mya 95% HPD (mean
17.8 Mya). The second is the ancestor of Hisonotus cf. charrua,
H. leucophrys, H. charrua, H. laevior, H. cf. taimensis,H. leucofrenatus, H. notatus and H. armatus about 11.4–24.8
95% HPD (mean 17.5 Mya).
Discussion
River capture as a biogeographic processIn this study we used a time-calibrated molecular phylogeny and
ancestral-area estimations (Figs. 5–7) with robust taxonomic
sampling, to document the effects of river capture on the
diversification of taxa in the HNO-clade of loricariid (armoured)
catfishes in South America. The results are largely consistent with
those of previous studies of loricariids from Southern and
Southeastern Brazil [36,48,85]. For example, Chiachio et al.
[36] recovered a similar division of the HNO-clade into two
monophyletic groups, the Hypoptopomatinae and Neoplecosto-
minae + Otothyrinae, inferred the ancestor of Hypoptopomatinae
to have inhabited the Amazon basin, and inferred the ancestor of
Neoplecostominae + Otothyrinae to have inhabited an area now
drained by the Upper Parana and part of the Atlantic coastal
drainages.
The Atlantic coastal region has a complex and ancient
geological history that traces to the final separation of Africa
and South America about 100 million years ago [86–89]. Roxo et
al. [48] identified the Coastal Drainages of Southeastern Brazil as
an important area where many lineages of Loricariidae originated,
including the ancestors of Neoplecostominae. Ribeiro [16]
described a set of phylogenetic patterns (termed A, B and C) with
sister group relationships observed between lineages inhabiting the
Atlantic coastal drainages and inland drainages such as Amazon
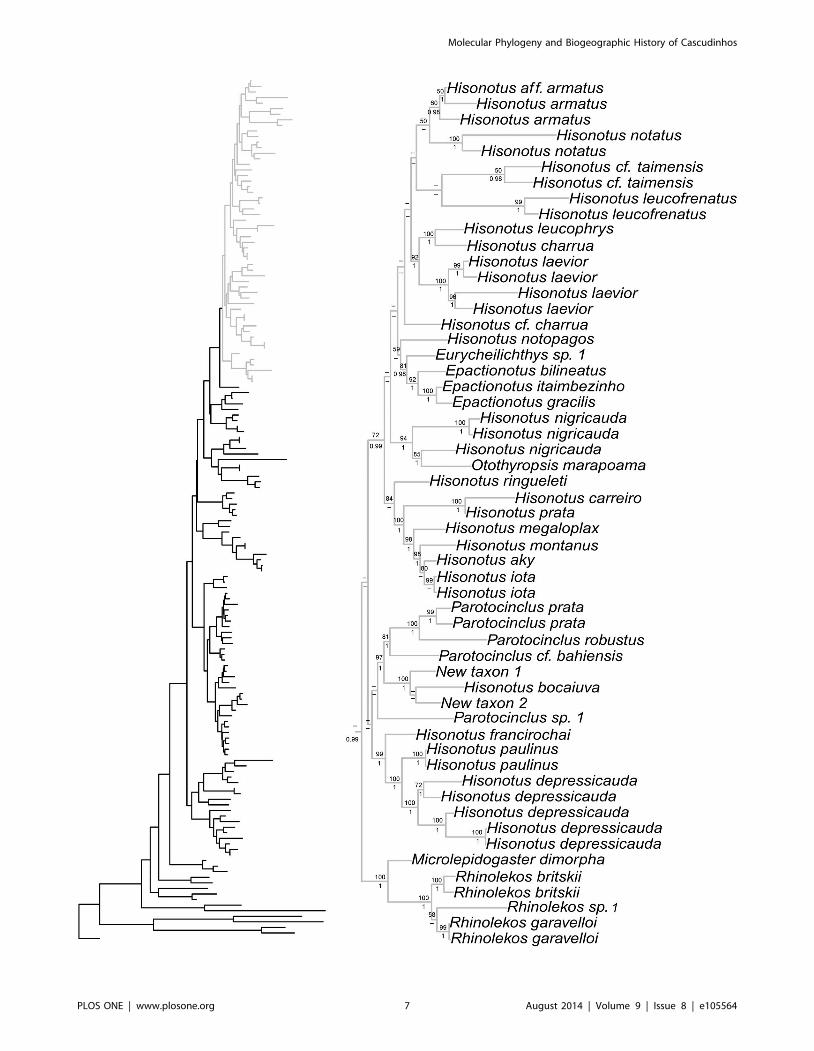
Figure 4. Partial ML tree showing the interrelationship among species of the subfamily Otothyrinae. Numbers above branches arebootstrap values from 1000 bootstrap pseudoreplicates obtained from ML analysis. Bootstrap values below 50% (2) are not shown. Numbers belowbranches are posterior probabilities obtained in the BI analysis. Posterior probabilities values below 0.95 (2) or when the nodes were not obtained byB analyses are not shown.doi:10.1371/journal.pone.0105564.g004
Molecular Phylogeny and Biogeographic History of Cascudinhos
PLOS ONE | www.plosone.org 8 August 2014 | Volume 9 | Issue 8 | e105564
Molecular Phylogeny and Biogeographic History of Cascudinhos
PLOS ONE | www.plosone.org 9 August 2014 | Volume 9 | Issue 8 | e105564
and Parana Basins. Our results suggest a fit to pattern B in
Neoplecostominae and Otothyrinae, with sister-group relation-
ships between species endemic to the Brazilian coastal drainages
and adjacent portions of the Brazilian shield. Ribeiro [16] listed
Lignobrycon, Rhinelepis, Spintherobolus, and Triportheus, the
tribes Aspidoradini and Glandulocaudini, and the subfamilies
Cheirodontinae and Sarcoglanidinae as examples of pattern B.
According to the Lagrange ancestral-area estimations, the area
of the modern Atlantic Coastal Drainages (Region A) is optimized
as the ancestral area for three of the deepest nodes of the HNO
phylogeny. These nodes include the HNO-clade as a whole
(40.8–79.7 Mya 95% HPD, mean 58.4 Mya, Fig. 5), the Hypop-
topomatinae (33.6–67.4 Mya 95% HPD, mean 49.9 Mya, Fig. 6),
and the Neoplecostominae and Otothyrinae (31.0–62.2 Mya 95%
HPD, mean 45.9 Mya, Fig. 6–7). The results of the Lagrange
analysis are consistent with a river capture event at about 26.7–
58.6 Mya 95% HPD (mean 42.5 Mya), allowing range expan-
sion(s) from the Atlantic Coastal Drainages (Region A) to a region
comprised of the modern Paraguay/Lower Parana/Uruguay
(Region C) and Amazon/Orinoco Basins (Region D). An
important river capture event at this approximate time and place
is also consistent with the topology of a General Area Cladogram
of fish taxa from tropical South America, as inferred from a Brooks
Parsimony (meta) Analysis of all 32 published phylogenies of
species-rich fish clades available at that time [22].
Chiachio et al. [36] explained the division of Hypoptopoma-
tinae, between lineages in the Amazon Basin (Region D) and the
Brazilian East Coastal (Region A) and the Upper Parana (Region
B), as the result of limited dispersal of fishes to less favourable areas
of the continental margin. Although species of Hypoptopomatinae
do inhabit lowland rivers in the Amazon, Orinoco and Guianas
regions, most species of Neoplecostominae plus Otothyrinae
inhabit rivers and streams in the mountainous Brazilian Shield,
where they are adapted to colder and more highly oxygenated
waters [27]. Additionally, historical paleogeographic connections
among the Orinoco, Amazon, and Paraguay basins are hypoth-
esized to have enabled the colonization of Hypoptopomatinae
species through these basins [4].
Within Neoplecostominae our time-calibrated phylogeny and
Lagrange biogeographic analysis suggest a geodispersal event in
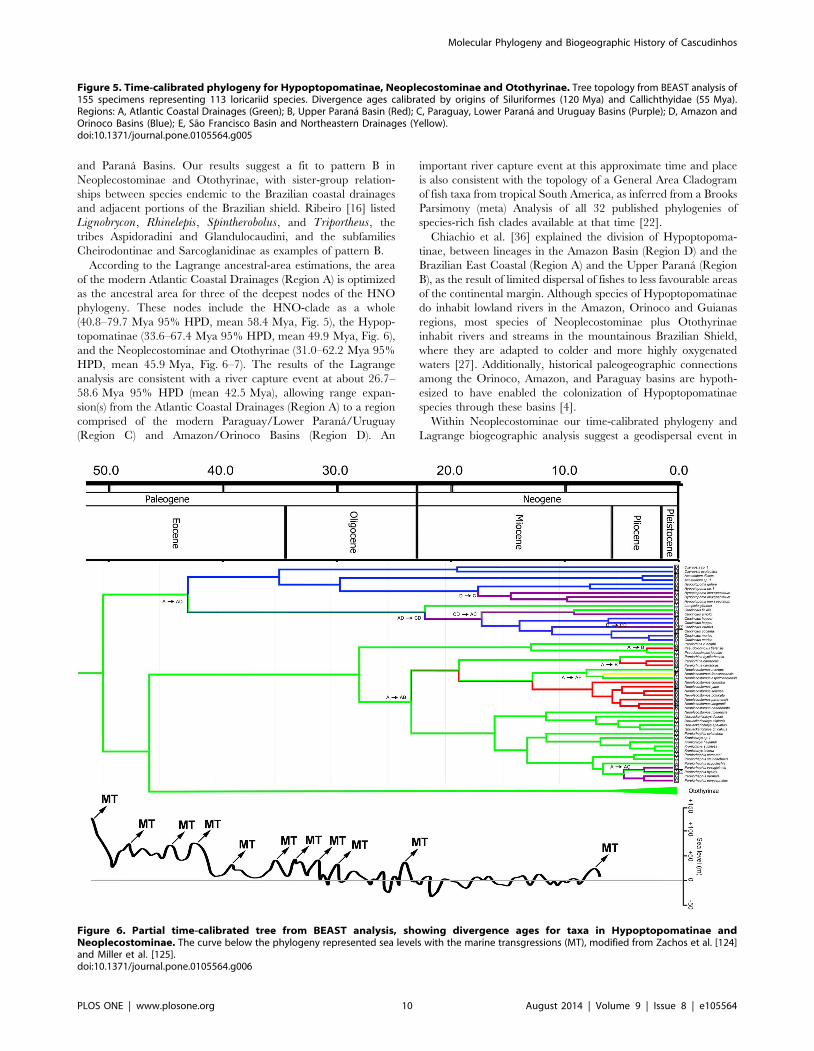
Figure 5. Time-calibrated phylogeny for Hypoptopomatinae, Neoplecostominae and Otothyrinae. Tree topology from BEAST analysis of155 specimens representing 113 loricariid species. Divergence ages calibrated by origins of Siluriformes (120 Mya) and Callichthyidae (55 Mya).Regions: A, Atlantic Coastal Drainages (Green); B, Upper Parana Basin (Red); C, Paraguay, Lower Parana and Uruguay Basins (Purple); D, Amazon andOrinoco Basins (Blue); E, Sao Francisco Basin and Northeastern Drainages (Yellow).doi:10.1371/journal.pone.0105564.g005
Figure 6. Partial time-calibrated tree from BEAST analysis, showing divergence ages for taxa in Hypoptopomatinae andNeoplecostominae. The curve below the phylogeny represented sea levels with the marine transgressions (MT), modified from Zachos et al. [124]and Miller et al. [125].doi:10.1371/journal.pone.0105564.g006
Molecular Phylogeny and Biogeographic History of Cascudinhos
PLOS ONE | www.plosone.org 10 August 2014 | Volume 9 | Issue 8 | e105564
the ancestral species of the clade composed of Neoplecostomus(except N. ribeirensis) and Pareiorhina carrancas to move from the
Coastal Drainages (Region A) to the Upper Parana Basin (Region
B) at about 14.2–33.4 Mya 95% HPD (mean 22.9 Mya). Roxo
et al. [48] reported an event with a similar date in the range 15.4–
38.1 Mya 95% HPD (mean 26.7 Mya), and suggested that this
geodispersal event could be a result of a headwater capture.
During this time period several headwater capture events have
been proposed between the Rio Tiete, Rio Paraıba do Sul, Rio
Sao Francisco, and Rio Ribeira de Iguape basins [16,90,91].
Headwater capture is likely to have influenced ancestral fish
distributions throughout adjacent drainages, allowing the ances-
tors of this group to reach the Upper Parana basin.
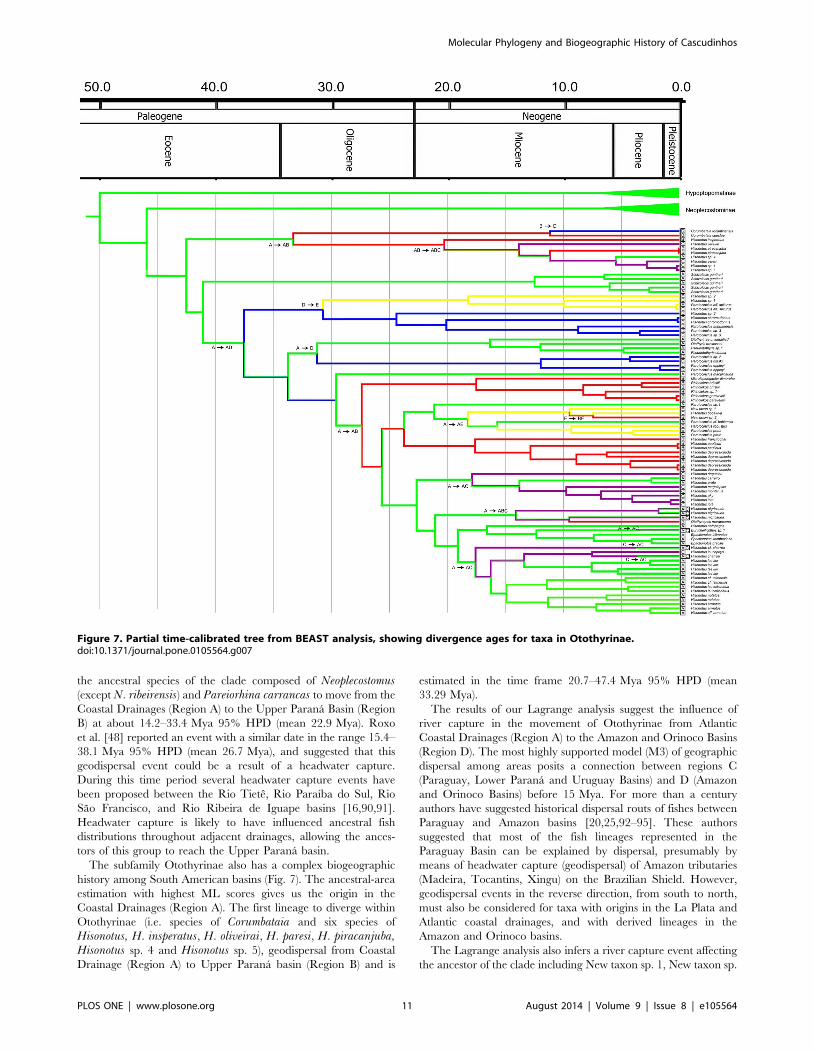
The subfamily Otothyrinae also has a complex biogeographic
history among South American basins (Fig. 7). The ancestral-area
estimation with highest ML scores gives us the origin in the
Coastal Drainages (Region A). The first lineage to diverge within
Otothyrinae (i.e. species of Corumbataia and six species of
Hisonotus, H. insperatus, H. oliveirai, H. paresi, H. piracanjuba,Hisonotus sp. 4 and Hisonotus sp. 5), geodispersal from Coastal
Drainage (Region A) to Upper Parana basin (Region B) and is
estimated in the time frame 20.7–47.4 Mya 95% HPD (mean
33.29 Mya).
The results of our Lagrange analysis suggest the influence of
river capture in the movement of Otothyrinae from Atlantic
Coastal Drainages (Region A) to the Amazon and Orinoco Basins
(Region D). The most highly supported model (M3) of geographic
dispersal among areas posits a connection between regions C
(Paraguay, Lower Parana and Uruguay Basins) and D (Amazon
and Orinoco Basins) before 15 Mya. For more than a century
authors have suggested historical dispersal routs of fishes between
Paraguay and Amazon basins [20,25,92–95]. These authors
suggested that most of the fish lineages represented in the
Paraguay Basin can be explained by dispersal, presumably by
means of headwater capture (geodispersal) of Amazon tributaries
(Madeira, Tocantins, Xingu) on the Brazilian Shield. However,
geodispersal events in the reverse direction, from south to north,
must also be considered for taxa with origins in the La Plata and
Atlantic coastal drainages, and with derived lineages in the
Amazon and Orinoco basins.
The Lagrange analysis also infers a river capture event affecting
the ancestor of the clade including New taxon sp. 1, New taxon sp.
Figure 7. Partial time-calibrated tree from BEAST analysis, showing divergence ages for taxa in Otothyrinae.doi:10.1371/journal.pone.0105564.g007
Molecular Phylogeny and Biogeographic History of Cascudinhos
PLOS ONE | www.plosone.org 11 August 2014 | Volume 9 | Issue 8 | e105564
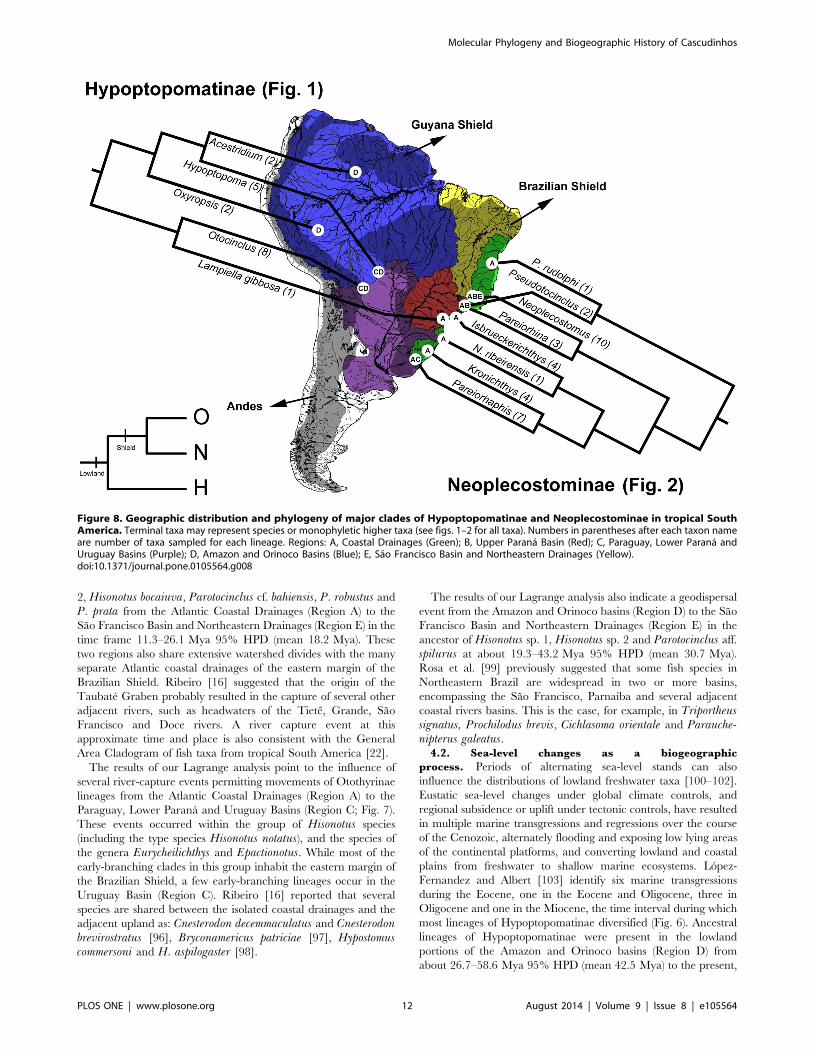
2, Hisonotus bocaiuva, Parotocinclus cf. bahiensis, P. robustus and
P. prata from the Atlantic Coastal Drainages (Region A) to the
Sao Francisco Basin and Northeastern Drainages (Region E) in the
time frame 11.3–26.1 Mya 95% HPD (mean 18.2 Mya). These
two regions also share extensive watershed divides with the many
separate Atlantic coastal drainages of the eastern margin of the
Brazilian Shield. Ribeiro [16] suggested that the origin of the
Taubate Graben probably resulted in the capture of several other
adjacent rivers, such as headwaters of the Tiete, Grande, Sao
Francisco and Doce rivers. A river capture event at this
approximate time and place is also consistent with the General
Area Cladogram of fish taxa from tropical South America [22].
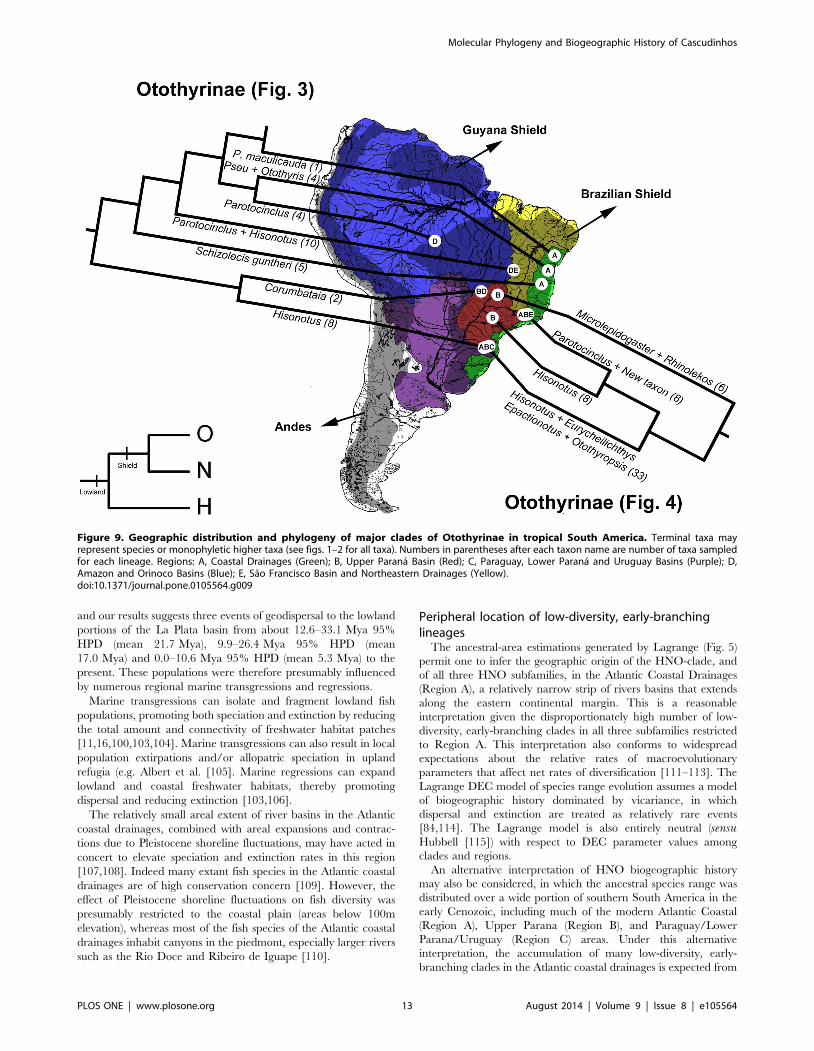
The results of our Lagrange analysis point to the influence of
several river-capture events permitting movements of Otothyrinae
lineages from the Atlantic Coastal Drainages (Region A) to the
Paraguay, Lower Parana and Uruguay Basins (Region C; Fig. 7).
These events occurred within the group of Hisonotus species
(including the type species Hisonotus notatus), and the species of
the genera Eurycheilichthys and Epactionotus. While most of the
early-branching clades in this group inhabit the eastern margin of
the Brazilian Shield, a few early-branching lineages occur in the
Uruguay Basin (Region C). Ribeiro [16] reported that several
species are shared between the isolated coastal drainages and the
adjacent upland as: Cnesterodon decemmaculatus and Cnesterodonbrevirostratus [96], Bryconamericus patriciae [97], Hypostomuscommersoni and H. aspilogaster [98].
The results of our Lagrange analysis also indicate a geodispersal
event from the Amazon and Orinoco basins (Region D) to the Sao
Francisco Basin and Northeastern Drainages (Region E) in the
ancestor of Hisonotus sp. 1, Hisonotus sp. 2 and Parotocinclus aff.
spilurus at about 19.3–43.2 Mya 95% HPD (mean 30.7 Mya).
Rosa et al. [99] previously suggested that some fish species in
Northeastern Brazil are widespread in two or more basins,
encompassing the Sao Francisco, Parnaıba and several adjacent
coastal rivers basins. This is the case, for example, in Triportheussignatus, Prochilodus brevis, Cichlasoma orientale and Parauche-nipterus galeatus.
4.2. Sea-level changes as a biogeographic
process. Periods of alternating sea-level stands can also
influence the distributions of lowland freshwater taxa [100–102].
Eustatic sea-level changes under global climate controls, and
regional subsidence or uplift under tectonic controls, have resulted
in multiple marine transgressions and regressions over the course
of the Cenozoic, alternately flooding and exposing low lying areas
of the continental platforms, and converting lowland and coastal
plains from freshwater to shallow marine ecosystems. Lopez-
Fernandez and Albert [103] identify six marine transgressions
during the Eocene, one in the Eocene and Oligocene, three in
Oligocene and one in the Miocene, the time interval during which
most lineages of Hypoptopomatinae diversified (Fig. 6). Ancestral
lineages of Hypoptopomatinae were present in the lowland
portions of the Amazon and Orinoco basins (Region D) from
about 26.7–58.6 Mya 95% HPD (mean 42.5 Mya) to the present,
Figure 8. Geographic distribution and phylogeny of major clades of Hypoptopomatinae and Neoplecostominae in tropical SouthAmerica. Terminal taxa may represent species or monophyletic higher taxa (see figs. 1–2 for all taxa). Numbers in parentheses after each taxon nameare number of taxa sampled for each lineage. Regions: A, Coastal Drainages (Green); B, Upper Parana Basin (Red); C, Paraguay, Lower Parana andUruguay Basins (Purple); D, Amazon and Orinoco Basins (Blue); E, Sao Francisco Basin and Northeastern Drainages (Yellow).doi:10.1371/journal.pone.0105564.g008
Molecular Phylogeny and Biogeographic History of Cascudinhos
PLOS ONE | www.plosone.org 12 August 2014 | Volume 9 | Issue 8 | e105564
and our results suggests three events of geodispersal to the lowland
portions of the La Plata basin from about 12.6–33.1 Mya 95%
HPD (mean 21.7 Mya), 9.9–26.4 Mya 95% HPD (mean
17.0 Mya) and 0.0–10.6 Mya 95% HPD (mean 5.3 Mya) to the
present. These populations were therefore presumably influenced
by numerous regional marine transgressions and regressions.
Marine transgressions can isolate and fragment lowland fish
populations, promoting both speciation and extinction by reducing
the total amount and connectivity of freshwater habitat patches
[11,16,100,103,104]. Marine transgressions can also result in local
population extirpations and/or allopatric speciation in upland
refugia (e.g. Albert et al. [105]. Marine regressions can expand
lowland and coastal freshwater habitats, thereby promoting
dispersal and reducing extinction [103,106].
The relatively small areal extent of river basins in the Atlantic
coastal drainages, combined with areal expansions and contrac-
tions due to Pleistocene shoreline fluctuations, may have acted in
concert to elevate speciation and extinction rates in this region
[107,108]. Indeed many extant fish species in the Atlantic coastal
drainages are of high conservation concern [109]. However, the
effect of Pleistocene shoreline fluctuations on fish diversity was
presumably restricted to the coastal plain (areas below 100m
elevation), whereas most of the fish species of the Atlantic coastal
drainages inhabit canyons in the piedmont, especially larger rivers
such as the Rio Doce and Ribeiro de Iguape [110].
Peripheral location of low-diversity, early-branchinglineages
The ancestral-area estimations generated by Lagrange (Fig. 5)
permit one to infer the geographic origin of the HNO-clade, and
of all three HNO subfamilies, in the Atlantic Coastal Drainages
(Region A), a relatively narrow strip of rivers basins that extends
along the eastern continental margin. This is a reasonable
interpretation given the disproportionately high number of low-
diversity, early-branching clades in all three subfamilies restricted
to Region A. This interpretation also conforms to widespread
expectations about the relative rates of macroevolutionary
parameters that affect net rates of diversification [111–113]. The
Lagrange DEC model of species range evolution assumes a model
of biogeographic history dominated by vicariance, in which
dispersal and extinction are treated as relatively rare events
[84,114]. The Lagrange model is also entirely neutral (sensuHubbell [115]) with respect to DEC parameter values among
clades and regions.
An alternative interpretation of HNO biogeographic history
may also be considered, in which the ancestral species range was
distributed over a wide portion of southern South America in the
early Cenozoic, including much of the modern Atlantic Coastal
(Region A), Upper Parana (Region B), and Paraguay/Lower
Parana/Uruguay (Region C) areas. Under this alternative
interpretation, the accumulation of many low-diversity, early-
branching clades in the Atlantic coastal drainages is expected from
Figure 9. Geographic distribution and phylogeny of major clades of Otothyrinae in tropical South America. Terminal taxa mayrepresent species or monophyletic higher taxa (see figs. 1–2 for all taxa). Numbers in parentheses after each taxon name are number of taxa sampledfor each lineage. Regions: A, Coastal Drainages (Green); B, Upper Parana Basin (Red); C, Paraguay, Lower Parana and Uruguay Basins (Purple); D,Amazon and Orinoco Basins (Blue); E, Sao Francisco Basin and Northeastern Drainages (Yellow).doi:10.1371/journal.pone.0105564.g009
Molecular Phylogeny and Biogeographic History of Cascudinhos
PLOS ONE | www.plosone.org 13 August 2014 | Volume 9 | Issue 8 | e105564
patterns of diversification on landscapes with low rates of river
capture.
In places like the eastern margin of South America, where
geographic range evolution is thought to have been dominated by
river capture [16,116–118], vicariance and geodispersal events are
expected to be coupled (see the Introduction; see also Albert and
Crampton [7]). Under these conditions, rates of speciation and
dispersal should be approximately matched as sources for the
introduction of new species (sensu Vellend [119]). Further, because
dispersal expands species ranges, it tends to reduce extinction
rates, and freshwater fish species with larger ranges generally have
lower extinction risk [120,121]. Therefore, the combination of low
speciation and extinction rates in the Atlantic coastal drainages
may have contributed to an accumulation of low-diversity clades.
By contrast, the relatively higher rates of speciation and extinction
in the La Plata basin is predicted to have resulted in a phylogeny
with few or no low-diversity early-branching clades (see e.g. Albert
et al. [4] fig. 2.15). In other words, regions with high species
turnover are less likely to retain low-diversity early-branching
clades (i.e. the Effect Hypothesis of Vrba [122]).
This alternative interpretation predicts the presence of many
low-diversity, early-branching fish lineages on landscapes with low
rates of river capture. This alternative interpretation differs from
the Lagrange-generated ancestral-area estimations by positing
different rates of speciation and extinction in clades inhabiting the
Atlantic coastal drainages and La Plata basin. In other words, this
alternative interpretation is not neutral with respect to DEC
parameter values among regions, positing instead that rates of
speciation and extinction are correlated with rates of river capture.
Museums and cradlesIn evaluating distributional patterns of Neotropical fish distri-
butions in southeastern Brazil, Ribeiro [16] concluded that the
Atlantic coastal drainages (Region A of the present study) served as
both a cradle and a museum of diversity for different fish groups.
The terms ‘‘evolutionary cradle’’ and ‘‘evolutionary museum’’ are
alternative hypotheses for the occurrence of areas with high species
richness [123]. An ‘‘evolutionary cradle’’ is an area with high rates
of speciation, where environmental conditions promote speciation.
By contrast, an ‘‘evolutionary museum’’ is an area with low rates
of extinction, where low rates of environmental disturbance act to
preserve early-branching taxa, and where species richness
accumulates through long periods of geological time.
The results of this study on the Hypoptopomatinae, Neople-
costominae and Otothyrinae broadly concur with the conclusions
of Ribeiro [16] (Figs. 8–9). All three HNO subfamilies are inferred
by Lagrange ancestral-area estimations to have originated in the
Atlantic coastal drainages, suggesting that this region served as the
cradle for early diversification in these clades. In addition, several
lineages of Neoplecostominae remain confined to the region of the
Atlantic coastal drainages, which therefore also appears to serve as
a museum for these clades. These major patterns of diversification
in Neoplecostominae in the Atlantic coastal drainages and
Brazilian Shield were previously recognized by Roxo et al. [48].
For Hypoptopomatinae, most of the diversification occurred in
lowlands of the Amazon, Orinoco and Paraguay basins, and the
species Lampiella gibbosa and Otocinclus affinis appears to be
relictual lineages confined to the Atlantic coastal drainages.
Diversification within Otothyrinae exhibits a pattern with
monophyletic lineages in each of the several regions and basins
of the South American platform (Fig. 9).
Here, we presented a time-calibrated phylogenetic analysis of
the loricariid catfish subfamilies Hypoptopomatinae, Neoplecos-
tominae and Otothyrinae, used parametric biogeographic meth-
ods to estimate ancestral geographic ranges, and documented
several historical river-capture events. The results of this study
largely support previous hypotheses on the origins and evolution of
the major HNO-clades in space and time. The historical
biogeographic analysis of these taxa also illustrates the role of
river capture as an important evolutionary process contributing to
the extraordinary diversification of Neotropical fishes in South-
eastern Brazil.
Supporting Information
Table S1 Species included in the present study.
(DOCX)
Table S2 Summary of taxonomic information for species of
Hypoptopomatinae, Neoplecostominae and Otothyrinae included
in the analysis.
(DOC)
Table S3 Primers used in the present study to amplify partial
sequences of F-reticulon 4, 16S rRNA, cytochrome oxidase
subunit I (COI) and cytochrome B (CytB).
(DOC)
Table S4 Nucleotide substitution models for each partition
evaluated in the software PartitionFinder [68] and used in the
phylogenetic analyses. *These partitions were analyzed in one
partition.
(DOC)
Table S5 DEC models tested to estimate distribution ranges
inherited by the descending lineages at each node of the tree. The
differences between the models are in the rate of dispersal among
adjacent and no adjacent areas. * Represent the model used in the
analysis.
(DOC)
Table S6 Substitution Saturation estimated for each gene using
the index of substitution saturation (Iss) [65,66] and the rate of
transitions/transversions evaluated in software DAMBE 5.2.31
[67].
(DOC)
Table S7 Likelihood-based tests for alternative topologies. SH
and AU are probability values obtained for the Shimodaira-
Hasegawa and the Approximately Unbiased tests [76]. Asterisks
denote significant values (P,0.05 for SH and P,0.01 for AU and
ELW), that imply the topology is rejected.
(DOC)
Acknowledgments
We thank Guilherme J. Costa Silva, Jefferson M. Henriques, Alex T.
Ferreira, Mahmoud Mehanna and Renato Devide for their help during the
collection expeditions; Victor A. Tagliacollo for help with the data analysis;
Juan I. Montoya-Burgos and Roberto E. Reis for providing tissue samples;
Bruno F. Melo, Danilo Pinhal, Flavio C. T. Lima, Francisco Langeani
Neto, Pedro Hollanda Carvalho, Ricardo C. Benine, Roberto E. Reis and
Tiago P. Carvalho for fruitful discussions; Fernanda O. Martins for helps
with the taxonomic identification.
Author Contributions
Conceived and designed the experiments: FFR GSCS FF CO. Performed
the experiments: FFR GSCS. Analyzed the data: CO FFR JSA.
Contributed reagents/materials/analysis tools: CO. Contributed to the
writing of the manuscript: FFR JSA. Identified all species used in the study:
FFR GSCS CHZ.
Molecular Phylogeny and Biogeographic History of Cascudinhos
PLOS ONE | www.plosone.org 14 August 2014 | Volume 9 | Issue 8 | e105564

References
1. Cox CB, Moore PD (2005) Biogeography: An ecological and evolutionary
approach, 7th edn. United Kingdom: Blackwell, Oxford, pp. 498.
2. Lomolino MV, Riddle BR, Whittaker RJ, Brown JH (2010) Biogeography, 4th
edn. Massachusetts: Sinauer Associates, Sunderland.
3. Vari RP, Malabarba LR (1998) Neotropical ichthyology: An overview. In:
Malabarba LR, Reis RE, Vari R, Lucena ZMS, Lucena CAS, editors.
Phylogeny and Classification of Neotropical Fishes. Edipucrs, Porto Alegre. pp.
1–11.
4. Albert JS, Petry P, Reis RE (2011) Major biogeographic and phylogenetic
patterns. In: Albert JS, Reis RE, editors. Historical Biogeography of
Neotropical Freshwater Fishes. University of California Press, Berkeley, Los
Angeles. pp. 21–57.
5. Waters JM, Allibone RM, Wallis GP (2006) Geological subsidence, river
capture, and cladogenesis of galaxiid fish lineages in central New Zealand.
Biol J Linn Soc 88: 367–376.
6. Winemiller KO, Lopez-Fernandez H, Taphorn DC, Nico LG, Duque AB
(2008) Fish assemblages of the Casiquiare River, a corridor and zoogeograph-
ical filter for dispersal between the Orinoco and Amazon basins. J Biogeo-
graphy 35: 1551–1563.
7. Albert JS, Crampton WGR (2010) The geography and ecology of
diversification in Neotropical freshwaters. Nature Education Knowledge 1:
13–19.
8. Smith GR (1981) Late Cenozoic freshwater fishes of North America. Annu Rev
Ecol Syst 12: 163–193.
9. Hocutt CH, Wiley EO (1986) Zoogeography of the Freshwater Fishes of North
America. New York: John Wiley and Sons.
10. Mayden RL (1988) Vicariance biogeography, parsimony, and evolution in
North American freshwater Fishes. Syst Zool 37: 329–355.
11. Lundberg JG, Marshall LG, Guerrero J, Horton B, Malabarba MCSL, et al.
(1998) The stage for Neotropical fish diversification: A history of tropical South
American rivers. In: Malabarba LR, Reis RE, Vari RP, Lucena ZMS, Lucena
CAS, editors. Phylogeny and Classification of Neotropical Fishes. Porto Alegre:
Edipucrs. pp. 13–48.
12. Almeida FFM, Carneiro CDR (1998) Origem e evolucao da Serra do Mar. Rev
Bras Geo 28: 135–150.
13. Bishop P (1995) Drainage rearrangement by river capture, beheading and
diversion. Progr Phys Geogr 19: 449–473.
14. Wilkinson MJ, Marshall LG, Lundberg JG (2006) River behavior on megafans
and potential influences on diversification and distribution of aquatic
organisms. J South Am Earth Sci 21: 151–172.
15. Wilkinson MJ, Marshall LG, Lundberg JG, Kreslavsky MH (2010) Megafan
environments in northern South America and their impact on Amazon
Neogene aquatic ecosystems. In: Horn C, Wesselingh EP, editors, Amazonia,
Landscape and Species Evolution: A Look into the Past, Blackwell Publishing.
pp. 165–185.
16. Ribeiro AC (2006) Tectonic history and the biogeography of the freshwater
fishes from the coastal drainages of eastern Brazil: an example of faunal
evolution associated with a divergent continental margin. Neotr Ichthyology 4:
225–246.
17. Grant CEH, Lowe WH, Fagan WF (2007) Living in the branches: population
dynamics and ecological processes in dendritic networks. Ecology Letters 10:
165–175.
18. Muneepeerakul R, Bertuzzo E, Lynch HJ, Fagan WF, Rinaldo A, et al. (2008)
Neutral metacommunity models predict fish diversity patterns in Mississippi–
Missouri basin. Nature 453: 220–222.
19. Bertuzzo E, Muneepeerakul R, Lynch HJ, Fagan WF, Rodriguez-Iturbe I,
et al. (2009) On the geographic range of freshwater fish in river basins. Water
Resour Res 45(11).
20. Carvalho TP, Albert JS (2011) The Amazon-Paraguay divide. In: Albert JS,
Reis RE, editors. Historical Biogeography of Neotropical Freshwater Fishes.
University of California Press, Berkeley, California. pp. 193–202.
21. Lieberman BS (2008) Emerging syntheses between palaeobiogeography and
macroevolutionary theory. Proc R Soc Vic 120: 51–57.
22. Albert JS, Carvalho TP (2011) Neogene assembly of modern faunas. In: Albert
JS, Reis RE, editors. Historical Biogeography of Neotropical freshwater fishes.
Los Angeles: University of California Press, Berkeley. pp. 119–136.
23. Reis RE, Kullander SO, Ferraris CJ (2003) CLOFFSCA-Check list of the
freshwater fishes of South and Central America. Edipucrs.
24. Abell R, Thieme ML, Revenga C, Bryer M, Kottelat M, et al. (2008)
Freshwater ecoregions of the world: A new map of biogeographic units for
freshwater biodiversity conservation. Bioscience 58: 403–414.
25. Ribeiro AC, Jacob RM, Silva RRSR, Lima FCT, Ferreira DC, et al. (2013)
Distributions and phylogeographic data of rheophilic freshwater fishes provide
evidences on the geographic extension of a central-Brazilian Amazonian
palaeoplateau in the area of the present day Pantanal Wetland. Neotr
Ichthyology 11: 319–326.
26. Eschmeyer W (2013) Catalog of fishes. Electronic publication in ‘‘World Wide
Web’’. Available: http://www.calacademy.org/research/ichthyology/catalog.
Accessed 20 February 2013.
27. Langeani F (1990) Revisao do genero Neoplecostomus, com a descricao de
quatro especies novas do sudeste brasileiro (Ostariophysi, Siluriformes,Loricariidae). Com Mus Cienc Tec PUCRS Zool 3: 3–31.
28. Armbruster JW (1998) Modifications of the Digestive Tract for Holding Air inLoricariid and Scoloplacid Catfishes. Copeia 3: 663–675.
29. Covain R, Fisch-Muller S (2007) The genera of the Neotropical armoredcatfish subfamily Loricariinae (Siluriformes: Loricariidae): a practical key and
synopsis. Zootaxa 1462: 1–40.
30. Nelson JA, Wubah DA, Whitmer ME, Johnson EA, Stewart DJ (1999) Wood-
eating catfishes of the genus Panaque: gut microflora and cellulolytic enzymeactivities. J Fish Biol 54: 1069–1082.
31. Sabaj MH, Armbruster JW, Page LM (1999) Spawning in Ancistrus(Siluriformes: Loricariidae) with comments on the evolution of snout tentacles
as a novel reproductive strategy: larval mimicry. Ichthyol Explor Freshwaters
10: 217–229.
32. Armbruster JW (2004) Phylogenetic relationships of the sucker-mouth armored
catfishes (Loricariidae) with particular emphasis on the Hypostominae and theAncistrinae. Zool J Linn Soc 141: 1–80.
33. Bizerril CRSF (1994) Analise taxonomica e biogeografica da ictiofauna de aguadoce do leste brasileiro. Acta Biol Leopoldensia 16: 51–80.
34. Schaefer SA (1991) Phylogenetic Analysis of the Loricariid SubfamilyHypoptopomatinae (Pisces, Siluroidei, Loricariidae), with Comments on
Generic Diagnoses and Geographic-Distribution. Zool J Linn Soc 102: 1–41.
35. Schaefer SA (1998) Conflict and resolution: impact of new taxa on phylogenetic
studies of the Neotropical cascudinhos (Siluroidei: Loricariidae). In: MalabarbaLR, Reis RE, Vari RP, Lucena ZMS, Lucena CAS, editors. Phylogeny and
classification of neotropical fishes. Porto Alegre: Edipucrs. pp. 375–400.
36. Chiachio MC, Oliveira C, Montoya-Burgos JI (2008) Molecular systematic and
historical biogeography of the armored Neotropical catfishes Hypoptopoma-
tinae and Neoplecostominae (Siluriformes: Loricariidae). Mol Phyl Evol 49:606–617.
37. Cramer CA, Bonatto SL, Reis RE (2011) Molecular phylogeny of theNeoplecostominae and Hypoptopomatinae (Siluriformes: Loricariidae) using
multiple genes. Mol Phyl Evol 59: 43–52.
38. Cramer CA, Liedke AMR, Bonatto LS, Reis RE (2008) The phylogenetic
relationship of the Hypoptopomatinae and Neoplecostominae (Siluriformes:Loricariidae) as inferred from mitochondrial cytochrome c oxidase I sequences.
Bull Fish Biol 9: 51–59.
39. Eschmeyer WN, Fong JD (2013) Species by Family/Subfamily. Available:
http://research.calacademy.org/research/ichthyology/catalog/SpeciesByFamily.
asp. Accessed 18 November 2013.
40. Eigenmann CH, Eigenmann RS (1890) South America Nematognathi. PhD
Thesis, San Francisco: California Academy of Science.
41. Regan CT (1904) A monograph of the fishes of the family Loricariidae. Trans
Zool Soc Lond 17: 191–350.
42. Gosline WA (1947) Contributions to the classification of the loricariid catfishes.
Arq Mus Nac, Rio de Janeiro 41: 79–134.
43. Isbrucker IJH (1980) Classification and catalogue of the mailed Loricariidae
(Pisces, Siluriformes). Inst v Tax Zool (Zool Mus) Univ Amsterdam 22: 1–181.
44. Howes GJ (1983) The cranial muscles of loricarioid catfishes, their homologies
and value as taxonomic characters (Teleostei: Siluroidei). Bull br Mus nat HistZool 45: 309–345.
45. Schaefer SA (1987) Osteology of Hypostomus plecostomus (Linnaeus) with aphylogenetic analysis of the loricariids subfamilies (Pisces: Siluroidei). Nat Hist
Mus Los Angeles 394: 1–31.
46. Montoya-Burgos JI, Muller S, Weber C, Pawlowski J (1998) Phylogenetic
relationships of the Loricariidae (Siluriformes) based on mitochondrial rRNAgene sequences. In: Malabarba LR, Reis RE, Vari RP, Lucena ZM, Lucena
CAS, editors. Phylogeny and classification of Neotropical fishes. Porto Alegre:
Edipucrs. pp. 363–375.
47. Reis RE, Pereira EHL, Armbruster JW (2006) Delturinae, a new loricariid
catfish subfamily (Teleostei, Siluriformes), with revisions of Delturus andHemipsilichthys. Zool J Linn Soc 147: 277–299.
48. Roxo FF, Zawadzki CH, Alexandrou MA, Costa Silva GJ, Chiachio MC, et al.(2012) Evolutionary and biogeographic history of the subfamily Neoplecosto-
minae (Siluriformes: Loricariidae). Ecology and Evolution 2: 2438–2449.
49. Roxo FF, Zawadzki CH, Costa Silva GJ, Chiachio MC, Foresti F, et al. (2012)
Molecular systematics of the armored neotropical catfish subfamily Neople-costominae (Siluriformes, Loricariidae). Zootaxa 3390: 33–42.
50. Arratia G (1987) Description of the primitive family Diplomystidae (Silur-
iformes, Teleostei, Pisces): morphology, taxonomy and phylogenetic implica-tions. Bonn Zool Monogr 24: 1–120.
51. de Pinna MCC (1993) Higher-level phylogeny of Siluriformes (Teleostei,Ostariophysi), with a new classification of the order. PhD Thesis, New York:
City University of New York.
52. de Pinna MCC (1998) Phylogenetic relationships of Neotropical Siluriformes
(Teleostei: Ostariophysi): historical overview and synthesis of hypotheses. In:Malabarba LR, Reis RE, Vari RP, Lucena CAS, Lucena ZMS, editors.
Phylogeny and Classification of Neotropical Fishes. Mus Cienc TecnolPUCRS, Porto Alegre. pp. 279–330.
Molecular Phylogeny and Biogeographic History of Cascudinhos
PLOS ONE | www.plosone.org 15 August 2014 | Volume 9 | Issue 8 | e105564
53. Grande L (1987) Redescription of Hypsidoris farsonensis (Teleostei: Silur-
iformes), with a reassessment of its phylogenetic relationships. J Vert Paleont 7:24–54.
54. Grande L, de Pinna MCC (1998) Description of a second species of Hypsidorisand a reevaluation of the genus and family Hypsidoridae. J Vert Paleont 18:
451–474.
55. Mo T (1991) Anatomy, relationships and systematics of the Bagridae (Teleostei,
Siluroidei) with a hypothesis of siluroid phylogeny. Theses Zoologicae 17,
Koenigstein: Koeltz Scientific Books.
56. Sullivan JP, Lundberg JG, Hardman M (2006) A phylogenetic analysis of the
major groups of catfishes (Teleostei: Siluriformes) using rag1 and rag2 nucleargene sequences. Mol Phyl Evol 41: 636–662.
57. Kocher TD, Thomas WK, Meyer A, Edwards SV, Pabo S, et al. (1989)
Dynamics of mitochondrial DNA evolution in animals: Amplification and
sequencing with conserved primers. PNAS 86: 6196–6200.
58. Oliveira C, Avelino GS, Abe KT, Mariguela TC, Benine RC, et al. (2011)
Phylogenetic relationships within the speciose family Characidae (Teleostei:
Ostariophysi: Characiformes) based on multilocus analysis and extensive
ingroup sampling. BMC Evol Biol 11: 275.
59. Ward RD, Zemlak TS, Innes BH, Last PR, Hebert PDN (2005) DNAbarcoding Australia’s fish species. Phil Trans R Soc B, 360: 1847–1857.
60. Hall TA (1999) BioEdit: a user-friendly biological sequence alignment editor
and analysis program for Windows 95/98/NT. Nucleic Acids Symp Ser 41:
95–98.
61. Edgar RC (2004) Muscle: a multiple sequence alignment method with reduced
time and space complexity. BMC Bioinformatics 5: 1–19.
62. Stamatakis A, Hoover P, Rougemont J (2008) A rapid bootstrap algorithm for
the RAxML web servers. Syst Biol 57: 758–771.
63. Stamatakis A (2006) RAxML-VI-HPC: Maximum likelihood-based phyloge-
netic analyses with thousands of taxa and mixed models. Bioinformatics 22:
2688–2690.
64. Tamura K, Peterson D, Peterson N, Stecher G, Nei M, et al. (2011) MEGA5:Molecular Evolutionary Genetics Analysis using Maximum Likelihood,
Evolutionary Distance, and Maximum Parsimony Methods. Mol Biol Evol
28: 2731–2739.
65. Xia X, Xie Z, Salemi M, Chen L, Wang Y (2003) An index of substitution
saturation and its application. Mol Phyl Evol 26: 1–7.
66. Xia X, Lemey P (2009) Assessing substitution saturation with DAMBE. In:
Lemey P, Salemi M, Vandamme AM, editors. The Phylogenetic Handbook: A
Practical Approach to DNA and Protein Phylogeny. Cambridge University
Press. pp. 615–630.
67. Xia X, Xie Z (2001) DAMBE: Data analysis in molecular biology and
evolution. J Hered 92: 371–373.
68. Lanfear R, Calcott B, Ho SYW, Guindon S (2012) PartitionFinder: combined
selection of partitioning schemes and substitution models for phylogeneticanalyses. Mol Biol Evol 29: 1695–1701.
69. Felsenstein J (1985) Confidence limits on phylogenies: an approach using the
bootstrap. Evolution 39: 783–791.
70. Huelsenbeck JP, Ronquist F (2001) MrBayes: Bayesian inference ofphylogenetic trees. Bioinformatics 17: 754–755.
71. Ronquist F, Huelsenbeck JP (2003) MrBayes 3: Bayesian phylogenetic
inference under mixed models. Bioinformatics 19: 1572–1574.
72. Rambaut A, Drummond AJ (2007a) Tracerv1.5. Available: http://beast.bio.
ed.ac.uk/Tracer. Accessed 04 November 2013.
73. Swofford DL (2003) PAUP*: phylogenetic analysis using parsimony (*and other
methods). Version 4. Massachusetts: Sinauer Associates, Sunderland, MA.
74. Jobb G, von Haeseler A, Strimmer K (2004) TREEFINDER: a powerful
graphical analysis environment for molecular phylogenetics. BMC Evol Biol 4:
4–18.
75. Shimodaira H, Hasegawa M (1999) Multiple comparisons of log-likelihoods
with applications to phylogenetic inference. Mol Biol Evol 16: 1114–1116.
76. Shimodaira H (2002) An approximately unbiased test of phylogenetic tree
selection. Syst Biol 51: 492–508.
77. Strimmer K, Rambaut A (2002) Inferring confidence sets of possibly
misspecified gene trees. Proc R Soc B 269: 137–142.
78. Lundberg JG (1993) African South America freshwater fish clade and
continental drift: problems with a paradigm. In: Goldblatt P, editor. The
Biotic Relationship between Africa and South America. Yale University Press.
pp. 156–199.
79. Lundberg JG, Sullivan JP, Rodiles-Hernandez R, Hendrickson DA (2007)
Discovery of African roots for the Mesoamerican Chiapas catfish, Lacantuniaenigmatica, requires an ancient intercontinental passage. Proc Acad Nat Sci
Phil 156: 39–53.
80. Cockerell TDA (1925) A fossil fish of the family Callichthyidae. Science 62:
397–398.
81. Marshall LG, Sempere T, Butler RF (1997) Chronostratigraphy of the
mammal-bearing Paleocene of South America. J South Am Earth Sci 10: 49–
70.
82. Rambaut A, Drummond AJ (2007b) TreeAnnotator v1.7.5. Available: http://
beast.bio.ed.ac.uk/TreeAnnotator. Accessed 09 November 2013.
83. Ree RH, Moore BR, Webb CO, Donoghue MJ (2005) A likelihood framework
for inferring the evolution of geographic range on phylogenetic trees. Evolution59: 2299–2311.
84. Ree RH, Smith SA (2008) Maximum likelihood inference of geographic range
evolution by dispersal, local extinction, and cladogenesis. Syst Biol 57: 4–14.
85. Reis RE, Schaefer SA (1998) New cascudinhos from southern Brazil:
systematics, endemism, and relationships (Siluriformes, Loricariidae, Hypopto-
pomatinae). Am Mus Novit 3254: 1–25.
86. Pitman WC III, Cande SC, LaBrecque J, Pindell J (1993) Fragmentation of
Gondwana: The separation of Africa from South America. In: Goldblatt P,
editor. Biological Relationships between Africa and South America. Connecti-
cut: Yale University Press, New Haven. pp. 15–34.
87. Cesero P, Ponte FC (1997) Analise comparativa da paleogeologia dos litorais
atlanticos brasileiro e africano. Bol Geocienc PETROBRAS 11. pp. 1–18.
88. Scotese CR (2004) Cenozoic and Mesozoic paleogeography: Changing
terrestrial pathways. In: Lomolino MV, Heaney LR, editors. Frontiers of
Biogeography. Massachusetts: Sinauer Associates, Sunderland. pp. 9–26.
89. Blakey R (2006) Plate tectonics and continental drift: Regional paleogeographic
views of earth history. Available: http://jan.ucc.nau.edu/,rcb7/globaltext.
html. Accessed 14 August 2013.
90. Ab’Saber AN (1957) O problema das conexoes antigas e da separacao da
drenagem do Paraıba e Tiete. Bol Paulista Geografia 26: 38–49.
91. Ab’Saber AN (1998) Megageomorfologia do Territorio Brasileiro. In: Cunha
SB, Guerra AJT, editors. Geomorfologia do Brasil, Rio de Janeiro: Bertrand.
pp. 71–106.
92. Eigenmann CH, Eigenmann RS (1891) A catalogue of the freshwater fishes of
South America. Proc U S Nat Mus 14: 1–81.
93. Jordan DS (1896) Science sketches. A.C. McClurg and Company, Chicago.
94. Eigenmann CH (1906) The freshwater fishes of the South and Middle America.
PopSci 68: 515–530.
95. Pearson NE (1937) The fishes of the Beni-Mamore and Paraguay basin, and a
discussion of the origin of the Paraguayan fauna. Proc Calif Acad Sci 23: 99–
114.
96. Lucinda PHF (2005) Systematics of the genus Cnesterodon Garman, 1895
(Cyprinodontiformes: Poeciliidae: Poeciliinae). Neotr Ichthyology 3: 259–270.
97. Silva JFP (2004) Two new species of Bryconamericus Eigenmann (Characi-
formes: Characidae) from southern Brazil. Neotr Ichthyology 2: 55–60.
98. Reis RE, Weber C, Malabarba LR (1990) Review of the genus HypostomusLacepede, 1803 from southern Brazil, with descriptions of three new species
(Pisces, Siluriformes, Loricariidae). Rev Sui Zoo 97: 729–766.
99. Rosa RS, Menezes NA, Britski HA, Costa WJEM, Groth F (2004) Diversidade,
padroes de distribuicao e conservacao dos peixes da Caatinga. In: Leal IR,
Tabarelli M, Silva JMC, editors. Ecologia e conservacao da Caatinga. Recife:Edufpe. pp. 135–180.
100. Lovejoy NR, Albert JS, Crampton WGR (2006) Miocene marine incursions
and marine/freshwater transitions: Evidence from Neotropical fishes. J South
Am Earth Sci 21: 5–13.
101. Albert JS, Reis RE (2011) Historical Biogeography of Neotropical freshwater
fishes, 1st edn. Los Angeles: University of California Press, Berkeley.
102. Bloom DD, Lovejoy NR (2011) The biogeography of marine incursions in
South America. In: Albert JS, Reis RE, editors. Historical Biogeography of
Neotropical freshwater fishes. Los Angeles: University of California Press,
Berkeley. pp. 137–144.
103. Lopez-Fernandez H, Albert JS (2011) Paleogene Radiations. In: Albert JS, Reis
RE, editors. Historical Biogeography of Neotropical freshwater fishes. Los
Angeles: University of California Press, Berkeley. pp. 105–118.
104. Sabaj-Perez MH, Orangel AS, Lundberg JG (2007) Fossil catfishes of the
families Doradidae and Pimelodidae (Teleostei: Siluriformes) from the Miocene
Urumaco Formation of Venezuela. Proc Acad Natural Sci Phil 156: 157–194.
105. Albert JS, Lovejoy NR, Crampton WGR (2006) Miocene tectonism and the
separation of cis-and trans-Andean river basins: Evidence from Neotropical
fishes. J South Am Earth Sci 21: 14–27.
106. Lopez-Fernandez H, Arbour JH, Winemiller KO, Honeycutt RL (2013)
Testing for ancient adaptive radiations in Neotropical cichlid fishes. Evolution
67: 1321–1337.
107. Beheregaray LB, Sunnucks P, Briscoe DA (2002) A rapid fish radiation
associated with the last sea-level changes in southern Brazil: the silverside
Odontesthes perugiae complex. Proc R Soc Lond B: Biological Sciences 269:
65–73.
108. do Amaral PG (2012) Paleoenvironmental reconstruction of a Late Quaternary
lagoon system in southern Brazil (Jagurana region, Santa Catarina state) based
on multi-proxy analysis. Quaternary International 279: 120.
109. Reis RE (2013) Conserving the freshwater fishes of South America.
International Zoo Yearbook 47: 65–70.
110. Malabarba LR, Neto PC, Bertaco VA, Carvalho TP, dos Santos JF, et al.
(2013) Guia de identificacao dos peixes da bacia do rio Tramandaı. Porto
Alegre, Via Sapiens.
111. Bloom DD, Weir JT, Piller KR, Lovejoy NR (2013) Do freshwater fishes
diversify faster than marine fishes? A test using state-dependent diversification
analyses and molecular phylogenetics of new world silversides (Atherinopsidae).
Evolution 67: 2040–2057.
112. Pyron RA, Burbrink FT (2013) Phylogenetic estimates of speciation and
extinction rates for testing ecological and evolutionary hypotheses. Trends Ecol
Evol 28: 729–736.
113. Rabosky DL (2013) Diversity Dependence, Ecological Speciation, and the Role
of Competition in Macroevolution. Annu Rev Ecol Evol Syst 44(1).
Molecular Phylogeny and Biogeographic History of Cascudinhos
PLOS ONE | www.plosone.org 16 August 2014 | Volume 9 | Issue 8 | e105564

114. Ronquist F, Sanmartın I (2011) Phylogenetic methods in biogeography. Annu
Rev Ecol Evol Syst 42: 441–464.115. Hubbell SP (2001) The Unified Neutral Theory of Biodiversity and
Biogeography Monographs in Population Biology v32. New Jersey: Princeton
University Press.116. Buckup PA (2011) The Eastern Brazilian Shield. In: Albert JS, Reis RE,
editors. Historical Biogeography of Neotropical Freshwater Fishes. California:University of California Press, Berkeley. pp. 203–210.
117. Lima FC, Ribeiro AC (2011) Continental-scale tectonic controls of biogeog-
raphy and ecology. In: Albert JS, Reis RE, editors. Historical biogeography ofNeotropical freshwater fishes. Los Angeles: University of California Press,
Berkeley. pp. 145–164.118. Pereira TL, Santos U, Schaefer CE, Souza GO, Paiva SR, et al. (2012)
Dispersal and vicariance of Hoplias malabaricus (Bloch, 1794) (Teleostei,Erythrinidae) populations of the Brazilian continental margin. J Biogeogr 40:
905–914.
119. Vellend M (2010) Conceptual synthesis in community ecology. Q Rev Biol 85:
183–206.
120. Fagan WF (2002) Connectivity, fragmentation, and extinction risk in dendritic
metapopulations. Ecology 83: 3243–3249.
121. O’Grady JJ, Reed DH, Brook BW, Frankham R (2004) What are the best
correlates of predicted extinction risk? Biol Conserv 118: 513–520.
122. Vrba ES (1984) What is species selection? Syst Zool 33: 318–328.
123. Stebbins GL (1974) Flowering Plants: Evolution above the Species Level.
Massachusetts: Belknap Press of Harvard University Press, Cambridge.
124. Zachos J, Pagani M, Sloan L, Thomas E, Billups K (2001) Trends, rhythms,
and aberrations in global climate 65 Mya to present. Science 292: 686–693.
125. Miller KG, Kominz CAS, Browning JV, Wright DJ, Mountain GS, et al.
(2005) The Phanerozoic record of global sea-level change. Science 310: 1293–
1298.
Molecular Phylogeny and Biogeographic History of Cascudinhos
PLOS ONE | www.plosone.org 17 August 2014 | Volume 9 | Issue 8 | e105564


![Neotropical cervidology_12[1]](https://img.pdfslide.net/doc/110x75/547f4ab5b37959a22b8b56e0/neotropical-cervidology121.jpg)