Embed Size (px)
Citation preview

Isothermal Calorimetry and RamanSpectroscopy to Study Response ofPlants to Abiotic and Biotic Stresses
11
Andrzej Skoczowski and Magdalena Troc
Abstract
This review presents applying a typical chemical methods such as
isothermal calorimetry and Raman sectroscopy to study response of plants
to aboiotic and biotic stress, so how can be used analytical techniques to
better understunding of plant phisiology.
Plants produce heat during metabolism, and measurements of these
metabolic heat could lead understanding of plant physiology. Calorimetric
measurements have proven to be useful as monitors for many types of
biological processes such as seed germination, seedlings growth or plant
tissue vitality. Differences in amount of heat production give the informa-
tion about how big is the impact of stress factors on plant.
Raman spectroscopy can be used for in situ analysis of valuable
substances in living plant tissue. Chemical compounds (primary and
secondary metabolites) content could be done as point-measurements
and distribution as a Raman mapping. This techniques allow to obtain
the data as a Raman-spectra, which present some characteristic bands of
plants components. These bands give informations about the specific
chemical composition of plant tissue. Two-dimensional Raman maps
provide insight not only into the distribution, but also into relative content
of the compounds in the specified area of the plant tissue.
Combination of spectroscopy and hierarchical cluster analysis
enables a simple, quickly and reliable method for chemotaxonomy char-
akterization.
A. Skoczowski
Department of Plant Physiology, Institute of Biology,
Pedagogical University of Cracow, Podchorazych
2 Street, 30-084 Cracow, Poland
e-mail: [email protected]
M. Troc (*)
The Franciszek Gorski Institute of Plant Physiology,
Polish Academy of Sciences, Niezapominajek 21 Street,
30-239 Cracow, Poland
e-mail: [email protected]
G.R. Rout and A.B. Das (eds.), Molecular Stress Physiology of Plants,DOI 10.1007/978-81-322-0807-5_11, # Springer India 2013
263

Isothermal calorimetry and Raman spectroscopy, especially combination
of these two analitical techniques is a very good tool to describe the
susceptibility and response of plant to abiotic and biotic stress factors.
Isothermal Calorimetry
Calorimetric Methods in Plant StressPhysiology
IntroductionAccording to Criddle and Hansen (1999), calo-
rimetry plays a unique role in the measurement of
metabolic plant properties. These authors recog-
nised that “calorimetry provides more than just
another means for measuring metabolic rate
because itmeasures a fundamentally different prop-
erty (energy) while other methods measure mass”.
Although at the beginning of the twentieth century
it was recognised that plants produce heat during
metabolism and that measurements of the meta-
bolic heat of plants could guide understanding of
plant physiology, only recently has metabolic heat
in plants become a rapidly expanding area of inves-
tigation (for review see Criddle and Hansen 1999).
Theoretical Basis
Criddle et al. (1991a) recognised that “heat
production is an inevitable by-product of all
metabolic processes”. Equations describing
metabolic heat production were published,
with minor differences, in several papers
(Criddle and Hansen 1999; Smith et al. 1999,
2001; Hansen et al. 2002, 2004; Thygerson et al.
2002). We present below equations for catabolic
and anabolic reactions according to Thygerson
et al. (2002).
Aerobic respiration covers catabolic as well
as anabolic processes. In catabolic reactions,
organic substrates are oxidised to produce CO2.
Part of the energy produced by oxidation is used
to produce ATP from ADP and inorganic phos-
phate (Pi). The rest of the energy is lost as heat.
Organic substrateþ O2 þ xADP þ xPi! CO2 þ H2Oþ xATPþ heat
ATP produced in catabolic reactions is used
for cellular work, including anabolism:
Substrateþ yATP ! growthþ yADPþ yPiþ heat
In anabolism, heat and new plant tissue are
produced, and ATP is hydrolyzed back to ADP
and Pi. A calorimeter measures the rate of heat
loss (Rq) from both catabolism and anabolism.
For that reason, in most cases, calorimetric mea-
surements of metabolic heat production alone are
not sufficient to analyse the metabolic efficiency
of plant tissues.
As early as 1991, Criddle and co-workers
postulated that only the combined measurements
of heat rates, CO2, and O2 fluxes provide impor-
tant information on the bioenergetic efficiency of
cell metabolism (Criddle et al. 1991a). This prob-
lem was widely presented in several papers
(Criddle et al. 1997; Criddle and Hansen 1999;
Hansen et al. 2002, 2004; Smith et al. 2001).
Roughly, respiration processes in living tissues
are described by three parameters: the rate of
heat production (Rq), the rate of oxygen con-
sumption Ro2ð Þ, and the rate of carbon dioxide
production RCO2ð Þ. From these three measures of
respiratory rate, three ratios can be calculated,
i.e. Rq=RCO2;Rq=RO2
, and RCO2=RO2
. There are
differences in the information content of
Rq=RCO2and Rq=RO2
, so that each ratio provides
unique information on metabolic activities and
efficiency. Measurement of both ratios provides
information not available from either alone (for
details see Hansen et al. 2004).
Some Practical Remarks
Unfortunately, terminology concerning calorim-
etry is not homogeneous with respect to both
instruments and measured values. For example,
the poorly defined term “microcalorimeter” is
264 A. Skoczowski and M. Troc

used to indicate that the instrument’s sensitivity
is in the range of 1 mW or better. Consequently,
in this chapter, we use the term isothermal calo-
rimeter. Not long ago, Hansen (2001) proposed a
systematic nomenclature for describing calori-
meters. According to Hansen, the instrument’s
name and description must include four parts:
the method of heat measurement, a description
of the temperature control of the surroundings, a
description of the means of initiating the heat
effect, and a description of the operation of the
calorimeter, including data analysis.
The problem is also with the uniform names for
measured values. In the literature, many syno-
nyms for metabolic heat production exist, such
as heat production rate, heat flow, heat emission,
heat evolution, heat output, and, finally, metabolic
heat rate. Recently the term specific thermal
power was introduced.
How can the best calorimeter for the investi-
gation of living plants materials be chosen? The
answer is not simple because, unfortunately, no
single source adequately describes the many
applications or current capabilities of calori-
meters. Applications of calorimetry to metabo-
lism are not widely known or fully understood.
Furthermore, most books on calorimetry are too
basic or too specific for the plant physiologist,
and physical chemistry textbooks include only
the basics on traditional applications. The litera-
ture is also a poor guide for selecting the opti-
mum calorimeter for a given task. Hansen and
Russell (2006) recently described a procedure for
choosing the best calorimeter for a given task.
Practically all calorimetric experiments con-
ducted on living plant systems have been carried
out under dark condition. Isothermal photocalori-
meters are not available on the market, so they
are constructed individually by particular
researchers (Petrov et al. 1995; Janssen et al.
2005; Mukhanov and Kemp 2006, Alyabyev et
al. 2007, Oroszi et al. 2011).
New trend in calorimetric measurements was
described by Lamprecht and Schmolz (2000).
In speculative paper, they presented idea that
modern biological calorimetry may go afield in
cases where biological system is fixed in their
place (e.g. plants).
Isothermal calorimetric techniques used in
measurements on living systems are very well
described by Wadso (1995) and Criddle and
Hansen (1999).
Plant Material
Recent calorimetric investigations in the plant
field have been conducted on cell suspensions
(Rank et al. 1991; Janeczko et al. 2007b), callus
tissues (Płazek et al. 2000a), algae (Loseva et al.
1995, 1998, 2002, 2003, 2004; Alyabyev et al.
2007), mosses (Mozdzen and Skoczowski – in
this chapter), seeds (Schabes and Sigstad 2005),
seedlings (Płazek and Rapacz 2000; Alyabyev
et al. 2002, Skoczowski et al. 2011b), cotyledons
(Janeczko et al. 2007a; Skoczowski et al. 2011a),
leaves (Adam et al. 1993; Fodor et al. 2007;
Baltruschat et al. 2008), roots and tuber tissue
(Minibayeva et al. 1998; Gordon et al. 2004;
Wadso et al. 2004; Alyabyev et al. 2007), and
fruits (Criddle et al. 1991b).
Applications in Stress Physiology
Response of plants to temperature was exten-
sively discussed by Criddle and Hansen (1999)
and Smith et al. (1999, 2001). Recently, a lot of
papers described influence of the climate at the
place of origin (e.g. temperature) on the intensity
of plant metabolism and respiration (Smith et al
2002; Thygerson et al. 2002; Anekonda et al.
2004; Keller et al. 2004).
Below we presented our selected studies
about influence of low temperatures on plant
metabolism.
Low and High TemperatureResponse to Low Temperature
Regenerable cell cultures offer an in vitro system
for mutant selection, propagation of varieties,
gene transfer experiments, and biochemical stud-
ies (Janeczko et al. 2007b). The main aim of the
investigation conducted by Janeczko and co-
workers (2007b) was to determine the impact of
zearalenone and 24-epibrasinolide on differenti-
ation of winter wheat callus developed from cell
suspension cultured for 0–9 weeks at 5�C.
11 Isothermal Calorimetry and Raman Spectroscopy to Study Response. . . 265

Nevertheless, because the survival of winter
wheat suspension for a longer period of cold
had not been studied earlier, the changes in met-
abolic activity (heat production rate) of wheat
suspension over 9 weeks at low temperature
will be also characterised. Using isothermal cal-
orimetry, it was shown that the cell suspension of
winter wheat may be cultured for 9 weeks with-
out the necessity of changing the medium. Its
metabolic activity is slowed down, and there
is observed a stage of acclimation to cold and
subsequently of fast growth and stabilisation.
Suspension may be used to study the response
to cold of isolated cells (Janeczko et al. 2007b).
The precise time and temperature dependence
of the decrease of metabolism of cultured cells of
tomato (Lycopersicon esculentum L.) resulting
from exposures to high and low temperatures
were determined by Rank et al. (1991). Analysis
of metabolic heat rates, O2-consumption rates,
and CO2-evolution rates demonstrated a simulta-
neous shift in metabolic pathways and metabolic
activities towards more anaerobic metabolism
below about 12�C and at high temperatures that
stress the growth of tomato cells.
Skoczowski and Troc (data not yet published)
are probably the first researchers to comprehen-
sively investigate the energy dependence asso-
ciated with the early stages of the growth of
seedlings of different varieties of wheat at
chilling temperatures. Papers relating to the calo-
rimetric measurement of heat energy accompa-
nying the germination of seeds are relatively
numerous (Sigstad and Prado 1999; Sigstad and
Garcia 2001; Schabes and Sigstad 2005, 2006).
However, the authors did not encounter any work
done at temperatures near 0�C for seeds or seed-
lings of plants. This is probably due to lack of
access to isothermal calorimeters allowing this
type of measurement. The study’s aim was to
determine the differences in the response of dif-
ferent cultivars of winter wheat seedlings to
changes of growth temperature (from 20 to
0.5�C). The specific thermal power accompany-
ing the growth of seedlings at a temperature of
0.5�C is shown below. Tests were performed on
seedlings of winter wheat (Triticum aestivum L.)
cultivars: Trend, Kobiera, Alcazar, and Ludwig.
The seeds were germinated at 20�C for 24 h.
Then 20 seedlings, which were morphologically
similar to each other, were placed in a ventilated
calorimetric ampoule. The cell with distilled
water was placed on the bottom of ampoule and
covered with plastic mesh in order to isolate
seedlings from direct contact with the water,
which were also in an atmosphere of saturated
water vapour. The reference ampoule contained
water only.
Measurements were carried out in an isother-
mal calorimeter TAM I (Thermometric AB,
Jarfalla, Sweden) at 0.5�C for 6 days, with 5
replicates for each variety. The monitoring of
the heat flow was by the computer programme
DIGITAM (Thermometric AB, Sweden). After
measurement the seedlings were lyophilised and
weighed, and the specific thermal power was
determined based on the dry weight.
In Fig. 11.1, the specific thermal power–time
curves obtained for the tested winter wheat culti-
vars are shown. Due to the large differences in
thermal power emitted by the seedling cultivars
(from about 70 mW·gDW�1 in the case of cv.
Trend up to about 180 mW·gDW�1 for cv.
Ludwig), a detailed analysis of the changes in
the various pattern curves required individual
adjustment of the Y scale.
Based on the data, tested cultivars can be
divided into those with high heat production
(cv. Ludwig and cv. Kobiera) and those with a
much lower heat production (cv. Trend and cv.
Alcazar). The variety Trend is characterised by
low values of specific thermal power (max. about
75 mW·gDW�1), and the characteristic mark of
this variety is its fast acclimatisation to the new
thermal conditions. The increase of specific ther-
mal power, after an initial decrease caused by
thermal shock, appears on the second day at
0.5�C (Fig. 11.1a). The Kobiera variety seems
to be very resistant to rapid temperature changes,
because the decrease of thermal power caused by
the change of seedlings’ growth temperature is
little (about a few mW·gDW�1), and then a rapid
increase of the thermal power is observed
(Fig. 11.1b). In the case of the Alcazar variety,
a decrease of specific thermal power, which
occurs on day 6 of growth at 0.5�C, is
266 A. Skoczowski and M. Troc

characteristic, as this does not occur in other
varieties (Fig. 11.1c).
The variety Ludwig has a high emission of
heat in the cold. At the same time, processes of
acclimatisation to the new thermal conditions
proceed slowly in this variety, as evidenced by
the absence of a significant increase of thermal
power during the investigated period of time
(Fig. 11.1d).
Heat Shock
Loseva et al. (1998) investigated both the effect
of extreme temperature (45�C) and high salt con-centration (450 mM) on the rate of heat evolution
by Chlorella cells. In fact, this work is connected
with adaptive changes in energy of plant cells
under stress. On the other hand, Alyabyev et al.
(2002) examined the influence of blue and red
light on the resistance of energetic processes of
wheat seedlings to treatment by stress tempera-
ture (45�C). The authors concluded that blue
light has a positive effect on the resistance of
wheat seedlings to high temperature. In light of
what has been said above, it seems that high-
temperature stress (heat shock) is still an open
field for research using isothermal calorimetry.
SalinityMost crops in saline environments are negatively
affected in their rate of growth. This effect is
Fig. 11.1 Specific thermal
power–time curves for
winter wheat seedlings cv.
Trend (a), cv. Kobiera (b),cv. Alcazar (c), and cv.
Ludwig (d) transferred,after 24 h of growth at
20–0.5�C on 6 days. Mean
values from five repetitions
� SD. Interpolation by the
method of least squares
11 Isothermal Calorimetry and Raman Spectroscopy to Study Response. . . 267

attributed either to osmotic causes or to ion
toxicity, depending on the plant species, salt
composition, and salt concentration. A serious
problem affecting arable land is its increasing
salinity. Moreover, there is still a lack of well-
defined plant indicators that could be used by
plant breeders to improve agricultural crops for
their tolerance to saline environments.
The effect of salinity stress on metabolic heat
production by barley (Hordeum vulgare L.) roots
has been measured by isothermal calorimetry
(Criddle et al. 1989). Experiments were per-
formed on three barley varieties differing in
tolerance to salinity. Root tips were put on moist-
ened filter paper in a calorimeter ampoule, and
heat efflux was measured. The roots were then
flushed with solutions in increasing concentrations
of NaCl, and metabolic heat rates were remea-
sured at each concentration. Two levels of inhibi-
tion by increasing salt concentrations were found.
The first, occurring at a concentration of NaCl up
to 150 mM, inhibiting metabolic rate at about
50%, was cultivar dependent. At a higher concen-
tration of NaCl (>150 mM), metabolism was
further decreased, and this decrease was not culti-
var dependent. Inhibition of root tip metabolism
was not reversed by washing with NaCl-free
solution.
In order to elucidate the physiological
responses of Piriformospora indica-colonisedbarley plants to salinisation, Baltruschat et al.
(2008) measured important indicators of salt
stress, such as metabolic heat production, lipid
peroxidation, fatty acid composition, and ana-
lysed antioxidant activities. The fungus Pirifor-
mospora indica colonises roots and increases
the biomass of both monocot and dicot plants.
The above-mentioned researchers provided clear
evidence that salt-induced responses indicated
by heat emission in the P. indica-infected salt-
sensitive barley cv. Ingrid resemble those found
in salinity-tolerant plants (cv. California Mari-
out). Calorimetric studies indicated that the rate
of metabolic activity increased in leaves of P.
indica-infected plants after salt treatment. There-
fore, the endophyte seemed to overcompensate
the salt-induced inhibition of metabolic leaf
activity. This suggests that enhanced tolerance
to salt stress can be associated with higher
metabolic activity in P. indica-colonised barley.
Schabes and Sigstad (2005) evaluated two
cultivars of quinoa (Chenopodium quinoa
Willd.) for tolerance to saline stress by isother-
mal calorimetric measurements of seed germina-
tion in various salt solutions (NaCl, KCl,
Na2SO4, K2SO4, Na2CO3). HgCl2 was used in
combination with the salts to evaluate the possi-
ble existence of channels blocked by the mercu-
rial reagent involved in the transport of ions.
They conclude that seeds of cv. Robura are less
tolerant to saline stress than are seeds of cv.
Sajama, with a tolerance limit for seeds of the
former cultivar of 100 mM NaCl.
The salt inhibition of Chlorella has been stud-
ied by calorimetric methods by Loseva et al.
(1995). The addition of low salt concentrations
(450 mM of NaCl) causes an increase in meta-
bolic rate. The increased metabolic rate is not
sufficient to offset energetic losses, and the
growth rate of Chlorella is reduced.
The unicellular green halotolerant microalga
Dunaliella maritime and the freshwater micro-
alga Chlorella vulgaris were used by Alyabyev
et al. (2007) as suitable model systems in studies
on the adaptation of energy mechanisms to
changes in salinity. The study of the alteration
of energy-yielding processes of cells with differ-
ent sensitivity to salt stress may be a key to the
understanding of the complex mechanisms that
play an important role in the adaptation of
algae to unfavourable conditions. Chlorella was
unable to adapt to concentrations of 500 mM
NaCl and higher. This microalga has a metabolic
rate significantly lower than that of Dunaliella.This halotolerant and cell wall-less microalga
adapts to very high salinities. This tolerance is
connected with the ability to maintain high rates
of energy-yielding processes. Alyabyev et al.
(2007) showed that the heat production, O2
uptake, and O2 evolution rates increased in
Dunaliella cells in conditions up to 2M salt in
the medium. These data may support the opinion
that an important feature of salt-sensitive and
salt-tolerant algae is the increased rate of energy
dissipation, which ensures quick and effective
microalgal adaptation.
268 A. Skoczowski and M. Troc

DroughtCalorimetry may be used also for estimation of
plant tolerance to drought. For example, relative
degree of drought tolerance was tested for some
populations of small burnet (Sanguisorba minor
Scop.) and few cultivar of alfalfa (Medicago
sativa L.). Small burnet was more drought tol-
erant than alfalfa (Jones et al. 1999, cited in
Smith et al. 2001). Mosses are known as plants
with very high water demand. However, many
mosses can survive desiccation, sometimes for
months, returning to life even within a few
hours of rehydration. Skoczowski and Mozdzen
tested, by isothermal calorimetry, plants of the
moss Mnium undulatum under their response to
dehydration and rehydration process (not pub-
lished data). Measurements were carried out at
three temperatures: 20, 24, and 28�C. For dehy-dration experiments, five plants were put into
20 ml ampoules equipped with lids that enabled
air exchange, and specific thermal power curves
were recorded during 24 h. After this time,
1 ml of water was added and measurements
of metabolic response to rehydration were
continued for additional 24 h. Specific thermal
power values accompanying dehydration pro-
cess were much higher than for rehydration pro-
cess (Fig. 11.2a, b). At both cases, the highest
amount of metabolic heat at 28�C was observed.
At 20 and 24�C, the metabolic heat production
both in de- or rehydration was similar. The most
interesting metabolic changes were observed
in first hours of de- and rehydration. So, in the
case of dehydration, rapid decrease of meta-
bolic activity was observed. On the other hand,
the thermal power–time curves showed that the
beginning of rehydration is connected with sig-
nificant increase of metabolic heat production.
However, after short time, metabolic heat
production significantly decreased. Processes
related to drought stress in mousses are still
under intensive investigation in our laboratory.
HerbicidesThe continuous employment of herbicides with
the same mode of action may lead to resistance in
weeds. Herbicide resistance denotes the inherited
ability of a plant to survive and reproduce follow-
ing exposure to a dose of herbicide normally lethal
to a wild type (http://www.weedscience.com/).
Fig. 11.2 Typical specific thermal power–time curves (mW · gDW�1) for plants of mossesMnium undulatum obtained
during dehydration (a) and rehydration (b) processes at 20, 24, and 28�C (According Mozdzen and Skoczowski)
11 Isothermal Calorimetry and Raman Spectroscopy to Study Response. . . 269

The most popular methods for detecting herbicide
resistance are glasshouse pot experiments and
laboratory tests (http://www.plantprotection.org/
HRAC/). But these methods are time and space
consuming. Nowadays, when resistance to herbi-
cides in many countries has become a serious
problem, rapid tests for herbicide resistance
detection are needed.
In 1995, Suwanagul (quoted in Criddle and
Hansen 1999), studying three species of weeds
and three herbicides with different mechanisms
of action (atrazine, metsulphuron-methyl, and
diclofop-methyl), showed that the metabolic
activity (metabolic rate) of sensitive biotypes
was inhibited by lower concentrations of herbi-
cide than resistant biotypes.
In the described research, herbicides were
applied to young plants of weeds, from which,
after a certain time, meristematic tissue was col-
lected and metabolic heat rate measured. A few
years later, Stokłosa et al. (2006) proposed a
much faster method for testing weeds’ resistance
to herbicides using isothermal calorimetry.
Three-day-old seedlings of wild oat (Avenafatua L.) were put into calorimetric ampoules
on filter paper moistened with herbicide solution
(152 and 40% of the field dose for fenoxaprop
and diclofop, respectively). Rate of heat flow was
measured for 72 h. However, differences were
already visible in the first hours of growth on
each herbicide. Rate of heat flow for seedlings’
resistant to both herbicides was higher than for
susceptible ones. The most evident differences
between susceptible and resistant biotypes were
noticed after 10–20 h and 25–40 h (of the seed-
lings’ growth) on fenoxaprop and diclofop,
respectively, when a sharp increase in the rate
of heat flow was observed. In conclusion, iso-
thermal calorimetry may be used as a rapid test
for the detection of the resistance of weed
biotypes to herbicides, with a large practical
application in agriculture.
AllelopathyAllelopathy is the direct or indirect influence of
chemical compounds (allelochemicals) released
from one living plant on the growth and develop-
ment of another plant (Rice 1984). Many allelo-
chemical compounds can be toxic to higher
plants, and therefore, they can be used as a
natural herbicide. Nowadays, a new method of
weed control is searched for, and allelochemicals
are considered to be environmentally friendly
herbicides (Vyvyan 2002). This interest has
been stimulated by the negative effects of using
herbicides. On the one hand, applying herbicides
caused the pollution of water and soil. The next
problem is that there is a rapid increase in the
number of biotypes of weed which are resistant
to herbicides (Heap 2006). On the other hand,
at the moment, there is, essentially, stagnation in
the elaboration of methods of the synthesis of new
active herbicidal substances (Steinrucken and
Hermann 2000). A source of natural phytotoxins
may be products of the secondary metabolism of
plants. These may be compounds which have alle-
lopathic potential (Weston and Duke 2003) and
which are secreted as substances to aid competi-
tion between species (Inderjit and Weiner 2001).
Kupidłowska et al. (2006) probably first used
microcalorimetric methods for the study of alle-
lophatic interactions. We investigated the influ-
ence of water extracts of sunflower leaves on
catabolic processes taking place during mustard
(Sinapis alba L.) seed germination. Besides met-
abolic heat rate production, O2 uptake by intact
seeds, and energy metabolism by determining
adenylate (ATP, ADP, AMP), concentrations in
tissues of germinating seeds were also measured.
The heat efflux from seeds germinating on water
was expressed as a continuous increase during the
40th hour of the culture. Sunflower phytotoxins
altered the typical heat emission pattern observed
in control seeds. During first 12 h, sharp increases
in metabolic heat emission were detected, being
twofold higher than in the control. In control
seeds, heat emission was correlated with an
increased respiration rate, whereas in seeds
imbibing sunflower extracts, this correlation was
not detected. Maximum heat emission after 12 h
was accompanied neither by high oxygen uptake
nor by any increase in ATP concentration. There-
fore, we cannot exclude the possibility that the
transient increase in heat production may be a
result of oxidative reactions taking place in
seeds exposed to sunflower phytotoxins.
270 A. Skoczowski and M. Troc
Since undisturbed reserve mobilisation is an
important requirement for germination, as well
as for subsequent plant growth and development,
the influence of various extracts from sunflower
and mustard leaves (as autoallelopathy) on cata-
bolic activity during mustard seed germination
was investigated further (Troc et al. 2009). Total
catabolic activity was measured as the heat pro-
duction rate (in mW) of germinated seeds in an
isothermal calorimeter. It was shown that the
heat production rate–time curves of mustard
seeds can be correlated with different extracts
used for seed germination and, consequently,
with different allelopathic compounds which
influence the metabolism of seeds. The seeds
germinated on the mustard extract have higher
values of metabolic activity than those germi-
nated on the sunflower extract. Later investiga-
tions confirmed that sunflower and mustard
extracts have varied impact on the growth and
heat production rate of mustard seedlings
(Skoczowski et al. 2011b).
In order to better understand the allelophatic
interactions, and to elucidate the impact of
various herbal extracts on seedling growth,
investigations were initiated using isothermal
calorimetry as a monitor (Troc et al. 2011).
Seeds of wheat, mustard, rape, and clover were
germinated on aqueous herbal extracts from
arnica, hypericum, milfoil, ribwort, sage, and
sunflower (until the root was visible). Then,
seedlings were put into a calorimeter ampoule
on moistened filter paper discs containing herbal
extracts. The specific thermal power (heat pro-
duction rate) of the seedlings during their growth
was measured over 48 h. As a control seedlings
were grown on water. The patterns of the thermal
power–time curve during seedling growth on the
herbal extracts and on water were completely
different. In comparison with the water control,
seedling growth on the herbal extracts was
accompanied by a strong exothermic peak (first
phase), whereas in the second phase distinct
endothermic peaks were observed. The time
after which the maxima of exo- and endothermic
peaks occurred strongly depended on the seed-
ling species and the origin of the herbal extract.
Similarly, the total thermal effect connected with
seedling growth was correlated with the seedling
species and herbal extract type.
Schabes and Sigstad (2007) used isothermal
calorimetry to measure the effect of “cnicin” on
the germination of the soybean (Glycine max L.)
Merr. and the radish (Raphanus sativus L.). Thesesquiterpene lactone cnicin was isolated from a
highly invasive plant, the diffuse knapweed Cen-
taurea diffusa Lam. Calorimetric experiments
were performed with seeds on moistened filter
paper discs or in agar, both containing varying
concentrations of cnicin. Results indicate that
this substance blocks the water uptake by roots,
inhibiting subsequent seedling growth, but has no
effect during germination.
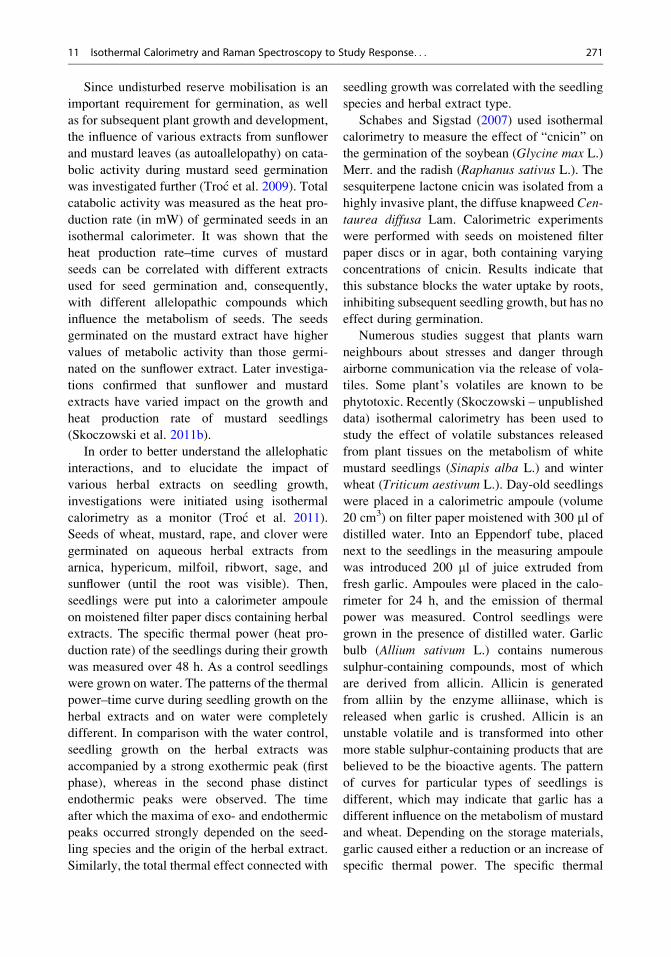
Numerous studies suggest that plants warn
neighbours about stresses and danger through
airborne communication via the release of vola-
tiles. Some plant’s volatiles are known to be
phytotoxic. Recently (Skoczowski – unpublished
data) isothermal calorimetry has been used to
study the effect of volatile substances released
from plant tissues on the metabolism of white
mustard seedlings (Sinapis alba L.) and winter
wheat (Triticum aestivum L.). Day-old seedlings
were placed in a calorimetric ampoule (volume
20 cm3) on filter paper moistened with 300 ml ofdistilled water. Into an Eppendorf tube, placed
next to the seedlings in the measuring ampoule
was introduced 200 ml of juice extruded from
fresh garlic. Ampoules were placed in the calo-
rimeter for 24 h, and the emission of thermal
power was measured. Control seedlings were
grown in the presence of distilled water. Garlic
bulb (Allium sativum L.) contains numerous
sulphur-containing compounds, most of which
are derived from allicin. Allicin is generated
from alliin by the enzyme alliinase, which is
released when garlic is crushed. Allicin is an
unstable volatile and is transformed into other
more stable sulphur-containing products that are
believed to be the bioactive agents. The pattern
of curves for particular types of seedlings is
different, which may indicate that garlic has a
different influence on the metabolism of mustard
and wheat. Depending on the storage materials,
garlic caused either a reduction or an increase of
specific thermal power. The specific thermal
11 Isothermal Calorimetry and Raman Spectroscopy to Study Response. . . 271
power of wheat seedlings is reduced in relation to
the control, while the growth of mustard seed-
lings caused an increase in the specific heat
capacity compared to controls (Fig. 11.3).
The presented results demonstrate the power
of isothermal calorimetry as a tool to investigate
the phenomena of allelopathy. The other meth-
ods used for this purpose mainly show inhibi-
tion of growth (length, weight), but they do not
show changes of metabolic activity. Only with
the use of calorimetry can we see the endother-
mic reaction during seedling growth. It is not
possible to use any other method. Moreover,
this method precisely showed the moment
when additional detailed analytical methods
should be used. In other words, it might be
desirable to combine isothermal calorimetry
with specific analytical techniques (Sigstad and
Prado 1999). This trend was proposed earlier by
Wadso (1995, 1997) and is also recommended
by Skoczowski et al. (2011a b).
Wounding ResponseIn most cases, information about the metabolic
response of tissues to wounding stress derived
from investigations connected directly with
food sciences and technology (Criddle et al.
1991b; Smith et al. 2000; Wadso et al. 2004,
2005; Rocculi et al. 2005). Studying the wound
response in cut vegetables (to quantify metabolic
response after cutting) may be used for the opti-
misation of process parameters, which is of
importance for the large-scale market in mini-
mally processed, ready-to-eat vegetables (for a
review see Gomez Galindo et al. 2005). Smith
et al. (2000) studied metabolic changes in 1 mm
slices of potato and found that the heat produc-
tion rate increased for up to 30 h. They also found
a change from lipid to starch as the substrate.
Wadso et al. (2004) conducted a study by
isothermal calorimetry of the heat production
response of root and tuber tissue to wounding.
Samples with different surface-to-volume ratios
Fig. 11.3 Specific thermal
power–time curves
(mW · gDW�1) for mustard
(a) and winter wheat
seedlings (b), which were
grown in air contained
volatiles from fresh garlic
and in water vapour
(control). Measurements
were conducted by 24 h at
20�C
272 A. Skoczowski and M. Troc

were prepared from carrots, potatoes, and
rutabaga, and total metabolic heat was measured
in an isothermal calorimeter. Authors showed
that the total measured heat of cut samples is
the sum of normal metabolism and wounding
stress heat emission. The results showed that
the wound response part was very high. In some
cases, almost half of the overall heat derived
from the wound response and not from the nor-
mal metabolic activity of tissue. Results obtained
by Wadso et al. (2004) are, generally, very
important from the methodological point of
view because they give a recommendation on
how samples should be cut (prepared) for calori-
metric measurements.
PathogenesisPathogenic processes could be monitored by
using calorimetry. Calorimetric measurement
of heat emission by cotyledons or leaves
can be used to complement other tests in study-
ing plant–pathogen interactions. This technique
has an advantage in that measurements are
continuous and do not interfere with the investi-
gated processes. Moreover, calorimetric changes
in plant metabolism caused by external stressors
are visible very rapidly. As a result, there have
been a lot of investigations designed to reveal
the mechanisms employed in the response of
plant cells to infection by viruses (Adam et al.
1993; Fodor et al. 2007), fungus (Płazek et al.
2000b; Płazek and Rapacz 2000), mycoplasma
(Loseva et al. 2002, 2003, 2004), and bacteria
(Janeczko et al. 2007b; Skoczowski et al. 2011b).
Virus Infection
Tobacco (Nicotiana tabacum L. cv. Xanthi-nc)
plants carry the N resistance gene against the
Tobacco mosaic virus (TMV) and localise the
infection to cells adjacent to the site of viral
entry, developing a hypersensitive response in
the form of local necrotic lesions. Studies
performed by Adam and co-workers (1993)
have shown an enhanced heat production in
Xanthi-nc plants during the formation of
TMV-induced necrotic lesions. A much more
detailed analysis of these changes was carried
out in wild-type (WT) Xanthi-nc and salicylic
acid (SA)-deficient phenotype NahG tobacco
plants during TMV-induced cell death (Fodor
et al. 2007). TMV-inoculated WT plants
develop systemic acquired resistance (SAR),
while NahG tobacco plants are not able to estab-
lish SAR against a second inoculation by TMV.
Heat efflux from uninoculated leaves of NahG
plants was found to be significantly lower
than from WT tobacco. However, the rates of
heat efflux increased up to similar levels in
TMV-inoculated WT plants either expressing
or not expressing SAR and in NahG plants.
The elevated level of heat efflux detected in
the TMV-inoculated NahG leaves indicates
that heat production can be independent of
salicylic acid.
Fungus
Płazek and Rapacz (2000) checked whether the
difference in susceptibility to Bipolaris sorokini-
ana (Sacc.) Shoem between barley and fescue
leaves is also reflected in heat emission and respi-
ration courses. Seedlings of spring barley and
meadow fescue were inoculated with conidia and
mycelium. Leaf respiration was measured using a
Clark-type electrode, while heat emission was
evaluated by means of an isothermal calorimeter.
Leaves of meadow fescue were characterised by a
higher respiration rate at the 6th hour, while barley
leaves showed an elevated rate at 24th hours after
inoculation. In the case of meadow fescue, the
greatest heat emission was noted between 24 and
168 h after inoculation, whereas barley leaves
emitted the greatest amount of heat only during
the first 3 h of the pathogenesis. The observed
opposing reaction of respiration rate and heat emis-
sion in the infected seedlings of both species may
illustrate a disorder inmetabolic processes in plants
during pathogenesis (Płazek and Rapacz 2000).
Sensitivity of spring barley and meadow fes-
cue to the leaf spot pathogen Bipolaris sorokini-
ana was also investigated on the callus tissues
(Płazek et al. 2000a, b). Callus reaction to fungus
phytotoxins was examined on the basis of the
amount of total phenolics and heat emission.
The results obtained show that spring barley
and meadow fescue differ in the rate of response
to Bipolaris sorokiniana phytotoxins with regard
11 Isothermal Calorimetry and Raman Spectroscopy to Study Response. . . 273
to changes in metabolic activity and phenolic
content. The authors suggested a different degree
of the plants’ sensitivity to B. sorokiniana at
tissue level.
Mycoplasma
A calorimetric study has demonstrated that oxy-
gen uptake and superoxide burst are also in
strong correlation with heat flow rate in Chlo-
rella vulgaris alga inoculated by a mycoplasma,
Acholeplasma laidlawii (Loseva et al. 2002).
Chlorella is extensively used as a suitable
model for investigating pathogenesis (Loseva
et al. 2003, 2004) because of the structural and
physiological similarity of these protists to
higher plants.
Bacteria
Studies by Janeczko et al. (2007a) and
Skoczowski et al. (2011a) illustrated the useful-
ness of isothermal calorimetry in investigations
on plant response to bacterial infection. These
researchers showed that heat emission (meta-
bolic activity) was markedly increased in cotyle-
dons of spring oilseed rape (Brassica napus L.)infected with the incompatible bacterium Pseu-
domonas syringae pv. syringae. Heat emission
continued to increase as the hypersensitive
response progressed, reflecting an increase in
the metabolic rate in the infected tissue
(Janeczko et al. 2007a). The authors also inves-
tigated the possibly protective role of 24-
epibrasinolide (BR27) in defence of the reactions
of plants against bacterial infection. Pretreatment
with BR27 markedly increased the metabolic
activity (heat production rate) in infected cotyle-
dons and increased host plant resistance to necro-
sis by caused bacterial infection.
The study on the protective effect of BR27 in
oilseed rape cotyledons against infection by an
incompatible wild type of, a hypersensitive
response mutant of, and saprophytic Pseudomo-
nas bacteria was continued by Skoczowski et al.
(2011a). In this study, changes in metabolic
activity (heat flow) during pathogenesis were
also analysed. The following strains of Pseudo-
monas were used: P. syringae pv. syringae (Ps),
P. syringae pv. syringae hrcC mutant (Pm), and
P. fluorescence (Pf). The study was carried out
using two cultivars of spring oilseed rape (Bras-
sica napus L.): ‘Licosmos’ and ‘Huzar’. The
values of heat flow in all treatments, except for
cotyledons infected with Ps, decreased during
20 h after inoculation. However, the curves of
heat flow for Ps-infected cotyledons showed a
completely different pattern, with at least two
peaks. BR27 pretreated cotyledons infected with
Ps had higher heat flow in comparison to Ps-
infected ones. As shown, the first effects of path-
ogenesis occurred 4 h after inoculation. The large
exothermic peaks observed in Ps and BR27 Ps
calorimetric curves were an indicator of tissue
response to an incompatible pathogen (Ps). BR27
treatment did not change the specific enthalpy of
cotyledon growth (Dgh) for both cultivars if
compared with absolute control. However, infec-
tion with Ps markedly increased Dgh values by
about 200% for both cultivars. In conclusion the
authors suggested the protective action of BR27
in oilseed rape cotyledons after bacterial infec-
tion with Pseudomonas (Skoczowski et al.
2011a).
Ozone StressTropospheric ozone (O3) has become one of the
strongest factors affecting agricultural and forest
plants and other types of vegetation (Kraft et al.
1996). The concentration of tropospheric O3 has
risen at least twice in the last 100 years, mainly
because of the industrial revolution; it will con-
tinue to rise if anthropogenic activity remains at
the same level (Wieser et al. 2001). The negative
influence of ozone on plants depends on the
concentration of O3 in the genetic background
and on the efficiency of plant defence mechan-
isms (Calatayud and Barreno 2004). This particle
is responsible for the destruction of the structure
and function of biological membranes and
for changes in the properties of thylakoids
(Płazek et al. 2000b). At the same time, there
exist some reports which indicate that higher
ozone concentration can lead to enhanced effi-
cacy of protective systems through an increase in
the levels of apoplastic and symplastic ascorbates
and glutathione (Wieser et al. 2001; Kronfuß
et al. 1998).
274 A. Skoczowski and M. Troc
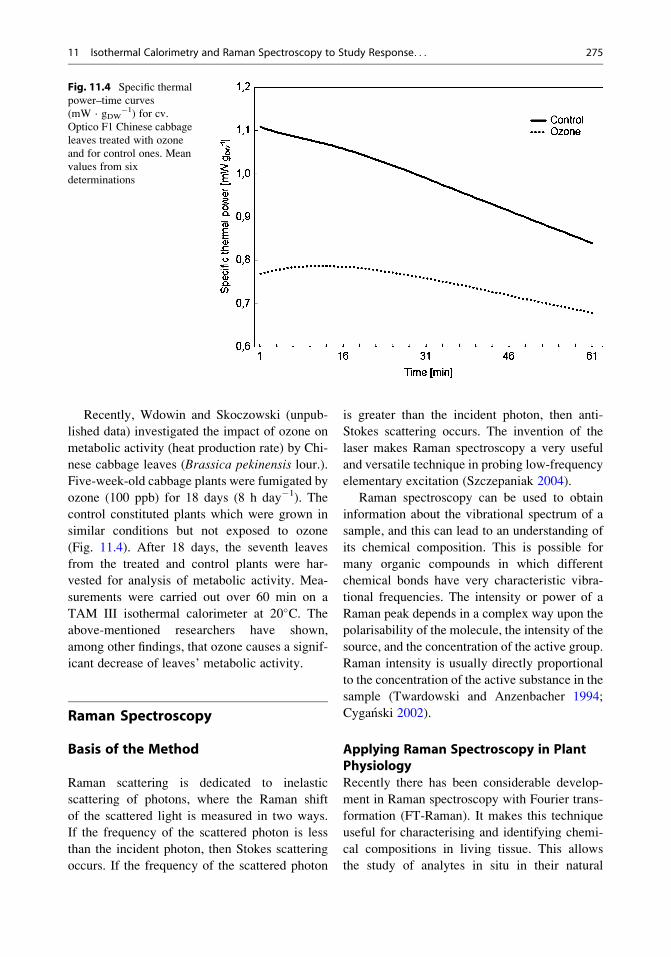
Recently, Wdowin and Skoczowski (unpub-
lished data) investigated the impact of ozone on
metabolic activity (heat production rate) by Chi-
nese cabbage leaves (Brassica pekinensis lour.).Five-week-old cabbage plants were fumigated by
ozone (100 ppb) for 18 days (8 h day�1). The
control constituted plants which were grown in
similar conditions but not exposed to ozone
(Fig. 11.4). After 18 days, the seventh leaves
from the treated and control plants were har-
vested for analysis of metabolic activity. Mea-
surements were carried out over 60 min on a
TAM III isothermal calorimeter at 20�C. Theabove-mentioned researchers have shown,
among other findings, that ozone causes a signif-
icant decrease of leaves’ metabolic activity.
Raman Spectroscopy
Basis of the Method
Raman scattering is dedicated to inelastic
scattering of photons, where the Raman shift
of the scattered light is measured in two ways.
If the frequency of the scattered photon is less
than the incident photon, then Stokes scattering
occurs. If the frequency of the scattered photon
is greater than the incident photon, then anti-
Stokes scattering occurs. The invention of the
laser makes Raman spectroscopy a very useful
and versatile technique in probing low-frequency
elementary excitation (Szczepaniak 2004).
Raman spectroscopy can be used to obtain
information about the vibrational spectrum of a
sample, and this can lead to an understanding of
its chemical composition. This is possible for
many organic compounds in which different
chemical bonds have very characteristic vibra-
tional frequencies. The intensity or power of a
Raman peak depends in a complex way upon the
polarisability of the molecule, the intensity of the
source, and the concentration of the active group.
Raman intensity is usually directly proportional
to the concentration of the active substance in the
sample (Twardowski and Anzenbacher 1994;
Cyganski 2002).
Applying Raman Spectroscopy in PlantPhysiologyRecently there has been considerable develop-
ment in Raman spectroscopy with Fourier trans-
formation (FT-Raman). It makes this technique
useful for characterising and identifying chemi-
cal compositions in living tissue. This allows
the study of analytes in situ in their natural
Fig. 11.4 Specific thermal
power–time curves
(mW · gDW�1) for cv.
Optico F1 Chinese cabbage
leaves treated with ozone
and for control ones. Mean
values from six
determinations
11 Isothermal Calorimetry and Raman Spectroscopy to Study Response. . . 275

environment, which is not possible when using
other analytical techniques. Raman measure-
ments with the excitation in the near-infrared
range can usually be performed without any
mechanical, chemical, photochemical, or thermal
decomposition of the sample (Schrader et al.
1999, 2000). In these conditions, plant tissues
do not absorb light, so fluorescence can also be
avoided. The major advantage of the Raman
technique in comparison to other standard ana-
lytical methods is its non-destructive effect on
plant tissue. Therefore, when using Raman spec-
troscopy, information on chemical composition
can be obtained without any need to disrupt sam-
ples. The first applications of NIR-FT-Raman
spectroscopy for non-destructive measurements
of various plant tissues were found to be very
promising, and therefore, this method has been
used extensively for this purpose in the last few
years (Baranska et al. 2005, 2006a, b; Baranski
et al. 2005). Samples can be analysed at ambient
temperature and pressure without any special
preparation required.
Raman spectroscopy can be successfully
applied for identifying various plant components
if characteristic key bands of individual analyte
molecules are found in the spectrum. This tech-
nique can also be considered as a potential ana-
lytical tool in taxonomy. The usefulness of
Raman spectroscopy for general plant classifica-
tion was reported previously (Reitzenstein et al.
2007; Baranski and Baranska 2008). Raman
measurements of single seeds enabled the correct
separation of accessions in accordance with
their taxonomical classification (Baranski et al.
2006).
The Raman spectrum, the dependence of the
intensity of scattered radiation from the quantum
energy gap of the incident and scattered radia-
tion, contains information about the characteris-
tic vibration of the studied molecules, which is
then used to identify and determine the total
amount of the chemical compound in the sample.
In the Raman spectrum, the intensity of radiation
is given in arbitrary units, referring to the
selected standard (Kecki 1998).
Using a modern FT-Raman spectrometer, it is
possible not only to non-destructively detect
chemical compounds which are contained in
plants but also to study their distribution in the
plant. In this way, it can create two-dimensional
maps showing the chemical composition of the
tested samples, and what is more, the coexistence
of various plant components in the same tissue
can be studied in a single analysis. Analysed
materials can be both primary metabolites
(mono- and oligosaccharides, fatty acids, amino
acids, proteins) and secondary metabolites: alka-
loids (Schulz et al. 2005), flavonoids (Baranska
et al. 2006a), carotenoids (Baranski et al. 2005,
Baranska et al. 2006b), terpenoids (Baranska
et al. 2005, Rosch et al. 1999), and polyacety-
lenes (Baranska et al. 2005).
Applications in Stress Physiology
AllelopathyAllelopathy is a direct or indirect influence of
chemical compounds (allelochemicals) released
from one living plant on the growth and develop-
ment of another plant (see section “Allelopa-
thy”). Investigations into allelopathic potential
usually begin with testing the activity of phyto-
toxicity crude extracts from plant donors. The
next step is determining the participation of indi-
vidual phytotoxic compounds in investigated
extracts. So, we prepared crude extracts from
sunflower (Helianthus annuus L.) and mustard
(Sinapis alba L.) leaves, and we wanted to
check the allelopathic effect and the autoallelo-
pathic effect of these extracts on the growth of
mustard seedlings (Skoczowski et al. 2011b).
In Fig. 11.5 are presented the FT-Raman spec-
tra obtained from mustard cotyledons germinated
on water – the control – and sunflower and mus-
tard leaf extracts. The band at 1,655 and
1,630 cm�1, together with signals at 1,300 and
1,266 cm�1, may be associated with fatty acids.
The first two Raman bands are related to the
content of individual cis and trans isomers pres-
ent in various edible oils (Sadeghi-Jorabchi et al.
1991). The total degree of unsaturation can also
be determined by calculating the ratio of the
intensity of a band at 1,266 cm�1 to that of a
band at 1,300 cm�1 (Sadeghi-Jorabchi et al.
276 A. Skoczowski and M. Troc
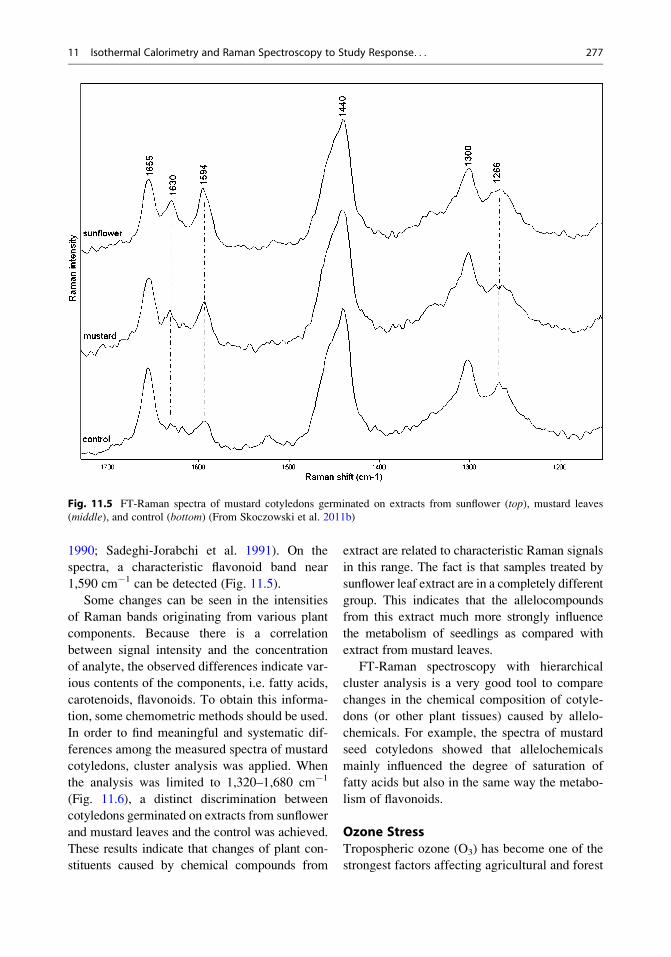
1990; Sadeghi-Jorabchi et al. 1991). On the
spectra, a characteristic flavonoid band near
1,590 cm�1 can be detected (Fig. 11.5).
Some changes can be seen in the intensities
of Raman bands originating from various plant
components. Because there is a correlation
between signal intensity and the concentration
of analyte, the observed differences indicate var-
ious contents of the components, i.e. fatty acids,
carotenoids, flavonoids. To obtain this informa-
tion, some chemometric methods should be used.
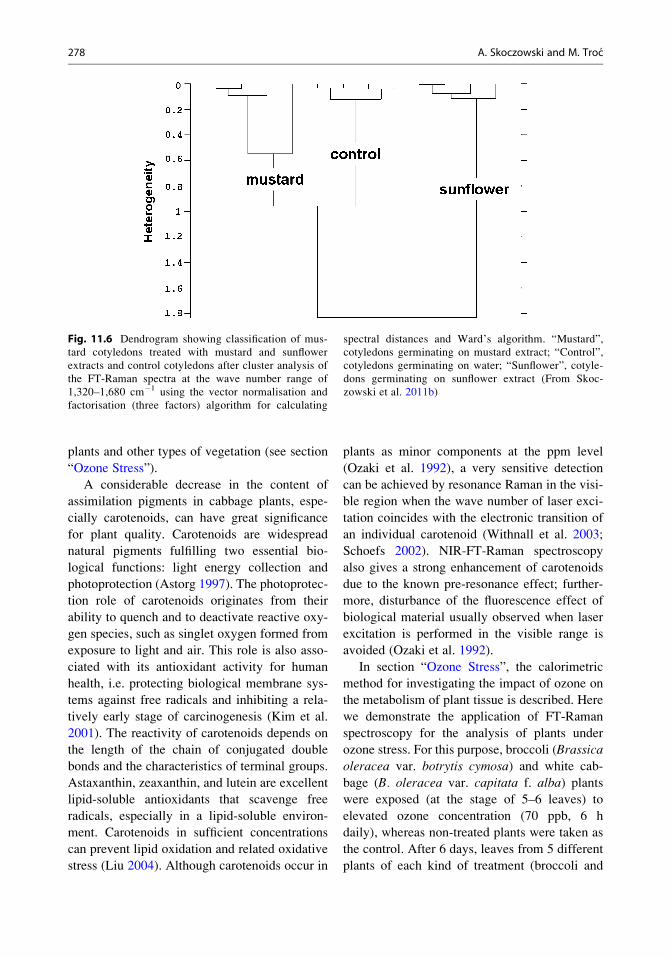
In order to find meaningful and systematic dif-
ferences among the measured spectra of mustard
cotyledons, cluster analysis was applied. When
the analysis was limited to 1,320–1,680 cm�1
(Fig. 11.6), a distinct discrimination between
cotyledons germinated on extracts from sunflower
and mustard leaves and the control was achieved.
These results indicate that changes of plant con-
stituents caused by chemical compounds from
extract are related to characteristic Raman signals
in this range. The fact is that samples treated by
sunflower leaf extract are in a completely different
group. This indicates that the allelocompounds
from this extract much more strongly influence
the metabolism of seedlings as compared with
extract from mustard leaves.
FT-Raman spectroscopy with hierarchical
cluster analysis is a very good tool to compare
changes in the chemical composition of cotyle-
dons (or other plant tissues) caused by allelo-
chemicals. For example, the spectra of mustard
seed cotyledons showed that allelochemicals
mainly influenced the degree of saturation of
fatty acids but also in the same way the metabo-
lism of flavonoids.
Ozone StressTropospheric ozone (O3) has become one of the
strongest factors affecting agricultural and forest
Fig. 11.5 FT-Raman spectra of mustard cotyledons germinated on extracts from sunflower (top), mustard leaves
(middle), and control (bottom) (From Skoczowski et al. 2011b)
11 Isothermal Calorimetry and Raman Spectroscopy to Study Response. . . 277
plants and other types of vegetation (see section
“Ozone Stress”).
A considerable decrease in the content of
assimilation pigments in cabbage plants, espe-
cially carotenoids, can have great significance
for plant quality. Carotenoids are widespread
natural pigments fulfilling two essential bio-
logical functions: light energy collection and
photoprotection (Astorg 1997). The photoprotec-
tion role of carotenoids originates from their
ability to quench and to deactivate reactive oxy-
gen species, such as singlet oxygen formed from
exposure to light and air. This role is also asso-
ciated with its antioxidant activity for human
health, i.e. protecting biological membrane sys-
tems against free radicals and inhibiting a rela-
tively early stage of carcinogenesis (Kim et al.
2001). The reactivity of carotenoids depends on
the length of the chain of conjugated double
bonds and the characteristics of terminal groups.
Astaxanthin, zeaxanthin, and lutein are excellent
lipid-soluble antioxidants that scavenge free
radicals, especially in a lipid-soluble environ-
ment. Carotenoids in sufficient concentrations
can prevent lipid oxidation and related oxidative
stress (Liu 2004). Although carotenoids occur in
plants as minor components at the ppm level
(Ozaki et al. 1992), a very sensitive detection
can be achieved by resonance Raman in the visi-
ble region when the wave number of laser exci-
tation coincides with the electronic transition of
an individual carotenoid (Withnall et al. 2003;
Schoefs 2002). NIR-FT-Raman spectroscopy
also gives a strong enhancement of carotenoids
due to the known pre-resonance effect; further-
more, disturbance of the fluorescence effect of
biological material usually observed when laser
excitation is performed in the visible range is
avoided (Ozaki et al. 1992).
In section “Ozone Stress”, the calorimetric
method for investigating the impact of ozone on
the metabolism of plant tissue is described. Here
we demonstrate the application of FT-Raman
spectroscopy for the analysis of plants under
ozone stress. For this purpose, broccoli (Brassica
oleracea var. botrytis cymosa) and white cab-
bage (B. oleracea var. capitata f. alba) plants
were exposed (at the stage of 5–6 leaves) to
elevated ozone concentration (70 ppb, 6 h
daily), whereas non-treated plants were taken as
the control. After 6 days, leaves from 5 different
plants of each kind of treatment (broccoli and
Fig. 11.6 Dendrogram showing classification of mus-
tard cotyledons treated with mustard and sunflower
extracts and control cotyledons after cluster analysis of
the FT-Raman spectra at the wave number range of
1,320–1,680 cm�1 using the vector normalisation and
factorisation (three factors) algorithm for calculating
spectral distances and Ward’s algorithm. “Mustard”,
cotyledons germinating on mustard extract; “Control”,
cotyledons germinating on water; “Sunflower”, cotyle-
dons germinating on sunflower extract (From Skoc-
zowski et al. 2011b)
278 A. Skoczowski and M. Troc

white cabbage ozone fumigated and control)
were taken for FT-Raman measurements. We
show that Raman spectroscopy combined with
chemometrics can be considered as a potential
analytical technique allowing for discriminating
the plants stressed by ozone from the non-
processed control group.
The cluster analysis was performed separately
for each sample type, for the whole, as well as for
specific wave number ranges using Ward’s algo-
rithm. Spectral distances for broccoli were calcu-
lated with the standard algorithm after applying
vector normalisation. For white cabbage, the
cluster analysis was carried out with the factor-
isation algorithm using the first three factors.
Single Raman spectra obtained from leaves
did not show any distinctive differences which
could be used for analytical purposes (Fig. 11.7).
Yet it does not mean that ozone did not result
in any change in the chemical composition of
plants. This information can be spread in the
broad range of the spectrum, and it overlaps
with other signals assigned to various plant com-
ponents. To extract this information, some che-
mometric methods should be used.
The most intensive carotenoid bands can be
found in the Raman spectrum within the
1,500–1,550 cm�1 range due to in-phase CC
(n1) stretching vibrations of the polyene chain.
The medium signal of carotenoids at 1,150–
1,170 cm�1 can be assigned to C–C (n2) stretch-ing vibration. Additionally, the in-plane rocking
mode of CH3 groups attached to the polyene
chain and coupled with C–C bonds is seen as a
peak of weak intensity in the 1,000–1,020 cm�1
region (Baranski et al. 2005, Baranska et al.
2006). A special advantage of using FT-Raman
spectroscopy with laser excitation at 1,064 nm
is the possibility to investigate the content of
chlorophylls in green parts of plants at room
Fig. 11.7 Typical FT-Raman spectra of broccoli and white cabbage leaves fumigated by ozone over 6 days (70 ppb,
6 h daily)
11 Isothermal Calorimetry and Raman Spectroscopy to Study Response. . . 279

temperature. Characteristic Raman bands due to
chlorophyll (Chl) can be seen at 1,606 cm�1
(relatively strong), 1,326, 1,286 cm�1 (medium
to weak), and 740 cm�1 (weak) (Schrader et al.
1998; Schulz et al. 2005). The distinction
between Chl a and Chl b is also possible if this
technique is used when pigments occur in the
isolated form or are dissolved in sufficient sol-
vent (Schulz and Baranska 2007). Spectra of Chl
a and b contain a number of bands with similar
frequencies; however, a few of them may be
considered as fingerprints. The characteristic
band for Chl b in the FT-Raman spectrum at
1,660 cm�1 arises from the stretching mode of
its formyl group (this group is absent in Chl a).The other key band of lower intensity located
at about 1,565 cm�1 for Chl b and about
1,550 cm�1 for Chl a is sensitive to the coordina-tion state of the central Mg atom of chlorophyll
molecules (Pascal et al. 2000). However, when
FT-Raman measurement is performed from the
green tissue of the plant, the characteristic bands
for Chl a and Chl b cannot be seen, and only the
total content of both pigments can be analysed.
The best markers are the bands at 1,326 or
740 cm�1 since they do not overlap with other
Raman signals associated with the remaining
plant component, but their intensity is relatively
weak in comparison to carotenoid signals.
In order to find meaningful and systematic
differences among the measured spectra of
white cabbage under elevated ozone concentra-
tion and in normal growing conditions, cluster
analysis was applied. Despite the application of
the standard procedures of spectra pretreatment,
as well as various mathematical algorithms, no
discrimination could be achieved if the whole
spectral range was considered. Analyses based
on various narrow wave number ranges gave a
variety of outputs, with randomly distributed
plants from both experimental groups, except
for one specific spectral range. When the analysis
was limited to 1,570–1,470 cm�1 (Fig. 11.8), a
distinct discrimination between ozone-fumigated
and non-treated plants was achieved. This is the
range in which the most intense carotenoid
band can be found. These results indicated that
changes of plant constituents caused by ozone
exposure were related to the characteristic
Raman signals in this range, i.e. correlated with
carotenoid content. It can be concluded that the
content of this pigment in white cabbage leaves
is strongly influenced by ozone.
Raman spectra obtained for broccoli leaves
were also subjected to cluster analysis. The best
discrimination between ozonated and non-treated
plants was achieved when almost the whole
registered wave number range was considered
Fig. 11.8 Dendrogram
showing the classification
of white cabbage leaves
after cluster analysis of
spectra at the wave number
range of 1,570–1,470 cm�1
with the use of the first
three factors for calculating
spectral distances and
Ward’s algorithm.
“Control”, non-treated
plants; “Ozone”, plants
under exposure to elevated
concentration of ozone. For
details see Fig. 11.7
280 A. Skoczowski and M. Troc

(Fig. 11.9). Carotenoid bands are naturally the
most intense signals in the Raman spectra of
broccoli leaves, so the main weight of the analy-
sis was put on these components, but other plant
constituents were also included. Generally, a
clear discrimination can be observed between
both analysed groups, named as “control” and
“ozone” (Fig. 11.9).
Results show that some chemical changes in
plant composition upon the stress caused by expo-
sure to elevated ozone concentration can be
detected by using Raman spectroscopy. It is very
sensitive to carotenoids, and it can be successfully
analysed even when this pigment is present at the
level of ppm. This is due to the high Raman
activity of this compound and the resonance effect
resulting in a strong enhancement of the caroten-
oid band. Sometimes individual Raman spectra do
not show any distinctive visual differences, but the
application of cluster analysis allowed us to divide
the investigated plants into two groups – ozone-
fumigated samples and non-processed control
samples. Finally, FT-Raman spectrometry seems
to be a good tool to describe the susceptibility of
particular plant genotypes to ozone stress.
Response to Light QualityLight quality plays an important role in morpho-
genesis and photosynthesis (Hoenecke et al.
1992; Saebo et al. 1995; Tripathy and Brown
1995), but rapid changes in the spectral quality
of light are stressful for plants.
Blue light is important in the formation of
chlorophyll (Senger 1982; Pushnik et al. 1987),
chloroplast development (Akoyunoglou and
Anni 1984), stomata opening (Zeiger 1984),
enzyme synthesis (Senger 1982), activation of
the circadian rhythm of photosynthesis (Senger
1982), and photomorphogenesis (Cosgrove 1981,
1982; Senger 1982; Wheeler et al. 1991).
One light source is light-emitting diodes
(LEDs). The advantages of using light-emitting
diodes (LED) as an artificial light source for
controlled-environment plant growth applica-
tions include high energy-conversion efficiency,
the use of DC power, small mass and volume,
longer life, wavelength specificity, adjustable
light intensity/quality, and low thermal energy
output (Barta et al. 1992; Tennessen et al. 1994;
Okamoto et al. 1997; Schuerger et al. 1997).
Physiological responses to spectral changes can
vary among different plant species (Deutch and
Rasmussen 1974; Boardman 1977; Senger
1982). Heo et al. (2002) reported that 1st inter-
node elongation in salvia and marigold was
strictly dependent on red light. In the case of
salvia, the authors observed the inhibiting (and
in the case of marigold, the promoting) effect of
red light on internode elongations.
Some crops and flowers have been cultured by
LED light radiation, such as lettuce (Hoenecke
et al. 1992; Okamoto et al. 1996), pepper (Brown
et al. 1995), wheat (Goins et al. 1997; Tripathy
and Brown 1995), spinach (Yanagi and Okamoto
Fig. 11.9 Dendrogram
showing the classification
of broccoli leaves in the
cluster analysis of the
spectra at the wave number
range of 4,000–220 cm�1
using the standard
algorithm for calculating
spectral distances and
Ward’s algorithm.
“Control”, non-treated
plants; “Ozone”, plants
under exposure to elevated
concentration of ozone. For
details see Fig. 11.7
11 Isothermal Calorimetry and Raman Spectroscopy to Study Response. . . 281
1997; Yanagi et al. 1996), mustard (Cosgrove
1981), and banana (Duong et al. 2002).
In this experiment, we examined the influence
of rapid changes of spectral light quality (derived
from LED) on selected metabolic properties of
white cabbage (B. oleracea var. capitata f. alba)
leaves. Cabbage plants grown in white light
(photoperiod 12/12 – light/darkness) at 18/14�C(day/night) were rapidly transferred to blue light-
rich spectral conditions for 6 days.
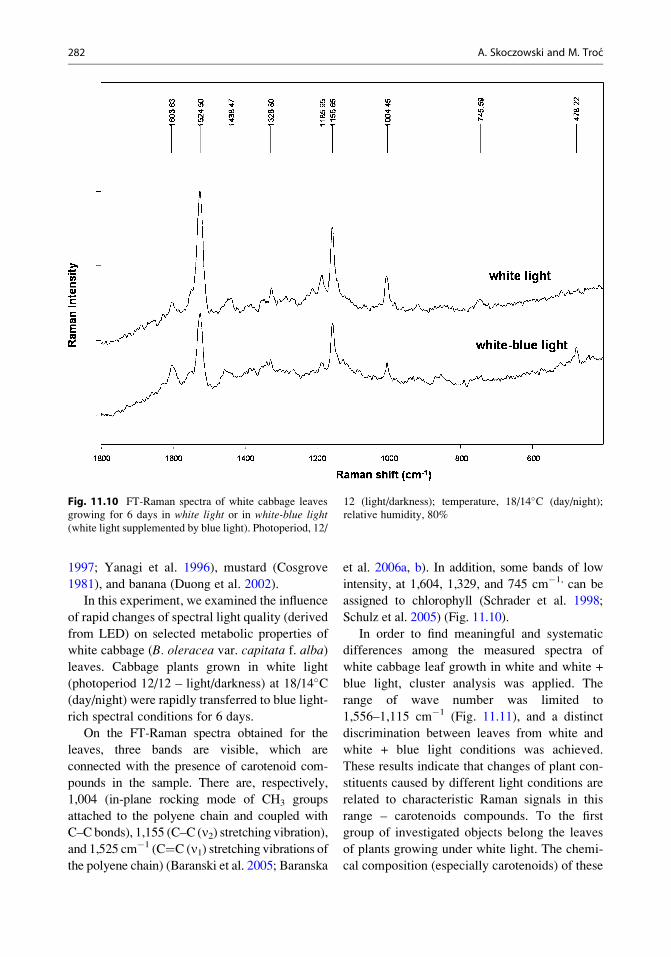
On the FT-Raman spectra obtained for the
leaves, three bands are visible, which are
connected with the presence of carotenoid com-
pounds in the sample. There are, respectively,
1,004 (in-plane rocking mode of CH3 groups
attached to the polyene chain and coupled with
C–C bonds), 1,155 (C–C (n2) stretching vibration),and 1,525 cm�1 (C¼C (n1) stretching vibrations ofthe polyene chain) (Baranski et al. 2005; Baranska
et al. 2006a, b). In addition, some bands of low
intensity, at 1,604, 1,329, and 745 cm�1, can be
assigned to chlorophyll (Schrader et al. 1998;
Schulz et al. 2005) (Fig. 11.10).
In order to find meaningful and systematic
differences among the measured spectra of
white cabbage leaf growth in white and white +
blue light, cluster analysis was applied. The
range of wave number was limited to
1,556–1,115 cm�1 (Fig. 11.11), and a distinct
discrimination between leaves from white and
white + blue light conditions was achieved.
These results indicate that changes of plant con-
stituents caused by different light conditions are
related to characteristic Raman signals in this
range – carotenoids compounds. To the first
group of investigated objects belong the leaves
of plants growing under white light. The chemi-
cal composition (especially carotenoids) of these
Fig. 11.10 FT-Raman spectra of white cabbage leaves
growing for 6 days in white light or in white-blue light(white light supplemented by blue light). Photoperiod, 12/
12 (light/darkness); temperature, 18/14�C (day/night);
relative humidity, 80%
282 A. Skoczowski and M. Troc
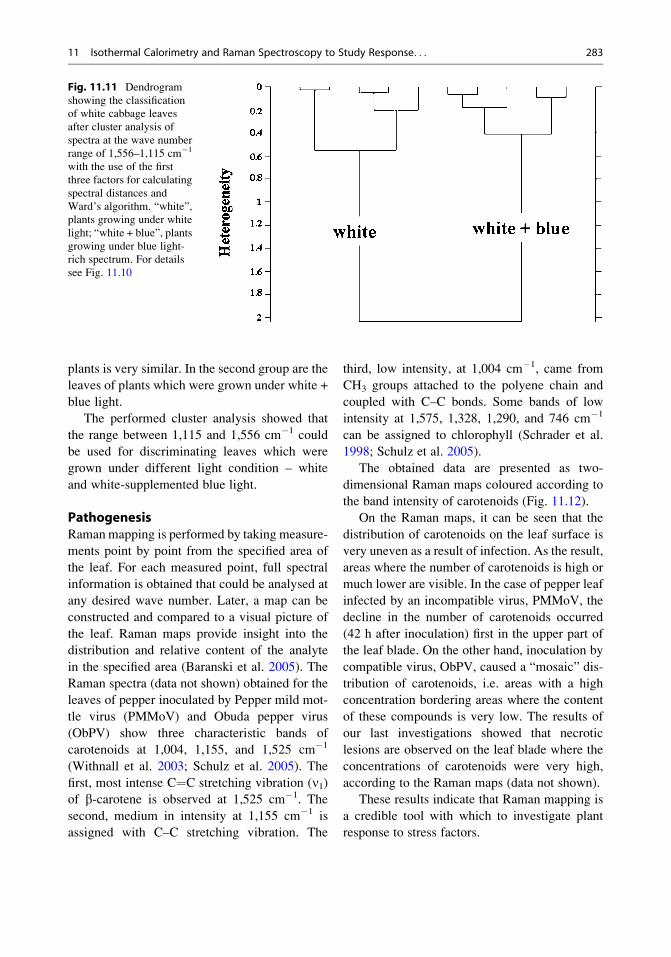
plants is very similar. In the second group are the
leaves of plants which were grown under white +
blue light.
The performed cluster analysis showed that
the range between 1,115 and 1,556 cm�1 could
be used for discriminating leaves which were
grown under different light condition – white
and white-supplemented blue light.
PathogenesisRaman mapping is performed by taking measure-
ments point by point from the specified area of
the leaf. For each measured point, full spectral
information is obtained that could be analysed at
any desired wave number. Later, a map can be
constructed and compared to a visual picture of
the leaf. Raman maps provide insight into the
distribution and relative content of the analyte
in the specified area (Baranski et al. 2005). The
Raman spectra (data not shown) obtained for the
leaves of pepper inoculated by Pepper mild mot-
tle virus (PMMoV) and Obuda pepper virus
(ObPV) show three characteristic bands of
carotenoids at 1,004, 1,155, and 1,525 cm�1
(Withnall et al. 2003; Schulz et al. 2005). The
first, most intense C¼C stretching vibration (n1)of b-carotene is observed at 1,525 cm�1. The
second, medium in intensity at 1,155 cm�1 is
assigned with C–C stretching vibration. The
third, low intensity, at 1,004 cm�1, came from
CH3 groups attached to the polyene chain and
coupled with C–C bonds. Some bands of low
intensity at 1,575, 1,328, 1,290, and 746 cm�1
can be assigned to chlorophyll (Schrader et al.
1998; Schulz et al. 2005).
The obtained data are presented as two-
dimensional Raman maps coloured according to
the band intensity of carotenoids (Fig. 11.12).
On the Raman maps, it can be seen that the
distribution of carotenoids on the leaf surface is
very uneven as a result of infection. As the result,
areas where the number of carotenoids is high or
much lower are visible. In the case of pepper leaf
infected by an incompatible virus, PMMoV, the
decline in the number of carotenoids occurred
(42 h after inoculation) first in the upper part of
the leaf blade. On the other hand, inoculation by
compatible virus, ObPV, caused a “mosaic” dis-
tribution of carotenoids, i.e. areas with a high
concentration bordering areas where the content
of these compounds is very low. The results of
our last investigations showed that necrotic
lesions are observed on the leaf blade where the
concentrations of carotenoids were very high,
according to the Raman maps (data not shown).
These results indicate that Raman mapping is
a credible tool with which to investigate plant
response to stress factors.
Fig. 11.11 Dendrogram
showing the classification
of white cabbage leaves
after cluster analysis of
spectra at the wave number
range of 1,556–1,115 cm�1
with the use of the first
three factors for calculating
spectral distances and
Ward’s algorithm. “white”,
plants growing under white
light; “white + blue”, plants
growing under blue light-
rich spectrum. For details
see Fig. 11.10
11 Isothermal Calorimetry and Raman Spectroscopy to Study Response. . . 283

References
Adam AL, Dubert F, Gilly A, Barna B, Skoczowski A
(1993) Measurement of exothermic heat flow and leaf
temperature of TMV- and CMV-infected plants by
microcalorimetry and infrared detection technique.
Acta Phytopath et Entomol Hung 28:195–200
Akoyunoglou G, Anni H (1984) Blue light effect on
chloroplast development in higher plants. In: Senger
H (ed) Blue light effects in biological systems.
Springer, Berlin
Alyabyev AJ, Loseva NL, Jakushenkova TP, Rachimova
GG, Tribunskih VI, Estrina RI, Petrov VY (2002)
Comparative effects of blue light and red light on the
rates of oxygen metabolism and heat production in
wheat seedlings stressed by heat shock. Thermochim
Acta 394:227–231
Alyabyev AJ, Loseva NL, Gordon LK, Andreyeva IN,
Rachimova GG, Tribunskih VI, Ponomareva AA,
Kempb RB (2007) The effect of changes in salinity
on the energy yielding processes of Chlorella vulgaris
and Dunaliella maritima cells. Thermochim Acta
458:65–70
Anekonda T, Jones C, Smith BN, Hansen LD (2004)
Differences in physiology and growth between coastal
and inland varieties of Douglas-fir seedlings in a com-
mon garden. Thermochim Acta 422:75–79
Astorg P (1997) Food carotenoids and cancer prevention:
an overview of current research. Trends Food Sci
Technol 8:406–413
Baltruschat H, Fodor J, Harrach BD, Niemczyk E, Barna
B, Gullner G, Janeczko A, Kogel K-H, Schafer P,
Schwarczinger I, Zuccaro A, Skoczowski A (2008)
Salt tolerance of barley induced by the root endophyte
Piriformospora indica is associated with a strong
increase in antioxidants. New Phytol 180:501–510
Baranska M, Schulz H, Baranski R, Nothnagel T,
Chrstensen L (2005) In situ simultaneous analysis of
polyacetylenes, carotenoids and polysaccharides in
carrot roots. J Agric Food Chem 53:6565–6571
Baranska M, Schulz H, Joubert E, Manley M (2006a) In
situ flavonoid analysis by FT-Raman spectroscopy:
identification, distribution, and quantification of
Fig. 11.12 The two-dimensional Raman maps for pep-
per leaves 42 h after inoculation with PMMoV or ObPV
viruses. Colour intensity corresponds with carotenoid
content (carotenoid band intensity). On the right-hand
side, analysed leaf areas are shown. The experiment was
conducted within the framework of cooperation with the
Plant Protection Institute of the Hungarian Academy of
Sciences in Budapest
284 A. Skoczowski and M. Troc

aspalathin in green rooibos (Aspalathus linearis). AnalChem 78:7716–7721
Baranska M, Baranski R, Schulz H, Nothnagel T (2006b)
Tissue-specific accumulation of carotenoids in carrot
roots. Planta 224:1028–1037
Baranski R, Baranska M (2008) Discrimination between
nongenetically modified (non-GM) and GMplant tissue
expressing cysteine-rich polypeptide using FT-Raman
spectroscopy. J Agric Food Chem 56:4491–4496
Baranski R, Baranska M, Schulz H (2005) Changes in
carotenoid content and distribution in living plant
tissue can be observed and mapped in situ using
NIR-FT-Raman spectroscopy. Planta 222:448–457
Baranski R, Baranska M, Schulz H, Simon PW, Nothnagel
T (2006) Single seed Raman measurements allow tax-
onomical discrimination of Apiaceae accessions col-
lected in gene banks. Biopolymers 81:497–505
Barta DJ, Tibbitis TW, Bula RJ, Morrow RC (1992)
Evaluation of light emitting diode characteristics for
a space-based plant irradiation source. Adv Space Res
12(5):141–149
Boardman NK (1977) Comparative photosynthesis of
sun and shade plants. Annu Rev Plant Physiol
28:355–377
Brown CS, Schuerger AC, Sager JC (1995) Growth and
photomorphogenesis of pepper plants under red light-
emitting diodes with supplemental blue or far-red
lighting. J Am Soc Hortic Sci 120:808–813
Calatayud A, Barreno E (2004) Response to ozone in two
lettuce varieties on chlorophyll a fluorescence, photo-
synthetic pigments and lipid peroxidation. Plant
Physiol Biochem 42:549–555
Cosgrove DJ (1981) Rapid suppression of growth by blue
light: occurrence, time course, and general character-
istics. Plant Physiol 67:584–590
Cosgrove DJ (1982) Rapid inhibition of hypocotyl growth
by blue light in Sinapis alba. Plant Sci Lett
25:305–312
Criddle RS, Hansen LD (1999) Calorimetric methods for
analysis of plant metabolism. In: Kemp RB (ed) Hand-
book of thermal analysis and calorimetry. Elsevier
Science B.V, Amsterdam, pp 711–763
Criddle RS, Hansen LD, Breidenbach RW, Ward MR,
Huffaker RC (1989) Effects of NaCl on metabolic
heat evolution rates by barley roots. Plant Physiol
90:53–58. doi:10.1104/pp. 90.1.53
Criddle RS, Fontana AJ, Rank DR, Paige D, Hansen LD,
Breidenbach RW (1991a) Simultaneous measure-
ments of metabolic heat rate, CO2 production, and
O2 consumption by microcalorimetry. Anal Biochem
194:413–417
Criddle RS, Breidenbach RW, Hansen LD (1991b) Plant
calorimetry: how to quantitatively compare apples and
oranges. Thermochim Acta 193:67–90
Criddle RS, Smith BN, Hansen LD (1997) A respiration
based description of plant growth rate response to
temperature. Planta 201:441–445
Cyganski A (2002) Metody spektroskopowe w chemii
analitycznej. Wydawnictwa Naukowo-Techniczne,
Warsaw (in polish)
Deutch B, Rasmussen O (1974) Growth chamber illumi-
nation and photomorphogenetic efficacy I. Physiolog-
ical action of infrared radiation beyond 750 mm.
Physiol Plant 30:64–71
Duong TN, Hong LTA, Watanabe H, Goi M, Tanaka M
(2002) Growth of banana plant lets cultured in vitro
under red and blue light-emitting diode (LED) irradi-
ation source. Acta Hortic 575:117–124
Fodor J, Harrach BD, Janeczko A, Barna B, Skoczowski
A (2007) Metabolic responses of tobacco to induction
of systemic acquired resistance. Thermochim Acta
466:29–34
Goins GD, Yorio NC, Sanwo MM, Brown CS (1997)
Photomorphogenesis, photosynthesis, and seed yield
of wheat plants grown under red light-emitting diodes
(LEDs) with and without supplemental blue lighting.
J Exp Bot 48:1407–1413
Gomez Galindo F, Rocculi P, Wadso L, Sjoholm I (2005)
The potential of isothermal calorimetry in monitoring
and predicting quality changes during processing and
storage of minimally processed fruits and vegetables.
Trends Food Sci Technol 16:325–331
Gordon LK,Minibayeva FV, Rakhmatullina DF, Alyabyev
AJ, Ogorodnikova TI, Loseva NL, Valitova YN (2004)
Heat production of wheat roots induced by the disrup-
tion of proton gradient by salicylic acid. Thermochim
Acta 422:101–104
Hansen LD (2001) Toward a standard nomenclature for
calorimetry. Thermochim Acta 371:19–22
Hansen LD, Russell DJ (2006) Which calorimeter is best?
A guide for choosing the best calorimeter for a given
task. Thermochim Acta 450:71–72
Hansen LD, Macfarlane C, McKinnon N, Smith BN,
Criddle RS (2004) Use of calorespirometric ratios,
heat per CO2 and heat per O2, to quantify metabolic
paths and energetics of growing cells. Thermochim
Acta 422:55–61
Hansen LD, Church JN, Matheson S, McCarlie VW,
Thygerson T, Criddle RS, Smith BN (2002) Kinetics
of plant growth and metabolism. Thermochim Acta
388:415–425
Heap I (2006) International survey of herbicide-resistant
weeds. http://www.weedscience.org
Heo J, Lee C, Chakrabarty D, Paek K (2002) Growth
responses of marigold and salvia bedding plants as
affected by monochromic or mixture radiation
provided by a Light-Emitting Diode (LED). Plant
Growth Regul 38:225–230
Hoenecke M, Bula RJ, Tibbitts TW (1992) Importance
of ‘blue’ photon levels for lettuce seedlings grown
under red light-emitting diodes. Hortic Sci 27:
427–430
Inderjit WJ (2001) Plant allelochemical interference or
soil chemical ecology? Perspect Plant Ecol 4(1):
3–12
Janeczko A, Tobias I, Skoczowski A, Dubert F, Gullner G,
Barna B (2007a) Bacterial infection and pretreatment
with 24-epibrassinolide markedly affect the
heat emission and membrane permeability of rape coty-
ledons. Thermochim Acta 458:88–91
11 Isothermal Calorimetry and Raman Spectroscopy to Study Response. . . 285
Janeczko A, Biesaga-Koscielniak J, Skoczowski A,
Marcinska I (2007b) Differentiation of wheat cell
suspension cultured in cold – impact of zearalenone
and 24-epibrassinolide. Zeszyty Problemowe Poste-
pow Nauk Rolniczych Z 523:127–136
Janssen M, Patino R, Von Stockar U (2005) Application
of bench-scale biocalorimetry to photoautotrophic
cultures. Thermochim Acta 435:18–27
Kecki Z (1998) Podstawy spektroskopii molekularnej.
Wydawnictwo Naukowe PWN, Warsaw (in polish)
Keller EA, Anekonda TS, Smith BN, Hansen LD,
Clair JBS, Criddle RS (2004) Stress and respira-
tion traits differ among four geographically distinct
Pinus ponderosa seed sources. Thermochim Acta
422:69–74
Kim MK, Ahn SH, Lee-Kim YC (2001) Relationship of
serum a-tocopherol, carotenoids and retinol with risk
of breast cancer. Nutr Res 21:797–809
Kraft M, Weigel H-J, Mejer G-J, Brandes F (1996)
Reflectance measurements of leaves for detecting vis-
ible and non-visible ozone damage to crops. J Plant
Physiol 148:148–154
Kronfuß G, Polle A, Tausz M, Havranek W, Wieser G
(1998) Effects of ozone and mild drought stress on gas
exchange, antioxidants and chloroplast pigments in
current-year needles of young Norway spruce [Piceaabies (L.) Karst]. Trees 12:482–489
Kupidłowska E, Gniazdowska A, Stepien J, Corbineau F,
Vinci D, Skoczowski A, Janeczko A, Bogatek R
(2006) Impact of sunflower (Helianthus annuus L.)
extracts upon reserve mobilization and energy metab-
olism in germinating mustard (Sinapis alba L.) seeds.
J Chem Ecol 32:2569–2583
Lamprecht I, Schmolz E (2000) Calorimetry goes afield.
Thermochim Acta 355:95–106
Liu RH (2004) Potential synergy of phytochemicals in
cancer prevention: mechanism of action. In: Interna-
tional research conference on food, nutrition and can-
cer, Washington
Loseva NL, Alyabyev AJ, Rachimova GG, Estrina RI
(1995) Aspects of the energetic balance of plant cells
under different salt conditions. Thermochim Acta
251:357–362
Loseva NL, Alyabyev AJ, Rachimova GG, Estrina RI
(1998) The effect of high temperature and salt on the
metabolic heat rate of Chlorella cells. Thermochim
Acta 309:129–131
Loseva NL, Gordon LK, Minibayeva FV, Alyabyev AJ,
Chernov VM, Chernowa OA, Andreyeva FV,
Rachimova GG, Tribunskih VI, Estrina RI, Gogolev
JB, Kemp RB (2002) Direct and indirect calorimetric
studies of stress responses of chlorella cells to infec-
tion with the mycoplasma, Acholeplasma laidlawii.Thermochim Acta 390:39–46
Loseva NL, Alyabyev AJ, Gordon LK, Andreyeva IN,
Kolesnikov OP, Ponomareva AA, Chernov VM,
Kemp RB (2003) The energetic stress response of
the microalgal Chlorella vulgaris to the mycoplasma,
Acholeplasma laidlawii as a model system for plant
pathogen interaction. Thermochim Acta 397:37–47
Loseva N, Gordon L, Alyabyev A, Andreyeva I, Kolesni-
kova O, Chernov V, Ponomareva A, Kemp RB (2004)
Effect of induced changes in membrane permeability
on the defence response of Chlorella vulgaris to infec-tion by Acholeplasma laidlawii. Thermochima Acta
422:95–100
Minibayeva FV, Gordon LK, Alyabyev AJ, Rakhmatullina
DF, Loseva NL (1998) Heat production of root cells
upon the dissipation of ion gradients on plasma mem-
brane. Thermochim Acta 309:139–143
Mukhanov VS, Kemp RB (2006) Simultaneous photoca-
lorimetric and oxygen polarographic measurements on
Dunaliella maritima cells reveal a thermal discrep-
ancy that could be due to nonphotochemical quench-
ing. Thermochim Acta 446:11–19
Okamoto K, Yanagi T, Takita S (1996) Development of
plant growth apparatus using blue and red led as
artificial light source. Acta Hortic 440:111–116
Okamoto K, Yanagi T, Kondo S (1997) Growth and
morphogenesis of lettuce seedlings eaisde under dif-
ferent combinations of red and blue light. Acta Hortic
435:149–157
Oroszi S, Jakob T, Wilhelm C, Harms H, Maskow T
(2011) Photosynthetic energy conversion in the dia-
tom Phaeodactylum tricornutum Measuring by calo-
rimetry, oxygen evolution and pulse-amplitude
modulated fluorescence. J Therm Anal Calorim
104:223–231. doi:10.1007/s10973-011-1358-3
Ozaki Y, Cho R, Ikegawa K, Muraishi S, Kawauchi K
(1992) Potential of near-infrared Fourier transform
Raman spectroscopy in food analysis. Appl Spectrosc
46:1503–1507
Pascal A, Peterman E, Gradinaru C, Van Amerongen H,
Van Grondelle R, Robert B (2000) Structure and inter-
actions of the chlorophyll a molecules in the higher
plant Lhcb4 antenna protein. J Phys Chem
104:9317–9321
Petrov VY, Alyabyev AJ, Loseva NL, Klementyeva GS,
Tribunskich VI (1995) A differential photocalori-
metric method for investigating the rate of energy
storage in plants. Thermochim Acta 251:351–356
Płazek A, Rapacz M (2000) The intensity of respiration
and heat emission from seedlings of Festuca pratensis(Hud.) and Hordeum vulgare L. during pathogenesis
caused by Bipolaris sorokiniana (Sacc.) Shoem. Acta
Physiol Plant 22:25–30
Płazek A, Skrzypek I, Zur I (2000a) The changes of heat
emission and phenolic compound level in Hordeumvulgare (L.) and Festuca pratensis (Huds.) calli trea-ted with Bipolaris sorokiniana (Sacc.) Shoem. phyto-
toxins. J Agron Crop Sci 184:17–21
Płazek A, Rapacz M, Skoczowski A (2000b) Effects of
ozone fumigation on photosynthesis and membrane
permeability in leaves of spring barley, meadow fes-
cue and winter rape. Photosynthetica 38:409–413
Pushnik JC, Miller GW, Jolley VD, Brown GC, Davis
TD, Burnes AM (1987) Influences of ultra-violet
(UV)-blue light radiation on the growth of cotton. II.
Photosynthesis, leaf anatomy and iron reduction. J
Plant Nutr 10:2283–2297
286 A. Skoczowski and M. Troc

Rank DR, Breidenbach RW, Fontana AJ, Hansen LD,
Cirddle RS (1991) Time-temperature response of
tomato cells during high-temperature and low-
temperature inactivation. Planta 185:576–582
Reitzenstein S, Rosch P, Strehle MA, Berg D, Baranska
M, Schulz H, Rudloff E, Popp J (2007) Nondestructive
analysis of single rapeseeds by means of Raman spec-
troscopy. J Raman Spectrosc 38:301–308
Rice EL (1984) Allelopathy. Academic, New York
Rocculi P, Romani S, Rosa MD, Gomez F, Sjoholm M,
Wadso L (2005) Influence of pre-treatment on metab-
olism and wounding response of fresh cut potatoes
evaluated with isothermal calorimetry. In: Mencarelli
F, Tonutti P (eds) Proceeding of the 5th international
postharvest symposium, Acta horticulturae 682., pp
1833–1838
Rosch P, Popp J, Kiefer W (1999) Raman and surface
enhanced Raman spectroscopic investigation on
Lamiaceae plants. J Mol Struct 480–481:121–124
Sadeghi-Jorabchi H, Hendra PJ, Wilson RH, Belton PS
(1990) Determination of the total unsaturation in oils
and margarines by Fourier transform Raman spectros-
copy. J Am Oil Chem Soc 67:483–486
Sadeghi-Jorabchi H, Wilson RH, Belton PS, Edward-
Webb JD, Coxon DT (1991) Quantitative analysis of
oils and fats by Fourier-transform Raman spectros-
copy. Spectrochim Acta A 47:1449–1458
Saebo A, Krekling T, Appelgren M (1995) Light quality
affects photosynthesis and leaf anatomy of birch plant-
lets in vitro. Plant Cell Tissue Organ Cult 41:177–185
Schabes FI, Sigstad EE (2005) Calorimetric studies of
quinoa (Chenopodium quinoa Willd.) seed germina-
tion under saline stress conditions. Thermochim Acta
428:71–75
Schabes FI, Sigstad EE (2006) Optimizing conditions to
study seed germination by calorimetry using soybean
(Glycine max [L.] Merr.) seeds. Thermochim Acta
450:96–101
Schabes FI, Sigstad EE (2007) A calorimetric study of the
allelopathic effect of cnicin isolated from Centaureadiffusa Lam. on the germination of soybean (Glicinemax) and radish (Raphanus sativus). Thermochim
Acta 458:84–87
Schoefs B (2002) Chlorophyll and carotenoid analysis in
food products. Properties of the pigments and methods
of analysis. Trends Food Sci Technol 13:361–371
Schrader B, Erb I, Lochte T (1998) Differentiation of
conifers by NIR-FT-Raman spectroscopy. Asian J
Phys 7:259–264
Schrader B, Klump HH, Schenzel K, Schulz H (1999)
Non-destructive NIR FT Raman analysis of plants. J
Mol Struct 509:201–212
Schrader B, Schulz H, Andreev GN, Klump HH, Sawatzki
J (2000) Non-destructive NIR-FT-Raman spectros-
copy of plant and animal tissues, of food and works
of art. Talanta 53:35–45
Schuerger AC, Brown C, Stryjewski EC (1997) Anatomi-
cal Features of pepper plants (AnalsofB ntt ff B L.)
grown under red light-emitting diodes supplemented
with blue or far-red light. Ann Bot 79:273–282
Schulz H, Baranska M (2007) Identification and quantifi-
cation of valuable plant substances by IR and Raman
spectroscopy. Vib Spectrosc 43:13–25
Schulz H, Baranska M, Baranski R (2005) Potential of
NIR-FT-Raman spectroscopy in natural carotenoid
analysis. Biopolymers 77:212–221
Senger H (1982) The effect of blue light on plants and
microorganisms. Photochem Photobiol 35:911–920
Sigstad EE, Garcia CI (2001) A microcalorimetric analy-
sis of quinoa seeds with different initial water content
during germination at 25�C. Thermochim Acta
366:149–155
Sigstad EE, Prado FE (1999) A microcalorimetric study
of Chenopodium quinoa Willd. seed germination.
Thermochim Acta 326:159–164
Skoczowski A, Janeczko A, Gullner G, Tobias I, Kornas
A, Barna B (2011a) Response of brassinosteroid-
treated oilseed rape cotyledons to infection with the
wild type and HR-mutant of Pseudomonas syringae orwith P. fluorescence. J Therm Anal Calorim
104:131–139
Skoczowski A, Troc M, Baran A, Baranska M (2011b)
Impact of sunflower and mustard leave extracts on the
growth and dark respiration of mustard seedlings.
J Therm Anal Calorim 104:187–192
Smith BN, Jones AR, Hansen LD, Criddle RS (1999)
Growth, respiration rate, and efficiency response to
temperature. In: Pessarakli M (ed) Handbook of
plant and crop stress, 2nd edn. Revised and expanded.
Marcel Dekker Inc., New York/Basel
Smith BN, Hansen LD, Breidenbach RW, Criddle RS,
Rank DR, Fontana AJ, Paige D (2000) Metabolic
heat rate and respiratory substrate changes in aging
potato slices. Thermochim Acta 349:121–124
Smith BN, Harris LC, McCarlie VW, Stradling DL,
Thygerson T, Walker J, Criddle RS, Hansen LD
(2001) Time, plant growth, respiration, and tempera-
ture. In: Pessarakli M (ed) Handbook of plant and crop
physiology, 2nd edn. Marcel Dekker, New York/Basel
Smith BN, Monaco TA, Jones C, Holmes RA, Hansen
LD, McArthur ED, Freeman DC (2002) Stress-
induced metabolic differences between populations
and subspecies of Artemisia tridentata (sagebrush)
from a single hillside. Thermochim Acta 394:205–210
Steinrucken HCM, Hermann D (2000) Spreading the
search for crop chemicals. Chem Ind 7(4):246–249
Stokłosa A, Janeczko A, Skoczowski A, Kiec J (2006)
Isothermal calorimetry as a tool for estimating resis-
tance of wild oat (Avena fatua L.) to aryloxyphenox-
ypropionate herbicides. Thermochim Acta
441:203–206
Suwanagul D (1995) Early detection of weed resistance:
pattern-thinking and rapid microcalorimetric analysis.
Dissertation, Oregon State University, Corvallis
Szczepaniak W (2004) Metody instrumentalne w analizie
chemicznej. Wydawnictwo Naukowe PWN, Warsaw
(in Polish)
Tennessen DJ, Singsaas EL, Sharkey TD (1994) Light-
emitting diodes as a light source for photosynthesis
research. Photosynth Res 39:85–92
11 Isothermal Calorimetry and Raman Spectroscopy to Study Response. . . 287

Thygerson T, Harris JM, Smith BN, Hansen LD, Pendleton
RL, Booth DT (2002) Metabolic response to tempera-
ture for six populations of winterfat (Eurotia lanata).Thermochim Acta 394:211–217
Tripathy BC, Brown CS (1995) Root–shoot interaction in
the greening of wheat seedlings grown under red light.
Plant Physiol 107:407–411
Troc M, Skoczowski A, Baranska M (2009) The influence
of sunflower and mustard leaf extracts on the germi-
nation of mustard seeds. J Therm Anal Calorim 95
(3):727–730
Troc M, Saja D, Kornas A, Zuraw A, Skoczowski A
(2011) Strong endothermic effects caused by allelo-
pathic interactions during growth of mustard, rape,
wheat and clover seedlings. J Therm Anal Calorim
104:141–148
Twardowski J, Anzenbacher P (1994) Raman and IR
spectroscopy in biology biochemistry. Wydawnictwo
Naukowe PWN, Warsaw
Vyvyan JR (2002) Allelochemicals as leads for new herbi-
cides and agrochemicals. Tetrahedron 58:1631–1646
Wadso I (1995) Microcalorimetric techniques for the
investigation of living plants materials. Thermochim
Acta 250:285–304
Wadso I (1997) Trends in isothermal microcalorimetry.
Chem Soc Rev 26:79–86
Wadso L, Gomez F, Sjoholm I, Rocculi P (2004) Effect of
tissue wounding on the results from calorimetric mea-
surements of vegetable respiration. Thermochim Acta
422:89–93
Wadso L, Rocculi P, Romani S, Gomez Galindo F,
Sjoholm I (2005) Isothermal calorimetry approach to
evaluate the effect of tissue wounding on vegetable
metabolism. In: Mencarelli F, Tonutti P (eds) Pro-
ceeding of the 5th international postharvest sympo-
sium, Acta horticulturae 682., pp 1833–1838
Weston LA, Duke SO (2003) Weed and crop allelopathy.
Crit Rev Plant Sci 22(3–4):367–389
Wheeler RM, Mackowiak CL, Sager JC (1991) Soybean
stem growth under high-pressure sodium with supple-
mental blue lighting. Agron J 83:903–906
Wieser G, Tausz M, Wonish A, Havranek WM (2001)
Free radical scavengers and photosynthetic pigments
in Pinus cembra L. needles as affected by ozone
exposure. Biol Plant 44:225–232
Withnall R, Chowdhry BZ, Silver J, Edwards HGM,
De Oliveira LFC (2003) Raman spectra of carote-
noids in natural products. Spectrochim Acta A 59:
2207–2212
Yanagi T, Okamoto K (1997) Utilization of super-bright
light emitting diodes as an artificial light source for
plant growth. Acta Hortic 418:223–228
Yanagi T, Okamoto K, Takita S (1996) Effects of blue,
red and blue/red lights of two different PPF levels on
growth and morphogenesis of lettuce plants. Acta
Hortic 440:117–122
Zeiger E (1984) Blue light and stomata function. In:
Senger H (ed) Blue light effects in biological systems.
Springer, Berlin/Heidelberg/New York
288 A. Skoczowski and M. Troc