Embed Size (px)
Citation preview

Arnis Abolins
MOLECULAR SUBTYPES AND
IMMUNOHISTOCHEMICAL
PROFILES IN BREAST CANCER
For obtaining the degree of a Doctor of Medicine
Speciality – Pathology
Supervisors:
Dr. habil. med., Professor Janis Gardovskis
Dr. med., Associate Professor Ilze Strumfa
Riga, 2012

2
ANNOTATION
The doctoral thesis “Molecular subtypes and immunohistochemical profiles in
breast cancer” is devoted to morphological and immunohistochemical research on
breast cancer. Breast cancer is one of the most common malignant tumours in the
European population and the most frequent malignancy in female. In Latvia, the
incidence of breast cancer remains significant. Breast cancer is a heterogeneous disease
including several entities with different clinical behaviour. The classics of breast cancer
characteristics are represented in the classification of breast tumours by the World
Health Organization. However, even tumours belonging to the same histologic type can
have different clinical course. Additional information can be obtained from molecular
subtyping of breast cancer thus disclosing subgroups with different biological properties
and response to treatment. The molecular subtypes initially were discovered by gene
expression profiling in high throughput microarray technologies. At present,
immunohistochemistry is accepted as adequate surrogate marker. In the present work, 5
molecular subtypes of breast cancer (luminal A, luminal B (HER2 positive), luminal B
(HER2 negative), HER2 positive and triple negative) are detected according to novel St.
Gallen (2011) classification and characterised in detail. Further, new potential
prognostic factors are analysed, targeting proteins that are involved in the cardinal
tumour features as cell proliferation and cell cycle control (cyclin D1), evasion of
apoptosis (BCL2 oncoprotein), expression of oncoproteins due to mutations in proto-
oncogenes (p53) and angiogenesis (cyclooxygenase-2). The theoretical basis of the
doctoral thesis employs 247 literature sources. The aim of the doctoral thesis was to
classify breast cancer by molecular subtypes and to evaluate the above listed novel
prognostic factors by immunohistochemistry. Within the research work, 383 patients
with primary invasive breast cancer were enrolled. The tumour tissues were evaluated
by morphological, immunohistochemical visualisation and in situ hybridisation
technologies. In the result, 4 immunohistochemical technologies for the detection of
p53, BCL2 protein, cyclooxygenase-2 and cyclin D1 have been developed, 5 molecular
subtypes of breast cancer are characterised in detail and the molecular portraits of p53,
BCL2, cyclooxygenase-2 and cyclin D1-positive breast cancers are obtained. The
complex evaluation of the prognostic value of several factors, revealed that the local
spread (pT) of breast cancer, regional lymph nodes status (pN) cancer grade and
molecular subtype as well as expression of p53 and BCL2 influences the survival.
3
ANOTĀCIJA
Promocijas darbs “Krūts vēža molekulāro apakštipu un imūnhistoķīmiskā profila
raksturojums” veltīts krūts vēža morfoloģiskajai un imūnhistoķīmiskajai izpētei. Krūts
vēzis ir viens no biežākajiem ļaundabīgajiem audzējiem Rietumu valstu populācijās un
visbiežākais ļaundabīgais audzējs sievietēm. Tā izplatība Latvijā saglabājas augsta.
Krūts vēzim raksturīgās heterogenitātes dēļ Pasaules Veselības organizācijas
apstiprinātā morfoloģiskā klasifikācija nespēj atklāt visus audzēja parametrus, kas
raksturo audzēja bioloģisko potenciālu un ļauj izvēlēties personalizētu terapiju, tādēļ
krūts audzēju raksturojumam izmantojama molekulārā klasifikācija. Molekulārie
apakštipi sākotnēji tika noteikti, analizējot gēnu ekspresiju ar mikrokartēšanas
tehnoloģiju. Šobrīd imūnhistoķīmija tiek pieņemta kā atbilstošākā aizvietojošā
tehnoloģija. Promocijas darbā detalizēti raksturoti krūts vēža 5 molekulārie subtipi
(lumināls A, lumināls B (HER2 negatīvs), lumināls B (HER2 pozitīvs), HER2 pozitīvs
un trīskārši negatīvs) atbilstoši St. Gallēnas klasifikācijai (2011), kas ir novatoriska
pieeja arī pasaules praksē, kā arī veikti pētījumi jaunu prognostisku faktoru atklāšanai,
analizējot molekulas, kas nosaka audzēja galvenās bioloģiskās īpašības – iesaistās šūnu
proliferācijā un šūnu cikla kontrolē (ciklīns D1), ļauj audzēja šūnām izvairīties no
apoptozes (BCL2 onkoproteīns), saistīti ar mutācijām proto-onkogēnos (p53) un
angioģenēzi (ciklooksigenāze-2). Pētījuma teorētiskās bāzes izstrādei izmantoti 247
literatūras avoti. Promocijas darbā izvirzīts mērķis klasificēt krūts vēža gadījumus pēc
molekulāriem apakštipiem un izvērtēt minētos jaunos potenciālos prognostiskos
faktorus krūts vēža audos. Izmantojot morfoloģiskas, imūnhistoķīmiskās vizualizācijas
un in situ hibridizācijas tehnoloģijas, izpētīti 383 secīgi invazīva krūts vēža gadījumi.
Pētījuma rezultātā izveidotas 4 imūnhistoķīmiskās vizualizācijas tehnoloģijas p53
proteīna, BCL2 proteīna, ciklooksigenāzes-2 un ciklīna D1 noteikšanai, detalizēti
raksturoti krūts vēža 5 molekulārie apakštipi, iegūts p53, BCL2, ciklooksigenāzes-2 un
ciklīnu D1 ekspresējošu krūts vēžu molekulārais portrets un noteikts šo faktoru
sastopamības biežums. Kompleksi izvērtējot daudzu parametru prognostisko nozīmi, kā
dzīvildzi ietekmējoši faktori identificēti krūts vēža lokālā izplatība (pT) un reģionālo
limfmezglu metastātisks bojājums (pN), audzēja diferenciācijas pakāpe, molekulārais
subtips, kā arī p53 un BCL2 ekspresija.

4
TABLE OF CONTENTS
ANNOTATION 2
ANOTĀCIJA 3
LIST OF ABBREVIATIONS 6
INTRODUCTION 8
1. LITERATURE REVIEW 11
1.1. Molecular subtypes of breast cancer 15
1.1.1. Luminal-like breast carcinoma 15
1.1.2. HER2 positive type (non luminal) 16
1.1.3. Normal breast-like type/unclassified breast cancer 17
1.1.4. Basal-like breast carcinoma 17
1.1.5. Triple negative breast cancer phenotype 19
1.2. Relation between molecular classification and adjuvant treatment 19
1.3. Future directions and perspectives in breast cancer classification 21
1.4. Prognostic and predictive factors in breast cancer 21
1.4.1. Expression of oncoprotein p53 25
1.4.2. Role of BCL2 in breast cancer 38
1.4.3. Cyclooxygenase-2 evaluation 47
1.4.4. Cyclin D1 in breast cancer 56
1.4.5. Basal differentiation by cytokeratin 5/6 63
2. MATERIALS AND METHODS 64
2.1. Patients 64
2.2. Gross examination 64
2.3. Microscopy 65
2.4. Immunohistochemistry 66
2.5. Fluorescent in situ hybridization 68
2.6. Statistical analysis 69
3. RESULTS 70
3.1. Basic characteristics of the study group 70
3.2. The morphological characteristics of the analysed tumours 72
3.3. Immunohistochemical findings on molecular subtyping and prognostic
variables
77

5
3.4. The association between the molecular subtypes of breast carcinoma and
known prognostic variables
85
3.5. The mutual associations between morphological variables 92
3.6. Survival 116
3.7. Statistically non-significant results 119
4. DISCUSSION 125
4.1. Surgical intervention 126
4.2. Surgical approach to axillary lymph nodes 127
4.3. The histological type of breast cancer 128
4.4. The local tumour spread (pT) 130
4.5. The evaluation of axillary lymph nodes status (pN) 131
4.6. Distant metastases (M) 133
4.7. Histological grade 133
4.8. Expression of oestrogen and progesterone receptors 135
4.9. Proliferation activity by Ki-67 136
4.10. The overexpression of HER2 protein and amplification of HER2/neu
gene
137
4.11. Immunohistochemistry and breast cancer molecular subtype 138
4.12. Age and molecular subtype 140
4.13. Expression of aberrant p53 protein 141
4.14. Expression of BCL2 oncoprotein 145
4.15. Expression of cyclooxygenase-2 protein 149
4.16. Overexpression of cyclin D1 152
4.17. Basal differentiation by cytokeratin 5/6 155
5. CONCLUSIONS 156
6. PRACTICAL RECOMMENDATIONS 157
7. REFERENCES 158

6
LIST OF ABBREVIATIONS
ABCSG – Austrian Breast and Colorectal Cancer Study Group
ASCO – American Society of Clinical Oncology
BCL2 – BCL2 oncoprotein
CAP – College of American Pathologists
CD – Cluster of differentiation
CDK – Cyclin dependent kinase
CI – Confidence interval
CISH – Chromogenic in situ hybridization
CK – Cytokeratin
COX – Cyclooxygenase
DCIS – Ductal carcinoma in situ
DFS – Disease free survival
DNA – Deoxyribonucleic acid
EGFR - Epidermal growth factor receptor
ER – Oestrogen receptor alpha
FISH – Fluorescent in situ hybridization
G - Grade
HE – Haematoxylin – eosin
HER – Human epidermal growth factor receptor
HR – Hazard ratio
IDC - Invasive ductal carcinoma
IHC – Immunohistochemistry
IP – Immunoperoxidase
kDa – Kilodalton
LCIS – Lobular carcinoma in situ
MDM2 - Murine double minute 2
NPI - Nottingham Prognostic Index
OM – Original magnification
OS – Overall survival
PCR – Polymerase chain reaction
PG – Prostaglandin

7
PR – Progesterone receptor
RFS – Relapse – free survival
RNA – Ribonucleic acid
RR – Relative risk
SD – Standard deviation
TNM – Classification of malignant tumours: T - size of the tumour, N – involvement of
regional lymph nodes, M - distant metastasis
WHO – World Health Organization

8
INTRODUCTION
Breast cancer is one of the most common malignant tumours in the European
population and the most frequent malignancy in female [Bombonati and Sgroi, 2011].
As the treatment of breast cancer is complex, wider understanding of breast cancer
biology is necessary.
Breast cancer is a heterogeneous disease including several entities with different
clinical behaviour. The classic of breast cancer characteristics is represented in the
classification of breast tumours by the World Health Organization [Tavassoli and
Devilee, 2003]. Even tumours belonging to the same histologic type can have different
clinical course. Naturally, the largest group – ductal cancer – shows the highest
heterogeneity. Additional information can be obtained from molecular subtyping of
breast cancer. This approach is based on expression patterns of so called intrinsic genes
showing higher variation of expression between tumours than within one tumour [Perou
et al., 2000; Strehl et al., 2011]. The molecular subtyping discloses subgroups with
different biological properties and response to treatment. The genes in breast cancer
became up-regulated or down-regulated in larger groups, as will be described further for
each molecular subtype. The molecular subtypes initially were discovered by gene
expression profiling in high throughput microarray technologies [Perou et al., 2000]. At
present, immunohistochemistry (IHC) is accepted as adequate surrogate marker
[Nielsen et al., 2004; Carey et al., 2006] benefitting from higher economic effect and
simpler technology despite less robust data in predictive sense [Sørlie, 2004].
The best-known molecular subtypes of breast cancer include luminal, human
epidermal growth factor receptor (HER) 2 positive and triple negative tumours
[Guarneri and Conte, 2009]. The division of luminal subtype into luminal A and luminal
B is also well-accepted. The basal-like breast cancer is matter of active discussions as it
overlaps with triple negative subtype but is not synonymous with it.
The luminal molecular subtype is characterised by oestrogen (ER) and
progesterone (PR) receptor positivity [Strehl et al., 2011]. The prognostically worse
luminal B subtype can be recognised by co-expression of HER2 in addition to ER and
PR in contrast to HER2 negative luminal A subtype, or by higher proliferative activity
[Cheang et al., 2009; Nielsen et al., 2010; Goldhirsch et al., 2011; Strehl et al., 2011].
HER2 positive breast cancer lacks expression of ER and PR, but is defined by HER2

9
protein overexpression by IHC and/or HER2/neu gene amplification by in situ
hybridisation [Strehl et al., 2011]. Breast cancer negative for ER, PR and HER2 protein
expression is called triple negative. It partially overlaps with basal-like subtype showing
expression of basal cytokeratins that normally are present in the basal cell of mammary
ducts. High proliferative activity is typical in triple negative breast cancer.
The hot topics in breast cancer research include the epigenetic research [Huang
et al., 2011], investigation of microenvironment and breast adipocytes [Place et al.,
2011; Tan et al., 2011] and studies of additional immunohistochemical factors. Novel
molecular factors that might play role in breast cancer development, reveal prognosis
and potentially become target for treatment, include cyclooxygenase-2 [Kang et al.,
2011], interleukins [Iliopoulos et al., 2011], p53 [Malhotra et al., 2010], p27 [Wander et
al., 2011], cyclin D1 [Li et al., 2011], cytokeratin 5/6 [Li et al., 2011] and apoptosis-
related factors including BCL2 oncoprotein [Zaha and Lazar, 2012]. Among the
potential prognostic factors, the most promising targets represent proteins that are
involved in the cardinal tumour features as cell proliferation and cell cycle control
(cyclin D1), evasion of apoptosis (BCL2 oncoprotein), expression of oncoproteins due
to mutations in proto-oncogenes (p53) and angiogenesis (cyclooxygenase-2).
Research aim: To classify breast cancer by molecular subtypes and evaluate
novel prognostic factors by immunohistochemistry.
Research objectives:
1. Applying total test approach, to develop immunohistochemical visualisation
technologies for detection of BCL2 oncoprotein, p53, cyclin D1 and
cyclooxygenase-2 protein expression.
2. By the acquired technology, to determine immunohistochemical expression of BCL2
oncoprotein, p53, cyclin D1, cyclooxygenase-2 protein and cytokeratin 5/6 in breast
cancer tissues.
3. To classify breast cancer cases by molecular subtypes (luminal A, luminal B (HER2
positive), luminal B (HER2 negative), HER2 positive, triple negative).
4. To analyze the associations between the novel immunohistochemical markers,
molecular subtype and known prognostic factors (pT, pN and grade) as well as
survival.

10
5. To establish the immunohistochemical markers that can be recommended as an
adjunct to routinely detected markers.
Scientific assumptions or working hypotheses:
Proteins that are involved in the cardinal tumour features as cell proliferation
and cell cycle control (cyclin D1), evasion of apoptosis (BCL2 oncoprotein),
angiogenesis (cyclooxygenase-2) and expression of oncoproteins due to mutations in
proto-oncogenes (p53) can have pathogenetic significance as reflected by association
with certain morphological and molecular features. Molecular classification, as well as
research-measurable immunohistochemical characteristics of breast cancer may have
prognostic value. In addition, the findings can provide insight into breast cancer
heterogeneity.
Scientific and practical diagnostic novelty
Within the frames of the present scientific work, five molecular markers with
equivocal published diagnostic and prognostic value are evaluated in a large and well-
characterised group of primary breast cancers. The findings will add evidence-based
knowledge to the published research data. Regionally, the study represents the largest
and widest morphological study of breast cancer. Regarding the recognised geographic
differences in the breast cancer incidence and morphology, the data present novel
findings.
The present work has facilitated the practical implementation of the molecular
classification of breast cancer into the regular diagnostic practice. The molecular
classification has been carried out in accordance with St. Gallen guidelines (2011) that
represent novel approach even in world medical practice.
Personal contribution
The author has performed all stages of the study, including the study design and
selection of the markers, the scientific measurements and statistical analysis. The author
performed immunohistochemical visualisation and is the author of the demonstrated
gross and microscopic photographs.
Ethical concerns
The study was approved by the Committee of Ethics, Riga Stradiņš University.

11
1. LITERATURE REVIEW
Breast cancer is the most frequent malignant tumour in female [Jemal et al.,
2011]. The morbidity and mortality continue to increase, despite remarkable
progression of early diagnosis and adjuvant therapy. In 2011, there were 1235 new
cases of invasive breast cancer in women of Latvia, and mortality was 39.7 per 100 000
females [spkc.gov.lv, accessed 15.08.2012.]. Figure 1.1. shows the growing number of
new cases of breast cancer in Latvia per year; the other most frequent malignant
tumours are shown for comparison as well.
Similarly, breast cancer is among the most frequent malignant tumours in many
developed countries. Breast cancer is one of the most common malignant tumours in the
European population and the most frequent malignancy in female [Bombonati and
Sgroi, 2011]. In USA, over 200 000 new cases of invasive breast cancer were reported
in 2011 and approximately 40 000 women died of the disease during that time period
[de Santis et al., 2011].
Figure 1.1. The number of new cases / per year of the most frequent malignant tumours in
Latvia.
Previously, pathologic diagnosis was the “gold standard” in determination of the
microscopic subtype and grading. Later it was found that breast tumours with similar

12
histopathological appearance (Figure 1.2.) can exhibit different clinical presentations,
disease aggressiveness, response to treatment and outcome.
Figure 1.2. Histological types of breast cancer. A, High-grade ductal cancer.
Haematoxylin-eosin (HE), original magnification (OM) 100x. B, Membranous expression
of E-cadherin in ductal cancer confirming the histogenesis even in high-grade case.
Immunoperoxidase (IP), anti-E-cadherin, OM 100x. C, Lobular carcinoma. HE, OM 100x.
D, Lack of E-cadherin in lobular carcinoma. IP, anti-E-cadherin, OM 100x. E, Mucinous
cancer. Note the abundance of mucus (star) and lower amount of neoplastic cells (arrow).
Masson trichrome, OM 100x. F, Medullary cancer. Note the presence of lymphoid follicle
(star) as well as neoplastic growth (arrow). HE, OM 50x. Microphotographs by A.Abolins.

13
Nowadays the routine morphological diagnostics of breast cancer involves
immunohistochemical investigation to classify the cases into homogeneous groups by
objective evidence. The loss of actin-positive myoepithelial cell layer is useful to
distinguish invasive breast cancer from benign proliferations [Walker et al., 2012; Lee,
2013]. Expression of E-cadherin is present in ductal cancer and can be employed in the
differential diagnostics with lobular breast cancer that is mostly negative for E-cadherin
[Abdollahi et al., 2011; Walker et al., 2012; Arps et al., 2013; Rakha et al., 2013].
The differences in morphology had insufficient prognostic and predictive power
for the current classification of breast cancer. Systematic investigation of gene
expression patterns and their correlation with specific features of phenotypic diversity
changed the way of classifying breast carcinoma at the molecular level. Analysis of
gene expression profiling and immunophenotypic characteristics suggests that breast
cancer is not a single entity but a heterogeneous disease, composed of a growing
number of recognized biological subtypes. “Molecular portraits” of human breast
tumours were recently developed through hierarchical clustering of genes on the basis
of similarity in the expression pattern. Breast cancers were categorized into at least four
main groups which differ markedly by incidence within distinct races/ ethnicities,
distribution of risk factors, prognosis, therapeutic treatment responsiveness, clinical
outcomes and both overall survival (OS) and relapse-free survival (RFS) as decribed by
Spitale et al., 2009. Some authors have classified the breast cancer in five groups
[Voduc et al., 2010; Irigoyen et al., 2011]. The main breast cancer subtypes include
luminal cell-like tumours, subdivided into luminal A and B (both expressing ER and
showing similar molecular profiles to those of normal luminal cells of breast glands),
basal cell-like or triple negative phenotype cancers (ER, PR and HER2 negative
tumours with genes usually expressed by basal/ myoepithelial cells) and HER2 positive
tumours (amplification of the HER2/neu gene). The fifth group was unclassified/
normal breast-like, described in several articles [Carey et al., 2007; Millikan et al.,
2008; Raica et al., 2009].
Breast cancer subtypes can be defined by genetic array testing [Perou et al.,
2000; Parker et al., 2009] or approximations to this classification using
immunohistochemistry as shown in Figure 1.3 [Nielsen et al., 2004; Cheang et al.,
2009; Blows et al., 2010]. These subtypes have different epidemiological risk factors
[Millikan et al., 2008; Phipps, Chlebowski et al., 2011], different natural histories
[Liedtke et al., 2008; Phipps, Buist et al., 2011], and different responses to systemic and

14
local therapies [Nguyen et al., 2008]. These differences imply that clinicians managing
breast cancer should consider cases within the distinct subtypes in order to arrive at
appropriate therapeutic conclusion. In general, the recommendations are intended to
guide therapy considerations outside clinical trials in communities with reasonable
levels of available resources. Remarkably, in appropriate situations it is wise to note the
availability of alternatives, which might be only marginally less effective but less
expensive [Goldhirsch et al., 2011].
Figure 1.3. Molecular subtypes of breast cancer. A-C, Luminal breast cancer: A,
Oestrogen receptor expression; B, Lack of HER2 protein; C, Low proliferation fraction.
D-F, HER2 overexpressing breast cancer: D, Lack of oestrogen receptors; B, HER2
protein overexpression; C, Moderate proliferative fraction. G-L, Triple negative breast
cancer: G, Lack of hormone receptors; K, Lack of HER2 protein; L, High proliferative
fraction. Immunoperoxidase; A, D and G, Anti-oestrogen receptor alpha; B, E and K,
HercepTest; C, F and L, Anti-Ki-67. OM 100x (B, G-L) and 400x (A, C-F).
Microphotographs by A.Abolins.

15
1.1. Molecular subtypes of breast cancer
Analysis of gene expression arrays has resulted in the recognition of several
fundamentally different subtypes of breast cancer [Perou et al., 2000]. Because it is not
always feasible to obtain gene expression array information, mainly due to financial
reasons, a simplified classification, closely following that proposed by Cheang et al.
[Cheang et al., 2009], has been adopted as useful shorthand. Subtypes defined by
clinico-pathological criteria are similar to but not identical to intrinsic subtypes and
represent a convenient approximation. This approach uses immunohistochemical
detection of ER and PR, the detection of overexpression of HER2 protein and/ or
amplification of the corresponding gene – HER2/neu oncogene, and Ki-67 labelling
index, a marker of cell proliferation, as the means of identifying tumour subtypes
(Figure 1.3.). Ki-67 labelling index presents more substantial challenges, but important
guidelines for this test are under development. Initially, Ki-67 was not included between
markers by which breast cancer molecular subtypes were determined [Viale, Regan et
al., 2008; Cheang et al., 2009; Raica et al., 2009; Dowsett et al., 2011].
1.1.1. Luminal-like breast carcinoma
Luminal breast cancer is characterized by the expression of ER and/or PR in the
background of high, low or any Ki-67 and positive or negative HER2. Additional
markers like GATA3, BCL2 oncoprotein (BCL2) and cytokeratin (CK) 8/18 were
previously searched for in the luminal type. At present, the definition of the luminal
subtype is independent on other markers like the CK 5/6 and epidermal growth factor
receptor (EGFR), but the expression of these markers may be found in some cases.
According to positivity or negativity of HER2 and the degree of cellular
proliferation, luminal breast cancers can be divided in two distinct groups: luminal A
and luminal B.
Luminal A
The typical immunohistochemical profile of luminal type breast cancer is ER
positive and/or PR positive, and HER2 negative. Based on the molecular profile, all
cases with pure lobular carcinoma in situ represent luminal A tumours [Millikan et al.,

16
2008]. Consecutively, the large majority of invasive lobular carcinomas have a profile
characteristic for luminal A. Depending on literature, luminal A subtype comprises 56-
61% of cases and tend to have the most favourable long-term survival [Zaha et al.,
2010]. Many of the genes found in luminal A breast carcinoma are typically expressed
in the luminal epithelium that lines the ducts [Raica et al., 2009; Millikan et al., 2008].
Luminal B
Previously, luminal B molecular subtype included all breast cancer cases, which
immunohistochemically coexpressed hormone receptors (ER and/or PR) and HER2.
This group comprises 9-16% of all cases and is associated with more aggressive nature
than luminal A. Luminal B breast cancers include high grade tumours and are
associated with lower long-term survival [Zaha et al., 2010]. Initially, Ki-67 was not
included in the criteria defining this subtype [Spitale et al., 2009].
According to recent modifications in the surrogate classification of intrinsic
breast cancer subtypes, luminal B group is divided in two parts: luminal B (HER2
negative) and luminal B (HER2 positive). Luminal B (HER2 negative) subtype includes
all cases with ER and/or PR positivity, HER2 negativity and high Ki-67, but luminal B
(HER2 positive) subtype includes breast cancer cases with positive ER and/or PR in
connection with positive HER2 and any Ki-67 level [Goldhirsch et al., 2011].
1.1.2. HER2 positive type (non luminal)
The HER2 positive type is characterised by lack of ER and PR expression by
immunohistochemistry in association with HER2 overexpression or HER2/neu gene
amplification by fluorescent in situ hybridisation (FISH).
The frequency of HER2 positive subtype is 8-16%. The HER2 positive subtype
includes two distinct subtypes based on the expression of ER: ER-negative that cluster
near the basal-like tumours (HER2 positive ER negative subtype), and ER (may also
express PR) positive as in luminal B subtype [Raica et al., 2009]. In the majority of the
cases, p53 is not expressed, and the expression of CK 8/18 is heterogeneous and
moderate. If positive, reaction for EGFR is focal and restricted to less than 5% of
tumour cell population. HER2 type is frequently associated with ductal carcinoma in

17
situ (DCIS), many cases have high grade and are characterized by poor prognosis
[Raica et al., 2009; Zaha et al., 2010].
1.1.3. Normal breast-like type/unclassified breast cancer
The frequency of normal breast-like type/unclassified breast cancer is 6-10%.
Basal cells in the normal breast duct immunohistochemically stain with CK 5/6, but
luminal cells express CK 8/18 [Millikan et al., 2008]. Basal cells represent a mixture of
different cell types with high proliferative potential, but luminal cells are more
differentiated. Whether these cell types include a stem cell population capable of self-
renewal is still unknown.
Normal breast-like cancer mainly is a triple negative tumour and is close to
basal-like carcinoma in terms of the molecular profile. Regarding the
immunohistochemical profile, outcome and survival, these tumours also are close to the
basal-like breast cancer. Nuclear grade is higher than in luminal breast cancer types, as
is the mitotic index. The unclassified type is negative for all five markers: ER, PR,
HER2, CK 5 and EGFR. It has a slightly better prognosis than basal-like type, and does
not respond to neoadjuvant therapy. It is important to point out that the term
‘unclassified’ within the frames of this classification is not synonymous with ‘not
otherwise specified’ [Zaha et al., 2010].
1.1.4. Basal-like breast carcinoma
Basal-like breast cancer (8 to 20% of breast cancer cases) lacks ER, PR and
HER2 expression, but express CK 5/6 and/or EGFR [Rakha et al., 2007] in gene
microarray analyses or by immunohistochemistry. The term “basal-like cancer”
describes a molecular phenotype initially defined using complementary
deoxyribonucleic acid (DNA) microarrays, whereas “triple negative” is a term based on
clinical assays for ER, PR, and HER2 [Perou et al., 2000, Sørlie et al., 2001]. Although
most triple negative breast tumors cluster within the basal-like subgroup, these terms are
not synonymous; there is up to 30% discordance between the two groups [Nielsen et al.,
2004]. There are no specific hallmark features on routine histopathological slides that

18
help to identify these tumours, although some common morphological traits are
described. The basal-like cancer is frequently associated with solid architecture, pushing
borders, prominent lymphocyte infiltration, scant stroma, high grade, high nuclear/
cytoplasmic ratio, high mitotic index and presence of necrosis, especially comedo type
necrosis [Winter, 2008; Popovska et al., 2010]. It is more frequent in premenopausal
patients [Carey et al., 2006]. Basal-like cancer shows a high rate of p53 mutations and
is common among BRCA1 mutation carriers [Raica et al., 2009]. A high proportion
(90.8%) of basal-like tumours presents with metaplastic features [Reis-Filho, Milanezi
et al., 2006]. The metaplastic breast cancer shows positive reaction for EGFR, CK 5/6,
CK 14, CK 17, and p63 in the majority of cases. By immunohistochemical panel, 93.8%
metaplastic breast cancer can be classified as basal-like tumours [Vincent-Salomon et
al., 2007].
Majority of medullary cancer cases fall into this subtype as well [Reis-Filho,
Milanezi et al., 2006]. Based on genetic and immunohistochemical analysis, medullary
carcinoma seems to be a subtype of basal-like type, based on the triple negative
character and CK 5/6 expression [Vincent-Salomon et al., 2007].
Many but not all basal-like tumours stain for both CK 5/6 and CK 8/18. Almost
half of basal-like tumours consist of a mixture of CK 5/14 positive and negative tumour
cells [Raica et al., 2009]. Specific markers of the myoepithelial cells (smooth muscle
actin, p63, cluster of differentiation (CD) 10) are not frequent and not substantial to
characterize this subtype of tumour [Winter, 2008].
The DCIS associated to invasive basal-like carcinoma shows the same
immunophenotype as the invasive tumour, and this provides evidence for early in situ
precursor lesion [Raica et al., 2009]. In these cases, P-cadherin is expressed in 75%, and
can be considered a good additional marker for basal-like DCIS. DCIS that is associated
with basal-like cancer has solid, flat or micropapillary structure, high nuclear grade and
necrosis. The absence of atypical ductal hyperplasia and small quantities of DCIS can
be explained by rapid growth of tumour [Banerjee et al., 2006].
The basal-like cancers less frequently disseminate in axillary lymph nodes, liver
and bones, and develop metastatic deposits in the brain and lungs [Hicks et al., 2006;
Tischkowitz et al., 2007; Onitilo et al., 2009]. Basal-like carcinoma is associated with
higher rate of recurrence and of cancer-related death, independently of lymph node
status and tumour size [Tischkowitz et al., 2007]. Adjuvant anthracyclin based
chemotherapy is less effective in case of basal-like carcinoma.

19
1.1.5. Triple negative breast cancer phenotype
Triple negative phenotype includes all breast cancers that lack ER, PR, HER2,
CK 5/6 and EGFR expression by gene and immunohistochemical analyses. Triple
negative breast cancer represents 10 to 17% of all breast cancers [Tan et al., 2008;
Foulkes et al., 2010]. The prevalence of triple negative tumours is 15-23% in patients
under the age of 40, 16-30% for patients aged 40-49, and 11-54% for patients over 50
years [Raica et al., 2009; Thike et al., 2010]. The evaluation of the molecular profile in
large series has demonstrated that triple negative tumours fall into the basal-like and
unclassified tumours. The diagnosis of these tumours has the advantage that these three
stains (ER, PR and HER2) are already routinely used in immunohistochemistry to guide
the therapeutic strategy. The aggressive character of this type of tumour is demonstrated
by the recurrences that occur between 1 and 3 years, and the majority of deaths occur in
the first 5 years, following therapy [Zaha et al., 2010]. The unfavourable prognosis is
also supported by the fact that the majority of triple negative cases are predominantly of
histological grade 3, up to 77%-96.8% of cases [Tan et al., 2008; Foulkes et al., 2010;
Thike et al., 2010; Zaha et al., 2010]. Triple negative tumours form a heterogeneous
group, and 56 to 84% of them express CK 5/6 and EGFR.
Approximately 80% overlap between triple negative and intrinsic basal-like
subtype but triple negative breast cancer also includes some special histological types
such as (typical) medullary and adenoid cystic carcinoma with low risk of distant
recurrence [Goldhirsch et al., 2011].
1.2. Relation between molecular classification and adjuvant treatment
Considering the wide spectrum of treatment possibilities for breast cancer, it is
important to choose appropriate options avoiding both over-treatment and under-
treatment. However, treatment failure occurs in approximately 30% of patients [Andre
and Pusztai, 2006]. ER positive cases are treated with hormone therapy, but respond
poorly to chemotherapy. The response of ER negative patients to chemotherapy is not
uniform necessitating more exact predictive subdivision [Raica et al., 2009]. In the
HER2 positive cases, the treatment with trastuzumab significantly improves the
prognosis and, combining with chemotherapy, it induces a remarkable reduction in the
20
relapse rate. However, not all HER2-positive cases respond to trastuzumab therapy;
resistance may be induced by phosphatase and tensin homolog loss or CD184 up
regulation.
Anthracycline-based chemotherapy has become a standard treatment. Data about
the efficacy of preoperative chemotherapy in relation to the molecular classification are
still controversial. It has been reported that the molecular subtype predicts the response
to preoperative chemotherapy [Raica et al., 2009] but other researchers have found only
ER status to be useful [Conforti et al., 2007]. Basal-like and HER2 tumours are more
sensitive to neoadjuvant anthracycline based chemotherapy than luminal types [Carey et
al., 2006]. Up to 45% of basal-like tumours show complete response after 12 weeks of
paclitaxel followed by neoadjuvant chemotherapy with 5-fluorouracil, doxorubicin and
cyclophosphamide. In the study by Sotiriou et al., basal-like and HER2 types were
associated with the highest rate of pathological complete response (45% for both), but
luminal type showed a lower rate of complete response (6%). In the normal breast-like
type, no complete response was noticed. Thus, the molecular profile as detected before
surgery was useful in the prediction of response to chemotherapy [Sotiriou et al., 2002].
Unfortunately, none of the biomarkers is strongly predictive of chemotherapy response
in cases with metastatic disease, but survival seems to be dependent on the hormone
receptor and p53 status [Pusztai et al., 2006].
Targeted therapy became largely applied in the last decade. EGFR tyrosine
kinase inhibitors might be a useful option and clinical trials have been initiated, based
on gefitinib and erlotinib. A subset of basal-like carcinoma expresses CD117 and is
associated with better prognosis, and therefore, targeted therapy could be initiated. Until
now, only disappointing breast cancer response rates were reported. CD117 positive
tumours usually fall into the category of basal-like carcinoma and patients were treated
with imatinib or sunitinib. The efficacy of targeting CD117 will probably depend on its
prevalence in the tumours and its role as predictive marker of response (both aspects are
largely unknown). Recently, it was shown that anti-vascular endothelial growth factor,
bevacizumab, improves survival in metastatic breast cancer when combined with
paclitaxel [Raica et al., 2009]. More than 60% of cases in this study were hormone
receptor positive and none was HER2-positive, suggesting that antiangiogenic strategies
may be effective in the luminal type tumours. It becomes clear that there is a need to
identify new specific therapeutic targets. Only by using the best of the old classic

21
approach and the best new possibilities, the maximal therapeutic benefit will be ensured
with the least possible risk of adverse side effects.
1.3. Future directions and perspectives in breast cancer classification
The molecular classification brought new insights into the biology and
behaviour of breast cancer. At present time, at least four types of breast cancers are
characterized by gene analysis and five - based on immunohistochemical profile.
Despite the fact that this classification correlates with prognosis, there are still many
questions to be answered. The first of them is related to the possibility to replace the
conventional morphologic classification. At present, the answer is probably negative,
because some types are not fully characterized and it is very probable that some of them
(e.g. basal-like and unclassified) include different subtypes. Moreover, such a change
may create confusion, mainly because some types are not completely characterized. A
good example is represented by the expression of EGFR and CD117 that could
represent viable targets for therapy, both found in some but not all cases with basal-like
carcinoma. Results on their immunohistochemical expression are still controversial.
1.4. Prognostic and predictive factors in breast cancer
Breast cancer is a heterogeneous disease with variable morphological
appearances, molecular features, behaviour, and response to therapy. Current routine
clinical management of breast cancer relies on the availability of robust clinical and
pathological prognostic and predictive factors to support decision making regarding the
choice between the growing ranges of potentially suitable treatment options [Weigel et
al., 2010]. A prognostic factor is any measurement available at the time of surgery that
correlates with disease-free survival (DFS) or OS in the absence of systemic adjuvant
therapy and, as a result, is able to correlate with the natural history of the disease. In
contrast, a predictive factor is any measurement associated with response to a given
therapy [Cianfrocca et al., 2004]. Breast cancer treatment has experienced several
changes in the past decades due to the discovery of specific prognostic and predictive
biomarkers that enable the application of more individualized therapies to different

22
molecular subgroups. These subgroups show specific differences regarding biological
clinical behaviour. In addition to the classical clinical prognostic factors of breast
cancer, established molecular biomarkers such as ER and PR play a significant role in
the selection of patients benefiting from endocrine therapy. These markers also are
shown to have prognostic role [Rossner et al., 2009; Weigel and Dowsett, 2010; Jung et
al., 2011; Gaur, 2013]. More recently, the HER2 has been validated to be not only a
prognostic factor, but also a predictor of response to HER2 targeting therapy [Rakha et
al., 2010; Weigel and Dowsett, 2010].
In the last few decades, proliferative markers have been evaluated as prognostic
and predictive factors for early stage breast cancer patients. Several papers evaluating
one or more markers have been published, often with contradictory results. As a
consequence, there is still uncertainty about the value of these markers.
Colozza et al. critically reviewed the current knowledge about the following
markers: thymidine labeling index, S phase fraction/flow cytometry, Ki-67, thymidine
kinase, cyclins E, cyclin D, the cyclin inhibitors p27 and p21, and topoisomerase IIa.
For each marker, the prognostic and predictive role was separately analysed. In
addition, the prognostic and predictive role of the markers had to be assessed through
multivariate analyses. One hundred and thirty-two papers fulfilled these criteria and
159516 patients were analysed. Unfortunately, several methodological problems
prevented from including any one of these proliferative markers among the standard
prognostic and predictive factors [Colozza et al., 2005]. Several recent reviews have
summarised the present knowledge regarding biomarkers in breast cancer; however,
controversies still are identified [Weigel and Dowsett, 2010; Gaur, 2013].
The shift towards an earlier diagnosis of breast cancer due to improved imaging
methods and screening programs highlight the need for new factors and combinations of
biomarkers to quantify the residual risk of patients and to indicate the potential value of
additional treatment strategies. The role of proliferation marker Ki-67 has been recently
emphasised due to several applications in neoadjuvant therapy in addition to its
moderate prognostic value.
The Ki-67 antigen is used to evaluate the proliferative activity of breast cancer.
In order to better define the prognostic value of Ki-67, de Azambuja et al. performed
meta-analysis of studies that evaluated the impact of Ki-67 on DFS and/or on OS in
early breast cancer. Sixty-eight studies were identified and 46 studies including 12 155
patients were included in the meta-analysis. Thirty-eight studies were suitable for the

23
aggregation of results for DFS, and 35 studies – for OS. Patients were considered to
have Ki-67 positive tumours according to the cut-off points defined by the authors. Ki-
67 positivity was associated with higher probability of relapse in all patients (hazard
ratio (HR) =1.93; 95% confidence interval (CI) =1.74-2.14; P<0.001), in node-negative
patients (HR=2.31; 95% CI=1.83-2.92; P<0.001) and in node-positive patients
(HR=1.59; 95% CI=1.35-1.87; P<0.001). Furthermore, Ki-67 positivity was associated
with worse survival in all patients (HR=1.95; 95% CI=1.70-2.24; P<0.001), node-
negative patients (HR=2.54; 95% CI=1.65-3.91; P<0.001) and node-positive patients
(HR=2.33; 95% CI=1.83-2.95; P<0.001). Meta-analysis suggested that Ki-67 positivity
confers a higher risk of relapse and is associated with worse survival in patients with
early breast cancer [de Azambuja et al., 2007].
Viale et al. evaluated the prognostic and predictive value of Ki-67 labeling
index in a trial comparing letrozole with tamoxifen as adjuvant therapy in
postmenopausal women with early breast cancer. Higher values of Ki-67 were
associated with adverse prognostic factors and with worse DFS (hazard ratio [HR; high:
low] = 1.8; 95% CI=1.4-2.3). The magnitude of the treatment benefit for letrozole
versus tamoxifen was greater among patients with high tumour Ki-67 labeling index
(HR [letrozole: tamoxifen] = 0.53; 95% CI=0.39-0.72) than among patients with low
tumour Ki-67 (HR [letrozole: tamoxifen] = 0.81; 95% CI=0.57-1.15; interaction
P=0.09). Thus, authors confirmed Ki-67 as a prognostic and predictive factor [Viale,
Giobbie-Hurder et al., 2008].
In more recent studies, the role of Ki-67 has been reconfirmed [Ryu and Lee,
2012]. Recently, international panel of experts developed recommendations on
preanalytical and analytical assessment as well as on interpretation and scoring of Ki-67
[Dowsett et al., 2011].
Thus, molecules that are used routinely to make treatment decisions in patients
with breast cancer include hormone receptors, markers of proliferation (e.g. Ki-67) and
the HER2. With the introduction of high-throughput technologies, numerous multigene
signatures have been identified that outperform traditional markers: current prospective
clinical trials are seeking evidence for their definitive role in breast cancer. There exist
many more factors and approaches that have the potential to become relevant in the near
future including the detection of single disseminating and circulating tumour cells in
blood and bone marrow as well as of circulating cell-free micro ribonucleic acid (RNA)
and DNA [Rakha et al., 2010].

24
By multidisciplinary group of clinicians, pathologists, and statisticians, different
prognostic and predictive factors in breast cancer have been stratified into categories
reflecting the strength of published evidence. Factors were ranked according to
previously established College of American Pathologists (CAP) categorical rankings:
category I, factors proven to be of prognostic value and useful in clinical patient
management; category II, factors that had been extensively studied biologically and
clinically, but whose importance remains to be validated in statistically robust studies;
and category III, all other factors not sufficiently studied to demonstrate their prognostic
value. Factors in categories I and II were considered with respect to variations in
methods of analysis, interpretation of findings, reporting of data, and statistical
evaluation. Category I included classification of malignant tumours (TNM) staging
information, histologic grade (G), histologic type, mitotic figure counts, and hormone
receptor status. Category II factors included HER2 (HER2/neu gene amplification),
proliferation markers, lymphatic and vascular channel invasion and p53. Factors in
category III included DNA ploidy analysis, microvessel density, EGFR, transforming
growth factor-α, BCL2 oncoprotein, pS2, and cathepsin D [Fitzgibbons et al., 2000].
The scope of markers that have been analysed for hypothetic predictive and/or
prognostic role in breast cancer include cyclooxygenase-2 [Kang et al., 2011; Kim et
al., 2012], interleukins and chemokine receptors [Liu et al., 2010; Iliopoulos et al.,
2011], p53 [Rossner et al., 2009; Malhotra et al., 2010; Jung et al., 2011; Millar et al.,
2011], p27 [Wander et al., 2011], p16 [Kröger et al., 2006], cyclin A [Aaltonen et al.,
2009; Boström et al., 2009], cyclin D1 [Esteva et al., 2004; Aaltonen et al., 2009;
Boström et al., 2009; Li et al., 2011; Yu et al., 2012], cyclin E [Esteva et al., 2004;
Aaltonen et al., 2009; Boström et al., 2009], cytokeratin 5/6 [Li et al., 2011], cathepsin
D [Esteva et al., 2004; Bradley et al., 2007], maspin [Kröger et al., 2006], microvessel
density [Bradley et al., 2007], urokinase-like plasminogen activator/ plasminogen
activator inhibitor [Esteva et al., 2004] and apoptosis-related factors including BCL2
oncoprotein [Won et al., 2010; Hwang et al., 2012; Yu et al., 2012; Zaha and Lazar,
2012]. Several studies have been devoted to EGFR [Hadžisejdić et al., 2010; Liu et al.,
2010; Rimavi et al., 2010]. Androgen receptors have been studied extensively
[Gonzalez-Angulo et al., 2009; Park et al., 2010; Hu et al., 2011]. Caveolin has been
evaluated in the tumour stroma [Koo et al., 2011]. Nestin and claudin-4 have been
associated with poor prognosis [Lanigan et al., 2009; Piras et al., 2011]. Cullin-1 has
recently been analysed as possible therapeutic target and marker of poor prognosis [Bai

25
et al., 2013]. Both E-cadherin [Querzoli et al., 2010] and actin [Yamashita et al., 2012]
have been evaluated for prognostic role in addition to the routine diagnostic importance
[Abdollahi et al., 2011; Walker et al., 2012].
Cyclin D1, BCL2 oncoprotein, p53 protein and COX-2 cause major scientific
and practical interest as these proteins are involved in the cardinal tumour features: cell
proliferation and cell cycle control, evasion of apoptosis, expression of oncoproteins
due to mutations in proto-oncogenes and angiogenesis. These biomarkers will be
discussed in more detail in the subsequent sections.
1.4.1. Expression of oncoprotein p53
p53 is a nuclear phosphoprotein with a molecular mass of 53 kilodaltons (kDa).
Wild-type p53 protein is present in a wide variety of normal cells, but the protein has a
very short half-life and thus is present in only minute amounts, generally below the
detection level of immunohistochemical methods. Somatic mutation of the TP53 gene is
a very frequent event in the development of human neoplasia. Mutant p53 proteins often
are more stable than wild-type p53 protein; therefore the mutant p53 protein
accumulates to a high level. As examples, p53 protein accumulation was observed in
76% of 212 human malignant lesions, including breast, colon and stomach carcinomas,
melanoma, embryonic carcinoma of the testis, transitional carcinoma of the urinary
bladder, uterine carcinoma and soft tissue sarcomas. Wild-type p53 protein functions as
a transcription factor, i.e., as a modulator which can turn crucial genes either on or off.
It also inhibits DNA replication and is a check-point control molecule for progression of
the cell cycle. Furthermore, p53 protein is involved in the regulation of apoptosis. The
wild-type p53 protein protects cell from neoplastic transformation by multiple
mechanisms. In short, if cell has experienced DNA damage, p53 protein undergoes
post-transcriptional modification that releases it from the binding protein homolog
murine double minute 2 (MDM2), a protein that normally stimulate the destruction of
p53. The released p53 becomes a transcription factor and the cell cycle is arrested. If the
DNA damage can be repaired, the cell cycle reverts to normal progress. Otherwise, the
cell is subjected either to senescence or death by apoptosis [Wei et al., 2006; Riley et
al., 2008]. At least part of the wide function spectrum of p53 is realized through
microRNA34 [He et al., 2007]. In transfection assays, wild-type p53 behaves as a

26
tumour suppressor, while mutant p53 behaves as a dominant transforming oncogene.
Cells labelled by the antibody generally display a nuclear staining pattern, but
cytoplasmic staining has been reported in some cases [Dako Denmark A/S, M7001] and
can be biologically true phenomenon explained by monoubiquitination induced by
different MDM2 levels [Brooks et al., 2004].
Nearly one third of breast cancers have mutations of the tumour suppressor gene
TP53, which are associated with high histologic grade and clinical aggressiveness.
Since part of the mutations result in prolonged half-life and protein accumulation,
immunohistochemical detection of p53 can be used as a surrogate for mutational
analysis. Immunostaining should be considered a screening method for TP53 mutation,
as some cases have neither protein overexpression nor an increased half-life [Alsner et
al., 2008]. The reported frequencies of p53 protein expression in breast cancer have
been as high as 54% and as low as 20% [Göhring et al., 1995; Sjögren et al., 1996;
Bidard et al., 2008]. However, several studies using immunohistochemistry and TP53
gene analysis have found remarkably similar estimates of p53 protein overexpression or
gene mutation: 29.0% (by IHC), 29.0% (by IHC), 29% (by sequencing) and 29.6% (by
IHC), respectively [Yamashita et al., 2004; Rolland et al., 2007; Alsner et al., 2008; Al-
Joudi et al., 2008]. Marchetti et al. used polymerase chain reaction (PCR) single strand
conformation polymorphism assay to assess TP53 mutations in invasive breast
carcinoma. A strong correlation (P<0.001) was observed between TP53 mutations and
nuclear accumulation of the p53 protein: 10 tumours were scored positive for both TP53
mutation and overexpression. However, in 9 cases having a mutated TP53 gene the
researchers failed to find positive immunoreactions [Marchetti et al., 1993].
The frequency of TP53 mutations in different publications clusters close to 15-
17% of patients [Soontrapornchai et al., 2007; Rossner et al., 2009; Fernández-Cuesta
et al., 2012]. The TP53 gene mutations in breast cancers appear to cluster in exons 5
through 9. Studies of mutation based on genetic sequencing have been limited because
of the molecular complexity of this large gene. Sequencing studies of breast cancer are
often limited to the exon sequences 5 through 9 because of the mutational hot spots that
have been identified there. Other methods to detect TP53 abnormalities include PCR
based amplification with screening for mutations using single strand conformational
polymorphism assays. New high-throughput sequencing technologies are developing.
Given the diverse functions of the TP53 gene and the location and type of genetic

27
abnormalities, the specific genetic lesion may have prognostic importance [Alsner et al.,
2008].
The p53 function can also be significantly influenced by expression of MDM2
protein as high levels of it induce p53 destruction [Onel and Cordon-Cardo, 2004;
Shmueli and Oren, 2004]. The binding of p53 protein by exogenous factors like E6
protein of human papilloma virus can result in loss of function as well [Chen, Huang et
al., 2012]. The levels of microRNA can be targeted by pathologic factors [He et al.,
2007].
While most TP53 abnormalities occur as somatic events, patients with germline
TP53 mutations (Li-Fraumeni syndrome) also have an increased incidence of breast
cancer [Nichols et al., 2001]. The breast cancer in Li-Fraumeni syndrome patients
represents invasive or in situ ductal cancer with virtual absence of other types. The
tumours are characterised by early origin (median age, 32 years), positivity for ER / PR
(84%), high grade (81%) and high rate of HER2 overexpression or gene amplification
[Masciari et al., 2012].
p53 appears to have prognostic and/or predictive value. However, consensus as
to the need for routine p53 immunostaining has not occurred. Some studies report
antigenic degeneration with time; therefore storage and fixation issues may be relevant.
Patients with p53-immunopositive cancers may develop autoantibodies against p53,
which have been used to detect or follow cancers [Anderson et al., 2010; Kulic et al.,
2010]. Array-based technologies that can screen for mutations in some regions of the
gene have become commercially available, but have not been widely adopted
[Fitzgibbons et al., 2000].
Several researchers have evaluated the immunohistochemical expression of p53
protein in relation to different principal features of breast cancer [Marchetti et al., 1993;
Göhring et al., 1995; Sjögren et al., 1996; Dublin et al., 1997; Megha et al., 2002;
Rolland et al., 2007; de Roos et al., 2007; Soontrapornchai et al., 2007; Al-Joudi et al.,
2008; Alsner et al., 2008; Bidard et al., 2008; Kim et al., 2010; Millar et al., 2011;
Dookeran et al., 2012; Fernández-Cuesta et al., 2012]. The structure of the most
relevant studies along with the size of patient’s group and short description of methods
is represented in Table 1.1., but the main findings and conclusions will be analysed
subsequently.

Table 1.1.
Logistic and technological characteristics of selected studies devoted to p53 analysis in breast cancer tissues
Author Patients and materials Methods The analysed correlations
Marchetti et
al., 1993
148 invasive breast carcinomas,
selected by histotype (56 lobular,
47 ductal, 19 mucinous, 18
medullary, 8 papillary cancers).
PCR single strand conformation polymorphism assay
to detect TP53 mutations.
IHC for p53 overexpression in 122 tumours by
antibody PAb 1801.
Presence of TP53 mutation;
nuclear immunostaining for p53;
histologic type; Ki-67.
Göhring et al.,
1995
204 formalin-fixed, paraffin-
embedded biopsies of primary
breast carcinomas.
IHC for p53 protein by antibody PAb 1801.
The influence of p53 expression on prognosis in 197
patients (T1-4 N0-2 M0, median observation time 72
months).
Tumour grade; patient’s
menopausal status; age; tumour
size; axillary lymph node
involvement; ER/ PR status;
disease-free survival.
Sjögren et al.,
1996
316 primary breast tumours. IHC by mouse monoclonal antibody Pab 1801 (that
recognizes both wild-type and mutant forms of p53).
Screening of entire coding region of p53 gene by
reverse transcription, PCR and DNA sequencing.
Kaplan-Meier method, log-rank test.
Overall survival; breast cancer-
corrected survival; death from
breast cancer; RFS.
Dublin et al.,
1997
277 women with node-positive
primary breast cancer.
The randomisation: either 6 cycles of
cyclophosphamide/ methotrexate/ 5-fluorouracil or no
treatment after tumour excision and axillary clearance.
IHC for p53 protein.
Follow-up: data available on all patients (median, 9
years).
Survival; treatment response.
Megha et al.,
2002
37 cases of in situ and 27 cases of
invasive ductal breast carcinoma.
IHC for the expression of the p53 and BCL2 proteins.
Polymerase chain reaction single strand conformation
polymorphism analysis for p53 gene mutation.
Phenotypic characteristics and
cellular kinetic parameters
(mitotic and apoptotic indices).
28

29
Table 1.1. (continued)
Yamashita et
al., 2004
506 patients with invasive ductal
carcinoma (1981 – 1999).
IHC for HER2, p53, and Ki-67.
Survival analysis with median follow-up 82 months.
Disease free and overall survival.
Rolland et al.,
2007
819 cases of resected primary
breast cancer (1986 – 1998).
Tissue microarray;
IHC by anti-p53 (clone DO-7) and BCL2 (clone 124).
Statistics by univariate and multivariate (Cox’s
regression) analyses.
Clinico-pathological data; disease
specific survival; BCL2
expression.
de Roos et al.,
2007
Consecutive patients (July 1996 –
December 2001) treated for pure
ductal carcinoma in situ (110) and
invasive ductal carcinoma (243).
Tissue microarray application.
IHC for ER, PR, HER2/neu, p53, and cyclin D1.
Follow-up: median, 49.8 months.
Local recurrence. All analyses
were stratified for diagnosis (in
situ vs. invasive cancer) and
pathological grade.
Soontraporn-
chai et al.,
2007
71 node-negative breast
carcinomas.
IHC for p53 on formalin-fixed, paraffin-embedded
sections.
Tumour size; ER expression;
survival.
Al-Joudi et al.,
2008
382 cases of invasive ductal breast
carcinoma, treated in 3 major
hospitals in Malaysia.
IHC for the detection of p53 protein. Age; grade; lymph node status;
tumour size; side of tumour,
expression of ER / PR.
Alsner et al.,
2008
630 breast cancer patients from
the Danish Breast Cancer
Cooperative Group, protocols
DBCG82 and DBCG89.
IHC for p53; scoring based on staining intensity and
percentage of invasive tumour cells with nuclear
staining.
Sequencing to identify TP53 mutations.
Mutation; protein expression;
disease-specific survival.
29

30
Table 1.1. (continued)
Bidard et al.,
2008
293 breast cancer samples from
two different centres.
IHC for ER, PR, HER2 and p53.
Logistic regression for multivariate analysis of
predictors for pathological complete response.
Grade; ER / PR status; molecular
subtype; efficacy of preoperative
fluorouracil, anthracycline and
cyclophosphamide treatment by
p53 status and molecular
classification.
Kim et al.,
2010
125 patients having radiotherapy
after breast conserving surgery
and axillary lymph node
dissection; 87 patients had
adjuvant chemotherapy and/or
hormonal therapy.
IHC for p53 and BCL2 expression (100 patients). Conventional clinicopathologic
variables; treatment-related
factors.
Millar et al.,
2011
498 patients with invasive breast
cancer.
IHC for ER, PR, Ki-67, p53, HER2.
Kaplan-Meier and Cox proportional hazards test.
Ipsilateral recurrence;
locoregional recurrence; distant
metastasis-free survival; breast
cancer-specific survival.
Yang et al.,
2011
21 patients with inflammatory and
locally advanced breast cancer
receiving neoadjuvant
bevacizumab and chemotherapy.
IHC for p53, ER, PR, HER2, Ki-67, tumour apoptosis,
vascular endothelial growth factor, microvessel density
Cox proportional hazard analysis.
Survival; progression-free
survival.
Dookeran et
al., 2012
Consecutively treated 331 African
American and 203 non-African
American women affected by
breast cancer.
IHC for p53 protein.
Cox regression model.
Stage; grade; ER / PR status;
occurrence of triple negative
subtype; mortality due to all
causes.
30

31
Table 1.1. (end)
Fernández-
Cuesta et al.,
2012
BIG 02-98 randomized phase III
trial: women with node-positive
breast cancer, treated with
adjuvant doxorubicin-based
chemotherapy with or without
docetaxel.
TP53 gene status was determined for 18% (520 of
2887) of the women. TP53 gene sequencing within
exons 5 to 8. Patients were classified according to p53
protein status predicted from TP53 gene sequence, as
wild-type (no TP53 variation or variations which were
predicted not to modify p53 protein sequence) or
mutant (p53 non-synonymous mutations). Mutations
were subcategorized as missense or truncating.
Survival analyses by Kaplan-Meier method and log-
rank test; Cox-regression analysis to identify
independent predictors of outcome.
Age; morphology; grade and ER /
PR status.
Abbreviations in the Table: PCR, polymerase chain reaction; IHC, immunohistochemistry; ER, oestrogen receptors; PR, progesterone
receptors; DNA, deoxyribonucleic acid; RFS, relapse-free survival; HER, human epidermal growth factor receptor.
31

Regarding the characteristics of patients and tumours, the following findings
have been reported. The expression of p53 showed statistically significant correlation
with younger patient’s age and higher histological tumour grade [Al-Joudi et al., 2008;
Guarneri et al., 2010]. No correlation by p53 protein expression and patient’s age or
menopausal status was identified by Göhring et al., 1995. In contrast, non-synonymous
TP53 mutations, found in 16.3% of breast cancers, were associated with older age, but
confirmed the correlation with higher grade [Fernández-Cuesta et al., 2012]. In another
study, p53 immunostaining (54%) was associated with high cancer grade (P=0.002) as
well [Bidard et al., 2008]. The statistically significant correlation (P=0.013) between
p53 expression and loss of tumour differentiation has been described by Göhring et al.
already earlier [Göhring et al., 1995] and confirmed by Le et al., 1999 reporting
P=0.0001. The association between high grade and p53 expression was reported also by
Guarneri et al., 2010.
The expression of p53 has been associated with ductal morphology [Fernández-
Cuesta et al., 2012]. By PCR, the distribution of TP53 mutations was significantly
different (P=0.006) in the examined histotypes: mutations were frequent in medullary
(39%) and ductal (26%), less common in lobular (12%), and absent in mucinous and
papillary carcinomas. The frequency of mutations in the exon 5 of the TP53 gene was
significantly higher (P=0.012) in medullary carcinomas than in the other histotypes: 5
(63%) of the mutations found in exon 5 were observed in medullary carcinomas
[Marchetti et al., 1993].
An interesting study has highlighted the role of p53 pathway damage as an early
event in breast carcinogenesis specific for certain pathogenetic way. Megha et al.
compared TP53 mutations in breast cancer with phenotypic and differentiation markers.
Both ductal carcinoma in situ (DCIS) and invasive ductal carcinoma (IDC) with a stem
cell phenotype (expression of CK 8, CK 14, CK 18, vimentin, and EGFR) were p53
positive and BCL2 negative by immunohistochemistry. In IDC, p53 expression was
associated with a reduction of both mitotic index and apoptotic index compared with
DCIS. Most of the tumours showing a more differentiated luminal phenotype (CK 8 and
CK 14, weak or negative expression of CK18, negativity for vimentin and EGFR) were
p53 negative and BCL2 positive. In these cases, cell kinetic parameters increased from
DCIS to IDC. These data suggest the existence of subsets of DCIS and IDC that could
be derived from subpopulations of normal breast cells having different control
mechanisms of cell proliferation and neoplastic progression [Megha et al., 2002].
32

33
Several studies have failed to identify correlation between the expression of p53
protein and the size of tumour [Göhring et al., 1995; Soontrapornchai et al., 2007; Al-
Joudi et al., 2008; Alsner et al., 2008]. Naturally, there is no correlation between p53
expression and the side of breast cancer [Al-Joudi et al., 2008].
The association between p53 expression and lymph node status has been
evaluated by several research groups. No significant statistical correlations were found
regarding p53 expression and lymph node status by Göhring et al., 1995 and Al-Joudi et
al., 2008. In contrast, p53 expression has recently been associated with higher number
of lymph node metastases [Lialiaris et al., 2011]. The p53 expression along with other
biological markers did not appear to be helpful predictors of non-sentinel lymph node
metastasis in sentinel-node positive breast cancer patients [Kwon et al., 2011]. The
concordance of p53 expression in the primary tumour and lymph node metastases of
breast cancer is 85% [Sjöström-Matson et al., 2009].
The molecular portrait of p53 positive breast cancer shows association with
high-risk features [Guarneri et al., 2010]. However, the published data are controversial.
There was no correlation between the expression of ER and/or PR and p53 positivity
[Göhring et al., 1995; Soontrapornchai et al., 2007; Al-Joudi et al., 2008]. Non-
synonymous TP53 mutations were associated with hormone-receptor negativity
[Fernández-Cuesta et al., 2012]. The association between p53 immunostaining and ER
negativity (P=0.04) was confirmed by Bidard et al., 2008 and Le et al., 1999 reporting
P=0.0001 for the association. It has been suggested to apply p53 negativity as an
additional criterion for prognostically beneficial luminal A molecular subtype [Millar et
al., 2011]. A significant association (P=0.01) has been reported between mutations in
the TP53 gene and high proliferative activity of the tumours determined by
immunohistochemistry with monoclonal antibody Ki-67 [Marchetti et al., 1993].
A significant association was found between p53 status and survival by Dublin
et al. Patients with p53-positive tumours had a less favourable outcome than those with
p53 negative disease [Dublin et al., 1997; Guarneri et al., 2010]. The correlation
between p53 expression and survival was not confirmed by Soontrapornchai et al.,
2007.
The prognostic value of p53 protein has also been analysed in association with
other molecular markers and in specific groups of patients. The p53 status by
multivariate analysis showed high prognostic value in luminal breast cancer

34
[Jacquemier et al., 2009]. It was less valuable in high-risk breast cancer [Somlo et al.,
2008].
Knowing the ability of wild-type p53 to control the apoptosis, the relation
between p53 and BCL2 protein expression has been evaluated. The purpose of Rolland
et al. was to determine if the immunohistochemical p53 positive BCL2 negative
phenotype predicts survival in breast cancer patients. Abnormal p53 expression was
detected in 29% tumours. p53 expression correlated with the clinicopathological
features of aggressive cancers and a reduction in survival (log rank 17.81; P<0.001).
Nineteen percent of tumours displayed a p53+ / BCL2- phenotype. Kaplan-Meier
analysis revealed a significant reduction in survival in these cases (log rank 34.01;
P<0.001). Multivariate analysis showed that while neither p53 expression nor BCL2
expression alone had independent prognostic significance, the p53+ / BCL2- phenotype
remained independently associated with a worse prognosis as revealed by HR=1.79;
95% CI=1.10-2.89, P<0.018 [Rolland et al., 2007].
According to Yamashita et al., accumulation of p53 protein significantly
decreased disease free (P=0.01) and overall survival (P=0.01). Overexpression of HER2
also significantly reduced disease free survival (P=0.02) and overall survival (P=0.005).
Patients with tumours that were positive for both HER2 and p53 relapsed and died
within a significantly shorter period of time after surgery (P=0.0001 and P<0.0001,
respectively). In multivariate analysis, patients with both HER2 and p53 positive
tumours had considerably decreased overall survival (P=0.04), as did patients with
larger tumour size and positive lymph node status. The findings indicated that the
coexistence of HER2 over-expression and p53 protein accumulation is a strong
prognostic molecular marker in breast cancer [Yamashita et al., 2004].
In a retrospective study showing p53 expression in 38% of breast cancers,
detection of p53 protein was associated with a significantly longer disease-free survival
in node-positive women (P=0.03). However, p53 protein did not prove to be a
prognostic factor in node-negative patients [Göhring et al., 1995]. In contrast,
correlation between p53 positivity and worse prognosis was observed in lymph node-
positive breast cancer patients by Lara et al., 2011. Prognostic power of p53 expression
in node-negative breast cancer has been reported as well [Jung et al., 2011]. However,
contrary data are also available. Thus, p53 expression was not a significant prognostic
factor for survival in node-negative breast carcinoma [Soontrapornchai et al., 2007].

35
Regarding specific patient groups, higher prognostic value of p53 status in
women of African descent has been reported [Dookeran et al., 2012].
The value of p53 detection is retained in patients receiving treatment. Thus,
prognostic value of p53 regarding survival after neoadjuvant bevacizumab and
chemotherapy has been reported [Yang et al., 2011].
In 1000 high-risk breast cancer patients randomized to postmastectomy
radiotherapy p53 accumulation was not significantly associated with increased overall
mortality, distant metastases or locoregional recurrence in univariate or multivariate
Cox regression analyses [Kyndi et al., 2008]. Kim et al. evaluated the prognostic
significance of p53 and BCL2 expression in patients treated with breast conserving
surgery and radiotherapy. The 5 year loco-regional relapse-free and distant metastasis-
free survival rates were 91.7% and 90.9%, respectively. On univariate analysis, age, T
parameter and the absence of BCL2 and ER expression were associated with loco-
regional RFS. When incorporating these variables into Cox proportional hazard model,
only BCL2- / ER- phenotype was an adverse prognostic factor (P=0.018). As for the
distant metastasis-free survival, age, T stage, and p53 expression were significant on
univariate analysis. However, p53 expression remained the only significant prognostic
factor on multivariate analysis characterised by P=0.009 [Kim et al., 2010].
The p53 protein has also been evaluated as a predictive marker. Pre-clinical data
suggest p53-dependent anthracycline-induced apoptosis and p53-independent taxane
activity. Fernández-Cuesta et al. retrospectively explored the prognosis and predictive
values of TP53 somatic mutations. Non-synonymous TP53 mutations were found in
16.3% patients and included missense (12.3%) and truncating (3.6%) mutations. Only
truncating mutations showed significant independent prognostic value, with an
increased recurrence risk compared to patients with non-modified p53 protein
(HR=3.21, 95% CI=1.74-5.94, P=0.0002). p53 status had no significant predictive value
for response to docetaxel [Fernández-Cuesta et al., 2012].
Bidard et al. hypothesized that, among molecular subclasses of breast cancer,
p53 status may have a differential predictive value for the efficacy of
anthracyclines/alkylating agents-based regimen. p53 immunostaining was detected in
54% of all cases and 59% of triple-negative tumours. In the general patient group,
pathological complete response (9.6%) was independently predicted by high tumour
grade (P=0.002) and triple negativity (P=0.0004), but not by p53 status (P=0.12). p53
immunostaining was associated with a trend for a higher rate of pathological complete

36
response in triple negative tumours [relative risk (RR) = 2.5, 95% CI=0.8–7.5, P=0.09],
but not in non-triple negative tumours (RR=0.73, 95% CI=0.16–3.3, P=0.69). Thus, it
was concluded that p53 status may have a different predictive value for efficacy of
anthracycline/ alkylating agents-based regimen in each molecular subclass, a result
which may explain the different results reported in literature [Bidard et al., 2008]. In
contrast, adjuvant chemotherapy with cyclophosphamide/ methotrexate/ 5fluorouracil
was associated with a survival benefit in women with node-positive breast cancer
irrespectively of immunohistochemically determined p53 status [Dublin et al., 1997].
Guarneri et al. characterised p53 expression as significant predictor of pathologic
complete response following anthracycline and taxane based treatment [Guarneri et al.,
2010].
Contrary to Bidard et al., de Roos et al. evaluated biological markers that could
predict local recurrence following treatment for all stages of primary operable ductal
carcinoma of the breast. In univariate analyses, HER2/neu (HR=3.1, 95% CI=1.1-8.7,
P=0.032) and p53 overexpression (HR=3.5, 95% CI=1.3-9.3, P=0.014) were associated
with local recurrence both in patients treated for in situ and invasive ductal cancer. In
multivariate analysis, p53 overexpression (HR=3.0, 95% CI=1.1-8.2, P=0.036 and
HR=4.4, 95% CI=1.5-12.9, P=0.008) and adjuvant radiotherapy (HR=0.2, 95% CI=0.1-
0.8, P=0.026) were independent predictors of local recurrence after treatment in both
patient groups [de Roos et al., 2007].
After several retrospective studies that have suggested TP53 gene mutation as an
adverse prognostic indicator in breast cancer patients, a cohort of 90 Caucasian breast
cancer patients was analyzed prospectively (60 months of follow-up) with a rigorous
mutation detection methodology. The presence of a TP53 gene mutation was the single
most adverse prognostic indicator for recurrence (P=0.0032) and death (P=0.0001), and
was associated with poor response to both adjuvant (P=0.0001) and palliative
(P=0.006) therapy [Blaszyk et al., 2000].
Sjögren et al. compared a complementary DNA based sequencing method and
an IHC method for their abilities to detect TP53 mutations in breast cancer specimens
and prognostic value of the obtained data. As a result, 22% of tumours had TP53 gene
mutations detected by the complementary DNA based sequencing method; only 45% of
these mutations were located in evolutionary conserved portions of the TP53 coding
region. Sixty-four tumours (20% of the total) had elevated levels of p53 protein as
detected by IHC, suggesting the presence of mutations. IHC failed to detect 33% of the

37
mutations. Furthermore, 19 of the IHC-positive tumours were sequencing negative (i.e.,
p53 wild-type), suggesting a 30% false-positive frequency with IHC. The 5-year
estimates for RFS, breast cancer-corrected survival and OS were significantly shorter
for patients with p53 sequencing-positive tumours (P=0.001, P=0.01, and P=0.0003,
respectively). Patients with IHC-positive tumours showed reduced survival in all three
categories when compared with those with IHC negative tumours, but the differences
were not statistically significant [Sjögren et al., 1996].
Alsner et al. investigated interrelationship between p53 accumulation and TP53
mutations as well as the importance of different TP53 mutation types. TP53 was
mutated in 29% of the patients. The disease-specific survival at 15 years of follow-up
for patients with missense mutations directly involved in DNA or zinc binding was
21±8%. Patients with the remaining missense mutations within the structural/conserved
domains and patients with null mutations had a disease-specific survival of 36±6% and
31±17%, respectively. For patients without TP53 mutations and patients with mutations
affecting amino acids outside these domains, the 15 year disease-specific survival was
51+/-3% and 71±10%, respectively. p53 accumulation was successfully scored in 567
patients and categorized into three groups. Tumours with no p53 expression had a high
frequency of null mutations (37% compared to 10% in the whole cohort), and tumours
with high p53 expression contained 82% of the missense mutations inside
structural/conserved domains including those directly involved in DNA or zinc binding.
The clinical outcome for breast cancer patients was significantly different for different
TP53 mutation types. Most of the mutations that lead to mutant p53 protein
accumulation can be detected by immunohistochemistry but the specificity is low.
Samples showing lack of detectable p53 protein should be considered as an indication
of a possible null mutation [Alsner et al., 2008].
The reported findings suggest several conclusions. Although p53 gene
alterations in breast cancer have been associated with poor prognosis, there is not yet
consensus that p53 testing should be performed routinely. Utility as a predictive marker
has been reported, but extensive validation studies have not yet been performed. Several
methods can be used to screen for or define p53 alterations in human tissue samples, but
consensus regarding optimal methodology or reagents does not exist for either
molecular or immunohistochemical assays.

38
1.4.2. Role of BCL2 in breast cancer
BCL2 oncoprotein is a blocker of apoptotic cell death. Gene transfer
experiments have shown that elevated levels of this protein can protect a wide variety of
cells from diverse cell death stimuli ranging from growth factor withdrawal and
cytotoxic lymphokines to virus infection and DNA-damaging anticancer drugs and
radiation. BCL2 oncoprotein resides on the cytoplasmic side of the mitochondrial outer
membrane, endoplasmic reticulum and nuclear envelope, and has a molecular mass of
26 kDa. The BCL2 gene is involved in the t(14;18) chromosomal translocation found in
85% of human follicular lymphomas and 20% of diffuse B cell lymphomas. In this
translocation, the BCL2 gene at chromosome segment 18q21 is juxtaposed with the
immunoglobulin heavy chain locus at 14q32, resulting in deregulated expression of
BCL2 oncoprotein. The cells labelled by the antibody display a cytoplasmic staining.
In normal tissues, the antibody labels almost all peripheral blood lymphocytes.
In lymphoid tissue, small lymphocytes in the mantle zones and T-cell areas are positive
whereas very few cells in germinal centres are labelled. In the spleen, many cells in both
T- and B-cell areas and the red pulp stain by the antibody. In the thymus, many cells in
the medulla are labelled, while most cells in the cortex show weak or negative staining
[Dako Denmark A/S, M0887]. BCL2 is physiologically expressed in ductal epithelia of
the normal breast [Binder et al., 1995].
Considering the expression of BCL2 in pathology, the antibody labels many
neoplastic cells including lymphoproliferative disorders of low and high grade, such as
chronic lymphocytic leukaemia, hairy cell leukaemia, T-cell lymphoma, B- and T-cell
large cell type and anaplastic large cell Ki-1 lymphoma, and follicular lymphoma.
Expression of BCL2 oncoprotein is also detected in synovial sarcomas, and in muscle-
derived tumours [Dako Denmark A/S, M0887].
Since BCL2 inhibits most kinds of programmed cell death and provides a
selective survival advantage to various cell types the biological significance of BCL2
overexpression for the development and progression of breast cancer has to be
evaluated. Several authors have analysed the expression of BCL-2 protein in breast
cancer [Binder et al., 1995; Le et al., 1999; Callagy et al., 2006; Tsutsui et al., 2006;
Lee, Im et al., 2007; Martinez-Arribas et al., 2007; Trere et al., 2007; Alireza et al.,
2008; Callagy, Webber et al., 2008; Talley et al., 2008; von Minckwitz et al., 2008;
Dawson et al., 2010; Chen, Wu et al., 2012; Zaha and Lazar, 2012]. The logistic and

39
technological characteristics of selected studies devoted to BCL2 analysis in breast
cancer tissues is shown in the Table 1.2. but the main findings will be discussed in short
further.

Table 1.2.
Logistic and technological characteristics of selected studies devoted to BCL2 analysis in breast cancer tissues
Author Patients and materials Methods The analysed correlations
Binder et
al., 1995
133 primary breast cancers. IHC for BCL2 protein. Grade; status of ER/ PR; HER1;
HER2; HER3.
Le et al.,
1999
175 operable breast tumour patients. IHC for BCL2 and p53 proteins.
Northern blot for the expression of the
c-myc gene.
Follow-up: mean, 9.5 years.
Tumour size and grade; ER / PR
status; number of positive
lymph nodes; risk of death and
relapse.
Tsutsui et
al., 2006
249 invasive ductal breast carcinomas. IHC for BCL2, p27 and p53 and Ki-67
proteins.
Grade; ER status; p27; p53; Ki-
67; HER2; DFS
Callagy et
al., 2006
930 breast cancers. Tissue microarray.
IHC for 13 biomarkers.
Survival.
Lee, Im et
al., 2007
151 curatively resected stage III breast cancer patients
(3 males, 148 females, median age 46 years) with at
least 4 positive lymph nodes and received doxorubicin/
cyclophosphamide / paclitaxel as adjuvant
chemotherapy. Patients with positive ER and / or PR
expression received 5 years of tamoxifen following
doxorubicin / cyclophosphamide / paclitaxel.
IHC for BCL2, p53, ER, PR, HER2,
Ki-67.
Follow-up: median duration, 36
months; 37 patients (24.5%)
experienced a recurrence.
Clinico-pathologic variables;
DSF; OS.
Alireza et
al., 2008
Breast tumour sections from 35 surgically removed
patient samples and 35 normal or benign tissue
samples; sera from both the patient and control groups.
IHC for BCL2 protein.
Enzyme-linked immunosorbent assay
technique for soluble BCL2
(BMs244/3 Kit).
Tumour type, grade, and size,
patient’s menopausal status and
age.
40

41
Table 1.2. (end)
Callagy,
Webber et
al., 2008
PubMed reports (1994–2006).
18 series including 5892 cases with an average median
follow-up of 92.1 months; 8 studies investigating
disease free survival unadjusted for other variables in
2285 cases.
Meta-analysis of studies that
investigated the role of BCL2
expression by IHC with a sample size
greater than 100.
The prognostic significance of
BCL2.
von
Minckwitz
et al., 2008
248 patients with a histologically confirmed diagnosis
of previously untreated, operable primary breast
cancer T2-3(≥3 cm) N0-2 M0, treated prospectively in
randomised trial with 4 cycles of dose-dense
doxorubicin and docetaxel, with or without tamoxifen,
prior to surgery.
IHC for BCL2, ER, PR, Ki-67, HER2,
p53 (196).
Menopausal status; clinical
tumour size and nodal status;
grade; clinical response after
two cycles; pathological
complete response.
Talley et
al., 2008
100 IDC in pre-menopausal women, aged 45 years and
younger.
100 IDC in post-menopausal women, aged 65 years
and older. IDC were selected so that the proportions of
high and low/moderate grade carcinomas were equal
in the pre- and post-menopausal groups.
IHC for BCL2, EGFR, p185erbB-2
and p53.
Multivariate analysis of survival.
Survival by age and biological
factors.
Dawson et
al., 2010
11 212 women with early-stage breast cancer, enrolled
into any of 5 studies.
Meta-analysis of 5 studies.
Cox model incorporating the time-
dependent effects of each variable
(tumour size, grade, lymph node
status, treatment, mortality, BCL2,
ER, PR and HER2 levels).
The prognostic significance of
BCL2.
Zaha and
Lazar, 2012
61 patients who had been followed up 5 years since
diagnosis.
IHC for molecular subtyping and
BCL2 assessment.
Age; tumour size; histological
type and grade; clinical stage;
lymph node status.
Abbreviations in the Table: IHC, immunohistochemistry; ER, oestrogen receptor; PR, progesterone receptor; HER, human epidermal growth
factor receptor; DFS, disease free survival; OS, overall survival; IDC, infiltrating ductal carcinoma; EGFR, epidermal growth factor receptor.
41

Regarding the rate of BCL2 expression, controversial findings are reported.
Positive BCL2 expression was detected in 46% of tumours [Rolland et al., 2007].
Higher frequencies have been described reaching 63-67.6% of breast cancer cases [Le et
al., 1999; Alireza et al., 2008]. In contrast, Tsutsui et al. have analysed the breast cancer
cases by loss of BCL2 expression. Decreased BCL2 protein expression was found in
42% of breast cancer cases [Tsutsui et al., 2006].
Clinical relevance of semiquantitative classification of the BCL2
immunostaining based on both the distribution and the intensity of the staining reaction
was studied by Trere and colleagues. The proposed classification was validated in 69
breast cancer specimens by comparing the BCL2 immunostaining with the BCL2
messenger RNA levels evaluated by real-time reverse transcription – polymerase chain
reaction. Highly significant association was found between protein and messenger RNA
for BCL2 [Trere et al., 2007]. Similar experience was reported by Martinez-Arribas and
colleagues. BCL2 expression in breast cancer by either IHC or real time PCR yields
very similar results [Martinez-Arribas et al., 2007].
The hypothetic release of BCL2 protein into patient’s serum has been evaluated.
The BCL2 serum levels were 3.6 +/-1.1 ng/mL in the breast cancer patient group and
3.23 +/-0.06 ng/mL in the control group. A weak correlation was found between BCL2
serum levels and tissue expression of it (r=0.382, P=0.049). A positive and significant
correlation was shown between BCL2 and menopause (r=0.523, P=0.005) and between
age and serum BCL2 (r=0.488, P=0.011). Although a majority of the breast tumour
tissue expressed BCL2, the mean BCL2 serum levels were not different between patient
and control groups. Therefore, BCL2 expression should be analysed in tissue at the
level of protein or messenger RNA expression, but the use of serum levels would be
very limited for clinical or scientific purposes [Alireza et al., 2008].
There was a significant (P<0.001) inverse correlation between histological grade
and immunoreactivity for BCL2 [Binder et al., 1995]. On univariate analysis BCL2
expression was correlated with the clinicopathological features of less aggressive
disease [Rolland et al., 2007]. Also, decreased BCL2 protein expression, found in 105
(42%) cases, significantly correlated with a nuclear grade 3 [Tsutsui et al., 2006]. Any
degree of BCL2 immunohistochemical staining significantly (P=0.0015) inversely
correlated with high nuclear grade. The correlation was confirmed (P=0.006) by
messenger RNA expression [Martinez-Arribas et al., 2007]. The BCL2 expression did
not correlate with histological type of the tumour [Zaha et al., 2012]. The BCL2 protein
42

43
expression was significantly (P=0.048) associated with smaller tumour size [Martinez-
Arribas et al., 2007]. Messenger RNA expression of the BCL2 gene showed a
significant (P=0.04) direct correlation with nodal invasion [Martinez-Arribas et al.,
2007].
The correlation between BCL2 expression and hormone receptor status has been
evaluated by several authors. A significant positive correlation (P<0.001) was observed
between BCL2 expression and positivity for ER and PR by Binder et al., 1995. In
addition, BCL2 expression was found to be significantly correlated with the expressions
of ER and PR by Lee, Im et al., 2007. Loss of BCL2 was associated with ER negativity
[Tsutsui et al., 2006]. BCL2 protein overexpression was significantly associated
(P=0.0001) with hormone receptor positive tumours [Le et al., 1999]. The significant
correlation between BCL2 and hormone receptor expression (ER, P=0.0003; PR,
P=0.0002) was confirmed by messenger RNA expression (ER, P=0.0004; PR, P=0.001)
in the study conducted by Martinez-Arribas et al., 2007.
BCL2 immunostaining was not related to positivity for HER1. It was negatively
associated with overexpression of HER2 (P=0.04), whereas a strong positive correlation
was found with expression of HER3 characterised by P=0.01 [Binder et al., 1995].
BCL2 expression showed significant inverse correlation with the expression of HER2
[Lee, Im et al., 2007]. The expression of BCL2 protein and messenger RNA
significantly (P=0.0008 and P=0.016, respectively) inversely correlated with HER2
expression [Martinez-Arribas et al., 2007].
Significant differences were found analysing BCL2 expression regarding
hormone receptor status and molecular subtype [Zaha et al., 2012].
Taking into account the anti-apoptotic action of BCL2, even low proliferative
activity would be sufficient to establish tumour growth. Indeed, high proliferative
activity as assessed by Ki-67 staining significantly (P<0.001) inversely correlated with
BCL2 expression [Binder et al., 1995]. The expression of BCL2 protein significantly
(P=0.02) inversely correlated with a Ki-67 labelling index >10% [Martinez-Arribas et
al., 2007]. In the study of Lee et al., significantly inverse correlation was found between
BCL2 expression and proliferative activity by Ki-67 [Lee, Im et al., 2007]. The
incidence of a high nuclear grade and Ki-67 counts increased as the number of
abnormal findings of BCL2, p27 and p53 protein expressions increased [Tsutsui et al.,
2006].

44
More complex approach to the analysis of cell cycle regulation in BCL2 positive
breast cancers has been undertaken as well. Experimental research work of Tsutsui et al.
has shown that BCL2, which has been established as a key player in the control of
apoptosis, participates in regulating the cell cycle and proliferation. Decreased BCL2
protein expression significantly correlated with decreased p27 protein expression,
positive p53 protein expression, positive Ki-67 counts and a positive HER2 protein
expression [Tsutsui et al., 2006]. The significant inverse correlation between BCL2 and
p53 expression was confirmed by Lee, Im et al., 2007. Messenger RNA expression of
the BCL2 gene showed a significant (P=0.014) inverse correlation with p53 expression
[Martinez-Arribas et al., 2007].
The association between BCL2 and survival has been analysed as well. By
univariate analysis, decreased BCL2 protein expression was significantly (P=0.0089)
associated with a worse disease-free survival (DFS), while multivariate analysis
indicated the lymph node status and Ki-67 counts to be independently significant
prognostic factors. The prognostic value of BCL2 as well as p27 and p53 protein
expression was dependent on the proliferation activity in breast cancer [Tsutsui et al.,
2006]. Loss of BCL2 expression significantly (P<0.001 on univariate analysis)
correlated with a reduction in survival [Rolland et al., 2007]. Better survival rates were
observed for BCL2 positive tumours [Zaha et al., 2012].
BCL2 expression was one of the few factors significantly (P=0.002) associated
with prolonged DFS. The other factors included ER positivity (P=0.013), and low p53
expression (P=0.032). Univariate analyses indicated that the tumour size (P=0.038) and
the number of involved lymph nodes (P<0.001) significantly affected the recurrences.
However, the type of surgery, the histology, histological grade, the presence of
endolymphatic emboli, and a close resection margin did not. Knowing this, further
multivariate analysis identified 10 or more involved lymph nodes (HR=7.366;
P<0.001), negative BCL2 expression (HR=2.895; P=0.030), and HER2 overexpression
(HR=3.535; P=0.001) as independent indicators of worse DFS. Patients with BCL2
expression had a significantly longer DFS even in the ER positive subgroup [Lee, Im et
al., 2007].
As the prognostic evaluation of breast cancer by clinicopathologic variables is
useful but imperfect, Callagy et al. evaluated the prognostic potential of Nottingham
Prognostic Index (NPI) along with the expression of 13 biomarkers in 930 breast
cancers on a tissue microarray. BCL2 was among those 8 markers, including also

45
hormone receptors, cyclin E, p53, proliferative activity, CK 5/6, and HER2 that showed
a significant association with survival at 10 years on univariate analysis. On
multivariate analysis BCL2 again was among the 3 markers that retained significance:
BCL2 (HR=0.68; 95% CI=0.46-0.99; P=0.055); NPI [HR=1.35; 95% CI=1.16-1.56;
P=0.0005] and ER status (HR=0.59; 95% CI=0.39-0.88; P=0.011). BCL2, used as a
single marker, was more powerful than the use of a panel of markers. Based on these
results, an independent series was used to validate the prognostic significance of BCL2.
Here, BCL2 (HR=0.83; 95% CI=0.71-0.96; P=0.018) retained prognostic significance
independent of the Nottingham Index (HR=2.04; 95% CI=1.67-2.51; P<0.001) with an
effect that was maximal in the first 5 years [Callagy et al., 2006].
Initially, the prognostic effect of BCL2 was considered to be related to ER
status. Dawson et al. tested the clinical validity of BCL2 as an independent prognostic
marker. In univariate analysis, ER, PR and BCL2 positivity was associated with
improved survival and HER2 positivity with inferior survival. For ER and PR this effect
was time-dependent, whereas for BCL2 and HER2 the effect persisted over time. In
multivariate analysis, BCL2 positivity retained independent prognostic significance
(HR=0.76, 95% CI=0.66-0.88, P<0.001). BCL2 was a powerful prognostic marker
independently of ER and HER2 status: in ER- (HR=0.63, 95% CI=0.54-0.74, P<0.001)
and ER+ disease (HR=0.56, 95% CI=0.48-0.65, P<0.001), and in HER2- (HR=0.55,
95% CI=0.49-0.61, P<0.001) and HER2+ disease (HR=0.70, 95% CI=0.57-0.85,
P<0.001), irrespective of the received adjuvant therapy [Dawson et al., 2010].
Studying 1000 high-risk breast cancer patients receiving radiotherapy, negative
BCL2 expression was significantly associated with increased overall mortality, distant
metastases and locoregional recurrence in multivariate Cox regression analyses.
Kaplan-Meier probability plots showed a significantly improved overall survival for the
BCL2 positive subgroup [Kyndi et al., 2008].
Multivariate analysis by Cox model showed that only 2 factors were
independently linked to the risk of death: BCL2 protein overexpression, which
decreased the risk (P=0.008) and number of metastasis in lymph nodes, which increased
the risk (P=0.0001). When BCL2 overexpression was studied in relation to nodal status,
hormone receptor status and treatment, no significant differences was observed. The
BCL2 expression was also associated with a significantly lower risk of distant
metastasis (P=0.04). Thus, it was suggested that BCL2 expression reveals

46
prognostically favourable phenotype of breast cancer, and it may therefore be used as a
marker of long-term survival [Le et al., 1999].
Interestingly, BCL2 has been found to have prognostic role in particularly
serious group of patients – young women affected by breast cancer. Young pre-
menopausal women with breast carcinomas have an overall worse prognosis than older,
post-menopausal women. Talley et al. assessed the BCL2 along with EGFR, HER2 and
p53 in breast carcinomas in pre- and post-menopausal women with equivalent histologic
grades. There were statistically significant differences in the BCL2, EGFR and p53
expression in carcinomas of high vs. low histologic grade. Despite the observation that
there were no age-related differences in the expression frequency and/ or pattern, BCL2
and p53 had prognostic significance in overall study population and pre-menopausal,
but not post-menopausal women [Talley et al., 2008].
Callagy, Webber at al. have also performed meta-analysis of the association
between BCL2 expression and both disease-free survival and overall survival in female
breast cancer. The re-analysis of 18 studies identified wide range of relative hazard
estimates (0.85-3.03). However, pooled analysis of all groups (separating groups of
studies unadjusted/ adjusted for other factors) invariably disclosed beneficial effect. The
meta-analysis strongly supported the prognostic role of IHC-assessed BCL2 in breast
cancer and showed that this effect is independent of lymph node status, tumour size and
grade as well as a range of other biological variables on multivariate analysis [Callagy
et al., 2008].
BCL2 was an independent predictor of clinical outcome, and its prognostic
independence was maintained when lymph node-negative and -positive patients were
considered separately. The subgroup of node-negative breast cancer patients with a
negative BCL2 immunostaining had a very high probability of relapse or death
(respectively about 5 and 7 times greater than patients with a positive BCL2
immunostaining). Moreover, BCL2 retained prognostic significance in subgroups of
patients treated with adjuvant endocrine therapy or chemotherapy [Trere et al., 2007].
Von Minckwitz with colleagues investigated the predictive value of clinical and
biological markers for a pathological complete remission after a preoperative dose-
dense regimen of doxorubicin and docetaxel, with or without tamoxifen, in primary
operable breast cancer. Pathological complete remission was observed in 9.7% of
patients. Clinically negative axillary lymph nodes, poor tumour differentiation, negative
ER and PR status, and loss of BCL2 were significantly predictive for a pathological

47
complete remission in a univariate logistic regression model, whereas in a multivariate
analysis only the clinical nodal status and hormonal receptor status provided
significantly independent information [von Minckwitz et al., 2008].
Thus, several investigators have confirmed that BCL2 is an independent
predictor of breast cancer outcome [Callagy et al., 2006; Rolland et al., 2007; Tsutsui et
al., 2006; Lee, Im et al., 2007; Kyndi et al., 2008; Dawson et al., 2010; Zaha et al.,
2012]. Some investigators have limited the conclusion for early-stage breast cancer but
extended it for all molecular types [Dawson et al., 2010], or focused on curatively
resected stage III breast cancer patients [Lee, Im et al., 2007]. BCL2 expression in high-
risk breast cancer has been evaluated as well [Kyndi et al., 2008]. Despite opposing
tumour cell death, BCL2 is associated with biological features of the tumours which
define a better intrinsic prognosis, such as hormone receptor expression, low
proliferation and absence of HER2 and mutant TP53 expression. This may in great part
explain why BCL2 expression has been invariably found to correlate with a better
prognosis of breast cancer [Martinez-Arribas et al., 2007].
The prognostic value of BCL2 expression could extend over the first 5 years
after diagnosis [Callagy et al., 2006]. As addition of BCL2 to the Adjuvant! Online
prognostic model, for a subset of cases with a 10-year follow-up, improved the survival
prediction (P=0.0039), the effect can also have longer-lasting value [Dawson et al.,
2010].
1.4.3. Cyclooxygenase-2 evaluation
The cyclooxygenase (COX) enzymes, COX-1 and COX-2, are critical in the
biosynthesis of prostaglandins from arachidonic acid. Two isoforms of COX have been
identified: COX-1, the constitutive isoform; and COX-2, the inducible form of the
enzyme [Davies et al., 2002]. The human COX-1 protein is constitutively expressed in
most tissues and maintains tissue homeostasis. Non-steroidal anti-inflammatory drugs
decrease the inflammatory response by blocking both COX enzymes. COX-2 is a 70
kDa inducible enzyme that is responsible for prostaglandin synthesis at the site of
inflammation. COX-2 can undergo rapid induction in response to many factors such as
bacterial lipopolysaccharides, growth factors, cytokines and phorbol esters. COX-2
expression has also been linked to carcinogenesis, and specific COX-2 inhibitors have

48
been shown to have antitumour effects. Expression of COX-2 by IHC has been reported
in a variety of normal tissues. The cellular staining pattern for anti-COX-2 is
cytoplasmic [Dako Denmark A/S, M3617].
Many human cancers exhibit elevated prostaglandin levels due to upregulation
of COX-2, a key enzyme in eicosanoid biosynthesis. Extensive pharmacologic and
genetic evidence implicates COX enzymes in neoplasia [Harris et al., 2009]. COX-2 is
also overexpressed in carcinoma of the breast [Davies et al., 2002]. COX-2
overexpression has been observed in about 40% of cases of invasive breast carcinoma
and at a higher frequency in preinvasive DCIS tumours [Harris et al., 2009].
Interest in chemoprevention in oncology using suppressants of prostaglandin
(PG) synthesis has been stimulated by epidemiological observations that the use of
aspirin and other non-steroidal inflammatory drugs is associated with reduced incidence
of some cancers, including cancer of the breast [Davies et al., 2002; Harris et al., 2009].
The breast cancer risk reduction can be as significant as 46% [Ashok et al., 2011].
However, the findings are unequivocal. It has been reported that prolonged use of COX-
2 inhibitors is associated with an increased risk of breast and haematological
carcinomas along with decreased risk of colorectal cancer [Vinogradova et al., 2011].
Lack or correlation has been reported as well [Cronin-Fenton et al., 2010].
COX-2-dependent activity is a necessary component for cellular and molecular
mechanisms of breast cancer cell motility and invasion. COX-2 activity also modulates
the expression of matrix metaloproteinases, which may be a part of the molecular
mechanism by which COX-2 promotes cell invasion and migration. The studies suggest
that COX-2 assists in determining and defining the metastatic signalling pathways that
promote the breast cancer progression to metastasis [Larkins et al., 2006].
Complementary experimental studies have established that both conventional
nonsteroidal anti-inflammatory drugs and selective COX-2 inhibitors suppress
mammary tumour formation in rodent breast cancer models. Furthermore, knocking out
COX-2 reduces mammary tumourigenesis and angiogenesis, and, conversely, transgenic
COX-2 overexpression induces tumour formation. However, lack of correlation
between COX-2 expression and microvessel density has been reported as well [Thorat
et al., 2009]. In breast cancer cell model, COX-2 has been implicated in the epithelial-
mesenchymal transformation and thus in the development of metastasis [Bisaro et al.,
2012]. The COX-2 expression in mouse breast cancer controls development of bone
metastasis [Karavitis et al., 2012]. The utility of COX/PG signalling as a target for

49
chemoprevention has been established by randomized controlled clinical trials.
However, these studies also identified increased cardiovascular risk associated with use
of selective COX-2 inhibitors. Thus, current efforts are directed toward identifying safer
approaches to antagonizing COX/PG signalling for cancer prevention and treatment,
with a particular focus on PGE2 regulation and signalling, because PGE2 is a key pro-
tumourigenic prostanoid [Howe, 2007]. In breast cancer cell cultures, COX-2 has been
implicated in the metastatic potential of chemotherapy-resistant breast cancer cells
[Kang et al., 2011], in stem-like breast cancer cells and disseminated cancer cells
[Singh et al., 2011].
Several authors have studied the role of COX-2 in breast cancer [Ristimäki et
al., 2002; Leo et al., 2006; Nassar et al., 2007; Zerkowski et al., 2007; Lee et al., 2010;
Ciris et al., 2011; Park et al., 2012]. The logistics and the applied methods of selected
representative studies are highlighted in Table 1.3. but the main results are discussed
subsequently.

Table 1.3.
Logistic and technological characteristics of selected studies devoted to cyclooxygenase-2 analysis in breast cancer tissues
Author Patients and materials Methods The analysed correlations
Ristimäki
et al.,
2002
1576 invasive breast cancers.
Tissue array construction.
IHC for COX-2, ER, PR, Ki-67, p53.
FISH for HER2 amplification.
Tumour size; grade;
lymph node status; ER /
PR status; proliferation
rate.
Leo et al.,
2006
39 patients: paired samples of invasive
cancer and normal breast epithelium; 29
patients: also ductal carcinoma in situ.
IHC for COX-2 by monoclonal antibody. COX-2 in normal tissue,
in situ and invasive
cancer.
Nassar et
al., 2007
43 breast carcinomas and 5 normal
breast tissues.
Tissue microarray construction.
IHC for COX-2 by monoclonal antibody. Expression was
assessed as intensity and scored as percentage of positive
cells.
Prognostic parameters and follow-up information: obtained
from the hospital records.
Disease-free and overall
survival.
Zerkowski
et al.,
2007
669 primary breast cancers, stage I-III.
Tissue microarray.
IHC for COX-2.
AQUA and X-tile: algorithms for quantitative analysis of
protein expression and determination of optimal cut-points.
The total tumour and
subcellular expression of
COX-2; clinicopathologic
factors and survival.
Lee et al.,
2010
80 breast cancer patients (January 2005
– February 2007).
IHC for COX-2.
COX-2 cutoff: 10%.
Outcome: locoregional recurrence, 2; systemic metastasis, 8;
died, 1 patient.
Age; tumour size and
grade; nodal status; ER /
PR status; HER2
positivity.
Park et
al., 2012
861 breast cancers. IHC for COX-2 and Ki-67.
Univariate and multivariate analyses.
Clinicopathological
parameters and survival.
Abbreviations in the Table: IHC, immunohistochemistry; COX, cyclooxygenase; ER, oestrogen receptor; PR, progesterone receptor; FISH,
fluorescent in situ hybridization; HER, human epidermal growth factor receptor. 50

Controversial data are reported regarding the frequency of COX-2
overexpression in breast cancer. At least partially the discrepancies can be attributed to
different evaluation systems. In the study of van Nes at al., the COX-2 expression was
scored and the cases classified into low expression or high expression group in relation
to the average value [van Nes et al., 2011]. Alternatively, the rate of COX-2 expression
was 15% using the cut-off value of 10% neoplastic cells [Lee et al., 2010]. In another
study, 95% of the breast carcinomas showed cytoplasmic COX-2 expression [Nassar et
al., 2007]. In contrast, COX-2 overexpression was observed in 46.8% of surgical
specimens [Guo et al., 2008]. Moderate to strong elevated expression of COX-2 protein
was observed in 37.4% of breast cancers by Ristimäki et al., 2002. In a large cancer
group, COX-2 was positive in 57.3% of invasive tumours [Park et al., 2012]. Most of
authors have reported expression of COX-2 in tumor cells. However, stromal areas
showed higher expression in the study of Richardsen et al., 2012. The observations of
the role of macrophages inducing COX-2 expression in breast cancer cells [Hou et al.,
2011] are in agreement with these findings as so far as the importance of stromal
compartment is emphasized [Troester et al., 2009]. However, significant discrepancies
exist in the primary data. COX-2 can be implicated in the epithelial-stromal interactions
facilitating the transformation of in situ cancer into invasive tumour [Hu et al., 2009].
No statistically significant correlation was found between COX-2 expression and
patient’s age [Lee et al., 2010].
It has been reported that COX-2 expression was not associated with tumor size
and grade [Lee et al., 2010]. In contrast, COX-2 intensity and percentage of positive
cells correlated significantly with size of carcinoma (P=0.0271; P=0.0539,
respectively), and COX-2 intensity correlated significantly with histologic grade
(P=0.0182) as described by Nassar et al., 2007. In the study performed by Zerkowski et
al., 2007, COX-2 expression also was directly associated with nuclear grade. Significant
association between COX-2 overexpression and high histological grade (P=0.026) was
also described by Ciris et al., 2011. The correlation between elevated COX-2
expression, large tumour size and a high histological grade was identified also by
Ristimäki et al., 2002. Elevated COX-2 was associated a high proliferation rate and
high p53 expression, (P<0.0001 for both comparisons), along with axillary node
metastases and a ductal type of histology (P<0.0001 and P<0.0017, respectively) as
described by Ristimäki et al., 2002. In contrast, association with lobular cancer type was
reported by Holmes et al., 2011.
51

52
In normal breast, ductal carcinoma in situ and invasive ductal cancer, the COX-2
overexpression rate was 0%, 84%, and 58.8%, respectively. The differences in COX-2
expression between cancer and benign tissues were significant (P<0.0001) as well as the
differences between in situ and invasive cancer (P=0.042) as described by Ciris et al.,
2011. Recently it was demonstrated that COX-2 protein is mainly located in plasma
membrane of lobular intraepithelial neoplasia cells suggesting localization in caveolae-
like structures [Perrone et al., 2007]. Leo et al. has also hypothesised that COX-2
overexpression is an early event in breast carcinogenesis. Comparing COX-2 protein
expression in normal breast tissue, carcinoma in situ and invasive breast cancer in
samples from the same patients, the findings were concordant. COX-2 expression in
normal breast tissue was an indicator for COX-2 expression in the paired breast
tumours. There was no significant correlation between COX-2 expression and
pathologic tumour stage, nodal status, hormone receptor status, tumour size, grading,
and lymphovascular space involvement in this study [Leo et al., 2006]. Similar COX-2
expression in invasive and in situ cancer has been reported by meta-analysis; this also
would lead to the conclusion that COX-2 expression is an early event in breast
carcinogenesis [Glover et al., 2011].
Although COX-2 expression has been associated with lymph node metastasis
[Nassar et al., 2007], this was not confirmed by Lee et al., 2010. In contrast, COX-2
expression was strongly correlated with vascular endothelial growth factor-C expression
(P<0.01), lymphangiogenesis characterised by number of lymphatic capillaries
(P=0.032) and metastatic lymph nodes (P=0.035) in the study performed by Guo et al.,
2008. The correlation between COX-2 expresion and higher stage was reported also by
Holmes et al., 2011.
There was no statistically significant correlation between COX-2 expression and
hormone receptor status. However, among ER/ PR positive tumours, COX-2 expression
was related to larger size (P=0.001 and P=0.009, respectively) and nodal status
(P=0.048 and P=0.009, respectively) as reported by Lee et al., 2010. In contrast,
tumours characterised by COX-2 and progesterone receptor co-expression have been
characterised by smaller size and lower number of axillary lymph node metastasis
[Almeida et al., 2011].
Lack of correlation between COX-2 and ER has been confirmed also by other
research groups [Nassar et al., 2007; Holmes et al., 2011] but rejected by still other
investigators. Interestingly, Holmes et al. observed positive association between COX-2

53
and hormone receptor status but worse prognosis [Holmes et al., 2011]. COX-2
expression has been inversely associated with ER and PR [Zerkowski et al., 2007].
Elevated COX-2 was associated with negative hormone receptor status [Ristimäki et al.,
2002]. In contrast, significant positive association between COX-2 and hormone
receptor expression (P<0.0010) has been reported recently [Dhakal et al., 2012].
There is evidence that COX-2 expression is associated with HER2 over-
expression [Nassar et al., 2007; Rozenowicz et al., 2010]. Statistically significant
correlation (P<0.0001) between COX-2 expression and HER2 oncogene amplification
was showed also by Ristimäki et al., 2002. In contrast, no statistically significant
correlation was found between COX-2 expression and HER2 positivity in other, more
recent studies [Lee et al., 2010; Miglietta et al., 2010]. COX-2 overexpression had a
significant relationship with HER2 overexpression (P=0.026) as described by Ciris et
al., 2011.
COX-2 expression has been studied in the context of fragile histidine triad – a
putative tumour suppressor gene that is could be involved in the carcinogenesis of
breast cancer. Loss of fragile histidine triad expression has been observed in up to 72%
of breast cancers and has been associated with increased p53, a high proliferation index,
and increased tumour size and grade. However, no association between COX-2 and
expression of fragile histidine triad has been observed [Arun et al., 2005].
In breast cancer, the prognostic impact of COX-2 expression varies widely
between studies. van Nes et al. examined the prognostic value of COX-2 expression in a
large cohort of breast cancer patients treated with surgery (1985-1994) and followed-up
for the median period of 19 years. COX-2 was scored using a weighted histoscore. The
COX-2 expression was prognostically important regarding disease-free survival and
overall survival. However, COX-2 did not remain independent in multivariate analysis.
In patients with hormone receptor positive tumours, COX-2 expression had a negative
influence on outcome (low versus high: disease free survival, HR=1.37, 95% CI=1.07-
1.76, P=0.013). This effect disappeared when endocrine therapy was administered (low
versus high: disease free survival, HR=0.93, 95% CI=0.51-1.70, P=0.811) while it
remained statistically significant when endocrine therapy was omitted (low versus high:
disease free survival, HR=1.48, 95% CI=1.12-1.94, P=0.005) as described by van Nes
et al., 2011. Thus, these findings suggest that COX-2 plays role in hormonal signalling.
In contrast, high COX-2 has been associated with local recurrence, cancer-related death

54
and reduced disease-free and disease-related overall survival in ER-negative but not
ER-positive disease [Nassar et al., 2007].
COX-2 did not correlate with DFS and OS in the study of Nassar et al., 2007. In
contrast, Guo et al. showed that patients with COX-2 positive tumours had a significant
shorter survival time than those with negative tumours, including DFS and OS. The
respective P values were 0.010 and 0.040 [Guo et al., 2008]. These findings are in
agreement with the research performed by Zerkowski et al., 2007. Here, patients with
high non-nuclear expression of COX-2 had significantly worse survival. Multivariate
analysis showed that COX-2 remained a significant prognostic factor for survival
independent of tumour size, nodal status, ER, HER2/neu, and grade [Zerkowski et al.,
2007]. Stromal expression of COX-2 is shown to have negative prognostic significance
[Richardsen et al., 2012]. Elevated expression of COX-2 protein was associated with
unfavourable distant disease-free survival (P<0.0001) in the study of Denkert et al.,
2003. Association with unfavourable outcome was especially apparent in the subgroups
defined by oestrogen receptor positivity, low p53 expression, and no HER2
amplification (P<0.0001 for all comparisons). These results indicated that elevated
COX-2 expression is more common in breast cancers with poor prognostic
characteristics and is associated with an unfavourable outcome [Ristimäki et al., 2002].
Worse prognosis in COX-2 positive cancers was reported by Holmes et al., 2011
despite the association between COX-2 and hormone receptor positivity in their study
group [Holmes et al., 2011]. Another challenging observation is the reported survival
advantage in patients taking non-steroidal anti-inflammatory drugs [Holmes et al.,
2011].
Interesting observations are brought by COX-2 expression studies by cell
proliferation. COX-2 was associated with favourable markers, but was not related to
survival outcome by itself. However, COX-2 in proliferative tumours [COX-2(+)/Ki-
67(+)] were significantly associated with unfavourable factors and the worst survival,
but COX-2 in non-proliferative tumours [COX-2(+)/Ki-67(-)] showed significantly
favourable parameters and better outcomes. COX-2(-)/Ki-67(any) showed intermediate
prognosis. The statistical significance was maintained in stage-matched and multivariate
analyses. The results suggested that COX-2 expression may act in a different ways by
the proliferation status of the tumour cells [Park et al., 2012].
Implications of COX-2 in early breast cancer treatment have been suggested
[Filipovic et al., 2011]. Criteria for COX-2 inhibitor combinations in the treatment of

55
invasive breast cancer have been discussed [Kim et al., 2012] as COX-2 inhibitor
celecoxib has antiproliferative effects on human breast cancer cell lines [Bocca et al.,
2011]. A challenging study was triggered by the following observations. In a clinical
research study combination of aromatase inactivator exemestane and COX-2 inhibitor
celecoxib for the treatment of breast cancer was as effective as exemestane alone. The
effect of celecoxib in clinical study was disappointing indicating that COX-2 may not
be as crucial for the progression of human breast cancer as previously described.
Authors searched for technological short-comings that could explain the previous data.
They suspected lack of quantitative measurements in the immunohistochemistry and
conventional real time PCR as the possible source of mistake. To quantitatively measure
the expression of COX-2 in breast cancer tissues, tumour-adjacent tissues, and healthy
breast tissues, Boneberg and colleagues performed real-time PCR analysis and
normalized the expression of COX-2 to the mean expression of four different
housekeeping genes. The expression of COX-2 messenger RNA was decreased in the
breast cancer samples (mean COX-2 expression: 0.3, 95% CI=0.2-0.4) in comparison
with tumour-adjacent tissues (mean: 2.0, 95% CI=1.3-2.7) and healthy tissues (mean:
1.0, 95% CI=0.5-1.4). The median expression of COX-2 in tumour tissues was only
20% of the median expression in healthy tissues (P<0.001) and only 10% of that of
tumour-adjacent tissues (P<0.001). Some tumour samples showed only about 1% of the
messenger RNA levels measured in tumour-adjacent tissues. Final results indicate that
COX-2 is expressed at reduced levels in human breast cancer, not over-expressed as
previously reported. Furthermore, the authors did not find any correlation of COX-2
messenger RNA expression in the tumour tissues with the messenger RNA expression
of HER2/neu, ER or PR. The loss of COX-2 expression in established breast cancers
that were observed could explain the failure of celecoxib to inhibit tumour growth in the
cited clinical trial [Boneberg et al., 2008].
Reduced risk for bone metastasis in breast cancer patients who use COX-2
inhibitors were reported [Valsecchi et al., 2009]. COX-2 is linked to cancer cell
infiltration in brain and lungs [Bos et al., 2009].

56
1.4.4. Cyclin D1 in breast cancer
Cyclin D1 (synonyms: PRAD-1, CCND1, Bcl-1) is a 36 kDa protein encoded by
the CCND1 (bcl-1) gene located on chromosome 11q13. Cyclin D1 associates with and
activates cyclin dependent kinases (CDK): CDK4 and CDK6. The protein functions as a
CDK-dependent regulator of the cell cycle by phosphorylating and inactivating the
retinoblastoma protein, thereby allowing for progression through the G1-S phase of the
cell cycle. Cyclin D1 is also involved in CDK-independent functions including
associating with and regulation of a variety of transcription factors and transcriptional
co-regulators, as well as the regulation of cellular metabolism, fat cell differentiation
and cell migration. Cyclin D1 overexpression is associated with tumourigenesis, and
cyclin D1 amplification and/or overexpression have been demonstrated in a variety of
human tumours, including mantle cell lymphomas, breast carcinomas, head and neck
squamous cell carcinomas and oesophageal cancers. Among lymphoid neoplasms, a
subset of chronic lymphocytic leukaemia, small lymphocytic lymphoma and multiple
myeloma have been reported to express cyclin D1 [Dako Denmark A/S, M3642].
The cellular staining pattern of cyclin D1 is predominantly nuclear. In breast, the
positively staining tissue elements are ductal epithelial cells (<10%).
The materials and methods used in several representative studies of cyclin D1 in
breast cancer [Umekita et al., 2002; Stendahl et al., 2004; Bilalović et al., 2005; Reis-
Filho, Savage et al., 2006; Guo et al., 2007; Lee, Park et al., 2007; Cho et al., 2008;
Elsheikh et al., 2008; Rudas et al., 2008; Aaltonen et al., 2008; Lundgren et al., 2012]
are presented in Table 1.4. The main findings are jointly discussed later.

Table 1.4.
Logistic and technological characteristics of selected studies devoted to cyclin D1 analysis in breast cancer tissues
Author Patients and materials Methods The analysed correlations
Umekita
et al.,
2002
173 females with invasive ductal carcinoma
that had had mastectomy (161) or breast-
conserving surgery (12).
IHC for cyclin D1 by monoclonal antibody (clone
DCS-6) and labelled streptavidin – biotin method
in paraffin-embedded tissues.
Follow-up: postoperative follow-up for 6-119
months (median 86 months).
Tumour size; histologic
grade; lymph node status;
ER status; OS; RFS.
Stendahl
et al.,
2004
167 postmenopausal breast cancer patients
randomised to 2 years of tamoxifen treatment
or no treatment.
Tissue array construction.
IHC for cyclin D1.
Follow-up: median, 18 years.
ER status; survival regarding
tamoxifen treatment.
Bilalović
et al.,
2005
Medical records and formalin-fixed, paraffin-
embedded breast cancer tissue of 48 patients
(1998).
IHC for ER, PR, BCL2, and cyclin D1 by
monoclonal antibodies.
Follow-up: mean, 61 months (range: 4-103
months).
Tumour grade; size; lymph
node status; ER/ PR status;
BCL2; OS; RFS.
Reis-
Filho,
Savage et
al., 2006
245 breast cancer patients. IHC for cyclin D1 by SP4 monoclonal antibody.
CISH by Zymed CCND1 SpotLight probe. CISH
signals were counted in 60 neoplastic cells.
Amplification was defined as 45 signals per
nucleus in more than 50% of cancer cells, or large
gene copy clusters.
ER/ PR status; basal-like
markers; overexpression;
amplification; overall
survival; disease-free
survival.
Guo et al.,
2007
Early breast carcinomas (18) and invasive
ductal carcinomas (80).
IHC for cyclin D1, Ki-67, pRb, and p53.
Southern blot and RT-PCR for alteration of cyclin
D1 gene and over-expression of cyclin D1 mRNA.
Ki-67; pRb; p53 expression;
protein and mRNA
overexpression; gene
amplification; five-year
survival.
57

58
Table 1.4. (end)
Lee, Park
et al.,
2007
333 invasive breast cancer specimens. IHC for cyclin D1 and ER.
FISH and IHC to detect HER2 status.
ER; HER2; mortality.
Cho et al.,
2008
Tissue from the primary tumour and matching lymph
node metastases of 73 breast cancer patients.
Cyclin D1 status evaluation along with
HER2 and EGFR expression in primary
tumours and metastases by IHC and
CISH.
Overexpression in primary
and metastatic tumour.
Elsheikh
et al.,
2008
880 unselected invasive breast cancer cases. Tissue microarray construction.
IHC for cyclin D1 protein by rabbit
monoclonal antibody SP4.
CISH for CCND1 amplification by
Spotlight CCND1 probe.
ER status; molecular
subtype; amplification and
overexpression.
Rudas et
al., 2008
Surgical specimens of 253 breast cancers, ABCSG Trial
05 and 948 cancers, ABCSG Trial 06.
IHC for cyclin D1.
Cox models.
Overall survival; RFS.
Aaltonen
et al.,
2008
53 BRCA1, 58 BRCA2, 798 familial non-BRCA1/2, and
439 sporadic breast tumours.
Tissue microarray construction.
IHC for cyclins E and D1.
Grade; Ki-67; ER status.
Lundgren
et al.,
2012
1155 postmenopausal, oestrogen receptor positive breast
cancer patients.
IHC for cyclin D1 protein expression.
CISH for CCND1 amplification status.
Recurrence; tamoxifen
treatment effect.
Abbreviations in the Table: IHC, immunohistochemistry; ER, oestrogen receptor; OS, overall survival; RFS, relapse – free survival; PR,
progesterone receptor; CISH, chromogenic in situ hybridisation; RT-PCR, real time - polymerase chain reaction; mRNA, messenger ribonucleic
acid; FISH, fluorescent in situ hybridization; EGFR, epidermal growth factor receptor. ABCSG-Austrian Breast and Colorectal Cancer Study
Group.
58

The frequency of cyclin D1 overexpression in breast cancer ranges from 42% to
60% [Umekita et al., 2002; Guo et al., 2007; Rudas et al., 2008]. The findings depend
on the applied methods significantly. Thus, strong cyclin D1 expression and CCND1
amplification were found in 67.4 and 14.5% of the cases, respectively. However, a
strong correlation (P<0.0001) between cyclin D1 overexpression and CCND1
amplification was demonstrated as well [Reis-Filho, Savage et al., 2006]. Similarly,
positive rate of cyclin D1 protein in invasive ductal carcinoma (52.5%) was slightly
higher than overexpression rate (40.8%) of cyclin D1 messenger RNA but significantly
higher than amplification rate (18.4%) of cyclin D1 gene [Guo et al., 2007]. In the study
of Elsheikh et al., 9.6% tumours showed CCND1 amplification and 43.6% showed
strong cyclin D1 expression. A strong positive correlation (P<0.001) between CCND1
amplification and higher levels of cyclin D1 expression was found [Elsheikh et al.,
2008]. However, cyclin D amplification was not related to protein overexpression in the
study performed by Cho et al., 2008. Close correlation between Western blot and IHC
findings are reported [Kamel et al., 2006]. The cyclin D1 expression is significantly
affected by neoadjuvant chemotherapy [Penault-Llorca et al., 2008].
The concordance between the primary lesion and the metastatic regional lymph
nodes is 63% for cyclin D1 protein overexpression and 85% for gene amplification
status by chromogenic in situ hybridisation (CISH) as reported by Cho et al., 2008.
Regarding the spread and histological characteristics of breast cancer, cyclin D1
expression inversely correlated with tumour grade (P=0.010) and size (P=0.023) as
described by Bilalović et al., 2005. In the ER-negative subgroup, overexpression of
cyclin D1 significantly correlated with the lymph node status and tumour size [Umekita
et al., 2002]. No expression of cyclin D1 was found in usual ductal hyperplasia and
atypical ductal hyperplasia [Guo et al., 2007]. The expression of cyclin D1 significantly
increased (P<0.05) in ductal carcinoma in situ [Zhou et al., 2009]. As this transition is
accompanied by increasing number of ER-positive proliferating (Ki-67 positive)
intraductal cells [Zhou et al., 2009], the expression of cyclin D1 can be not only early
but also pathogenetically important event in breast carcinogenesis, hypothetically more
related to low-grade cancer development [Abdel-Fatah et al., 2008].
The relation between ER and cyclin D1 has been highlighted by several
researchers. Significant positive association with ER (P<0.000001) was found by
Umekita et al., 2002 and confirmed by Bilalović et al., 2005 (P=0.001) and Lee, Park et
al., 2007 (P<0.01). The findings are confirmed by results regarding PR expression and
59

60
CCND1 gene amplification. Cyclin D1 expression showed a positive correlation
(P<0.0001) with ER and PR expression [Reis-Filho, Savage et al., 2006]. Both CCND1
amplification and cyclin D1 expression were associated with positive ER status.
CCND1 gene amplification was an independent prognostic factor for patients with ER
positive breast cancer. The results demonstrated a strong correlation between CCND1
amplification and its protein expression in breast cancer. However, protein expression
was more pervasive than gene amplification and associated with ER expression
[Elsheikh et al., 2008]. It has been recommended to include cyclin D1 in co-expression
pattern panels to distinguish estrogen receptor alpha / estrogen receptor beta pathways
[Yang, Pfeiffer et al., 2007].
Antioestrogen treatment by tamoxifen is a well-established adjuvant therapy for
ER positive breast cancer. Despite ER expression some tumours do not respond to
tamoxifen. Stendahl et al. observed that 55 patients having strongly ER positive
tumours with moderate or low cyclin D1 levels, responded to tamoxifen treatment
whereas the 46 patients with highly ER positive and cyclin D1 overexpressing tumours
did not show any difference in survival between tamoxifen and no treatment. Survival
in untreated patients with cyclin D1 high tumours was slightly better than for patients
with cyclin D1 low/moderate tumours. These findings suggest that cyclin D1
overexpression predicts tamoxifen treatment resistance in breast cancer [Stendahl et al.,
2004].
The objective of Rudas and Austrian Breast and Colorectal Study Group study
was to determine the clinical relevance of cyclin D1 expression in hormone receptor
positive breast cancer patients who were treated with tamoxifen based therapy.
Expression of cyclin D1 was associated with poor outcome. OS was significantly
shorter in patients with cyclin D1 positive tumours compared with patients with cyclin
D1 negative tumours (adjusted HR for death 2.47; 95% CI=1.08-5.63; P=0.03; adjusted
HR for death 1.78; 95% CI=1.36-2.34; P<0.0001). RFS was also shorter in patients with
cyclin D1 positive tumours than in patients with cyclin D1 negative tumours (adjusted
HR for relapse 2.73; 95% CI=1.50-4.96; P=0.001; adjusted HR for relapse 1.52; 95%
CI=1.14-2.04; P=0.005). Authors concluded that cyclin D1 expression is an
independent poor prognostic factor in women with early-stage, hormone receptor -
positive breast cancer who received adjuvant tamoxifen-based therapy [Rudas et al.,
2008].

61
In ER-negative breast cancer patients, overexpression of cyclin D1 is an
independent prognostic indicator. According to Cox’s multivariate analysis in the ER-
negative subgroup, overexpression of cyclin D1 had the most significant effect on
overall (P<0.02) and RFS (P<0.0058), followed by nodal status and histologic grade
[Umekita et al., 2002].
The overexpression of HER2 was associated with the high expression of cyclin
D1 and the negative expression of ER (P<0.01 for both). In the HER2 overexpressing
group of patients, low expression of cyclin D1 was associated with a significantly
higher mortality and thus worse prognosis than high expression (RR=3.2; 95% CI=1.6-
6.6) of cyclin D1 [Lee, Park et al., 2007]. No correlation between HER2, EGFR and
cyclin D1 was observed by Cho et al., 2008.
An inverse correlation between IHC panel of basal-like markers and both cyclin
D1 overexpression (P<0.0001) and CCND1 amplification (P<0.0001) was reported by
Reis-Filho, Savage et al., 2006. These findings are in agreement with the publication of
Elsheikh et al., 2008 who reported infrequent CCND1 amplification and cyclin D1
overexpression (P<0.001) in basal-like cancers [Elsheikh et al., 2008]. Cyclin D1 was
not predictive of pathological complete response to neoadjuvant chemotherapy in triple-
negative breast cancer [Li et al., 2011].
The expression of cyclin D1 is significantly positively associated with BCL2
(P=0.001) protein expression [Bilalović et al., 2005]. In Chinese patients with breast
carcinoma, expression of cyclin D1 correlated with Ki-67 expression, but not with pRb
and p53 expression [Guo et al., 2007].
Comparatively large volume of evidence is devoted to relation between cyclin
D1 overexpression or gene amplification and the survival of breast cancer patients.
However, conflicting results on the prevalence of cyclin D1 overexpression and its
correlation with CCND1 amplification and outcome of breast cancer patients have been
reported. Part of the problems have been attributed to IHC technology as the limited
sensitivity and specificity of most antibodies against cyclin D1 can result in problematic
evaluation of cyclin D1 expression [Reis-Filho, Savage et al., 2006]. The splice variants
of CCND1 gene polymorphisms, cyclin D1b and cyclin D1a can have different
influence on IHC findings and prognosis [Abramson et al., 2010].
Patients with higher cyclin D1 expression had longer OS (P=0.014) and RFS
(P=0.037). Cox regression analysis for OS showed that lymph node status, ER

62
expression, therapy, and cyclin D1 expression were independent prognostic factors with
P ranging 0.003-0.04 [Bilalović et al., 2005].
Univariate analysis revealed no association between overexpression of cyclin D1
and OS or RFS. However, in the ER-negative subgroup, overexpression of cyclin D1
significantly correlated with shorter OS (P<0.018) and RFS (P<0.014). In contrast,
there were no significant associations between overexpression of cyclin D1 and clinical
outcome in the ER-positive subgroup [Umekita et al., 2002].
When the group of the high cyclin D1 expression was analysed, the patients with
negative expression of ER showed a significantly higher mortality than those with the
positive expression of ER (RR=2.1; 95% CI=1.1-3.8). Positive expression of ER was
associated with better prognosis in patients with high cyclin D1 expression [Lee, Park et
al., 2007].
On univariate analysis cyclin D1 expression showed a correlation with longer
OS. Neither cyclin D1 nor CCND1 were independent prognostic factors for DFS or OS
[Reis-Filho, Savage et al., 2006].
In Chinese patients with breast carcinoma, 5-year survival of the patients with
positive expression of cyclin D1 (52.7%) was significantly lower than the cases with
negative expression of cyclin D1 (72.1%). Thus, positive expression of cyclin D1 could
serve as a poor prognostic marker independent of nodal metastasis and clinical stage.
Expression of cyclin D1 protein is affected more directly by overexpression of cyclin
D1 messenger RNA rather than cyclin D1 gene amplification [Guo et al., 2007].
Amplification of CCND1 has been associated with increased risk of breast
cancer recurrence. In contrast, nuclear expression of cyclin D1 protein was associated
with decreased recurrence rate (Lundgren et al., 2012). High CCND1 gene
amplification is associated with poor prognosis in ER-positive breast cancer (Roy et al.,
2010). The co-expression of cyclin D1b and cyclin D1a is associated with higher risk of
breast cancer recurrence (Abramson et al., 2010).
Aaltonen et al. analysed the expression of critical cell cycle regulators cyclin E
and cyclin D1 in familial breast cancer, focusing on BRCA mutation - negative tumours.
Cyclin E expression in tumours of BRCA1 or BRCA2 carriers is higher and cyclin D1
expression lower, than in sporadic tumours. In univariate analysis, BRCA1 tumours had
significantly more frequently high cyclin E (88%) and low cyclin D1 (84%) expression
than sporadic (54% and 49%, respectively) or familial non-BRCA1/2 (38% and 45%,
respectively) tumours. BRCA2 tumours had significantly more frequently low cyclin D1

63
expression (68%) than sporadic or familial non-BRCA1/2 tumours and significantly
more frequently high cyclin E expression than familial non-BRCA1/2 tumours. In a
logistic regression model, cyclin expression, early age of onset, and ER and HER2
status were the independent factors most clearly distinguishing tumours of BRCA1-
mutation carriers from other familial breast cancers. High cyclin E and low cyclin D1
expression were also independent predictors of BRCA2 mutation when compared with
familial non-BRCA1/2 tumours. Lower frequency of high cyclin E expression also
distinguished familial non-BRCA1/2 tumours also from sporadic ones [Aaltonen et al.,
2008].
Besides the prognostic role of cyclin D1, the predictive value of it has been
explored regarding bortezomib treatment [Ishii et al., 2006].
1.4.5. Basal differentiation by cytokeratin 5/6
Cytokeratin 5/6 has been employed as a marker of basal differentiation resulting
in association with triple negative molecular subtype that, in turn, has been related to
younger age, high tumour grade, mitoses, high nuclear grade and p53 expression [Pillai
et al., 2012; Rattan et al., 2012; Alshareeda et al., 2013]. However, the relationships
between different basal cytokeratins and the basal-like or triple negative differentiation
are complex [Alshareeda et al., 2013].

64
2. MATERIALS AND METHODS
2.1. Patients
Patients with primary, invasive breast carcinoma, diagnosed and routinely
operated between January 2008 and December 2010 at Pauls Stradins Clinical
University Hospital, Riga, were enrolled in the study. Patients without invasive
component in tumour and those who have been treated with neoadjuvant chemotherapy
before operation were excluded from study. All patients were women. In total, 383
consecutive cases corresponding to the above mentioned criteria were included in the
study. The demographic characteristics of the cases are provided in the Results section.
Records of the Clinic of Surgery were reviewed to identify the clinical and
treatment data. The morphological data were acquired in Institute of Pathology. The
gross and microscopic evaluation was performed routinely on breast cancer protocol
basis, aiming at complete description of morphological prognostic factors. The study
was approved by the Committee of Ethics, Riga Stradiņš University.
2.2. Gross examination
Breast cancer protocol comprised two subsections: clinical information and
pathology data, including gross and microscopic assessment. Clinical information
(patient identification data, age, gender and performed therapy before operation) was
filled in the Clinic of Surgery, but all morphological part (gross and microscopic data)
was assessed and filled in Institute of Pathology by a single pathologist. Gross
examination included measurement of the breast operation material weight and size in
three dimensions, assessment of tumour localization in operation specimen, colour,
edges of tumour (rounded, pushing vs. infiltrative), measurement of tumour size in three
dimensions and shortest distance between tumour and surgical resection margin. Lymph
nodes were sought for in the axillary tissue. The following tissue specimens were
submitted for microscopic investigation: tissue from surgical resection lines (including
shave examination of representative soft tissue and skin as well as perpendicular
sections from tissues between tumour and the closest point of resection surface),

65
tumour, nipple, skin overlying tumour and mammary gland tissue outside the grossly
evident tumour. All the identified lymph nodes were submitted for microscopic
investigation as well.
2.3. Microscopy
The primary tumour tissue samples after gross examination were fixed in neutral
buffered 10% formalin (Sigma-Aldrich, United States of America), processed in
vacuum infiltration processor Tissue-Tek® VIP
TM 6 (Sakura Seiki Co., Ltd., Nagano,
Japan) and embedded in paraplast (Diapath S.r.l., Belgamo, Italy) using tissue
embedding system TES 99 (Medite GmbH, Burgdorf, Germany). After embedding
tissue samples from paraffin blocks were cut in four-micron-thick sections by
microtome (Accu-cut SRM 200CW, Sakura Finetek Europa B.V., the Netherlands), put
on slides (Santaks, Yanheng Huida Medical Instruments Co., Ltd, China) and stained
with haematoxylin and eosin by automated tissue stainer (TST 44, Medite
Medizintechnik, Germany). Stained slides were covered by cover glass (Prestige, Vemi
S.R.L., Milano, Italy) employing automated cover slipper (Dako Coverslipper, Dako
Denmark A/S, Glostrup, Denmark). Standard haematoxylin and eosin stained slides
were examined under microscope to establish the following data: the tumour type, the
differentiation grade, presence of secondary changes like necrosis, sclerosis,
inflammation, microcalcifications, presence of peritumoural lymphatic, vascular and
perineural invasion. Carcinoma in situ, surgical resection margins and status of lymph
nodes were evaluated too. The tumours were diagnosed corresponding to the World
Health Organization (WHO) classification of breast tumours [Tavassoli and Devilee,
2003], the tumour grade was appreciated based upon the Scarff - Bloom - Richardson
classification modified by Elston and Ellis (Grade (G) 1 – well differentiated tumour; G
2 – moderately differentiated tumour; G 3 – poorly differentiated tumour) as described
by Elston et al., 1991. In situ ductal carcinoma lesions were classified in ductal
carcinoma in situ, non-comedocarcinoma type, lobular carcinoma in situ (LCIS) and
ductal carcinoma in situ, comedocarcinoma type. The tumour pathological T and N
characteristics (pathological TNM stage) was specified accordingly to the 7th edition
criteria of AJCC Cancer staging manual [Edge et al., 2010].

66
2.4. Immunohistochemistry
The formalin-fixed, paraffin-embedded tissues, cut at 3 micron thick sections on
electrostatic slides (Histobond, Marienfeld, Germany) were investigated by
immunohistochemistry, using heat-induced epitope retrieval in TEG buffer at pH 9.0 in
microwave oven 3x5 min. Panel of primary antibodies against oestrogen receptor alpha
(clone 1D5, dilution 1:1), progesterone receptors (clone PgR636, 1:1), E-cadherin
(clone NCH-38, 1:50), actin (clone HHF35, 1:400), p53 (DO-7, 1:400), Ki-67 (clone
MIB-1, 1:100), BCL2 oncoprotein (clone 124, 1:800), cyclooxygenase - 2 (clone CX-
294, 1:200), cyclin D1 (clone EP12, 1:80) and cytokeratin 5/6 (clone D5/16 B4, 1:100)
was employed. The optimal dilution, incubation time and antigen retrieval for BCL2
oncoprotein, cyclin D1, cyclooxygenase-2 and p53 protein was detected by total test.
Peroxidase-conjugated polymeric visualisation system EnVision was applied for the
detection of bound primary antibodies, followed by colour development by 3, 3'-
diaminobenzidine. Cell nuclei were counterstained with haematoxylin. The slides were
rinsed with distilled water and covered by cover glass (Prestige) using automated cover
slipper (Dako Coverslipper). All IHC reagents were produced by Dako, Glostrup,
Denmark. HER2 protein overexpression was detected by HercepTestTM
according to
manufacturer's (Dako) instructions. Appropriate positive and negative controls were
performed.
The cytoplasmic expression of actin was evaluated in the myoepithelial cell
layer. Loss of myoepithelial cell layer in an appropriate morphological setting was
considered an evidence of invasive breast cancer [Walker et al., 2012].
The expression of E-cadherin was evaluated in cancer cell membranes as
positive or negative. Positive expression of E-cadherine in appropriate morphological
background was considered an evidence of ductal differentiation while complete loss of
E-cadherin was the diagnostic criterion of lobular breast cancer [Arps et al., 2013].
The evaluation of ER alpha and PR status was carried out according to the
American Society of Clinical Oncology/ College of American Pathologists (ASCO/
CAP) guideline recommendations for IHC testing of ER and PR. The breast cancer case
was considered positive if at least 1% of tumour cells showed positive nuclear staining
of any intensity [Hammond et al., 2010].
Membranous staining was scored for HER2 according to the HercepTestTM
as
follows: 0 - no staining is observed or membrane staining is observed in less than 10%
67
of the tumour cells; 1 - a faint / barely perceptible membrane staining is detected in
more than 10% of the tumour cells. The cells are only stained in part of their membrane;
2 - a weak to moderate complete membrane staining is observed in more than 10% of
the tumour cells; 3 - strong complete membrane staining is observed in more than 30%
of the tumour cells. HercepTest™ is interpreted as negative for HER2 protein
overexpression (0 and 1+ staining intensity), weakly positive (2+ staining intensity), and
strongly positive (3+ staining intensity) in accordance with Dako HercepTestTM
, 16th
ed.
By ASCO/CAP guideline recommendations for HER2 testing in breast cancer HER2
staining was regarded positive if >30% of cells showed distinct and complete membrane
staining of HER2 in IHC or HER2/neu gene copies were amplified in fluorescent in situ
hybridization with ratio of HER2 to CEP17 of > 2.2 or average HER2 gene copy
number > six signals/nucleus for those test systems without an internal control probe.
The FISH technology is further described in more detail [Wolff et al., 2007].
To evaluate the expression of Ki-67, the positively stained nuclei of neoplastic
cells were counted and expressed as the percentage designated the Ki-67 index. The Ki-
67 index was considered low if the value was below 14%, but high if it was equal or
exceeded 14% of tumour cells [Goldhirsch et al., 2011].
The percentage of tumour cells with nuclear staining for p53 was graded semi-
quantitatively: score 0 = 0%, score 1 = 1-10%, score 2 = 11-50% and score 3 = >50%.
For statistical analysis, p53 expression score 0 and 1 was considered as negative, but
score 2 and 3 as positive [Yamashita et al., 2006].
The BCL2 oncoprotein expression was considered true positive if it was present
in the cytoplasm and/or membrane of cancer cells. The following semi-quantitative
model of evaluation was employed: negative by score 0 - 0% and score 1 between 0 -
10%; positive if 10 - 50% positive cells score 2+; more than 50% positive cells score 3+
[Zaha et al., 2012]. Callagy et al. recommended 10% cut-off value for BCL2 expression
[Callagy et al., 2006].
The evaluation of COX-2 expression regarded cytoplasmic reactivity. The
evaluation was made by intensity scoring as 0 (negative), 1 (weak), 2 (moderate), or 3
(strong) and by percentage of positive tumour cells. COX-2 was considered
overexpressed when the intensity was scored 2 and 3 in more than 10% of positive
tumour cells [Lee et al., 2010].

68
Cyclin D1 immunostaining was evaluated as the percentage of cyclin D1 -
stained nuclei. The cut-off point 10% cyclin D1 - positive tumour cells were applied
[Rudas et al., 2008].
Any cytoplasmic staining with the cytokeratin 5/6 in cancer cells was scored as
positive [Callagy et al., 2006].
Five breast cancer molecular subtypes were defined based on ER, PR, HER2 and
Ki-67 levels determined by IHC. Positive ER and/or PR, negative HER2, low Ki-67
(<14%) corresponded to the luminal A subtype. Luminal B subtype was divided in two
groups – luminal B (HER2 negative) and luminal B (HER2 positive). Luminal B (HER2
negative) was recognised by positive ER and/ or PR, negative HER2 and high Ki-67
(≥14%), but luminal B (HER2 positive) was identified by positive ER and/ or PR,
positive HER2 or amplified HER2/neu and any level of Ki-67. HER2 positive breast
cancer subtype was recognised by positive (3+) HER2 or amplified HER2/neu, in the
absence of ER and PR. Absent ER, PR and HER2 defined triple negative breast cancer
subgroup [Goldhirsch et al., 2011].
The routine microscopy was viewed in Clinical Microscope ECLIPSE 55i
(Nikon Corp., Tokyo, Japan), but image collection, IHC assessment and cell counting
was made by Axiolab microscope (Carl Zeiss AG, Oberkochen, Germany). Nuclear
immunostaining of ER, PR, Ki-67, p53 and cyclin D1 was evaluated by computed
morphometry using the Kappa image base program (KAPPA opto-electronics INC.,
United States of America).
2.5. Fluorescent in situ hybridization
FISH was performed using the HER2 FISH pharmDx Kit (Dako, Glostrup,
Denmark) according to the manufacturer’s instructions on 4-µm-thick paraffin sections.
Briefly, slides with tumour were deparaffinized and rehydrated at room temperature.
After pretreatment, pepsin digestion, dehydration, probe application and seal of
coverslip, automated denaturation and hybridization in Dako hybridizer (Dako,
Glostrup, Denmark) was performed overnight (16 hours) at 450C. In next day after
washing slides were counterstained with 4’,6-diamino-2-phenyl indole and covered by
coverslips. After 30 minutes fluorescence was observed in an Olympus CH30LF200
(Olympus Optical Co., LTD, Japan) fluorescence microscope at x1000 magnification

69
with a computerized imaging system. At least 50 cells in each histologic lesion and 50
control cells were evaluated for nuclear HER2/neu amplification. Results were
expressed as amplification ratio, the ratio of the number of HER2/neu to those of CEP
17 signals in the same cell. A score of 2 or greater was considered to indicate
amplification according to the manufacturer's instructions. Normal ductal epithelia and
lymphocytes in the same specimen served as control cells [Xu et al., 2003].
2.6. Statistical analysis
All calculations were performed with the IBM SPSS Statistics Version 20.0
statistical software package (International Business Machines Corp., Armonk, New
York, USA). Data were analysed using mean ± standard deviation, descriptive statistic
methods as descriptive and cross tabulation with Chi-square, bivariate correlation as
Spearman's rank correlation coefficient, non-parametric methods as Mann-Whitney U-
test and Kruskal-Wallis one-way analysis of variance by ranks and parametric method -
the one-way analysis of variance (ANOVA). Survival was evaluated by Kaplan-Meier
analysis. A value of P<0.05 was considered statistically significant.

70
3. RESULTS
3.1. Basic characteristics of the study group
The study included 383 female with primary, invasive breast carcinoma, who
were consecutively diagnosed and routinely operated between January 2008 and
December 2010 at a single University Hospital, Riga, Latvia. The age of patients ranged
from 27 to 88 years (mean ± standard deviation (SD), 59.59±12.22). The age
distribution is shown in the Figure 3.1.
Figure 3.1. Age distribution of the recruited patients.
The following surgical approach was undertaken. Two hundred twenty nine
patients underwent mastectomy (59.8%, 95% CI=54.8-64.5) as shown in Figure 3.2. and
154 ladies had segmental excisions (40.2%, 95% CI=35.5-45.2) of breast (Figure 3.3.).
In 197 cases (51.4%, 95% CI=46.5-56.1) carcinoma affected the right breast, but in 186
cases (48.6%, 95% CI=43.9-53.5) – the left breast.

71
Figure 3.2. Mastectomy material by gross examination. Note the skin retraction
due to breast cancer (star). En bloc axillary lymphadenectomy (arrow) has been
performed as well. Photo image by A.Abolins.
Figure 3.3. Segmental resection of breast tissue harbouring
breast carcinoma (arrow). Photo image by A.Abolins.
Along with breast operation, 78 sentinel lymph node excisions (21.5%, 95%
CI=17.7-26.0) and 284 axillary lymphadenectomies (78.5%, 95% CI=74.0- 82.3) were
performed. Among all the 362 lymph node operations, the lymph nodes were
successfully retrieved in 351 cases (97%, 95% CI=94.6-98.3). The mean count ± SD of
retrieved axillary lymph nodes per case were 12.5±8.2. The number of breast carcinoma
metastasis in the retrieved lymph nodes ranged 0 to 32 (mean amount ± SD, 2.8±5.0).

72
3.2. The morphological characteristics of the analysed tumours
Invasive ductal carcinomas constituted the largest part of cancers, respectively,
304 (79.4%) of 383 primary breast tumours. The other morphological types included 51
(13.3%) cases of invasive lobular carcinoma and 13 (3.4%) cases of mucinous breast
cancer. A single case (0.3%) of tubular breast carcinoma also was diagnosed. The full
spectrum of the revealed morphological types is shown in Table 3.1. and representative
Figures 3.4.-3.7.
Table 3.1.
The distribution of breast carcinoma by histological type
Histological type of breast cancer Count Frequency
%
95% confidence
interval, %
Lower
limit
Upper
limit
Invasive ductal carcinoma (Figure 3.4.) 304 79.4 75.5 83.6
Invasive lobular carcinoma (Figure 3.5.) 51 13.3 9.9 16.7
Mucinous breast carcinoma (Figure 3.6.) 13 3.4 1.6 5.2
Apocrine carcinoma 4 1.0 0.3 2.1
Invasive cribriform carcinoma 3 0.8 0.0 1.8
Metaplastic breast carcinoma 2 0.5 0.0 1.3
Medullary breast carcinoma (Figure 3.7.) 2 0.5 0.0 1.3
Invasive papillary carcinoma 3 0.8 0.0 1.8
Tubular breast carcinoma 1 0.3 0.0 0.8
Total 383 100.0
Figure 3.4. High grade invasive ductal
breast carcinoma. Haematoxylin – eosin,
original magnification 100 x.
Figure 3.5. Invasive lobular carcinoma.
Haematoxylin – eosin, original
magnification 100 x.

73
Figure 3.6. Mucinous breast carcinoma.
Haematoxylin – eosin, original
magnification 100 x.
Figure 3.7. Medullary breast carcinoma.
Haematoxylin – eosin, original
magnification 100 x.
Microphotographs by A.Abolins.
According to pathological TNM classification, all 383 tumours were
characterised as follows: pT1 – 161 tumours (42%); pT2 – 159 tumours (41.6%); pT3 –
35 tumours (9.1%) and pT4 – 28 tumours (7.3%). The relevant data are shown in
Figures 3.8.-3.11.
Figure 3.8. The distribution of breast carcinoma by local spread (pT).
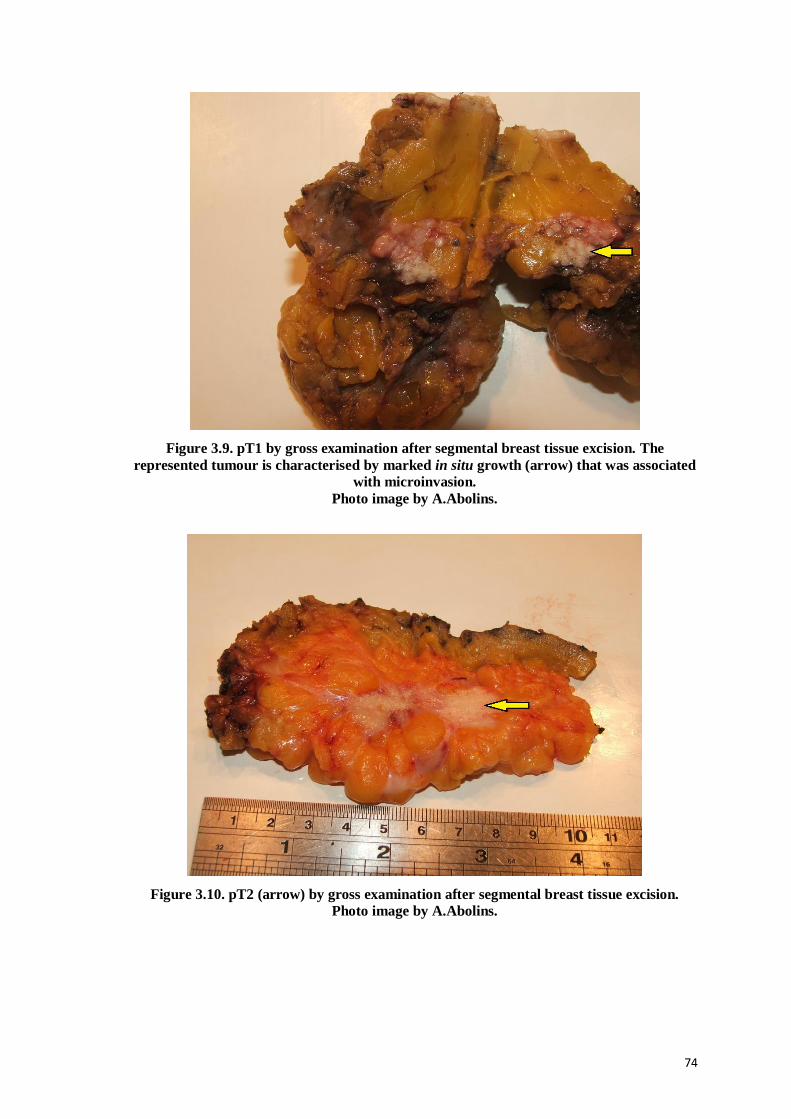
74
Figure 3.9. pT1 by gross examination after segmental breast tissue excision. The
represented tumour is characterised by marked in situ growth (arrow) that was associated
with microinvasion.
Photo image by A.Abolins.
Figure 3.10. pT2 (arrow) by gross examination after segmental breast tissue excision.
Photo image by A.Abolins.

75
Figure 3.11. pT4 (arrow) by gross examination after mastectomy.
Photo image by A.Abolins.
Regarding the pN category, there were 180 cases (47%) of pN0, 81 cases
(21.1%) of pN1 (Figure 3.12.), 54 (14.1%) cases of pN2 (Figure 3.13.) and 36 cases
(9.4%) of pN3. In 32 cases (8.4%), the lymph node status could not be established
(pNx).
Figure 3.12. Metastasis of high grade ductal breast carcinoma in the lymph node.
Haematoxylin – eosin, original magnification 100 x. Microphotograph by A.Abolins.

76
Figure 3.13. Breast carcinoma associated with metastases in axillary lymph nodes.
The tumour is bisected (stars). Four bisected metastases (arrows) are evident in axillary
tissues corresponding to pN2. Photo image by A.Abolins.
There were 12 patients (3.1%, 95% CI=1.8-5.4) affected by proved distant breast
cancer metastases (M1) at the time of breast operation. Breast carcinoma metastases
were found in bones – 33.3% (95% CI=13.8-60.9), central nervous system (brain) –
25% (95% CI=8.9-53.2), lungs – 25% (95% CI=8.9-53.2) and liver – 16.7% (95%
CI=4.7-44.8).
In breast tissues (Figure 3.14.), all cases were classified by the histological grade
as follows: G1 (Figure 3.15.) – 61 (16.0%, 95% CI=12.2-19.6), G2 (Figure 3.16.) – 138
(36.0%, 95% CI=31.9-41.1) and G3 (Figure 3.17.) – 184 cases (48.0%, 95% CI=43.8-
52.8).
Figure 3.14. Breast tissues without malignant
tumour. Haematoxylin – eosin, original
magnification 100 x.
Figure 3.15. Low grade invasive ductal
breast carcinoma. Haematoxylin – eosin,
original magnification 100 x.

77
Figure 3.16. Intermediate grade invasive
ductal breast carcinoma. Haematoxylin –
eosin, original magnification 100 x.
Figure 3.17. High grade invasive ductal
breast carcinoma. Haematoxylin – eosin,
original magnification 100 x.
Microphotographs by A.Abolins.
3.3. Immunohistochemical findings on molecular subtyping and prognostic
variables
The immunohistochemical investigation was invariably applied to verify the
histological diagnosis of invasive breast carcinoma as well as to detect the histological
type. In all cases, loss of actin-positive myoepithelial cell layer in the appropriate
morphological setting was used to confirm the invasive growth of breast carcinoma
(Figures 3.18.-3.19.). The immunohistochemical data of E-cadherin expression in
accordance with general morphology was used to classify the carcinoma as ductal or
lobular cancer by presence or loss of E-cadherin in the malignant cells, respectively
(Figures 3.20.-3.21.).
Figure 3.18. Actin expression in normal
breast tissues. Note the positive reaction
in myoepithelial cells (arrow). Anti-actin,
immunoperoxidase, original
magnification 50 x.
Figure 3.19. Lack of actin in invasive
breast carcinoma (star). Note the positive
reaction in muscular layer of small artery
(arrow). Anti-actin, immunoperoxidase,
original magnification 100 x.

78
Figure 3.20. Intense membranous
expression of E-cadherin in invasive ductal
breast carcinoma. Anti-E-cadherin,
immunoperoxidase, original magnification
100 x.
Figure 3.21. Lack of E-cadherin in invasive
lobular breast carcinoma (star). Note the
preserved positive reaction in benign lobule
(arrow). Anti-E-cadherin,
immunoperoxidase, original magnification
100 x.
Microphotographs by A.Abolins.
The further steps of immunohistochemical investigation included the evaluation
of molecular subtype. The immunohistochemical analysis was than extended by
evaluation of p53, cyclin D1, BCL2 and COX-2 protein expression (Table 3.2.).
By immunohistochemistry, expression of ER, PR, HER2 and Ki-67 was
determined and incorporated in the molecular subtype of breast carcinoma along with
appropriate FISH findings for HER2-positivity. Patient and tumour characteristics of the
383 cases based on molecular subtypes are summarized in Table 3.2. The majority of
cases were luminal A (39.9%), followed by the luminal B (HER2 negative) subtype
(32.6%). Triple negative breast cancer subtype constituted 12.8%, whereas only 8.4%
and 6.3% of tumours were classified as HER2 positive and luminal B (HER2 positive),
respectively.

79
Table 3.2.
Clinicopathological characteristics of molecular subtypes of breast cancer
Variable All cases
n=383
Luminal A
n=153 (39.9%)
Luminal B
(HER2
negative) n=125
(32.6%)
Luminal B
(HER2
positive) n=24
(6.3%)
HER2 positive
n=32
(8.4%)
Triple negative
n=49
(12.8%)
P value
Age
Mean ± SD (years)
59.59 ±
12.22
61.62 ±
11.61
59.66 ±
12.18
55.13 ±
11.80
57.56 ±
11.31
56.72 ±
13.88 0.025
Mean
tumour volume ±
SD (cm3)
18.51 ± 110.53
6.46 ± 18.09
7.96 ± 13.78
36.53 ± 88.94
7.47 ± 10.02
79.98 ± 291.80
0.001
pT 1 161
(42%)
85
(55.6%)
37
(29.6%)
8
(33.3%)
11
(34.4%)
20
(40.8%)
0.002
pT 2 159
(41.5%)
50
(32.7%)
63
(50.4%)
9
(37.5%)
18
(56.3%)
19
(38.8%)
pT 3 35
(9.2%) 6
(3.9%) 17
(13.6%) 4
(16.7%) 2
(6.3%) 6
(12.2%)
pT 4 28
(7.3%)
12
(7.8%)
8
(6.4%)
3
(12.5%)
1
(3.1%)
4
(8.2%)
pN 0 180
(51.3%) 90
(63.8%) 43
(37.7%) 9
(39.1%) 14
(48.3%) 24
(54.5%)
<0.0001 pN 1
81
(23.1%)
30
(21.3%)
33
(29.0%)
5
(21.7%)
8
(27.6%)
5
(11.4%)
pN 2 55
(15.6%)
12
(8.5%)
26
(22.8%)
8
(34.8%)
3
(10.3%)
6
(13.6%)
pN 3 35
(10.0%)
9
(6.4%)
12
(10.5%)
1
(4.4%)
4
(13.8%)
9
(20.5%)
Nx 32 12 11 1 3 5 -
G 1 61
(16.0%)
53
(34.6%)
4
(3.2%)
2
(8.4%)
1
(3.1%)
1
(2.0%)
<0.0001 G 2 138
(36.0%)
72
(47.1%)
57
(45.6%)
5
(20.8%)
2
(6.3%)
2
(4.1%)
G 3 184
(48.0%) 28
(18.3%) 64
(51.2%) 17
(70.8%) 29
(90.6%) 46
(93.9%)

80
Table 3.2. (continued)
Variable All cases
n=383
Luminal A
n=153
(39.9%)
Luminal B (HER2
negative)
n=125 (32.6%)
Luminal B (HER2
positive)
n=24 (6.3%)
HER2
positive n=32
(8.4%)
Triple
negative n=49
(12.8%)
P value
Invasion in
lymphatic
vessels (Figure
3.22.)
88
(23.0%)
22
(14.4%)
33
(26.4%)
8
(33.3%)
12
(37.5%)
13
(26.5%)
0.012
Absence of
invasion in lymphatic
vessels
295
(77.0%)
131
(85.6%)
92
(73.6%)
16
(66.7%)
20
(62.5%)
36
(73.5%)
Vascular invasion
22
(5.7%)
5
(3.3%)
9
(7.2%)
1
(4.2%)
2
(6.2%)
5
(10.0%)
0.386 Absence of
vascular invasion
361
(94.3%)
148
(96.7%)
116
(92.8%)
23
(95.8%)
30
(93.8%)
44
(89.8%)
Perineural
invasion 57
(14.9%)
25
(16.3%)
23
(18.4%)
4
(16.7%)
1
(3.1%)
4
(8.2%)
0.148 Lack of perineural
invasion
326
(85.1%)
128
(83.7%)
102
(81.6%)
20
(83.3%)
31
(96.9%)
45
(91.8%)
Ductal carcinoma
in situ, non-
comedo-carcinoma
type (Figure
3.23.)
108
(28.2%)
55
(35.9%)
34
(27.2%)
3
(12.5%)
6
(18.8%)
10
(20.4%)
<0.0001
Lobular carcinoma
in situ
28
(7.3%)
18
(11.8%)
9
(7.2%)
1
(4.2%)
0
(0.0%)
0
(0.0%)
Ductal carcinoma
in situ,
comedo-
carcinoma type (Figure
3.24.)
124
(32.4%)
26
(17.0%)
53
(42.4%)
13
(54.1%)
20
(62.4%)
12
(24.5%)
Carcinoma in situ not
observed
123
(32.1%)
54
(35.3%)
29
(23.2%)
7
(29.2%)
6
(18.8%)
27
(55.1%)

81
Table 3.2. (continued)
Variable All cases
n=383
Luminal A
n=153
(39.9%)
Luminal B (HER2
negative)
n=125 (32.6%)
Luminal B (HER2
positive)
n=24 (6.3%)
HER2
positive n=32
(8.4%)
Triple
negative n=49
(12.8%)
P value
Microcalcifications in
the tumour
(Figure 3.25.)
148
(38.6%)
68
(44.4%)
47
(37.6%)
8
(33.3%)
15
(46.9%)
10
(20.4%)
0.071
Microcalcifications in
the arteries
6
(1.6%)
2
(1.3%)
4
(3.2%)
0
(0.0%)
0
(0.0%)
0
(0.0%)
Microcalcifications
elsewhere
3
(0.8%)
3
(2.0%)
0
(0.0%)
0
(0.0%)
0
(0.0%)
0
(0.0%)
Microcalcifi
cations not observed
226
(59.0%)
80
(52.3%)
74
(59.2%)
16
(66.7%)
17
(53.1%)
39
(79.6%)
Invasive
ductal carcinoma
304
(79.4%)
105
(68.5%)
108
(86.4%)
21
(87.5%)
30
(93.8%)
40
(81.7%)
0.001
Invasive
lobular
carcinoma
51
(13.3%)
33
(21.6%)
12
(9.6%)
2
(8.3%)
1
(3.1%)
3
(6.1%)
Mucinous
breast
carcinoma
13 (3.4%)
10 (6.5%)
3 (2.4%)
0 (0.0%)
0 (0.0%)
0 (0.0%)
Apocrine carcinoma
4
(1.0%)
0
(0.0%)
0
(0.0%)
1
(4.2%)
1
(3.1%)
2
(4.1%)
Invasive
cribriform carcinoma
3
(0.8%)
3
(2.0%)
0
(0.0%)
0
(0.0%)
0
(0.0%)
0
(0.0%)
Metaplastic
breast
carcinoma
2
(0.5%)
0
(0.0%)
0
(0.0%)
0
(0.0%)
0
(0.0%)
2
(4.1%)
Medullary
breast
carcinoma
2 (0.5%)
0 (0.0%)
1 (0.8%)
0 (0.0%)
0 (0.0%)
1 (2.0%)
Invasive papillary
carcinoma
3
(0.8%)
1
(0.7%)
1
(0.8%)
0
(0.0%)
0
(0.0%)
1
(2.0%)
Tubular
breast carcinoma
1
(0.3%)
1
(0.7%)
0
(0.0%)
0
(0.0%)
0
(0.0%)
0
(0.0%)

82
Table 3.2. (continued)
Variable All cases
n=383
Luminal A
n=153
(39.9%)
Luminal B (HER2
negative)
n=125 (32.6%)
Luminal B (HER2
positive)
n=24 (6.3%)
HER2
positive n=32
(8.4%)
Triple
negative n=49
(12.8%)
P value
Positive ER
status
(Figure 3.26.)
294
(76.8%)
151
(98.7%)
121
(96.8%)
22
(91.7%)
0
(0.0%)
0
(0.0%) <0.0001
Negative
ER status 89
(23.2%)
2
(1.3%)
4
(3.2%)
2
(8.3%)
32
(100.0%)
49
(100.0%)
Positive
PR status 270
(70.5%)
137
(89.5%)
113
(90.4%)
20
(83.3%)
0
(0.0%)
0
(0.0%) <0.0001
Negative
PR status 113
(29.5%)
16
(10.5%)
12
(9.6%)
4
(16.7%)
32
(100.0%)
49
(100.0%)
Low
Ki-67 170
(44.4%)
153
(100%)
0
(0.0%)
6
(25.0%)
5
(15.6%)
6
(12.2%)
<0.0001 High Ki-67 (Figure
3.27.)
213
(55.6%)
0
(0.0%)
125
(100%)
18
(75.0%)
27
(84.4%)
43
(87.8%)
Positive HER2
status
(Figure
3.28.)
56 (14.6%)
0 (0.0%)
0 (0.0%)
24 (100%)
32 (100.0%)
0 (0.0%)
<0.0001
Negative
HER2
status
327
(85.4%)
153
(100%)
125
(100%)
0
(0.0%)
0
(0.0%)
49
(100.0%)
Positive
p53 status
(Figure 3.29.)
92
(24.1%)
9
(5.9%)
34
(27.2%)
7
(29.2%)
17
(53.1%)
25
(51.0%) <0.0001
Negative
p53 status 291
(75.9%)
144
(94.1%)
91
(72.8%)
17
(70.8%)
15
(46.9%)
24
(49.0%)
Positive
BCL2
status
(Figure 3.30.)
263
(68.7%)
133
(86.9%)
98
(78.4%)
17
(70.8%)
2
(6.2%)
13
(26.0%)
<0.0001
Negative
BCL2 status
120
(31.3%)
20
(13.1%)
27
(21.6%)
7
(29.2%)
30
(93.8%)
36
(74.0%)

83
Table 3.2. (end)
Variable All cases
n=383
Luminal A
n=153
(39.9%)
Luminal B (HER2
negative)
n=125 (32.6%)
Luminal B (HER2
positive)
n=24 (6.3%)
HER2
positive n=32
(8.4%)
Triple
negative n=49
(12.8%)
P value
Positive
COX-2
status (Figure
3.31.)
5
(1.3%)
0
(0.0%)
0
(0.0%)
0
(0.0%)
2
(6.3%)
3
(6.1%)
0.021
Negative
COX-2 status
378
(98.7%)
153
(100%)
125
(100%)
24
(100%)
30
(93.8%)
46
(93.9%)
Positive
cyclin D1 status
(Figure
3.32.)
237
(61.9%)
100
(65.4%)
94
(75.2%)
14
(58.4%)
13
(40.6%)
16
(32.7%)
<0.0001
Negative
cyclin D1
status
146
(38.1%)
53
(34.6%)
31
(24.8%)
10
(41.6%)
19
(59.4%)
33
(67.3%)
Positive
CK 5/6
(Figure
3.33.)
74
(19.3%)
21
(13.7%)
22
(17.6%)
3
(12.5%)
4
(12.5%)
24
(49.0%) <0.0001
Negative
CK 5/6 309
(80.7%)
132
(86.3%)
103
(82.4%)
21
(87.5%)
28
(87.5%)
25
(51.0%)
Figure 3.22. Cells of breast carcinoma in
lymphatic vessels. Anti-CD34,
immunoperoxidase, original
magnification 400 x.
Figure 3.23. Ductal carcinoma in situ.
Haematoxylin – eosin, original
magnification 50 x.
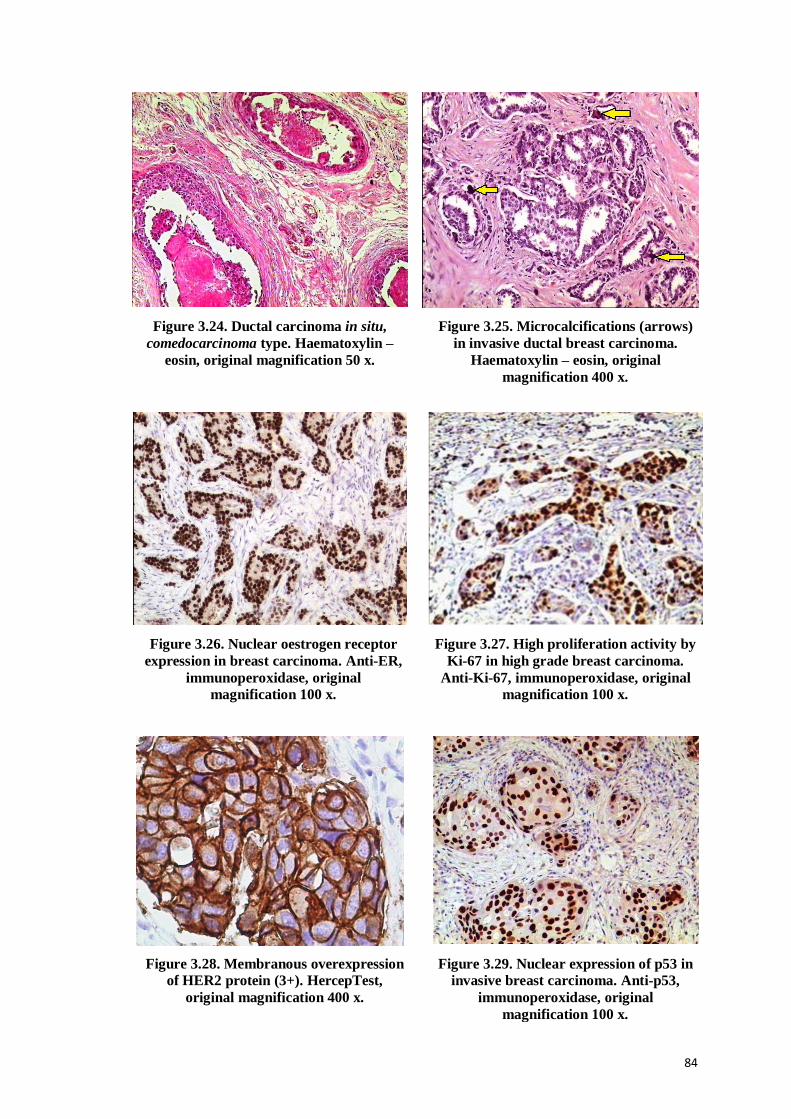
84
Figure 3.24. Ductal carcinoma in situ,
comedocarcinoma type. Haematoxylin –
eosin, original magnification 50 x.
Figure 3.25. Microcalcifications (arrows)
in invasive ductal breast carcinoma.
Haematoxylin – eosin, original
magnification 400 x.
Figure 3.26. Nuclear oestrogen receptor
expression in breast carcinoma. Anti-ER,
immunoperoxidase, original
magnification 100 x.
Figure 3.27. High proliferation activity by
Ki-67 in high grade breast carcinoma.
Anti-Ki-67, immunoperoxidase, original
magnification 100 x.
Figure 3.28. Membranous overexpression
of HER2 protein (3+). HercepTest,
original magnification 400 x.
Figure 3.29. Nuclear expression of p53 in
invasive breast carcinoma. Anti-p53,
immunoperoxidase, original
magnification 100 x.

85
Figure 3.30. Cytoplasmic expression of
BCL2 in breast carcinoma. Anti-BCL2,
immunoperoxidase, original magnification
400 x.
Figure 3.31. Cytoplasmic expression of COX-
2 in breast carcinoma (arrow). Anti-COX-2,
immunoperoxidase, original magnification
400 x.
Figure 3.32. Nuclear expression of cyclin D1
in invasive ductal breast carcinoma. Anti-
cyclin D1, immunoperoxidase, original
magnification 100 x.
Figure 3.33. Diffuse cytoplasmic expression
of CK 5/6 in breast carcinoma. Anti-CK
5/6, immunoperoxidase, original
magnification 50 x.
Microphotographs by A.Abolins.
3.4. The association between the molecular subtypes of breast carcinoma and
known prognostic variables
Although statistically significant differences were observed between the
molecular subtypes regarding the mean age at diagnosis (ANOVA F test = 2.81,
P=0.025) the mean values range within postmenopausal period, from 55.13 years in
case of luminal B (HER2 positive) to 61.62 years regarding luminal A molecular
subtype.

86
A significant difference was found when molecular subtypes were compared by
mean tumour volume at the time of diagnosis (ANOVA F test = 5.04, P<0.001), with
luminal B (HER2 positive) and triple negative breast cancers having larger volume
(36.53 and 81.44 cm3, respectively) than other molecular subtypes (luminal A - 6.47,
luminal B (HER2 negative) - 7.96 and HER2 positive - 7.47 cm3). Significant pair-wise
differences were observed when the triple negative group was compared with luminal A
(P<0.0001), luminal B (HER2 negative) (P<0.0001) and HER2 positive (P=0.003)
subtypes.
There were statistically significant (P=0.002) differences, analysing the local
spread (pT) by molecular subtype. The highest proportion of pT1 tumours were
classified as luminal A. In contrast, pT2 and pT3 tumours showed predominance of
luminal B (HER2 negative) subtype (Figure 3.34.A). The rate of pT1 tumours among
luminal A breast cancers was as high as 55.9%. The proportion of pT2 was remarkably
high in luminal B (HER2 negative) and triple negative subtypes, reaching 50.4% and
40.0%, respectively. Regarding statistical significance, higher proportion (P=0.002) of
luminal A molecular subtype is revealed in pT1, but luminal B (HER2 negative)
subtype – in pT2 stage (Figure 3.34.B).
3.34.A

87
Figure 3.34. Relevance between pT and molecular subtypes of breast cancer.
3.34.A, by pT; 3.34.B, by molecular subtype.
Statistically significant (P<0.0001) differences were observed analysing
molecular subtypes by pN stages. Tumours without metastases in regional lymph nodes
belonged mainly to luminal A and luminal B (HER2 negative) molecular subtypes
(Figure 3.35.A), but luminal A (63.9%) and triple negative (55.6%) molecular subtypes
showed the highest proportion of pN0 tumours (Figure 3.35.B).
3.35.A
3.34.B

88
Figure 3.35. Relevance between pN and molecular subtypes of breast cancer.
3.35.A, by pN; 3.35.B, by molecular subtype.
Statistically significant differences (P<0.0001) were observed regarding breast
cancer grade distribution between molecular subtypes. Significantly higher amount of
G3 cases belong to luminal B (HER2 negative) and triple negative subtypes, while G1
breast cancers are mainly luminal A molecular subtype cancers (Figure 3.36.A). The
highest proportions of high grade tumours were detected in luminal B (HER2 positive)
(70.8%), HER2 positive (90.6%) and triple negative subtypes (Figure 3.36.B).
3.36.A
3.35.B
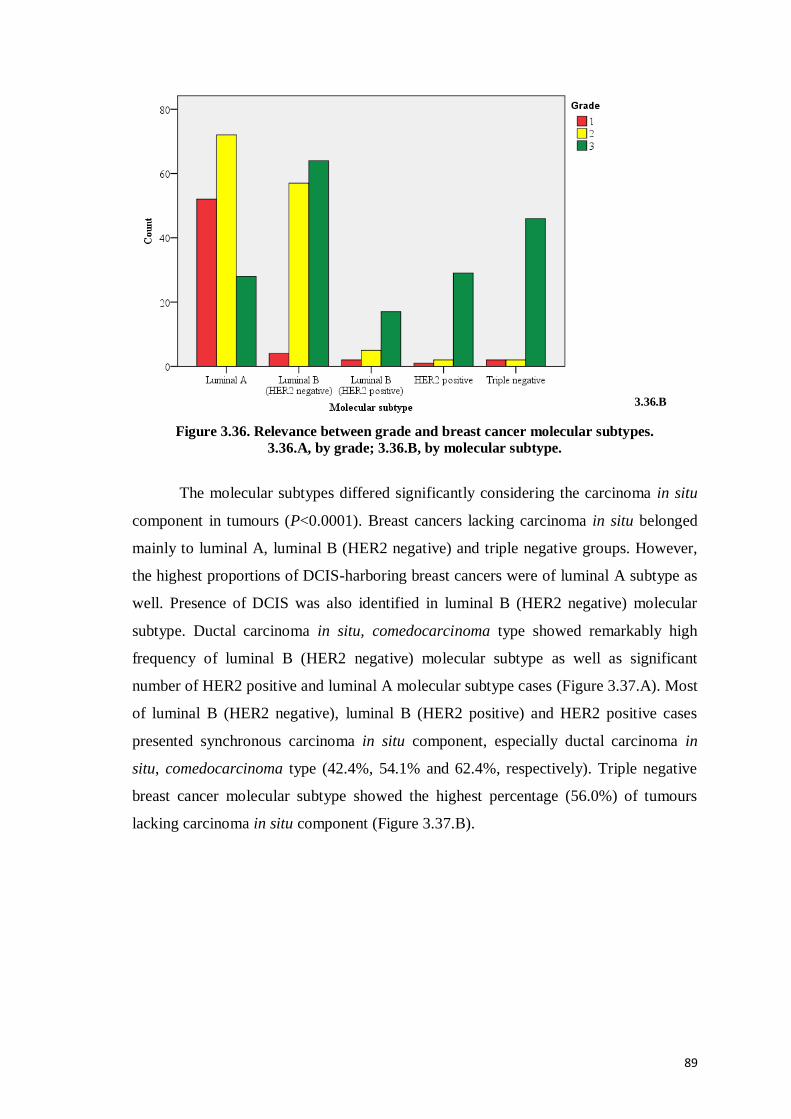
89
Figure 3.36. Relevance between grade and breast cancer molecular subtypes.
3.36.A, by grade; 3.36.B, by molecular subtype.
The molecular subtypes differed significantly considering the carcinoma in situ
component in tumours (P<0.0001). Breast cancers lacking carcinoma in situ belonged
mainly to luminal A, luminal B (HER2 negative) and triple negative groups. However,
the highest proportions of DCIS-harboring breast cancers were of luminal A subtype as
well. Presence of DCIS was also identified in luminal B (HER2 negative) molecular
subtype. Ductal carcinoma in situ, comedocarcinoma type showed remarkably high
frequency of luminal B (HER2 negative) molecular subtype as well as significant
number of HER2 positive and luminal A molecular subtype cases (Figure 3.37.A). Most
of luminal B (HER2 negative), luminal B (HER2 positive) and HER2 positive cases
presented synchronous carcinoma in situ component, especially ductal carcinoma in
situ, comedocarcinoma type (42.4%, 54.1% and 62.4%, respectively). Triple negative
breast cancer molecular subtype showed the highest percentage (56.0%) of tumours
lacking carcinoma in situ component (Figure 3.37.B).
3.36.B

90
Figure 3.37. Frequency of carcinoma in situ components in different breast cancer
molecular subtypes. 3.37.A, by carcinoma in situ; 3.37.B, by molecular subtype.
Categorizing the breast cancer cases by histological forms, significant difference
between molecular subtype distribution (P<0.0001) was observed. Ductal breast cancer
cases represent full spectrum of molecular subtypes with predominance of luminal B
(HER2 negative) and luminal A, followed by triple negative molecular subtype. The
lobular breast cancer is heterogeneous by the molecular subtype, but luminal A is the
most frequent subtype followed by less frequent occurrence of luminal B (HER2
3.37.A
3.37.B

91
negative) molecular subtype in contrast with ductal breast carcinoma (Figure 3.38.A).
Invasive ductal carcinoma was most frequent histological form of breast cancer in all
molecular subtypes. Invasive lobular carcinoma was next frequent breast cancer form,
especially among luminal A (21.7%) and luminal B (HER2 negative) molecular
subtypes (16.9%), while all reported metaplastic or anaplastic carcinomas (9.6%) were
of triple negative molecular subtype (Figure 3.38.B).
Figure 3.38. Distribution of the morphological type of breast carcinoma by molecular
subtypes. 3.38.A, by tumour histological type; 3.38.B, by molecular subtype.
3.38.A
3.38.B

92
3.5. The mutual associations between morphological variables
The lymph nodes were detected and examined in 351 cases (91.6%). Among
tumours measuring less than 2 cm in largest diameter (pT1), metastases in lymph nodes
were mostly absent – not found in 107 cases (75.4%). In pT2 cancers, the pN
distribution was different: metastases were not found in 39.3% of cases, 1-3 positive
lymph nodes were indentified in 30% of cases, but 10 or more metastases in axillary
lymph nodes were found in 10.7%. Larger tumours were associated with more
aggressive spread as in pT4 cases there were 4-9 positive lymph nodes in 40%, but ≥10
in 36% of cases (Figure 3.39.A). In general, statistically significant differences were
observed (P<0.0001), including the following findings.
Evaluating the lymph node – negative and positive cases, pT1 tumours (59.4%)
predominated in pN0 group. In contrast, pT4 was rare finding in pN0 constituting only
1.1%. In the pN1 group showing 1-3 positive lymph nodes, pT2 was the most common
finding constituting 55.6%. Similarly, pN2 (4-9 positive lymph nodes) and pN3 (≥10
positive lymph nodes) were dominated by pT2 composing 54.5% and 45.7%,
respectively (Figure 3.39.B). Statistically significant differences were observed
(P<0.0001).
Figure 3.39. Relevance between pT and pN findings. 3.39.A, by pT; 3.39.B, by pN.
The association between pT and pN parameters was statistically insignificant
(P=0.76) in cases undergoing only sentinel node examination. In contrast, the
differences were statistically significant (P<0.0001) in cases where axillary lymph
nodes dissection was performed.
3.39.A 3.39.B

93
Axillary lymph node dissection was attempted by the surgeon in 284 cases. In
275 (96.8%) of these cases, the nodes were detected. Among pT1 tumours, in 61 cases
(67%) metastases were not found but 20.9% cases had 1-3 positive lymph nodes
corresponding to pN1. Among pT2 breast cancers, metastases were absent in 31.5%, but
pN1 was slightly more common finding (33.1%). Among pT3 tumours, there was slight
predominance of pN1 finding (27.6%) in comparison with pN2, pN3 or pN0. Among
pT4 tumours there was predominance of pN2 and pN3 showing the frequency of 40%,
respectively. Just 8% of pT4 cases were free of lymph node metastases (Figure 3.40.A).
Statistically significant differences were present (P<0.0001).
Evaluating lymph node negative and positive cases, the pN0 group mostly
comprised pT1 cancers (55%). Presence of pT4 was rare finding in this group (8%).
pN1, pN2 and pN3 cancers showed predominance of pT2 tumours with frequencies
58.1%, 54.5% and 45.7%, respectively (Figure 3.40.B). Statistically significant
differences were identified (P<0.0001).
Figure 3.36. Relevance between pT and pN findings in axillary lymph node dissection
group. 3.40.A, by pT; 3.40.B, by pN.
Statistical analysis has disclosed correlation between pT and tumour grade
(P=0.003). In pT1 group, the frequency of G2 or G3 carcinoma was equal reaching
38.5%. In contrast, G3 was the most frequent finding in pT2 group (50.9%), pT3 (60%)
and pT4 cases (71.4%) as shown in Figure 3.41.A. pT3 and pT4 cancers were
characterised by rare occurrence of G1 (3.3% and 4.9% correspondingly).
3.40.B 3.40.A

94
Among G2 group, there was slight predominance of pT1 (44.9%), while G3
tumours were more frequently of pT2 (44%) as shown in Figure 3.41.B. Statistically
significant differences were identified (P=0.003).
Figure 3.41. Relevance between the local tumour spread (pT) and grade.
3.41.A, by pT; 3.41.B, by grade.
Analysing the association between tumour grade and lymph node metastases, the
following findings were obtained. Intermediate grade and high grade tumours
constituted similar frequency (G2 - 40.6%, G3 – 39.4%) in tumour group without lymph
node metastases. Among pN1 tumours, the frequency of G2 and G3 also was equal:
44.4% in each group. High number of metastases in lymph nodes (between 4-9, pN2
and ≥10, pN3, correspondingly) were associated with high grade tumours (Figure
3.42.A).
Among pN0 tumours, there were low grade, intermediate and high grade
tumours, comprising 66.7%, 56.2% and 42.5% of the respective G group. Intermediate
and high grade tumours have presented with low number of metastases in substantial
number of patients: G2/pN1 - 27.7%, G3/pN1 - 21.6%. However, high grade tumours
have been associated with higher number of metastases: G3/pN3 - 14.4%, G2/pN3 -
5.4% and G1/pN3 - 7.4%. The data are revealed in more detail in Figure 3.42.B.
Statistically significant differences were identified (P=0.002).
3.41.A 3.41.B

95
Figure 3.38. Relevance between tumour grade and extent of lymph node metastases (pN).
3.42.A, by pN; 3.42.B, by grade.
The invasion in lymphatic vessels was mostly absent (Figure 3.43.A). Among
cases showing peritumorous invasion in lymphatic vessels, pT2 cases were predominant
as shown in Figure 3.43.B (P=0.03).
Figure 3.43. Relevance between local tumour spread (pT) and invasion in lymphatic
vessels. 3.43.A, by pT; 3.43.B, by invasion in lymphatic vessels.
The invasion in veins was also mostly not observed (Figure 3.44.A). Among
cases showing invasion in veins, pT2 cases were predominant as shown in Figure
3.44.B (P=0.04).
3.42.B 3.42.A
3.43.B 3.43.A

96
Figure 3.44. Relevance between pT and tumour invasion in veins based on these factors.
3.44.A, by pT; 3.44.B, by invasion in veins.
Most of the studied breast cancer cases did not show perineural growth
(P=0.005). The data are shown in Figure 3.45.A. As it was seen in tumour invasion in
lymphatic vessels and veins, perineural invasion was observed more in pT2 stage than
other pT stages (Figure 3.45.B). The difference is statistically significant (P=0.005).
Figure 3.45. Relevance between pT and perineural tumour invasion.
3.45.A, by pT; 3.45.B, by perineural invasion.
Among pN0 cases, in 16.7% cases breast cancer cells can be identified in the
peritumorous lymphatic vessels despite absence of breast cancer metastases in axillary
lymph nodes (P<0.0001). Among pN3 cancers, the cases with identifiable lymphatic
vessel invasion are more frequent than cases not displaying such clear-cut evidence of
metastatic spread (Figure 3.46.A).
3.44.A 3.44.B
3.45.A 3.45.B

97
Considering breast carcinoma cases not showing evidence of lymphatic vessel
invasion, the status of lymph nodes reflect the findings in the general group with pN0
predominance and progressively lower rate of more extensive metastatic process.
Among the cases showing the presence of cancer cells in lymphatic capillaries, the
predominance of pN0 is lost as shown in Figure 3.46.B (P<0.0001).
Figure 3.46. Relevance between pN and tumour invasion in lymphatic vessels.
3.46.A, by pN; 3.46.B, by invasion in lymphatic vessels.
Most of the studied breast cancer cases did not show invasion in veins; this
observation was true for pN0, pN1, pN2 and pN3. The data are shown in Figure 3.47.A.
As shown in Figure 3.47.B, invasion in veins is associated with higher occurrence of
pN3 (P<0.0001).
Figure 3.47. Relevance between pN and tumour invasion in veins.
3.47.A, by pN; 3.47.B, by invasion in veins.
3.46.A 3.46.B
3.47.A
AA
3.47.B

98
Most of the studied breast cancer cases did not show perineural growth (P=0.02)
regardless of pN group. The data are shown in Figure 3.48.A. Among cases not showing
perineural growth, pN0 show distinct predominance in contrast to perineurally invading
cases (P=0.02). The data are presented in Figure 3.48.B.
Figure 3.48. Relevance between pN and perineural tumour invasion.
3.48.A, by pN; 3.48.B, by perineural invasion.
The relevance between breast cancer grade and observed cancer invasion in
lymphatic vessels was assessed as well. In all G groups, cancer invasion in the
lymphatic vessels was mostly absent. However, G3 group harbour relatively more cases
showing such invasion in contrast to G1 (Figure 3.49.A). Similarly, comparing the
cancer groups presenting with lymphatic vessels invasion or lacking such evidence
(Figure 3.49.B), high grade breast cancers are predominant but the frequency of G1
cancer is relatively higher among cases lacking lymphatic invasion (P=0.002).
Figure 3.49. Relevance between breast cancer grade and invasion in lymphatic vessels.
3.49.A, by grade, 3.49.B, by invasion in lymphatic vessels.
3.48.A 3.48.B
3.49.A 3.49.B

99
Breast cancer invasion in veins was rare observation in all grades (Figure
3.50.A), so the dominant finding was absence of such invasion. The invasion was
identified with higher frequency in high grade breast cancer cases in comparison to
intermediate or low grade breast cancers. High grade cancer cases compose the greatest
part of tumours regardless of venous invasion (P=0.043); however, G1 cancers almost
exclusively belong to the group lacking venous invasion (Figure 3.50.B).
Figure 3.46. Relevance between cancer grade and tumour invasion in veins.
3.50.A, by grade; 3.50.B, by invasion in veins
Ductal breast cancer frequently had high grade in contrast with lobular and
tubular breast cancer characterised by low grade (Figure 3.51.A). Mucinous and
invasive papillary breast cancers typically were G2 (P<0.0001). Medullary, apocrine
and metaplastic breast cancers (Figure 3.51.B) are invariably G3 tumours (P<0.0001).
3.50.A 3.50.B
3.51.A

100
Figure 3.51. Relevance between breast cancer grade (G) and tumour morphological type.
3.51.A, by tumour histological type, 3.51.B, by G.
Among the breast cancers with high proliferation activity, pT2 tumours
(measuring 2-5cm in largest diameter) were the most frequent finding, followed by pT1.
In low Ki-67 group, pT1 cancers are dominating and pT3 – distinctly rare (Figure
3.52.A). Examining pT by Ki-67 (Figure 3.52.B), it can be concluded that higher size is
associated with higher proliferation activity by Ki-67 (P=0.001).
Figure 3.52. Relevance between breast cancer proliferation activity (Ki-67) and cancer size
(pT). 3.52.A, by Ki-67 status; 3.52.B, by pT.
Statistical methods approved statistically significant association between
presence and number of metastatic lymph nodes (pN) and PR status in breast cancer
cells (P=0.03). Positive PR are more frequently found in breast cancers without
3.51.B
3.52.A 3.52.B
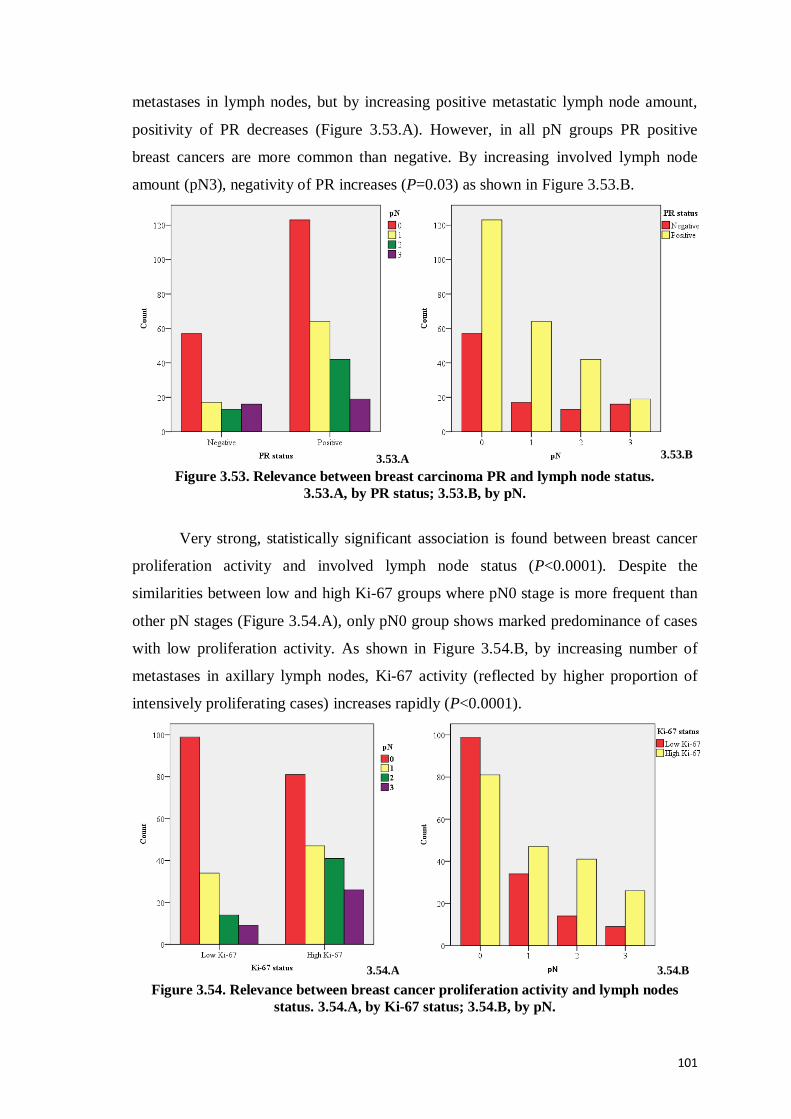
101
metastases in lymph nodes, but by increasing positive metastatic lymph node amount,
positivity of PR decreases (Figure 3.53.A). However, in all pN groups PR positive
breast cancers are more common than negative. By increasing involved lymph node
amount (pN3), negativity of PR increases (P=0.03) as shown in Figure 3.53.B.
Figure 3.53. Relevance between breast carcinoma PR and lymph node status.
3.53.A, by PR status; 3.53.B, by pN.
Very strong, statistically significant association is found between breast cancer
proliferation activity and involved lymph node status (P<0.0001). Despite the
similarities between low and high Ki-67 groups where pN0 stage is more frequent than
other pN stages (Figure 3.54.A), only pN0 group shows marked predominance of cases
with low proliferation activity. As shown in Figure 3.54.B, by increasing number of
metastases in axillary lymph nodes, Ki-67 activity (reflected by higher proportion of
intensively proliferating cases) increases rapidly (P<0.0001).
Figure 3.54. Relevance between breast cancer proliferation activity and lymph nodes
status. 3.54.A, by Ki-67 status; 3.54.B, by pN.
3.53.A 3.53.B
3.54.A 3.54.B

102
Breast cancer grade and ER status (negativity or positivity) in breast cancer cells
show statistically significant association (P<0.0001). Negativity of ER can be found
more frequently in G3 breast cancers (P<0.0001), but it is distinctly rare finding in low
or intermediate grade cancers (Figures 3.55.A and 3.55.B). The predominance of
intermediate grade cancers among the ER positive group reflects lower number of G1
cases in the general group as well as tendency to ER negativity in high-grade cancers.
Figure 3.55. Relevance between cancer grade and ER.
3.55.A, by ER status; 3.55.B, by grade.
Breast cancer grade and negativity or positivity of PR in breast cancer cells
shows statistically significant association (P<0.0001) similarly as between ER and G
(Figures 3.56.A and Figure 3.56.B). There is association between G3 and negative PR
status (P<0.0001).
Figure 3.56. Relevance between cancer grade and PR.
3.56.A, by PR status; 3.56.B, by grade.
3.55.A 3.55.B
3.56.A 3.56.B

103
Analysing by Ki-67 status, tumours of all grades are almost equally represented
in the low proliferation group, but tumours characterised by high proliferation rate show
distinct predominance of high grade tumours (Figure 3.57.A). The observed differences
are statistically significant (P<0.0001). In high grade cancer group, the proliferation
activity was also high in most cases (Figure 3.57.B). The proportion of intensively
proliferating cancers increases by growing tumour grade (P<0.0001).
Figure 3.57. Relevance between breast cancer proliferation activity (Ki-67) and grade.
3.57.A, by Ki-67; 3.57.B, by grade.
HER2 receptor overexpression or absence in breast cancer cells is another
prognostic and predictive factor. Subdividing all breast cancers in negative and positive
HER2 receptor groups (Figure 3.58.A) there is evidence that HER2 negative group is
heterogeneous by grade. In contrast, the HER2 positive breast cancer group shows
clear-cut evidence of predominance of high grade breast cancers (P<0.0001). Analysing
the breast cancer by grade (Figure 3.58.B), G1 and G2 cancers are predominantly HER2
negative, while G3 cancers comprise significant number of HER2 positive cases thus
representing another evidence of heterogeneous structure (P<0.0001).
3.57.A 3.57.B

104
Figure 3.58. Relevance between breast cancer HER2 receptor status and grade.
3.58.A, by HER2 status; 3.58.B, by grade.
The p53-negative breast cancers represent heterogeneous group by cancer grade
(Figure 3.59.A). If p53 is overexpressed it is seen in high grade breast cancer cells in
high level (P<0.0001). Analysing the breast cancers by grade (Figure 3.59.B), higher
number of p53 protein-positive cases is observed in G3 group (P<0.0001).
Figure 3.59. Relevance between breast cancer grade and expression of aberrant p53
protein. 3.59.A, by p53 expression; 3.59.B, by grade.
3.58.A 3.58.B
3.59.A 3.59.B

105
Among BCL2 negative cases, high grade cancers are the most frequent finding
(Figure 3.60.A). BCL2 positive group is heterogeneous, showing high percentage of
low and intermediate grade cancers (P<0.0001). The number of BCL2 negative cases
increases by increasing grade (Figure 3.60.B). The difference is statistically significant
(P<0.0001).
Figure 3.60. Relevance between breast cancer grade and BCL2 protein expression.
3.60.A, by BCL2 expression; 3.60.B, by grade.
The p53 negative breast cancer group shows distinct predominance of ER
positive cases: 15.4% ER negative versus 84.6% ER positive breast cancer cases
(Figure 3.61.A). The p53 positive group is heterogeneous regarding ER receptor status:
51.9% ER negative versus 48.1% ER positive cases (P<0.0001). The ER positive cases
(Figure 3.61.B) are heterogeneous by p53 protein status but negative cases predominate
in p53 positive group (P<0.0001).
Figure 3.61. Relevance between breast cancer ER status and aberrant p53 protein
expression. 3.61.A, by p53 expression; 3.61.B, by ER status.
3.60.A 3.60.B
3.61.A 3.61.B

106
Similar data were obtained considering the association between PR status and
p53 protein expression (Figure 3.62.A). The PR expression is observed more frequently
in p53 negative cases (P<0.0001). Comparing PR positive and negative breast cancer
cases, the p53 expression is more frequent in negative PR group (Figure 3.62.B). The
difference is statistically significant (P<0.0001).
Figure 3.62. Relevance between breast cancer PR status and p53 protein expression.
3.62.A, by p53 expression; 3.62.B, by PR status.
Both p53 positive and negative groups share fraction of HER2 positive cases
(Figure 3.63.A). However, p53 negative group includes higher number of HER2
negative cases (P=0.001). Dividing the study group into HER2 positive and negative
cases (Figure 3.63.B), HER2 negative group contains more p53 negative cases as HER2
positive group (P=0.001).
Figure 3.63. Relevance between breast cancer HER2 receptor status and aberrant p53
protein expression. 3.63.A, by p53 expression; 3.63.B, by HER2 receptor status.
3.62.A 3.62.B
3.63.A 3.63.B
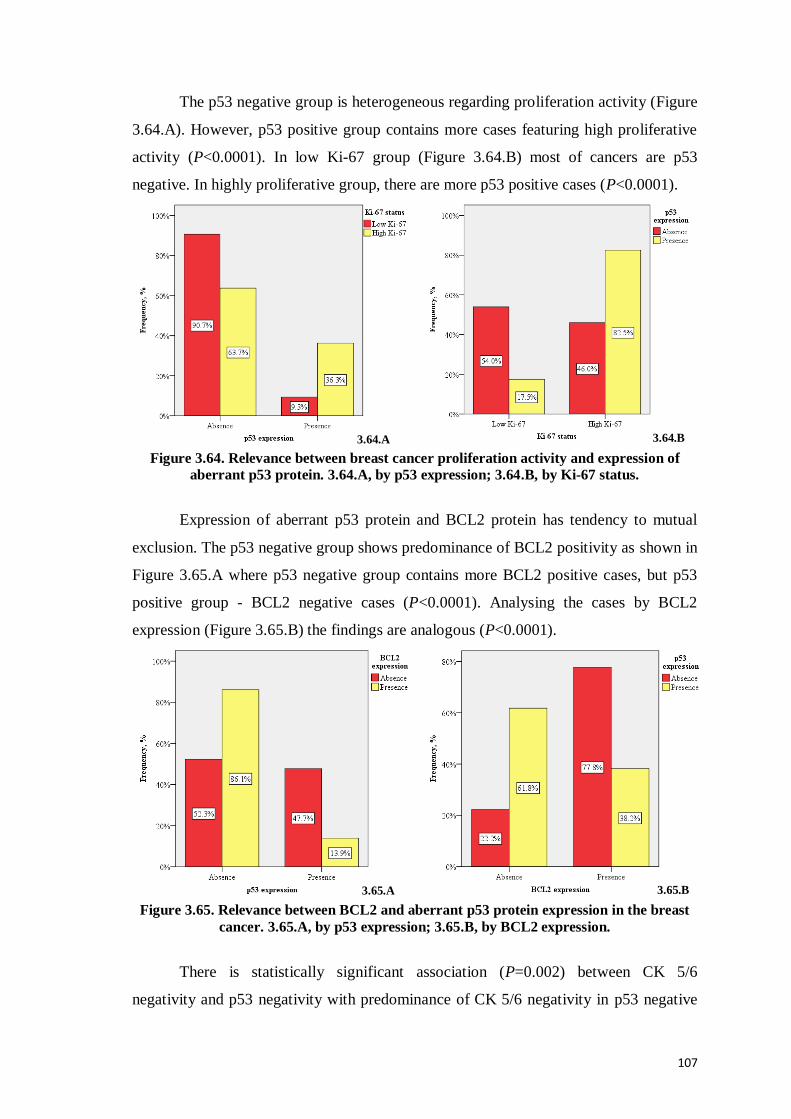
107
The p53 negative group is heterogeneous regarding proliferation activity (Figure
3.64.A). However, p53 positive group contains more cases featuring high proliferative
activity (P<0.0001). In low Ki-67 group (Figure 3.64.B) most of cancers are p53
negative. In highly proliferative group, there are more p53 positive cases (P<0.0001).
Figure 3.64. Relevance between breast cancer proliferation activity and expression of
aberrant p53 protein. 3.64.A, by p53 expression; 3.64.B, by Ki-67 status.
Expression of aberrant p53 protein and BCL2 protein has tendency to mutual
exclusion. The p53 negative group shows predominance of BCL2 positivity as shown in
Figure 3.65.A where p53 negative group contains more BCL2 positive cases, but p53
positive group - BCL2 negative cases (P<0.0001). Analysing the cases by BCL2
expression (Figure 3.65.B) the findings are analogous (P<0.0001).
Figure 3.65. Relevance between BCL2 and aberrant p53 protein expression in the breast
cancer. 3.65.A, by p53 expression; 3.65.B, by BCL2 expression.
There is statistically significant association (P=0.002) between CK 5/6
negativity and p53 negativity with predominance of CK 5/6 negativity in p53 negative
3.64.A 3.64.B
3.65.A 3.65.B

108
group (Figure 3.66.A). Similarly, subdividing the breast cancers by CK 5/6 expression
in positive and negative groups (Figure 3.66.B) p53 negativity is more frequent in CK
5/6 negative breast cancer group (P<0.0001).
Figure 3.66. Relevance between CK 5/6 and aberrant p53 protein expression in breast
cancer. 3.66.A, by p53 expression; 3.66.B, by CK 5/6 expression.
Determining BCL2 positivity or negativity in the breast cancer cells and
comparing the findings with ER expression (Figure 3.67.A), the BCL2 positive group
includes higher number of ER receptor positive cases (P<0.0001). Breast cancers with
positive ER receptors are more frequently BCL2 positive (Figure 3.67.B). The
difference is statistically significant (P<0.0001).
Figure 3.67. Relevance between breast cancer ER status and BCL2 protein expression.
3.67.A, by BCL2 expression; 3.67.B, by ER status.
Similar results are obtained regarding PR and BCL2 expression. In BCL2
negative group, there are more PR negative cases but BCL2 positive breast cancer cells
mostly express PR (Figure 3.68.A). The difference is statistically significant
3.66.A 3.66.B
3.67.A 3.67.B

109
(P<0.0001). PR positive breast cancer cases show statistically significantly more
frequent BCL2 positivity as well (Figure 3.68.B).
Figure 3.68. Relevance between breast cancer PR status and BCL2 protein expression.
3.68.A, by BCL2 expression; 3.68.B, by PR status
The BCL2 negative group is heterogeneous regarding HER2 overexpression
(Figure 3.69.A). BCL2 positive group is predominantly HER2 negative (P<0.0001).
Similarly, HER2 negative group contains more BCL2 positive cases as HER2 positive
group (Figure 3.69.B) where more frequent occurrence of BCL2 negative cases is
observed (P<0.0001).
Figure 3.69. Relevance between breast cancer HER2 receptor status and BCL2 protein
expression. 3.69.A, by BCL2 expression; 3.69.B, by HER2 receptor status.
Regarding proliferation activity in breast cancer cells, high proliferative activity
is more frequent in BCL2 negative group while low proliferation is more typical finding
within BCL2 positive group (Figure 3.70.A). The difference is statistically significant
(P<0.0001). The association is even more clearly evident, if the groups are separated by
3.68.A 3.68.B
3.69.A 3.69.B

110
Ki-67 expression (Figure 3.70.B). The cases showing low proliferation activity also
mostly are BCL2 positive (P<0.0001). Again, the heterogeneity of tumours is evident
by Ki-67 and BCL2 analysis.
Figure 3.70. Relevance between breast cancer proliferation activity and BCL2 protein
expression. 3.70.A, by BCL2 expression; 3.70.B, by Ki-67 status.
Statistically significant data are shown regarding the association between two
new potentially prognostic and predictive factors as BCL2 and cyclin D1 (P<0.0001).
The BCL2 positive group includes more cyclin D1 positive cases (Figure 3.71.A).
Similarly, cyclin D1 negative group is heterogeneous by BCL2 expression (Figure
3.71.B). In contrast, cyclin D1 positive group show clear-cut predominance of BCL2
positive cases (P<0.0001).
Figure 3.71. Relevance between cyclin D1 and BCL2 protein expression in breast cancer.
3.71.A, by BCL2 expression; 3.71.B, by cyclin D1 expression.
3.70.A 3.70.B
3.71.A 3.71.B

111
There are statistically significant data (P=0.02) regarding the association of other
potentially prognostic and predictive factors as BCL2 and CK 5/6 (Figures 3.72.A and
3.72.B). The BCL2 positive group shows marked predominance of CK 5/6 negative
cases (P=0.02).
Figure 3.72. Relevance between CK 5/6 and BCL2 protein expression in breast cancer.
3.72.A, by BCL2 expression; 3.72.B, by CK 5/6 expression.
COX-2 negativity is statistically significantly associated with ER expression in
the breast cancer (P=0.002) as shown in Figure 3.73.A and Figure 3.73.B.
Figure 3.73. Relevance between breast cancer ER status and COX-2 expression.
3.73.A, by COX-2 expression; 3.73.B, by ER status.
3.72.A 3.72.B
3.73.A 3.73.B

112
Similar association was observed between COX-2 negativity and PR expression
(P=0.008) and was shown in Figure 3.74.A and Figure 3.74.B.
Figure 3.74. Relevance between breast cancer PR status and COX-2 expression.
3.74.A, by COX-2 expression; 3.74.B, by PR status.
Statistically significant association was found between the two potential
prognostic and predictive factors as COX-2 and CK 5/6 (P=0.001). The COX-2
positivity is observed only in a subgroup of CK 5/6 positive cases (Figure 3.75.A) but is
virtually absent in CK 5/6 negative cases (Figure 3.75.B) characterised by P=0.001. The
COX-2 negative cases are observed both in CK 5/6 positive and CK 5/6 negative
groups.
Figure 3.75. Relevance between CK 5/6 and COX-2 expression in breast cancer.
3.75.A, by COX-2 expression; 3.75.B, by CK 5/6 expression.
3.74.A 3.74.B
3.75.A 3.75.B

113
Cyclin D1 expression shows strong association with presence of ER (Figure
3.76.A). The finding is statistically significant (P<0.0001). The analysis is confirmed
(P<0.0001) if cyclin D1 expression is evaluated by ER status (Figure 3.76.B).
Figure 3.76. Relevance between breast cancer ER status and cyclin D1 expression.
3.76.A, by cyclin D1 expression; 3.76.B, by ER status.
Similar data are obtained regarding cyclin D1 and PR status (Figures 3.77.A and
Figure 3.77.B), where majority of PR positive cases are in the cyclin D1 positive group
(P<0.0001)
Figure 3.77. Relevance between breast cancer PR status and cyclin D1 expression.
3.77.A, by cyclin D1 expression; 3.77.B, by PR status.
3.76.A 3.76.B
3.77.A 3.77.B

114
CK 5/6 negativity is observed in both cyclin D1 negative and positive groups
with predominance of CK 5/6 negativity in cyclin D1 positive group (Figures 3.78.A
and Figure 3.78.B). The difference is statistically significant (P=0.004).
Figure 3.78. Relevance between cyclin D1 and CK5/6 expression in breast cancer.
3.78.A, by cyclin D1; 3.78.B, by CK 5/6 expression.
In the CK 5/6 negative group, ER positivity is observed more frequently than
lack of ER expression (Figure 3.79.A). The CK 5/6 positive breast cancers show
contrary reciprocal relationship between ER positive and negative cases. The difference
is statistically significant (P=0.003). CK 5/6 negativity is associated with ER positive
group, but ER negative group shows more CK 5/6 positive cases (Figure 3.79.B); the
finding is significant as well (P=0.003).
Figure 3.79. Relevance between breast cancer ER status and CK 5/6 expression.
3.79.A, by CK 5/6 expression; 3.79.B, by ER status.
3.78.A 3.78.B
3.79.A 3.79.B

115
Similar data are obtained regarding PR and CK 5/6 expression. The data are
represented in Figures 3.80.A and 3.80.B. The association is statistically significant
(P=0.004).
Figure 3.80. Relevance between breast cancer PR status and CK 5/6 expression.
3.80.A, by CK 5/6 expression; 3.80.B, by PR status.
The analysis of proliferation activity by cytokeratin 5/6 status is embarrassed by
the fact that majority of breast cancer cases are CK 5/6 negative (Figure 3.81.A).
However, the CK 5/6 negative group is characterised by predominance of cases
exhibiting low proliferation activity in contrast to CK 5/6 positive group showing more
frequent occurrence of breast carcinoma with high proliferation fraction (P=0.047).
Among cases showing high proliferation activity (Figure 3.81.B) there are more CK 5/6
positive cases (P=0.047).
Figure 3.81. Relevance between breast cancer proliferation activity and CK 5/6
expression. 3.81.A, by CK 5/6 expression; 3.81.B, by Ki-67 status.
3.80.A 3.80.B
3.81.A 3.81.B

116
3.6. Survival
In the observed period, 39 patients have died from breast cancer. In the general
group of 383 patients such number of undesirable events is low embarrassing statistic
evaluation. However, Kaplan-Meier survival analysis by pT shows statistically
significant association between pT stage and survival. pT4 stage is associated with
higher death rate within the first year in comparison with pT2 or pT3 (P<0.0001) as
shown in Figure 3.82.
Figure 3.82. Kaplan-Meier breast carcinoma specific survival in relation to size (pT) of
breast carcinoma.
More than 10 metastatic lymph nodes is associated with poor outcome 11
months earlier comparing to cases without metastases (P<0.0001) or 7 months earlier
than pN2 cases (P<0.0001). Survival in patients having 1-3 positive lymph nodes
corresponding to N1 is the same as cases without lymph node metastases (P<0.0001) as
shown in Figure 3.83.
Figure 3.83. Kaplan-Meier breast carcinoma specific survival in relation to
metastases in lymph nodes (pN).

117
Kaplan-Meier survival analysis by breast cancer grade shows statistically
significant association between grade and survival (P=0.001), but analysed data are
affected by small account of G1 cases (Figure 3.84.).
Figure 3.84. Kaplan-Meier breast carcinoma specific survival in relation to grade
of breast carcinoma.
Patients with luminal A, luminal B (HER2 negative) and HER2 positive breast
carcinoma molecular subtypes statistically significantly survive 6 months longer than
patients with triple negative breast carcinoma molecular subtype (P<0.0001, P<0.0001,
P=0.001, respectively). Patients with luminal B (HER2 positive) breast carcinoma
molecular subtype live 5 months longer than triple negative molecular subtype patients
(P=0.02) as shown in Figure 3.85.
Figure 3.85. Kaplan-Meier breast carcinoma specific survival in relation to molecular
subtypes of breast carcinoma.

118
Among the new potential immunohistochemical markers as p53, BCL2, COX-2,
cyclin D1 and CK 5/6, Kaplan-Meier survival analysis shows statistically significant
association between survival and expression or absence of p53 (P=0.03) and expression
or absence of BCL2 (P=0.002). Patients without p53 expression in breast carcinoma
survive 2 months longer than patients with p53 expression (Figure 3.86.). Patients with
positive expression of BCL2 in breast carcinoma survive 2 months longer than patients
lacking BCL2 expression (Figure 3.87).
Figure 3.86. Kaplan-Meier breast carcinoma specific survival in relation to presence of
p53 in breast carcinoma cells.
Figure 3.87. Kaplan-Meier breast carcinoma specific survival in relation to presence and
absence of BCL2 in breast carcinoma cells.

119
3.7. Statistically non-significant results
No statistically significant associations were detected between breast cancer
molecular subtypes and tumour invasion in lymphatic vessels (Figure 3.88.) or veins,
perineural tumour growth and presence of microcalcifications (Figure 3.89.). Cancer
invasion in arteries was not observed in any of investigated case.
Figure 3.88. Breast carcinoma invading
lymphatic vessels. Anti-CD34,
immunoperoxidase,
original magnification 50 x.
Figure 3.89. Microcalcifications (arrows)
in high grade invasive ductal breast
cancer. Haematoxylin – eosin. Original
magnification 50 x.
Microphotographs by A.Abolins.
There was no statistically significant association between age and pT (P=0.06),
pN (P=0.7) and breast cancer grade (P=0.1).
No statistically significant association was observed between breast cancer grade
and perineural growth (P=0.2).
Ductal breast carcinoma is the most frequent morphological type of breast
cancer. It was mostly diagnosed when the tumour measured less than 5 cm in largest
diameter (pT1 and pT2). Metaplastic and tubular breast cancers were larger than 2 cm
but not more than 5 cm (pT2). However, the number of such cases was limited possibly
contributing to lack of statistically significant association between morphological type
and local spread (pT) of the breast cancer (P=0.9). The relevant analysis is shown in
Figures 3.90.A and 3.90.B.

120
Figure 3.90. Relevance between morphological type and local spread (pT) of breast
carcinoma. 3.90.A, by tumour histological type; 3.90.B, by pT.
3.90.A
3.90.B

121
There was no association between the presence of metastases in axillary lymph
nodes and the morphological type of breast carcinoma (P=0.6) as shown in Figure
3.91.A. Cancers of all morphological types were associated with metastatic spread to
lymph nodes except invasive cribriform, metaplastic, invasive papillary and tubular
breast carcinoma (Figure 3.91.B).
Figure 3.91. Relevance between the morphological type and pN of breast cancer. 3.91.A,
by tumour histological type; 3.91.B, by pN.
3.91.A
3.91.B

122
There were no statistically significant association between ER expression and
local tumour spread (P=0.5) as shown in Figure 3.92.A and Figure 3.92.B.
Figure 3.92. Relevance between ER status and local tumour spread (pT) of breast cancer.
3.92.A, by ER status; 3.92.B, by pT.
Similarly regarding the analysis of ER status vs. local tumour spread, no
statistically significant association was found between PR status and local tumour
spread (P=0.8). The data are presented in Figure 3.93.A and Figure 3.93.B.
Figure 3.93. Relevance between breast cancer PR status and local tumour spread (pT).
3.93.A, by PR status; 3.93.B, by pT.
3.92.A 3.92.B
3.93.B 3.93.A

123
No association was identified between HER2 protein expression and local
tumour spread (P=0.8). The analysis is highlighted in detail in the Figure 3.94.A and
Figure 3.94.B.
Figure 3.94. Relevance between breast cancer HER2 receptors and local tumour spread
(pT). 3.94.A, by HER2 status; 3.94.B, by pT.
There is no statistically significant association between breast cancer size (pT)
and new potential prognostic factor expression as p53 (P=0.1), BCL2 (P=0.9), COX-2
(P=0.1), cyclin D1 (P=0.1) and CK 5/6 (P=0.6).
Statistical methods did not reveal statistically significance between presence and
count of metastatic lymph nodes reflected by pN parameter and such prognostic factors
as ER (P=0.08) or HER2 (P=0.6). There is no statistically significant association
between lymph node status and immunohistochemical expression of p53 (P=0.6), BCL2
(P=0.1), COX-2 (P=0.2), cyclin D1 (P=0.1) and CK 5/6 (P=0.1).
Statistical methods did not disclose statistical significance between breast cancer
grade and expression of new potential prognostic factors as COX-2 (P=0.1), cyclin D1
(P=0.1) and CK 5/6 (P=0.07).
Ductal breast cancer is the most common histological type both in BCL2
positive and BCL2 negative groups. The BCL2 positive and BCL2 negative breast
cancers thus show no significant differences by histological type (P=0.1).
There is no statistically significant association between p53 expression and
breast cancer positivity for COX-2 (P=0.7) and cyclin D1 (P=0.4).
No statistically significant association was found between BCL2 and COX-2
expression (P=0.2).
3.94.A 3.94.B
124
COX-2 positivity did not show statistically significant association with HER2
receptors (P=0.3), proliferation activity (P=0.7) and expression of cyclin D1 (P=0.7) in
breast cancer.
Expression of cyclin D1 is not statistically significantly associated with HER2
protein expression (P=0.09) and with degree of breast cancer proliferation activity
(P=0.3).
CK 5/6 positivity or negativity does not show statistically significant association
with breast cancer HER2 receptors (P=0.1).
No statistically significant association was shown between patients’ survival and
expression of COX-2 (P=0.1), cyclin D1 (P=0.2) and CK 5/6 (P=0.3).

125
4. DISCUSSION
As breast cancer represents a heterogenous group of tumours with variable
biological and clinical characteristics, the identification of prognostic and predictive
markers is clinically important. ER and PR, determined by IHC, are widely used both as
predictive markers for hormonal therapy and as prognostic factors. HER2 status, as
determined by IHC or FISH, indicates poorer survival. Possible benefits may be derived
by therapeutically targeting these molecules. Recently, gene expression microarray
studies have shown a strong prognostic power [Hamilton and Piccart, 2000], but
immunohistochemistry remains a convenient and powerful means of prognostic
evaluation in a clinical setting as it is less expensive and easier to perform [Lee, Im et
al., 2007; Lee, Park et al., 2007].
The prognostic or predictive factors that currently are in use do not provide
sufficient information to allow accurate individual risk assessment and treatment
planning, emphasizing the need for additional prognostic and therapeutic factors [Lee,
Im et al., 2007; Lee, Park et al., 2007].
Approximately half of all new breast cancers are diagnosed in the developing
world, where the analysis of prognostic factors needs to be inexpensive and easy to
replicate. Even in the developed world, microarray analysis has yet to fully replace
classical IHC. Thus, in the absence of routine gene-expression profiling, surrogate IHC
markers for molecular breast cancer subtypes have emerged as a more practical means
of characterising breast cancer types according to prognosis and/or differential response
to specific agents [Hudis and Gianni, 2011]. For example, a five-marker method, which
examines ER, PR, HER2, CK 5/6, and EGFR have been proposed as a surrogate system
for identifying basal-like breast cancer [Nielsen et al., 2004; Cheang et al., 2008]. Such
an approach could have practical benefits. Moreover, it is becoming increasingly
apparent that the success of new anticancer therapies is likely to be dependent upon the
use of new biomarkers to detect patients who will benefit from a particular treatment
[Penault-Llorca and Viale, 2012].

126
4.1. Surgical intervention
Surgical intervention has a central role in the treatment of breast cancer. In the
presented study, 229 mastectomies (59.8%, 95% CI=54.8-64.5) and 154 segmental
resections (40.2%, 95% CI=35.5-45.2) of breast were performed. In general, the extent
of surgical operation corresponds to the data reported in other studies, Thus,
Wiechmann et al. reported rate of mastectomy as 59% of all cases, offering breast
conserving surgery to 41% of patients [Wiechmann et al., 2009]. Reverse ratio between
mastectomy and breast conserving surgery is reported by Irigoyen et al., who have
performed breast conserving operation in 59.2% of patients, but radical surgery - in
40.8% of patients. In this study, segmental resections were performed for most of
luminal A and luminal B subtype breast cancers (65% and 63%, respectively).
Mastectomies were performed for breast cancers which belonged to basal, HER2
positive and normal molecular subtype; the corresponding rate was 72.7%, 55.5% and
75%, respectively [Irigoyen et al., 2011]. The proportion of breast conserving
operations is only moderately dependant on the year of study. Some older studies report
higher frequency of mastectomy, e.g., in the study of Lee et al., radical modified
mastectomy without removal of the pectoral muscles was performed in 79.5% patients
but breast conserving surgery including quadrantectomy was performed in 20.5% [Lee,
Im et al., 2007]. However, Le et al. [Le et al., 1999] described 175 patients with breast
cancer who were locally treated by surgery, either lumpectomy (43%) or modified
radical mastectomy (57%).
In our study, in 197 cases (51.4%, 95% CI=46.5-56.1) breast carcinoma was in
right breast, but in 186 cases (48.6%, 95% CI=43.9-53.5) the tumour affected the left
breast. The breast cancer laterality has been analysed by several authors. Spitale et al.
showed data characterising breast cancer laterality in the general breast cancer group
and by molecular subtypes. Interestingly, cancer development was slightly more
frequent in the left breast (50.4% versus 49.6%), and this predominance was true also in
luminal B (53.3% vs. 46.7%) and basal cell-like (58.9% vs. 41.1%) cases. Luminal A
and HER2 positive cases were slightly more common in the right breast: 50.9% vs.
49.1% in luminal A and 51.5% vs. 48.5% in HER2 positive cases [Spitale et al., 2009].
In the study performed by Irigoyen et al., no statistically significant differences were
identified between the molecular subtypes regarding tumour location in right or left

127
breast, or the affected quadrant of breast: P=0.43 and P=0.38, respectively [Irigoyen et
al., 2011].
In general, our data regarding the surgical approach and cancer location are not
different from the published evidence and thus the group could be considered
representative for breast cancer evaluation.
4.2. Surgical approach to axillary lymph nodes
The surgical treatment of breast cancer involves also the evaluation of axillary
lymph node status and treatment of metastatic disease. Thus, sentinel lymph node
excision and / or axillary lymph node dissection can be performed. In the study of Lee
et al., sentinel node excisions were performed in 21.5%, 95% CI=17.7-26.0 and axillary
lymphadenectomies in 78.5%, 95% CI=74.0-82.3 of cases [Lee, Im et al., 2007].
Bertolo et al. studied 60 women with invasive ductal cancer. Complete axillary
dissection was done in 54 patients. In 43% of these cases the lymph nodes were
positive. Lymphadenectomy was not considered in 6 patients because of age and/or
health status [Bertolo et al., 2008].
In older studies, more active surgical approach towards lymph nodes was
attempted. Thus, axillary dissection was invariably performed in all patients undergoing
mastectomy or breast conserving surgery [Le et al., 1999].
The number of recovered lymph nodes is an important quality indicator in the
surgical and pathological diagnostic work. In our study group, 362 lymph node
operations were performed and in 351 cases (97%, 95% CI=94.6-98.3) the lymph nodes
were found at gross and microscopic pathology evaluation. The mean number ± SD of
lymph node count per case was 12.5±8.2, and the number of breast cancer metastasis
ranged from 0 to 32 (mean amount ± SD, 2.8±5.0). In other studies, comparable mean
number of removed lymph nodes was found reaching 22.9 (range 7-54) or mean number
of 14 (range 4-34) lymph nodes per patient in case of axillary lymphadenectomy [Le et
al., 1999; Lee, Im et al., 2007].

128
4.3. The histological type of breast cancer
The general composition of breast cancer by histological types has been
previously highlighted. In the present study, 304 (79.4%) of 383 primary breast tumours
were invasive ductal carcinomas, 51 (13.3%) invasive lobular carcinomas and 13
(3.4%) represented mucinous breast cancer. The predominance of ductal breast cancer is
recognised by other researchers as well, e.g., this histological type comprised 91.4% of
breast cancers in the series of Lee, Im et al., 2007. Bennis et al. described the rate of
invasive ductal carcinoma as 87.4% while invasive lobular carcinomas comprised only
4% of breast cancers, followed by metaplastic carcinoma (3%), medullary carcinoma
(2%) and few cancers of rare histology (3%), summarized as other types [Bennis et al.,
2012].
In the present study, ductal breast cancer is the most frequent histological type
both overall and in all individual molecular subtypes. It is followed by lobular breast
cancer, mucinous and other histological types as medullary or apocrine breast cancer
constituting 3.9%. The data regarding the presence and type of breast cancer can be
characterised as highly reliable. E-cadherin expression has been used systematically to
distinguish ductal and lobular breast cancer [Arps et al., 2013; Rakha et al., 2013]. The
loss of actin-positive myoepithelial cell layer has been used to confirm the invasive
growth of breast cancer in all the evaluated cases [Lee, 2013].
Within the present research work, the relationship between proportions of ductal
and lobular breast cancer is retained in all molecular subtypes. The following
uncommon histological types of breast cancer are observed with different frequency in
different molecular subtypes. Mucinous breast cancer is not observed in luminal B
(HER2 positive), HER2 positive and triple negative molecular subtype groups. This
shows that mucinous breast cancer never overexpresses HER2 receptors but is
characterised by preserved hormone receptor expression and different, but frequently
low proliferation fraction. Medullary breast cancer is characterised by lack of HER2
overexpression and/ or amplification and by high proliferation fraction leading to
classification into triple negative or luminal B (HER2 negative) group. Metaplastic
carcinoma is typically triple negative. Invasive cribriform carcinoma is invariably
classified into luminal A type. The obtained data are in aggrement with other published
studies but have high practical value.

129
The association between the histological types and molecular subtypes of breast
cancer has been analysed by Yang et al. [Yang, Sherman et al., 2007]. Luminal A
molecular subtype comprised ductal breast cancer (56%), followed by lobular breast
cancer and mixed and other tumours (23% and 21%, respectively). Luminal B
molecular subtype included more ductal breast cancer cases (75%), but fewer lobular
breast cancer cases (10%). In this subtype, mixed or other types of breast cancers are
more frequent than lobular histological type (14%). HER2 positive molecular subtype
shows similar relationships between histological types as luminal B subtype, but with
even more marked predominance of ductal carcinoma – ductal breast cancer constituted
89%, lobular breast cancer 5% and other / mixed types of breast cancer – 7%. Basal-like
breast cancer also was characterised by high percentage of ductal breast cancer (80%).
Presence of in situ cancer component has also been analysed by molecular
subtype. In the research of Spitale et al., most cases did not show synchronous in situ
component. Only HER2 positive molecular subtype was characterised by frequent
occurrence of in situ cancer (55.9% positive vs. 44.1% negative) while other molecular
subtypes showed in situ component only occasionally [Spitale et al., 2009].
In the present study, more detailed classification was applied, describing
separately ductal carcinoma in situ, non-comedocarcinoma type as well as ductal
comedocarcinoma and lobular carcinoma in situ. In the whole group, synchronous in
situ component was absent in one third of all cases. In more than half of cases of triple
negative breast cancer, carcinoma in situ was not found. Ductal in situ carcinoma, non-
comedocarcinoma type, was more frequent in luminal A subtype while rare in HER2
positive subtypes. In contrast, comedocarcinoma was less frequent in luminal A subtype
but distinctly frequent in HER2 positive and luminal B (HER2 positive) subtypes.
In general, the association between the molecular subtypes and frequency and
type of in situ cancer points towards early segregation of breast cancerogenesis towards
different pathogenetic ways. The association between morphological type and
molecular subtype can be clinically useful as hint towards the exact diagnosis.

130
4.4. The local tumour spread (pT)
According to pathological TNM classification, all 383 tumours were classified
subsequently: pT1 – 161 tumours (42%); pT2 – 159 tumours (41.6%); pT3 – 35
tumours (9.1%) and pT4 – 28 tumours (7.3%).
The size of diagnosed breast cancers influencing pT differs significantly in many
studies, reflecting the approaches to the diagnostic process and particularly breast
cancer screening as well as the biological properties of the tumours. Thus, in the study
group described by Callagy et al., most of tumours (48%) were of pT2, followed by pT1
(38%) and pT3 (18%). In the Nottingham study, pT1 cancers were dominating by 58%
of all cases, followed by pT2 (48%) and pT3 comprising only 2% of tumours [Callagy
et al., 2006]. The data obtained by Lee et al. show similar findings: 48.7% of tumour
cases are <2 cm; 43.8% measure ≥2 but <5 cm and 7.5% are ≥5 cm [Lee et al., 2010].
All WHO TNM-defined T stages were represented in the study of Rouzier et al.
T1 cancers were the smallest group (9%) but T2 with 56% of all cases composed the
largest part of all breast cancer cases in study. The T3 tumours formed 18% and T4 -
17% of cases [Rouzier et al., 2005]. pT4 cases were found also by Ambrogi et al., who
observed pT1 in 61.6% of all breast cancer cases, pT2 in 29.4%, pT3 – 1.3% and pT4 in
7.7% of all study cases [Ambrogi et al., 2006]. Wiechmann et al. described group which
included mostly T1 – 69%. T2 composed 24%, T3 – 3%, but Tx – 4% of all cases
[Wiechmann et al., 2009]. In the publication of Le et al., 70% of cases were of T2 stage,
20% – T1 but 10% of cases were of T3 stage [Le et al., 1999]. In another study,
characteristics of breast cancer by size were consequent: ≤2 cm, 7.3%; 2-5 cm – 72.8%
and >5 cm – 19.9% of all investigated breast cancers [Lee, Im et al., 2007].
Yamashita et al. divided all tumours not by WHO TMN classification stages,
but just in 2 groups: up to 2 cm and more than 2 cm. Consequently, only pT1 frequency
can be compared with our data. In this study, pT1 tumours represented 41% of studied
cases [Yamashita at al., 2004].
Spitale et al. classified breast cancers by TNM and resulted in the following
distribution: T1, 62.1%; T2, 35.2% and T3, 2.7% of all cases. By molecular subtypes,
luminal A group consisted of T1, 65.9%; T2, 31.4% and T3, 2.7%. Luminal B group
comprised T1, 58.3% and T2, 41.7% cancers. HER2 positive molecular subtype group
showed opposite data with dominance of relatively larger tumours measuring 2-5 cm:
T2, 66.0% and T1, 34.0%. Basal-like breast cancer (7% from all cases) comprised

131
slightly higher number of T1 (48.1%) than T2 cancers (42.0%), and some cases (9.9%)
were more than 5 cm large [Spitale et al., 2009].
In another large study, comprising 1134 breast cancer cases, 71.4% of tumours
were T1. T2 cancers, measuring 2.1-5 cm formed 23.1% of the study group. The
frequency of T3 was 4.7%, and of Tx – 0.8%. In such group, all molecular subtypes
(luminal A, luminal B, HER2 positive and triple negative/basal-like cancer) showed
highest percentages of tumours measuring ≤ 2 cm (78.9%, 62.1%, 47.1% and 54.0%,
respectively), followed by T2 [Onitilo et al., 2009].
Irigoyen et al. describe more frequent occurrence of pT1 in luminal A and
luminal B molecular subtype than in basal, HER2 positive or normal molecular
subtypes that showed predominance of pT2. In this study, pT3 and pT4 composed only
small fraction [Irigoyen et al., 2011].
The results obtained in the present study are comparable with the published
evidence. In the general group, T1 and T2 are the predominant findings. However, 9.1%
of breast cancers are diagnosed in stage T3 and 7.3% – in stage T4. The luminal A
subtype showed the highest frequency of pT1 tumours. On other extreme, pT4 also have
been observed in this group and are even more frequent than pT3; occasionally these
pT4 cases were related to very long anamnesis (A. Abolins, unpublished case
observations). Both luminal B (HER2 negative) and HER2 positive molecular subtypes
showed larger amount of pT2 in comparison with the general group. Triple negative
molecular subtype had the same pT distribution as the general group.
4.5. The evaluation of axillary lymph node status (pN)
In the present study, pN0 was observed in 180 cases (47%), pN1 – 81 cases
(21.1%), pN2 – 54 (14.1%) and pN3 – 36 cases (9.4%). There were 32 cases (8.4%) of
pNx as well. The general distribution of pN is within the published range although the
available data show some diversity.
In the University of British Colombia study of 800 cases, lymph nodes were free
of metastases in 30%, N1 was observed in 41% and more than 3 nodes were positive in
29% cases. The Nottingham case series used for the validation study consisted of 1,961
consecutive cases of primary operable breast carcinoma patients who presented from
1986 to 1998 and entered into the Nottingham Tenovus Primary Breast Carcinoma

132
Series. Nodal status of 1,938 cases was negative in 64%, positive in 1 to 3 nodes – 28%,
and positive in more than 3 nodes in 8% [Callagy et al., 2006].
In the research article published by Lee et al., the following lymph node status
was described: N0, 51.3% of the evaluated 80 patients; pN1, 22.5%, pN2, 11.2% and
pN3, 15% of cases [Lee et al., 2010].
Yamashita et al. analysed 503 cases. In this group, metastases have not been
found in 57% of cases, from 1 to 3 positive lymph nodes were identified in 24% cases,
but more than 3 positive lymph nodes were found in 19% [Yamashita at al., 2004].
Spitale et al. divided breast cancer by metastases in lymph nodes as positive or
negative cases. Positive lymph node status was in 39.6% of cases, but negative in 60.4%
of cases [Spitale et al., 2009]. In this study, no statistically significant differences in
lymph node status in different molecular subtypes were found in contrast to the present
study as discussed further.
Similarly, Onitilo et al. classified the lymph node status into negative (61.2%) or
positive (31%). In addition, lymph node investigation had not been done in 7.8% of
cases [Onitilo et al., 2009].
Carey et al. reported absence of lymph node metastases in approximately 2/3 of
investigated lymph nodes (61%) whereas 39% of cases presented with breast cancer
metastases. Negative lymph node status was predominant in luminal A (66%), luminal
B (53%), basal-like (61%) and unclassified (71%) breast cancer molecular subtypes.
Positive lymph node status was more frequent among HER2 positive cases [Carey et al.,
2006].
Le et al. performed complete lymph node investigation by TNM. N0 group
comprised largest part of all investigated cases – 40.5%. There were 33.7% of cases
corresponding to N1, 15.4% – N2 and 10.4% – N3 [Le et al., 1999].
In the present study, N0 cases are predominating in the general group as well as
in all molecular subtypes. In luminal A and luminal B (HER2 negative) subtypes,
number of cases decreases by increasing pN. Opposite data are observed in triple
negative molecular subtype characterised by bimodal distribution: relatively more
frequent occurrence of high number of metastases among N+ cases.

133
4.6. Distant metastases (M)
At the time of operation, proved distant breast cancer metastases (M1) were
present in 12 cases (3.1%, 95% CI=1.8-5.4). Breast cancer metastases affected bones
33.3% (95% CI=13.8-60.9), brain – 25% (95% CI=8.9-53.2), lungs – 25% (95%
CI=8.9-53.2) and liver – 16.7% (95% CI=4.7-44.8).
In the study performed by Spitale et al., similar rate of distant metastases (4.8%)
was described [Spitale et al., 2009].
In Onitilo et al. study, recurrence was observed in 8.7%. Among these cases,
local recurrence was found in 45.5% and the remaining developed metastases in bone
(39.4%), liver (22.2%), lung (15.1%), mediastinal lymph nodes (10.1%), brain (7.1%)
and other sites (11.1%). All molecular subtypes except luminal B molecular subtype
more frequently recurred locally than progressed to distant metastases into particular
site. Luminal B subtype breast cancers frequently metastasized to bones (61.5%), liver
(38.5%) or recurred locally (38.5%) as reported by Onitilo et al. 2009.
In the study of Lee et al., 151 patients were followed up for median duration of
36 months (range 8-78). During this time, 24.5% patients experienced breast cancer
recurrence, and 34 of these had distant metastases. Frequent sites of distant metastases
were bone (46%), lung (29.7%), liver (18.9%), and brain (5.4%) [Lee et al. 2007].
Although the cancer recurrence after treatment and presence of distant
metastases at the time of primary diagnostics differs by time of disease progression, our
data are in general agreement with the cited studies. The higher frequency of brain
metastases reaching statistical significance can be attributed to relatively low number of
events in the study group although cancer recurrence after treatment and presence of
distant metastases at the time of primary diagnostics can also involve different
mechanisms.
4.7. Histological grade
By histological grade all cases in the presented research work were classified as
follows: G1 – 16.0%, 95% CI=12.2-19.6; G2 – 36.0%, 95% CI=31.9-41.1 and G3 –
48.0%, 95% CI=43.8-52.8. Very similar data are reported by Bertolo et al.: G1, 18%;

134
G2, 35%; and G3, 47% of cases [Bertolo et al., 2008]. Lee et al. classified 19.2% of
cases as G1, 35.9% as G2 and 44.9% as G3 [Lee et al., 2010].
Callagy et al. reported slightly different composition by grade showing
statistically significantly lower rate of low grade cancers and higher – of high grade
cancers: G1, 9%; G2, 32% and G3, 59%. In contrast, Nottingham series showed similar
results: G1 – 19%, G2 – 33%, G3 – 48% of cases, respectively, without statistically
significant differences from the presented study [Callagy et al., 2006].
Histological grade in Yamashita et al. study was following: G1 in 17%, G2 in
59%, but G3 in 24% of cases. Le et al. describe breast cancer grade subsequently: G1 –
7.9%, G2 – 53.7% and G3 – 39%. In both these studies statistically significant excess of
G2 cancers was found [Le et al., 1999; Yamashita et al., 2004].
Spitale et al. classified the analysed cases into 2 grade levels including well/
moderately differentiated cancer (72.9% of cases) and poorly differentiated cancer,
constituting 27.1% of cases [Spitale et al., 2009]. Well/ moderately differentiated breast
cancers constituted the largest part of luminal A and luminal B molecular subtypes
(84.6% in luminal A and 52.5% in luminal B group). HER2 positive and basal-like
cancers were predominantly poorly differentiated with notable difference, e.g., 75.9% of
poorly differentiated breast cancers versus 24.1% of well/moderately differentiated
breast cancers in basal-like molecular subtype group. Carey et al. also divided breast
cancer by the histological grade in two groups – poorly and well/moderately
differentiated breast cancer. In this study, poorly differentiated cancer predominated in
the general group (65% of all cases) as well as in all molecular subtypes constituting
58% in luminal A, 56% in luminal B, 70% in HER2 positive, and 82% and 81% of
basal-like and unclassified breast cancer molecular subtype groups respectively [Carey
et al., 2006].
Onitilo et al. analysed breast cancer histological grades by three-tiered system.
Their study group comprised G3 tumours (35.9%), G2 tumours (38.4%) as well as
relatively small proportion of G1 tumours (21.2%). Data were missing in few cases
(4.6%). Luminal A molecular subtype group contained more G2 breast cancers (44.9%)
followed by well differentiated (28.9%) and poorly differentiated (21.5%) breast
cancers. Luminal B subtype breast cancers were less differentiated containing more
poorly differentiated tumours (49.1%), the moderately differentiated – 41.4%, followed
with few cases of well differentiated breast cancers – 6%. In HER2 positive and triple
negative molecular subtypes, poorly differentiated breast cancers were frequently

135
observed (77.7% and 76.3%, respectively), followed by moderately differentiated
(20.0% and 12.5%, respectively) and well differentiated (1.2% and 4%, respectively)
cancers [Onitilo et al., 2009].
IHC subtypes were significantly different by histological grade (P=0.0053) in
Bennis et al. study. The unclassified, basal-like and HER2 positive subtypes showed
higher percentage of cases with histological grade 3 (53%; 47.6% and 42.2%
respectively), and a very low percentage of tumours with histological grade 1: 0%, 4.8%
and 13.3%, respectively [Bennis et al., 2012].
Similar tendency is shown in the present study data where triple negative
molecular subtype group of breast cancer practically contain poorly differentiated breast
cancers (92% of G3 vs. 8% of G1/G2 group). The same situation is in HER2 positive
molecular subtype group and Luminal B (HER2 positive) group. If G1 and G2 group
cases are counted together then amount is greater than single G3 group in luminal A
breast cancer subtype like in Spitale et al. study [Spitale et al., 2009]. The differences
that were identified within the frames of the present research are statistically significant.
4.8. Expression of oestrogen and progesterone receptors
Classifying all investigated breast cancers by ER positivity or negativity, up to
80% of all breast cancers show ER positivity. By definition, HER2 positive and triple
negative molecular subtypes do not posses ER positivity. The present study is in
agreement with Spitale et al. [Spitale et al., 2009].
The proportion of ER positive cases was lower in the study performed by Carey
et al. Among 496 cases, ER receptors were found in 60% of all cases [Carey et al.,
2006], being absent in basal-like, HER2 positive and unclassified breast cancer
molecular subtypes. In luminal A subtype, 86% cases showed ER positivity, but in
luminal B almost all cases were positive – 97% [Carey et al., 2006].
The rate of ER positivity was 55% in the study performed by Lee et al. Among
the investigated 151 cases, PR receptor positivity was observed in 39.1 % of cases. A
cut-off value of 10% or more positively stained nuclei in 10 high-power fields was used
to define ER and PR positivity [Lee, Im et al., 2007]. In the present study, the
evaluation of ER alpha and PR status was carried out according to the ASCO/CAP
guideline recommendations for IHC testing of ER and PR. The breast cancer case was

136
considered positive if at least 1% of tumour cells showed positive nuclear staining of
any intensity [Hammond et al., 2010].
The data about PR positivity parallels the ER expression. Up to 70% or more all
breast cancers show PR positivity [Spitale et al., 2009] in agreement with the present
study. The expression of PR is absent in basal-like, HER2 positive and unclassified
breast cancer molecular subtype as well as in 16% and 14% of cases in luminal A and
luminal B molecular subtypes, respectively [Carey et al., 2006].
4.9. Proliferation activity by Ki-67
High tumour proliferation activity recognised by high levels of Ki-67 expression
is associated with worse outcomes [de Azambuja et al., 2007]. The proliferation marker
Ki-67 should be included in routine clinical investigation because the labelling index is
crucially important in the distinction between luminal A and luminal B (HER2
negative) subtypes. If reliable Ki-67 labelling index assessment is not available, some
alternative measure of proliferation such as histological grade may be used in making
this distinction. Ki-67 labelling index presents substantial challenges, as important
guidelines for this test are still under development. The cut-off point <14% for Ki-67
labelling index was established by comparison with PAM50 intrinsic subtypes meaning
that a higher score defines luminal B tumours with a worse prognosis [Cheang et al.,
2009; Goldhirsch et al., 2011].
Regarding the cut-off point, different researchers have used different decision-
changing values of Ki-67 labelling index. Spitale et al. divided breast cancer cases by
Ki-67 labelling index in 3 groups: ≤5%, 5-20% and >20%. Consequently, most of breast
cancer cases belonged to the group with 5-20% of Ki-67 positive cells. Analysing Ki-67
labelling index by molecular subtypes, luminal A and luminal B subtypes were
associated with index up to 20%. Luminal B molecular subtype showed also high rate of
cases belonging to actively proliferating group recognised by Ki-67 index over 20%.
Basal cell-like and HER2 molecular subtypes were associated with high Ki-67 labelling
index.
In the article by Lee et al., more than 5% of positive cells were presumed as cut-
off point. Consequently, the proliferative activity was lower than 5% in 44.4 % of all
investigated patients and exceeded this cut-off in 55.6% of all cases [Lee et al., 2007].

137
In accordance with the published evidence, the present study showed association
between luminal A subtype and low Ki-67 labelling index. All other subtypes were
associated with high Ki-67 labelling index. However, the cut-point was 14% in
accordance with the recent St. Gallen recommendations [Goldhirsch et al., 2011].
4.10. The overexpression of HER2 protein and amplification of HER2/neu
gene
HER2 overexpressing breast cancer patients are more likely to suffer from
relapse and tend to have a shorter overall survival. Amplification of the HER2/neu gene
and RNA/protein overexpression correlates strongly [Pegram et al., 2000; Lee, Park et
al., 2007]. After development of trastuzumab, which is the monoclonal antibody and
targets HER2, the amplification status of HER2 became a highly predictive biomarker
[Slamon et al., 1987; Mass et al., 2005]. Overexpression and amplification of HER2/neu
can be detected in about 15% of all primary breast cancers, and this group of patients
benefit significantly from anti-HER2 therapies. HER2 status should be assessed in
every diagnosed case of breast cancer [Romond et al., 2005; Smith et al., 2007]. HER2
status is currently assessed in most cases initially by immunohistochemistry, and in
cases of equivocal protein expression levels, HER2/neu gene copy number is measured
via FISH or CISH techniques [Wolff et al., 2007]. In addition, detection of HER2 status
along with expression of ER and PR is useful for defining the molecular subtypes.
Carey et al. examined HER2 overexpression in all consecutive breast cancer
cases [Carey et al., 2006]. According to molecular subtype classifications, HER2
expression was observed in HER2 positive and luminal B molecular subtype. Luminal
A, basal-like and unclassified breast cancers did not possess HER2 positivity by
definition. In that study membranous staining for HER2 was scored as: 0, faint
incomplete staining in 10% or less of cells; 1, faint incomplete staining in more than
10% of cells; 2, weak to moderate complete staining in more than 10% of cells; 3,
strong complete staining in more than 10% of cells. Thus, no expression of HER2 was
present in 43% of cases but 1+ was observed in 23.8% of investigated cases. Borderline
HER2 expression as 2+ was observed in 13.2% of cases. HER2 overexpression scoring
3+ was present in 19.9% of cases [Lee et al., 2007]. Again, it must be emphasized that
the cut-off levels for HER2 positivity have changed over years.

138
HER2 positivity in the present study is shown in 14% of cases which is similar
to other studies [Spitale et al., 2009]. In the present study, there was no association
between HER2 expression and the local tumour spread characterised by pT (P=0.8). In
contrast, Lee et al. found correlation between the overexpression of HER2 and larger
tumour size (P=0.03) and more extensive axillary lymph node involvement as
characterised by P=0.02 [Lee, Im et al., 2007; Lee, Park et al., 2007]. In present study
no correlation was found between pN parameter and HER2 overexpression.
4.11. Immunohistochemistry and breast cancer molecular subtype
Breast cancer is the second most common neoplasm among women in Latvia
[spkc.gov.lv], as well as in the world, accounting for one third of newly diagnosed
malignancies [Jemal et al., 2011]. Breast cancers with similar histopathological
appearances can exhibit different clinical presentation, disease aggressiveness and
response to treatment. These differences cannot be explained completely by
morphology therefore the application of the current WHO classification of breast
cancers is limited. Systematic investigations of gene expression patterns and their
correlation with specific features of phenotypic diversity are changing the way of
classifying, at the molecular level, the phenotypes of breast cancers, as well as of other
tumours [Spitale et al., 2009]. In addition, profiles of gene expression analysis and
immunophenotype suggest that breast cancer is not a single entity but a heterogeneous
disease, which is composed of a growing number of recognized biological subtypes.
Nowadays classification of human breast tumours was developed through a hierarchical
clustering of genes on the basis of similarity in the expression pattern [Spitale et al.,
2009]. Breast cancers were categorized into at least five main groups which differ
markedly in terms of incidence in distinct races/ ethnicities, risk factor distribution,
prognosis, response to treatment, clinical outcomes and both OS and RFS: luminal cell-
like tumours, subdivided into luminal A and B, basal cell-like and/ or triple negative
phenotype [ER and PR negative tumours with amplification of genes usually expressed
by basal/myoepithelial cells], HER2 tumours (amplification of the HER2/neu gene) and
normal breast-like group [Sotiriou et al., 2003; Carey et al., 2007; Spitale et al., 2009].
Recent publications have shown that molecular classification of breast cancer
also has important prognostic value [Pusztai et al., 2006]. Luminal A tumours were

139
shown to be associated with good prognosis and a less aggressive behaviour if
compared with the basal-cell like or HER2/neu groups [Sotiriou et al., 2003]. Basal-cell
like subtype has been associated with aggressive behaviour, poor clinical outcomes and
lack of response to the usual endocrine therapies, shorter survival and presence of
BRCA1 mutations [Spitale et al., 2009]. Several studies have shown that breast
carcinomas may be stratified in subtypes similar to those defined by expression
profiling using a panel of IHC markers [Tang et al., 2008; Spitale et al., 2009].
Subtyping breast cancer using microarrays for gene expression analysis is the
best way to perform molecular classification, but it is not always feasible to obtain gene
expression array information according to high costs or inaccessibility of fresh tissues,
therefore simplified classification has been adopted as useful shorthand [Cheang et al.,
2009].
Molecular subtypes defined by clinicopathological criteria are similar to but not
identical to intrinsic subtypes and represent a convenient approximation. This approach
uses immunohistochemical definition of ER and PR, the detection of overexpression
and/or amplification of HER2/neu gene, and Ki-67 labelling index, a marker of cell
proliferation, as the means of identifying tumour subtypes. Clearly, this
clinicopathological classification requires the availability of reliable measurements of
its individual components. Guidelines have been published for ER and PR
determination [Hammond et al., 2010] and for the detection of HER2 positivity [Wolff
et al., 2007]. Ki-67 labelling index presents more substantial challenges, but important
guidelines for this test are still under development [Cheang et al., 2009].
Routine IHC evaluation of breast cancers may provide not only crucial
information to guide clinical management but also represents a valid alternative to
costly genotyping assays. The relationship between IHC markers and responsiveness to
therapeutic treatments has been extensively studied [Goldhirsch et al., 2011]. IHC-
based classification systems are still useful in clinical practice, and have been shown to
correlate well with intrinsic classification using gene expression microarrays:
ER/PR+,HER2+ with luminal B; ER/PR+, HER2- with luminal A; ER/PR-, HER2+
with HER2 positive and ER/PR-,HER2- with triple negative/ basal-like tumours [Carey
et al., 2006, Carey et al., 2007].
On 2011, in 12th St. Gallen International Breast Cancer Conference expert panel
adopted a new approach to the classification of patients for therapeutic purposes based
on the recognition of intrinsic biological subtypes within the breast cancer spectrum.

140
Intrinsic subtypes of breast cancer are luminal A, luminal B, HER2 overexpressed and
basal-like, but corresponding clinico-pathological surrogate classification with
definitions to intrinsic subtypes includes luminal A, luminal B (HER2 negative),
luminal B (HER2 positive), HER2 positive (non-luminal) and triple negative breast
cancer [Goldhirsch et al., 2011].
In the present work, the molecular subtypes of breast cancer were detected
according to this new classification and IHC data. The majority of cases belonged to
luminal A (39.7%), followed by the luminal B (HER2 negative) subtype (32.6%). Triple
negative breast cancer subtype constituted 13.1%, whereas only 8.4% and 6.3% of
tumours were classified as HER2 positive and luminal B (HER2 positive), respectively.
As the St. Gallen classification (2011) is new, few scientists have published data
according to it.
4.12. Age and molecular subtype
In a study of breast cancer molecular subtypes and response to different
preoperative chemotherapy, Rouzier et al. [Rouzier et al., 2005] included 82 females
whose mean age was 52 years (range 29-79 years). In another study evaluating 151
breast cancer cases, the mean age was 46 years ranging 28-70 years. Among them,
73.5% of patients were younger than 50 years of age and only 26.5% were older than 50
years of age [Lee, Im et al., 2007].
In Spitale et al. study, evaluating 1214 breast cancer cases, the mean age of
patients was 62.7±14.0 years. After classification of breast cancer by molecular
subtypes, the mean age in the basal cell-like or triple negative phenotype group was
58.5±14.6 years, in HER2 positive breast cancer group – 62.3±12.5 years. In other
breast cancer molecular subtypes like luminal A and luminal B, the mean age ± standard
deviation was 63.4±13.7 and 61.4±15.0 years, respectively [Spitale et al., 2009].
Onitilo et al. included in study 1134 patients, whose mean age was 62.7±13.8
years. By molecular subtype, luminal A or ER/PR+, HER2- group contained patients
with highest age 64.4±13.2 years. HER2 molecular group included patients with the age
59.9±12.7 years, but ER/PR+, HER2 and ER/PR-, HER2- included patients with the
mean age 58.9±14.6 and 58.1±14.7years, respectively [Onitilo et al., 2009].

141
The mean patient age was 56 (range, 22-95) years in Wiechmann et al. study
[Wiechmann et al., 2009]. Subdividing this group into four molecular subtypes, the
mean age was following – luminal A, 58 years; luminal B, 52 years; HER2 positive, 53
years and basal subtype, 54 years.
Carey et al. in her study of 496 cases described the mean age of 50 years with SD
12 years. By molecular subtype, the mean age in luminal A group was 52 years, luminal
B – 50 years, HER2 positive – 47 years, basal- like – 46 years, but the lowest mean age
was in unclassified breast cancer molecular subtype group [Carey et al., 2006].
Phipps, Malone et al. evaluated 2616 breast cancer cases subdividing the study
group in luminal, HER2 overexpressing and triple negative cases. The mean age in
luminal group was 68.6 years, but in HER2 overexpressing group – 67.6 years. Triple
negative cases included patients with mean age 66.0 years [Phipps, Malone et al.,
2008].
In the present study, 383 consecutive female patients with primary, invasive
breast carcinoma were included. The mean age ± SD was 59.59±12.22 years. Patient’s
age ranged from 27 to 88 years old. In the published studies, the mean age ranges from
46 to 62.7 years. Our data are within this interval. In accordance with other studies, the
highest mean age is in luminal A molecular subtype group, followed by luminal B
(HER2 negative) molecular subtype and HER2 positive group. The lowest mean age is
observed in luminal B (HER2 positive) group and triple negative group. Several
researchers have applied classification of breast cancer by molecular subtypes including
just 4 categories. The information about recently defined luminal B (HER2 positive) can
be lacking than. However, the observation that triple negative breast cancer is diagnosed
in younger patients is in agreement with other studies.
4.13. Expression of aberrant p53 protein
The tumour suppressor protein p53 has central role in cell protection against
malignant change. It is activated in response to cellular stresses and initiates a variety of
cellular responses including cell cycle arrest and apoptosis [Liu et al., 2013]. p53
protein regulates also gene transcription and DNS synthesis and repair [Ma et al., 2013].
Apoptosis or programmed cell death plays a critical role in the development of
cancer. Inhibition of apoptosis leads to loss of the tumour-suppressor phenotype and to

142
accumulation of mutations. Apoptosis is a complex process controlled by multiple
genes, and investigations on cell models in culture have demonstrated that the proto-
oncogene BCL2 and the tumour-suppressor gene p53 play a fundamental role in its
regulation. The BCL2 protein is a potent inhibitor of cell death, whereas wild-type p53
protein activates the apoptotic pathway. Mutated p53 protein loses this function [Reed
et al., 1997]. Inappropriate expression of BCL2 gene also modulates the function of p53
and triggers cell proliferation and transformation [Ryan et al., 1994].
The recent trends to target mutant p53 for cancer treatment [Liang et al., 2011;
Liu et al., 2013] underline the necessity to develop technologies for p53 detection and
to detect the damage in TP53 gene and the respective protein levels. The regulatory
pathways can be deranged as well. As the frequency of p53 mutation can be associated
with socioeconomic deprivation, race and other factors [Ma et al., 2013; Starks et al.,
2013], the frequency of p53 pathway dysfuction must be determined separately for the
particular population. The present study is the first research devoted to p53 analysis in
breast cancer tissues in Latvia.
In the present study, we used immunohistochemistry to detect p53 protein as the
method has been widely accepted for p53 analysis in proteome level [Laurinavicius et
al., 2012; Shapocka et al., 2012; Liu et al., 2013]. By this approach, expression of p53
protein was observed in 24% of consecutive breast cancer cases.
Lee et al. found nuclear staining of p53 protein in 23% of tumours from 175
breast cancer cases using 10% cut-off value of tumour cells displaying strong nuclear
staining [Le et al., 1999]. We have used analogous evaluation scale as described by
Yamashita et al., 2006, and the obtained data are in aggrement with the published
findings.
Other autors have used different evaluation scales. In occasional publications,
the number of cells stained for p53 have been scored semi-quantitatively as follows;
0%, 1–25%, 26–50%, 51–75%, or > 75%. According to this classification p53 was
expressed consequently: absent – 31.1%; present in 1-25% of tumour cells – 38.4%;
present in 26-50% of neoplastic cells – 7.3%; present in 51-75% of neoplastic cells –
5.3% and present in 76-100% of neoplastic cells – 17.9% of cases. Expression of
aberrant p53 protein in more than 25% of the tumour cells was observed in 30.5% of all
cases [Lee et al., 2007]. Although the general trends are similar, guidelines for p53
detection and evaluation should be evaluated in near future. Immunohistochemistry
seems to be one of the mainstays in these guidelines as the findings in protein level are

143
different from genetic data but protein conformation and functionality changes could be
targeted by future treatments [Liu et al., 2013].
Le et al. showed statistically insignificant association (P=0.6) between breast
cancer size and p53 expression. However, p53 nuclear overexpression in breast cancer
cells was found to be associated by lymph node metastases [Le et al., 1999]. In the
presented study, the association between p53 status, pT and pN was statistically
insignificant.
Statistically significant relations (P=0.0001) between breast cancer histological
grade and p53 were described by Le et al. G1 breast cancers did not show p53 nuclear
overexpression (0%). The amount of p53 overexpressing cases increased in paralled
with increasing cancer grade: G2, 13% and G3, 41% [Le et al., 1999]. In triple negative
breast cancer, expression of p53 has been associated with high nuclear grade
[Nakagawa et al., 2011]. In women with TP53 germline mutations, most of breast
cancers (81%) also are of high grade [Masciari et al., 2012]. In the present study,
expression of p53 protein is more frequent in high grade breast cancers than in other
groups (P<0.0001). Thus, our findings are in accordance with the world experience.
The rate of ER expression is statistically significantly associated with p53
negativity. In the present study, the ER+ cases predominate in p53 negative group in
contrast to p53 positive group showing marked excess of ER negative breast cancer
cases. The difference is statistically significant at P<0.0001. The same association is
observed between p53 and PR expression (P<0.0001). p53 overexpression is more
frequent in ER and/ or PR negative breast cancer [Rossner et al., 2009; Ma et al., 2013]
and have caused great interest in triple negative breast cancer [Nakagawa et al., 2011;
Kumar et al., 2012]. Statistically significant association between hormone receptor and
p53 status was shown by Le et al. Among hormone receptor positive cases, the rate of
synchronous nuclear expression of p53 was 16% in contrast to 41% in cases without
hormone receptor expression [Le et al., 1999]. However, breast cancer in women with
TP53 germline mutations is characterised by frequent expression (84%) of ER and/or
PR [Masciari et al., 2012]. p53 expression is also shown to be adverse prognostic factor
in luminal breast cancer [Millar et al., 2011].
The p53 expression is heterogeneous regarding HER2 protein expression.
However, most of HER2 negative cases are also negative for p53 (P=0.001). In the
present study, there is statistically significant association between p53 expression and

144
higher proliferative activity (P<0.0001). Trend towards higher proliferation in p53-
positive breast cancer has been described [Jung et al., 2011].
Regarding the 5 molecular subtypes, HER2 positive molecular subtype included
more p53-positive than negative cases. In triple negative molecular subtype, the ratio
between positive and negative cases was 1:1. Luminal A and luminal B (HER2
negative) molecular subtypes are these groups where the present data suggest no
necessity to do the p53 investigations due to usually negative results. Ratio between
expression and non-expression of p53 is lower in luminal B (HER 2 positive) group
emphasizing HER2 aggressive nature and higher possibility of p53 expression. More
studies can be recommended regarding this group as well as triple negative molecular
subtype although the obtained data are statistically significant. The data about p53
expression by molecular type are still highly controversial [Jung et al., 2011].
p53 and BCL2 are two opposite findings (P<0.0001). Inverse correlation of
expression of BCL2 and p53 was described by Le et al. Among the 64 BCL2 negative
tumours, 36% were p53 positive, whereas among the 111 BCL2-positive tumours only
16% were also p53 positive corresponding to P=0.003 [Le et al., 1999]. The findings
were confirmed by Lee et al., 2007. In their study, p53 ≤ 25% correlated with high
BCL2 expression (68.6%). One third of cases did not show p53 and BCL2 expression.
Breast cancer cases which expressed more than 25% of p53 lacked BCL2 expression in
56.5% of cases. 43.5% of cases were p53 and BCL2 positive [Lee, Im et al., 2007]. No
significant association between p53 and BCL2 expression was found in Korean triple
negative breast cancer despite sufficient heterogeneity of data [Ryu and Lee, 2012].
In the present study, CK 5/6 negativity was associated with lack of p53
expression (P=0.002). The CK 5/6 positive group is heterogeneous regarding expression
of p53 protein; however, the association is statistically significant (P<0.0001).
The survival analysis by Kaplan-Meier has identified p53 expression as
significant negative prognostic factor in agreement with the previously published
findings that p53 status, as determined by immunohistochemistry, has prognostic impact
and provides additional prognostic information for intrinsic subtypes and St. Gallen
consensus classification [Guarneri et al., 2010; Jung et al., 2010]. However,
controversial results have been reported that are partially associated with different cut-
off levels, evaluation of gene and protein dysfunction and variable findings in specific
subgroups of patient [Rossner et al., 2009; Ryu and Lee, 2012].

145
4.14. Expression of BCL2 oncoprotein
BCL2 belongs to a group of related proteins that are key regulators of apoptosis
or programmed cell death. The tumorigenic potential of inappropriate BCL2 protein
expression was first described as a result of the chromosomal translocation t(14;18) in
non-Hodgkin’s lymphoma. Since this discovery, overexpression of BCL2 protein has
been identified in a variety of solid tumours, including breast cancer. BCL2 protein
expression in breast cancer has been associated with low grade, slowly proliferating, ER
positive breast tumours [Dawson et al., 2010]. However, BCL2 still has been suggested
but not accepted as a prognostic factor in breast cancer due to conflicting results and
insufficient level of evidence [Hwang et al., 2012]. Thus, more studies are necessary in
this field.
This paradoxical favourable prognostic effect of BCL2 in breast cancer could be
related to its non-apoptotic functions. The exact mechanism of differential BCL2
protein expression in breast cancer is complex. BCL2 is expressed in normal breast
glandular epithelium and is known to be unregulated by oestrogen, possibly as a direct
result of transcriptional induction [Wang and Phang, 1995; Leung and Wang, 1999]. In
breast cancer, BCL2 positivity is not simply a surrogate for ER positivity as 14% of
BCL2 positive tumours were ER negative and 31% of BCL2 negative tumours were ER
positive [Dawson et al., 2010]. The prognostic impact of BCL2 positivity was observed
regardless of other tumour characteristics, including tumour size, grade and lymph node
status. BCL2 was a prognostic factor in women with both ER negative and ER positive
disease. It is important that women with ER positivity/ BCL2 negativity were found to
have a worse prognosis than those with ER negativity/ BCL2 positivity of the tumour.
BCL2 was also a strong prognostic marker in women with both HER2 negative and
HER2 positive disease and women with triple negative disease. The interaction between
treatment and the prognostic role of BCL2 has also been addressed, showing that the
prognostic impact of BCL2 is independent of adjuvant therapy received [Dawson et al.,
2010].
In the present study, positive expression of BCL2 was found in 67.6% of cases.
If only cytoplasmic staining was scored as positive for BCL2, regardless of the intensity
of the stained cells, BCL2 positivity has been observed in 92 (60.9%) of all cases by
immunohistochemical evaluation of 151 patients [Lee, Im et al., 2007]. Choosing the
cut-off value for BCL2 protein positivity in breast cancer as 30% of tumour cells

146
showing moderate to strong cytoplasmic staining, positive reaction was observed in
63% of tumours [Le et al., 1999].
In the present study, there was no statistically significant association between
BCL2 expression and the local spread of breast cancer as characterised by pT (P=0.9)
similarly to Won et al., 2010. In contrast, Le et al. showed statistically significant
association between tumour size and cytoplasmic expression of BCL2 protein (P=0.03).
The distribution of BCL2 positive cases by T stage was consequent: T1 – 20%, T2 –
25% and T3 – 17%. The frequency of BCL2 expression reached 83% among pT1 cases,
58% – pT2 and 61% – pT3 [Le et al., 1999]. Recently, Zaha et al. have shown
association between BCL2 and pT characterised by P=0.04 [Zaha et al., 2012]. Hwang
et al. have compared the expression of BCL2 in breast cancers exceeding the size of 2
cm with smaller tumours, and the difference was found statistically significant [Hwang
et al., 2012].
BCL2 expression also did not correlate with axillary lymph node status.
Previously, contrasting data are published. By increasing amount of positive lymph
nodes with breast cancer metastases, the BCL2 overexpression rate statistically
significantly decreased (P=0.01). The frequency of BCL2 overexpression was 70% in
N0, 64% in N1, 59% in N2 and 39% in N3 [Le et al., 1999]. Recently, statistically
significant association between BCL2 expression and N0 has been reconfirmed [Hwang
et al., 2012]. However, no statistically significant association between BCL2 expression
and presence or absence of lymph node metastasis was found by Won et al., 2010.
Comparing the presence of BCL2 protein in different histological types of breast
cancer, the expression was observed mostly in ductal breast cancer followed by lobular
breast cancer. However, as the ductal breast cancer is the most frequent histological
type the difference is not statistically significant (P=0.1). Similar data were described
by Lee et al., 2007. In this study, 60.1% of ductal breast cancer cases and 69.2%
cancers of other histological types expressed BCL2 and the difference was not
statistically significant, characterised by P=0.521 [Lee, Im et al., 2007]. In the group
described by Zaha et al., the frequency of BCL2 expression was 54.8% in invasive
ductal carcinomas and 66.6% in invasive lobular and mixed lobular carcinomas.
Medullary carcinomas were negative. These differences were statistically insignificant
(P=0.1) in accordance with the present study [Zaha et al., 2012]. Lee et al. analysed
BCL2 expression in the endolymphatic tumour emboli. The emboli were present in 95%

147
of cases; 62.9% were positive for BCL2 [Lee, Im et al., 2007]. In the present study,
lymphatic invasion was rarely observed therefore no definite conlusions can be drawn.
Absence of BCL2 in breast cancer cells is more frequent in high grade breast
cancers (P<0.0001). Zaha et al. found that BCL2 expression decreased with increasing
tumour grade. G3 tumours did not present positive BCL2 at 3+. All well differentiated
infiltrating ductal carcinomas (G1) were BCL2 positive and score 3+ was found in 75%
of the cases. Moderately differentiated tumours had a rate of 54.5% BCL2 positive
cases. G3 carcinomas presented positive reaction for BCL2 in only 38.4% of cases, all
scoring 2+. Although these results are statistically significant, the difference had a
borderline statistical significance with P=0.048 [Zaha et al., 2012].
Statistically significant association (P=0.003) between BCL2 overexpression
and tumour histological grade was revealed by Le et al. Well differentiated breast
cancers (G1) showed absolute (100%) BCL2 cytoplasmic overexpression while among
moderately differentiated breast cancers (G2), only 61% cases showed BCL2 positivity.
Slightly more than a half (51%) of high grade (G3) breast cancers was positive for
BCL2 protein [Le et al., 1999].
In the joint group of G1 and G2 tumours, the rate of BCL2 expression was
78.8%. In G3 tumours more than a half of all investigated cases (54.5%) did not show
BCL2 cytoplasmic expression [Lee et al., 2007]. In more recent study, similar data were
obtained. Among BCL2 positive tumours, there were 53.4% G1-G2 and 34.1% G3
cancers. The BCL-2 negative group comprised 31.3% G1-G2 and 59.3% G3 tumours.
The differences were statistically significant [Hwang et al., 2012]. Similarly,
statistically significant correlations between BCL2 expression and low nuclear grade
were found [Hwang et al., 2012].
In the present study, BCL2 protein expression was significantly associated with
ER expression (P<0.0001). Analysing the published evidence, similar observations can
be found. High level of BCL2 expression is strongly associated with positive oestrogen
and progesterone receptors. BCL2+ ER+ and PR+ cases represent half of the cases
exhibiting the best response to hormone therapy and the lowest rate of recurrence [Zaha
et al., 2012]. The relationships between BCL2 and the hormone receptor markers were
evaluated also by Lee et al. Ninety two percent of ER positive tumours showed co-
expression with BCL2. Among the cases with negative ER expression, 76.5% of
cancers were negative for BCL2 as well [Lee, Im et al., 2007]. Statistically significant
association between hormone receptor expression and BCL2 positivity was shown also

148
by Le et al. Eighty three percent of cases with positive hormone receptor expression
showed co-expression of BCL2 [Le et al., 1999]. The results regarding PR and BCL2
expression are similar (P<0.0001) and in accordance with the published evidence [Lee,
Im et al., 2007].
In contrast to positive association between BCL2 and hormone receptor
expression, HER2 overexpression was more frequently observed in the BCL2 negative
group (P<0.0001). The data are in accordance with the published evidence [Lee, Im et
al., 2007; Hwang et al., 2012]. Negativity of HER2 (from 0 to 2+) was observed along
with frequent marked BCL2 expression (68.6%). Overexpression of HER2 (3+) was
observed in 56.7% of BCL2 negative cases, but 43.3% of BCL2 positive tumours [Lee,
Im et al., 2007]. Hwang et al. have recognised HER2 positivity as 2+ or 3+ expression
by immunohistochemistry, or by positive FISH findings. Despite different cut-off
levels, the same conclusion was reached. The HER2 positivity was found in 34.6% of
BCL-2 negative and 21.8% of BCL-2 positive cases, and the difference was statistically
significant with P<0.001 [Hwang et al., 2012].
The BCL2 positive cases more frequently show low proliferation activity.
Opposite situation is observed in the negative BCL2 group where there are more high
Ki-67 level of breast cancer cells (P<0.0001). Controversial relationships between
BCL2 and proliferative activity have been described. Some authors have shown that the
expression of BCL2 is significantly more frequent in breast cancers with low Ki-67
index. Others authors insist that there is no association between BCL2 and Ki-67 status.
In highly proliferative tumours, lack of BCL2 expression is common while
cancers having lower proliferation show BCL2 positivity in a subgroup of such cancers
(P=0.00049). Regarding BCL2 positive tumours, 66.6% of cases had a low Ki-67,
18.8% – intermediate type and only 15.1% – high. In contrast, BCL2 negative tumours
are highly proliferative [Zaha et al., 2012].
In contrast, Ki-67 expression was not found to be inversely correlated with
BCL2 as it was with other parameters in Lee et al. study. The breast cancers were
classified into 2 groups based on the Ki-67 labelling index less than 5% or exceeding
5%. In the group of low proliferative activity, 73.1% of cases expressed BCL2. In
contrast, the proliferatively active cancers exhibited BCL2 positivity in 51.2% of cases.
The difference did not reach statistical significance [Lee, Im et al., 2007].
Molecular subtype of breast cancer and BCL2 expression has been evaluated by
Zaha et al. BCL2 expression was observed in 54.1% of cases. Assessing the BCL2
149
expression according to molecular classification, luminal A tumours expressed BCL2 at
a rate of 92.3%, luminal B subtype cancers in 60% of cases, while the remaining
molecular subtypes showed no expression. Among non-luminal tumours, the basal-like
tumours has a negative score 0 in 77.8% cases, the rest being 1+. HER2-type tumours
were classified the score 0 [Zaha et al., 2012]. In the present study, positive expression
is observed in luminal A and both luminal B subtype cases, but HER2 positive and
triple negative molecular subtypes are frequently negative. However, the heterogeneity
exists and should not be neglected.
In the present study, statistically significant association is shown between two
new potentially prognostic and predictive factors as BCL2 and cyclin D1 (P<0.0001).
The BCL2 positive group also include most of cyclin D1 positive cases (P<0.0001).
This finding corresponds to the the known molecular mechanisms, including up-
regulation of BCL-2 and cyclin D1 by common pathway including oestradiol-repressed
microRNAs. This pathway is associated both by presence of oestrogen receptors
ensuring the binding of oestradiol, and growth suppression in response to oestradiol [Yu
et al., 2012]. In addition, BCL2 positivity in the present study is associated with lack of
CK 5/6 expression (P=0.02).
The survival analysis by Kaplan-Meyer has identified BCL2 expression as
important prognostic factor in agreement with Hwang et al., 2012. However, conflicting
findings are reported [Ryu and Lee, 2012].
4.15. Expression of cyclooxygenase-2 protein
Many factors are known to have prognostic value in case of breast cancer,
including tumour size, nodal status, hormone receptors, and HER2/neu expression. For
targeted treatment, hormone therapy and HER2/neu application have been successful
and they have become the mainstay of treatment of breast cancer patients along with
chemotherapy and radiation therapy. Adding to these treatment strategies, different
factors are being studied, one of which is COX-2 and the associated pathways. COX-2
is an inducible enzyme involved in the conversion of arachidonic acid to eicosanoids. In
cancerogenesis, COX-2 has been associated with angiogenesis, tumour cell
proliferation, invasion, metastatic spread and escape from apoptosis [Khan et al., 2011].

150
COX-2 expression can be evaluated by immunohistochemistry. However, the
technological variability can exceed the biological differences [Strumfa, 2005], and the
applied scoring systems also are diverse. Cho et al. determined COX-2 by multiplying
the staining intensity score and staining quantity score, while Ristimäki et al. and Haffty
et al. considered COX-2 moderately to strongly positive when >10% was stained in
cancer cells [Cho et al., 2006; Ristimäki et al., 2002; Haffty et al., 2008]. Analogous
approach was applied in the present study.
Consequently to the technological and scoring variability, contrasting data are
reported. Lee et al. evaluated COX-2 cytoplasmic expression by intensity scoring as 0
(negative), 1 (weak), 2 (moderate), or 3 (strong) and by percentage of positive tumour
cells. COX-2 was considered overexpressed when the intensity was scored 2 or 3 in
more than 10% of tumour cells. By these cut-off values, the positivity rate was 15%
[Lee et al., 2010]. In the present study, positive COX-2 expression was found in 1.3%
of investigated breast cancer cases. In general, the reported positivity of COX-2 in
breast cancer varies from 4.5% to 85% [Brueggemeier et al., 2005; Lee et al., 2010].
The difference can be attributed both to biological properties of the evaluated tumours
or to the immunohistochemical staining protocol, especially the clonality and affinity of
the primary antibody.
COX-2 immunohistochemical staining was scored using a weighted histoscore
by van Nes et al. in their work. The proportion of cells with cytoplasmic staining was
multiplied by the intensity of staining to provide a score of 0 to 300. The following
calculations were applied: score = (0 x percentage of cytoplasm not stained) + (1 x
percentage weakly stained) + (2 x percentage moderately stained) + (3 x percentage
strongly stained). Median tumour COX-2 histoscore was 148.33 (range 3-278), meaning
high COX-2 had a histoscore >148 and low COX-2 a histoscore ≤148. Increased COX-
2 expression was observed with increasing grade, stage (P<0.0001), and age (P<0.004)
as reported by van Nes et al., 2011. The correlation between COX-2 positivity and
grade and size of breast cancer was identified also by Jana et al., 2012 and Kim et al.,
2012. In the present study, there was no correlation between COX-2 expression and
cancer grade or pT. Also, no association between pN and COX-2 expression was found
in agreement with van Nes et al., 2011. As described by Lee, Im et al., 2007, no
statistical significance was found between COX-2 overexpression and patient’s age
(P=0.76), tumour size by pT (P=0.143), nodal status by pN (P=0.236), distant

151
metastases (P=0.407) and death rate (P=0.674). Similarly, in multivariate analysis, no
correlation was found between clinico-pathologic parameters and COX-2 expression
although COX-2 overexpression was more common in larger tumours and higher nodal
status (P<0.001 and P=0.048, respectively) by univariate evaluation [Lee et al., 2010].
In the present study, expression of COX-2 was limited to a subgroup of ER
negative cases (P=0.002). Analogous association was found regarding COX-2 and PR
expression (P=0.008). These data are in agreement with the observation that ER and PR
negative tumours exhibit higher COX-2 expression levels than hormone receptor
positive tumours [van Nes et al., 2011]. Also, significant correlation between COX-2
overexpression and ER negativity was found by Jana et al., 2012. In contrast, no
statistical significance was found between COX-2 overexpression and hormone receptor
(ER and PR) status (P=0.286 and P=0.272, respectively) by Lee, Im et al., 2007.
Brueggemeier et al. analysed the regulation of oestrogen in relation to COX-2,
and concluded that elevated COX-2 results in increased aromatase activity via autocrine
and paracrine mechanisms which underlie the pathogenesis of breast cancer. Although
there are theories involving the relationship between COX-2 and breast cancer, clinical
relevance or prognostic values are still controversial [Brueggemeier et al., 2005; Lee et
al., 2010].
There was no significant correlation between COX-2 expression and Ki-67 or
HER2 expression in aggrement with van Nes et al., 2011. As described by Lee et al.,
2007, no statistical significance was found between COX-2 overexpression and HER2
expression (P=0.277) or Ki-67 expression by cut-off value 20% characterised by
P=0.23 [Lee, Im et al., 2007]. Recently, correlation between COX-2 and HER2 posivity
in invasive ductal carcinoma was found [Jana et al., 2012].
In the present study, positive COX-2 expression was observed in HER2 positive
and triple negative molecular subtypes. Luminal A and both luminal B subtype cases
did not express COX-2. In general the data are in agreement with Nes et al., 2010 as in
the cited study the presence of COX-2 is observed in ER and PR-negative tumours. The
different cut-off values yield mathematically different results.
Statistically significant association was identified between two potential
prognostic and predictive factors as COX-2 and CK 5/6 (P=0.001). Only subgroup of
CK 5/6 positive cases exhibited COX-2 reactivity.

152
As described by Lee et al., 2007, no statistical significance was found between
COX-2 overexpression and p53 positivity (P=0.126). Analogous data are achieved in
the present study.
No correlation between COX-2 expression and survival was observed in
agreement with Lee, Im et al., 2007. The small number of COX-2 positive cases limited
the study.
4.16. Overexpression of cyclin D1
Cyclins ensure the positive regulation of cyclin dependant kinases that upon
activation promotes the progression of cell cycle. The cyclin family comprises several
proteins, including cyclins A, B1, D1 and E. Regarding breast cancer, more information
is available on cyclins A and E that are associated with poor prognosis, and on cyclin
B1 showing correlation with tumour grade, proliferation activity by Ki-67, mitotic count
and adverse clinical outcome [Boström et al., 2009]. The cyclin D1 controls the G1 to S
phase transition that represents critical checkpoint controlling cell entry into division
[Aaltonen et al., 2009; Velasco-Velázquez et al., 2011].
Cyclin D1 overexpression is reported to be more prevalent than amplification,
with the reported frequency ranging from 28% to 83%. The wide variation has been
linked with different antibodies, techniques and thresholds (cut-off points). Cyclin D1
overexpression, with or without CCND1 amplification, has received great attention in
the literature in the last three years due to results of in vitro studies and data from
clinical trials implicating cyclin D1 overexpression in resistance to tamoxifen treatment.
Immunohistochemical assessment of cyclin D1 expression has been performed
by different technologies. Several authorities have reported that immunohistochemical
assessment of cyclin D1 in pathology practice is difficult, erratic, “technically
challenging” and “not routinely used because of the frequent demonstration of
equivocal results” despite the development of a new rabbit monoclonal antibody
against cyclin D1 [Reis-Filho, Savage et al., 2006].
Reiss-Filho et al. assessed the intensity and distribution of immunohistochemical
distribution of cyclin D1 in semiquantitative way using the Allred score method. With
this method, the intensity of the immunohistochemical reaction as viewed under the
light microscope was recorded as 0, negative (no staining of any nuclei even at high

153
magnification); 1, weak (only visible at high magnification); 2, moderate (readily
visible at low magnification); or 3, strong (strikingly positive even at low power
magnification). The proportion of tumour nuclei showing positive staining was also
recorded as either: 0, none; 1, less than 1/100; 2, 1/100 to 1/10; 3, 1/10 to 1/3; 4, 1/3 to
2/3 and 5, more than 2/3. The proportion and intensity scores were added to obtain a
total score, which ranged from 0 to 8.35. Tumours were then categorised into four
groups: negative/weak expression (total scores 0-2), intermediate expression (total
scores 3-5) and strong expression (total scores 6-8). Only nuclear staining was
considered specific. Among 224 breast cancers, 13 were scored as 0; 1 as 2; 12 as 3; 16
as 4; 31 as 5; 57 as 6; 59 as 7 and 35 as 8 [Reis-Filho, Savage et al., 2006]. In present
study positive cyclin D1 expression is observed in 61.6% of breast cancer cases.
Boström et al., 2009 reported cyclin D expression in 3-90% of breast cancer cells.
Evidently, the diversity of scoring systems embarrasses the comparison between
different studies.
Research data from Lee et al. showed statistically significant association
between breast cancer size or pT parameter and expression of cyclin D1 in breast cancer
cells characterised by P=0.04 [Lee et al., 2007]. Statistically significant associations
were found between cyclin D1 expression and tumour size (P=0.01) in postmenopausal
women with early-stage, hormone receptor positive breast cancer [Rudas et al., 2008].
However, in the present study, the association was not statistically significant (P=0.1) in
agreement with Reis-Filho, Savage et al., 2006 and Boström et al., 2009. No
statistically significant association with pN was found in agreement with Reis-Filho,
Savage et al., 2006; Lee et al., 2007; Rudas et al., 2008 and Boström et al., 2009.
In the present study, the expression of cyclin D1 is associated with ER
expression (P<0.0001). Comparing ER positive and negative breast cancer groups it
was evident that more cyclin D1 positive cases belong to ER positive group but the ER
negative group includes more cyclin D1 negative cases (P<0.0001). Similar association
was found between expression of cyclin D1 and PR (P<0.0001). The findings are in
aggrement with the following literature data. Reis-Filho, Savage et al., 2006 reported
strong direct correlation between cyclin D1 positivity and expression of ER and PR
(both, P<0.0001). The positive correlation between cyclin D1 and hormone receptor
status was confirmed also by Aaltonen et al., 2009 and Boström et al., 2009.
Expression of cyclin D1 in the present study was not associated with HER2 status
(P=0.09) and proliferation activity (P=0.3). Both findings are in agreement with

154
Boström et al., 2009. Lack of significant correlation (P=0.08) between cyclin D1 and
HER2 overexpression is reported also by Reis-Filho, Savage et al., 2006 and Rudas et
al., 2008. The absence of correlation between cyclin D1 and proliferation activity is
indirectly confirmed by the reported lack of association between cyclin D1 expression
and breast cancer grade [Reis-Filho, Savage et al., 2006; Boström et al., 2009].
Controversial data regarding grade are presented by Rudas et al., 2008. However,
tumours with high levels of cyclin D1 expression showed lower proliferation rates
(P<0.0001) when compared to cyclin D1 low tumours [Reis-Filho, Savage et al., 2006].
In the present study, luminal A and luminal B (HER2 negative) molecular
subtype groups expressed cyclin D1 more frequently than HER2 positive or triple
negative breast cancer. Strong positive correlation between cyclin D1 expression and
luminal molecular subtype and significant inverse correlation (P<0.0001) between
basal-like immunophenotype and cyclin D1 overexpression has been described [Nielsen
et al., 2004; Reis-Filho, Savage et al., 2006].
Expression of cyclin D1 was significantly associated with CK 5/6 negativity
(P=0.004). Reis-Filho, Savage et al., 2006 also reported inverse correlation of cyclin D1
with the expression of basal markers (P<0.0001), including CK 5/6 (P<0.0001) as well
as EGFR (P<0.0001), CK 14 (P=0.0014), and CK 17 (P<0.0001).
There has been controversy in explaining the meaning of the cyclin D1
expression as a prognostic or predictive marker. Cyclin D1 overexpression has been
associated with poor prognosis in breast cancer. However, some researchers have
reported it to be of no prognostic significance while others have reported that cyclin D1
overexpression is associated with a better prognosis in breast cancer [Lee et al., 2007].
Stendahl et al. suggested that, when no hormone therapy was involved, patients
with breast cancers expressing high cyclin D1 levels had a better survival outcome than
those with cyclin D1 low/moderate breast cancers, but cyclin D1 overexpression is a
negative predictive factor for the response to tamoxifen in postmenopausal breast cancer
patients [Stendahl et al., 2004]. Aaltonen et al. suggested that cyclin D1 in ER positive
tumours correlates with high grade and proliferation activity as well as high
concentration of cyclins A and E, but in ER negative tumours it is associated with low
grade and low proliferation activity suggesting different pathogenetic mechanisms and
different regulation of cell proliferation [Aaltonen et al., 2009]. Ahnström et al.
reported that combined cyclin D1 and HER2 overexpression among breast cancer
patients is associated with a high rate of recurrence and suggested that cyclin D1 and

155
HER2 can cooperate to produce a more malignant tumour type with worse prognosis
[Ahnström et al., 2005]. The present study showed no significant relationship between
the expression of cyclin D1 and survival in patients with invasive breast cancer.
4.17. Basal differentiation by cytokeratin 5/6
The expression of CK 5/6 was found in 19.0% of consecutive invasive breast
cancer cases. The frequency of CK 5/6 presence is within the published range [Rattan et
al., 2012; Alshareeda et al., 2013]. CK 5/6 showed statistically significant association
with triple negative molecular subtype in accordance with Pillai et al., 2012. However,
positive cases were found in all molecular subtypes by reasonable rate. Statistically
significant associations between the presence of CK 5/6 and lack of oestrogen and
progesterone receptors as well as cyclin D1 expression also were identified. The CK 5/6
positive cases were significantly associated with higher proliferation. These findings are
in agreement with the published evidence [Pillai et al., 2012; Rattan et al., 2012;
Alshareeda et al., 2013]. However, the heterogeneity of CK 5/6 expression is an
important finding.

156
5. CONCLUSIONS
1. The breast cancer can be categorised into mutually exclusive molecular types by
immunohistochemistry for ER, PR, proliferation activity and HER2 protein.
Immunohistochemistry is also technologically adequate method to detect aberrant
p53 protein, BCL2 protein, COX-2, cyclin D1 and CK 5/6 in breast cancer tissues.
2. The molecular subtypes differ by tumour volume and local tumour spread pT.
Statistically significant differences between molecular subtypes are found
regarding axillary lymph nodes status by pN, invasion in lymph vessels, presence
of carcinoma in situ and histological type by WHO classification.
3. The expression of p53, BCL2, COX-2, cyclin D1 and CK 5/6 differs between
molecular types suggesting different pathways of molecular pathogenesis.
4. The expression of p53 protein, observed in 24.0% of breast cancer cases, is
associated with negative ER (P<0.0001), PR (P<0.0001) and BCL2 (P<0.0001). It
is heterogeneous regarding HER2 over-expression and proliferative activity.
5. The molecular portrait of BCL2 protein-expressing breast cancer includes positive
ER (P<0.0001), PR (P<0.0001) and cyclin D1 (P<0.0001) expression, as well as
lack of HER2 over-expression (P<0.0001) and CK 5/6 expression (P<0.0001).
There is statistically significant association with lower proliferative activity
(P<0.0001) although heterogeneity is observed. The rate of BCL2 protein
expression (67.6%) is well suited for clinical analysis.
6. Expression of COX-2 in breast cancer is rare event (1.3%), limited to ER
(P=0.002) and PR (P=0.008) negative, CK 5/6 (P=0.001) positive cases.
7. The cyclin D1 expression in breast cancer has reasonable frequency (61.6%). It
shows strong association with positivity for hormone receptors ER (P<0.0001)
and PR (P<0.0001) and also a strong inverse correlation with the expression of
basal-like CK 5/6 (P=0.004).
8. The expression of CK 5/6, found in 19.0% of breast cancer, is associated with ER
(P=0.003) and PR (P=0.004) negativity.
9. The survival is significantly influenced by pT, pN, cancer grade, molecular
subtype and expression of p53 and BCL2.

157
6. PRACTICAL RECOMMENDATIONS
1. The practical morphological examination of breast cancer tissues and data
reporting must be carried out by protocol approach. It is highly recommended to
extend the protocol by conclusion about the molecular subtype in addition to
primary data. Five molecular subtypes should be determined using
immunohistochemistry as economically adequate surrogate method and the
significant factor associated with survival.
2. Taking into account the high frequency of p53 expression in the context with
published evidence and the significant association with survival, it is
recommended to include immunohistochemistry for aberrant p53 protein in the
morphological diagnostic protocol of breast cancer.
3. Taking into account the high frequency BCL2 expression in the context with
published evidence and the significant association with survival, it is
recommended to include immunohistochemical evaluation of BCL2 protein
expression in the morphological diagnostic protocol of breast cancer.

158
7. REFERENCES
1. Aaltonen K, Amini RM, Landberg G, Eerola H, Aittomäki K, Heikkilä P,
Nevanlinna H, Blomqvist C. Cyclin D1 expression is associated with poor
prognostic features in estrogen receptor positive breast cancer. Breast Cancer Res
Treat. 2009;113(1):75-82.
2. Aaltonen K, Blomqvist C, Amini RM, Eerola H, Aittomäki K, Heikkilä P,
Nevanlinna H. Familial breast cancers without mutations in BRCA1 or BRCA2
have low cyclin E and high cyclin D1 in contrast to cancers in BRCA mutation
carriers. Clin Cancer Res. 2008;14(7):1976-1983.
3. Abdel-Fatah TM, Powe DG, Hodi Z, Reis-Filho JS, Lee AH, Ellis IO.
Morphologic and molecular evolutionary pathways of low nuclear grade invasive
breast cancers and their putative precursor lesions: further evidence to support the
concept of low nuclear grade breast neoplasia family. Am J Surg Pathol.
2008;32(4):513-523.
4. Abdollahi A, Ensani F, Maleki Z, Iravanlo G, Ashtari A. Differential expression
of e-cadherin in lobular and ductal carcinoma of breast in an Iranian Cancer Care
Hospital. Pakistan Journal of Medical Sciences. 2011;27(1):56-59.
5. Abramson VG, Troxel AB, Feldman M, Mies C, Wang Y, Sherman L, McNally
S, Diehl A, Demichele A. Cyclin D1b in human breast carcinoma and
coexpression with cyclin D1a is associated with poor outcome. Anticancer Res.
2010;30(4):1279-1285.
6. Ahnström M, Nordenskjöld B, Rutqvist LE, Skoog L, Stål O. Role of cyclin D1 in
erbB2-positive breast cancer and tamoxifen resistance. Breast Cancer Res Treat.
2005;91:145-151.
7. Alireza A, Raheleh S, Abbass R, Mojgan M, Mohamadreza M, Gholamreza M,
Shadi B. An immunohistochemistry study of tissue bcl-2 expression and its serum
levels in breast cancer patients. Ann N Y Acad Sci. 2008;1138:114-120.
8. Al-Joudi FS, Iskandar ZA, Rusli J. The expression of p53 in invasive ductal
carcinoma of the breast: a study in the North-East States of Malaysia. Med J
Malaysia. 2008;63(2):96-99.

159
9. Almeida M, Munoz J, Nunes S, Fonseca-Moutinho J. Cyclooxygenase-2
immunoexpression in breast cancer: progesterone receptor influence. Cancer
Epidemiol. 2011;35(6):e81-e84.
10. Alshareeda AT, Soria D, Garibaldi JM, Rakha E, Nolan C, Ellis IO, Green AR.
Characteristics of basal cytokeratin expression in breast cancer. Breast Cancer Res
Treat. 2013;139(1):23-37.
11. Alsner J, Jensen V, Kyndi M, Offersen BV, Vu P, Børresen-Dale AL, Overgaard
J. A comparison between p53 accumulation determined by immunohistochemistry
and TP53 mutations as prognostic variables in tumours from breast cancer
patients. Acta Oncol. 2008;47(4):600-607.
12. Ambrogi F, Biganzoli E, Querzoli P, Ferretti S, Boracchi P, Alberti S, Marubini
E, Nenci I. Molecular subtyping of breast cancer from traditional tumor marker
profiles using parallel clustering methods. Clin Cancer Res. 2006;12(3 Pt 1):781-
790.
13. Anderson KS, Wong J, Vitonis A, Crum CP, Sluss PM, Labaer J, Cramer D. p53
autoantibodies as potential detection and prognostic biomarkers in serous ovarian
cancer. Cancer Epidemiol Biomarkers Prev. 2010;19(3):859-868.
14. Andre F, Pusztai L. Molecular classification of breast cancer: implications for
selection of adjuvant chemotherapy. Nat Clin Prot Oncol. 2006;3(11):621-632.
15. Arps DP, Healy P, Zhao L, Kleer CG, Pang JC. Invasive ductal carcinoma with
lobular features: a comparison study to invasive ductal and invasive lobular
carcinomas of the breast. Breast Cancer Res Treat. 2013;138(3):719-726.
16. Arun B, Kilic G, Yen C, Foster B, Yardley DA, Gaynor R, Ashfaq R. Loss of
FHIT expression in breast cancer is correlated with poor prognostic markers.
Cancer Epidemiol Biomarkers Prev. 2005;14(7):1681-1685.
17. Ashok V, Dash C, Rohan TE, Sprafka JM, Terry PD. Selective cyclooxygenase-2
(COX-2) inhibitors and breast cancer risk. Breast. 2011;20(1):66-70.
18. Bai J, Yong HM, Chen FF, Mei PJ, Liu H, Li C, Pan ZQ, Wu YP, Zheng JN.
Cullin1 is a novel marker of poor prognosis and a potential therapeutic target in
human breast cancer. Ann Oncol. 2013 Apr 16. [Epub ahead of print].
19. Banerjee S, Reis-Filho JS, Ashley S, Steele D, Ashworth A, Lakhani SR, Smith
IE. Basal-like breast carcinomas: clinical outcome and response to chemotherapy.
J Clin Pathol. 2006;59(7):729-735.

160
20. Bennis S, Abbass F, Akasbi Y, Znati K, Joutei KA, El Mesbahi O, Amarti A.
Prevalence of molecular subtypes and prognosis of invasive breast cancer in
north-east of Morocco: retrospective study. BMC Res Notes. 2012;5(1):436.
21. Bertolo C, Guerrero D, Vicente F, Cordoba A, Esteller M, Ropero S, Guillen-
Grima F, Martinez-Peñuela JM, Lera JM. Differences and molecular
immunohistochemical parameters in the subtypes of infiltrating ductal breast
cancer. Am J Clin Pathol. 2008;130(3):414-424.
22. Bidard FC, Matthieu MC, Chollet P, Raoefils I, Abrial C, Dômont J, Spielmann
M, Delaloge S, André F, Penault-Llorca F. p53 status and efficacy of primary
anthracyclines/alkylating agent-based regimen according to breast cancer
molecular classes. Ann Oncol. 2008;19(7):1261-1265.
23. Bilalović N, Vranić S, Basić H, Tatarević A, Selak I. Immunohistochemical
evaluation of cyclin D1 in breast cancer. Croat Med J. 2005;46(3):382-388.
24. Binder C, Marx D, Overhoff R, Binder L, Schauer A, Hiddemann W. Bcl-2
protein expression in breast cancer in relation to established prognostic factors
and other clinicopathological variables. Ann Oncol. 1995;6(10):1005-1010.
25. Bisaro B, Montani M, Konstantinidou G, Marchini C, Pietrella L, Iezzi M, Galie
M, Orso F, Camporeale A, Colombo SM, Di Stefano P, Tornillo G, Camacho-
Leal MD, Turco E, Taverna D, Cabodi S, Amici A, Defilippi P.
p130Cas/Cyclooxygenase-2 axis in the control of mesenchymal plasticity of
breast cancer cells. Breast Cancer Res. 2012;14(5):R137.
26. Blaszyk H, Hartmann A, Cunningham JM, Schaid D, Wold LE, Kovach JS,
Sommer SS. A prospective trial of midwest breast cancer patients: a p53 gene
mutation is the most important predictor of adverse outcome. Int J Cancer.
2000;89(1):32-38.
27. Blows FM, Driver KE, Schmidt MK, Broeks A, van Leeuwen FE, Wesseling J,
Cheang MC, Gelmon K, Nielsen TO, Blomqvist C, Heikkilä P, Heikkinen T,
Nevanlinna H, Akslen LA, Bégin LR, Foulkes WD, Couch FJ, Wang X, Cafourek
V, Olson JE, Baglietto L, Giles GG, Severi G, McLean CA, Southey MC, Rakha
E, Green AR, Ellis IO, Sherman ME, Lissowska J, Anderson WF, Cox A, Cross
SS, Reed MWR, Provenzano E, Dawson SJ, Dunning AM, Humphreys M, Easton
DF, García-Closas M, Caldas C, Pharoah PD, Huntsman D. Subtyping of breast
cancer by immunohistochemistry to investigate a relationship between subtype

161
and short and long term survival: a collaborative analysis of data for 10,159 cases
from 12 studies. PLoS Med. 2010;7:e1000279.
28. Bocca C, Bozzo F, Bassignana A, Miglietta A. Antiproliferative effects of COX-2
inhibitor celecoxib on human breast cancer cell lines. Mol Cell Biochem.
2011;350(1-2):59-70.
29. Bombonati A, Sgroi DC. The molecular pathology of breast cancer progression. J
Pathol. 2011;223:307-317.
30. Boneberg EM, Legler DF, Senn HJ, Fürstenberger G. Reduced expression of
cyclooxygenase-2 in primary breast cancer. J Natl Cancer Inst.
2008;100(14):1042-1043.
31. Bos PD, Zhang XH, Nadal C, Shu W, Gomis RR, Nguyen DX, Minn AJ, van de
Vijver MJ, Gerald WL, Foekens JA, Massague J. Genes that mediate breast
cancer metastasis to the brain. Nature. 2009;459(7249):1005-1009.
32. Boström P, Söderström M, Palokangas T, Vahlberg T, Collan Y, Carpen O,
Hirsimäki P. Analysis of cyclins A, B1, D1 and E in breast cancer in relation to
tumour grade and other prognostic factors. BMC Res Notes. 2009;2:140. doi:
10.1186/1756-0500-2-140.
33. Bradley KT. Prognostic and predictive factors in breast cancer. College of
American Pathologists newsletter NewsPath. 2007.
34. Brooks CL, Li M, Gu W. Monoubiquitination: the signal for p53 nuclear export?
Cell Cycle. 2004;3(4):436-438.
35. Brueggemeier RW, Diaz-Cruz ES, Li PK, Sugimoto Y, Lin YC, Shapiro CL.
Translational studies on aromatase, cyclooxygenases and enzyme inhibitors in
breast cancer. J Steroid Biochem Mol Biol. 2005;95:129-136.
36. Callagy GM, Pharoah PD, Pinder SE, Hsu FD, Nielsen TO, Ragaz J, Ellis IO,
Huntsman D, Caldas C. Bcl-2 is a prognostic marker in breast cancer
independently of the Nottingham Prognostic Index. Clin Cancer Res.
2006;12(8):2468-2475.
37. Callagy GM, Webber MJ, Pharoah PD, Caldas C. Meta-analysis confirms BCL2
is an independent prognostic marker in breast cancer. BMC Cancer. 2008;8:153.
38. Carey LA, Dees EC, Sawyer L, Gatti L, Moore DT, Collichio F, Ollila DW,
Sartor CI, Graham ML, Perou CM. The triple negative paradox: primary tumor
chemosensitivity of breast cancer subtypes. Clin Cancer Res. 2007;13:2329-2334.

162
39. Carey LA, Perou CM, Livasy CA, Dressler LG, Cowan D, Conway K, Karaca G,
Troester M A, Tse CK, Edmiston S, Deming SL, Geradts J, Cheang MC, Nielsen
TO, Moorman PG, Earp HS, Millikan RC. Race, breast cancer subtypes, and
survival in the Carolina Breast Cancer Study. JAMA. 2006;295(21):2492-2502.
40. Cheang MC, Voduc D, Bajdik C, Leung S, McKinney S, Chia SK, Perou CM,
Nielsen TO. Basal-like breast cancer defined by five biomarkers has superior
prognostic value than triple-negative phenotype. Clin Cancer Res. 2008;14:1368-
1376.
41. Cheang MCU, Chia SK, Voduc D, Gao D, Leung S, Snider J, Watson M, Davies
S, Bernard PS, Parker JS, Perou CM, Ellis MJ, Nielsen TO. Ki67 index, HER2
status, and prognosis of patients with luminal B breast cancer. J Natl Cancer Inst.
2009;101:736-750.
42. Chen TH, Huang CC, Yeh KT, Chang SH, Chang SW, Sung WW, Cheng YW,
Lee H. Human papilloma virus 16 E6 oncoprotein associated with p53
inactivation in colorectal cancer. World J Gastroenterol. 2012;18(30):4051-4058.
43. Chen X, Wu J, Lu H, Huang O, Shen K. Measuring β-tubulin III, Bcl-2, and
ERCC1 improves pathological complete remission predictive accuracy in breast
cancer. Cancer Sci. 2012;103(2):262-268.
44. Cho EY, Choi YL, Han JJ, Kim KM, Oh YL. Expression and amplification of
Her2, EGFR and cyclin D1 in breast cancer: immunohistochemistry and
chromogenic in situ hybridization. Pathol Int. 2008;58(1):17-25.
45. Cho MH, Yoon JH, Jaegal YJ, Choi YD, Lee JS, Lee JH, Nam JH, Choi C, Lee
MC, Park CS, Woo Juhng S, Min KW. Expression of cyclooxygenase-2 in breast
carcinogenesis and its relation to HER-2/neu and p53 protein expression in
invasive ductal carcinoma. Breast. 2006;15:390-398.
46. Cianfrocca M, Goldstein LJ. Prognostic and predictive factors in early-stage
breast cancer. Oncologist. 2004;9(6):606-616.
47. Ciris IM, Bozkurt KK, Başpinar S, Kapucuoğlu FN. Immunohistochemical COX-
2 overexpression correlates with HER-2/neu overexpression in invasive breast
carcinomas: a pilot study. Pathol Res Pract. 2011;207(3):182-187.
48. Colozza M, Azambuja E, Cardoso F, Sotiriou C, Larsimont D, Piccart MJ.
Proliferative markers as prognostic and predictive tools in early breast cancer:
where are we now? Ann Oncol. 2005;16(11):1723-1739.

163
49. Conforti R, Boulet T, Tomasic G, Taranchon E, Arriagada R, Spielmann M,
Ducourtieux M, Soria JC, Tursz T, Delaloge S, Michiels S, Andre F. Breast
cancer molecular subclassification and estrogen receptor expression to predict
efficacy of adjuvant anthracyclines-based chemotherapy: a biomarker study from
two randomized trials. Ann Oncol. 2007;18(9):1477-1483.
50. Cronin-Fenton DP, Pedersen L, Lash TL, Friis S, Baron JA, Sørensen HT.
Prescriptions for selective cyclooxygenase-2 inhibitors, non-selective non-
steroidal anti-inflammatory drugs, and risk of breast cancer in a population based
case-control study. Breast Cancer Res. 2010;12(2):R15.
51. Dako Denmark A/S, Produktionsvej 42, DK-2600, Glostrup, Denmark,
M0887/EFG/KRM/2008.09.30:p.1-4.
52. Dako Denmark A/S, Produktionsvej 42, DK-2600, Glostrup, Denmark,
M3617/305834EFG_001:p.1-8.
53. Dako Denmark A/S, Produktionsvej 42, DK-2600, Glostrup, Denmark,
M3642/P01466EFG_002_M3642/2011.04:p.1-8
54. Dako Denmark A/S, Produktionsvej 42, DK-2600, Glostrup, Denmark,
M7001/EFG/CE/18.12.02:p.1-4.
55. Dako HercepTestTM
, Code K5204, Glostrup, Denmark, 16th edition. For
immunocytochemical staining.
56. Davies G, Martin LA, Sacks N, Dowsett M. Cyclooxygenase-2 (COX-2),
aromatase and breast cancer: a possible role for COX-2 inhibitors in breast cancer
chemoprevention. Ann Oncol. 2002;13(5):669-678.
57. Dawson SJ, Makretsov N, Blows FM, Driver KE, Provenzano E, Le Quesne J,
Baglietto L, Severi G, Giles GG, McLean CA, Callagy G, Green AR, Ellis I,
Gelmon K, Turashvili G, Leung S, Aparicio S, Huntsman D, Caldas C, Pharoah P.
BCL2 in breast cancer: a favourable prognostic marker across molecular subtypes
and independent of adjuvant therapy received. Br J Cancer. 2010;103(5):668-675.
58. de Azambuja E, Cardoso F, de Castro G Jr, Colozza M, Mano MS, Durbecq V,
Sotiriou C, Larsimont D, Piccart-Gebhart MJ, Paesmans M. Ki-67 as prognostic
marker in early breast cancer: a meta-analysis of published studies involving
12,155 patients. Br J Cancer. 2007;96(10):1504-1513.
59. de Roos MA, de Bock GH, de Vries J, van der Vegt B, Wesseling J. p53
overexpression is a predictor of local recurrence after treatment for both in situ
and invasive ductal carcinoma of the breast. J Surg Res. 2007;140(1):109-114.

164
60. de Santis C, Siegel R, Jemal A. American Cancer Society. Breast Cancer Facts &
Figures 2011-2012. 2011; Atlanta: American Cancer Society, Inc.
61. Denkert C, Winzer KJ, Müller BM, Weichert W, Pest S, Köbel M, Kristiansen G,
Reles A, Siegert A, Guski H, Hauptmann S. Elevated expression of
cyclooxygenase-2 is a negative prognostic factor for disease free survival and
overall survival in patients with breast carcinoma. Cancer. 2003;97(12):2978-
2987.
62. Dhakal HP, Naume B, Synnestvdt M, Borgen E, Kaaresen R, Schlichting E,
Wiedswang G, Bassarova A, Holm R, Giercksky KE, Nesland JM. Expression of
cyclooxygenase-2 in invasive breast carcinomas and its prognostic impact. Histol
Histopathol. 2012;27(10):1315-1325.
63. Dookeran KA, Dignam JJ, Holloway N, Ferrer K, Sekosan M, McCaskill-Stevens
W, Gehlert S. Race and the prognostic influence of p53 in women with breast
cancer. Ann Surg Oncol. 2012;19(7):2334-2344.
64. Dowsett M, Nielsen TO, A'Hern R, Bartlett J, Coombes RC, Cuzick J, Ellis M,
Henry NL, Hugh JC, Lively T, McShane L, Paik S, Penault-Llorca F, Prudkin L,
Regan M, Salter J, Sotiriou C, Smith IE, Viale G, Zujewski JA, Hayes DF;
International Ki-67 in Breast Cancer Working Group. Assessment of Ki67 in
breast cancer: recommendations from the International Ki67 in Breast Cancer
working group. J Natl Cancer Inst. 2011;103(22):1656-1664.
65. Dublin EA, Miles DW, Rubens RD, Smith P, Barnes DM. p53
immunohistochemical staining and survival after adjuvant chemotherapy for
breast cancer. Int J Cancer. 1997;74(6):605-608.
66. Edge SB, Byrd DR, Compton CC, Fritz AG, Greene FG, Trotti A, eds. AJCC
Cancer Staging Manual. 7th ed. New York: Springer; 2010.
67. Elsheikh S, Green AR, Aleskandarany MA, Grainge M, Paish CE, Lambros MB,
Reis-Filho JS, Ellis IO. CCND1 amplification and cyclin D1 expression in breast
cancer and their relation with proteomic subgroups and patient outcome. Breast
Cancer Res Treat. 2008;109(2):325-335.
68. Elston CW, Ellis IO. Pathological prognostic factors in breast cancer. I. The value
of histological grade in breast cancer: experience from a large study with long-
term follow-up. Histopathology. 1991;19(5):403-410.
69. Esteva FJ, Hortobagyi GN. Prognostic molecular markers in early breast cancer.
Breast Cancer Res. 2004;6(3):109-118.

165
70. Fernández-Cuesta L, Oakman C, Falagan-Lotsch P, Smoth KS, Quinaux E, Buyse
M, Dolci MS, Azambuja ED, Hainaut P, Dell'orto P, Larsimont D, Francis PA,
Crown J, Piccart-Gebhart M, Viale G, Leo AD, Olivier M. Prognostic and
predictive value of TP53 mutations in node-positive breast cancer patients treated
with anthracycline - or anthracycline/taxane-based adjuvant therapy: results from
the BIG 02-98 phase III trial. Breast Cancer Res. 2012;14(3):R70.
71. Filipovic A, Giamas G, Stebbing J. The potential role of cyclooxygenase-2(COX-
2) during early breast cancer therapy. Ann Oncol. 2011;22(8):1700-1702.
72. Fitzgibbons PL, Page DL, Weaver D, Thor AD, Allred DC, Clark GM, Ruby SG,
O'Malley F, Simpson JF, Connolly JL, Hayes DF, Edge SB, Lichter A, Schnitt SJ.
Prognostic factors in breast cancer. College of American Pathologists Consensus
Statement 1999. Arch Pathol Lab Med. 2000;124(7):966-978.
73. Foulkes WD, Ian E. Smith, Jorge S. Reis-Filho JS. Triple-negative breast cancer.
N Engl J Med. 2010;363:1938-1948.
74. Gaur RK. Breast cancer biomarkers in Omics: Applications in Biomedical,
Agricultural, and Environmental Sciences. Ed. by Bahr D, Zambare V, Azevedo
V. Taylor & Francis Group, USA, 2013.
75. Glover JA, Hughes CM, Cantwell MM, Murray LJ. A systematic review to
establish the frequency of cyclooxygenase-2 expression in normal breast
epithelium, ductal carcinoma in situ, microinvasive carcinoma of the breast and
invasive breast cancer. Br J Cancer. 2011;105(1):13-17.
76. Göhring UJ, Scharl A, Heckel C, Ahr A, Crombach G. P53 protein in 204 patients
with primary breast carcinoma – immunohistochemical detection and clinical
value as a prognostic factor. Arch Gynecol Obstet. 1995;256:139-146.
77. Goldhirsch A, Wood WC, Coates AS, Gelber RD, Thürlimann B, Senn HJ; Panel
members. Strategies for subtypes – dealing with the diversity of breast cancer:
highlights of the St. Gallen International Expert Consensus on the Primary
Therapy of Early Breast Cancer 2011. Ann Oncol. 2011;22(8):1736-1747.
78. Gonzalez-Angulo AM, Stemke-Hale K, Palla SL, Carey M, Agarwal R, Meric-
Berstam F, Traina TA, Hudis C, Hortobagyi GN, Gerald WL, Mills GB, Hennessy
BT. Androgen receptor levels and association with PIK3CA mutations and
prognosis in breast cancer. Clin Cancer Res. 2009;15(7):2472-2478.
79. Guarneri V, Barbieri E, Piacentini F, Giovannelli S, Ficarra G, Frassoldati A,
Maiorana A, D'Amico R, Conte P. Predictive and prognostic role of p53

166
according to tumor phenotype in breast cancer patients treated with preoperative
chemotherapy: a single-institution analysis. Int J Biol Markers. 2010;25(2):104-
111.
80. Guarneri V, Conte PF. Metastatic breast cancer: therapeutic options according to
molecular subtypes and prior adjuvant therapy. Oncologist. 2009;14:645-656.
81. Guo GL, Yang GL, Li ZY, You J, Yang K, Huang DP, Hu XQ, Zhang XH. The
effect of cyclooxygenase-2 on lymphangiogenesis in breast cancer. [Article in
Chinese]. Zhonghua Wai Ke Za Zhi. 2008;46(2):132-135. PMID 18509974.
82. Guo LL, Gao P, Wu YG, Jian WC, Hao CY, Li H, Lin XY. Alteration of cyclin
D1 in Chinese patients with breast carcinoma and its correlation with Ki-67, pRb,
and p53. Arch Med Res. 2007;38(8):846-852.
83. Haffty BG, Yang Q, Moran MS, Tan AR, Reiss M. Estrogen-dependent
prognostic significance of cyclooxygenase-2 expression in early-stage invasive
breast cancers treated with breast-conserving surgery and radiation. Int J Radiat
Oncol Biol Phys. 2008;71:1006-1013.
84. Hamilton A, Piccart M. The contribution of molecular markers to the prediction of
response in the treatment of breast cancer: a review of the literature on HER-2,
p53 and BCL-2. Ann Oncol. 2000;11:647-663.
85. Hammond MH, Hayes DF, Wolff AC, Mangu PB, Temin S. American Society of
Clinical Oncology/College of American Pathologists guideline recommendations
for immunohistochemical testing of estrogen and progesterone receptors in breast
cancer. J Oncol Pract. 2010;6(4):195-197.
86. Harris RE. Cyclooxygenase-2 (cox-2) blockade in the chemoprevention of cancers
of the colon, breast, prostate and lung. Inflammopharmacology. 2009;17(2):55-67.
87. He L, He X, Lowe SW, Hannon GJ. MicroRNAs join the p53 network – another
piece in the tumour suppression puzzle. Nat Rev Cancer. 2007;7(1):819-822.
88. Hicks DG, Short SM, Prescott NL, Tarr SM, Coleman KA, Yoder BJ, Crowe JP,
Choueiri TK, Dawson AE, Budd GT, Tubbs RR, Casey G, Weil RJ. Breast
cancers with brain metastases are more likely to be estrogen receptor negative,
express the basal CK5/6, and overexpress HER2 or EGFR. Am J Surg Pathol.
2006;30(9):1097-1104.
89. Holmes MD, Chen WY, Schnitt SJ, Collins L, Colditz GA, Hankinson SE,
Tamimi RM. COX-2 expression predicts worse breast cancer prognosis and does

167
not modify the association with aspirin. Breast Cancer Res Treat.
2011;130(2):657-662.
90. Hou Z, Falcone DJ, Subbaramaiah K, Dannenberg AJ. Macrophages induce COX-
2 expression in breast cancer cells: role of IL-1beta autoamplification.
Carcinogenesis. 2011;32(5):695-702.
91. Hu M, Peluffo G, Chen H, Gelman R, Schnitt S, Polyak K. Role of COX-2 in
epithelial-stromal cell interactions and progression of ductal carcinoma in situ of
the breast. Proc Natl Acad Sci USA. 2009;106(9):3372-3377.
92. Hu R, Dawood S, Holmes MD, Collins LC, Schnitt SJ, Cole K, Marotti JD,
Hankinson SE, Colditz GA, Tamimi RM. Androgen receptor expression and
breast cancer survival in postmenopausal women. Clin Cancer Res.
2011;17(7):1867-1874.
93. Huang Y, Nayak S, Jankowitz R, Davidson NE, Oesterreich S. Epigenetics in
breast cancer: what’s new? Breast Cancer Res. 2011;13:225.
94. Hudis CA, Gianni L. Triple-negative breast cancer: an unmet medical need.
Oncologist. 2011;16(Suppl 1):1-11.
95. Hwang KT, Woo JW, Shin HC, Kim HS, Ahn SK, Moon HG, Han W, Park IA,
Noh DY. Prognostic influence of BCL2 expression in breast cancer. Int J Cancer.
2012;131(7):E1109-19. doi: 10.1002/ijc.27539.
96. Iliopoulos D, Hirsch HA, Wang G, Struhl K. Inducible formation of breast cancer
stem cells and their dynamic equilibrium with non-stem cancer cells via IL6
secretion. Proc Natl Acad Sci USA. 2011;108(4):1397-1402.
97. Irigoyen MAA, García FV, Iturriagagoitia AC, Beroiz BI, Martínez MS, Grima
FG. Subtipos moleculares del cáncer de mama: implicaciones pronósticas y
características clínicas e inmunohistoquímicas. [Article in Spanish] An. Sist.
Sanit. Navar. 2011;34(2):219-233.
98. Ishii Y, Pirkmaier A, Alvarez JV, Frank DA, Keselman I, Logothetis D, Mandeli
J, O’Connell MJ, Waxman S, Germain D. Cyclin D1 overexpression and response
to bortezomib treatment in a breast cancer model. J Natl Cancer Inst.
2006;98(17):1238-1247.
99. Jacquemier J, Charafe-Jauffret E, Monville F, Esterni B, Extra JM, Houvenaeghel
G, Xerri L, Bertucci F, Birnbaum D. Association of GATA3, P53, Ki67 status and
vascular peritumoral invasion are strongly prognostic in luminal breast cancer.
Breast Cancer Res. 2009;11(2):R23.

168
100. Jana D, Sarkar DK, Maji A, Chikkala BR, Hassanujjaman S, Mukhopadhyay M,
Ganguly S. Can cyclo-oxygenase-2 be a useful prognostic and risk stratification
marker in breast cancer? J Indian Med Assoc. 2012;110(7):429-433.
101. Jemal A, Bray F, Center MM, Ferlay J, Ward E, Forman D. Global Cancer
Statistics. Ca Cancer J Clin. 2011;61:69-90.
102. Jung SY, Jeong J, Shin SH, Kwon Y, Kim EA, Ko KL, Shin KH, Ro J, Lee KS,
Park IH, Lee S, Kim SW, Kang HS. Accumulation of p53 determined by
immunohistochemistry as a prognostic marker in node negative breast cancer;
analysis according to St Gallen consensus and intrinsic subtypes. J Surg Oncol.
2011;103(3):207-211.
103. Kamel A, Mokhtar N, Elshakankiry N, Yassin D, Elnahass Y, Zakarya O,
Elbasmy A, Elmetenawy W. The prognostic impact of some cell cycle regulatory
proteins in Egyptian breast cancer patients. J Egypt Natl Canc Inst.
2006;18(2):93-102.
104. Kang JH, Song KH, Jeong KC, Kim S, Choi C, Lee CH, Oh SH. Involvement of
Cox-2 in the metastatic potential of chemotherapy-resistant breast cancer cells.
BMC Cancer. 2011;11:334.
105. Karavitis J, Hix LM, Shi YH, Schultz RF, Khazaie K, Zhang M. Regulation of
COX2 expression in mouse mammary tumor cells controls bone metastasis and
PGE2-induction of regulatory T cell migration. PLoS One. 2012;7(9):e46342.
106. Khan Z, Khan N, Tiwari RP, Sah NK, Prasad GB, Bisen PS. Biology of Cox-2: an
application in cancer therapeutics. Curr Drug Targets. 2011;12(7):1082-1093.
107. Kim HS, Moon HG, Han W, Yom CK, Kim WH, Kim JH, Noh DY. COX2
overexpression is a prognostic marker for Stage III breast cancer. Breast Cancer
Res Treat. 2012;132(1):51-59.
108. Kim K, Chie EK, Han W, Noh DY, Park IA, Oh DY, Im SA, Kim TY, Bang YJ,
Ha SW. Prognostic value of p53 and bcl-2 expression in patients treated with
breast conservative therapy. J Korean Med Sci. 2010;25(2):235-239.
109. Koo JS, Park S, Kim SI, Lee S, Park BW. The impact of caveolin protein
expression in tumor stroma on prognosis of breast cancer. Tumour Biol.
2011;32(4):787-799.
110. Kröger N, Milde-Langosch K, Riethdorf S, Schmoor C, Schumacher M, Zander
AR, Löning T. Prognostic and predictive effects of immunohistochemical factors
in high-risk primary breast cancer patients. Clin Cancer Res. 2006;12(1):159-168.

169
111. Kulic A, Sirotkovic-Skerlev M, Jelisavac-Cosic S, Herceg D, Kovac Z, Vrbanec
D. Anti-p53 antibodies in serum: relationship to tumor biology and prognosis of
breast cancer patients. Med Oncol. 2010;27(3):887-893.
112. Kumar P, Mukherjee M, Johnson JP, Patel M, Huey B, Albertson DG, Simin K.
Cooperativity of Rb, Brca1, and p53 in malignant breast cancer evolution. PLoS
Genet. 2012;8(11):e1003027. doi: 10.1371/journal.pgen.1003027.
113. Kwon Y, Ro J, Kang HS, Kim SK, Hong EK, Khang SK, Gong G, Ro JY.
Clinicopathological parameters and biological markers predicting non-sentinel
node metastasis in sentinel-node-positive breast cancer patients. Oncol Rep.
2011;25(4):1063-1071.
114. Kyndi M, Sørensen FB, Knudsen H, Alsner J, Overgaard M, Nielsen HM,
Overgaard J. Impact of BCL2 and p53 on postmastectomy radiotherapy response
in high-risk breast cancer. A subgroup analysis of DBCG82 b&c. Acta Oncol.
2008;47(4):608-617.
115. Lanigan F, McKiernan E, Brennan DJ, Hegarty S, Millikan RC, McBryan J,
Jirstrom K, Landberg G, Martin F, Duffy MJ, Gallagher WM. Increased claudin-4
expression is associated with poor prognosis and high tumour grade in breast
cancer. Int J Cancer. 2009;124(9):2088-2097.
116. Lara JF, Thor AD, Dressler LG, Broadwater G, Bleiweiss IJ, Edgerton S, Cowan
D, Goldstein LJ, Martino S, Ingle JN, Henderson IC, Norton L, Winer EP, Hudis
CA, Ellis MJ, Berry DA, Hayes DF, Cancer and Leukemia Group B. p53
expression in node-positive breast cancer patients: results from the Cancer and
Leukemia Group B 9344 Trial (159905). Clin Cancer Res. 2011;17(15):5170-
5178.
117. Larkins TL, Nowell M, Singh S, Sanford GL. Inhibition of cyclooxygenase-2
decreases breast cancer cell motility, invasion and matrix metalloproteinase
expression. BMC Cancer. 2006;6:181.
118. Laurinavicius A, Laurinaviciene A, Ostapenko V, Dasevicius D, Jarmalaite S,
Lazutka J. Immunohistochemistry profiles of breast ductal carcinoma: factor
analysis of digital image analysis data. Diagn Pathol. 2012;7:27. doi:
10.1186/1746-1596-7-27.
119. Le MG, Mathieu MC, Douc-Rasy S, Le Bihan ML, Adb El All H, Spielmann M,
Riou G. c-myc, p53 and bcl-2, apoptosis-related genes in infiltrating breast
carcinomas: evidence of a link between bcl-2 protein over-expression and a lower

170
risk of metastasis and death in operable patients. Int J Cancer. 1999;84(6):562-
567.
120. Lee A, Park WC, Yim HW, Lee MA, Park G, Lee KY. Expression of c-erbB2,
cyclin D1 and estrogen receptor and their clinical implications in the invasive
ductal carcinoma of the breast. Jpn J Clin Oncol. 2007;37(9):708-714.
121. Lee AH. Use of immunohistochemistry in the diagnosis of problematic breast
lesions. J Clin Pathol. 2013 Mar 13. [Epub ahead of print].
122. Lee JA, Bae JW, Woo SU, Kim H, Kim CH. Correlation between COX-2
expression and hormone receptors in invasive ductal breast cancer. J Korean Surg
Soc. 2010;78:140-148.
123. Lee KH, Im SA, Oh DY, Lee SH, Chie EK, Han W, Kim DW, Kim TY, Park IA,
Noh DY, Heo DS, Ha SW, Bang YJ. Prognostic significance of bcl-2 expression
in stage III breast cancer patients who had received doxorubicin and
cyclophosphamide followed by paclitaxel as adjuvant chemotherapy. BMC
Cancer. 2007;7:63.
124. Leo C, Faber S, Hentschel B, Höckel M, Horn LC. The status of cyclooxygenase-
2 expression in ductal carcinoma in situ lesions and invasive breast cancer
correlates to cyclooxygenase-2 expression in normal breast tissue. Ann Diagn
Pathol. 2006;10(6):327-332.
125. Leung LK, Wang TT. Paradoxical regulation of Bcl-2 family proteins by 17beta-
oestradiol in human breast cancer cells MCF-7. Br J Cancer. 1999;81(3):387-392.
126. Li XR, Liu M, Zhang YJ, Wang JD, Zheng YQ, Li J, Ma B, Song X. CK5/6,
EGFR, Ki-67, cyclin D1, and nm23-H1 protein expressions as predictors of
pathological complete response to neoadjuvant chemotherapy in triple-negative
breast cancer patients. Med Oncol. 2011;28(Suppl 1):S129-S134.
127. Lialiaris TS, Kouskoukis A, Georgiou G, Tripsianis G, Fiska A, Giatromanolaki
A, Chrisafi S, Sivridis E, Vamvakopoulou DN, Soutopoulou DO, Kiritsaka A,
Athanassiou E, Lialios GA, Sotiriou S, Sidiropoulos A, Vamvakopoulos NC.
Expression of 6 common antigenic markers in invasive ductal breast carcinoma:
potential clinical implications. Appl Immunhistochem Mol Morphol.
2011;19(2):106-111.
128. Liang Y, Besch-Williford C, Benakanakere I, Thorpe PE, Hyder SM. Targeting
mutant p53 protein and the tumor vasculature: an effective combination therapy
for advanced breast tumors. Breast Cancer Res Treat. 2011;125(2):407-420.

171
129. Liedtke C, Mazouni C, Hess KR, André F, Tordai A, Mejia JA, Symmans WF,
Gonzalez-Angulo AM, Hennessy B, Green M, Cristofanilli M, Hortobagyi GN,
Pusztai L. Response to neoadjuvant therapy and long-term survival in patients
with triple-negative breast cancer. J Clin Oncol. 2008;26:1275-1281.
130. Liu X, Wilcken R, Joerger AC, Chuckowree IS, Amin J, Spencer J, Fersht AR.
Small molecule induced reactivation of mutant p53 in cancer cells. Nucleic Acids
Res, 2013; [Epub ahead of print].
131. Liu Y, Ji R, Li J, Gu Q, Zhao X, Sun T, Wang J, Li J, Du Q, Sun B. Correlation
effect of EGFR and CXCR4 and CCR7 chemokine receptors in predicting breast
cancer metastasis and prognosis. J Exp Clin Cancer Res. 2010;29:16. doi:
10.1186/1756-9966-29-16.
132. Lundgren K, Brown M, Pineda S, Cuzick J, Salter J, Zabaglo L, Howell A,
Dowsett M, Landberg G, TransATAC investigators. Effects of cyclin D1 gene
amplification and protein expression on time to recurrence in postmenopausal
breast cancer patients treated with anastrozole or tamoxifen: a TransATAC study.
Breast Cancer Res. 2012;14(2):R57.
133. Ma H, Lu Y, Malone KE, Marchbanks PA, Deapen DM, Spirtas R, Burkman RT,
Strom BL, McDonald JA, Folger SG, Simon MS, Sullivan-Halley J, Press MF,
Bernstein L. Mortality risk of black women and white women with invasive breast
cancer by hormone receptors, HER2, and p53 status. BMC Cancer.
2013;13(1):225.
134. Malhotra GK, Zhao X, Band H, Band V. Histological, molecular and functional
subtypes of breast cancers. Cancer Biol Ther. 2010;10(10):955-960.
135. Marchetti A, Buttitta F, Pellegrini S, Campani D, Diella F, Cecchetti D, Callahan
R, Bistocchi M. p53 mutations and histological type of invasive breast carcinoma.
Cancer Res. 1993;53(19):4665-4669.
136. Martinez-Arribas F, Alvarez T, Del Val G, Martín-Garabato E, Núñez-Villar MJ,
Lucas R, Sánchez J, Tejerina A, Schneider J. Bcl-2 expression in breast cancer: a
comparative study at the mRNA and protein level. Anticancer Res. 2007;27:219-
222.
137. Masciari S, Dillon DA, Rath M, Robson M, Weitzel JN, Balmana J, Gruber SB,
Ford JM, Euhus D, Lebensohn A, Telli M, Pochebit SM, Lypas G, Garber JE.
Breast cancer phenotype in women with TP53 germline mutations: a Li-Fraumeni
syndrome consortium effort. Breast Cancer Res Treat. 2012;133(3):1125-1130.

172
138. Mass RD, Press MF, Anderson S, Cobleigh MA, Vogel CL, Dybdal N, Leiberman
G, Slamon DJ. Evaluation of clinical outcomes according to HER2 detection by
fluorescence in situ hybridization in women with metastatic breast cancer treated
with trastuzumab. Clin Breast Cancer. 2005;6(3):240-246.
139. Megha T, Ferrari F, Benvenuto A, Bellan C, Lalinga AV, Lazzi S, Bartolommei
S, Cevenini G, Leoncini L, Tosi P. p53 mutation in breast cancer. Correlation with
cell kinetics and cell of origin. J Clin Pathol. 2002;55(6):461-466.
140. Miglietta A, Toselli M, Ravarino N, Vencia W, Chiecchio A, Bozzo F, Motta M,
Torchio B, Bocca C. COX-2 expression in human breast carcinomas: correlation
with clinicopathological features and prognostic molecular markers. Expert Opin
Ther Targets. 2010;14(7):655-664.
141. Millar EK, Graham PH, McNeil CM, Browne L, O’Toole SA, Boulghourjian A,
Kearsley JH, Papadatos G, Delaney G, Fox C, Nasser E, Capp A, Sutherland RL.
Prediction of outcome of early ER+ breast cancer is improved using a biomarker
panel, which includes Ki-67 and p53. Br J Cancer. 2011;105(2):272-280.
142. Millikan RC, Newman B, Tse CK, Moorman PG, Conway K, Dressler LG, Smith
LV, Labbok MH, Geradts J, Bensen JT, Jackson S, Nyante S, Livasy C, Carey L,
Earp HS, Perou CM. Epidemiology of basal-like breast cancer. Breast Cancer Res
Treat. 2008;109(1):123-139.
143. Nakagawa M, Bando Y, Nagao T, Morimoto M, Takai C, Ohnishi T, Honda J,
Moriya T, Izumi K, Takahashi M, Sasa M, Tangoku A. Expression of p53, Ki-67,
E-cadherin, N-cadherin and TOP2A in triple-negative breast cancer. Anticancer
Res. 2011;31(6):2389-2393.
144. Nassar A, Radhakrishnan A, Cabrero IA, Cotsonis G, Cohen C. COX-2
expression in invasive breast cancer: correlation with prognostic parameters and
outcome. Appl Immunohistochem Mol Morphol. 2007;15(3):255-259.
145. Nguyen PL, Taghian AG, Katz MS, Niemierko A, Abi Raad RF, Boon WL,
Bellon JR, Wong JS, Smith BL, Harris JR. Breast cancer subtype approximated
by estrogen receptor, progesterone receptor, and HER-2 is associated with local
and distant recurrence after breast-conserving therapy. J Clin Oncol.
2008;26:2373-2378.
146. Nichols KE, Malkin D, Garber JE, Fraumeni JF Jr, Li FP. Germ-line p53
mutations predispose to a wide spectrum of early-onset cancers. Cancer
Epidemiol Biomarkers Prev. 2001;10(2):83-87.

173
147. Nielsen TO, Hsu FD, Jensen K, Cheang M, Karaca G, Hu Z, Hernandez-Boussard
T, Livasy C, Cowan D, Dressler L, Akslen LA, Ragaz J, Gown AM, Gilks CB,
van de Rijn M, Perou CM. Immunohistochemical and clinical characterization of
the basal-like subtype of invasive breast carcinoma. Clin Cancer Res.
2004;10:5367-5374.
148. Nielsen TO, Parker JS, Leung S. Voduc D, Ebbert M, Vickery T, Davies SR,
Snider J, Stijleman IJ, Reed J, Cheang MC, Mardis ER, Perou CM, Bernard PS,
Ellis MJ. A comparison of PAM50 intrinsic subtyping with
immunohistochemistry and clinical prognostic factors in tamoxifen-treated
estrogen receptor-positive breast cancer. Clin Cancer Res. 2010;16:5222-5232.
149. Onel K, Cordon-Cardo C. MDM2 and prognosis. Mol Cancer Res, 2004; 2(1):1-8.
150. Onitilo AA, Engel JM, Greenlee RT, Mukesh BN. Breast cancer subtypes based
on ER/PR and Her2 expression: comparison of clinicopathologic features and
survival. Clin Med Res. 2009;7(1-2):4-13.
151. Park BW, Park S, Park HS, Koo JS, Yang WI, Lee JS, Hwang H, Kim SI, Lee KS.
Cyclooxygenase-2 expression in proliferative Ki-67-positive breast cancers is
associated with poor outcomes. Breast Cancer Res Treat. 2012;133(2):741-751.
152. Park S, Koo J, Park HS, Kim JH, Choi SY, Lee JH, Park BW, Lee KS. Expression
of androgen receptors in primary breast cancer. Ann Oncol. 2010;21(3):488-492.
153. Parker JS, Mullins M, Cheang MC, Leung S, Voduc D, Vickery T, Davies S,
Fauron C, He X, Hu Z, Quackenbush JF, Stijleman IJ, Palazzo J, Marron JS,
Nobel AB, Mardis E, Nielsen TO, Ellis MJ, Perou CM, Bernard PS. Supervised
risk predictor of breast cancer based on intrinsic subtypes. J Clin Oncol.
2009;27:1160-1167.
154. Pegram MD, Konecny G, Slamon DJ. The molecular and cellular biology of
HER2/neu gene amplification/overexpression and the clinical development of
herceptin (trastuzumab) therapy for breast cancer. Cancer Treat Res. 2000;103:57-
75.
155. Penault-Llorca F, Abrial C, Raoelfils I, Chollet P, Cayre A, Mauret-Reynier MA,
Thivat E, Mishellany F, Gimbergues P, Durando X. Changes and predictive and
prognostic value of the mitotic index, Ki-67, cyclin D1, and cyclo-oxygenase-2 in
710 operable breast cancer patients treated with neoadjuvant chemotherapy.
Oncologist. 2008;13(12):1235-1245.

174
156. Penault-Llorca F, Viale G. Pathological and molecular diagnosis of triple-negative
breast cancer: a clinical perspective. Ann Oncol. 2012;23(Suppl 6):vi19-vi22.
157. Perou CM, Sørlie T, Eisen MB, van de Rijn M, Jeffrey SS, Rees CA, Pollack JR,
Ross DT, Johnsen H, Akslen LA, Fluge O, Pergamenschikov A, Williams C, Zhu
SX, Lønning PE, Børresen-Dale AL, Brown PO, Botstein D. Molecular portraits
of human breast tumours. Nature. 2000;406:747-752.
158. Perrone G, Zagami M, Altomare V, Battista C, Morini S, Rabitti C. COX-2
localization within plasma membrane caveolae-like structures in human lobular
intraepithelial neoplasia of the breast. Virchows Arch. 2007;451:1039-1045.
159. Phipps AI, Buist DS, Malone KE, Barlow WE, Porter PL, Kerlikowske K, Li CI.
Reproductive history and risk of three breast cancer subtypes defined by three
biomarkers. Cancer Causes Control. 2011; 22:399-405.
160. Phipps AI, Chlebowski RT, Prentice R, McTiernan A, Stefanick ML, Wactawski-
Wende J, Kuller LH, Adams-Campbell LL, Lane D, Vitolins M, Kabat GC,
Rohan TE, Li CI. Body size, physical activity, and risk of triple-negative and
estrogen receptor-positive breast cancer. Cancer Epidemiol Biomarkers Prev.
2011;20:454-463.
161. Phipps AI, Malone KE, Porter PL, Daling JR, Li CI. Reproductive and hormonal
risk factors for postmenopausal luminal, HER-2-overexpressing, and triple-
negative breast cancer. Cancer. 2008;113(7):1521-1526.
162. Pillai SKK, Tay A, Nair S, Leong CO. Triple-negative breast cancer is associated
with EGFR, CK5/6 and c-KIT expression in Malaysian women. BMC Clin Pathol.
2012;12:18. doi: 10.1186/1472-6890-12-18.
163. Piras F, Ionta MT, Lai S, Perra MT, Atzori F, Minerba L, Pusceddu V, Maxia C,
Murtas D, Demurtas P, Massidda B, Sirigu P. Nestin expression associates with
poor prognosis and triple negative phenotype in locally advanced (T4) breast
cancer. Eur J Histochem. 2011;55(4):e39. doi: 10.4081/ejh.2011.e39.
164. Place AE, Huh SJ, Polyak K. The microenvironment in breast cancer progression:
biology and implications for treatment. Breast Cancer Res. 2011;13:227.
165. Popovska SL, Ooi A, Ivanov IN, Ivanova NG, Dineva TB. Triple-negative breast
cancer does not fully overlap with basal-like molecular profile – a morphological
and immunohistochemical study. J Biomed Clin Res. 2010;3(1):45-50.

175
166. Pusztai L, Mazouni C, Anderson K, Wu Y, Symmans WF. Molecular
classification of breast cancer: limitations and potential. Oncologist. 2006;11:868-
877.
167. Querzoli P, Coradini D, Pedriali M, Boracchi P, Ambrogi F, Raimondi E, La
Sorda R, Lattanzio R, Rinaldi R, Lunardi M, Frasson C, Modesti F, Ferretti S,
Piantelli M, Iacobelli S, Biganzoli E, Nenci I, Alberti S. An
immunohistochemically positive E-cadherin status is not always predictive for a
good prognosis in human breast cancer. Br J Cancer. 2010;103(12):1835-1839.
168. Raica M, Jung I, Cimpean AM, Suciu C, Muresan AC. From conventional
pathologic diagnosis to the molecular classification of breast carcinoma: are we
ready for the change? Rom J Morphol Embryol. 2009;50(1):5-13.
169. Rakha EA, El-Sayed ME, Green AR, Paish EC, Lee AHS, Ellis IO. Breast
carcinoma with basal differentiation: a proposal for pathology definition based on
basal cytokeratin expression. Histopathology. 2007;50(4):434-438.
170. Rakha EA, Reis-Filho JS, Baehner F, Dabbs DJ, Decker T, Eusebi V, Fox SB,
Ichihara S, Jacquemier J, Lakhani SR, Palacios J, Richardson AL, Schnitt SJ,
Schmitt FC, Tan PH, Tse GM, Badve S, Ellis IO. Breast cancer prognostic
classification in the molecular era: the role of histological grade. Breast Cancer
Research. 2010;12:207.
171. Rakha EA, Teoh TK, Lee AH, Nolan CC, Ellis IO, Green AR. Further evidence
that E-cadherin is not a tumour suppressor gene in invasive ductal carcinoma of
the breast: an immunohistochemical study. Histopathology. 2013;62(5):695-701.
172. Rattan B, Manjari M, Kahlon SK, Kalra N, Bhalla A, Paul S. The
immunohistochemical expression of the oestrogen receptor (ER), HER-2/NEU
and cytokeratin 8/18 and 5/6 in invasive breast carcinoma. J Clin Diagn Res.
2012;6(9):1495-1498.
173. Reed JC. Bcl-2 family proteins: regulators of apoptosis and chemoresistance in
hematologic malignancies. Sem. Hematol. 1997;4(Suppl.5):9-19.
174. Reis-Filho JS, Milanezi F, Steele D, Savage K, Simpson PT, Nesland JM, Pereira
EM, Lakhani SR, Schmitt FC. Metaplastic breast carcinomas are basal-like
tumours. Histopathology. 2006;49(1):10-21.
175. Reis-Filho JS, Savage K, Lambros MB, James M, Steele D, Jones RL, Dowsett
M. Cyclin D1 protein overexpression and CCND1 amplification in breast

176
carcinomas: an immunohistochemical and chromogenic in situ hybridisation
analysis. Mod Pathol. 2006;19(7):999-1009.
176. Richardsen E, Uglehus RD, Johnsen SH, Busund LT. Immunohistochemical
expression of epithelial and stromal immunomodulatory signalling molecules is a
prognostic indicator in breast cancer. BMC Res Notes. 2012;5:110.
177. Riley T, Sontag E, Chen P, Levine A. Transcriptional control of human p53-
regulated genes. Nature Rev Mol Cell Biol. 2008; 9(5):402-412.
178. Ristimäki A, Sivula A, Lundin J, Lundin M, Salminen T, Haglund C, Joensuu H,
Isola J. Prognostic significance of elevated cyclooxygenase-2 expression in breast
cancer. Cancer Res. 2002;62:632-635.
179. Rolland P, Spendlove I, Madjd Z, Rakha EA, Patel P, Ellis IO, Durrant L. The
p53 positive Bcl-2 negative phenotype is an independent marker of prognosis in
breast cancer. Int J Cancer. 2007;120(6):1311-1317.
180. Romond EH, Perez EA, Bryant J, Suman VJ, Geyer CE Jr, Davidson NE, Tan
Chiu E, Martino S, Paik S, Kaufman PA, Swain SM, Pisansky TM, Fehrenbacher
L, Kutteh LA, Vogel VG, Visscher DW, Yothers G, Jenkins RB, Brown AM,
Dakhil SR, Mamounas EP, Lingle WL, Klein PM, Ingle JN, Wolmark N.
Trastuzumab plus adjuvant chemotherapy for operable HER2-positive breast
cancer. N Engl J Med. 2005;353(16):1673-1684.
181. Rossner P Jr, Gammon MD, Zhang YJ, Terry MB, Hibshoosh H, Memeo L,
Mansukhani M, Long CM, Garbowski G, Agrawal M, Kalra TS, Gaudet MM,
Teitelbaum SL, Neugut AI, Santella RM. Mutations in p53, p53 protein
overexpression and breast cancer survival. J Cell Mol Med. 2009;13(9B):3847-
3857.
182. Rouzier R, Perou CM, Symmans WF, Ibrahim N, Cristofanilli M, Anderson K,
Hess KR, Stec J, Ayers M, Wagner P, Morandi P, Fan C, Rabiul I, Ross JS,
Hortobagyi GN, Pusztai L. Breast cancer molecular subtypes respond differently
to preoperative chemotherapy. Clin Cancer Res. 2005;11(16):5678-5685.
183. Roy PG, Pratt N, Purdie CA, Baker L, Ashfield A, Quinlan P, Thompson AM.
High CCND1 amplification identifies a group of poor prognosis women with
estrogen receptor positive breast cancer. Int J Cancer. 2010;127(2):355-360.
184. Rozenowicz RdeL, Santos RE, Silva MA, Rodrigues FF, Oliveira AL, Ulson LB,
Oliveira VM, Aoki T. Cox-2 and its association with prognostic factors and

177
response to primary chemotherapy in patients with breast cancer. Rev Col Bras
Cir. 2010;37(5):323-327.
185. Rudas M, Lehnert M, Huynh A, Jakesz R, Singer C, Lax S, Schippinger W,
Dietze O, Greil R, Stiglbauer W, Kwasny W, Grill R, Stierer M, Gnant MF,
Filipits M; Austrian Breast and Colorectal Cancer Study Group. Cyclin D1
expression in breast cancer patients receiving adjuvant tamoxifen-based therapy.
Clin Cancer Res. 2008;14(6):1767-1774.
186. Ryan JJ, Prochownik E, Gottlieb CA, Apel IJ, Merino R, Nuñez G, Clarke MF. c-
myc and bcl-2 modulate p53 function by altering p53 subcellular trafficking
during the cell cycle. Proc Natl Acad Sci USA. 1994;91(13):5878-5882.
187. Ryu DW, Lee CH. Outcome of triple-negative breast cancer in patients with or
without markers regulating cell cycle and cell death. J Korean Surg Soc.
2012;83(4):187-195.
188. Shapochka DO, Zaletok SP, Gnidyuk MI. Relationship between NF-κB, ER, PR,
Her2/neu, Ki67, p53 expression in human breast cancer. Exp Oncol,
2012;34(4):358-363.
189. Shmueli A, Oren M. Regulation of p53 by Mdm2: fate is in the numbers. Mol
Cell. 2004;13(1):4-5.
190. Singh B, Cook KR, Vincent L, Hall CS, Martin C, Lucci A. Role of COX-2 in
tumorospheres derived from a breast cancer cell line. Surg Res. 2011;168(1):e39-
e49.
191. Sjögren S, Inganäs M, Norberg T, Lindgren A, Nordgren H, Holmberg L, Bergh J.
The p53 gene in breast cancer: prognostic value of complementary DNA
sequencing versus immunohistochemistry. J Natl Cancer Inst. 1996;88(3-4):173-
182.
192. Sjöström-Mattson J, Von Boguslawski K, Bengtsson NO, Mjaaland I, Salmenkivi
K, Blomqvist C. The expression of p53, bcl-2, bax, fas and fasL in the primary
tumour and lymph node metastases of breast cancer. Acta Oncol.
2009;48(8):1137-1143.
193. Slamon DJ, Clark GM, Wong SG, Levin WJ, Ullrich A, McGuire WL. Human
breast cancer: correlation of relapse and survival with amplification of the HER-
2/neu oncogene. Science. 1987;235(4785):177-182.
194. Smith I, Procter M, Gelber RD, Guillaume S, Feyereislova A, Dowsett M,
Goldhirsch A, Untch M, Mariani G, Baselga J, Kaufmann M, Cameron D, Bell R,

178
Bergh J, Coleman R, Wardley A, Harbeck N, Lopez RI, Mallmann P, Gelmon K,
Wilcken N, Wist E, Sánchez Rovira P, Piccart-Gebhart MJ; HERA study team. 2
year follow-up of trastuzumab after adjuvant chemotherapy in HER2 positive
breast cancer: a randomized controlled trial. Lancet. 2007;369(9555):29-36.
195. Somlo G, Chu P, Frankel P, Ye W, Groshen S, Doroshow JH, Danenberg K,
Danenberg P. Molecular profiling including epidermal growth factor receptor and
p21 expression in high-risk breast cancer patients as indicators of outcome. Ann
Oncol. 2008;19(11):1853-1859.
196. Soontrapornchai P, Chanvitan A, Koontongkaew S, Sunpaweravong S. The
prognostic value of p53 immunostaining in node-negative breast carcinoma. J
Med Assoc Thai. 2007;90(9):1833-1838.
197. Sørlie T, Perou CM, Tibshirani R, Aas T, Geisler S, Johnsen H, Hastie T, Eisen
MB, van de Rijn M, Jeffrey SS, Thorsen T, Quist H, Matese JC, Brown PO,
Botstein D, Lønning PE, Børresen-Dale AL. Gene expression patterns of breast
carcinomas distinguish tumor subclasses with clinical implications. Proc Natl
Acad Sci USA. 2001;98(19):10869-10874.
198. Sørlie T. Molecular portraits of breast cancer: tumour subtypes as distinct disease
entities. Eur J Cancer. 2004;40:2667-2675.
199. Sotiriou C, Neo SY, McShane LM, Korn EL, Long PM, Jazaeri A, Martiat P, Fox
SB, Harris AL, Liu ET. Breast cancer classification and prognosis based on gene
expression profiles from a population-based study. Proc Natl Acad Sci USA.
2003;100(18):10393-10398.
200. Sotiriou C, Powles TJ, Dowsett M, Jazaeri AA, Feldman AL, Assersohn L,
Gadisetti C, Libutti SK, Liu ET. Gene expression profiles derived from fine
needle aspiration correlate with response to systemic chemotherapy in breast
cancer. Breast Cancer Res. 2002;4(3):R3.
201. Spitale A, Mazzola P, Soldini D, Mazzucchelli L, Bordoni A. Breast cancer
classification according to immunohistochemical markers: clinicopathologic
features and short-term survival analysis in a population-based study from the
South of Switzerland. Ann Oncol. 2009;20(4):628-635.
202. Starks AM, Martin DN, Dorsey TH, Boersma BJ, Wallace TA, Ambs S.
Household income is associated with the p53 mutation frequency in human breast
tumors. PLoS One. 2013;8(3):e57361. doi: 10.1371/journal.pone.0057361.

179
203. Statistical yearbook of health care in Latvia 2011.
http://www.spkc.gov.lv/veselibas-aprupes-statistika/. 2011.
204. Stendahl M, Kronblad A, Rydén L, Emdin S, Bengtsson NO, Landberg G. Cyclin
D1 overexpression is a negative predictive factor for tamoxifen response in
postmenopausal breast cancer patients. Br J Cancer. 2004;90(10):1942-1948.
205. Strehl JD, Wachter DL, Fasching PA, Beckmann MW, Hartmann A. Invasive
breast cancer: recognition of molecular subtypes. Breast Care. 2011;6:258-264.
206. Strumfa I. Cycclooxygenase-2 protein expression in gastrooesophageal tumours –
study of a complex interplay of biological and technological factors. Riga, RSU,
2005.
207. Talley L, Chhieng DC, Bell WC, Grizzle WE, Frost AR. Immunohistochemical
detection of EGFR, p185(erbB-2), Bcl-2 and p53 in breast carcinomas in pre-
menopausal and post-menopausal women. Biotech Histochem. 2008;83(1):5-14.
208. Tan DS, Marchió C, Jones RL, Savage K, Smith IE, Dowsett M, Reis-Filho JS.
Triple negative breast cancer: molecular profiling and prognostic impact in
adjuvant anthracycline-treated patients. Breast Cancer Res Treat. 2008;111(1):27-
44.
209. Tan J, Buache E, Chenard MP, Dali-Youcef, Rio MC. Adipocyte is a non-trivial,
dynamic partner of breast cancer cells. Int J Dev Biol. 2011;55:851-859.
210. Tang P, Wang J, Bourne P. Molecular classifications of breast carcinoma with
similar terminology and different definitions: are they the same? Hum Pathol.
2008;39(4):506-513.
211. Tavassoli FA, Devilee P: World Health Organization: Tumours of the breast and
female genital organs (IARC WHO Classification of Tumours): IARC Press,
Lyon, France; 2003.
212. Thike AA, Cheok PY, Jara-Lazaro AR, Tan B, Tan P, Tan PH. Triple-negative
breast cancer: clinicopathological characteristics and relationship with basal-like
breast cancer. Mod Pathol. 2010;23:123-133.
213. Thorat MA, Mehrotra S, Morimiya A, Badve S. COX-2 expression does not
correlate with microvessel density in breast cancer. Pathobiology. 2009;76(1):39-
44.
214. Tischkowitz M, Brunet JS, Bégin LR, Huntsman DG, Cheang MC, Akslen LA,
Nielsen TO, Foulkes WD. Use of immunohistochemical markers can refine
prognosis in triple negative breast cancer. BMC Cancer. 2007;7:134.

180
215. Trere D, Montanaro L, Ceccarelli C, Barbieri S, Cavrini G, Santini D, Taffurelli
M, Derenzini M. Prognostic relevance of a novel semiquantitative classification of
Bcl2 immunohistochemical expression in human infiltrating ductal carcinomas of
the breast. Ann Oncol. 2007;18(6):1004-1014.
216. Troester MA, Lee MH, Carter M, Fan C, Cowan DW, Perez ER, Pirone JR, Perou
CM, Jerry DJ, Schneider SS. Activation of host wound responses in breast cancer
microenvironment. Clin Cancer Res. 2009;15(22):7020-7028.
217. Tsutsui S, Yasuda K, Suzuki K, Takeuchi H, Nishizaki T, Higashi H, Era S. Bcl-2
protein expression is associated with p27 and p53 protein expressions and MIB-1
counts in breast cancer. BMC Cancer. 2006;6:187.
218. Umekita Y, Ohi Y, Sagara Y, Yoshida H. Overexpression of cyclin D1 predicts
for poor prognosis in estrogen receptor-negative breast cancer patients. Int J
Cancer. 2002;98(3):415-418.
219. Valsecchi ME, Pomerantz SC, Jaslow R, Tester W. Reduced risk of bone
metastasis for patients with breast cancer who use COX-2 inhibitors. Clin Breast
Cancer. 2009;9(4):225-230.
220. van Nes JG, de Kruijf EM, Faratian D, van de Velde CJ, Putter H, Falconer C,
Smit VT, Kay C, van de Vijver MJ, Kuppen PJ, Bartlett JM. COX2 expression in
prognosis and in prediction to endocrine therapy in early breast cancer patients.
Breast Cancer Res Treat. 2011;125(3):671-685.
221. Velasco-Velázquez MA, Li Z, Casimiro M, Loro E, Homsi N, Pestell RG.
Examining the role of cyclin D1 in breast cancer. Future Oncol. 2011;7(6):753-
765.
222. Viale G, Giobbie-Hurder A, Regan MM, Coates AS, Mastropasqua MG, Dell'Orto
P, Maiorano E, MacGrogan G, Braye SG, Ohlschlegel C, Neven P, Orosz Z,
Olszewski WP, Knox F, Thürlimann B, Price KN, Castiglione-Gertsch M, Gelber
RD, Gusterson BA, Goldhirsch A; Breast International Group Trial 1-98.
Prognostic and predictive value of centrally reviewed Ki-67 labeling index in
postmenopausal women with endocrine-responsive breast cancer: results from
Breast International Group Trial 1-98 comparing adjuvant tamoxifen with
letrozole. J Clin Oncol. 2008;26(34):5569-5575.
223. Vincent-Salomon A, Gruel N, Lucchesi C, MacGrogan G, Dendale R, Sigal-
Zafrani B, Longy M, Raynal V, Pierron G, de Mascarel I, Taris C, Stoppa-
Lyonnet D, Pierga JY, Salmon R, Sastre-Garau X, Fourquet A, Delattre O, de

181
Cremoux P, Aurias A. Identification of typical medullary breast carcinoma as a
genomic sub-group of basal-like carcinomas, a heterogeneous new molecular
entity. Breast Cancer Res. 2007;9(2):R24.
224. Vinogradova Y, Coupland C, Hippisley-COX J. Exposure to cyclooxygenase-2
inhibitors and risk of cancer: nested case-control studies. Br J Cancer. 2011;
105(3):452-459.
225. Voduc KD, Cheang MC, Tyldesley S, Gelmon K, Nielsen TO, Kennecke H.
Breast cancer subtypes and the risk of local and regional relapse breast cancer
subtypes and the risk of local and regional relapse. J Clin Oncol. 2010;28:1684-
1691.
226. von Minckwitz G, Sinn HP, Raab G, Loibl S, Blohmer JU, Eidtmann H, Hilfrich
J, Merkle E, Jackisch C, Costa SD, Caputo A, Kaufmann M; German Breast
Group. Clinical response after two cycles compared to HER2, Ki-67, p53, and
bcl-2 in independently predicting a pathological complete response after
preoperative chemotherapy in patients with operable carcinoma of the breast.
Breast Cancer Res. 2008;10(2):R30.
227. Walker RA, Hanby A, Pinder SE, Thomas J, Ellis IO; National Coordinating
Committee for Breast Pathology Research Subgroup. Current issues in diagnostic
breast pathology. J Clin Pathol. 2012;65(9):771-785.
228. Wander SA, Zhao D, Slingerland JM. P27: a barometer of signaling deregulation
and potential predictor of response to targeted therapies. Clin Cancer Res.
2011;17(1):12-18.
229. Wang TT, Phang JM. Effects of estrogen on apoptotic pathways in human breast
cancer cell line MCF-7. Cancer Res. 1995;55(12):2487-2489.
230. Wei CL, Wu Q, Vega VB, Chiu KP, Ng P, Zhang T, Shahab A, Yong HC, Fu Y,
Weng Z, Liu J, Zhao XD, Chew JL, Lee YL, Kuznetsov VA, Sung WK, Miller
LD, Lim B, Liu ET, Yu Q, Ng HH, Ruan Y. A global map of p53 transcription-
factor binding sites in the human genome. Cell. 2006;124(1):207-219.
231. Weigel MT, Dowsett M. Current and emerging biomarkers in breast cancer:
prognosis and prediction. Endocr Relat Cancer. 2010;17:R245-R262.
232. Wiechmann L, Sampson M, Stempel M, Jacks LM, Patil SM, King T, Morrow M.
Presenting features of breast cancer differ by molecular subtype. Ann Surg Oncol.
2009;16(10):2705-2710.

182
233. Winter J. Morphological and immunophenotypic analysis of basal-like carcinoma
of the breast. Bioscience Horizons. 2008;1(1):19-27.
234. Wolff AC, Hammond ME, Schwartz JN, Hagerty KL, Allred DC, Cote RJ,
Dowsett M, Fitzgibbons PL, Hanna WM, Langer A, McShane LM, Paik S,
Pegram MD, Perez EA, Press MF, Rhodes A, Sturgeon C, Taube SE, Tubbs R,
Vance GH, van de Vijver M, Wheeler TM, Hayes DF; American Society of
Clinical Oncology; College of American Pathologists. American Society of
Clinical Oncology/College of American Pathologists guideline recommendations
for human epidermal growth factor receptor 2 testing in breast cancer. J Clin
Oncol. 2007;25(1):118-145.
235. Won KY, Kim GY, Kim YW, Song JY, Lim SJ. Clinicopathologic correlation of
beclin-1 and bcl-2 expression in human breast cancer. Hum Pathol.
2010;41(1):107-112.
236. Xu R, Feiner H, Li P, Yee H, Inghirami G, Delgado Y, Perle MA. Differential
amplification and overexpression of HER-2/neu, p53, MIB1, and estrogen
receptor/progesterone receptor among medullary carcinoma, atypical medullary
carcinoma, and high-grade invasive ductal carcinoma of breast. Arch Pathol Lab
Med. 2003;127(11):1458-1464.
237. Yamashita H, Nishio M, Toyama T, Sugiura H, Zhang Z, Kobayashi S, Iwase H.
Coexistence of HER2 over-expression and p53 protein accumulation is a strong
prognostic molecular marker in breast cancer. Breast Cancer Res. 2004;6(1):R24-
30.
238. Yamashita H, Toyama T, Nishio M, Ando Y, Hamaguchi M, Zhang Z, Kobayashi
S, Fujii Y, Iwase H. p53 protein accumulation predicts resistance to endocrine
therapy and decreased post-relapse survival in metastatic breast cancer. Breast
Cancer Res. 2006;8(4):R48.
239. Yamashita M, Ogawa T, Zhang X, Hanamura N, Kashikura Y, Takamura M,
Yoneda M, Shiraishi T. Role of stromal myofibroblasts in invasive breast cancer:
stromal expression of alpha-smooth muscle actin correlates with worse clinical
outcome. Breast Cancer. 2012;19(2):170-176.
240. Yang SX, Steinberg SM, Nguyen D, Swain SM. p53, HER2 and tumour cell
apoptosis correlate with clinical outcome after neoadjuvant bevacizumab plus
chemotherapy in breast cancer. Int J Oncol. 2011;38(5):1445-1452.

183
241. Yang XR, Pfeiffer RM, Garcia-Closas M, Rimm DL, Lissowska J, Brinton LA,
Peplonska B, Hewitt SM, Cartun RW, MAndich D, Sasano H, Evans DB, Sutter
TR, Sherman ME. Hormonal markers in breast cancer: coexpression, relationship
with pathologic characteristics, and risk factor associations in a population-based
study. Cancer Res. 2007;67(21):10608-10617.
242. Yang XR, Sherman ME, Rimm DL, Lissowska J, Brinton LA, Peplonska B,
Hewitt SM, Anderson WF, Szeszenia-Dabrowska N, Bardin-Mikolajczak A,
Zatonski W, Cartun R, Mandich D, Rymkiewicz G, Ligaj M, Lukaszek S, Kordek
R, García-Closas M. Differences in risk factors for breast cancer molecular
subtypes in a population-based study. Cancer Epidemiol Biomarkers Prev.
2007;16(3):439-443.
243. Yu X, Zhang X, Dhakal IB, Beggs M, Kadlubar S, Luo D. Induction of cell
proliferation and survival genes by estradiol-repressed microRNAs in breast
cancer cells. BMC Cancer. 2012;12:29. doi: 10.1186/1471-2407-12-29.
244. Zaha DC, Lazăr E. Molecular characterization of apoptosis by the
immunohistochemical evaluation of Bcl-2 in breast cancer. Rom J Morphol
Embryol. 2012;53(1):155-160.
245. Zaha DC, Lazăr E, Lăzureanu C. Clinicopathologic features and five years
survival analysis in molecular subtypes of breast cancer. Rom J Morphol
Embryol. 2010;51(1):85-89.
246. Zerkowski MP, Camp RL, Burtness BA, Rimm DL, Chung GG. Quantitative
analysis of breast cancer tissue microarrays shows high cox-2 expression is
associated with poor outcome. Cancer Invest. 2007;25(1):19-26.
247. Zhou CJ, Zhang QH, Zhang TG, Sun SZ, Li H, Wang Y, Liu ZY. Expression of
ER, Ki-67 and cyclin D1 in the pre-cancerous breast of Chinese patients. Pathol
Oncol Res. 2009;15(2):153-158.