Embed Size (px)
Citation preview

MOLECULAR SYATEMATICS OF BONNETED BATS (MOLOSSIDAE:
EUMOPS) BASED ON MITOCHONDRIAL AND NUCLEAR DNA
SEQUENCES
A Thesis
Presented to the
Faculty of the Graduate School of
Angelo State University
In Partial Fulfillment of the
Requirements for the Degree
MASTER OF SCIENCE
by:
SARAH NICHOLE BARTLETT
May 2012
Major: Biology

iii
ACKNOWLEDGMENTS
I would first like to express my deepest gratitude to my major advisor Dr. Loren
Ammerman for donating countless hours to this project and to my success as an
undergraduate and graduate student at Angelo State University. She introduced me to the
joys of late night field work and the experience I have gained under her advisement is sure to
prove invaluable.
I would also like to thank my family and friends who offered the encouragement and
support I needed to complete this project. The other students working in Dr. Ammerman’s
lab also deserve acknowledgment. I always knew someone would be around to bounce ideas
off of or to ask those simple questions you just cannot remember the answer to. For editing
manuscripts and sage writing advice, due thanks are given to Dr. Ammerman, Dr. Michael
Dixon, Dr. Terry Maxwell, and Dr. Ned Strenth.
All of the samples that I used in my project were collected by other people whom I
would like to thank for their diligence in collecting tissue samples, without which this project
would have been impossible. I have had the pleasure to be a part of multiple field work
excursions both with Dr. Ammerman and my fellow students both in Texas and in Arizona
and can relate to the hard work and dedication it takes to man the nets all night and collect
tissues in the dark before turning in for the night. The people behind the specimens are as
important as the work done after the tissues are collected and stored in museums. Special
thanks to J. Apodaca and R. Rodriguez for use of their sequences in this project
Additionally, I would like to extend my gratitude to the following individuals and
institutions for their contributions of tissue loans and specimen data: F. Anwarali, R. Baker,

iv
and H. Garner (Natural Science Research Laboratory, Texas Tech University); R. Dowler
(Angelo State Natural History Collections, Angelo State University); J. Eger (Royal Ontario
Museum); R. Timm (University of Kansas Natural History Museum, University of Kansas);
B. Marks and J. Light (Texas Cooperative Wildlife Collection, Texas A&M University).
This project was funded by a Head of the River Ranch Research Grant, Angelo State
University Student Research Fellowship, and a Southwestern Association of Naturalists
McCarley Student Research Award.

v
ABSTRACT
Previous understanding of the relationships among the species of bats in the genus
Eumops has been based on phenetic and cladistic analyses of morphological data. The
objective of this study was to construct a phylogeny of the bats within the genus Eumops
using DNA sequence data from 2 mitochondrial genes (cytochrome b and nicotinamide
adenine dinucleotide dehydrogenase subunit 1) and 1 nuclear locus (β-fibrinogen intron 7)
for members of Eumops and outgroups from the family Molossidae. Data for each locus were
analyzed separately using maximum-likelihood and Bayesian methods then were combined
for complete data analyses using Bayesian Inference and Bayesian concordance analysis on a
total of 2715 base pairs. Our results conflicted with some of the relationships proposed in
previous morphological studies. Minor disagreements existed between the individual
mitochondrial and nuclear data sets. However, the monophyly of the genus was significantly
supported in all of the analyses.

vi
TABLE OF CONTENTS
Page
ACKNOWLEDGMENTS……………………………………………………………....……iii
ABSTRACT……………….………………………………………………………............…..v
TABLE OF CONTENTS……………………………………………………................……..vi
LIST OF TABLES……………………………………………………....................……….viii
LIST OF FIGURES………………………........................................................................…..ix
INTRODUCTION……………………………………………………………................…….1
MATERIALS AND METHODS……………………………………………………………...3
Taxonomic sampling for molecular analysis……………………………………....….3
Gene selection…………………….…………………………………………………...4
DNA Sequencing…………………………………………...........................................4
Phylogenetic analysis of individual data sets…..…….....................................………..5
Phylogenetic analysis of combined data matrix……………….....................................6
RESULTS……………………………………………………………………..........................8
Phylogenetic analysis of cytochrome b……………………..........................................8
Phylogenetic analysis of ND1…………………………………....................................8
Phylogenetic analysis of β-Fibrinogen intron 7……………….....................................9
Concatenated Bayesian analysis………………………..............................................11
Bayesian concordance analysis………………………………....................................11
DISCUSSION…………………………………………………………………………..........11
Morphological comparison……………………………..............................................11
Position of Eumops glaucinus complex…………………...........................................12

vii
Position of Eumops perotis……………………………………….....................................13
Position of Eumops hansae and the Eumops bonariensis complex………………….14
Analysis of β-Fibrinogen.............................................................................................16
Large insert in βFib of Eumops hansae.....………………………..............................17
Complete data analyses (BCA and BI)........................................................................17
LITERATURE CITED……………………………………………………………………....27
APPENDIX I………………………………………………………………………….......…32
VITA…………………………………………………………………………………............34

viii
LIST OF TABLES
Page
Table 1. Primers used in PCR and DNA sequencing for each of the genes utilized to analyze relationships among Eumops species. An asterisk (*) indicates a primer used only in sequencing. All other primers were used in both PCR and sequencing…...............20
Table 2. Average Kimura 2-parameter cytochrome b distances between species of Eumops
bats based on 715 base pairs of the cytochrome b gene for 29 taxa. Outgroups were not included…………………………………………………………………………21

ix
LIST OF FIGURES
Page
Figure 1. Most parsimonious cladogram of Eumops species resulting from analysis using unordered characters equally weighted. Small numbers below the branches represent decay index and bootstrap. Large numbers represent clades. (From Gregorin 2009)…………………………………………………………………....22
Figure 2. Bayesian tree of Eumops species generated with 715 base pairs of the Cytb gene
from a total of 32 taxa including outgroups. A black circle represents a node with significant BPP (BPP > 95) support only. A black circle with a star represents significant support with BPP and BS (BS > 70; generated from 1000 MLBS replicates). Numbers represent nodes (see results and discussion). Refer to Appendix for acronyms and collection site………………………………………23
Figure 3. Bayesian tree of Eumops species generated with 947 base pairs of the ND1 gene
from a total of 34 taxa including outgroups. A black circle with a star represents significant support with BPP (BPP > 95) and BS (BS > 70; generated from 1000 MLBS replicates). Numbers represent nodes (see results and discussion). Refer to Appendix for acronyms and collection site………………………………………24
Figure 4. Bayesian tree of Eumops species generated from 1043 base pairs of the βFib gene
of a total of 28 taxa including outgroups. A partial deletion was used on gaps with 75% site coverage cutoff. A black circle with a star represents significant support with BPP (BPP > 95) and BS (BS > 70; generated from 1000 MLBS replicates). Numbers represent nodes (see results and discussion). Refer to Appendix for acronyms and collection site……………………………………………………...25
Figure 5. Bayesian tree of Eumops species generated with 2715 base pairs of the
concatenated data set from 36 taxa including outgroups. A black circle with a star represents significant support with BPP (BPP > 95) and BS (BS > 70; generated from 1000 MLBS replicates). Numbers represent nodes (see results and discussion). Percentages below branches represent CF values generated from the BCA. Refer to Appendix for acronyms and collection site………………………26

1
INTRODUCTION
The genus Eumops consists of the mastiff and bonneted bats in the family
Molossidae. Bats in the family Molossidae, 16 genera of approximately 100 species
(Simmons 2005), are characterized by a free tail that extends past the tip of their
uropatagium. Eumops, a new world genus, currently consists of 15 species that can be found
in Texas, Arizona, Mexico, Central and South America, and the Caribbean (Eger 2007;
Gregorin 2009; McDonough et al. 2008). The genus is defined by a combination of
characteristics such as joined ears, moderate to deep basisphenoid pits, closed anterior palate,
and fine wrinkles on the lips (Freeman 1981). However, there are few well defined
synapomorphies that delimit the relationships of species within the genus Eumops. Bats in
the genus Eumops are morphologically highly variable with forearm size ranging from 37-82
mm (Eger 1977). The relative thickness of jaw bones in Eumops has been found to be
variable with E. perotis and E. auripendulus being at opposite ends of the spectrum (Freeman
1981). Eumops also shows high levels of karyotypic polymorphism with diploid numbers
ranging from 38-40 and fundamental numbers ranging from 54-64 (Genoways et al. 2005;
McDonough et al. 2008; Warner et al. 1974). Individuals within the E. glaucinus complex
also differ in the placement of the X-chromosome centromere (Genoways et al. 2005; Warner
et al. 1974).
Historically, there have been multiple Eumops species with recognized subspecies
(Eger 1977; Gregorin 2009; Sanborn 1932; Simmons 2005; Timm and Genoways 2004).
Worthy of particular note is the E. bonariensis complex which has contained as many as 4
Journal of Mammalogy

2
subspecies including E. b. beckerii/patagonicus, E. b. bonariensis, E. b. delticus, and E. b.
nanus (Eger 1977). Barquez et al. (1999) recognized E. bonariensis and E. patagonicus as
separate species based on prolonged sympatry in two parts of Argentina. Size differences
between these species are also pronounced with E. patagonicus having smaller forearms,
narrower ears, and a shorter skull with less separation between basisphenoid pits. Evidence
of sympatry was also used as justification to elevate E. nanus and E. delticus to specific
status (Eger 2007).
Analysis of 32 morphometric characters for many of the current Eumops species
(Eger 1977) provided much of the current framework for the relationships of the species
within Eumops. Eger’s (1977) use of overall similarities produced a phenogram that did not
agree with proposed relationships based on genetic similarities (Dolan and Honeycutt 1978).
Dolan and Honeycutt (1978) suggested high similarity between E. dabbenei and E.
underwoodi and a more distant relationship between E. glaucinus and E. auripendulus than
was portrayed in the phenetic morphological analysis by Eger (1977). By using overall
similarities instead of shared, derived characters species relationships can be difficult to
define because overall similarities can represent retained ancestral traits (Wiley et al. 1991).
A more recent cladistic morphological study by Gregorin (2009) using 39 characters
provided an updated review of the relationships within the genus Eumops. Gregorin proposed
a separation of the genus into two divergent clades and the recognition of 5 distinct lineages
based on morphological synapomorphies at the specific level (Fig. 1). While this more recent
work provided additional support for the relationships within Eumops, it also left a large
unresolved polytomy within the E. bonariensis clade and weak support for the position of E.

3
glaucinus (the E. bonariensis clade will be referred to as the E. nanus clade in this report
since we did not include E. bonariensis in our analysis).
McDonough et al. (2008) provided support for the elevation of 2 species within the
Eumops glaucinus complex using gene sequence, karyotypic, morphological, and AFLP data.
Their analysis supported three distinctive clades within the Eumops glaucinus complex: E.
glaucinus from Paraguay and Venezuela, E. ferox and E. floridanus from Cuba, Jamaica,
Mexico, and the United States, and a new species from Ecuador. The distinctive Ecuador
clade proposed by McDonough et al. (2008) was later given the name Eumops wilsoni (Baker
et al. 2009).
Although McDonough et al. (2008) resolved some of the uncertainty within the
Eumops glaucinus complex, the entire genus has yet to be studied using a molecular
approach. The objective of our study was to use multiple molecular data sets (both nuclear
and mitochondrial) to test the hypothesis of relationship among Eumops species that have
been proposed by cladistic analysis of morphological data (Gregorin 2009). We aimed to
determine if there was support for monophyly of the genus and to determine the sister
relationships among species within the genus Eumops.
MATERIALS AND METHODS
Taxonomic sampling for molecular analysis.-Individuals representative of 12 of the
15 species in the genus Eumops were included in our analysis. Samples from Ecuador, Costa
Rica, Jamaica, Venezuela, Cuba, Mexico, United States, Paraguay, Guyana, Panama, and
Nicaragua were loaned from various institutions (Appendix I). Other taxa within the family
Molossidae were used as outgroups; Nyctinomops macrotis, N. femorosaccus, Molossus ater,

4
Promops centralis, Tadarida brasiliensis. These taxa shared a common ancestor with
Eumops 24.4-28.7 million years ago and represent many of the genera that are most closely
related to Eumops (Ammerman et al. 2012). Close outgroups were chosen in order to
decrease the chance of long branch attraction by a distant lineage (Bergsten 2005).
Gene selection.-Mitochondrial sequences from both cytochrome-b (Cytb) and
nicotinamide adenine dinucleotide dehydrogenase subunit 1 (ND1) and nuclear sequence
data from β-fibrinogen intron 7 (βFib) were used to test relationships among Eumops species.
Previous studies successfully recovered relationships at the generic and specific levels of
classification using these genes (Baker and Bradley 2006; Johnson and Clayton 2000; Lerner
et al. 2008; Mayer et al. 2007; McAliley et al. 2007; Spinks and Shaffer 2007; Tagliaro et al.
2005). Although nuclear genes usually have fewer parsimony-informative sites, βFib has
been shown to have a higher percentage of parsimony-informative sites than other nuclear
genes, which is probably because it is an intron and is not under the same selective pressure
as coding nuclear genes (Ammerman et al. 2012; Fujita et al. 2004; Mathee and Davis 2001).
By collecting mitochondrial sequences in conjunction with nuclear sequences, an
independent test of proposed phylogenetic relationships is generated, thus allowing for
comparison between the relationships determined by the two genomes (Moore 1994; Teeling
et al. 2000).
DNA Sequencing.-We extracted total genomic DNA from frozen liver, heart, or
kidney tissue using the DNeasy Tissue Kit (QIAGEN Inc., Valencia, California) following
manufacturer’s protocol. Sequences from both mitochondrial (Cytb and ND1) and nuclear
(βFib) genes were amplified using conserved vertebrate primers (Table 1). We amplified

5
DNA templates using either Eppendorf Taq polymerase (5U/ul; Eppendorf, Westbury, New
York) or AmpliTaq 360 DNA polymerase (5U/ul; Applied Biosystems, Foster City,
California). Reactions were carried out in 12.5ul volume following a standard polymerase
chain reaction protocol (Palumbi 1996). Each reaction consisted of 200-500 ng of DNA, 3 U
of Taq polymerase, 0.16 uM of forward and reverse primer, 2mM MgCl2, 0.16 mM
deoxynucleoside triphosphates and 1X reaction buffer.
The same thermal profile was used for each fragment except for varying annealing
temperatures: initial denaturation at 94°C for 3 min; 39 cycles at 94°C for 1 min, annealing
for 1 min (Cytb 48-50°C, βFib 48-57°C, and ND1 56°C), and 72°C for 1 min, with a final
extension of 72°C for 3 min. Differences in annealing temperatures within each locus were
due to varying primer sets being used to amplify the locus and to individual sample variation
(some samples produced multiple bands unless the annealing temperature was increased).
We quantified products from the PCR using a Qubit fluorometer (Invitrogen,
Carlsbad, California). The PCR products were then purified using ExoSAP-IT (USB-
Affymetrix, Cleveland, Ohio) and subjected to DNA sequencing using GenomeLab DTCS-
Quick Start Mix in a Beckman Coulter CEQ 8000 automated sequencer following
manufacturer’s protocol except reaction volumes were quartered (Beckman Coulter Inc.,
Fullerton, California). We sequenced each sample with the same primers used in PCR as well
as additional internal primers to create overlapping sequences in order to increase the
accuracy of the sequence data (Table 1).
Phylogenetic analysis of individual data sets.-We used Sequencher version 5.0 (Gene
Codes Corporation, Ann Arbor, Michigan) and MEGA5 (Tamura et al. 2011) to align the

6
sequences and check for amino acid translation of the mitochondrial genes. The Model
Selection function in MEGA5 was used to determine which of 24 possible evolutionary
models best fit each individual gene for both maximum likelihood (ML) and Bayesian
analyses. We considered models with the lowest Bayesian Information Criterion (BIC) to
describe the substitution pattern that best fit the data set (Tamura et al. 2011). We calculated
average overall and pairwise genetic distances to estimate evolutionary divergence between
lineages using the Kimura 2-parameter model without gamma correction in order to allow for
comparison with Bradley and Baker’s (2001) test of the genetic species concept. Bootstrap
analysis (Felsenstein 1985) for 1000 pseudoreplicates using ML criteria was performed in
MEGA5. Gaps were treated with partial deletion with site coverage cutoff set at 75% in βFib
in order to keep as many phylogenetically informative characters as possible. We considered
nodes with ML bootstrap (BS) values >70 as significantly supported (Hillis and Bull 1993).
Bayesian Inference (BI) analysis of each individual data set was completed using
MrBayes version 3.2.1 (Ronquist and Huelsenbeck 2003). The analyses consisted of 2
simultaneous runs each with four Markov Chain Monte Carlo (MCMC) chains (one heated
and three cold) run for 5 million generations on each of our individual data sets. Trees were
sampled every 100 generations for a total of 50,000 trees sampled. We used a burn-in of
12,500 to discard the first 25% of sampled trees. Bayesian posterior probabilities (BPP)
>0.95 were considered significant node support (Suzuki et al. 2002).
Phylogenetic analysis of combined data matrix.-The individual data sets (ND1, Cytb,
and βFib) were placed into a concatenated data set for further analysis using Bayesian
methods to provide a better estimate of the relationships between species (Heulsenbeck and

7
Ronquist 2005). We placed the individual alignments into one alignment that contained all
three genes. Individuals with missing data for some of the genes were retained in the
concatenated data set because according to Weins and Morrill (2011) missing data are less
important than missing taxa in a phylogenetic analysis. Individual evolutionary models,
which we determined to best fit our data sets previously, were applied to each gene partition
in the concatenated dataset and then MrBayes was run as previously described for the
individual BI analyses.
Concatenation of loci is known to be powerful, but it is also known to cause inflated
support values (Kubatko and Degnan 2007). Because of this, Bayesian concordance analysis
(BCA) was performed using the program BUCKy (Bayesian Untangling of Concordance
Knots) (Larget et al. 2010). BCA allows for discordance among loci, but makes no
assumption as to what is the underlying cause of the discordance (e. g. incomplete lineage
sorting). Additional independent Bayesian analyses were run on the three individual datasets
for all 36 taxa for 2 million generations with trees sampled every 1000 generations. We used
the best-fit evolutionary model for each gene. We then summarized the two independently
inferred sets of gene trees for each gene, combining the 2 MCMC runs resulting from the
Bayesian analysis (files ending with *.runx.t) using the mbsum command. A burnin of 25%
was set since all saved trees from the BI were included in the *.t files (Larget et al. 2010).
Finally, BCA was performed on the 3 summarized files using the BUCKy command line
(Ane et al. 2006). The primary concordance tree was built from clades that are supported by a
majority of the sampled genes, giving a useful summary of the dominant phylogenetic
history. Concordance factors (CF) represent the proportion of sampled trees across all genes

8
that supported a particular clade.
RESULTS
Phylogenetic analysis of cytochrome b.-A total of 715 base pairs was sequenced from
32 taxa (including outgroups; Appendix 1) for Cytb resulting in 216 parsimony informative
characters. Model Selection analysis in MEGA5 determined that the Tamura-Nei with
gamma distribution (TN93+G, α=0.24) was the best-fit evolutionary model for this data set.
ML and BI analyses recovered significant support for the monophyly of the genus and three
deeply divergent lineages within Eumops with no disagreement between ML and BI
topologies (Fig 2).
Significant support was recovered using both ML and BI for the placement of
Eumops perotis in the same clade (clade 2) as the E. glaucinus complex (Fig. 2). Most
individuals of the same species grouped together, except for E. ferox. The specific
relationships of E. perotis and E. maurus + E. auripendulus within clade 2 remain unclear. E.
ferox did not represent a monophyletic group. The position of Eumops hansae also remains
unclear. While the topology seems to suggest that E. hansae is outside of other members of
the genus, this placement did not have significant support.
Within species, pairwise genetic distances (K2P) ranged from 0.0018 (E. wilsoni) to
0.0899 (E. patagonicus). The average overall genetic distance between ingroup species was
0.1191 with values ranging from 0.0084 between E. ferox and E. floridanus to 0.1804
between E. dabbenei and E. hansae (Table 2).
Phylogenetic analysis of ND1.-A total of 957 base pairs was sequenced from 34 taxa
(including outgroups; Appendix 1) for ND1 resulting in 295 parsimony informative

9
characters. Analysis using Model Selection in MEGA5 determined that the Tamura-Nei with
gamma distribution (TN93+G, α=0.32) was the best-fit evolutionary model for this data set.
No significantly supported clades conflicted in the ML and BI analyses (Fig. 3). We
recovered a very similar topology as recovered for Cytb. A noteworthy difference between
the clades recovered in the Cytb analysis and the ND1 analysis was the placement of Eumops
hansae within clade 1 (E. nanus clade; Fig. 3). Significant support was found for the
placement of E. hansae in this clade based on both BPP and BS values.
There was significant support for the monophyly of the genus and many
monophyletic species groups, but E. ferox and E. nanus represent exceptions to this. E. nanus
from Panama (TK12526) clustered with E. patagonicus rather than with E. nanus from
Mexico. This specimen also had a smaller genetic distance from E. patagonicus (0.033) than
from the E. nanus from Mexico (0.056). Similarly, E. ferox individuals do not form a
monophyletic lineage with respect to E. floridanus.
Within species, pairwise genetic differences (K2P) ranged from 0.0013 (E. perotis) to
0.0345 (E. nanus). The average overall distance between species (with outgroups removed)
was 0.1019 with values ranging from 0.013 between E. floridanus and E. ferox and 0.188
between E. auripenduluss and E. hansae.
Phylogenetic analysis of β-Fibrinogen intron 7.-A total of 1043 base pairs was
sequenced from 28 taxa (including outgroups) for βFib resulting in 95 parsimony informative
characters. When aligning the sequences in MEGA5, Eumops hansae was found to have a
262 base pair insert that was shared exclusively by both E. hansae individuals that were
sequenced. This fragment was compared to GenBank (www.ncbi.gov) using BLAST and a

10
match was found to a previously described SINE insert (Borodulina and Kramerov 1999).
Other smaller deletions also were present in the βFib data set including a 9-bp deletion in all
Eumops patagonicus and a 2-bp deletion from both Eumops hansae specimens. Partial
deletion (75% coverage cutoff) resulted in the exclusion of the large SINE insert from E.
hansae from the ML analysis and the inclusion of each of the small deletions found in the
alignment.
Model selection analysis in MEGA5 determined that the Tamura 3-parameter without
gamma correction (T3P) was the best-fit evolutionary model for this data set. ML and BI
analyses recovered significant support for the monophyly of the genus (Fig. 4). Closely
related species showed some lack of separation into individual species clades. This lack of
separation was seen in the E. glaucinus complex and within the uniquely recovered E.
auripendulus + E. nanus clade. The placement of E. hansae as basal to the rest of the genus
was not significantly supported by either BI or ML analyses. Significant support was found
for the placement of E. perotis in the same clade with the E. glaucinus complex (Clade 2)
which also was seen in the Cytb and ND1 analyses (Fig. 2, 3) but the sister relationships
within Clade 2 remain an unresolved polytomy. The placement of E. nanus differed
significantly from the mitochondrial gene trees. In the βFib analysis, E. nanus grouped with
E. auripendulus rather than sister to E. patagonicus (Clade 1).
Within species, pairwise genetic differences (K2P) ranged from 0.0023 (E. perotis) to
0.0159 (E. wilsoni). The average overall distance between species (with outgroups removed)
was 0.0375. The smallest interspecific distance was between Eumops dabbenei and E.
underwoodi (D=0.0034) and the largest distance was between E. hansae and E. nanus

11
(D=0.0758).
Concatenated Bayesian Analysis.-A total of 2715 base pairs from 36 taxa were
included in the Bayesian analysis of our concatenated data set. Analysis of the partitioned
concatenated data set including both mitochondrial genes (ND1 and Cytb) and the nuclear
gene (βFib) recovered a topology similar to that recovered from the analyses of
mitochondrial genes (Fig. 5). Significant support was not found for the placement of E.
hansae as a basal lineage in the genus. Significant support was found using BI for individual
species as monophyletic, except within E. ferox, E. floridanus, and E. nanus. The placement
of E. perotis in the same clade as the E. glaucinus complex (Clade 2) also was significantly
supported, but the sister relationships of E. perotis and E. maurus + E. auripendulus with
other members of Clade 2 remain unresolved (Fig. 5).
Bayesian Concordance Analysis.-The primary concordance tree generated with BCA using
the independent posterior probabilities of the individual gene trees is the same topology as
the Bayesian tree generated based on our concatenated data set (Fig. 5). Identical results were
generated when using α priors of 0.1, 1, and 10. Generally, CF values were lower on the
branches representing earlier divergences within the genus.
DISCUSSION
Morphological comparison.-The evolutionary history of the Eumops genus recovered
in our study based on DNA sequence data is not consistent with many of the existing
morphological predictions (Eger 1977; Freeman 1981; Gregorin 2009). Our phylogeny
generated from each mitochondrial gene recovered some of the same relationships recovered
in Gregorin’s (2009) cladogram such as the close relationship of Eumops maurus + E.

12
auripendulus, E. dabbenei + E. underwoodi, and E. nanus + E. patagonicus. Some of the
characters, such as large body size and a high sagittal crest, used by Gregorin (2009) can be
considered to have evolved convergently as is evidenced by their appearance in multiple
distantly related clades. The groupings based on these homoplastic characteristics therefore
do not represent a true phylogenetic history (Wiley and Lieberman 2011). We found support
that two (slightly domed skull and warts on upper boarder of ears) of the five possible
convergent characters mentioned by Gregorin (2009) do represent true convergences based
on our analyses of mitochondrial DNA sequence data. The other three characters with
alternative groupings proposed by Gregorin (2009) were high sagittal crest, broad braincase,
and large body size. Our analyses recovered clades that were consistent with these
morphological synapomorphies.
Position of Eumops glaucinus complex.-McDonough et al. (2008) presented evidence
that the Eumops glaucinus complex contained multiple species, but the sister relationships of
this complex with the other species within the genus was not evaluated. Gregorin’s (2009)
strict consensus cladogram based on ordered characters (Fig. 4 in Gregorin 2009) could not
resolve the relationship between E. glaucinus and the other species. His unordered analysis
supported (only with decay index, no bootstrap support was recovered) grouping E.
glaucinus with the E. bonariensis group although he noted E. glaucinus shared a similar size
with E. auripendulus. He also noted that E. glaucinus shared the characteristics of overall
skull shape and pelage color with E. dabbenei + E. underwoodi, a grouping we find more
consistent with our molecular data (Fig. 2-5). We found significant support for E. glaucinus
as a member of clade 2 (Fig. 5).

13
Each of the mitochondrial trees supports the position of E. wilsoni as basally
divergent in the E. glaucinus complex as hypothesized by McDonough et al. (2008). The lack
of complete separation of E. ferox and E. floridanus into monophyletic groups may be due to
incomplete lineage sorting and was also recovered by McDonough et al (2008). The
separation of the E. ferox samples, which was recovered in each of the mitochondrial trees
and the combined analyses, is consistent with geographic location; TK13585 and TK13589
were collected in Mexico while TK32052 and TK32033 were collected in Cuba. E.
floridanus is distinguished from other members in this complex based on larger overall size
and body mass, a narrower palate, and proportionally shorter condylobasal length (Timm and
Genoways 2004). In the cytb data set, E. floridanus had less sequence divergence from the E.
ferox from Cuba (0.0066) than the two geographically distinct E. ferox populations had from
each other (0.0081). According to Bradley and Baker (2001) this low level of sequence
divergence is expected at the subspecific level. The evidence based on sequence divergence
among and between these two species combined with incomplete separation of the two
species suggests reevaluation of E. floridanus as a valid species.
Position of Eumops perotis.-Our analysis offered increased resolution of the
relationships within this genus with significant support for the placement of E. perotis within
the same clade as the E. glaucinus complex. However, this placement does not fully resolve
the relationship of E. perotis to other species in the clade. Gregorin (2009) found that
unequivocal synapomorphies of quadrish basisphenoid pits and a narrowed crest between the
basisphenoid pits joined E. perotis with the previously described E. bonariensis group, but
this relationship was not supported in any of the gene trees we generated, suggesting

14
convergence of these characters in multiple lineages. We can refute the proposed placement
of E. perotis with the E. bonariensis group by Gregorin (2009). We believe that the
characters grouping E. perotis with the other large bodied bats in clade 2 recovered in our
analyses, such as the high sagittal crest shared with E. auripendulus, may be more
phylogenetically informative in the morphological classification of this genus. Our recovery
of E. perotis as more closely related to E. dabbenei + E. underwoodi leaves the E.
bonariensis complex + E. hansae as a distinct, small bodied (FA < 50mm) clade.
The specific relationships of the species within this clade (which also contains E.
underwoodi + E. dabbenei and E. maurus + E. auripendulus in our total data analyses)
remain relatively uncertain. Although E. trumbulli was not included in our molecular analysis
we can postulate on its relationship to the other members in Eumops. It seems more likely
that E. trumbulli would group with E. perotis in future analyses rather than remaining sister
to the E. nanus clade as was recovered by Gregorin (2009). Additionally, E. perotis and E.
trumbulli share five morphological synapomorphies that group them. Together, these two
species also share large body size and similar skull shapes with the E. dabbenei + E.
underwoodi clade (Gregorin 2009).
Position of Eumops hansae and the Eumops nanus clade.-Dolan and Honeycutt
(1978) suspected that the large amount of diversity seen in Eumops hansae both
morphologically and genetically warranted consideration of its possible placement in a
different genus. However our analyses support the monophyly of the genus and thus, the
inclusion of E. hansae within the genus (BPP > 0.99, Fig. 2, 3). Additionally, although there
was some uncertainty in the position of E. hansae, the ND1 analysis placed E. hansae as

15
sister to the E. nanus group (Fig. 3). Sanborn (1932) first suspected the close relationship of
E. bonariensis and E. hansae based on overall similarities in external morphology and skull
shape. Gregorin’s (2009) morphometric analysis confirmed this grouping with 7
morphological synapomorphies defining the unresolved polytomy in which these species
previously recognized as subspecies of E. bonariensis appear.
The incomplete separation of E. patagonicus and E. nanus into monophyletic species
groups remains problematic (Fig. 3; Fig. 5). According to current species ranges, E. nanus
extends from Central Mexico to southern Brazil (including Columbia, Ecuador, Venezuela,
and parts of Guyana and Peru) (Eger 2007). The range of E. patagonicus seems to be more
restricted, extending from the east coast of Argentina through Paraguay and up into central
Bolivia (Eger 2007). Thus these 2 species’ distributions do not overlap. More likely we
would expect this pattern of non-monophyly to exist between closely-related species with
overlapping distributions, such as E. patagonicus and E. bonariensis or E. nanus and E.
delticus, which would allow for possible interspecific breeding between these individuals
(Nesi et al. 2011). All of the E. nanus that did form a monophyletic group were from Mexico,
while the E. nanus (TK12526) that grouped with E. patagonicus was collected from Panama.
Our data suggest this specimen may actually be E. patagonicus, although sequence data was
only available for ND1 and significant support for this result was only recovered in our
concatenated analysis (Fig. 5). The lower sequence divergence we recovered between the E.
nanus from Panama and our E. patagonicus specimens (0.033) than between the two
geographically distinct E. nanus groups from Panama and the Yucatan (0.056) suggests that
the distributions and elevation of these species (or subspecies) need to be reevaluated.

16
Available data regarding the elevation of species previously recognized as subspecies within
the E. bonariensis complex is rather nonspecific; the addition of the other members of the E.
bonariensis complex (E. delticus and E. bonariensis) from across their range will be essential
in determining the cause of the uncertainty in position of these species.
Analysis of β-Fibrinogen.-Lack of parsimony informative characters for βFib may be
the reason why some species, such as E. ferox and E. floridanus in the E. glaucinus complex,
do not fall out into fully demarcated clades. The average overall genetic divergence within
the mitochondrial genes was approximately four times greater than that of βFib. Individuals
within this complex are recently diverged, causing us to expect very little difference in their
highly conserved nuclear genes (Ammerman et al. 2012, Steppan et al. 2004). The grouping
of E. nanus and E. auripendulus in this nuclear gene tree conflicts with the placement of
these species recovered in the mitochondrial trees. Contamination during DNA extraction,
PCR, or even sequencing could be an explanation, but each of the E. nanus and E.
auripendulus samples were processed multiple times. If contamination were the cause of this
unique grouping, we would not expect for samples processed at different times to have
independently acquired the same contaminant. Additionally, this unique grouping has not
been supported or proposed as a possible explanation of the relationships within Eumops in
any of the morphological data that we reviewed. Eger (1977) placed E. auripendulus as more
closely related to E. maurus than E. nanus in her phenogram of average taxonomic difference
(E. nanus was presented as E. bonariensis in her phenogram because E. nanus was
recognized as a subspecies of E. bonariensis at the time). The morphologically based
cladogram also does not support this grouping (Gregorin 2009). Curiously, the two characters

17
from his analysis that we showed to be homoplastic in our analyses of our mitochondrial
trees (slightly domed head and warts on upper boarder of ears) are concordant with this
otherwise unique recovery (Gregorin 2009). Even so, there is much morphological and
molecular support for the close relationship of Eumops nanus and E. patagonicus. We need
to increase the number of nuclear genes in order to get a better understanding of the evolution
of the nuclear genome of Eumops species. Addition of microsatellite or AFLP data would
also be useful in delineating these closely related species due to their rapid rates of evolution
(Larsen et al. 2010, McDonough et al. 2008).
Large Insert in ΒFib of Eumops hansae.-The large, 262 base pair, insert found in the
βFib intron of E. hansae represents a SINE, short interspersed element, which was originally
discovered in bats of the families Vespertilionidae and Molossidae (Borodulina and
Kramerov 1999). SINEs are ‘jumping genes’ that belong to the retrotransposon class of
mobile elements that can propagate in their host genomes through retrotransposition
(Fantaccione et al. 2008). A BLAST search from GenBank also returned high similarity
matches for records of this SINE in Artibeus (family Phyllostomidae), Tadarida, Otomops
(family Molossidae), Myotis, Rhogeessa, and Neoromicia (family Vespertilionidae). Further
investigations into the evolutionary mechanisms underlying this SINE repeat and possible
implications of this insert for E. hansae are justified.
Complete data analyses (BCA and BI).-Our concatenated analysis recovered support
for basically the same relationships as both of the mitochondrial gene trees, giving us
additional support for the monophyly of this genus and many of the species within it (Fig. 5).
This complete data analysis also recovered the relationships seen in the nuclear gene, less the

18
unique grouping of E. auripendulus + E. nanus recovered in βFib. Our study is the most
comprehensive molecular study on the entire Eumops genus thus far and so we consider our
tree resulting from the analysis of our concatenated data set the most representative species
tree. There is still some lack of resolution, in particular the relationship of E. perotis with
other bats in Clade 2 and the position of E. hansae.
The BCA allowed us to integrate information from multiple individual datasets and
clarify the natural groups within Eumops (Baum 2007). We recovered additional evidence for
the possible placement of E. nanus with E. patagonicus, which differed significantly from the
nuclear gene tree that placed E. nanus sister to E. auripendulus. The low CF values from the
BCA for the individuals with missing sequence data for ND1 (Appendix I) are likely due to
the loss of informative characters found in the ND1 gene. The overall lower CF support
values (when compared to BS and BPP) illustrate the difference between these computational
procedures used in these measures of support (Weisrock et al. 2012). Using a BCA may
better reflect the level of incongruence between gene trees, in particular, between the
mitochondrial trees and the nuclear gene tree because the genetic histories are directly
estimated from the individual gene genealogies, which are then used to estimate the
proportion of the sampled genes with different histories (Baum 2007; Cranston et al. 2009).
The resulting concordance tree provides an estimate of the discordance and divergence at
various points in the history of the genus Eumops. By taking into account the incongruence
between gene trees using BCA, we do not change our view of the phylogeny of this group
generated based on our other molecular analyses, but instead offer increased evidence where
disagreement existed and a more comprehensive view of the support across the tree

19
(Cranston et al. 2009).
Although some relationships remain unresolved within the genus and some species
within the genus Eumops were not included in this study, we were able to offer increased
resolution and significant support for many of the proposed relationships, including the
monophyly of the genus. We reject Gregorin’s (2009) hypothesis of the relationships within
Eumops and put forth a new hypothesis of these relationships. Additional taxa and additional
genes, especially from the nuclear genome, will undoubtedly clarify the hypotheses of
relationships within Eumops.

20
Table 1.--Primers used in PCR and DNA sequencing for each of the genes utilized to analyze relationships among Eumops species. An asterisk (*) indicates a primer used only in sequencing. All other primers were used in both PCR and sequencing. Gene Name Sequence (5'-3') Reference
Cytb 14841 AAAAAGCTTCCATCCACCATCTCAGCATGAAA Irwin et al. 1991 15547 GGCAAATAGGAAATATCATTC Edwards et al. 1991 Gludg TGACTTGAARAACCATCGTTG Palumbi 1996
βFib B17L GGAGAAAACAGGACAATGACAATTCAC Prychitko and Moore 1997 B17U TCCCCAGTAGTATCTGCCATTAGGGTT Prychitko and Moore 1997 FGB-FelF CACAACGGCATGTTCTTCAGCACG Yu and Zhang 2005 FGB-FelR TACCACCATCCACCACCATCTTCTT Yu and Zhang 2005
ND1 ER65 CCTCGATGTTGGATCAGGACATCC Petit et al. 1999 ER66 GTATGGGCCCGATAGCTTAATTAGC Petit et al. 1999 *ER70 CAGACCGGCGTAATCCAGGTGGGTT Petit et al. 1999 *ER89 CTCTATCAAAGTAACTCTTTTATCAGA Petit et al. 1999
*ER340 AGGTTCAAYTCCTCTCTCTAACA Dolman 2009

21
Table 2.—Average Kimura 2-parameter cytochrome b distances between species of Eumops bats based on 715 base pairs of the cytochrome b gene for 29 taxa. Outgroups were not included. 1 2 3 4 5 6 7 8 9 10 11
1 E. wilsoni 2 E. perotis 0.1105 3 E. dabbenei 0.1159 0.1201 4 E. underwoodi 0.0966 0.1114 0.0498 5 E. ferox 0.0674 0.1184 0.0952 0.0910 6 E. floridanus 0.0679 0.1200 0.1000 0.0936 0.0084 7 E. hansae 0.1535 0.1666 0.1804 0.1796 0.1692 0.1704 8 E. glaucinus 0.0747 0.1319 0.0903 0.0987 0.0349 0.0372 0.1631 9 E. maurus 0.1148 0.1151 0.1201 0.1223 0.1178 0.1249 0.1653 0.1161
10 E. auripendulus 0.1148 0.1215 0.1129 0.1267 0.1178 0.1249 0.1707 0.1117 0.0191 11 E. nanus 0.1416 0.1604 0.1481 0.1595 0.1473 0.1501 0.1676 0.1421 0.1615 0.1523 12 E. patagonicus 0.1394 0.1485 0.1525 0.1525 0.1378 0.1388 0.1518 0.1525 0.1477 0.1477 0.0619

Fig. 1unordindex
1.--Most pardered characx and bootstr
rsimonious ccters equally rap. Large nu
1
2
cladogram ofweighted. S
umbers repre
22
f Eumops spSmall numbeesent clades
pecies resultiers below the. (From Gre
ing from anae branches regorin 2009)
alysis using epresent dec.
cay
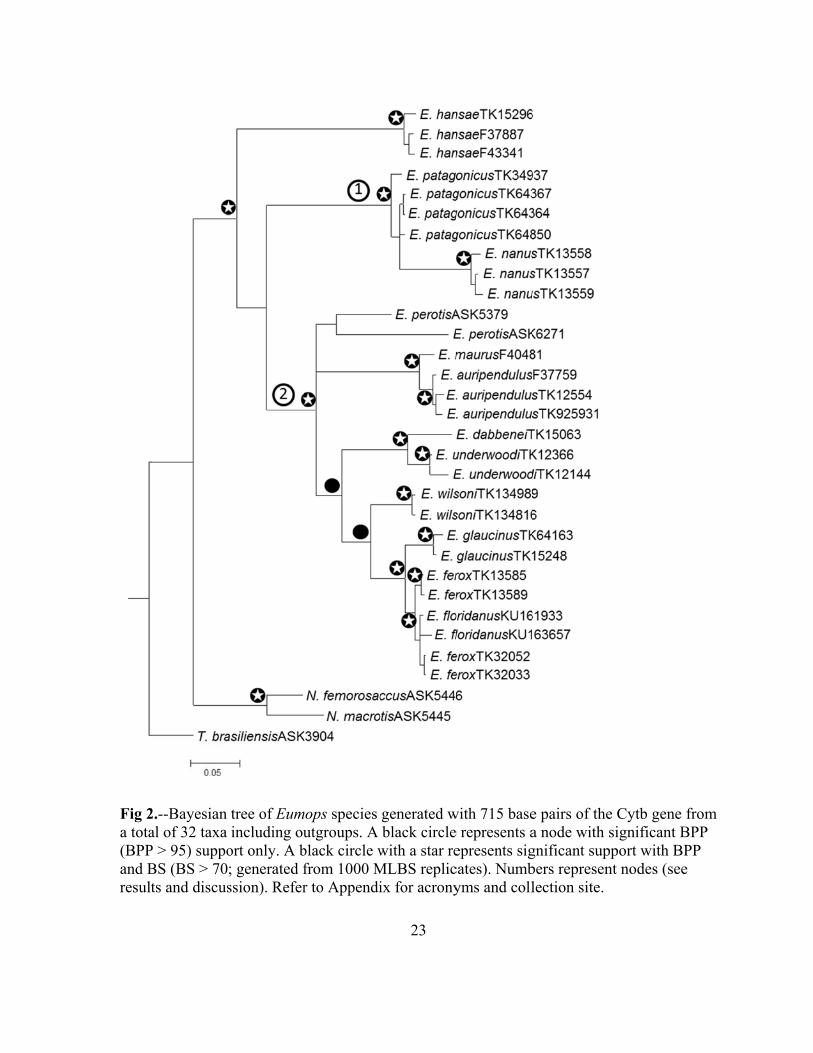
Fig 2a tota(BPPand Bresult
2.--Bayesian al of 32 taxa P > 95) suppoBS (BS > 70ts and discus
tree of Eumincluding ou
ort only. A b; generated fssion). Refer
mops speciesutgroups. A black circle wfrom 1000 Mr to Appendi
23
generated wblack circle
with a star reMLBS replicix for acrony
with 715 basee represents aepresents sigcates). Numbyms and coll
e pairs of thea node with gnificant supbers represenlection site.
e Cytb gene significant B
pport with BPnt nodes (see
from BPP PP e

Fig 3a totasuppoNumbcollec
3.--Bayesian al of 34 taxa ort with BPPbers represection site.
tree of Eumincluding ou
P (BPP > 95)nt nodes (se
mops species utgroups. A ) and BS (BSe results and
24
generated wblack circleS > 70; gened discussion)
with 947 basee with a star rerated from 1). Refer to A
e pairs of therepresents si1000 MLBS
Appendix for
e ND1 gene ignificant
S replicates). r acronyms a
from
and

Fig 4a totacover95) aresult
4.--Bayesian al of 28 taxa rage cutoff. And BS (BS >ts and discus
tree of Eumincluding ouA black circ> 70; generassion). Refer
mops species utgroups. A
cle with a stated from 100r to Appendi
25
generated frpartial delet
ar represents 00 MLBS reix for acrony
rom 1043 bation was usesignificant s
eplicates). Nyms and coll
ase pairs of thed on gaps wsupport with
Numbers reprlection site.
he βFib gene
with 75% siteh BPP (BPP resent nodes
e of e > (see
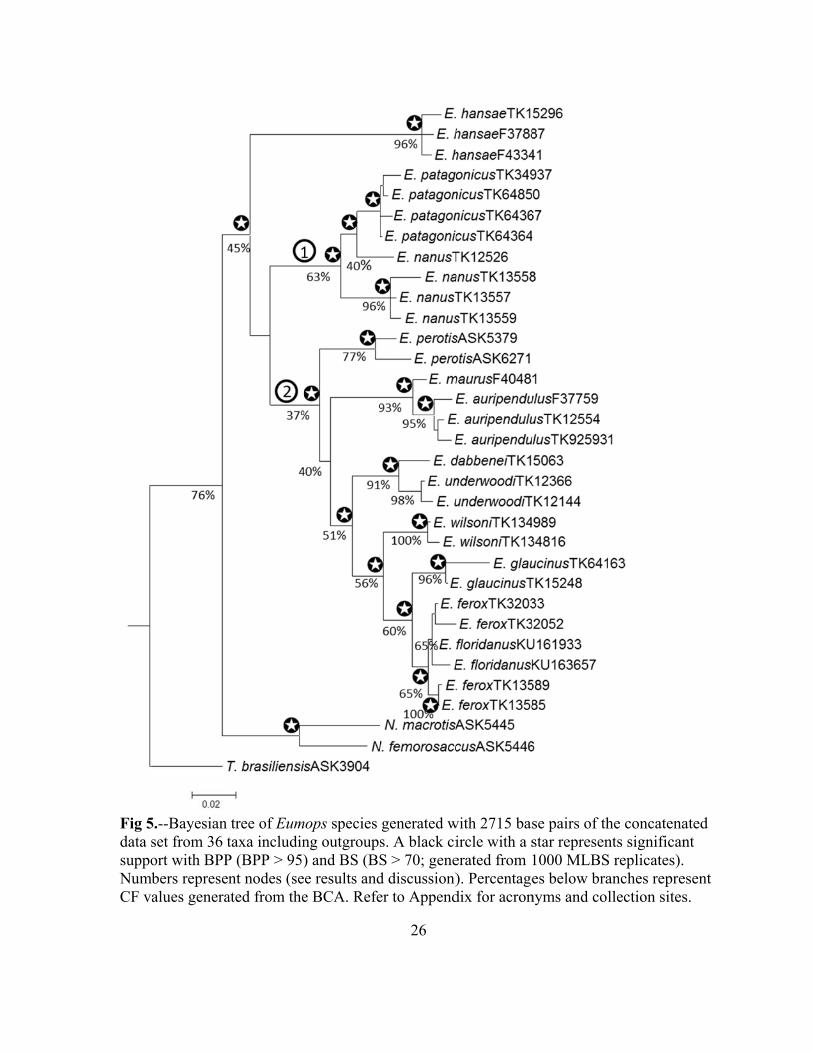
Fig 5data ssuppoNumbCF va
5.--Bayesian set from 36 tort with BPPbers represealues genera
tree of Eumtaxa includinP (BPP > 95)nt nodes (se
ated from the
mops species ng outgroups) and BS (BSe results ande BCA. Refe
26
generated ws. A black ciS > 70; gened discussion)er to Append
with 2715 basircle with a serated from 1). Percentagedix for acron
se pairs of thstar represen1000 MLBSes below bra
nyms and col
he concatenants significanS replicates). anches reprellection sites
ated nt
esent s.

27
LITERATURE CITED
AMMERMAN, L. K., D. N. LEE, AND T. M. TIPPS. 2012. First molecular phylogenetic insights into the evolution of free-tailed bats in the subfamily Molossinae (Molossidae, Chiroptera). Journal of Mammalogy 93:12-28.
ANE, C., B. LARGET, D. A. BAUM, S. D. SMITH, AND A. ROKAS. 2006. Bayesian estimation of
concordance among gene trees. Molecular Biology and Evolution 24:412-426. BAKER, R. J., M. M. MCDONOUGH, V. J. SWIER, P. A. LARSEN, J. P. CARRERA, AND L. K.
AMMERMAN. 2009. New species of bonneted bat, genus Eumops (Chiroptera: Molossidae) from the lowlands of western Ecuador and Peru. Acta Chiropterologica 11:1-13.
BAKER, R. J. AND R. D. BRADLEY. 2006. Speciation in mammals and the genetic species
concept. Journal of Mammalogy 87:643-662. BARQUEZ, R. M., M. A. MARES, AND J. K. BRAUN. 1999. The bats of Argentina. Special
Publications, Museum of Texas Tech University, Lubbock, Texas. BAUM, D. A. 2007. Concordance trees, concordance factors, and the exploration of reticulate
genealogy. Taxon 56:417-426. BERGSTEN, J. 2005. A review of long-branch attraction. Cladistics 21:163-193. BORODULINA, O. R. AND D. A. KRAMEROV. 1999. Wide distribution of short interspersed
elements among eukaryotic genomes. FEBS Letters 457:409-413. BRADLEY, R. D. AND R. J. BAKER. 2001. A test of the genetic species concept: cytochrome-b
sequences and mammals. Journal of Mammalogy 82:960-973. CRANSTON, K. A., B. HURWITZ, D. WARE, L. STEIN, AND R. A. WING. 2009. Species trees
from highly incongruent gene trees in rice. Systematic Biology 58:489-500. DOLAN, P. G. AND R. L. HONEYCUTT. 1978. Systematics and evolutionary implications of
genetic variation in the mastiff bat, Eumops (Chiroptera: Molossidae). Bat Research News 19:72.
DOLMAN, R.W. 2009. Molecular systematics of Nyctinomops (Chiroptera: Molossidae). M.S.
Thesis, Angelo State University, San Angelo, Texas. EDWARDS, S. V., P. ARCTANDER, AND A. C. WILSON. 1991. Mitochondrial resolution of a
deep branch in the genealogical tree for perching birds. Proceedings of the Royal Society of London 243:99-107.

28
EGER, J. L. 1977. Systematics of the genus Eumops (Chiroptera: Molossidae). Life Science Contributions, Royal Ontario Museum 110:1-69.
EGER, J. L. 2007. Order Chiroptera: Family Molossidae. Pp. 407-416 in Mammals of South
America, Volume 1: Marsupials, Xenarthrans, shrews, and bats. (Gardner, A. L., ed.) University of Chicago Press, Chicago, Illinois.
FANTACCIONE, S., P. WOODROW, AND G. PONTECORVO. 2008. Identification of a family of
SINEs and LINEs in the Pipistrellus kuhli genome: a new structural and functional symbiotic relationship. Genomics 9:178-185.
FELSENSTEIN, J. 1985. Confidence limits on phylogenies: an approach using bootstrap.
Evolution 39:783-791. FREEMAN, P. W. 1981. A multivariate study of the family Molossidae (Mammalia,
Chiroptera): morphology, ecology, evolution. Fieldiana: Zoology (N.S.) 7:1-173. FUJITA, M. K., T. M. ENGSTROM, D. E. STARKEY, AND H. B. SHAFFER. 2004. Turtle
phylogeny: insights from a novel nuclear intron. Molecular Phylogenetics and Evolution 31:1031-1040.
GENOWAYS, H. H., R. J. BAKER, J. W. BICKHAM, AND C. J. PHILLIPS. 2005. Bats of Jamaica.
Special Publications, The Museum of Texas Tech University, Lubbock, Texas 48:1-155.
GREGORIN, R. 2009. Phylogeny of Eumops Miller, 1906 (Chiroptera: Molossidae) using
morphological data. Acta Chiropterologica 11:247-258. HEULSENBECK, J. P. AND F. RONQUIST. 2005. Bayesian analysis of molecular evolution using
MrBayes. Statistical Methods in Molecular Evolution: Statistics for Biology and Health, Part II, pp183-1226.
HILLIS, D. M. AND J. J. BULL. 1993. An empirical test of bootstrapping as a method for
assessing confidence in phylogenetic analysis. Systematic Biology 42:182–192. HUDSON, R. R. 1992. Gene trees, species trees and the segregation of ancestral alleles.
Genetics 131:509-513. IRWIN, D. M., T. D. KOCHER, AND A. C. WILSON. 1991. Evolution of the cytochrome-b gene
of mammals. Journal of Molecular Evolution 32:128-144. JOHNSON, K. P. AND D. H. CLAYTON. 2000. A molecular phylogeny of the dove genus
Zenaida: mitochondrial and nuclear DNA sequences. The Condor 102:864-870.

29
KUBATKO, L. S. AND J. H. DEGNAN. 2007. Inconsistency of phylogenetic estimates from concatenated data under coalescence. Systematic Biology 56:17-24.
LARGET, B. R., S. K. KOTHA, C. N. DEWEY, AND C. ANE. 2010. BUCKy: gene tree/species
tree reconciliation with Bayesian concordance analysis. Bioinformatics 26:2910-2911.
LARSEN, P. A., M. R. MARCHAN-RIVADENEIRA, AND R. J. BAKER. 2010. Taxonomic status of Andersen’s fruit-eating bat (Artibeus jamaicensis aequatorialis) and revised classification of Artibeus (Chiroptera: Phyllostomidae). Zootaxa 2649:45-60.
LERNER, H. R. L., M. C. KLAVER, AND D. P. MINDELL. 2008. Molecular phylogenetics of the
buteonine birds of prey (Accipitridae). The Auk 125:304-315. MATHEE, A. C. AND S. C. DAVIS. 2001. Molecular insights into the evolution of the family
Bovidae: a nuclear DNA perspective. Journal of Molecular Evolution 18:1220-1230. MAYER, F., C. DIETZ, AND A. KIEFER. 2007. Molecular species identification boosts bat
diversity. Frontiers in Zoology 4(4). MCALILEY, L. R., M. B. O’NEILL, AND R. J. BAKER. 2007. Molecular evidence for genetic
subdivisions in the desert shrew, Notiosorex crawfordi. The Southwestern Naturalist 52:410-417.
MCDONOUGH, M. M., L. K. AMMERMAN, R. M. TIMM, H. H. GENOWAYS, P. A. LARSEN, AND
R. J. BAKER. 2008. Speciation within bonneted bats (genus Eumops): the complexity of morphological, mitochondrial, and nuclear data sets in systematics. Journal of Mammalogy 89:1306-1315.
MOORE, W. S. 1994. Inferring phylogenies from mtDNA variation: mitochondrial-gene trees
versus nuclear-gene trees. Evolution 49:718-726. NESI, N., E. NAKOUNE, C. CRUAUD, AND A. HASSANIN. 2011. DNA barcoding of African fruit
bats (Mammalia, Pteropodidae). The mitochondrial genome does not provide a reliable discrimination between Epomophorus gambianus and Micropteropus pusillus. Comptes Rendus Biologies 334:544-554.
PALUMBI, S. R. 1996. Nucleic acids II: the polymerase chain reaction. Pp. 207-247 in
Molecular systematic (D. M. Hillis, C. Moritz, and B. K. Mable, eds.) 2nd ed. Sinauer Associates, Inc., Publishers, Sunderland, Massachusetts.
PETIT, E., L. EXCOFFIER, AND F. MAYER. 1999. No evidence of bottleneck in postglacial
recolonization of Europe by the noctule bat (Nyctalus noctula). Evolution 53:1247-58.

30
PRYCHITKO, T. M. AND W. S. MOORE. 1997. The utility of DNA sequences of an intron from the beta-fibrinogen gene in phylogenetic analysis of woodpeckers (Aves: Picidae). Molecular Phylogenetics and Evolution 8:193-204.
RONQUIST, F. AND J. P. HUELSENBECK. 2003. MrBayes 3: Bayesian phylogenetic inference
under mixed models. Bioinformatics 19:1572-1574. SANBORN, C. C. 1932. The bats of the genus Eumops. Journal of Mammalogy 72:658-668. SIMMONS, N. B. 2005. Order Chiroptera. Pp. 312–529 in Mammal species of the world: a
taxonomic and geographic reference (D. E. Wilson and D. M Reeder, eds.). 3rd ed. Johns Hopkins University Press, Baltimore, Maryland.
SPINKS, P. AND H. B. SHAFFER. 2007. Conservation phylogenetics of the Asian box turtles
(Geoemydidae, Cuora): mitochondrial introgression, numts, and inferences from multiple nuclear loci. Conservation Genetics 8:641-657.
STEPPAN, S. J., R. M. ADKINS, AND J. ANDERSON. 2004. Phylogeny and divergence-date
estimates of rapid radiations in Muroid rodents based on multiple nuclear genes. Systematic Biology 53:533-553.
SUZUKI, Y., G. B. GLAZKO, AND M. NEI. 2002. Overcredibility of molecular phylogenies
obtained by Bayesian phylogenetics. Proceedings of the National Academy of Sciences 99:16138-16143.
TAGLIARO, C. H., H. SCHNEIDER, I. SAMPAIO, M. P. C. SCHNEIDER, M. VALLINOTO, AND M.
STANHOPE. 2005. Molecular phylogeny of the genus Saguinus (Platyrrhini, Primates) based on the ND1 mitochondrial gene and implications for conservation. Genetics and Molecular Biology 28:46-53.
TAMURA, K., D. PETERSON, N. PETERSON, G. STECHER, M. NEI, AND S. KUMAR. 2011.
MEGA5: Molecular evolutionary genetics analysis using maximum likelihood, evolutionary distance, and maximum parsimony methods. Molecular Biology and Evolution 28:2731-2739.
TEELING, E. C., M. SCALLY, D. J. KAO, M. L. ROMAGNOLI, M. S. SPRINGER, AND M. J.
STANHOPE. 2000. Molecular evidence regarding the origin of echolocation and flight in bats. Nature 403:188-192.
TIMM, R. M. AND H. H. GENOWAYS. 2004. The Florida bonneted bat, Eumops floridanus,
(Chitoptera: Molossidae): distribution, morphometrics, systematics, and ecology. Journal of Mammalogy 85:852-865.

31
WARNER, J. W., J. L. PATTON, A. L. GARNER, AND R. J. BAKER. 1974. Karyotypic analyses of twenty-one species of Molossid bats (Molossidae: Chiroptera). Canadian Journal of Genetics and Cytology 16:165-176.
WEINS, J. J. AND M. C. MORRILL. 2011. Missing data in phylogenetic analysis: reconciling
results from simulations and empirical data. Systematic Biology 60:719-731. WEISROCK, D. W., S. D. SMITH, L. M. CHAN, K. BEIBOUW, P. M. KAPPELER, AND A. D.
YODER. 2012. Concatenation and concordance in the reconstruction of mouse lemur phylogeny: an empirical demonstration of the effect of allele sampling in phylogenetics. Molecular Biology and Evolution doi: 10.1093/molbev/mss008.
WILEY, E. O. AND B. S. LIEBERMAN. 2011. Characters and homology. Pp. 110-151 in
Phylogenetics: theory and practice of phylogenetic systematics. 2nd ed. John Wiley and Sons, INC., Hoboken, New Jersey.
WILEY, E. O., D. SIEGEL-CAUSEY, D. R. BROOKS, AND V. A. FUNK. 1991. The compleat
cladist: a primer of phylogenetic procedures. The University of Kansas Museum of Natural History: Special Publication 19:1-12.
YU, LI AND YA-PING ZHANG. 2005. Phylogenetic studies of pantherine cats (Felidae) based
on multiple genes, with novel applications of nuclear β-fibrinogen intron 7 to carnivores. Molecular Phylogenetics and Systematics. 35:483-495.

32
APPENDIX I List of specimens sequenced in this study.
GenBank accession nos.
Species Catalog no./Tissue no.a Locality Cytb ND1 βFib Eumops auripendulus ROM105526/F37759 Ecuador, Napo JQ731823 HQ671531 HQ671608 Eumops auripendulus TTU29815/TK12554 Costa Rica, Alajuela JQ731822 JQ765469 JQ765483 Eumops auripendulus CM46610/TK9384 Jamaica, St. Ann Parish JQ731824 JQ765470 JQ765482 Eumops dabbenei TTU33406/TK15063 Venezuela, Guarico JQ731806 JQ765456 HQ671609 Eumops ferox TTU52617/TK32052 Cuba, Guantanamo JQ731816 — JQ765488 Eumops ferox TTU47519/TK13585 Mexico, Yucatan JQ731820 JQ765463 JQ765487 Eumops ferox TTU47521/TK13589 Mexico, Yucatan JQ731809 JQ765462 —
Eumops ferox TTU52613/TK32033 Cuba, Guantanamo JQ731818 HQ671532 HQ671610 Eumops floridanus KU161933/RMT4618 USA, Florida JQ731811 — —
Eumops floridanus KU163657/RMT4611 USA, Florida JQ731810 HQ671533 —
Eumops glaucinus TTU33408/TK15248 Venezuela, Guarico JQ731819 JQ765459 —
Eumops glaucinus TTU80255/TK64163 Paraguay, Concepción JQ731817 JQ765464 JQ765484 Eumops hansae ROM108361/F43341 Guyana, Potaro-siparuni JQ731814 HQ671534 JQ765493 Eumops hansae ROM105642/F37887 Ecuador, Napo JQ731815 JQ765460 JQ765492 Eumops hansae TTU33409/TK15296 Venezuela, Miranda JQ731813 JQ765461 —
Eumops maurus ROM106326/F40481 Ecuador, Napo JQ731821 JQ765468 HQ671611 Eumops nanus TTU29308/TK12526 Panama, Chiriqui — JQ765477 —
Eumops nanus TTU47518/TK13559 Mexico, Yucatan JQ731832 JQ765476 —
Eumops nanus TTU47517/TK13558 Mexico, Yucatan JQ731826 JQ765471 JQ765481 Eumops nanus TTU47516/TK13557 Mexico, Yucatan JQ731829 JQ765475 JQ765480

33
APPENDIX.—Continued. GenBank accession nos.
Species Catalog no./Tissue no.a Locality Cytb ND1 βFib Eumops patagonicus TTU80582/TK64367 Paraguay, Neembucu JQ731830 HQ671535 JQ765491 Eumops patagonicus TTU62499/TK34937 Paraguay, Pte. Hayes JQ731833 JQ765472 JQ765490 Eumops patagonicus TTU80491/TK64850 Paraguay, Pte. Hayes JQ731831 JQ765474 JQ765489 Eumops patagonicus TTU80620/TK64364 Paraguay, Neembucu JQ731828 JQ765473 HQ671612Eumops perotis ASNHC13295/ASK6271 USA, Texas JQ731825 JQ765454 JQ765479 Eumops perotis ASNHC12238/ASK5379 USA, Texas JQ731805 JQ765455 HQ671613Eumops underwoodi TTU29311/TK12366 Nicaragua, Boaco JQ731807 JQ765457 HQ671614Eumops underwoodi TTU29322/TK12144 Mexico, Chiapas JQ731808 JQ765458 JQ765478 Eumops wilsoni TTU103278/TK134816 Ecuador, Guayas JQ731804 JQ765465 JQ765486 Eumops wilsoni TTU103466/TK134989 Ecuador, Guayas JQ731827 HQ671536 JQ765485 Nyctinomops macrotis ASNHC11533/ASK5445 USA, Texas JQ731803 HQ671549 HQ671619Nyctinomops femorosaccus ASNHC11528/ASK5446 USA, Texas JQ731802 HQ671548 HQ671620Tadarida brasiliensis ASNHC9561/ASK3904 USA, Texas JQ731812 JQ765466 JQ765494 Tadarida brasiliensis OMNH23758/OCGR1848 Argentina, Tucuman — JQ765467 —
Molossus ater ASNHC7008/FN32848 Mexico, Yucatan — JQ765453 JQ765495 Promops centralis ROM106020/F40274 Ecuador, Napo — JQ765452 HQ671615
aInstitutional acronyms: Angelo State University Natural History Collection, San Angelo, Texas (ASNHC); Royal Ontario Museum, Toronto, Ontario, Canada (ROM); University of Kansas Natural History Museum, Lawrence, Kansas (KU); Natural Science Research Laboratory, Museum of Texas Tech University, Lubbock, Texas (TTU); Sam Noble Oklahoma Museum of Natural History, University of Oklahoma, Norman, Oklahoma (OMNH); Carnegie Museum, Pittsburgh, Pennsylvania (CM).