Embed Size (px)
Citation preview

LB~-43273
Molecular Thermodynamics for Salt-Induced
Protein Precipitation
I). E. Kuehner, H. W. Blanch and J. M. Prausnitz
Department of Chemical Engineering
University of California
and
Chemical Sciences Division
Lawrence Berkeley National Laboratory
University of California
Berkeley, CA 94720, U.S.A.
May 1999
This work was supported by the Director, Office of Energy Research, Office of Basic Energy
Sciences, Chemical Sciences Division of the U.S. Department of Energy under Contract Number
DE-AC03-76SFOO098.

ABSTRACT
A mokcukr-thermodynamic model is developid for salt-induced protein precipitation the
model considers an aquleous solution of globular protein molecules as a s:ystem of
interacting hard spheres in a continuum pseudo-solvent (water and salt ions). l%e protein
molecules interact in a manner described by a set of sphericaUy-symmetric two-body
potentials of mean force. These include screened CMombic repulsion, dispersion (van der
Wads) attraction, and ion-excluded-vohnne osmotic attraction. Specific chemical
interactions between proteins (e.g., hydrophobic interactions and self-association) am
modekd with a short-range, orientationdependent attractive square-weU potentkd. An
analytical equation of state is derived using the Random Phase Approximation with the
hard-sphere fluid as the reference system and a perturbation based on the protein-protein
overall potential of mean force, while the short-range specific chemical intemction is
incorporated through the S/WI’ perturbation theory of associating fluids. This equation of
state, similar in form to the well-known van der Waals equation of state, provides an
expression for the chemieal potential of the protein and determines liquid-liquid phase
equilibria. Critical and spinodal criteria for salt-induced protein precipitation are derived,
and the dependence of critical points and protein volubility on model parameters is
examined. Salting-out phase-equilibrium data are described for two globular proteins, hen-
egg-white lysozyme and bovine cz-chymotrypsin, in solutions of ammoniurh wdf~ at
25”C. For both proteins, the SAFT parameters M, &,P,and V are correlated from the
Iysozyme precipitation data of Coen, et al. (1995). Cikulated Cohn-Edsall slopes relating
the protein solubllity to the solution ionic strength are greater than those measured in
precipitation experiments with lysozyme and chymotrypsin, indicating that ionic--strength-
dependent parameters are required for quantitative application of this modei to these
proteins.
2

DISCLAIMER
This report was prepared as an account of work sponsoredby an agency of the United States Government. Neitherthe United States Government nor any agency thereof, norany of their employees, make any warranty, express orimplied, or assumes any legal liability or responsibility forthe accuracy, completeness, or usefulness of anyinformation, apparatus, product, or process disclosed, orrepresents that its use would not infringe privately ownedrights. Reference herein to any specific commercialproduct, process, or service by trade name, trademark,manufacturer, or otherwise does not necessarily constituteor imply its endorsement, recommendation, or favoring bythe United States Government or any agency thereof. Theviews and opinions of authors expressed herein do notnecessarily state or reflect those of the United StatesGovernment or any agency thereof.

DISCLAIMER
Portions of this document may be illegiblein electronic image products. Images areproduced from the best available originaldocument.
1. INTRODUCTION
Predpitation has long been used as an early step in the process of pufifjing proteins from
complex solutions {Green,1931;Green,1932). ‘I%&technique has been applied to the Kzovery
of proteins such as insulh, diagnostic and industrial enzymes, human growth hormone,
and interferon (McGregor,1983). Phase sepamtion in aqueous protein solutions is achieved
through addition of precipitating agents, such as inorganic salts at high concentrations,
nonionic polymers, poIyeketro@tes, and organic solve~ @ster et al., 1973; &iiiE et d., WW,
Shih et al., 1992 Rothstein, 1994). Salting-out of prokins provides one of the simplest
precipitation techniques and is used extensively in the laboratory and in the biotechnology
and pharmaceutical industries.
ln most previous studies, sait-induceclprecipitation of proteins and other ecdloids has been
understood as phase separation resuiting in a solid precipitated phase in equilibrium with a
liquid phse containing protein at its saturation concentration (Rosenbmn et aZ.,M@ Tmres
aadSan&er,HW7). TraditionaUy, quantitative charaeterizadon has been expressed through the
protein solubllity, defined as the protein concentration in the equilibrium liquid phase. For
example, the chssieal Cohn and E&all approach (E&W 1%3)correlates protein volubility,
S, with solution ionic strength, 1, in a simple exponential mannec logS = #l-all, where/3
and A are empirieaIIydetermined parameters specific to a given protein and salt. Recent
experimental results (Shih et al., l-, Coen, 19%) suggest that sak-induced protein
precipitation may also be appropriately described as a phase separation resulting in two
fluid phases: a supernatant fluid phase lean in protei~ in equilibrium with a pnxipitate
phase rich in protein and containing appreciable amounts of water and salt. Aeeording to
this view, the degree of precipitation is charackxized by the distribution coefficien~ K.,
defined as the ratio of the protein concentration in the prdpitate phase to that in the
supernatant phase. Various experimental equilibrium salting-out studies have shown that
protein partitioning can depend strongly on protein si% initkd concentration, and surface
chemistry; on eketrolyte identity and ionic stren@, and on solution pH (Mwa and
Timasheff,198% Arakawaand TkashefF, 1984). Speeific interactions (e.g., dirnerization or
h~gher oligomeriation, or hydrophobic interactions) may also play a major role in
governing protein-protein interactions in precipitating soIutions.
To establish a rational basis for designing a protein-pivcipitation process, it is useful to
develop a model to provide a theoretical i%ameworkfor interpretation and corre~ation of
3

protein-precipitation data. Melander and Horvath showed that the fi.mctional form of the
Cohn-Edsall equation maybe interpreted on the basis of solvophobic (MeIanderail HoNiith,
1977). Recent theoretical studies have been &xted at developing more fundamental
models to amount, on a mokxxdar IeveI, for diverse interactions between the various
components in the protein solution. For example, lWibadevanand Hall presented a model,
based on Barker-Henderson perturbation theory, for protein precipitation by a :nonionic
polymer (MahadevanandHall, 1990;MahadevanandHall, 1992). Vlachy, Blanch and ~%msnitz
describe a model for polymer-induced liquid-liquid phase separation in soIutions ofeolloids
and globular proteins, based on the random-phase approximation (Vlaehy et d., 1993).
However, these recent theoretical studies are eoncemed with aqueous solutions where the
electrolyte concentration is less than 0.1 molar. Experimental studies clearly show that
protein precipitation by salts typically requires electrolyte concentration in the range 1-10
molar.
This work presents a molecular-thermodynamic model for protein precipitation by
inorganic salts. Particular attention is given to highly concentrated salt solutions. The
procedure employed here represents the ternary solution (protein, electrolyte, and water) as
a one-component system containing globular protein molecules immersed in a continuous
pseudo-solvent. The pseudo--solvent is an aqueous salt solution. The effect of pseudo-
solvent chemistry (i.e., pH, salt type and ionic strength) on protein-protein intemctions is
taken into account through the strong infhience that it exerts on the foIlowing protein-
protein interactions: Cou[ombic (charge-charge) repulsion, dispersion (van der Waals)
attraction, ion-excluded-volume (or osmotic) attraction and interactions between exposed
hydrophobic groups on the surfaces of two or more protein molecules. Despite its
simplicity, the one-component representation has been successful in explaining some
experimental properties of colloidal dispersions (Grimsm, 1983) and globular-protein
soh.itions (VIaehyet al., 1993; Chiew et d., 1995; Kuehneres aL, 19%; Tavares and Sandier, lW,
Curtis et d., 1998). A powerful advantage of this representation is that final results 2ue given
by analytical equations based on statistical-mechanical theories.
Two-body potentials of mean force are discussed in Section 2. Section 3 presents a
derivation of the moIecular-thermodynamic equation-of-state model for protein solutions,
based on the random-phase approximation (RPA) and the statistical associating fluid theory
(SAFT’). ResuIts of model calculations and comparkn with experimental pnxipitation
data are presented in Section 4,
4

2. PROTEIN-PROTEIN POTENTIAL OF MEAN FORCE
In the one-component model, aqueous solutioti of globular proteins are represented by a
mormdkperse assembly of spherical non-interpenetrating spheres of diameter CP which
interact through effective solvent-dependent potentials of mean force (PMFs). The overall
potential of mean force, W(r), between protein molecules is given by the sum of five
potentials of mean force
W(r) = WA$(r)+ Wqq(r)+ Wdi#j + W...(r) + w,P(r,@ (1)
where r is the center-to-center distance between proteins. Here, Wh$r) is the hard-sphere
potential, WJr) is the repulsive screened electricdouble-layer potential of mean force,
WdiJr) is the attractive dispersion potential of mean force, and WoJr-) is the attractive
potential due to ion-excluded-volume effects. These four terms are spherically symmetric
potentials of mean force which depend on the center-~nter distance betwtxm proteins,
on the properties of the protein molecules, and on the solvent chemistry (e.g., pH and ionic
strength). WJr, co)represents attractive specific interactions between exposed groups on
the surfaces of the proteins these may include hydrophobic interactions and shoti-range
attractive electrostatic interactions. This potential depends not only on r but also on relative
molecular orientation, indicated by co.
2.1 Hard-Sphere and Coulornbic Potentials
The hard-sphere and repulsive screened Coulombic potentials of mean force between
proteins, normalized with respect to the thermal energy kg, are represented by:
Wh,(r) = cu r< ap
=0 r> op
Wqq(r) (zPe)2 exp[+c(r - crP)]
‘=- r-(l+KOP 12)2kBT r> q
(2a)
(2b)
(2C)
5

where k~denotes Boltzma.nntsconstant, and T is the absolute tempeti, zPeis the charge
on the protein, where ZPis the protein valence and e is the elementary unit char,ge; 4=s0
represents the d~electric permhtivity of vacuum in units of C/Vin and c, is the ioNc-
strengthdependent dielectric constant of the salt-water continuum pseudo-solven~ K is the
Debye screening parameter, given by & = (2&ZVJ)/(q+#J’); NA is Avogadro’s numbe~
and ionic strength 1 = 0.5 z cmz~, where c. and ~ are the molar concentration and
valence of ion m, respectively.
The value of WqJr) depends on the ionic strength of the solution, as shown in Hgure 1,
where W#) is plotted as a function of the center-to-center distance between protein
molecules, r, normalized by the protein diameter, OP. In Figure 1, Op= 50~ and .ZP= 10.
As ionic strength increases, the electric double layer surrounding the protein molecule
compresses and the effective charge-charge interaction between proteins is screened. Also,
the protein valence, ZP,depends on protonation states of the various constituent amino acids
which have hydrogen-ion equilibria, hence the protein will have an effective net charge
which depends on the solution plil. Each protein has an isoelectric poin~ pI$ where the net
charge is zero; hence, at the pI, Wqq(r)= O. The net protein charge is a model parameter
obtained from independent experimental data.
The Coulombic potentkd of mean force accounts for long-range repulsive charge-charge
interactions between protein molecules present in dilute concentrations. The derivation of
this potential assumes that the charge of the protein is evenly distributed over the surface of
the molecule. In reality, protein surface charges, both positive and negative, are discrete
and are located at sites possessing hydrogen-ion equilibria. In the dilute-protein limi~
where the average separation between protein molecules is large (up to severai protein
diameters), the approximation of evenly-distributed surface charge is acmptable.
However, for concentrated-protein solutions (where precipitation or crystallization may
occur), the protein molecules am much more closely packed in solution, and shofi-range
attractive electrostatic intemctions between oppositely charged moieties on the protein
surface become more important, and this assumption is no longer valid. These specific
interactions are accounted for in WJr, co), as discussed below.
6
I
Furthermore, WJr) is derived within the Debye-Hiickel framework using a linearized
form of the Poisson-Bokzrnann equation for the electrostatic potential around the sphericai
charged protein molecukq this assumption is valid only in solutions where the ionic
strength is 0.1 M or Iess. Application of Wqq(r)to solutions with higher ionic strengths is
an extrapolation. However, for ionic strengths greater than approximately 0.5 M, this
potential is screened so strongly that it has oniy a negligible contribution to the total
potential of mean force. Higher-order electrostatic interactions, i.e., between charges and
permanent dipdes, are not considered here, since they are genemlly much weaker in
magnitude than Wqq(r)and are strongly screened by salt.
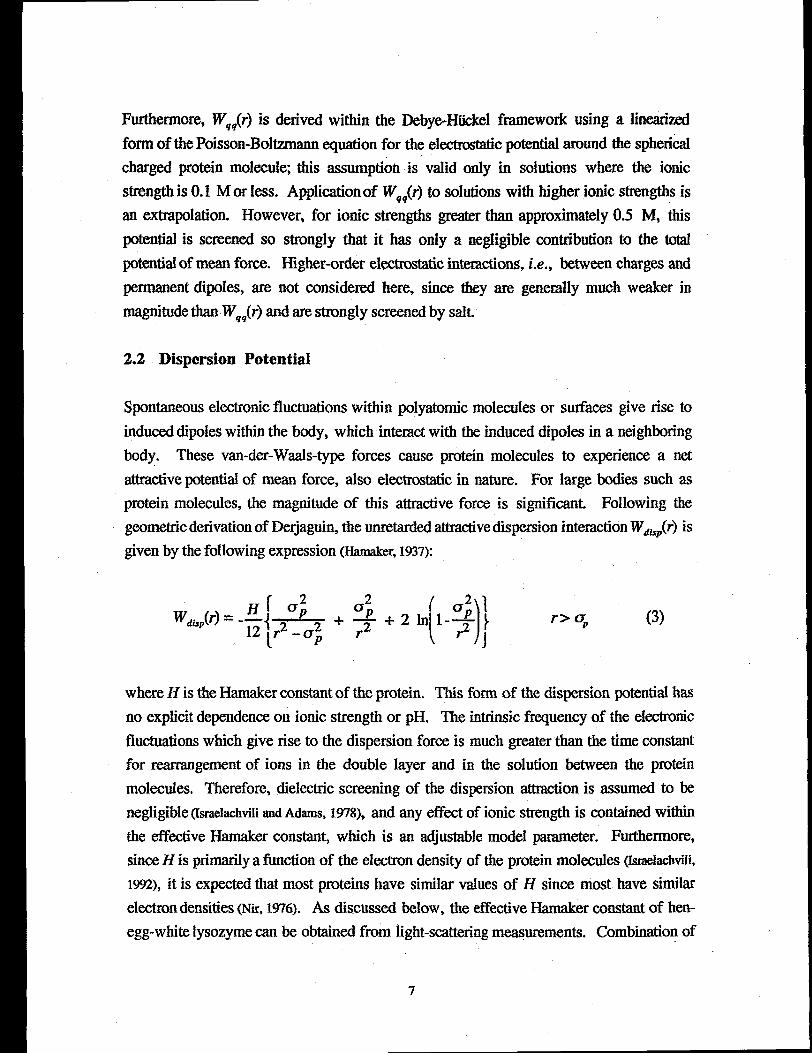
2.2 Dispersion Potential
Spontaneous electronic fluctuations within polyatomic molecules or surfaces give rise to
induced dipoles within the body, which interact with the induced dipoles in a neighboring
body. These van-der-Waals-type forces cause protein molecules to experience a net
attractive potential of mean force, also electrostatic in nature. For large bodies such as
protein molecules, the magnitude of this attractive force is significant. Following the
geometric derivation of Derjaguin, the unretarded attractivedispersion interaction WdiJr) is
given by the following expression @maker, 1937’):
(3)
where His the Munaker constant of the protein. This form of the dispersion potential has
no explicit dependence on ionic strength or pH. The intrinsic frequency of the elecbxmic
fluctuations width give rise to the dispersion force is much greater than the time constant
for rearrangement of ions in the double layer and in the solution between the protein
molecules. Therefore, dielectric screening of the dispersion attmction is assumed to be
neg@ibIe (1.melachvihandAdams, 1978), and any effect of ionic strength is contained within
the effective Hamaker constant, which is an adjustable modei parameter. Furthermore,
since His primarily a fimction of the electron density of the protein mokcules @aelaclwiIi,
1992),it is expected that most proteins have similar values of H since most have similar
electron densities (Nk, 1976), As discussed below, the effective Harnaker cunstant of hen-
egg-white lysozyme can be obtained from light-scattering m~urements. Combination of
7

I
Wgq(r)and WdiJr) form the basis of the I)ergajuin-Landau-Verwey-Overbeek (DLVO)
th~ry of colloidal stability (VerweyaudOverbeek,1!348).
2.3 Ion-Excluded-Volume Potential
h concentrated ekct.rolytesohitions, ions occupy a significant fraction of the total solution
volume. When two protein molecules approach conta@ ions are excluded from a region
between the protein particles; the geometry of this mechanism is shown in Figure 2. The
resulting imbalance in the local osmotic pressure exerted by the ions on the proteins gives
rise to a short-range attmctive force. The area of the plane of ion exclusion can be
calculated in terms of the diameter of the protein, OP,the average diameter of a salt ion,
GiOm,and the center-to-center separation, r. Multiplying this area by the osmotic pressure of
the corresponding protein-free salt solution, fla~~,yields the
respect to r, the ion-excluded volume potential, WO&), is
19*, AsakumandOosaw&1958X.
= o
where OP.= (~ + qon)/2 and the composition-weighted
force. When integmted with
given by (Asakuraand00sawiL
r< (OP+ q)
r2 (Op-1-Op) (4)
average ion diameter q.OX=
(~c.,~~ + ~..cQv, where v.a and Vanare the stoichiornetric coefficients of the cation and
anion, respectively, and v = v==,+ v=.. The osmotic pressure of the protein-free salt
solution is obtained from the literature in terms of the [email protected] @O=~,which is a
measure of the non-idealify of the salt solution, by 1(0= = @O~m~~= @O,~@,kJ), where
the total ion number density, p=, is given in terms of the molar salt concentration, C$,by
P.= c~~v. WoJr) is a short-range attractive potential of mean force which becomes
significant at high ionic strength, as shown in Figure 3. In Figure 3, protein diameter OP=
30~. The salt is ammonium sulfate: hydra@d ionic diameters are UC.= 6.62A and O=.=
8

7.58A (Horvath,1985), and values of the osmotic coefficien~ @O~m,for ammonium sulfate
solutions were taken from the Iitemture (~egg et A, N?%)(see Appendix B). In the
derivation of equation (4), salt ions are considered uncharged hard spheres; electrostatic
effects are assumed to be taken into account in @Omand W,,(r).
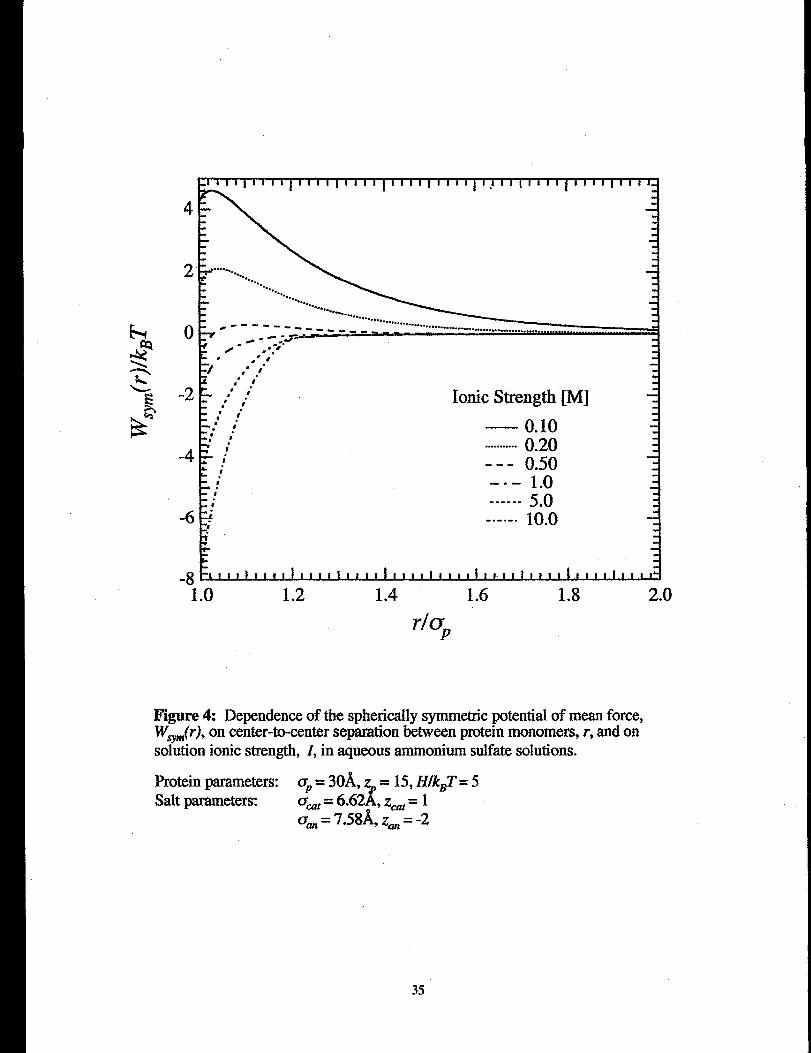
Figure 4 shows the spherically-symmetric potential of mean force, tVV&), composed of
~JO + ~~i,P(O+ ~O,m(~),m a function of rfaP for several values of ammonium-sulfate
ionic strength. In Figure 4, UP= 30& ZP= 15 and H/kBT= 5, and the salt is ammonium
sulfate. At low ionic strength a repulsive barrier exists due to WJr). As ionic strength
increases, W&j diminishes due to dielectric screening, and the magnitude of the ion-
exch.tded-vohune potential WO$m(r)increases. For ionic strengths greater than 1.0 M,
Ww(r) is uniformly attractive with a steep attractive well near surface contac~ at extremely
high ionic strengths, tlds represents a strong driving force for protein aggregation and
precipitation.
The effect of solution pfl on Ww(r) is solely through the pH dependence of the protein
vaIence, ZP,in the scre,enedCoulombic repulsion potential of mean force. Hence, any pH
dependence of Win(r) diminishes as ionic strength increases. In dilute protein solutions at
low ionic strength, WV(r) describes well the pH dependence of the osmotic second virial
coefficient (Curtiset d., 1998)and of the average apparent difision coefficient of proteins in
aqueous solutions (Kuekeret d., 1997). However, protein-precipitation data in concentrated
salt solutions often show a significant dependence on solution pH (Shibef al., 199%Coen,
w!%) beyond that captured in Ww(r). As discussed below, the specific interaction
potential, W#, CO),contains parameters which are pH dependent and are obtained from
experimental data.
2.4 Specific Interactions
Specific interactions between proteins are known to occur in solutions where crystallization
or precipitation phase transitions occur. These additional forces include hydrophobic
interactions and short-ranged electrostatic interactions between surface groups, which
depend on the rekitive orientation of the two protein molecules. The hydrophobic
interaction between between exposed non-polar amino-acid residues on the surfaces of the
protein molecules is, in general, attractive, short-ranged, and orientationdependent.
9

Hydrophobic “bonds” are formed when hydrophobic groups on separate protein molecules
come into contact and may cause association or agjyegation of proteins. Similarly,
attractive charge-charge couplings between oppositely-charged groups on the surfaces of
two protein molecules, as well as salt bridges in solutions with divalent ions, can form in
concentrated protein solutions. Although short-rang~ these can affect protein volubility.
In this work, specific interactions are represented by a potential model used for associating
fluids (Jackson et aL, 1988). The shapes of these specdlc-interaction sites are idealized as
“circularpatehes” or “sphexica.1caps” located on the surface of the protein molecules. As
indicated in Figure 5, interaction potential WJr, @ between site A on the surface of protein
1 and site B on the surface of protein 2 is defined as an orientationdependent squw-well
potentiak
Wp(?-,co) &w—=. —
kBT kBTif r<rcand
=0 otherwise
Hence, two “patches” on two different paiticles
/)1 < (jJ,c~(j (+ s 02,=
((5)
are considered to form a “bond” if the
centers of the two particles are within a critical distance, rC, and if the two patches am
within the constraints of relative orientation, defined by the critical angles 61,Cand f?z,c. In
general, these quantities are not known. Fortunately, the thermodynamic properties of
systems with this type of interaction can be described in terms of quantities that are known
or can be estimated from physicochernical data for proteins, as described below.
3. LIQUID-STATE THEORY AND EQUATION OF STATE
Having established and defined pertinent potentials of mean force, it is necessary to
construct a molecular-thermodynamic model which relates these potentials to macroscopic
thwmmdynamicproperties. In this work, that model is based on perturbation theory. The
center-to-center spherically symmetrical Coulornkic, dispersion and ion-excluded-volume
interactions are incorpmatied into the model in the context of the mndom-phase
approximation (RPA), described in Section 3.1. The contribution of the orientation-
dependent specific interaction potential is included through a first-order perturbation theory
of associating ffuids, the statistical associating fluid theory (SM1.J, described in !Rxtion
10

3.2. The RPA-SAFW equation of state, which combines both these contributions, is
presented in Seetion 3.3.
3.1 Random-Phase Approximation
The Random-PhaseApproximation(WA) has been used previously to model the str!Klure
factorof colloid solutions (GrimsoIL 1983)and to describe liquid-liquid phase separation of
proteins due to addition of polymers (MahademnandHalL199QMihadevanandHall, 1992;Vlachy
et al., 1993). In the RPA, an assembly of hard spheres is used as the reference system,
while the spherkxdly symmetric interactions are treated as perturbations. Thermodynamic
properties of the system are obtained from liquid-state integral-equation theory. The basis
of this framework is the Ornstein-Zernike (02) equation describing two-body interactions
between particles in.a monodkperse, isotropic fluid (ChnsteinandZernike,1914):
In this
h(~l~ = ~~12)+ &(r13)h(r23)&23 (6)
formal representation, the interaction betsveen molecule 1 and molecule 2 in the
fluid, characterized by the total correlation ilmction l@IJ, is composed of two
contributions: the direct interaction, given by the direct correlation function c@J, and the
indwt interactions transmitted from 1 to 2 through interaction with one other molecule
(labeled molecule 3). Higher order terms, for instanm interactions between molecules 1
and 2 tmnsmitted through two other particles (i.e., molecules 3 and 4) are assumed
negligible. Therefore, the physical meaning of the 02 equation is that the total intemction
for a two-body interaction is composed of the direct correlation, plus the density-weighted
sum of 1-2 interactions tmnsmitted through all other particles 3. Here, p is the number
density (number of molecules per unit volume) of the molecular fluid. Through equation
(2.6) the intemctions between ali molecules in the fluid are coupled. In a monodkperse
isotropic fluid, rlz, rlj and rzj are replaced simply by r, the center-to-center distance
between molecules. The direct correlation function h(r) is related to the potential of mean
force between mokwuks through the following definition (McQuarrie,1976):
h(r) + 1 = g(r)= exp[-WY(r)/k8~ (7)
11

I
whereg(r) is the pair-correlation function, or radial distribution function, which rellatesthe
spatially-varying concentration of moiecules in the tlui~ p(r), to the average concmtration
p, by the following: p(r)= pg(r).
The connection of the 02 equation to thermodynamic properties of solutions comes from
performing a Fourier transformation on equation (6), resulting in
.
1- p(?(k) = -———&—1+ pzl(k)
(8)
where ~(k) and i$(k) represent the Fourier analogs of c(r) and h(r), respectively. By
Fourier-transforming in the limit k = O(which corresponds to taking a volume integral), tie
thermodynamic pressure and chemical potential may be obtained from the isothermal
compressibility relation for a one-component fluid
1- pe(o) ‘+%=$(:), (9)
The random-phase approximation consists of defining the direct correlation function, c@),
as
where ch,(r) is the dhect correlation fhnction for the hard-sphere reference system. This is
most valid in the limit of small Ww(r) and low mokcular concentmtion, p. Fourier
transformation of equation (10) in the k = O h-it and integmtion of equation (!?) with
respect to p yields the following expressions for the pressure and residual chemical
potential of protein in solution
(11)
(12)%es,RPA f% PU—=— -.
kBT kgT + kBT
12

where Ph$,and pk$are the pressure and chemical potential, respectively, of the hard-sphere
reference system. The contributio~ to the pressure and chemical potential from the
spherically-symmetric interactions am given by the terms in equations (11) and (12)
containing the RPA perturbation energy, U, defined as the volume integral of the
spherically-symmetric potential of mean force
Because U is an energy per unit density, it is independent of protein
depends only on potentials of mean force between protein molecuies.
(13)
concentration, U
The hard-sphere
reference terms are given by the standard Carnahan-Starling forms (&n&m andStarling,
“1970]
(14)
(15)
where the protein packing fraction q = (m/ 6)pr#. This theory is applied to proteins in
aqueous salt solutions within the context of the McMiliau-Mayersolution theory (Hill,1%0),
in which the potent.kdof mean force between particles immersed in a solvent is analogous
to the pair potential for non-ideal gases interacting through a vacuum.
3.2 Statistical Associating Fluid Theory
The contribution of the orientation-dependent specific interactions to the residual Helmholtz
energy and pressure of the system are evaluated using the first-order perturbation theory of
associating fluids formulated by Wertheim (wertheim,19s&vwertheim, 1986b),extended to
mixtures by Jackson and co-workers (JacksoIIet af., 1!?s8). At a given protein number
density, p, the StatisticalAssociating Fluid Theory (SAFT) gives the residual Helrnholtz
free energy of the associating system relative to that of the non-associating reference
13
system. The refenxwe system is an assembly of non-aggregating protein mokxxdes that
interact through the spherimliy-symmetric potential of mean force, Ww(r).
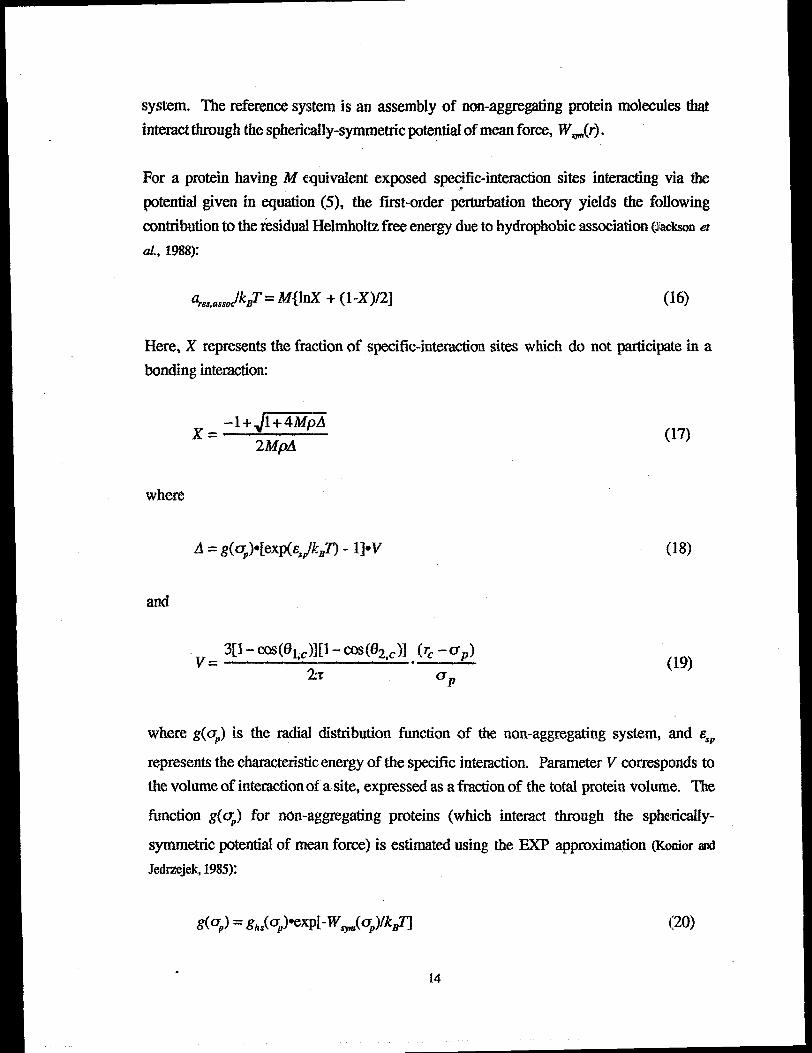
For a protein having M equivalent exposed spec~tic-intenwtion sites intemcting via the
potential given in equation (5], the first-order perturbation theory yields the following
contribution to the rksidual Helmholtz free energy due to hydrophobk association (~’acksonet
d., 1988):
a,e~,~,JkBT=M{lnX + (1-X)/2] (16)
Here, X represents the fraction of specific-interaction sites which do not participate in a
bonding interaction
-1 + Jmpxx=
2MpA —(17)
where
A = g(q>[exp(s#Bq - lIoV
and
(18)
3[1- c0s(f34.)][1- COS(~2,C)l(~ -Q‘v= .—
23T(19)
‘P
where g(@ is the radial distribution function of the non-aggregating system, and s~P
represents the characteristic energy of the specific interaction. Parameter V corresponds to
the volume of interaction of a site, expressed as a fraction of the totaI protein volume. The
fimction g(@ for non-aggregating proteins (which interact through the sphericaliy-
syrnmetric potentiai of mean force) is estimated using the EXP approximation (Kcmiorand
Jedrzejekj1985}
(20)
.14

where g~$(@ is given by the contact value of the Camahan-Starling expression for the
hard-sphere radiaI distribution functiom
1-?7/2gh,(cp) = —
(1-q)s(21)
The first-order perturbation theory of association assumes that the interactions between
specific-interaction sites on different molecules are independent and that no ring structures
are formed. The standard thermodynamic relation P = -(&4/ilV’)~ yiekis the associating-
fiuid contributicmto the total thermodynamic pressmw
(22)
The associating-ffuid contribution to the residual chemical potential of protein is obtained
from equations (16) and (22):
y=+.++%(:)&)}”l%es,amoc
3.3 Equation of State for Associating Protein Molecules
(23)
Combining equations (11) - (23) using the thermodynamic relation p,JkJ = a,JkBT +
P/pkBT - 1 yields the RPA-SAFI’ equation of state and expressions for the residuaI
Hehnholtz free energy and excess chemical potential of aqueous protein solutions:
15

{
p-p” q(8-9q+3q2)+ PU ~M ~X; 1-X (~_~ . ~\—=—. .kBT (1-q)s kBT 2 )(‘lx 2 MT
+hl,f)
(26)
Here, the ideal-gas chemical potential pi8/kBT= y*/kJ + inp, where p“ is a function only
of temperatunx p“ lkBT= ln(A3);the deBroglie wavelength A = ~~-, where h is
Planck’s constant and m is the mass of the protein molecule.
The number of specific-interaction sites, M, the interaction energy, &~P,and the intmaetion
volume, V, win be estimated from relevant physicoehemiea.1data for the protein of interest
or correlated from a reasonably small set of precipitation data, as described below.
4. PHASE EQUXLIBRHJM IN PROTEIN SOLUTIONS
4.1 Critical Points andl S pinodal and Coexistence Curves
The Spinodd criterion for a one-component sohdion is (Rausnitzet al., 1986):
-(#)T=(;)T=o (27)
where A is the Hehnh&z free energy of protein and V is system volume. At the critical
point, in addition to equation (27), the following criterion also applies:
-($)T=($]T=OThe partial differentials of the pressure with respect to density for the RPA-SAFT equation
of state (24) are derived in Appendix A. At equilibrium, protein concentrations in the
supematant and dense-fluid phases are calculated from equations (24) and (26) based on
the classical equilibrium editions:
16
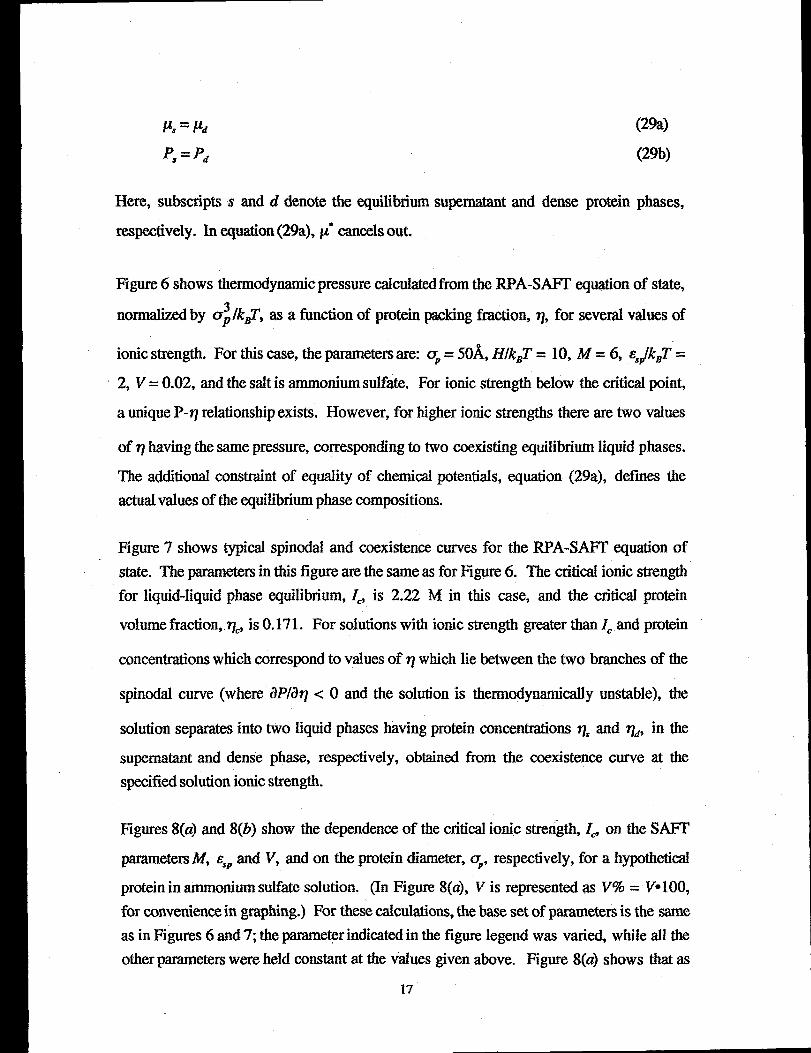
~s=pd (2%)
P,= Pd (29b)
Here, subscripts s and d denote the equilibrium supernatant and dense protein phases,
respectively. In equation (29a), p“ eaneels out.
Figure 6 shows thermodynamic pressure ealcukt.edfiom the RPA-SAFI’ equation of state,
normalized by @~, as a function of protein packing fkaction, q, for several values of
ionic strength, For this case, the parameters are CP= 50& HJk# = 10, M =6, qJkJ’ =
2, V= 0.02, and the saIt is ammonium sulfate. For ionic strength below the critical poin~
a unique P-q relationship exists. However, for higher ionic strengths there are two values
of q having the same pressure, corresponding to two coexisting equilibrium liquid phases.
The additional constraint of equality of chemical potentials, equation (29a), defines the
aetwdvalues of the equilibrium phase compositions.
Figure 7 shows @pied spinodal and coexistence curves for the RPA-SAFT’ equation of
state. The parameters in this figure are the same as for Figure 6. The died ionic strength
for liquid-liquid phase equilibrium, 1=,is 2.22 M in this case, and the critical protein
volume ilaction,. qC,isO.171. For solutions with ionic strength greater than lCand protein
concentrations which correspond to values of q which lie between the two branches of the
sphmdal curve (where ilP/~q <0 and the solution is thermodynamically unstable), the
solution separates into two liquid phases having protein Coneentmtions q. and qd, in the
supernatant and dense phase, respectively, obtained from the coexistence curve at the
specified solution ionic strength.
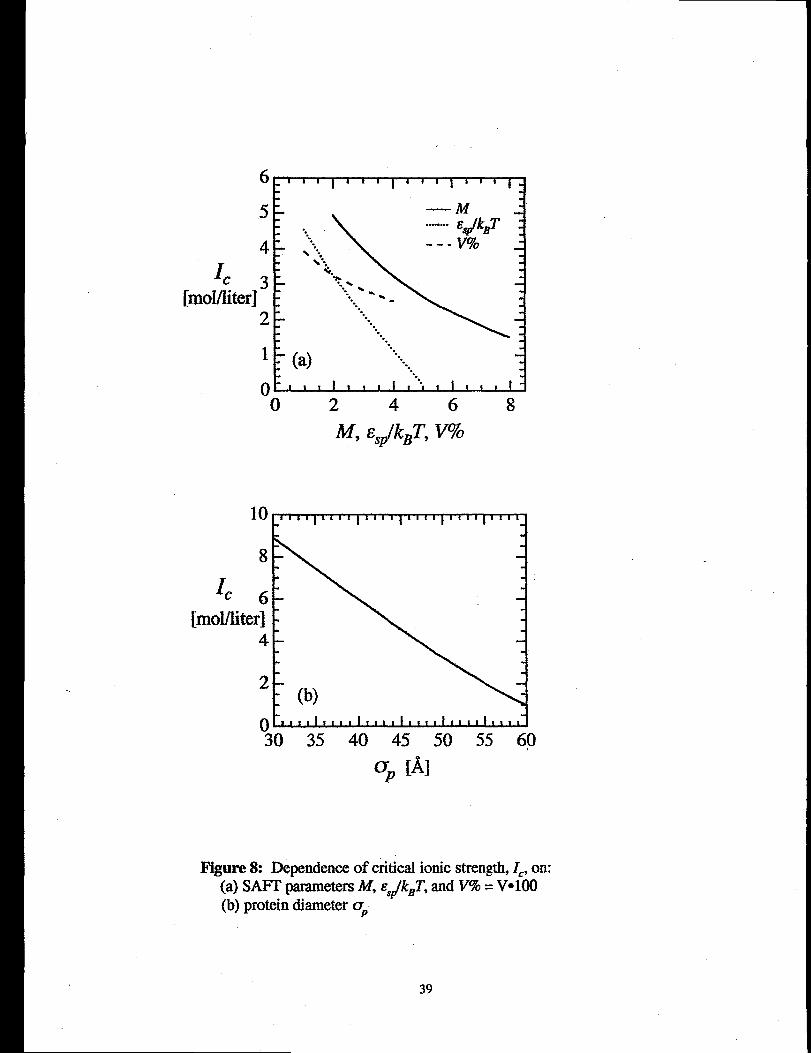
Figures $(a) and 8(b) show the dependence of the critical ionic stre&th, 1=,on the SAFT
parametem M, s~pand V, and on the protein diameter, Op,respectively, for a hypothetical
protein in ammonium sulfate solution. (h Figure 8(a), V is represented as V% = V“100,
for convenience in graphing.) For these ealcuiations, the base set of parameters is the same
as in Figures 6 and 7; the pammeter indicated in the figure legend was varied, while all the
other parameters were held constant at the values given above. 13gure 8(a) shows that as
17

the value of any of the SAFT parameters increases, attractive specific interactions increase,
and hence the critical ammonium sulfate ionic strength required to induce precipitation
decreases. The strength of the specific interaction, E,P,and the number of interaction sites,
M, have a stronger effect on 1=than does the interaction volume, V. The protein diameter,
OP,has the strongest effect on IC: for a protein with diameter of 30~, 1== 9 M, while for a
60~ protein, only 1 M armnonium-sulf~ ionic strength is required to cause phase
separation. This is due entirely to ion-excluded-volume forces. Consider Figure 2 as the
protein diameter increases, the plane from which ions are excluded also increases in area
when the two protein molecules approach surface contact. Hence, there is a larger area
over which the osmotic pressure imbakmceacts, increasing the attractive force at any given
ionic strength and resulting in a lower Z=required to induce precipitation. This phenomenon
-- that larger proteins precipitate at lower ionic strength than smaller proteins -- has been
previously observed in experimental salting-out protein-precipitation studies (~~bertsson,
198@Shih et al., 199%Coen, 1995).
For precipitating systems, two quantities of primary interest in comparing
predictions to experimental phase-equilibrium data w the supernatant
model
protein
concentration, often equated with the protein apparent volubility, S, expressed herein terms
of the supernatant-phase protein packing fractio~ q=(recall, q, = m/6p,~~, where ,pXis the
protein number concentration in the supernatnnt phase); and the equilibrium partition
coefficient, K,, defined as K=’=q~q~, where q~ is the equilibrium protein packing fraction
in the dense (p~cipitated) phase. Figures 9 through 12 examine the effect of varying the
SAFI’ parameters and the :proteindiameter on calculated phase-equilibrium compositions.
Again, the base set of parameters is the same as in Figures 6, 7 and 8; the parameter
indicated in the figure legend was varied, while all the other parameters were held l-cnstant
at the values given above. In Figures 9 and 10, an increase in ionic strength results in a
decrease in q,, indicating greater partitioning into the dense phase. Furthermore, as any of
the SAFT parameters increases at a given ionic strength, the magnitude of the attractive
specific interactions increases and the equilibrium supernatant protein packing fkaction
decreases. As shown in Figure 10(b), protein diameter, o,, has the most significant eff’t
on protein volubility, and interaction volume, V, has the weakest influence.
18

Figures 11 and 12 show that the equilibrium prom-n partition coefficient, K., increases
exponentially with increasing ionic strength. ASshown in Figures 9 and 10, increasing the
values of the SAIW pmameters increases the amount of attraction between protein
molecules and results in ligher protein partition coefficients. Similarly, larger proteins
show much greater partitioning than smaller proteins at any given ionic strength above the
critical value. Also, l%gures 11 and 12 show that the RPA-SAFI’ model has the power to
describe equilibrium protein partition coefficients with vabs from 1 (near the critical point)
up to values on the order of Id, which corresponds to essentially complete protein
precipitation, using ~onable values of model parameters at experimentally relevant salt
concentrations.
4.2 IIen-Egg-White Lysozyme Precipitation
Figure 13 shows experimental precipitation data (C= 1995) for hen-egg-white Iysozyme
(points) in ammonium-sulfate solutions, for pll between 5 and 8 and ionic strength
between 5 and 9 mokd, aiong with values of K. cdcuhtedfrom the RPA-SAFT equation of
state for the same solutions (dotted lines). While the experimental equilibrium partition
coefficient increases with ionic strength, no dependence on pH is observed at any ionic
strength shown in Figure 13. The potential-of-mean-force model incorporates pH
dependence only through the screened Coulombic repulsion potential, Wqq(r). For ionic
strengths above 1 mokd, the contribution of long-range macromolecular Coulombic
repulsion to the total spherically-symmetric potential of mean force, Win(r), is negligible
due to dielectric screening; therefore, the RPA contribution to the thermodynamic properties
of the system is independent of pl%
However, equilibrium partitioning at high ionic strength does depend on the solution pH
for most proteins. This includes lysozyme at pH c 5, Iysozyme K=increases significantly
with decreasing pH at all ionic strengths [data not shown; see [Coen,199s}]. Chym@rypsin
partition coefficient also increases with decreasing pm .as shown in Figure 16(u). There
are several possible physiochemical reasons for this observation. Partial denaturation in
acidic conditions may make the protein more prone to precipitate. As the protein denatures,
its eff’ve hard-sphere diameter DPincreases. As shown in Figure 12(b), for a given
ionic strength, larger proteins precipitate more readily than smaller proteins. Also, with
partial denaturation comes the possibility of greater solvent exposure of hydrophobic
amino-acid groups which are normally sequestered in the interior of the protein, when in its
19

native conformation. Increased hydrophobic interactions can enhanee protein aggregation
and precipitation. Furthermore, at low pH, sigrtii%antanion binding may occur (chrr, 1953;
Przybyeienand Bailey, 1989), altering the surface chemistry and attenuating short-range
ekdmstatic interactions. In high-ionic-strength solutions, there may be little free water of
hydration available to the protein molecides. Desolation of the protein can lead to
eonformational shifts and changes in surface chemistry, which may provide an ionic-
strength dependence to protein partitioning beyond what is accounted for in the spherically-
syrnmetric potential of mean force. Whether this change favors”increased or deereased
partitioning depends on the specific protein and salt under consideration. In the context of
the RPA-SN?T description of salting-out phase equilibrium, ali these protein- and salt-
spedlc effeets are accounted for by correlating pH- andor ionic-strength-dependent values
of the SAFT parameters from a set of experimental precipitation data.
In applying the RPA-SAIW model to precipitation&a of the type shown in Figure 13,
physical insight is required in choosing appropriate values of the SAFI’ pammeters M, E~p,
and V. Here, M is assigned the value of 6 for Iysozyme, enabling the formation c)f large,
dense’aggregates; V is taken to be 0.03, or 3%of the totalmolecularvohune per interaction
site. The specific-interaction energy, e~P,is Wowed to vary and is regressed from the
experimental precipitation data. The potential-of-mean-force parameters for lysozyme are
taken from earlier work (Kuehneret d., 1997] the Hamaker constant (which depends on
neither pH nor ionic strength), H/kBZ’= 8.9, and the protein net valence, ZPis obtained
from extrapolation of lysozyme titration curves titration cnrves (Kuehneret uZ.,1998).
Figure 14 shows the values of the speeific-interaction energy, S,P, regressed from the
average values of the equilibrium protein partition eoefficien~ JKe,=vg,shown in Figure 13.
S$Pdecreases in a linear fashion with increasing ionic strength. This is an empirical
regression and reflects the “true” interactions oeeurring in this system only to the extent that
the physics included in the RPA-SA17T model are correct. Whhin these physical
assumptions, Figure 14 implies that as ionic strength increases, ion-excluded-volume
forces grow rapidly enough that a decr~e in the specific-interaction energy is required to
—
1Inaddition,speeificioneffeetsonproteinipteraetionsandsoluhilityhavebeenwellstudiedandanalyzedtheoretically(llofmeister,1888;Grr, 1953;Carr,1953;Melanderandllorvath,1~, AmkawaandTimasheff,198%ArakawaandTimasheff,1984ArakawaandTiieff, 1985;Ries-KauttandDucruix,1989;Ries-Kauttand Ducruix,1994 Corm,1995;CurdSet d., 1998) but m not discussedin the contextof this work,whereammoniumWfate is the only salt examined
20

describeaccurately the experimental equilibrium protein partition coefficient in ammonium-
sulfate solutions.
Figure 15 examines the ionic-strength dependence of the equilibrium protein pardtion
coefficient of lysozyme in ammonium-sulfate solutions at pH 8.0. Figure 15@) shows
experimental values of JC.in logarithmic scale, along with calculated partition coefficients
for two different vttlues of &~P,where S$Pis held constant with respect to ionic strength.
Both the experimental and the calculated values of ~~ foilow classical Cohn-Edsall behavior
@dsdl, 1943),where the protein volubility (expressed here as ~~) exhibits au exponential
dependence on the ionic strength. However, the slope of the experimental line is smaller
than that of either of the two calculated lines. The values of Ife calculated using q~k~ =
4.0 match the experimental values better at lower ionic strengths but overpredict
partitioning as ionic strength approaches”9 mokd. Conversely, the values of E= calculated
using qJkBT = 3.8 match the experimental values well at high ionic strength, but
underpredict partitioning at lower ionic strengths. This subtlety is not easiiy seen in Figure
15(b), where the same values of K. are displayed on a linear scale. However, Figure 15(b)
shows the sensitivity of Calculatedvalues of K. to &.pat high ionic strength more effectively
than does Figure 15(a). Figure 15(b) also illustrates that when high degrees of
precipitation are desired (which would presumably be one of the potential applications of
such a model), it is more important to fit modeI parameters to high-ionic-strength data thark
to Iow-ionic-stmmgthdata. In order to make calculated values fit experimental values more
exactly over the whole range of salt concentration%s~Pmust be allowed to vary with ionic
strength.
4.3 Bovine a-Chyinotrypsin Precipitation
Bovine a-chymotrypsin is a serine protease involved in the degradation of other proteins in
the digestive process. It is composed of 245 amino acids in three chains joined by disulfide
linkages between cysteine residues. As with Iysozyme, chymotrypsin’s structure has been
chamcterized by X-ray crystallography in its native conformation, it is a compact globular
molecule, slightly prolate, with axes 5,1x40x 40& giving an equivalent spherical diameter
Op= 43.4A; it has molecular weight 24S00 Daand isoelectric point 8.3 ($lkryer,1988).
21

Figure 16(a) shows the dependence of the equilibrium protein partition coefficient lie, on
solution pH and ionic strength, for precipitation of a-chymotrypsin in ammonium-sulfate
solutions. For chyrqotrypsin, p=ipitation is significantly enhanced as pH decneases,
whereas K=for lysozyme showed no pH dependence. 33gure M(b) shows calculated and
experimental values of K. in logarithmicformat. For the RPA-SAFI’ calculations with
chymotrypsin, M was again taken as 6. Chymotrypsin is larger than Iysozyme (IvIW =
14,500 D% UP= 34.4A). Hence, the volume fraction of each specific-interaction site in
chymotrypsin was chosen to be slightly smaller than in lysozyme; here, V = 0.02,
comesponding to 2~0 of the protein volume per site. The Hamaker constant of
chymotrypsin, H/kBT= 10, a value similar to that of lysozyme. The Hamaker constant
depends primarily on the electron density of the macromolecule and is therefore expected to
have similar vaiues for most small globukw proteins QWr,1%’6). The net valeu& of
chymotrypsin was obtained from titration experiments (Fergg,w%). Figure 16(b) shows
that, as is the case for lysozyme precipitation in ammonium-sulfate solutions, the RPA-
SAFTmodel gives caicuiatedCohn-Edsall slopes for chymotrypsin that are slightiy higher
than the experimental values. Consequently, wdues of qP which vary with ionic strength,
as well as with pH, must be used to correlate the data of Coen (Coen, 19%) for
chyrnotrypsin precipitation with quantitative accuracy.
Comparison of Figures 15 and 16 shows that Iysozyme precipitates at lower amrnonium-
sulfate ionic strength tharchymotrypsin, although lysozyme is the smzdler of tlm two
proteins. Normally larger proteins are observed to salt out at iower ionic strength than
smaller proteins (Albertsson,1986 Rothstein,1994);this observation is also reflected in RPA-
SAFT calculations, as shown in Figure 12(b). Attmctive speciilc interactions (or, at leas~
interactions not included in W~(r), the spherically symmetric potential of mean force) in
lysozyme solutions must be responsible for lysozyme’s lower sohdility in ammonium
sulfate. This is highlighted by the difference in the correlated values of the specific-
interaction energies: for chymotrypsin, 6,JkBT-1, whilefor lysozyme, qJkBT -4. These
additional forces may arise from, for example, diffenmces in the extent of hydrophobic
interaction, diffemmes
precipitating solutions.
in protein-salt interactions, and/or conformationrd changes in
22
5. CONCLUSION
An approximate statistical-mechanical equation-&f-statemodel has been derived to describe
salt-induced protein precipitation. In tlds model, protein-protein interactions are quantified
through potentials of mean force (PI@%) which account for electrostatic repulsion,
dispersion attraction, ion-excluded-volume attractiq and hydrophobic interactions.
Thermodynamic properties of the system are derived using two perturbation theorkx
spherically symmetric interactions are described by the random phase approximation
(RPA), and orientationdependent attmctive specific interactions (e.g., hydrophobic
interactions, short-range electrostatic interactions or self-association) are accounted for
using the statistical associating fluid theory (SAFT’).
The equation of state has been applied to solutions of hypothetical prot&s in aqueous
solutions of ammonium sulfate. Calculated phase-equilibrium results show that both the
supematant-phase protein concentration, q., and the equilibrium protein partition
coefficien~ K., exhibit exponential dependence on ionic strength, C&n and E&all @&all,
1943)were the first to make this observation experimentally and to correlate salting-out
solubilities for a variety of proteins using a simple, purely empirical exponential formukq
successfully describing this phenomenon is one of the first requirements of a
thermodynamic model for protein precipitation. Protein partitioning is most sensitive to
protein size, with larger proteins being more prone to precipitate than smaller proteins, in a
solution of any given ionic strength. Furthermore, attractive specific interactions may play
an important mle in the pmipitation of proteins at high salt concentrations; the SAITf
contribution to precipitation is a strong fi.mctionof the magnitude of the specific-interaction
energy, &,P. It has been shown in principle that using the RPA-SAIW equation of state,
either ion-excluded-volume or specific-intenwtion forces, or both, can be used to interpret
protein-precipitation data.
The RPA-SAFI’ equation of state has been applied to real protein-precipitation data for hen-
egg-white lysozyme and bovine rwchymotrypsin in concentrated ammonium-sulf~
solutions. Potential-of-mean force panirneters for hen%gg-white lysozyme from previous
work (Kueb.aeret ul., 1997)are used to calc~ate the RPA contributions to the thermodynamic
pressure and chemical potential of protein in precipitating solutions. Precipitation of both.
proteins is described well using six specific-interacdon sites. Quantitative agreement
between experimental and calculated values of the protein equilibrium partition Coefficient
23

~~, is obtained by using values of the specific-interaction energy, s~P,which depend on
ionic strength for Iysozyme and on both ionic strength and pH for chymotrypsim In
general, the strength of attractive specific interactions was found to be greater for lysozyme
than for chymotrypsin at aIl solution conditions.
In summary, the RPA-SA171’equation of state provides simple analytic expressions for the
thermodynamic properties of soluble and precipitating solutions of globular proteins. It
includes contributions from a variety of intermolecular interactions which depend on
solution pH and ionic strength, two variables often used to control protein precipitation in
practice. Wxth five adjustable parameters which may be correlated from a reasonable
number of light-scattering, titration and protein-precipitation experiments, the RPA.-SAFI’
equation of state provides quantitative description of equilibrium protein partitioning in
precipitation systems. In the future, it is expected that incorporation of additional significant
features -- e.g., specific protein-ion interaction effects, multi-component expressions
describing the properties of mixtures of proteins, and application to protein crystallization –
will significantly enhance the utility of this type of molecular-thermodynamic model in
biochemical eng@eering applications.
24
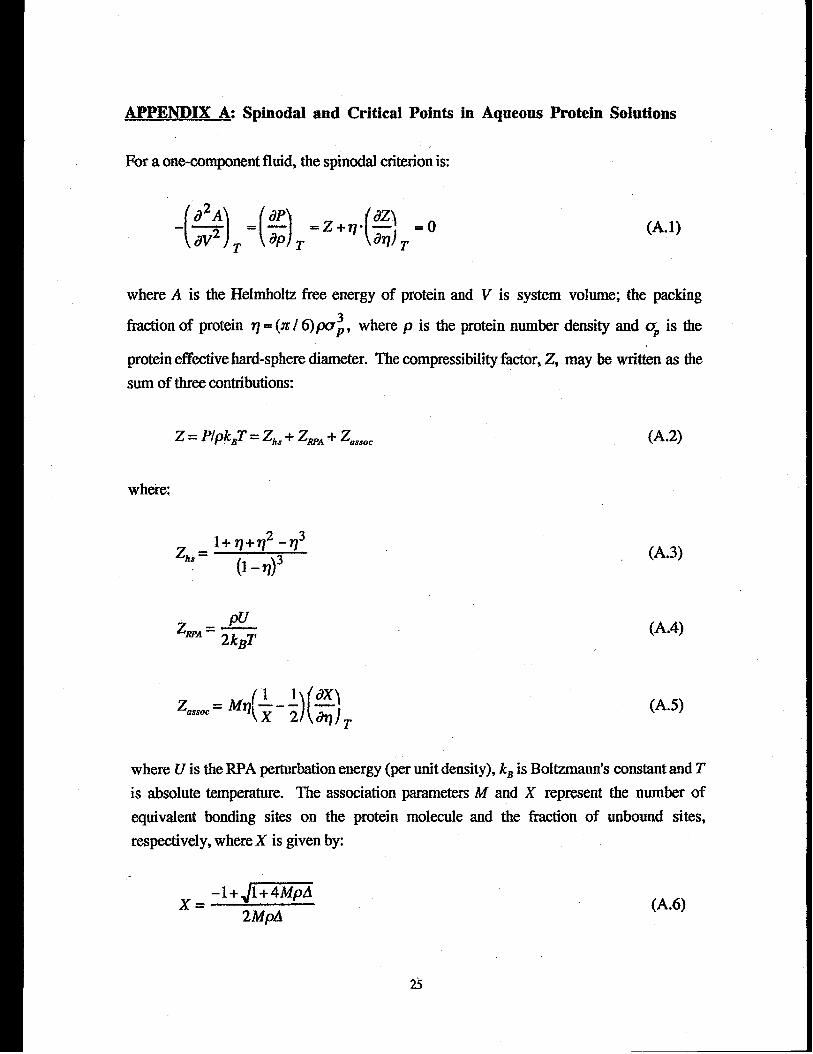
APPENDIX A Spinodal and Critical Points in Aqueous Protein Solutions
For a one-component fluid, the spinodal criterion i~
-($)T=(:)T=Z+T(;;T=O
where A is the Hehnholtz free energy of protein and V is system volume; the packing
fraction of protein q = (z / 6)p0~, where p is the protein number density and OPis the
protein effeetive hard-sphere diameter. The eompressibility ftior, Z, may be written as the
sum of three contributions:
Z = P/pkBT= Zh=+ Zm. -t-Z_.c (A.2)
whertx.
wz =—“ 2kBT
(A.3)
(A.4)
(A.5]
where U is the R.PAperturbation energy (per unit density), kBis Boltzrnann’s constant and T
is absolute temperature. The association parameters M and X represent the number of
equivalent bonding sites on the protein molecule and the fraction of unbound sites,
respectively, where X is given by:
-l+&zi@x=”
2MpA{A*6)
25

and
.
(.A.7)
Diiexentiationwith respectto q yieldx
dz~ 2(2+2r/-q2)—=—.t?q (1-q)4
(M-?)
(,?!.9)
(,4.10)
where the constant-temperaturenotationhas been omiaed for convenience on the density
derivatives. The derivatives of X with respeet to q are given by
(z“”*~-x) (A.11)
where
J311 —-
‘~-2-q+q(A.13)
26

(A.14)
Thus, at the spinodal poin~ equation (A. 1) becomes:
At the critical point the additional constraint
.($),=($),=O
is imposed. Equation(A.16) is equivalent@.
Again, differentiation with respect to q yields
(#zk 4(5 +2q -92)
‘= (AJ5dr/2
(A.16)
(A.17)
(A.18)
(A.19)
27
(A.20)
where
2h@AJ f283 ,J~ l-2MpA
‘(1 +4MpA)3~2 [ % ()1+ 4MpA
and
d2J 6 22..— —=== (2-@3 ‘fL?q
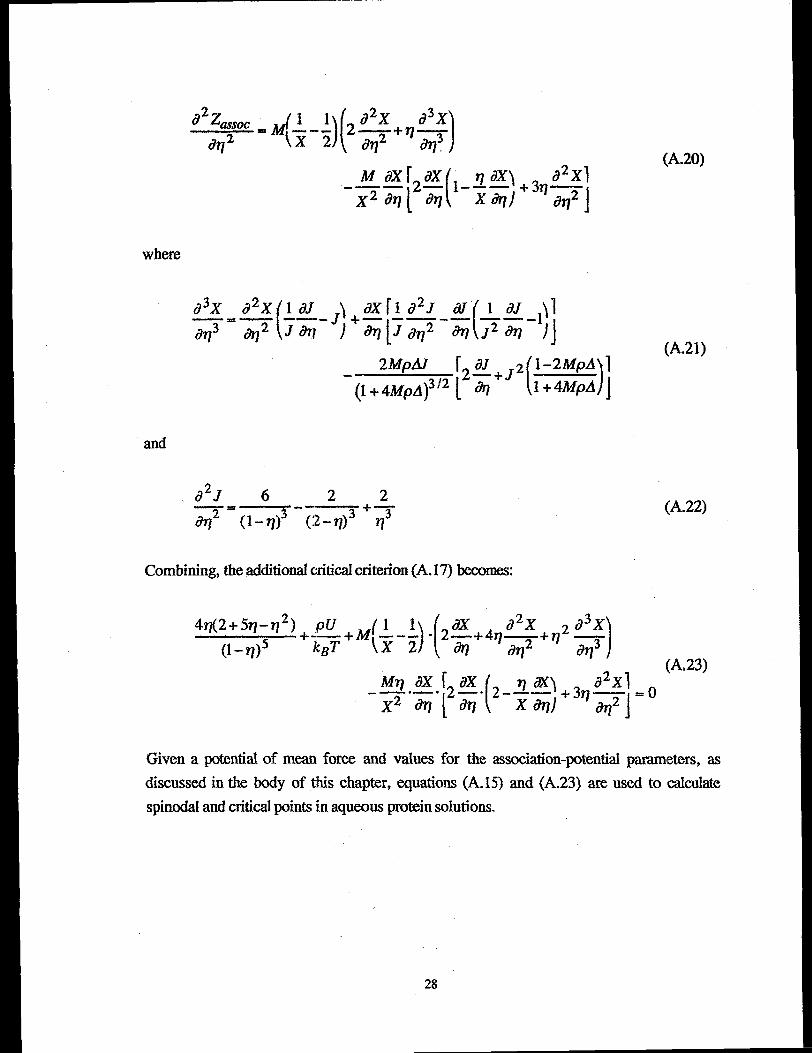
Combining, the additional critical criterion (A.17) beeomes:
(A.21)
(A.22)
Given a potentiaf of mean force and values for the association-potential parameters, as
discussed in the body of this chapter, equations (A. 15) and (A.23) are used to calculate
spinodal and critical points in aqueous protein solutions.
28

/4PPENI)IX B:
In evahmting the
Osmotic Coefficients for (NHJ2S04 Solutions
ion-excluded volume poten’kal of mean force, WOSm(r),the osmotic
pressure, I&, of the corresponding pmtein-free salt solution is required. The ideal and
real osmotic pressures of an aqueous electrolyte solution are related by
(B.1)
where the ideal osmotic pressure ix
%= %NA(%.,+ V.J+BT (B.2)
where c. is the molar concentration of salt, ZV~is Avogadro’s number, V@,and v=. are the
stoichiometric coefficients of the cation and anion, respectively, kB is Boltmmmn’s
constant, and T is absolute temperature.
Osmotic coefficients for ammonium-sulfate solutions at T = 2981S are reported in the
literature (Clegget & 1996)and are shown in Figure B.1. For use in calculating WOw(r),the
data of Clegg and coworkers were fit to a sixth-order polynomial fimction, yielding
n om = 0.000142m6 - 0.002788m5 + 0.021813nz4-0.0881 18rn3(B.3)
+0.204384m2 - 0.26135Fn+ 0.768580
with a high degree of accuracy (R2= 0.998).
29

NOTATION
a
ci~r)
Ci
e
g&r)
h$r)H
h
?
Ke
NA
P’
r
sT
uv
W(r)
Zj
Helmholtzenergy, J/mol ‘
directcorrekitionfimction of&pair
concentration of species i, moi/L
elementary charge, 1.602x10⁻¹⁹C
radial distribution function of ~ pair
total correlation function of ij pair
Hnmaker’s eonstang J
Planck’s constant, 6.6252x10-~ J-see
ionic strenglh of solution, mol/L
distribution coefficient
Bokzmann’s COllS@ll~1.3804x10⁻²³J/K
molecuiarmass of species i
number of attractive specific-interaction sites per protein molecule
Avogadro’s number, 6.023x10²³ mol-1
thermodynamic pressure, Pa
center-t.o-eenterdistance, A
protein solubiiity, mol/L
absolute temperature, K
RPA perturbation energy, J-JJmol
specific-interaction volume flaction
potential of mean force
valence of species i
Greek Symbols
P Cohn-E&all salting-out intercept
E, relative permittivity
% permitivity of vacuum, UVm
&SP association energy
~ protein packing fraction
e angle
30

K
A
Pi
q.
q-on
@ osm
Debye length, ~-1
Cohn-Edsall salting out slope ~
chemical potential
stoichiometriccoefficient of species i
real, idealosmotic pressureof protein-freesalt solution, Pa
number concentration of species i
diameter of species i, A
composition-weighted average hydrated ion diameter
osmotic coefficient of protein-tie salt solution
31

l“%—--r-I’’’”~”’’P’”~” “l’ ’i ’”l’’’’l ’i ’’l’’” -1
0.8
0.61**
●*.●*
●.●..,.
●
●.●
●.,..Ionic Strength ~]
------0.10--- 0.20...........0.50— 1.00
●
L ●
(),4 3, ●’**%.,,\ ●
\ “.\ ‘.
\ ‘*‘.\ ‘.0.2 &
\ -..\ .-
\ ‘.:.- % ...%.. - ●..- -.. .* -----+. --=...... ----------------
++...... . ,....... . -rrl-1+++~
1.0 1.1 1.2 1.3 1.4 1.5
rfap
Fignrel: De~ndence oftiescrwnedC oulombicp kntidofmemf orm,~q~(r),on center-to-centerseparationbetween proteinmonomers,r, andon solution ionicstreng@ 1, in aqueous ammonium sulfate solutions.
Protein parameters: 0“ = 50A, z =10Salt parameter Ocat-- &62~, 2Cat= 1
crm= 7.58& zm = -2
32

/- \\
/-—-. . \/
/. .%%......%..%.. ..-..:.:-:.:-:.:.:--------.
..........................%-...%.................................. .
\...................../.... .. ... ..... ,..:.:.:.:.:.:.:.:.:.:%-.:.>:.:.~:.:.:.:.:.:.:.:.}:.:..
~.:.:.:.+~.:.y,:.:.:.:.:.:.:.:.~..:.:.:.~.:.... .. ......... .. ... ..... ... .. .....
I%...--...%%........%..%..-.....%..........%..%%..%%%........................................................... ................................................................/..............................:.:.:.:.:.:-:-:.:.:-:.:.%:.:.:.:.:.:.:.:.:.:.:.:.:.:.:.:-:.:.:.:.:.>.
f.........................................................................................-./............................ ..............%%..%..%...... .........
\........................................................... %::::>,:::::::j$j$j;::::::y. . . . . . . . . . . . . . . . . . . . . . . . . . . . . . . . . . . . . . . . .
....%....-....... ........ ..............%%..%%%%.... ......... .............%..............................w.%.. ..:-:.:.:.x+:.:.~.:.:.:.:.:.:.:.:.:.:. :.~.y..:.:.:.>:-y..:.:.:.:.:
. ............ .................. .......................... ..... ............-,%..=-...... .... ...... ............... . . . . . . . . . . . . . . . . . . . . . . . . . . . . . . . . . . . . . .
\
..:.:.:+:++:.:.:.:.:.:.:.:.:.:..- . : ..... ................. ..... ... ..:.:.:.:.~.:.:.:.:.:.:.:.:.:.:.:.:.:.:.:.:. :.:.x+:.:.:.:.:.:........ ... ... ............. ... ... .>:.:.~.>:.:.:.>: by..:.:.:.:.:.:.:. :.:.:.:.~.:.:.:.:.~.:.:.:.-
..................... . . . . . . . . . . . . . . . . . . . . . . .. . . . . . . . . ............ ...... ...... .... ...... ...... .. ........... ............ .. .......-./. . . . . . . . . . . . . . . . . . . . . . . . . . . . . . . . .
.............. ..... ......... .. ..... ..... .... .................
\
........................................ .......... .........%:.:.:.:.:.:.:.:.:.:.:.:.:.:.*:.:,:.:.:.:..
..%.. %%....%..-.........%....%..%-----.............................+.+y..
\
\/
/\
/
\ 0.- - --
Fi~re 2: Geometry of the ion-excluded-volumeattractionmechanism.
33

0KI I I 1 I 1 I I I I
---------- --------------------- ---------- ----------- ----- ....------*-”’ .-. -”
-.*. - .9.~.- ------ #“@ /“----- ----
6 -. ...- 0“ 0“------ /- .“
-1: -------- ~‘Hw ./=’~---@“,0 ‘/”.4* /’0“ .
-2 p ,“4”●/”
● ,/’/.z /“k
-3
t
-4
t
/Ionic Strength ~
/’ — U.1O,! ------0.50/’4 --- 1.00/’ -.-.-.2.00
/4 ---5.00./“ ---- 10.0de/ 1
AL-_Lllllllfltllllldi.oo 1.05 1.10 1.15 1.20
I-hp
Figure 3: Dependence of the ion-excluded-volume potential of mean force, Worn(r),on center-to-center separation between protein monomers, r, and on solution ionicstrength, 1, in aqueous ammonium sulfate solutions.
Protein parameters: oP = 30f$$tdt parameters: ~C=t= 6.62A, Zcat = 1
am= 7.58A, Zm= -2
34
2 p......
L
.
L
m
L. ------ 5.0-6 ~’
~-.-. -” 10.0
-t**
-8 ~l’I’I’ ’I ’1 l’IIi ’’II fl’’’I’” I ““’ {’11’ 1’’’ ’1’1’151.0 1.2 1.4 1.6 1.8 2.0
Figure 4: Dependence of the spherically symmetricpotentialof mean force,Wwm(r),on center-to-center separation between protein monomers, r, and onsolution ionic strength, I,inaqueous ammonium sulfate solutions.
Protein Parameters: cP=30& =15, H/kBT=5&%ltparameter~ cr@=6.6 ,zc~=l
- 7.58& zm = -2Um-
35

specific interaction sites
A /’
r12
\-
Figure 5: Representation of speeific-interaction “siteson the protein surface.
36

.
I 1 I 1“”1 I I 1 I I I I I i l“’’I’”’’’ 1’’”:.“,*
0.5#,“
Ionic Strength ~~ ,’,,’,
------ 1.0 ,..0.4
E— 2’22--- 95 /’-,’
,’.--- .“
,’‘
/
.
.’●.....
.’..“.
.’t“.
.“#-
.-.“
.“.0
●**“
.“ ------.
O.ofi’’’l’’’’ l’’’’ l’’’’ l’” ‘1’’’’ 1’’”+0.00 0.05 0.10 0.15 0.20 0.25 0.30 0.35
F~ure 6: Thermodynamic pressure, normalized by ap3/kBT,as a function of proteinpacking fraction, q, forthreedifferent values ofionic strength. Here, thecritical valueof ionic strength, IC,is 2.22M.
Protein parameters: OP= 50& H/kBT= 10, M= 6, s~kBT= 2, V= 0.02Salt pararnete~. o==,= 6.62& Zcat= 1
Om= 7.58A, zm = -2
37

k''''''''''''''''''i''''''''''''''''''''1'''''''''''''''''2■ Critical Point
------Spinadal Curve— Coexistence Curve
0.1
0.0
L 1 -1
Ltt,tiL[●..
‘.‘..
.... . .
“-----------
-“--------= ------- ---
. . .
-.—0 1 2 3 4“5 6
1, [mol/liter]
Figure 7: Typical critical point and spinodal and coexistence curves calculated fromthe RPA-SAFI’ eqnation of state.
Protein parameters: ~P= 50& H/k#= 10, M= 6, s#kBT= 2, V= 0.02Salt parameters: u’,~l= 6.62& Zcat= 1
o-m= 7,58& zan= -2
38
Ic ~[rnoI/Iiter] k
2 :
1 : [a) ‘....=...A
...0 “’lil’’l’”’’l’”l-02468
- :~k~... ,-.-.. ---v%%..%=..+.>..%..-* ~“. -..........“.....\l
M &,.kBT,V%
()~30 35 40 45 50 55 60
up [A]
Figure 8 Dependence of critical ionic strentiti, 1=,om(a) SAFT Pammeters M, s,~kBT,and V% = VQ1OO(b) protein diameter iYP
39

‘:K-
L \ d
10-5 Ll&LdLd4ukkd
5678910
I [mol/Iiter]
%~*-3
104
I (b)
\\\\\
\
lo-5 l'';'"'''''''''''~' '''''''''''''''''''''''''''''l2 4 6 8 10
I [mollliter]
Figure 9: Dependence of equilibriumproteinpackingfractionin the supernatantphase,q., on Sm pmete~: (a) ~K and (b) s,~kBT in aqueous ammonium sulfate solutions.
Protein parameter% a.= 50& H/kBT= 10, M= 4 fin (b)], c~kBT= 2 [in (a)], V= ().02Salt parameters: tiCat= 6.62fi, Zc=t= 1
.
q.m= 7.58& za~= -2
#

~o-l
~~-2
10-3
104
k’i ’’’’ l’’t ’l ’’’’ t’’’ ’l’’’’l’” ‘I{a
“$x&\\
I(a)
+ 0.01+ 0.02+ 0.03+ 0.04 1
-1~o-51,1, ,,, l*, *, l,, ,,!, t,,i,, ,,1, ,,,1,[ . .....
3456789
I [molfiter]
1o-1
10-2
10-3
104
E’I’’’l l’’’ l’’’ l’’’ l’’’l”a
I [mollliter~
Figure IO: llependenceofequiiibriump~teinpaeking fractioninthesupematantphase,%.!on: (@ s~ P-@r V$ad (b) ~pIn Wueous -o~~ s~fite so~utio~s”
Protein parameters: cP = 50~ [in (a)], H/kBT= 10, M= 4, e~kBT= 2, V= 0.02[in(b)]Saitparameterx aWl=6.62&zc@=l
..= 7.58A, zm = -20
41

Ke
Ke
105
104
103
102
101
10°
104
103
102
101
# Ii, ,, lt, t, 1,1, ,1, ,,,l,,, ,1,
45678910
1’ [molfiter]
11/~/&~~kBT
+ 1.0+ 2.0+ 3.0
(b)+ 4.0+ 5.0
I [mol/liter]
Figure 11: Dependence of protein equilibrium partition coeffkient, K,, on SAFI’parameters: (a)lf, and(b) s@/k#’in aqueous ammonium sulfate solutions.
- 50.& H/kBT= 10, M = 4 [in (b)], s~kBT= 2 [in(a)], V= (11.02Protein parameters: oP-Salt parameters: UCat= 6.62A, zCaf= 1
- %58& zm = -2O=n–
42

105
104
103Ke
102
101
I“’’J’* ’’l ’’’’ l’ ’’’I’” ‘1’’”1’
vq 4-0.01
4-0.02+ 0.03+ 0.04+ 0.05
e
(a)
10°tll,,,llll ill, tllllli llltlll*litlll3456789
I [rnoMiter]
105I * 1 1 I 8 I 4 I 1 1’ a I 1 1 t I i 1 * I I 1
CTp[A].(b)
104
Ke 103102
101
10° Ffillll 111 11111 Illll*llll2 “4681012
1 [molfliter]
Figure 12: Dependence ofprotein equilibrium partition cokfflcien6iK@on(a) S.AIWparameter V, &d(b) OPin aqueous ammonium sulfate solutions.
Protein parameters: aP = 50~ [in (a)], H/kBT= 10, M = 4, s,~kBT= 2, V= 0.02 @ (b)]%ltpammeters: oCat=6.62&zcaf=l
Om= 7.58A, Z@ = -2
43

10w8~’’’ l’’’’’’’’’4’’’’’’}’’I’’’’’’’’’i’’i’46~
4 -
2 -
N)08 :
6 -
4 -
2
108~
6 -
4 -
2 -
r
* ●✎✎✎✎✎✎✎✎✎✎✎✎✎✎✎✎✎✎✎✎✎✎✎✎✎✎✎✎✎✎✎✎✎✎✎✎✎✎✎✎✎✎✎✎✎✎✎✎✎✎✎✎✎✎✎✎✎●
✎✎✎✎✎✎✎✎✎✎✎✎✎✎✎✎✎✎✎✎✎✎✎✎✎☛❞ 9me.avg= 257
Q..........................................................o ~ I=8m.......... .............. .
u ~,w = 90.2
A.........................................................A .,......_..-...........~ j:=:= 4(-J8
A
nu..........................................................
n u ...”...--”-”a”-......”a$’;:= 14.1
*..........................* ........................e .....--~...............g ~:::= 6.34
4
5 6 7 8 9
pH
Figure K%Dependence of the equilibrium protein partition coefficient, K,, on pHand ionic strength for Iysozyme precipitating in solutions of ammoniumsulfateat 298K.
44

4.4
4.2
4.0
3.8
3.6i- -i
Fi,ll,l,l i,l,l,l,,l J,fllllil nil, Jill, il,l,l, d5 6 7 8 9
1 [mold]
Figure 14: Dependence of specific-interaction energy, QkBT, on solution ionic strengthfor precipitation of hen-egg-white iysozyme in solutions of ammonium sulfate at 298K.
Ammonium sulfate am= 6.62A, Om= 7.58A; zC=t= +1, Zm= -2Lysozymc OP= 34.4& H/kBT= 8.9, M = 6, V= 0.03
45

Ke
Nloop, ,’’, ,,, ,,l,,,, ,,,,,,,6 ~4 - 0 Experimental (pH8)’ 0
........ e#BT=3.g 02- ‘ ..*4 ...
--- &JkBT= 4.0 # ..0 .....100 r / ‘ ‘.8......
6 ~ / ..”.0 /’
4- ~6 ..”..’”& ..2- / -----
& ...
10? * ‘ ....””..0 .,# ..”.6: ● , ‘ .....””.
4- # ~/..’.-....’...
2-(a)
400
t
● Experimental (pH 8).,-.....~~kRT= 3.8
300 --- %&7w= 4.04
4
4
I
f .64 ---
r...
4....
...t
I ~-
f --:
/ ..:
# -----
‘:~5“6 ‘7 8 9
1 [mold]
Figure 15: Experimentalandcalculated values of the equilibriumprotein partitioncoeffkknt, K~,as a function of ionic strengthfor hen-egg-white Iysozyme precipitatingin solutions of ammoniumstifate at 298& in logarithmic(a) and linear(b) scale.
Ammonium sulfate Oal = 6.62A, C3a= 7.58A; Zcat= +1, Zm= -2Lysozyme OP= 34.4~, H/kBT= 8.9, M = 6, &~kBT= 3,8, V= 0.03
46

Ke
Ke
250L, ,1, ,,, ,,, ,, I,,,,I ,,, ,,, ,,, l,,,,iJ
200
150
100
50
0
t
-a- pH 4.0-o- pH7.O-+ pH8.3
,m...............-,..-.. {
7.5 8.0 8.5 9.0 9.5 10.0 10.5
I [mokil]
100o k,,,,,,,,,,,,,,,,,,,, ,,, ,,, ,,, ,,, ,q6
I
4
2
10064
2
10
..-....””“.”..’.m...-.
.....”-.ii”...-......4”’ A.....
w...”----#..-....#.-...-”s Experimental calculated
6
[
.----...- * pH4.o
4–.-.E~.kBT=l.()
● pH7.O — q.JkBT= ().8
2 ;; A pH8.3 ---- sJkBZ’= 0.6 !
11’’l ’”’’’l ’’’’ l””~ “’’1 ’’’’ 1’’”117.5 8.0 8.5 9.0 9.5 10.0 10.5
1 [mokd]
l?igure 16: Dependenceoftheproteinequilibrium partitioncoefficienGK,,[email protected] cz-chymo~sinin solutionsofammonium suHat~at298K.
(a) Experimental data displayed in linear format(b) experimental and calculated values of K=displayed in logarithmic format.
Ammonium sulfate a~~ = 6.62A, Om= 7.58A; ~a, = +1, zm = -2a-chymotrypsin UP= 43.4~, H/kBT= 10, M= 6, V= 0.02
47

0.72
0.70
0.68
0.66
O*64
0.62
lil:llllfll![ltlllllllllll [llllllllllllfllJllJjll’11 Illly
*..--..
-1
Data of Clegg, et al.
Polynomial fit 1#y
.’,
J..’
●
.“.“.
.’.. 1.0
o 1 2 3 4 5 6
Cs [mola.1]
Figure B.1: Osmotic cwfficients inpureaqueous solutions ofmotim sulfateat 298.15K.
48

LITERATURE CITED
Albertsson, P.-A. (1986). Partition of Cell Particles and Macromolecules. New York,
Wiley.
hkaw~ T. and S. N. Timasheff, “Preferential interactions of proteins with salts in
concentmted solutions: Biochem=(1982} 21:6545-6552.
ArakawzqT. and S. N. llmasheff, “Mechanism of protein saking-in and salting-out by
divakmt cation salts Balance between hydration and salt binding: Biochem. (1984) 2A
5912.
ArakawiL T. and S. N. Timasheff, “Theory of protein solubility~ Methods Enzvmol.
(1985) 11449-.
Asaku~ S. and F. Oosaw~ “C)ninteraction between two bodies immersed in a solution of
mac~molecules~ J. Chem. Phys. (1954)22 1255-1256.
Asakura, S. and F. Oosaw~ “Interaction between particles suspended in solutions of
macromolecules< J. Poly. Sci. (1958) 33:183.
Grnahan, N, and K Starling, “Thermodynamic properties of a rigid-sphere ffuid~ ~
Chem. Phys. (1970) 53:600.
Carr, C., “Studies on the binding of small ions in protein solutions with the use of
membrane electrodes. ID. The binding of chloride ions in solutions of various proteins:
~ch. J3iochem. Bioohvs. (1953) 46417-423.
Carr, C., “Studies on the binding of small ions in protein soluticmswith the use of
membrane electrodes. IV, The binding of calcium ions in solutions of various proteins,”
Arch. Biochem. Biophvs. (1953) 4(k 423-431.
Chiew, Y. C., D. E. Kuehner, H. W. Blanch and J. M. Prausnitz, “Molecular
thermodynamics of salt-induced protein precipitation: AICh,EJ. (1995) 4 1(9): 2150-
2159.
49

Clegg, S. L., S. Milioto and D.A. Pahner, “Osmotic and activity coefficients of aqueous
(NH4)2S04 as a finct.ion of temperature, and aqueous (NH4)2SC14- H2SC14mixtures at
298.15 K and 323.15 K7 UChem. Eng. Data (1996) 41:455-467.
Coen, C. J., ‘MokcuIar Thermodynamics of Protein Interactions and Phase Behavior in
Aqueous Electrolyte Solutions,” Ph.D. thesis. Department of Chemical Engineering,
University of Cidifomia, I%erlkeley(1995).
Curtis, R. A., J. M. Prausnitz and H. W. Blanch, “Protein-protein and protein-salt
interactions in aqueous proteilnsolutions containing concentrated electrolyte: Biotech,.
=(~998) 57(1): 11-21.
E&all, J. T. (1943). Proteins asAciak andl?ases. Proteins. Amino Acids. and Pe@idlM.
E. J. Cohn and J. T. Edsall. New York Reinhold.
Fergg, F., “Hydrogen-Ion Titmtions of Amino Acids and Proteins in Solutions Containing
Concentrated Electrolyte,” Di,pl.Ing. thesis. Department of Chemical Engineering,
University of Wlfomi% Berkeley (1994).
Foster, P. R., P. Dunhill and M. D. I-My, “The precipitation of wqrnes from ceil extmcts
of SacchuromycesCerevisiae by polyethylene glycolfl Biochem. Bio@vs. Acts (1973)
317505.
Green, A, A., “Studies of the physical chemistry of the proteins, VIIk The solubWy of
hemoglobin in concentrated salt solutions: J. Biol. Chem. (1931) 93495.
Green, A. A., “Studies of the physical chemistry of the proteins, X The volubility of
hemoglobin in solutions of chlorides and sulfates of varying concentration:’ J. Biol.
Chem. (1932) 95:47.
Grimson, M. J., “Small angle scattering from colloidal dispersion” J. Chem. Sot. FqQw@
‘Ilans. II (1983) 79817.
Haire, R. N., W. A. Tisel, 3. Cr.White and A. Rosenberg, “On the precipitation of
proteins by pdymew. The hemoglobin polyethylene g~ycolsystem” Bioml. (1984) 23:
2761.
50

Hamaker, H. C., “The London-van-tier Waals attraction between spherical particles~
PhysicaA (1937) 4(10): 1058-1072. ‘
Hill, T. L. (1960). An Introduction to Statistical Thermodvnamies. New York, Dover
Publications.
Hofmeister, F., “Zur lehre von der wirkung der salze~ Arch. EXDt Pathol. Pharmakol.
(1888) 24:247-260.
Horvath, A. L. (1985). Handbook of Aaueous Ekotrolyte Solutions: Phvsieal Promxties,
Estimation agd Correlation Methods. Chichester, Ellis Horwood.
Israelachvili, J. N. (1992), Intermolecular and Surface Forces. London, Academic Press.
Israelachvili, J. N. and G. E. Adams, J. Chem. WC. Farad. Trans, I (1978) 74975.
Jackson, G., W. G. Chapman and K. E. Gubbins, “Phase equilibria of associating fluids:
Spherieal molecules with multiple bonding sites: Melee. Phvs. (1988) 641.
Konior, J. and C. Jedrzejek “Analytic formulations of the WCA-type perturbation theory
forahard-core-with-one-Yukawa-tail fluid: Melee. Phvs. (1985)55 187.
.
Kuehner, D., J. Engmann, F. Fergg, M. Wernic~ H. W. Blanch and J. M. Prausnitz,
“Lysozyme net charge and ion binding in aqueous electrolyte solutions in reparation
(1998) .
Kuehner, D. E., H. W. Blanch and J. M. Prausni@ “SaIt-induced protein precipitation
phase equilibria from an equation of state;’ ~uid Phase EaUil.(1996)116 140-147.
Kuehner, D. E., C. Heyer, C. Riimsch, U. M. Fomefeld, H. W, Blanch and J. M.
Prausni@ “Interactions of Iysozyme in concentrated electrolyte solutions from dynamic
light-scattering measurements,” Biophvs. J. (1997) 73:3211-3224.
Mahadevan, H. and C. K. Hall, “Statistical-meehanieaI model of protein precipitation by
nonionic polymer~ AIChE J. (1990) 36:1517.
51

Mahadevan, H. and C. K. Hall, “Theory of precipitation of protein mixtures by nonianie
polymer~ AIChE J. (1992) 38(4): 573-591. ‘
McGregor, W. C., “Large scale isolation and purification of proteins from recombinant E.
Coli~ Arm. N. Y. Aead. Sci, (1983) 413:231-.
McQuarrie, D. (1976). Satis@dMechanies. New York, Harper-Collii.
Mekmder, W. and C. Horvath, “Salt effects on hydrophobic interactions in precipitation
and chromatography of pmteiins: An interpretation of Iyotropic series,” Arch. BiocheI~
Biophvs. (1977) 183:200-215.
Nir, S., “Van der Wads interactions between surfaces of biological interestfl Prog. Surf.
S@. (1976) 8:1.
Ornstein, L. S. and F. Zernike, Prok. Acad. Sci. (1914) 17793.
Pitzer, K. S. (1991), Activity Coefficients in Eh%rolvte Sofutions. Boca Raton, CRC
Press.
Prausnitz, J. M., R.N. Lichtenthaler and E.G. Azevedo (1986). Molecular
Thermodymuru“mof Fluid-Phase Equilibria. Engleweood Clif%, NJ, Prentiee-llall.
Przybycien, T. M. and J. Bailey, “Volubility-activity relationship in the inorganic sak-
induced precipitation of a-cliymotrypsinfl Enzvrne Microb. Tech. (1989) 11:264.
Ries-Kautt, M. and A. Dwruix, “Crystallization of previously desalted lysozyrne in the
presence of sulfate ions,” Ac@ Cryst.(1994)D50 366-369.
Ries-KautL M. A. and A. F. Ducruix, “Relative effectiveness of various ions on the
solub~lityand crystal growth of lysozyme,” J. Biol. Chem. (1989) 264745-748.
Rosenbaum, D., P. C. zamom and C. F. Zukoski, “Phase behavior of small attractive
colloidal particles: Phys. Rev. Lett. (1996)76(l): 150-153.
52

RothStein, F. (1994). Dt~erentilPrecipitationofProteins. ProteinPurificationProcess
Engineering.R. G. Harrison.New York, Dekk&.
Rothstein, F. (1994). Rotein Purification Pioeess Engineering. New York, Dekker.
Shih, Y.-C., H. W. Blanch and L M. Prausnitz, “Some characteristics of protein
precipitation by salts; Biotech, Bioeng. (1992) 40:1155-1164.
Stryer, L. (1988). Biochemistry.New York, W.H. Freeman.
Tavares, F. W. and S. I. Sandier, “Phase equilibrium for the mean-force potentkd of
gIobular protein solutionsfl AIChE J. (1997) 43(l): 218-231.
Verwey, E. J. W. and J. T. G. Overbeek (1948). Theorv of Stabilitv of Lyot)hobic
-. Amsterdamt Elsevier.
Vlachy, V., H. W. Bkmch and J. M. Pramitz, “Liquid-liquid phase separations in
aqueous solutions of globular proteins: AIChE J. (1993) 3 9(2): 215-223.
Wertheim, M. S., “Fluids with highly directional attractive forces. III. multiple attraction
sites; J. Stat, Phvs. (1986a)42 459.
Wertheim, M. S., “FIuids with highly directional attractive forces. IV. equilibrium
polymerization; J. Stat. Phvs.(1986b)42477.
53