Embed Size (px)
Citation preview

M O L S O N C O O R S B R E W I N G C O M PA N Y B A R C L AY S B A C K T O S C H O O L C O N F E R E N C E
S E P T E M B E R 4 , 2 0 1 4
1
2
PETER SWINBURN, PRESIDENT & CEO MOLSON COORS BREWING COMPANYPETER SWINBURN, PRESIDENT & CEO MOLSON COORS BREWING COMPANY
This presentation includes estimates or projections that constitute “forward-looking statements” within the meaning of the U.S. federal securities laws. Generally, the words “believe,” "expect,” "intend,” "anticipate,” “project,” “will,” and similar expressions identify forward-looking statements, which generally are not historic in nature. Although the Company believes that the assumptions upon which its forward-looking statements are based are reasonable, it can give no assurance that these assumptions will prove to be correct. Important factors that could cause actual results to differ materially from the Company’s historical experience, and present projections and expectations are disclosed in the Company’s filings with the Securities and Exchange Commission (“SEC”). These factors include, among others, impact of competitive pricing and product pressures; health of the beer industry and our brands in our markets; economic conditions in our markets; pension plan costs; availability or increase in the cost of packaging materials; our ability to maintain manufacturer/distribution agreements; our ability to implement our strategic initiatives, including executing and realizing cost savings; our ability to successfully integrate our Central Europe business; changes in legal and regulatory requirements, including the regulation of distribution systems; increase in the cost of commodities used in the business; our ability to maintain brand image, reputation and product quality; our ability to maintain good labor relations; changes in our supply chain system; additional impairment charges; the impact of climate change and the availability and quality of water; risks relating to operations outside North America; success of our joint ventures; lack of full-control over the operations of MillerCoors; and other risks discussed in our filings with the SEC, including our Annual Report on Form 10-K for the year-ended December 31, 2013, which are available from the SEC. All forward-looking statements in this press release are expressly qualified by such cautionary statements and by reference to the underlying assumptions. You should not place undue reliance on forward-looking statements, which speak only as of the date they are made. We do not undertake to update forward-looking statements, whether as a result of new information, future events or otherwise.
3
FORWARD LOOKING STATEMENTFORWARD LOOKING STATEMENT
4
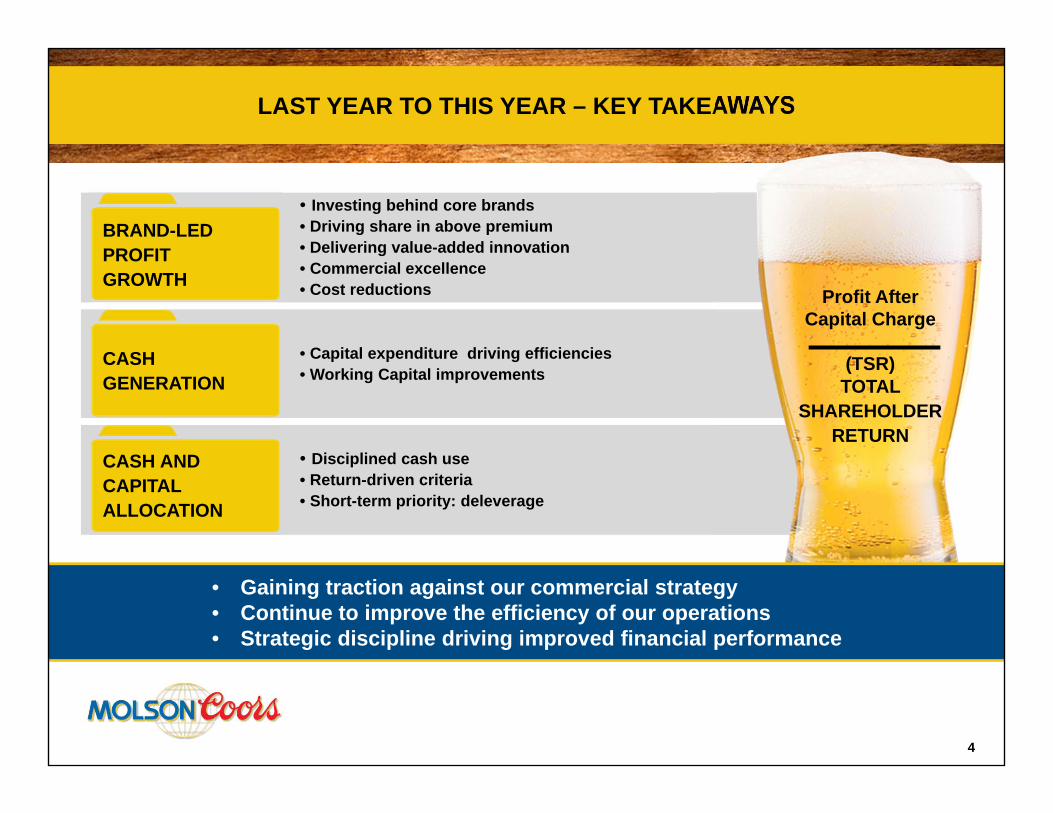
LAST YEAR TO THIS YEAR – KEY TAKEAWAYSLAST YEAR TO THIS YEAR – KEY TAKEAWAYS
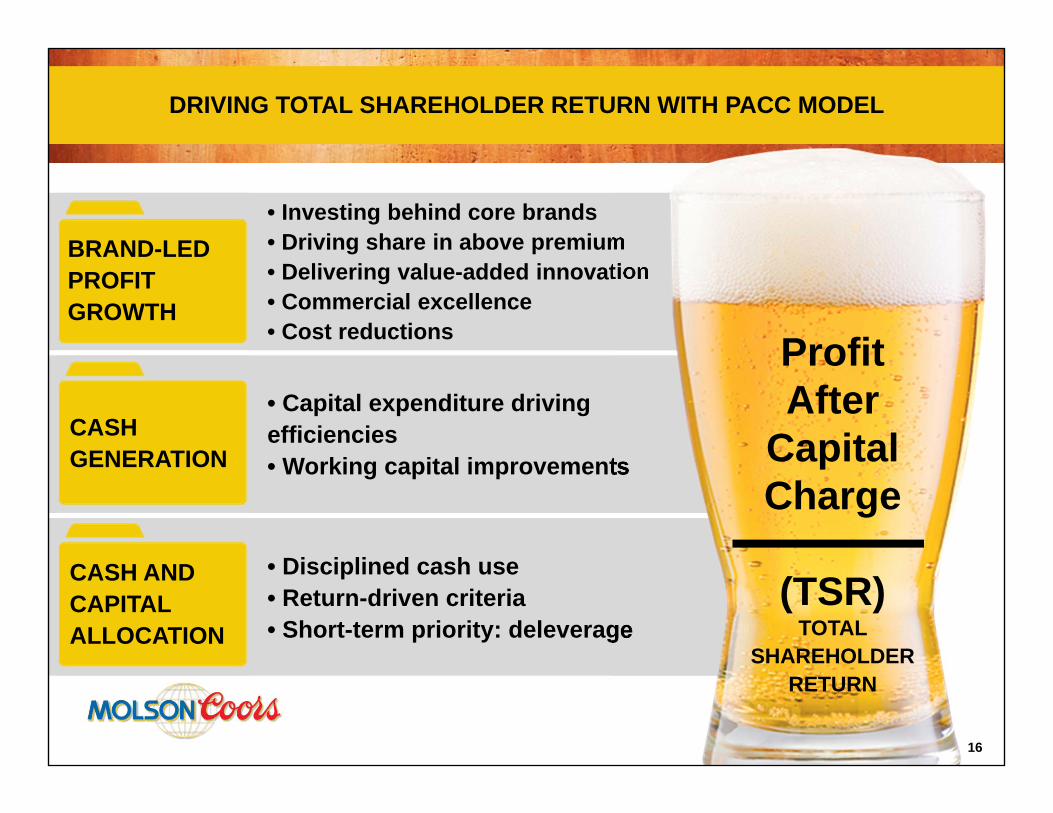
• Investing behind core brands• Driving share in above premium• Delivering value-added innovation• Commercial excellence• Cost reductions
BRAND-LED PROFITGROWTH
• Capital expenditure driving efficiencies• Working Capital improvements
CASHGENERATION
• Disciplined cash use• Return-driven criteria• Short-term priority: deleverage
CASH AND CAPITAL ALLOCATION
Profit AfterCapital Charge
(TSR)TOTAL
SHAREHOLDER RETURN
• Gaining traction against our commercial strategy• Continue to improve the efficiency of our operations• Strategic discipline driving improved financial performance
5
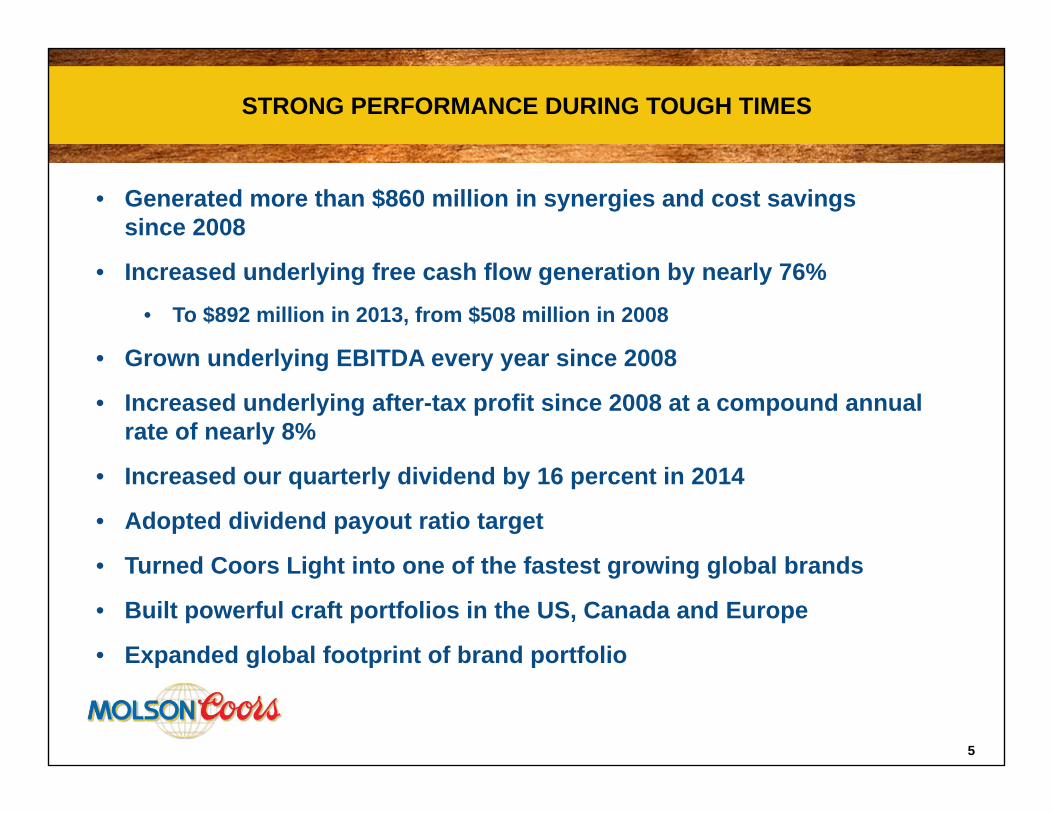
STRONG PERFORMANCE DURING TOUGH TIMESSTRONG PERFORMANCE DURING TOUGH TIMES
• Generated more than $860 million in synergies and cost savings since 2008
• Increased underlying free cash flow generation by nearly 76%
• To $892 million in 2013, from $508 million in 2008
• Grown underlying EBITDA every year since 2008
• Increased underlying after-tax profit since 2008 at a compound annual rate of nearly 8%
• Increased our quarterly dividend by 16 percent in 2014
• Adopted dividend payout ratio target
• Turned Coors Light into one of the fastest growing global brands
• Built powerful craft portfolios in the US, Canada and Europe
• Expanded global footprint of brand portfolio
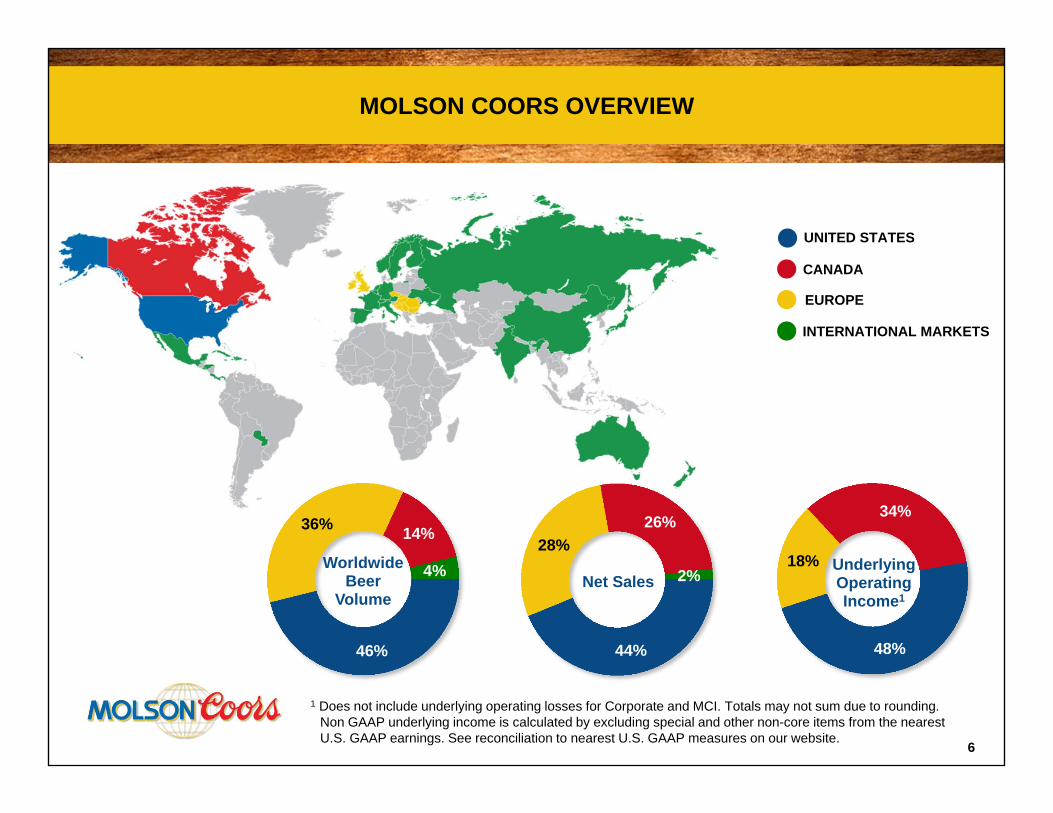
1 Does not include underlying operating losses for Corporate and MCI. Totals may not sum due to rounding. Non GAAP underlying income is calculated by excluding special and other non-core items from the nearest U.S. GAAP earnings. See reconciliation to nearest U.S. GAAP measures on our website.
6
MOLSON COORS OVERVIEWMOLSON COORS OVERVIEW
46%
36% 14%
4%Worldwide Beer
Volume
44%
28%26%
2%Net Sales
48%
18%
34%
Underlying Operating Income1
INTERNATIONAL MARKETS
EUROPE
CANADA
UNITED STATES
7
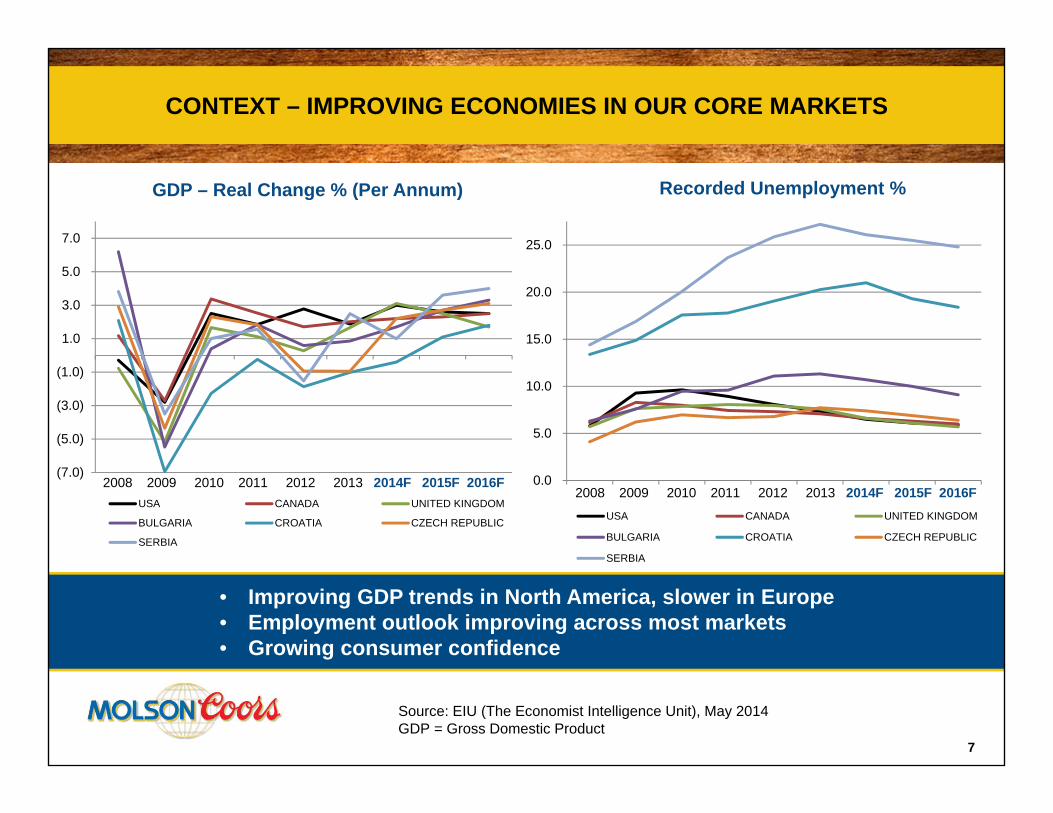
CONTEXT – IMPROVING ECONOMIES IN OUR CORE MARKETSCONTEXT – IMPROVING ECONOMIES IN OUR CORE MARKETS
GDP – Real Change % (Per Annum) Recorded Unemployment %
(7.0)
(5.0)
(3.0)
(1.0)
1.0
3.0
5.0
7.0
2008 2009 2010 2011 2012 2013 2014F 2015F 2016FUSA CANADA UNITED KINGDOM
BULGARIA CROATIA CZECH REPUBLIC
SERBIA
2008 2009 2010 2011 2012 2013 2014F 2015F 2016F
Source: EIU (The Economist Intelligence Unit), May 2014GDP = Gross Domestic Product
0.0
5.0
10.0
15.0
20.0
25.0
2008 2009 2010 2011 2012 2013 2014F 2015F 2016FUSA CANADA UNITED KINGDOM
BULGARIA CROATIA CZECH REPUBLIC
SERBIA
2008 2009 2010 2011 2012 2013 2014F 2015F 2016F
• Improving GDP trends in North America, slower in Europe• Employment outlook improving across most markets• Growing consumer confidence
CASH AND CAPITALCASH GENERATIONBRAND-LED PROFIT GROWTH
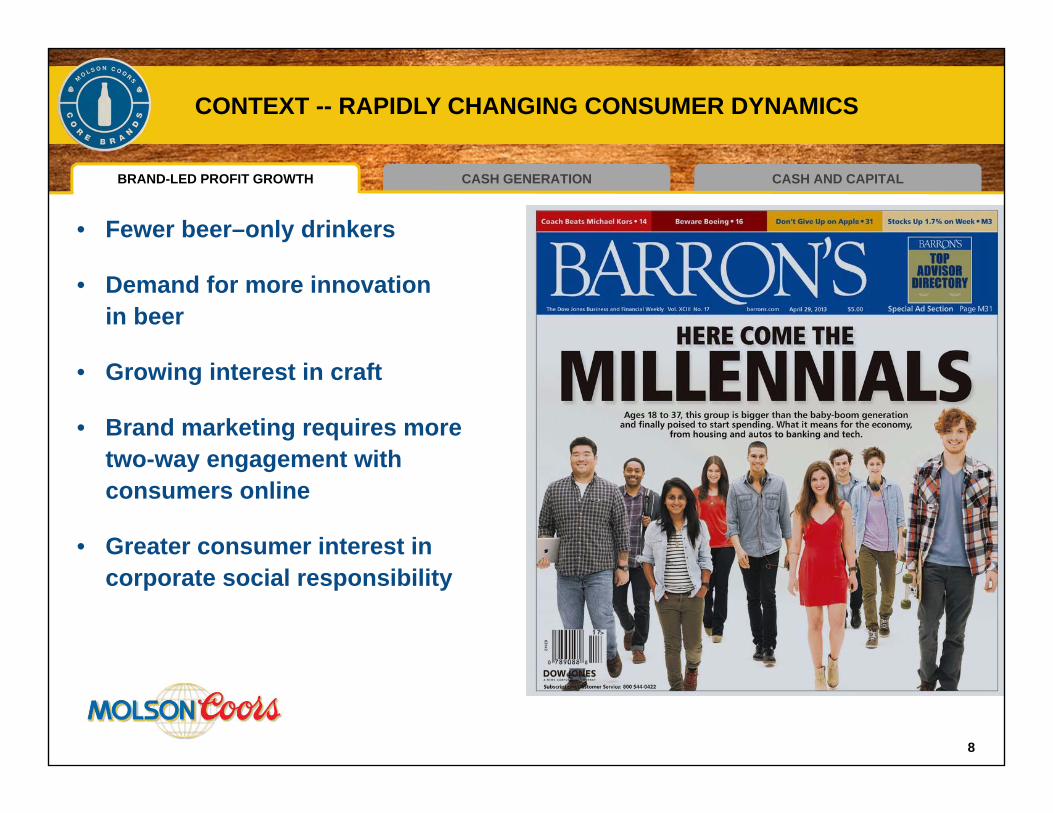
CONTEXT -- RAPIDLY CHANGING CONSUMER DYNAMICSCONTEXT -- RAPIDLY CHANGING CONSUMER DYNAMICS
• Fewer beer–only drinkers
• Demand for more innovation in beer
• Growing interest in craft
• Brand marketing requires more two-way engagement with consumers online
• Greater consumer interest in corporate social responsibility
8
9
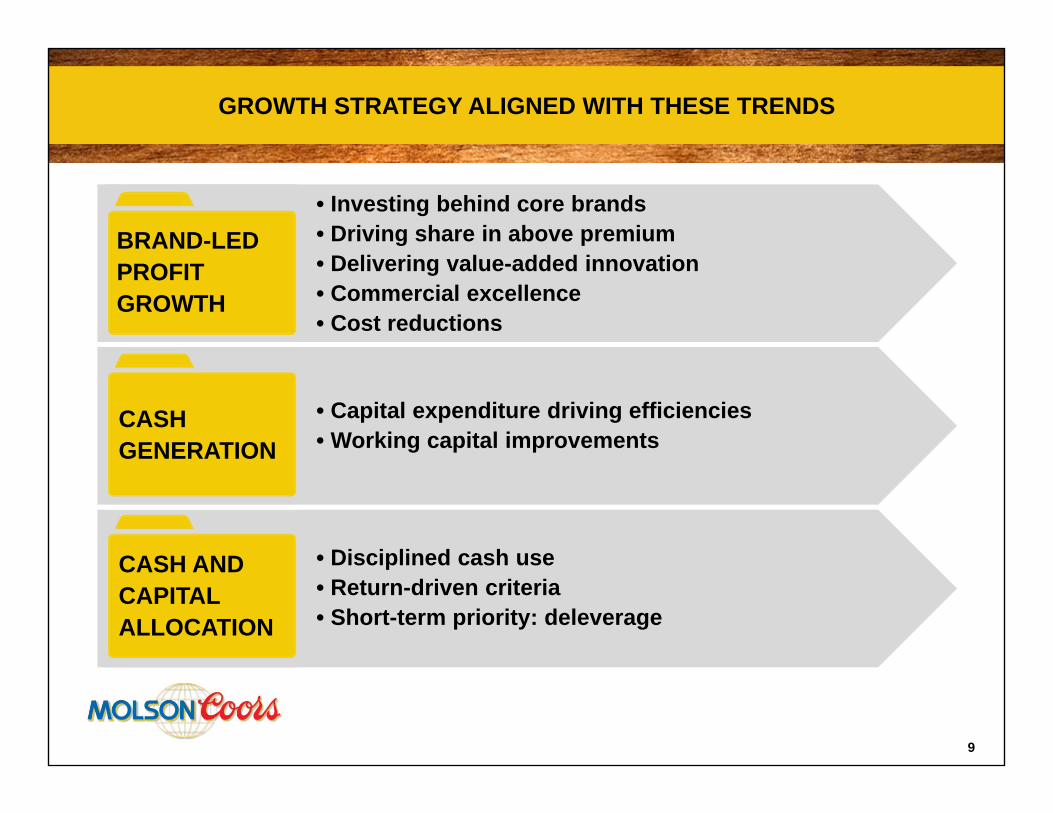
GROWTH STRATEGY ALIGNED WITH THESE TRENDSGROWTH STRATEGY ALIGNED WITH THESE TRENDS
• Investing behind core brands• Driving share in above premium • Delivering value-added innovation• Commercial excellence• Cost reductions
BRAND-LED PROFITGROWTH
• Capital expenditure driving efficiencies• Working capital improvements
CASHGENERATION
• Disciplined cash use• Return-driven criteria• Short-term priority: deleverage
CASH AND CAPITAL ALLOCATION
10
BRAND-LED GROWTH ENABLERSBRAND-LED GROWTH ENABLERS
DRIVING SHARE
IN ABOVE PREMIUM
DRIVE COST SAVINGS AND
COMMERCIAL EXCELLENCE
DELIVERING VALUE
ADDED INNOVATION
INVESTING BEHIND
CORE BRANDS
CASH AND CAPITALCASH GENERATIONBRAND-LED PROFIT GROWTH
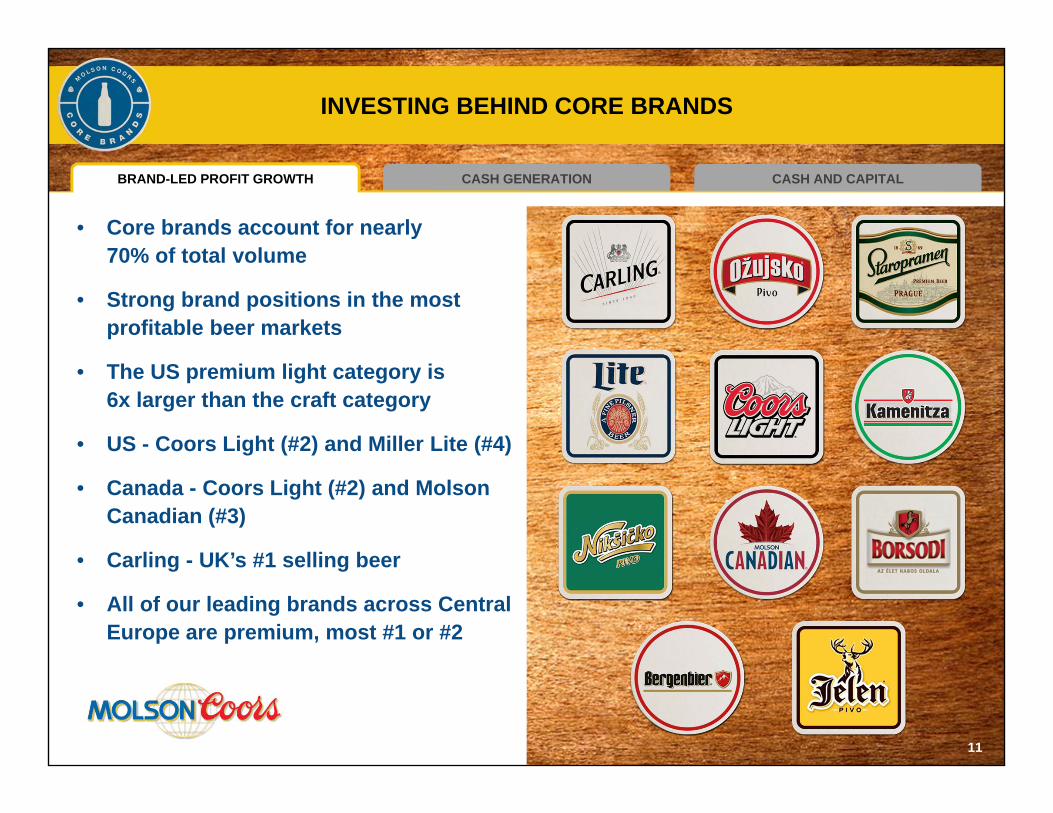
INVESTING BEHIND CORE BRANDSINVESTING BEHIND CORE BRANDS
• Core brands account for nearly 70% of total volume
• Strong brand positions in the most profitable beer markets
• The US premium light category is 6x larger than the craft category
• US - Coors Light (#2) and Miller Lite (#4)
• Canada - Coors Light (#2) and Molson Canadian (#3)
• Carling - UK’s #1 selling beer
• All of our leading brands across Central Europe are premium, most #1 or #2
11
CASH AND CAPITALCASH GENERATIONBRAND-LED PROFIT GROWTH
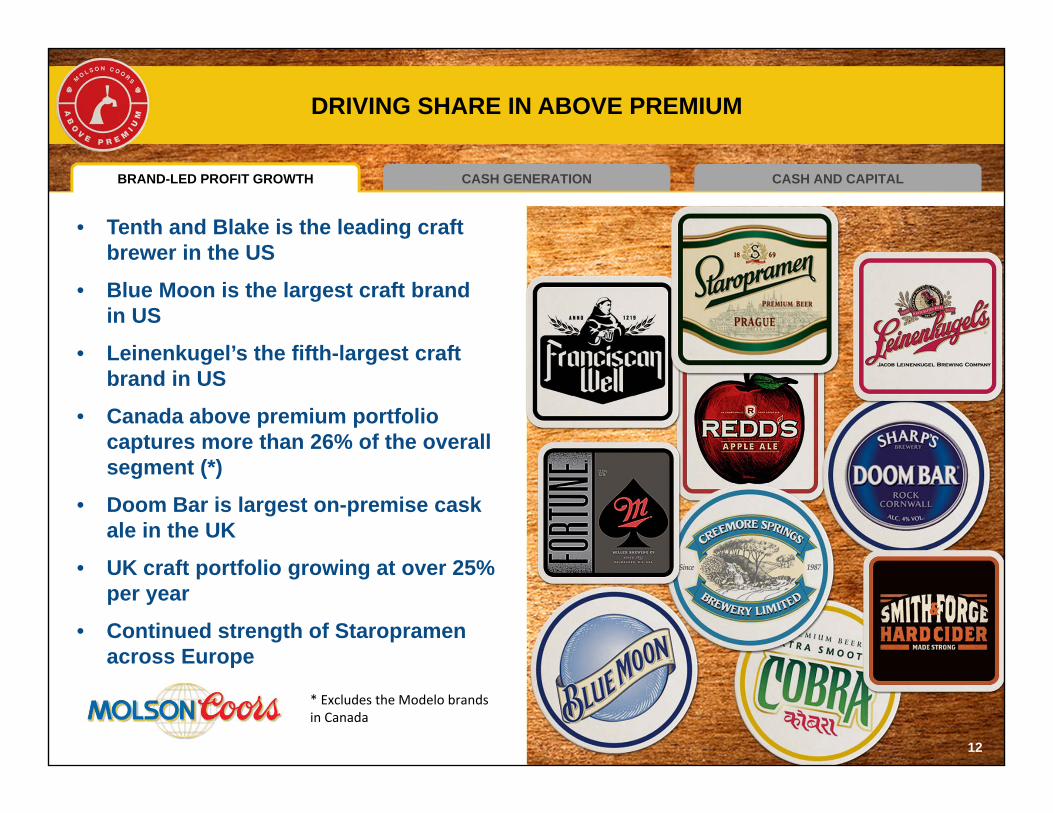
DRIVING SHARE IN ABOVE PREMIUMDRIVING SHARE IN ABOVE PREMIUM
• Tenth and Blake is the leading craft brewer in the US
• Blue Moon is the largest craft brand in US
• Leinenkugel’s the fifth-largest craft brand in US
• Canada above premium portfolio captures more than 26% of the overall segment (*)
• Doom Bar is largest on-premise cask ale in the UK
• UK craft portfolio growing at over 25% per year
• Continued strength of Staropramenacross Europe
12
* Excludes the Modelo brands in Canada
CASH AND CAPITALCASH GENERATIONBRAND-LED PROFIT GROWTH
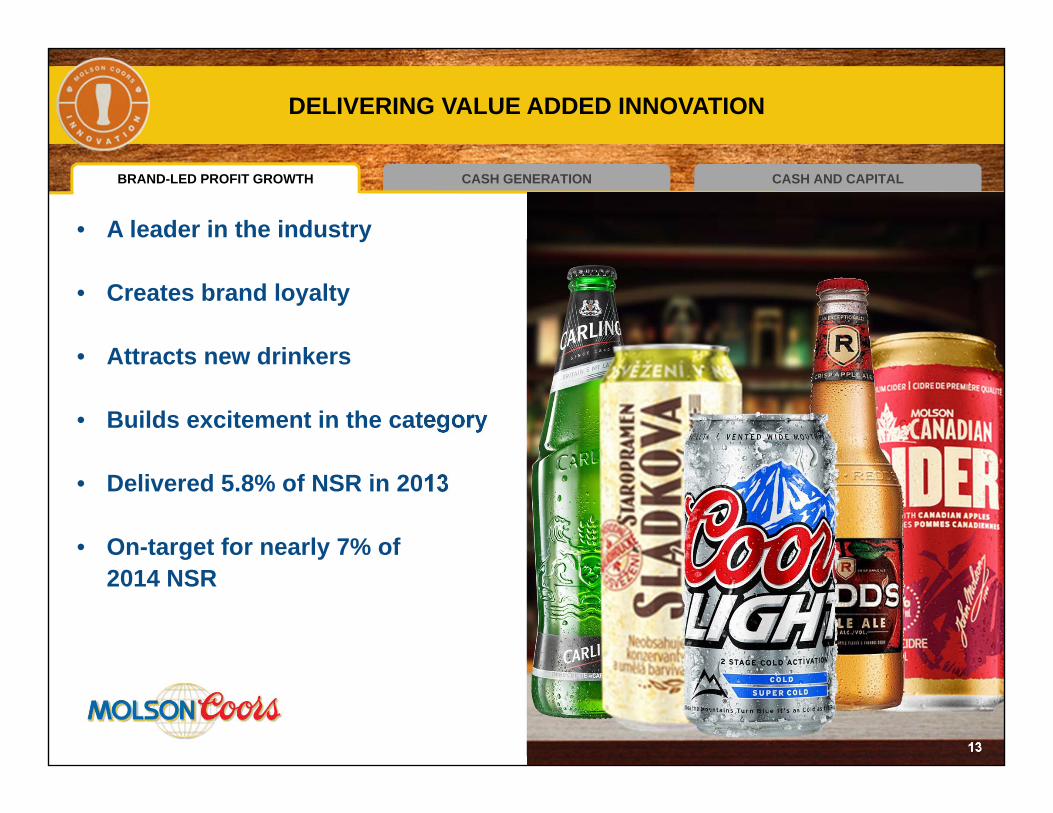
DELIVERING VALUE ADDED INNOVATIONDELIVERING VALUE ADDED INNOVATION
• A leader in the industry
• Creates brand loyalty
• Attracts new drinkers
• Builds excitement in the category
• Delivered 5.8% of NSR in 2013
• On-target for nearly 7% of 2014 NSR
13
CASH AND CAPITALCASH GENERATIONBRAND-LED PROFIT GROWTH
14
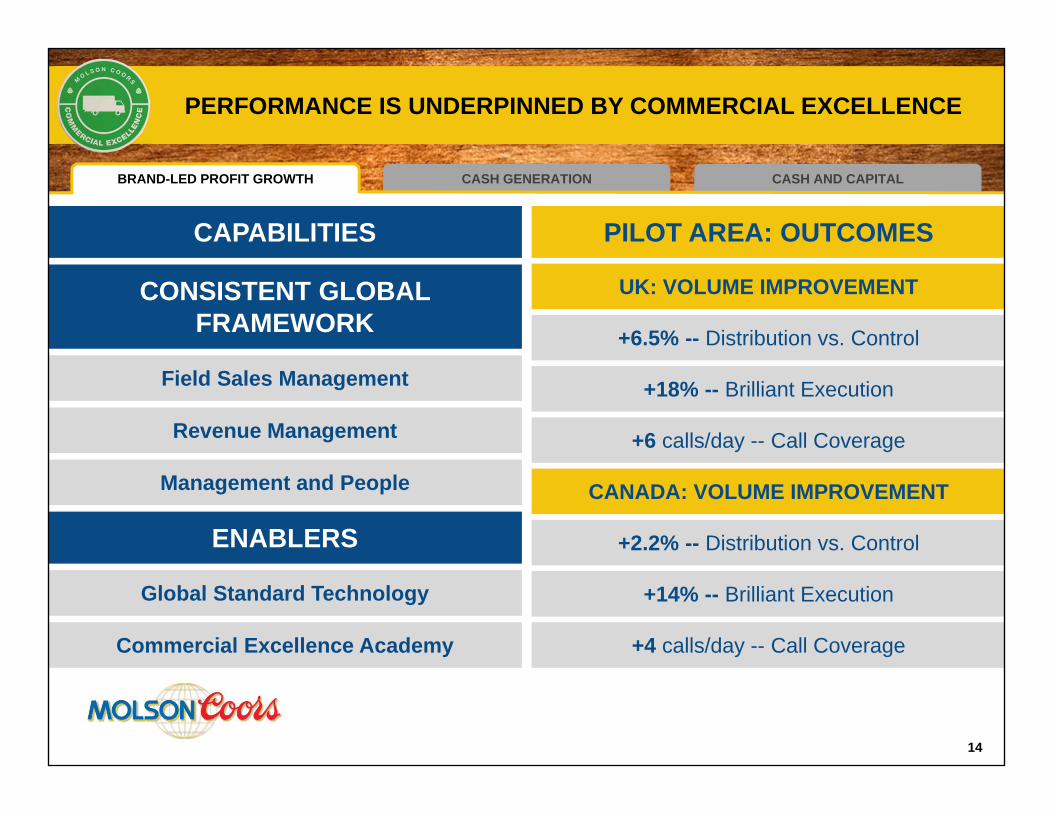
PERFORMANCE IS UNDERPINNED BY COMMERCIAL EXCELLENCEPERFORMANCE IS UNDERPINNED BY COMMERCIAL EXCELLENCE
CONSISTENT GLOBAL FRAMEWORK
CAPABILITIES
Management and People
Global Standard Technology
Commercial Excellence Academy
ENABLERS
PILOT AREA: OUTCOMES
Field Sales Management
Revenue Management
UK: VOLUME IMPROVEMENT
CANADA: VOLUME IMPROVEMENT
+6.5% -- Distribution vs. Control
+18% -- Brilliant Execution
+6 calls/day -- Call Coverage
+2.2% -- Distribution vs. Control
+14% -- Brilliant Execution
+4 calls/day -- Call Coverage
15
FINANCIAL UPDATE: GAVIN HATTERSLEY, CFOMOLSON COORS BREWING COMPANY
FINANCIAL UPDATE: GAVIN HATTERSLEY, CFOMOLSON COORS BREWING COMPANY
• Investing behind core brands• Driving share in above premium • Delivering value-added innovation• Commercial excellence• Cost reductions
BRAND-LED PROFITGROWTH
• Capital expenditure driving efficiencies• Working capital improvements
CASHGENERATION
• Disciplined cash use• Return-driven criteria• Short-term priority: deleverage
CASH AND CAPITAL ALLOCATION
16
DRIVING TOTAL SHAREHOLDER RETURN WITH PACC MODELDRIVING TOTAL SHAREHOLDER RETURN WITH PACC MODEL
ProfitAfter
CapitalCharge
(TSR)TOTAL
SHAREHOLDER RETURN
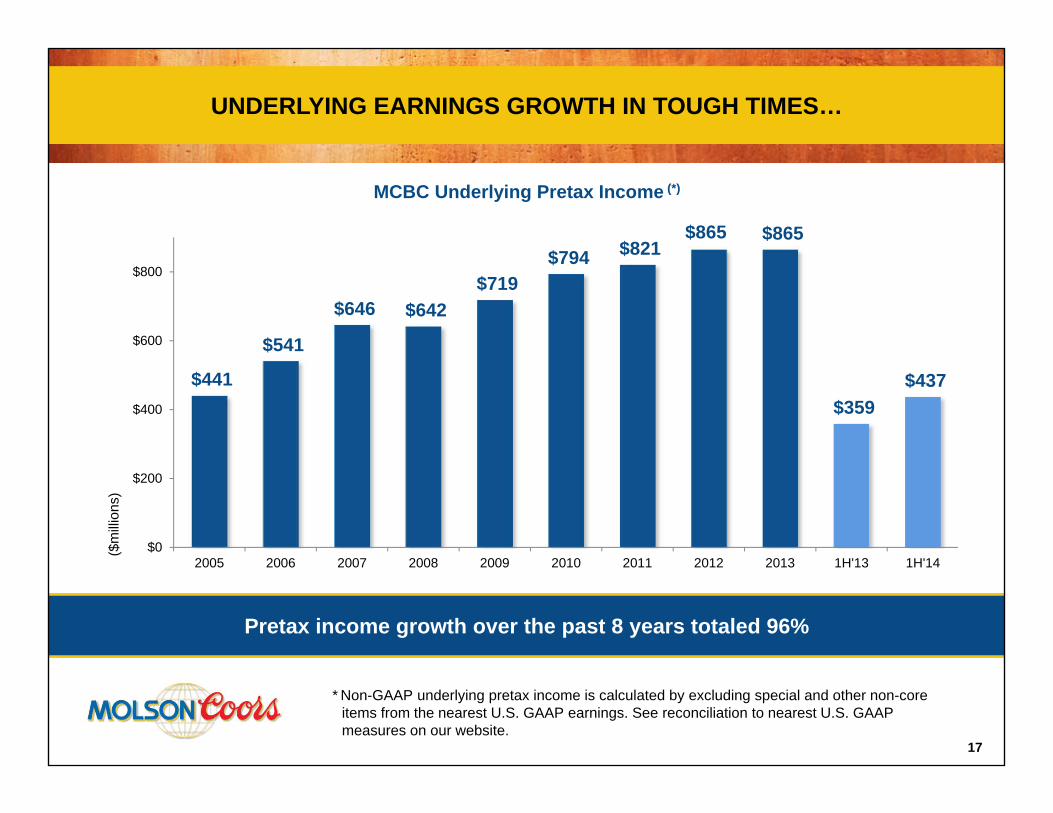
$441
$541
$646 $642 $719
$794 $821 $865 $865
$359 $437
$0
$200
$400
$600
$800
2005 2006 2007 2008 2009 2010 2011 2012 2013 1H'13 1H'14
($m
illio
ns)
MCBC Underlying Pretax Income (*)
17
UNDERLYING EARNINGS GROWTH IN TOUGH TIMES…UNDERLYING EARNINGS GROWTH IN TOUGH TIMES…
* Non-GAAP underlying pretax income is calculated by excluding special and other non-core items from the nearest U.S. GAAP earnings. See reconciliation to nearest U.S. GAAP measures on our website.
Pretax income growth over the past 8 years totaled 96%
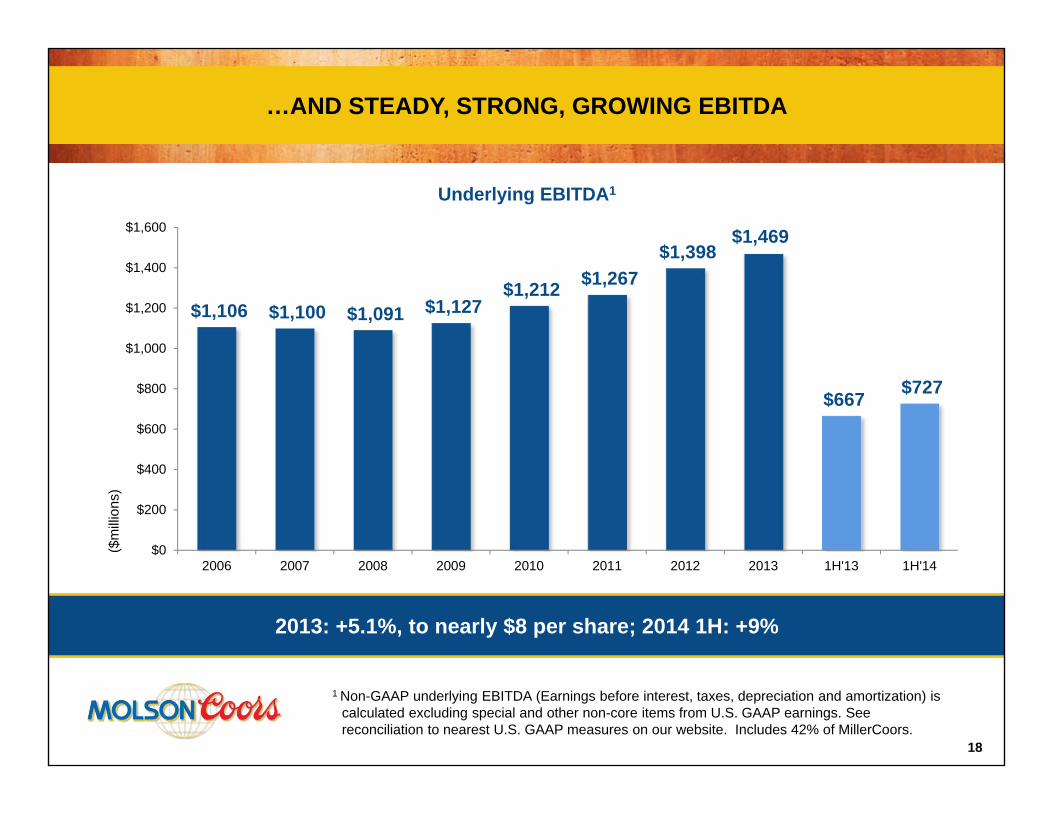
$1,106 $1,100 $1,091 $1,127 $1,212 $1,267
$1,398 $1,469
$667 $727
$0
$200
$400
$600
$800
$1,000
$1,200
$1,400
$1,600
2006 2007 2008 2009 2010 2011 2012 2013 1H'13 1H'14
($m
illio
ns)
Underlying EBITDA1
18
…AND STEADY, STRONG, GROWING EBITDA…AND STEADY, STRONG, GROWING EBITDA
1 Non-GAAP underlying EBITDA (Earnings before interest, taxes, depreciation and amortization) is calculated excluding special and other non-core items from U.S. GAAP earnings. See reconciliation to nearest U.S. GAAP measures on our website. Includes 42% of MillerCoors.
2013: +5.1%, to nearly $8 per share; 2014 1H: +9%
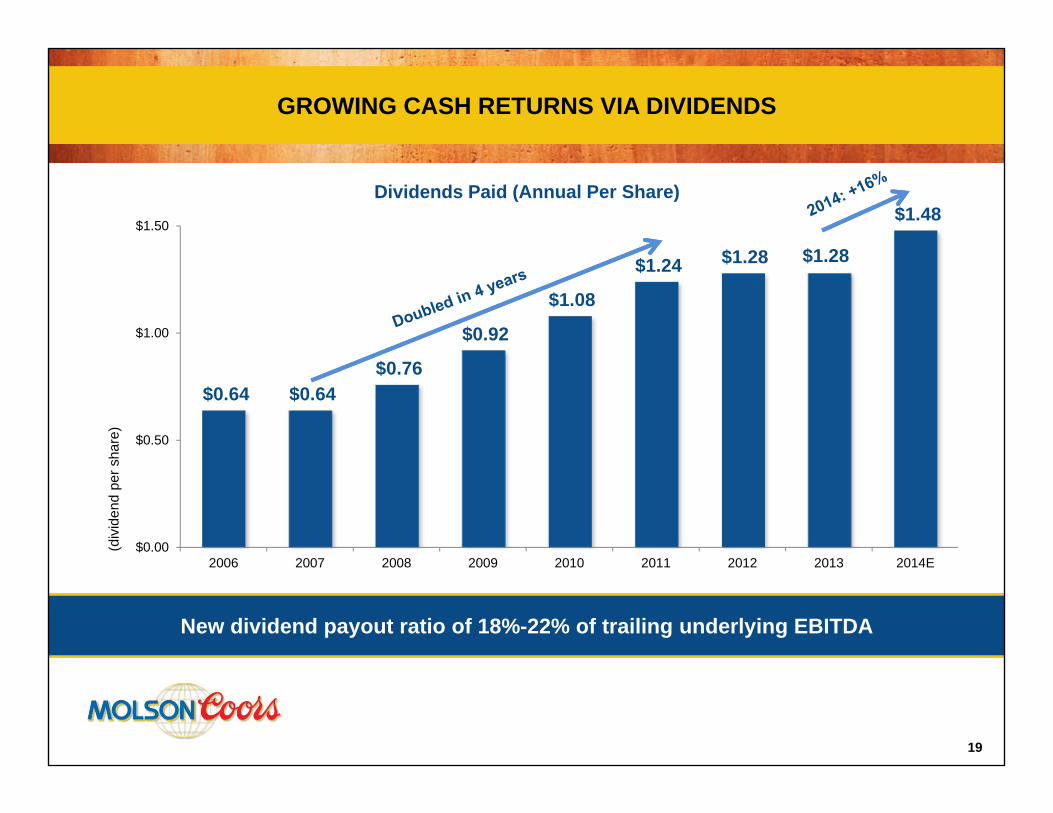
$0.64 $0.64 $0.76
$0.92
$1.08
$1.24 $1.28 $1.28
$1.48
$0.00
$0.50
$1.00
$1.50
2006 2007 2008 2009 2010 2011 2012 2013 2014E
(div
iden
d pe
r sha
re)
Dividends Paid (Annual Per Share)
19
GROWING CASH RETURNS VIA DIVIDENDSGROWING CASH RETURNS VIA DIVIDENDS
New dividend payout ratio of 18%-22% of trailing underlying EBITDA
CASH AND CAPITALCASH GENERATIONBRAND-LED PROFIT GROWTH
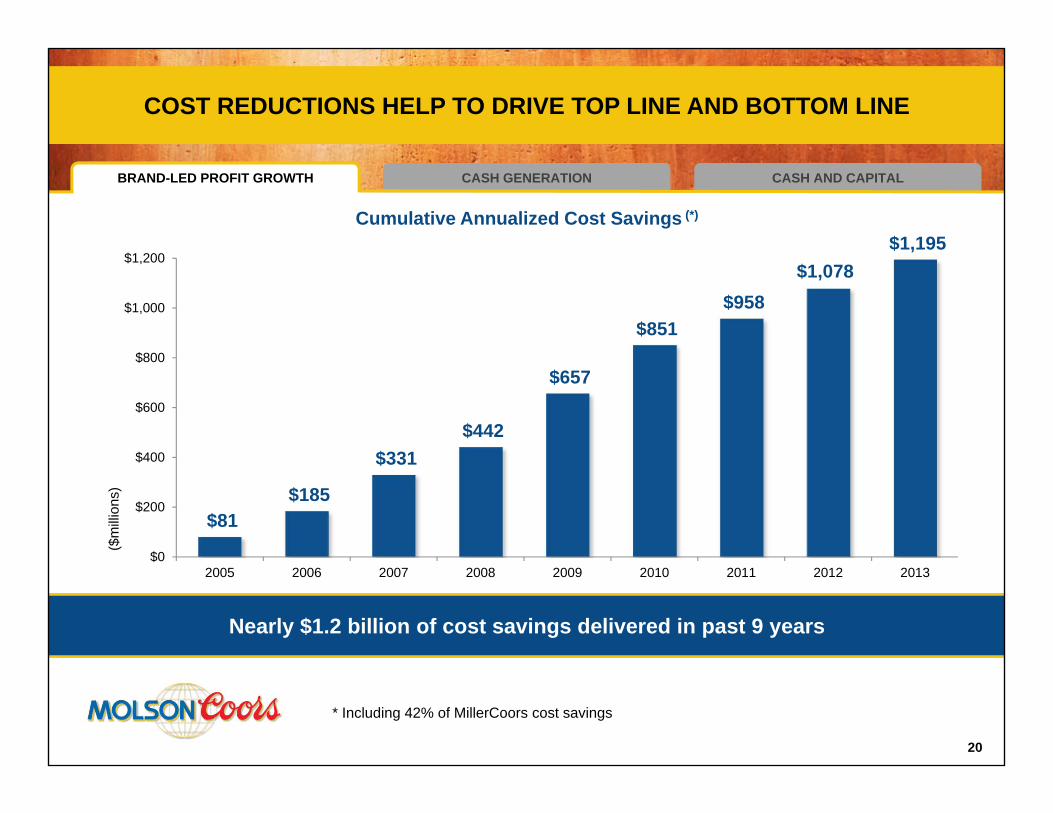
$81 $185
$331 $442
$657
$851 $958
$1,078 $1,195
$0
$200
$400
$600
$800
$1,000
$1,200
2005 2006 2007 2008 2009 2010 2011 2012 2013
($m
illio
ns)
Cumulative Annualized Cost Savings (*)
20
COST REDUCTIONS HELP TO DRIVE TOP LINE AND BOTTOM LINECOST REDUCTIONS HELP TO DRIVE TOP LINE AND BOTTOM LINE
* Including 42% of MillerCoors cost savings
Nearly $1.2 billion of cost savings delivered in past 9 years
CASH AND CAPITALCASH GENERATIONBRAND-LED PROFIT GROWTH
21
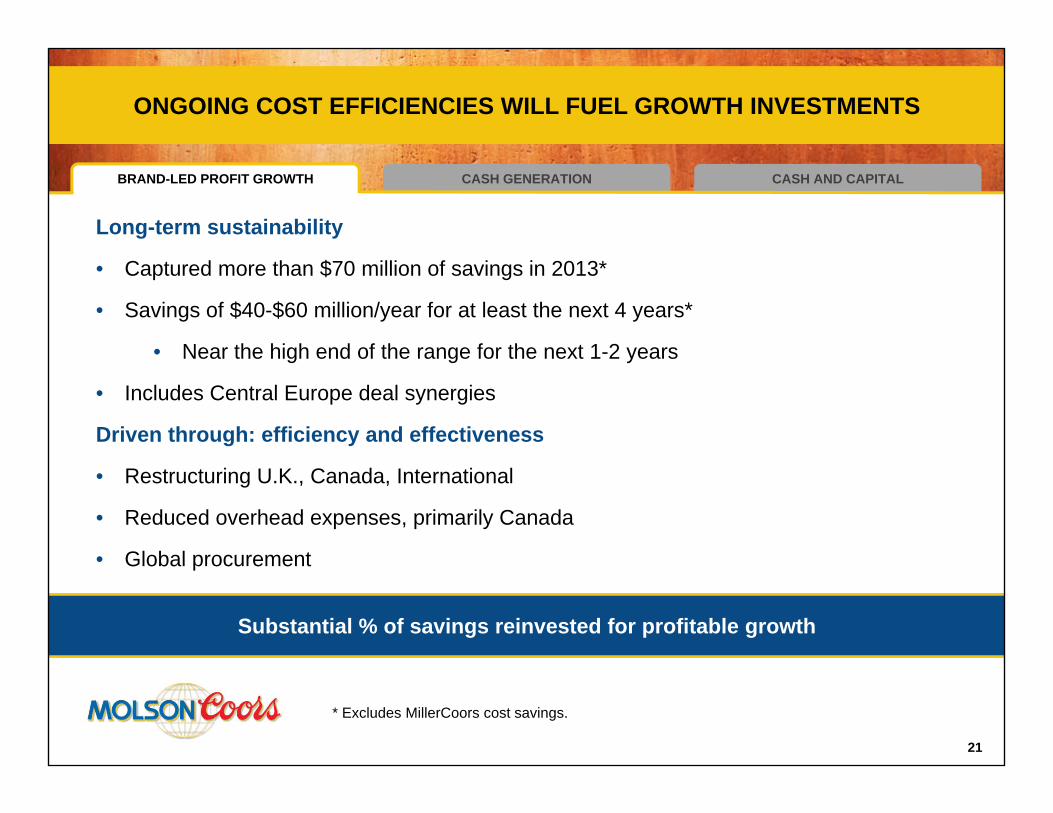
ONGOING COST EFFICIENCIES WILL FUEL GROWTH INVESTMENTSONGOING COST EFFICIENCIES WILL FUEL GROWTH INVESTMENTS
Long-term sustainability
• Captured more than $70 million of savings in 2013*
• Savings of $40-$60 million/year for at least the next 4 years*
• Near the high end of the range for the next 1-2 years
• Includes Central Europe deal synergies
Driven through: efficiency and effectiveness
• Restructuring U.K., Canada, International
• Reduced overhead expenses, primarily Canada
• Global procurement
* Excludes MillerCoors cost savings.
Substantial % of savings reinvested for profitable growth
CASH AND CAPITALBRAND-LED PROFIT GROWTH CASH GENERATION
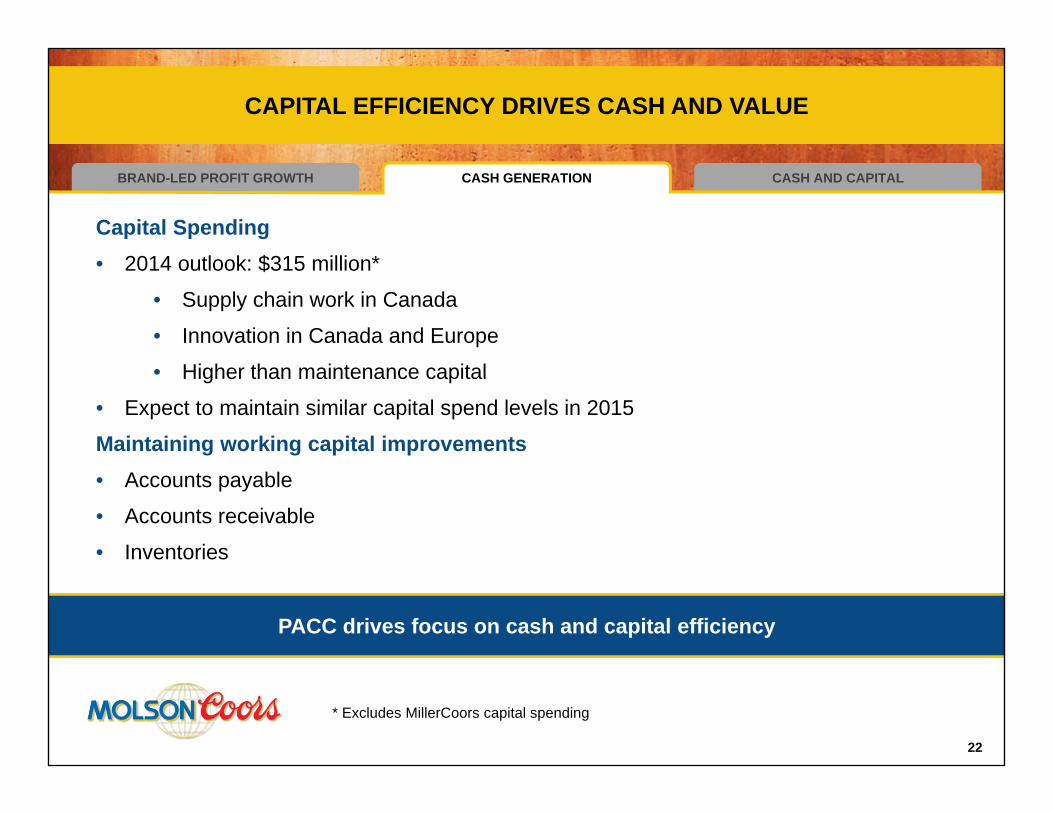
Capital Spending• 2014 outlook: $315 million*
• Supply chain work in Canada
• Innovation in Canada and Europe
• Higher than maintenance capital
• Expect to maintain similar capital spend levels in 2015
Maintaining working capital improvements• Accounts payable
• Accounts receivable
• Inventories
22
CAPITAL EFFICIENCY DRIVES CASH AND VALUECAPITAL EFFICIENCY DRIVES CASH AND VALUE
* Excludes MillerCoors capital spending
PACC drives focus on cash and capital efficiency
CASH AND CAPITALBRAND-LED PROFIT GROWTH CASH GENERATION
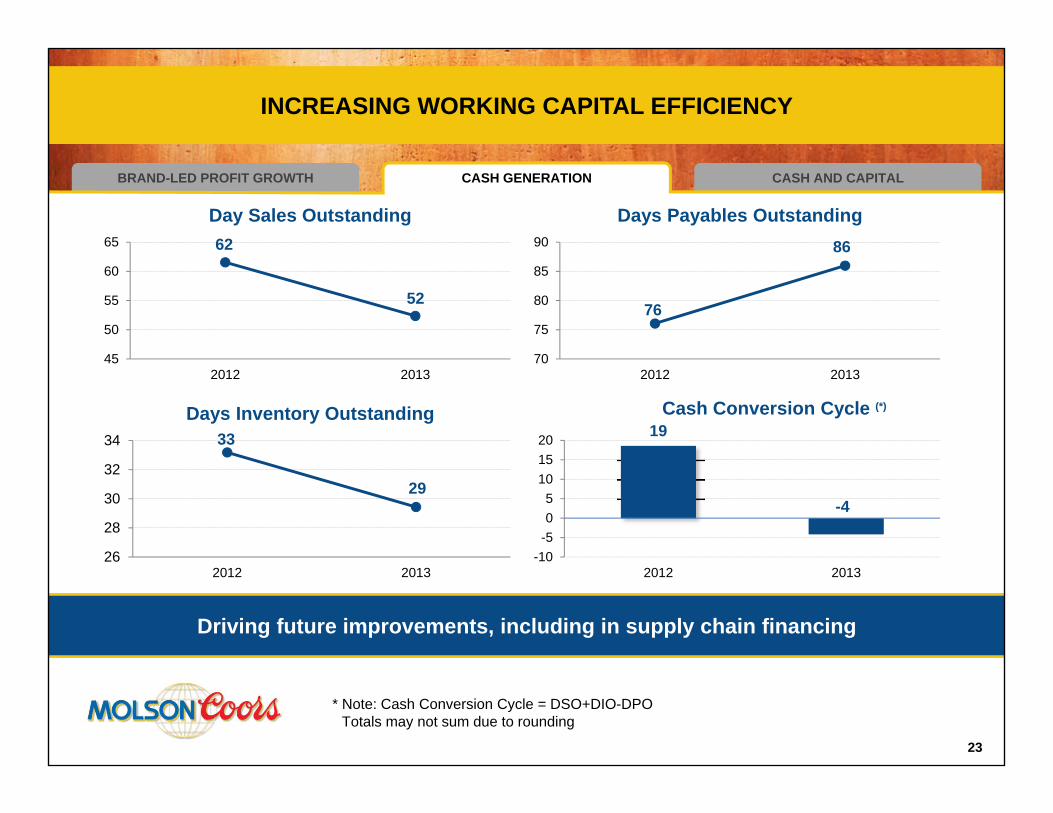
INCREASING WORKING CAPITAL EFFICIENCYINCREASING WORKING CAPITAL EFFICIENCY
62
52
45
50
55
60
65
2012 2013
Day Sales Outstanding
23
19
-4
-10-505
101520
2012 2013
Cash Conversion Cycle (*)
76
86
70
75
80
85
90
2012 2013
Days Payables Outstanding
33
29
26
28
30
32
34
2012 2013
Days Inventory Outstanding
* Note: Cash Conversion Cycle = DSO+DIO-DPO Totals may not sum due to rounding
Driving future improvements, including in supply chain financing
CASH AND CAPITALBRAND-LED PROFIT GROWTH CASH GENERATION
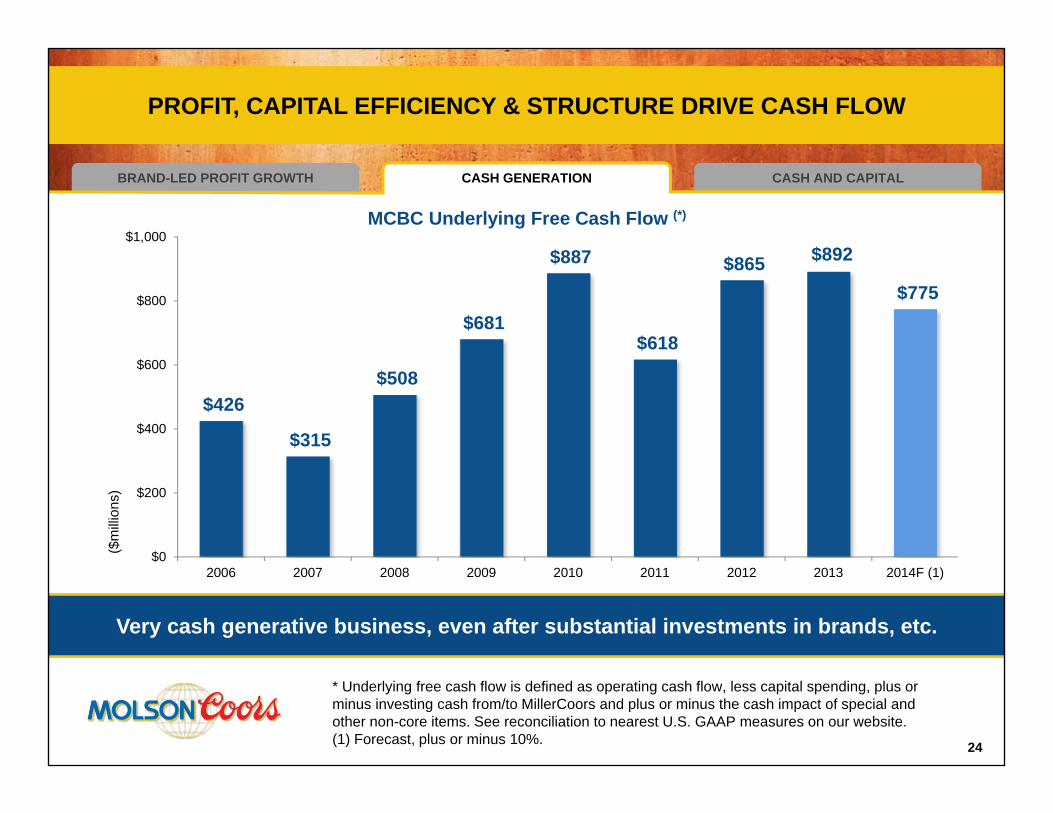
PROFIT, CAPITAL EFFICIENCY & STRUCTURE DRIVE CASH FLOWPROFIT, CAPITAL EFFICIENCY & STRUCTURE DRIVE CASH FLOW
$426
$315
$508
$681
$887
$618
$865 $892
$775
$0
$200
$400
$600
$800
$1,000
2006 2007 2008 2009 2010 2011 2012 2013 2014F (1)
($m
illio
ns)
MCBC Underlying Free Cash Flow (*)
24
* Underlying free cash flow is defined as operating cash flow, less capital spending, plus or minus investing cash from/to MillerCoors and plus or minus the cash impact of special and other non-core items. See reconciliation to nearest U.S. GAAP measures on our website. (1) Forecast, plus or minus 10%.
Very cash generative business, even after substantial investments in brands, etc.
CASH GENERATIONBRAND-LED PROFIT GROWTH CASH AND CAPITAL
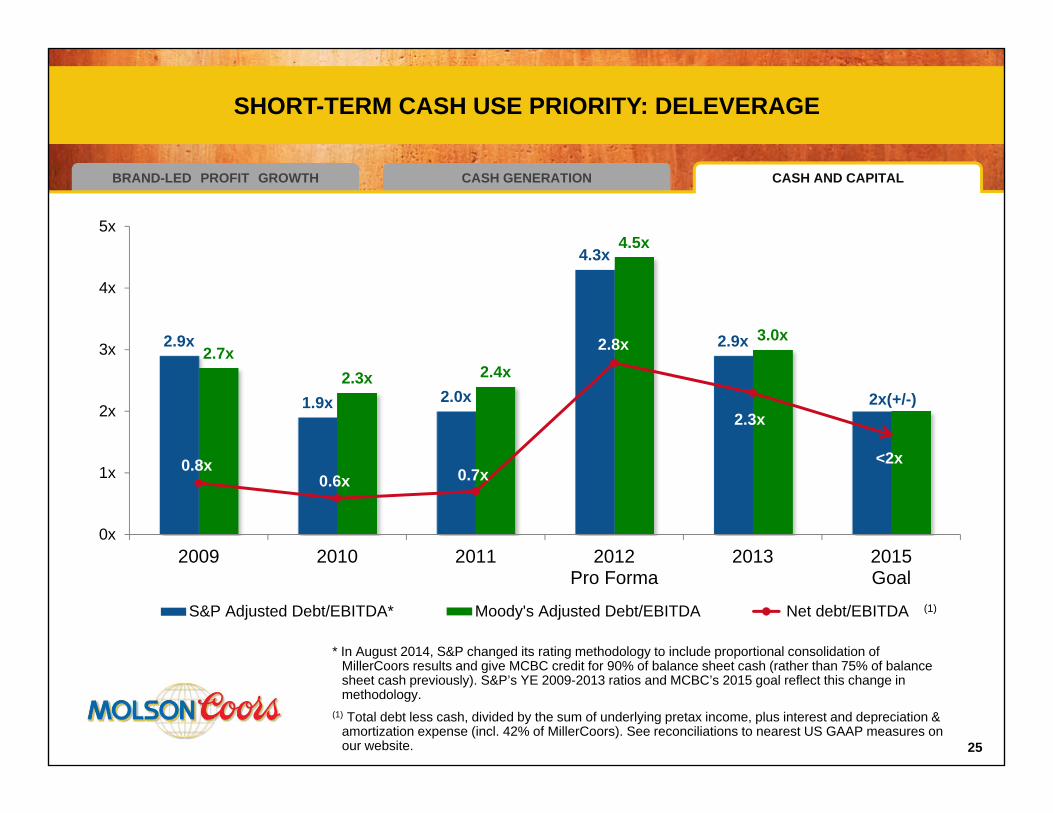
SHORT-TERM CASH USE PRIORITY: DELEVERAGESHORT-TERM CASH USE PRIORITY: DELEVERAGE
2.9x
1.9x 2.0x
4.3x
2.9x
2x(+/-)
2.7x2.3x 2.4x
4.5x
3.0x
0.8x0.6x 0.7x
2.8x
2.3x
0x
1x
2x
3x
4x
5x
2009 2010 2011 2012Pro Forma
2013 2015Goal
S&P Adjusted Debt/EBITDA* Moody's Adjusted Debt/EBITDA Net debt/EBITDA
<2x
(1)
25
* In August 2014, S&P changed its rating methodology to include proportional consolidation of MillerCoors results and give MCBC credit for 90% of balance sheet cash (rather than 75% of balance sheet cash previously). S&P’s YE 2009-2013 ratios and MCBC’s 2015 goal reflect this change in methodology.
(1) Total debt less cash, divided by the sum of underlying pretax income, plus interest and depreciation & amortization expense (incl. 42% of MillerCoors). See reconciliations to nearest US GAAP measures on our website.
CASH GENERATIONBRAND-LED PROFIT GROWTH CASH AND CAPITAL
26
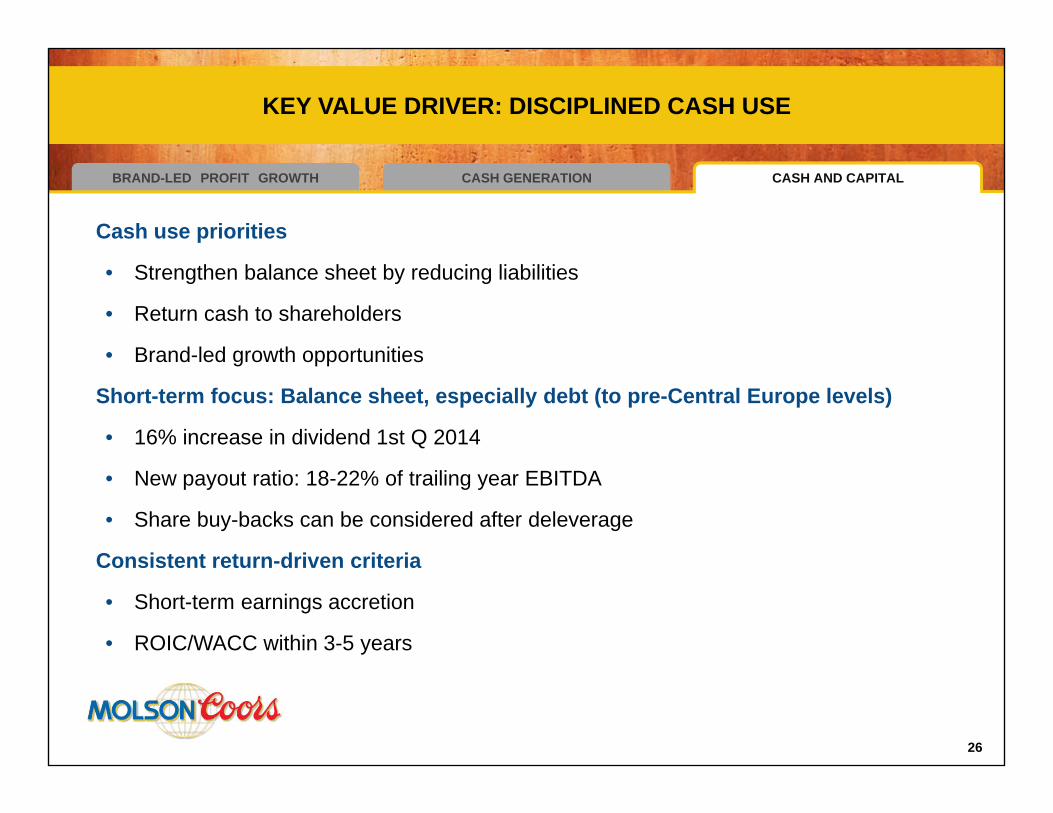
KEY VALUE DRIVER: DISCIPLINED CASH USEKEY VALUE DRIVER: DISCIPLINED CASH USE
Cash use priorities
• Strengthen balance sheet by reducing liabilities
• Return cash to shareholders
• Brand-led growth opportunities
Short-term focus: Balance sheet, especially debt (to pre-Central Europe levels)
• 16% increase in dividend 1st Q 2014
• New payout ratio: 18-22% of trailing year EBITDA
• Share buy-backs can be considered after deleverage
Consistent return-driven criteria
• Short-term earnings accretion
• ROIC/WACC within 3-5 years
BRAND-LED PROFITGROWTH
CASHGENERATION
CASH AND CAPITAL ALLOCATION
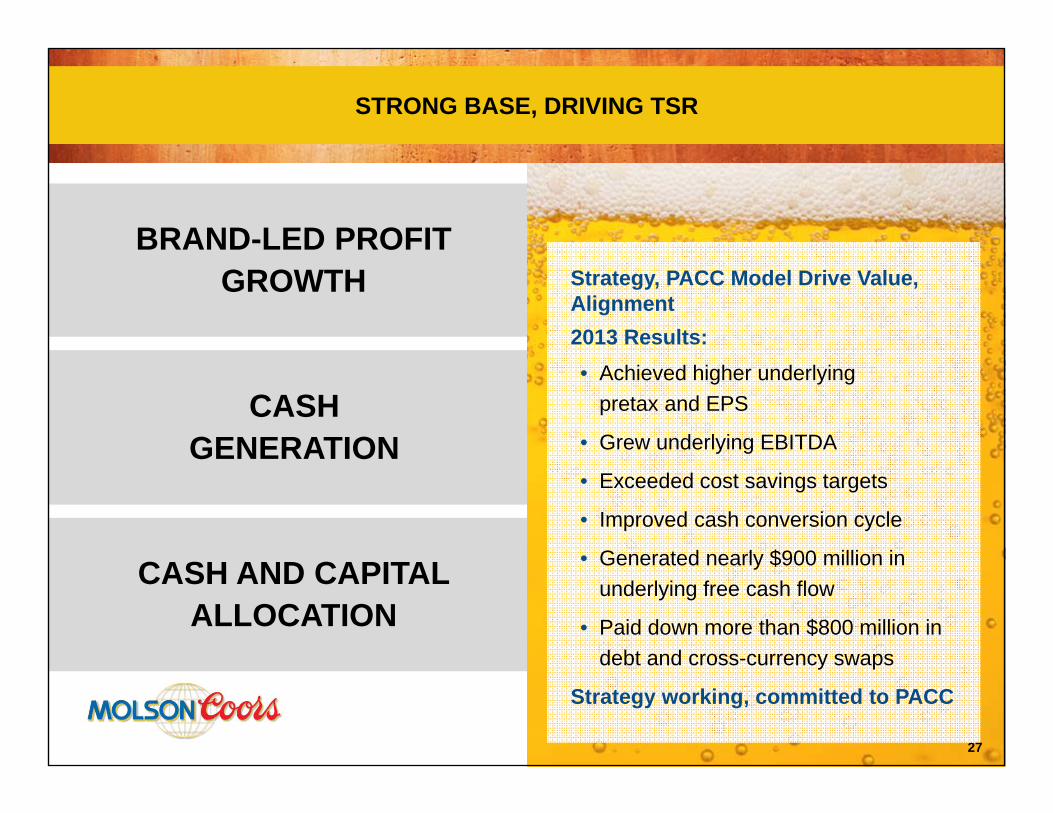
STRONG BASE, DRIVING TSRSTRONG BASE, DRIVING TSR
27
Strategy, PACC Model Drive Value, Alignment2013 Results: • Achieved higher underlying
pretax and EPS
• Grew underlying EBITDA
• Exceeded cost savings targets
• Improved cash conversion cycle
• Generated nearly $900 million in underlying free cash flow
• Paid down more than $800 million in debt and cross-currency swaps
Strategy working, committed to PACC

28
PETER SWINBURN, PRESIDENT & CEO MOLSON COORS BREWING COMPANYPETER SWINBURN, PRESIDENT & CEO MOLSON COORS BREWING COMPANY
• The fundamentals of our business are strong and improving
• We have a disciplined growth strategy that is yielding improved financial results
• Delivering an increasing share of revenue from innovation
• Strong growth of core brands
• Accelerated success in the above premium category
• Increased operational efficiency, and
• Strong commercial execution
• Well positioned to grow as economic conditions continue to improve
29
MOLSON COORS IS WELL POSITIONEDMOLSON COORS IS WELL POSITIONED
M O L S O N C O O R S B R E W I N G C O M PA N Y B A R C L AY S B A C K T O S C H O O L C O N F E R E N C E
S E P T E M B E R 4 , 2 0 1 4
30