Embed Size (px)
Citation preview

MONASH UNIVERSITY
AUSTRALIA
Department of Economics Discussion Papers ISSN 1441-5429
Industrial Concentration and Competition in Malaysian Manufacturing
Mita Bhattacharya
No. 14/01
Monash University Victoria 3800
Australia

O 200 1 Mita Bhattacharya All rights reserved. No part of this paper may be reproduced in any form, or stored in a retrieval system, without the prior written permission of the author.
Industrial Concentration and Competition in Malaysian Manufacturing*
Mita Bhattachaya Department of Economics, Monash University, Australia 31 45
Phone: 613-9903-282 1, Fax: 61 3-9903-2292 E-mail: Mita.Bhattacharya@,Buseco.monash.edu.au
Abstract: Industrial concentration is the most widely studied area among various elements of market structure in the industrial organization literature. This paper is a first attempt to analyse the determinants of changes in industry concentration over time in the case of Malaysia. Using a partial adjustment model, a cross-sectional analysis is carried out against a sample of manufacturing industries between l986 and 1996. Domestic factors in influencing competition eg, capital intensity, advertising intensity and market size are found to be significant in most cases to explain the level of concentration. Considering variable rate of adjustment of concentration, an increase in labour productivity of the large firms and high entry rates are found to be significant for faster adjustment towards equilibrium level. Compared with the other developed countries, the annual rate of structural adjustment is found to be slow in the case of the Malaysian manufacturing.
Keywords: Asia, Malaysia, manufacturing, competition, market power JEL Classifications: L10, L1 1
*Thanks to the Department of Statistics, Kuala Lumpur, Malaysia for supplying unpublished data set. The usual disclaimer applies.

l. Introduction
MARKET structure represents the number and size distribution of firms, as
we11 as entry barriers for potential competitors. Competition among firms
provides internal and allocative efficiency with reward to the consumers and
sellers. In a market, few dominant firms may enjoy economic power and
charge higher prices to extract excess profits.' The inefficiency of
monopolised markets and the efficiency of competitive ones are a major
justification for the key role that antitrust policy plays in most market
economies. Concentration measures are useful summary statistics that
provide some indication of the extent to which a particular industry differs
from the competitive ben~hmark.~ Following the structure-conduct-paradigm
(SCP) analysis, a high degree of concentration may cause monopolistic or
oligopolistic behaviour; raising monopoly profit and lessen ~ o m ~ e t i t i o n . ~
Since the 1890s, antitrust laws remain the basic industrial policy of
the U.S. economy. The policies are designed to limit market structure, which
could lead to the exercise of monopoly power, such as resale price
maintenance, and dominance due to merger activities.' Following the U.S.,
other developed countries have introduced regulatory units like the U.K.,

Japan, Canada, Germany, Australia and New zealand? Official acts and
regulatory bodies exist in some developing countries like Korea, Thailand,
India and Sri Lanka. In Malaysia, competition policy was non-existent until
1994. The Ministry of Domestic Trade and Consumer Affairs then
introduced the Competition Bill to increase the efficiency and
competitiveness of industries.
During the 1970s and 1980s, the Malaysian economy experienced
rapid economic development. The industrialisation program was export-led
based on mainly manufacturing industries. The government introduced
various reform programs to increase the competitiveness in domestic as well
as in international markets. In early phases of industrialisation, concentration
of manufacturing was high. Concentration has been changing due to the
effect of various government policies. A dynamic analysis of market
structure may be helpfbl in formulating policy reform programs. The
literature on developing countries is almost non-existent in this direction.
This paper explains industrial concentration in a steady-state model.
An extension of this model incorporates a dynamic version, with incomplete
and industry-specific adjustment to deviations of concentration from its
steady-state level.

The paper is organised as follows. Section 2 provides an overview of the
manufacturing within the Malaysian industrialisation program and highlights
the trends of concentration in the manufacturing sector. A comparison of
concentration with some OECD countries is included here. A summary of
the literature is covered in Section 3. The model and data set are described in
Section 4. Section 5 analyses the empirical findings and compares these with
developed countries. The concluding section sumniarises findings and
related policy iniplications for the economy.
2. Industrialisation, Concentration and Malaysian Manufacturing
2.1. Industrialisation and Malaysian Manufacturing
The manufacturing sector plays a major role in the Malaysian economy. The
rate of growth in manufacturing output has been rapid since independence in
1957. In the 1950s and 1960s, the manufacturing sector started to become
significant. Import substitution industries targeted local markets. Impressive
growth was recorded for food, beverages and tobacco, printing -publishing
and construction materials. To promote such industries, the government
directly and indirectly subsidised the establishment of new firms and

protected the domestic market. Annual growth of the sector was 10 percent
during the 1960s.
The import substitution phase generated little new employment and
soon became saturated in the small domestic market. By the mid 1960s, the
inherent weaknesses of this phase were becoming clear. Since 1965, the
Federal Industrial Development Authority (FIDA) with the help of the Raja
Mohar Committee encouraged the expansion of manufactured exports
through various reform programs including changes in the labour market.
The switch to an export-oriented industrialisation strategy in late the
1960s boosted the export sector. The manufacturing sector shifted its
direction of growth from import-substitution industries to focus on resource-
based (mainly rubber, tin, palm oil and timber) processing and labour-
intensive industries.
Since the 1970s, non-resource based (mainly electrical and electronic
components) export industries have developed. The share of manufactured
exports increased rapidly from 1 1.9 percent in 1970 to 2 1.4 percent in 1975.
New Free Trade Zones (FTZs) and export processing zones (EPZs) were
introduced to expand exports using imported equipment and material.
During this period government intervened heavily in the market in the form

of public sector ownership in industries like food, chemicals, iron and steel,
petroleum, cement, transport, tyres and tubes, and wood products.
In the early 1980s, there was a major push for heavy industries. This
included the Malaysian car project, a sponge iron and steel billet plant, a
petroleum refining and petrochemical project, three motorcycle plants, two
new cement factories and a paper mill. Most of these involved expensive
foreign technology and caused large amounts of government borrowing. Due
to economic liberalisation, there was an increase in foreign direct investment
and private ownership.
In the mid 1980s, Malaysia's terms of trade fell sharply; the economy
was in c r i ~ i s . ~ Since 1987, the economy has been through the fifth phase of
its industrialisation program. Two Industrial Master Plans (IMP) along with
the Seventh Malaysian Plan (7MP) recognise the problems and provide
recommendations to improve the efficiency, productivity and
competitiveness of the manufacturing ~ e c t o r . ~
The manufacturing sector still contributes a large share of GDP,
employment and exports in the economy. The share of manufacturing in
total gross domestic product has increased from less than 10 percent in the
late 1950s to 26 percent in thirty years. Manufacturing -employment
increased from 8.4% in 1970 to 20.1 % in 1999.
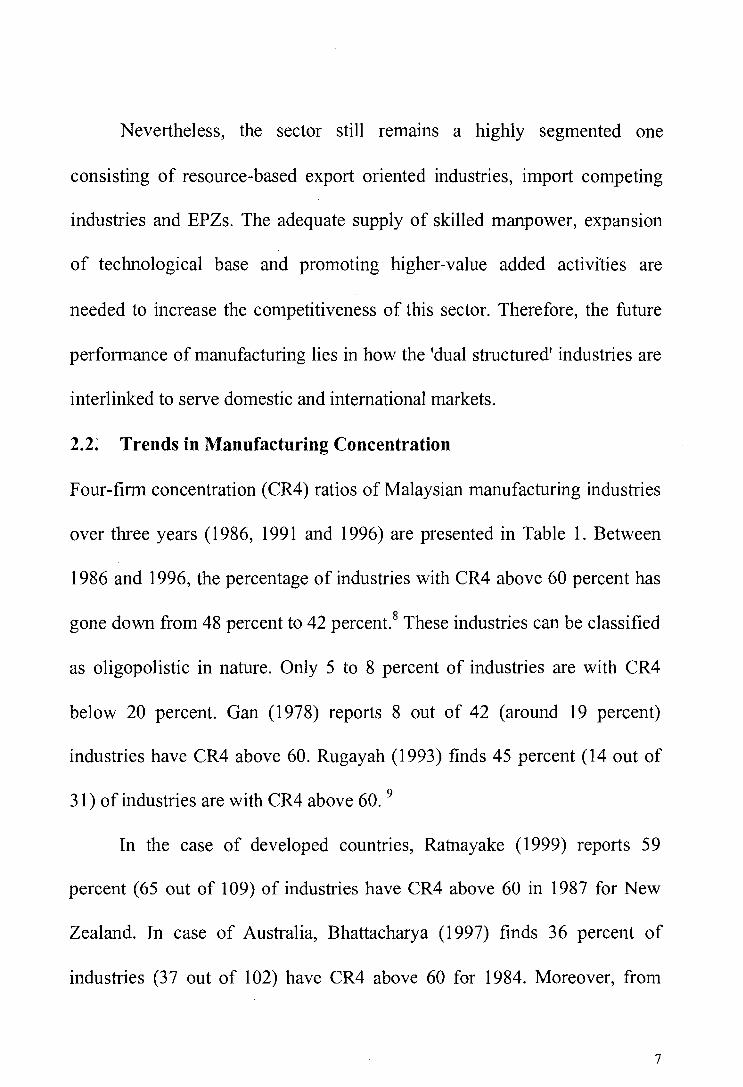
Nevertheless, the sector still remains a highly segmented one
consisting of resource-based export oriented industries, import competing
industries and EPZs. The adequate supply of skilled manpower, expansion
of technological base and promoting higher-value added activi'ties are
needed to increase the conlpetitiveness of this sector. Therefore, the future
performance of manufacturing lies in how the 'dual structured' industries are
interlinked to serve domestic and international markets.
2.2: Trends in Manufacturing Concentration
Four-firm concentration (CR4) ratios of Malaysian manufacturing industries
over three years (1 986, 1991 and 1996) are presented in Table l . Between
1986 and 1996, the percentage of industries with CR4 above 60 percent has
gone down from 48 percent to 42 percent.8 These industies can be classified
as oligopolistic in nature. Only 5 to 8 percent of industries are with CR4
below 20 percent. Gan (1978) reports 8 out of 42 (around 19 percent)
industries have CR4 above 60. Rugayah (1993) finds 45 percent (14 out of
3 l ) of industries are with CR4 above 60.
In the case of developed countries, Ratnayake (1999) reports 59
percent (65 out of 109) of industries have CR4 above 60 in 1987 for New
Zealand. In case of Australia, Bhattacharya (1997) finds 36 percent of
industries (37 out of 102) have CR4 above 60 for 1984. Moreover, from
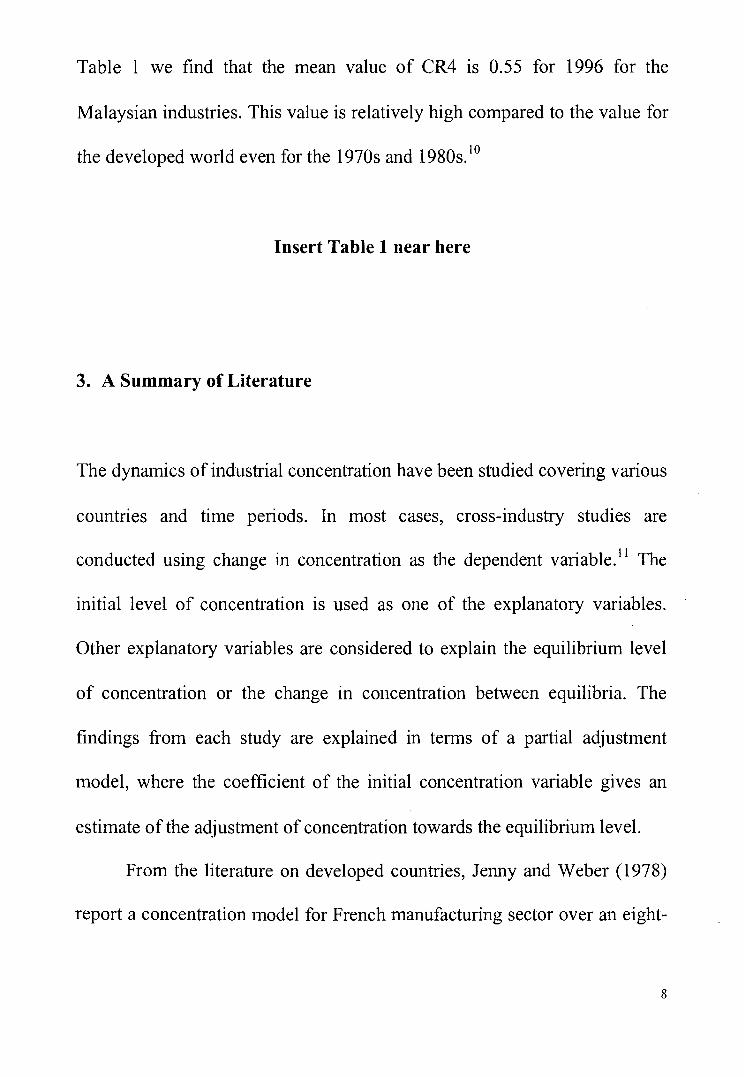
Table 1 we find that the mean value of CR4 is 0.55 for 1996 for the
Malaysian industries. This value is relatively high compared to the value for
the developed world even for the 1970s and 1980s.'~
Insert Table 1 near here
3. A Summary of Literature
The dynamics of industrial concentration have been studied covering various
countries and time periods. In most cases, cross-industry studies are
conducted using change in concentration as the dependent variable." The
initial level of concentration is used as one of the explanatory variables.
Other explanatory variables are considered to explain the equilibrium level
of concentration or the change in concentration between equilibria. The
findings from each study are explained in terms of a partial adjustment
model, where the coefficient of the initial concentration variable gives an
estimate of the adjustment of concentration towards the equilibrium level.
From the literature on developed countries, Jenny and Weber (1978)
report a concentration model for French manufacturing sector over an eight-

year period. For their full sample, the estimated adjustment coefficient is
0.02. Levy (1985) with U.S. data estimates a lagged concentration
coefficient between 0.30 and 0.43 for an eleven-year period. Geroski et a1
(1987) consider a varying rate of adjustment model for the US
manufacturing sector. They find an adjustment coefficient as 0.123 for a
four-year period. In Australia, Dixon (1987) estimates a lagged
concentration coefficient of 0.12 over a fourteen-year period. Table 2
surnqarises the annual adjustment rate from various studied2
Insert Table 2 near here
4. The Model Specification and Data
4. I The Concentration Model
For the purpose of discussing the causes of concentration in Malaysia, we
speci@ the model in two versions. Following is an equilibrium (or steady
state) version.

4.1. l An Equilibrium Version
The market share of the dominant firms (measured by four-firm
concentration ratio; CR4). CR4 depends in general on entry barriers (BTE),
demand conditions (DD) and international influences (IF).
ie, CR4 =$ (BTE, DD, IF)
where BTE includes proxies for barriers to entry. These barriers reduce
competition and are a source of market power. Capital intensity (WL) and
advertising intensity (ADV) as barriers can have a positive sign with
concentration.13 Demand condition depends on market size (MS). Larger the
value of MS, the lower is the level of concentration.
Among international influences, we include export intensity
(EXPINT) and import penetration (IMPINT) to incorporate international
linkages. Manufactured exports are expanding in Malaysia, hence
broadening the market. A negative relationship can be expected with
concentration.14 Due to the effect of trade liberalisation, a potential import
threat increases efficiency among domestic firms. Small inefficient firms can
not survive due to foreign competition and this causes an increase in I
concentration. A positive sign is expected with concentration.

Summarising the arguments above, we have the following steady-state
concentration model, with the expected direction of impact indicated
underneath each explanatory variable:
C R ~ ~ * is the steady-state concentration level expressed in terms of four-firm
concentration ratio. l 5 A linear specification is chosen for simplicity and to
enhance comparability with previous studies. The coefficients of the
explanatory variables in (1) can be estimated using ordinary least squares
regression.
4.1.2. The Change in Concentration over Time
The direction of the change in concentration is a function of actual
concentratio~l relative to steady-state concentration ( c R ~ ~ * ) . Any deviation
of the actual level of concentration from its equilibrium level should result in
an adjustment process that leads to changes in concentration. With less than

complete adjustment between periods, we have the partial adjustment model
given by
where ACR4t is the change in concentration between two periods.'G For
empirical purposes, we assume t=1996 and t-1=1986. y is the partial
adjustment, which is the same in all industries and takes values between zero
and one. C R ~ ~ * is the equilibrium level of concentration in period t and is
determined as in (l).
Substituting from (1) into (2) to remove the unobservable equilibrium
concentration level, C R ~ ~ * , and solving for CR4t, gives the following
equation for the linear dynamic model:
When equations in the form of (3) are estimated using linear estimating
techniques, the coefficient of the lagged concentration variable, CR4t- l ,

gives the estimate of one minus the partial adjustment.17 The coefficients of
the remaining explanatory variables are estimates of the long-run impact
multiplied by the partial adjustment.
Alternatively, a model with partial adjustment that varies across
industries is given by
where yi is the partial adjustment for the ith industry. yi should be non-
negative and less than one for all values of its determinants. yi is specified as
a function of variables related to the internal and external adjustment process
of the industry. The variable adjustment coefficient in our model depends on
relative labour productivity of the top four firms (RP), net entry of firms into
an industry (NETENT) and on export intensity (EXPINT). The higher the
productivity of the top four firms, the greater is the competition within
industries, and faster adjustment will take place towards an equilibrium level
of concentration. An increase in the NETENT variable also will operate in a
similar direction, so a positive effect is expected on y.
In Malaysia, manufacturing exports have become increasingly important
over recent years. To incorporate the role of exports in influencing industry

structure we add the EXPINT variable. If exports are profitable, domestic
firms become more competitive and a faster rate of adjustment can be
expected? On the other hand, most of the manufactured exports are low-
value added products, hence less attractive for new firms to enter inlo the
market. Hence, we can have effect on y in both directions.
If the relationship between the variables of interest and the degree of
adjustment is assumed to be linear, we have
The partial adjustment coefficient in (5) is not directly observable.
However, substituting (1) and (5) into (4) and solving for CR4t-l, gives the
following version in non-linear form as follows:

All variables are as described above, with the indicated direction of impact
carried over from ( l ) and (5). When equations in the form of (6) are
estimated using non-linear estimating techniques, each coefficient gives a
direct estimate of the parameter of the underlying model. The estimated
partial adjustment for an industry is then determined indirectly by
multiplying the industry value of each of the variables, RPt, NETENTt,t-l
and EXPINTt, by its estimated coefficient, and then adding the estimated
constant, ao.
4.2 The Data
The Department of Statistics (West Malaysia, Kuala Lumpur) conducts a
survey of manufactures; the Department supplied unpublished data for 1986
and 1996. The choice of the time period was dictated by the availability of
data. Considering all variables we have ended up with 102 manufacturing

industries at the five-digit level. The descriptions of variables with means
and standard deviations are given in the Appendix la.
5. The Findings
5.1. Levels of Concentration
First, we discuss the findings from the steady-state version for determinants
of the level of concentration, so that we can compare the findings from the
dynamic versions later on. The first column of Table 3 presents the findings
fiom the steady-state model. Ordinary least squares regression is used for
estimation.I9 The four-firm concentration in l996 is the dependent variable.
Except EXPINT, each of the estimated coefficients for the steady-state
model in Table 2, has the expected sign. The adjusted ~2 is 0.189, lower
than findings fiom overseas studies.20 MS, KL and IMPINT are significant
at the one- percent level, while the estimated coefficient of EXPINT is not
statistically significant. All the proxies of entry barriers are quite significant
in influencing the shares of top firms in Malaysian manufacturing. IMPINT
variable has a positive and strong significant effect on concentration. This
reflects the fact that foreign competition helps in improving competition

among domestic firms, hence increasing the level of concentration among
manufacturing industries.
Insert Table 3 near here
5.1. Changes in Concentration
The second column of Table 3 reports the results of estimates for the model,
in which the speed of adjustment, y, is uniform across industries. Each
estimated coefficient has the expected sign. The coefficient of lagged
concentration is significantly less than one at the one percent level, so the
restriction that no adjustment to long-run equilibrium is achieved during the
ten-year interval is rejected. Also, the restriction that full adjustment to
equilibrium is achieved, y = 0, is clearly rejected. Comparing with the
steady-state version, MS and KL are still significant at the one- percent
level, but ADV lost its significance. Most importantly, international linkages
viz, EXPINT and IMPINT are correctly signed and significant at the five-
percent level. The partial adjustment over ten years is one minus the
estimated coefficient of lagged concentration or 0.262, which corresponds to
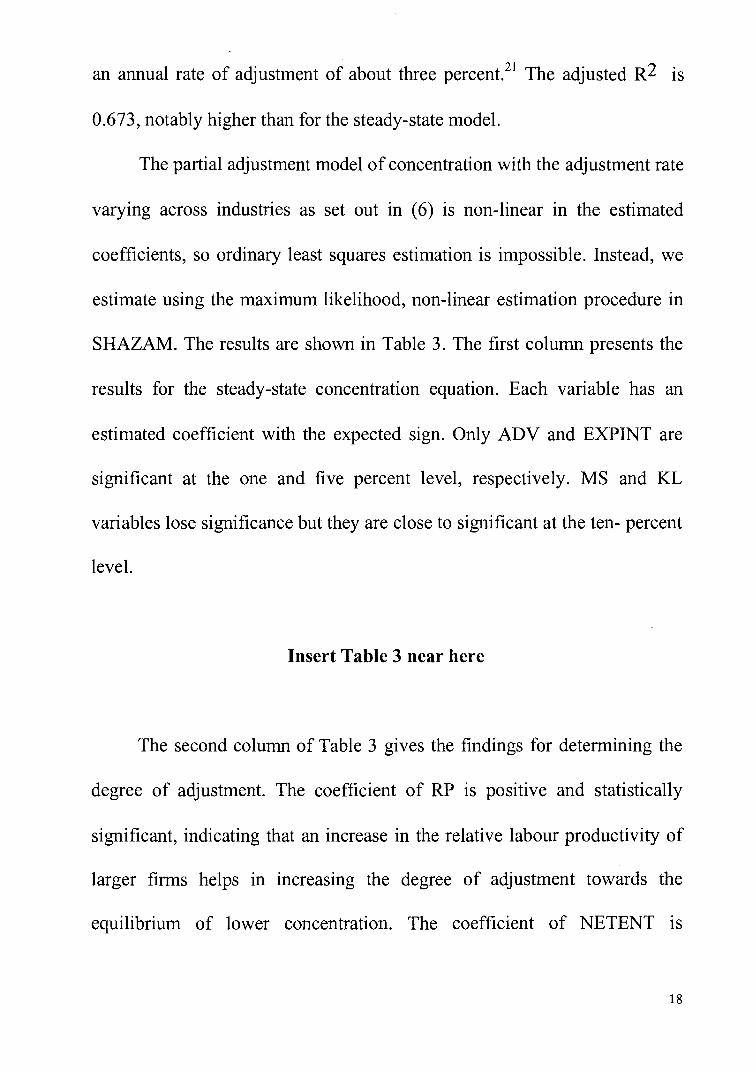
an annual rate of adjustment of about three percent.2' The adjusted ~2 is
0.673, notably higher than for the steady-state model.
The partial adjustment model of concentration with the adjustment rate
varying across industries as set out in (6) is non-linear in the estimated
coefficients, so ordinary least squares estimation is impossible. Instead, we
estimate using the maximum likelihood, non-linear estimation procedure in
SHAZAM. The results are shown in Table 3. The first column presents the
results for the steady-state concentration equation. Each variable has an
estimated coefficient with the expected sign. Only ADV and EXPINT are
significant at the one and five percent level, respectively. MS and KL
variables lose significance but they are close to significant at the ten- percent
level.
Insert Table 3 near here
The second column of Table 3 gives the findings for determining the
degree of adjustment. The coefficient of RP is positive and statistically
significant, indicating that an increase in the relative labour productivity of
larger firms helps in increasing the degree of adjustment towards the
equilibrium of lower concentration. The coefficient of NETENT is

significant at the one percent level, higher the net entry, faster is the speed of
adjustment. The EXPINT variable is insignificant and negative.22
The likelihood-ratio strongly supports rejection of the restriction that
the coefficients associated with varying adjustment rates across industries
are collectively zero. This implies the varying adjustment rate specification
of the model is statistically superior to the common adjustment rate
~~ecif icat ion.~ ' The mean value of the partial adjustment coefficient across
industries in the sample is 0.328. This implies an annual adjustment rate of
around four- percent, which is only around one percent higher than the rate
we found from the model with common adjustment across industries. Thus,
these results confirm (although not strongly) the finding by Geroski, et a1
(1 987) for U.S. manufacturing that the assumption of a common adjustment
rate across industries leads to downward bias in the estimate.
Applying the estimated coefficients to the values of the variables
yields estimates of the partial adjustment of concentration for each industry,
with a standard deviation of 0.283 around the mean of 0.328. The great bulk
of values (72 out of 102) are within one standard deviation of the mean
value, implying annual rates of adjustment for these industries are close to
four-percent on average. There are a few outliers among the estimated
values of partial adjustment. In particular, five values are greater than one,

implying perverse adjustment. These are all for industries with high
efficiency and net entry. Only one industry has an adjustment coefficient of
0.989.
In summary, the annual adjustment rates are generally low but similar
to the most of the estimates from overseas studies cited in Table 2.24 In most
developed countries, regulatory practices started at early dates. Considering
that the Malaysian government has taken the initiatives only in the recent
past, the annual adjustment rate although slow is easily comparable with that
of developed countries.
6. Summary and Policy Implications
The Malaysian manufacturing industries are more concentrated compared to
the most of developed countries. However, the level of concentration has
declined significantly over the period under consideration. The government
efforts to reduce monopoly power and increase competition have been
success~l in this direction.
The increase in use of capital, market opportunities and removing
barriers are major development strategies under the ~ M P . ~ ~ This is supported
in our econometric findings. The significance of capital intensity, advertising

intensity and market size variables are established in explaining the level of
concentration of Malaysian manufacturing.
Considering the dynamics of concentration over a ten-year period, we
find the annual adjustment rate of concentration is still slow compared to the
developed countries. Labour productivity and the net entry of firms are
found to be significant in explaining the adjustment procedure. In this
respect, the current government through its privatization program may be
successfully contributing towards the increase in efficiency and
competitiveness. Also, an increase in the speed of structural adjustment
integration among industries is needed to serve the domestic as well as
international market.
Finally, the successful implementation of competition policy requires
the adequate interaction among consunlers, producers and government. In
this respect, the government should continue its lead role in achieving this
objective.

References
Bhattacharya, M. and Bloch, H 'Adjustment of Profits: Evidence from Australian Manufacturing', 7 (2) Empirica, 157-73.
Bhattacharya, M. and Wong, K.N.(2000). Do Profits Persist Over Time?: The Case of Malaysian Manufacturing, The International Business Symposium in New Era, Kuala Lumpur, Malaysia, Conference Proceedings.
Carlton, D.W. Pearloff, J.M. (1994). Modern Industrial Organization, Second Edition, Harper Collins College Publishers, NY, USA.
Chou, T.C. (1986). Concentration, Profitability and Trade in a Simultaneous Equation Analysis: The Case of Taiwan, Journal of Industrial Economics, 34 (4), 429-43.
Comanor, W.S.and Wilson, T. A. (1979), The Effect of Advertising on Competition: A survey', Journal of Economic Literature, 17,435-76.
Cowling, K and Waterson, M. (1976), Price-Cost Margins and Market Structure, Economics, 43, (1 71), August, , 267-74.
Frischtak, C.R. (1 989). competition Policies for Industrializing Economies, The World Bank, Washington. D.C.
Gan, W.B. (1978). The Relationship between Market Concentration and Profitability in Malaysian Manufacturing Industries, Malayan Economic Review, 23 (l) , 1 - 1 1.
Dixon, R. (1987). The Role and Consequences of Structural Change in Recent Australian Economic Growth, (Centre for Economic Policy Research, The Australian National University, Canberra).
Geroski, P., Masson, R. & Shaanan, J. (1987). 'Dynamic market models in industrial organization, International Journal of Industrial Organization 5, 93-100.

Hart, P., Clarke, R. (1 980). Concentration in British Industry 1935- 75, (Cambridge University Press, Cambridge).
Hannah, L., Kay, J.A. (1977). Concentration in Modern Industry: Theory, Measurement and the U.K. Experience, (Macmillan, London).
Jenny, F., Weber, A. (1978). The Determinants of Concentration Trends in the French Manufacturing Sector, Journal of Industrial Economics, 26, 193- 207.
Levy, D. (1 985). Specifying the Dynamics of Industrial Concentration, Journal of Industrial Economics, 34, 55-68.
Jomo, K.S. (1989). Beyond 1990: Considerations for a New National Development Strategy, Institute of Advanced Studies, University of Malaya, Kuala Lumpur.
Jomo, K.S. (1990). Economic Growth and Structural Change in the Malaysian Economy, London, Macmillian.
Jomo, K.S. (ed), (1993). Industrialising Malaysia: Policy, Per$ormance, Prospects, London, Routledge.
Kalirajan, K.P. (1 99 1). Government Intervention in Malaysian Manufacturing Industries: a Suggested Methodology of Measurement, Applied Economics, 23, 10%- 1 10 1.
Kalirajan, K.P. (1 993a), Simultaneity Bias: Is it Relevant in the Developing Countries Industrial Structure-Performance Paradigm?, Journal of Quantitative Economics, 9, (l), 147-56.
Kalirajan, K.P. (1 993b). On the Simultaneity between Market Concentration and Profitability: The Case of a Small-Open Developing Country', International Economic Journal, 7 (l), 3 1-48.
Malaysia (1 989). Mid-Term Review of the Fifih Malaysia Plan 1986-1990, Government Printer, Kuala Lumpur.
Malaysian Management Review (1989). Special Issue on the New Economic Policy, 24, 2, August, Kuala Lumpur.

Martin, S.(1979), Advertising, Concentration, and Profitability: The Simultaneity Problem, Bell Journal of Economics, 10,639-47.
Rugayah, M (1993). The Measurement of Market Concentration in Malaysian Manufacturing Industries, Malaysian Management Review, 29 (2).
Sawyer, M. (1982), On the Specification of Structure Performance Relationship, European Economic Review, 17,295-306.
Schmalensee, R, (1 99 l),'Inter-Industry Studies of Structure and Performance', in Schmalensee, R and Willig, R.D: (ed) Handbook of Industrial Organization ', Vo12.
Scherer, F.M., Ross, D. (1990). Industrial Market Structure and Economic Performance, (Third Edition), Boston: Houghton Mifflin Company.
Shepherd, W.G., (1 982). Causes of Increased Competition in the U.S. economy, Review of Economics and Statistics, 64,6 1 3-26.
Shepherd, W.G., (1 997), ' The Economics of Industrial Organisation ', Fourth Edition, Prentice-Hall, New Jersey, USA.
Sieh-L., Mei L. & Susan Tho L. M., (1986). Malaysia Manufacturing Futures Survey 1986 Report, Faculty of Economics and Administration, University of Malaya, Kuala Lumpur.
Sieh-L., Mei L. & Susan Tho L. M., (1987). Malaysia Manufacturing Futures Survey 1987 Report, Faculty of Economics and Administration, University of Malaya, Kuala Lumpur.
Wright, N. (1 978), Product Differentiation, Concentration and Changing Concentration, Review of Economics and Statistics, 60, 628-3 1.
Yean, T.S. (1995). Productivity, Growth and Development in Malaysia, The Singapore Economic Review, 40 (l), 4 1-63.

Table 1: Percentage of Industries under Each Range of Four-Firm Concentration ~ a t i o in 1986,1991 and 1996
Four- firm Concentration 0-0.2
Mean Standard Deviation
Percentage of Industries (%)
L
ource: Prepared using data from the ~ e ~ a r t m e A t of Statistics. The maximum numbers of industries is taken into account from the data set.

Table 2: Estimated Annual Rate of the Partial Adjustment Coefficient for Different Countries
I Researcher(s) Country Period Numbe Estimated r of Annual
I l Years Adjustment Rate
Wright (1 978) U.S. 1947-63 16 0.008 I Jenny and France 1961-69 8 0.002 Weber ( l 978) Hart and U.K. 1958-68 10 0.027 Clarke (1 980) Levy (1 985) U.S. 1962-73 11 0.03 1 Geroski, U.S. 1963-67 4 0.032 Masson and S haanan
I (1 987) Dixon (1 987) Australia 1968-82 14 0.009
Note: Only Geroski et al(1987) consider varying rate of adjustment model.

Table 3: Results of the Steady-state Model and for the Dynamic Model, when y is Constant Across Industries (Ordinary Least Squares Estimation)
Steady-state Linear Dynamic Variable Model Model
Estimated Estimated Coefficient Coefficient
Column (2) Column ( l )
ADV
EXPINT
IMPINT
a Intercept 0.470 0.086
I ~2 (adjusted) 0-189 0.673
Note: CR496 is the dependent variable.

Figures in parentheses are heteroscedastic consistent t-ratios. a) Indicates coefficient is significant at the 0.01 level using a one-tailed
t-test. b) Indicates coefficient is significant at the 0.05 level using a one-tailed
t-test.

Table 4: Results of Estimation of the Dynamic Model, when y Varies Across Industries (Non-Linear Maximum Likelihood Estimation)
Variable L.-l MS
KL '
ADV
EXPINT
IMPINT
RP
NETENT
EXPINT
Steady-state coefficients
Adjustment coefficients
Notes: CR496 is the dependent variable.
Column ( l )
-0.00002 (1.24)
0.175 (1.23)
9. 146a (2.92)
-0.216~ (1.74)
0.016 (0.93) -
-
-
Column (2) -
-
-
-
-
0.2 1 9b (1.70)
0.00 1 a
(3.32)
-0.003 (0.41)

Figures in parentheses are t-ratios. a) Indicates coefficient is significant at the 0.01 level using a one-tailed
t-test. b) Indicates coefficient is significant at the 0.05 level using a one-tailed t-
test.

APPENDIX 1A: VARIABLES WITH DESCRIPTIVE STATISTICS
Industry sales accounted by the top four firms divided by total industry sales for 1996.
Industry sales accounted by the top four firms divided by total industry sales for 1986.
l
MS I Total industry value added for 1996.
I
WL I The average of capital expenditure over I employment for 1996.
ADVS Advertising expenses over sales for 1996.
EXPINT Export divided by sales for 1996.
IMPINT Import divided by sales plus import minus exports for 1996.
RP Value-added per worker of the top four firms over the value-added per worker for the industry, 1996.
NETENT Change in number of firms between 1986 I and 1996 with respect to 1986.
(Mean, Std Deviation) (0.523, 0.240)

APPENDIX l B: CALCULATION OF ANNUAL ADJUSTMENT RATES
A 1 B. l . For Linear Dynamic Model:
CR4t - CR4 t-l =y (CR4 t* - CR4 t-l)
CR4t - CR4tq = [l - ( l - y)n] (CR4t* - CR4 t-n )
CR4t = [l - (1 - y)"] CR4 t* + (1 - y)n CR4 t-n
Let, X = ( l - y)"
Then y = 1- X 'ln
X = 0.738 and h = 2.9%
A 1 B .2. For Non-Linear Dynamic Model:
CR4t- CR4t-l = y (CR4t* - CR4t-1 )
CR4t - CR4 t-n = [ l - (1 - y)"] (CR4 t* - CR4 t-n)
CR4t = [ l - (1 - y)"] (CR4 t* - CR4 t-n) + CR4 t-n
Let,Y =l - ( l - y ) "
Theny =l - (1 - Y ) 'ln
Y = 0.328 and h =3.8%

-
1 Cowling and Waterson (1 976) derive an oligopoly model of profit with
market structure elements and collusion among firms. Bhattacharya and
Bloch (2000) provide a summary of literature on persistence of profits.
2 Discussions on measures of industry concentration can be found in Carlton
and Perloff (1 994, Chapter 9), pp 344-47.
3 Sawyer (1 982) discusses the structure-performance relationships in detail.
On antitrust, see Scherer and Ross (1990).
or a summary of antitrust in other countries, see Shepherd (1997, pp 366-
67).
or more details see Jomo (1 989, 1990 and 1993)
7 Details are in Malaysian Management Review (1 989), and Malaysia
(1 989).
8 We follow Shepherd (1997) classification for the U.S. manufacturing
industries. He considers industries with oligopolistic, dominant and
monopoly behaviour if four-firm concentration is above 60 percent.
9 From the developing world, Go , Kamerschen and Delonne (Jr) (1999)
report mean CR4 as 68.15 percent for 83 manufacturing industries in
Philippine.
10 Average four-firm concentration was 47 percent for the US in 1972, and
43 percent for Argentina in 1984, see Frischtak ( l 989).

- -
1 1 Schmalensee ( l 99 1) for literature survey
l 2 The formula in Appendix Ib is used to find the annual rate of adjustment
for various studies from the coefficient of lagged concentration.
l 3 See Comanor and Wilson (1 979), Martin (1979) and Shepherd (1982,
1997)
l 4 Chou (1 986)
15 The Herfindahl index of concentration satisfies all desirable properties of
a concentration measure that are suggested by Hannah and Kay (1977). It
combines aspects of both the number and size distribution of firms. For the
sample, we do not have dis-aggregated data to find Herfindahl index.
Literature shows various concentrations measures are highly correlated and
provide similar findings.
'' Time-series data would be ideal. Due to non-availability of time-series
data we consider here cross-section analysis, see Martin (1979), Levy
(1 987).
17 We use estimating equations in the form or (3), with the level of
concentration as the dependent variable, rather than follow the practice of
many earlier studies and use the change in concentration as the dependent
variable. This allows for a more direct comparison of goodness of fit with
the estimating equations for the equilibrium model in (1) above and for the

model with varying speed of adjustment in concentration in (6) below.
Finally, we avoid a spurious relation that could arise from using an
independent variable, the lagged level of concentration, in calculating the
change in concentration as the dependent variable.
'' Import intensity as a determinant of adjustment coefficient was
considered, but the findings are insignificant and hence are not reported
here.
19 ' A simultaneous model is not considered. Kalirajan (1993a, b) shows
simultaneity is not prominent for the Malaysian manufacturing industries.
20 Levy (1 987), Ratnayake (1999).
2 1 Calculations of the compound annual rate of adjustment for both
models (linear and non-linear versions) are shown in Appendix Ib.
22 Till early the 1990s, most of the manufactured exports were low value
added products. Also the export sector was mainly based on Singapore,
Japan and U.S.
23 The log-likelihood ratio is 16.32, which exceeds the critical value,
24= 13.27, at the one percent significance level.

24 The existing overseas literature are based on old data set mostly during
1960s to early 1980s, the data set for this study is the most updated for the
Malaysian economy.
25 Yean (1995) reports capital as a major source of growth, contributing 22.4
percent of growth in Malaysian manufacturing between 1986 and 199 1.
26 The Department of Statistics (Kuala Lumpur, Malaysia) supplied all
industry data, from the Census of Manufacturing Industries, West Malaysia
and Surveys of Manufacturing Industries for the financial year 1986 and
1996. This table presents descriptive statistics of 102 common industries.

Titles in the Department of Economics Discussion Papers (New Series commenced October 1999)
0 1-99 Should China be Promoting Large-scale Enterprises and Enterprise Groups? Russell Smyth
02-99 Division o-f Labor, Coordination, and Underemployment Heling Shi
03-99 Attitude Choice, Economic Change, and Welfare Yew-Kwang Ng and Jianguo Wung
04-99 Economic Reform, Overlapping Property Rights, and Polarisation in the Real Estate Market .I Ram Pillarisetii
05-99 Econonlic Reform, Growth and Inequality in Human Developn~ent in Transitional Economies ,I Rum Pillarisetti and Mark Mcgillivruy
06-99 Efficiency and Liquidity in the Electricity Market: A Preliminary Analysis Burry A. Goss and S. Guluy Avsar
0 1-00 Effects of Externality-Corrective Taxation on the Extent of the Market and Network Size of Division of Labor Yew-Kwung Ng and Xiuokai Yang
02-00 Incomplete Contingent Labor Contract, Asymmetric Residual Rights and Authority, and the Theory of the Firm Xiuokui Yang
03-00 The Effects of Education on the Timing of Marriage and First Conception in Pakistan Lata Gungadharan and Pushkar Maitra
04-00 A Production Theory Approach to the Imports and Wage Inequality Nexus Christis G. Tombazos
05-00 Simultaneity, Rationality and Price Determination in US Live Cattle Barry A. Goss, S. Gulay Avsur and Brett A. Inder

06-00 Free Riding and the Welfare Effects of Parallel Imports Jong-Say Yong
07-00 The Determinants of Judicial Prestige and Influence: Some Empirical Evidence from the High Court of Australia Mita Bhattacharya and Russell Srnyth
08-00 Causality in International Capital Movements: The Income Mobility of Australian Investment Abroad Robert D Brooks, Dietrich K Fausten and Pararn Silvapulle
01-01 Outside Options and the Competitiveness of Vertical Alliances: A Core Theoretic Approach Jong-Say Yong
02-0 1 Resource Inflows and Household Composition: Evidence From South African Panel Data Pushkar Maitra and Ranjan Ray
03-0 1 School Dropouts and Economic Growth: A Cross-Country Analysis Kausik Clzaudhuri and Pushkar Maitra
04-0 1 HOGLEX demand systems and welfare policy in major ASEAN developing countries: A Bayesian analysis using expenditure unit records Iiikaru Hasegaw~r, Tran Van Hoa, Ma. Reheccn Valenzuela
05-0 1 Unprotective Tariffs, Ineffective Liberalization and Other Mysteries: An Investigation of the Endogenous Dimensions of Trade Policy Formation in Australia Christis G. Tombazos
06-0 1 Strategic FDI and Industrial Ownership Structure Christopher J. Ellis and Dietrich Fausten
07-0 1 Forecast Errors and Efficiency in the US Electricity Futures Market S. Gulay Avsar and Barry A. Goss
08-0 1 Good Capitalism Versus Bad Capitalism: Effects of Political Monopoly of the Ruling Elite on the Extent of the Market, Income Distribution, and Development Wai-Man Liu and Xiaokai Yang

09-0 1 Birth-spacing and Child Survival: Comparative Evidence from India and Pakistan Pushkar Maitra and Sarmistha Pal
10-01 Board remuneration, Company Performance and Corporate Governance: Evidence from Publicly Listed Malaysian Companies Ergun Dogan and Russell Smyth
11-01 Externality, Pigou and Coase: A Case for Bilateral Taxation and Amenity Rights Yew-Kwang Ng
12-01 Division of Labour, Specialisation and the Enforcement of a System of Property Rights: A General Equilibrium Analysis Li Ke and Russell Smyth
13-01 Optimal Environmental Cl~arges/Taxes: Easy to Estimate and Surplus Yielding Yew-Kwang Ng
14-01 Industrial Concentration and Competition in Malaysian Manufacturing Mita Bhattachnrya
15-01 Information Exchange, Risk and Community Participation in Pollutioil Control Measures Ian Wills
16-0 1 Industry-Community-Regulator Consultation in Pollution Control in Victoria I m Wills and Sigmund Fritschy