Embed Size (px)
Citation preview

MISLMonday 5 March 12
Impact of the LTE Scheduler on achieving Good QoE for DASH Video Streaming
This publication has emanated from research conducted with the financial support of Science Foundation Ireland (SFI) under Grant Number 13/IA/1892.
Jason J. QuinlanMISL, Dept. of Computer Science,
University College Cork,Ireland
Ahmed H. ZahranMISL, Dept. of Computer Science,
University College Cork,Ireland
Cormac J. SreenanMISL, Dept. of Computer Science,
University College Cork,Ireland
K. K. RamakrishnanDept. of Computer Science,
University of California,Riverside

MISLMonday 5 March 12
2 LANMAN 2016
Motivation● Over 55% of total mobile traffic is now video,
approximately 2 Million Terabytes per Month, and is expected to increase to 75% by 2020, approximately 22 Million Terabytes per Month. (Cisco/Statista)
● Adaptive Bitrate Streaming (ABR) over HTTP techniques e.g. Dynamic Adaptive Streaming over HTTP (DASH) are considered the default streaming approach for many video providers, such as Netflix, Hulu and YouTube.
● The objective of this work is to undertake a systematic study on predefined LTE schedulers in NS3 and determine if they can offer improvement in the achievable quality of an adaptive client

MISLMonday 5 March 12
3 LANMAN 2016
Overview
● In this study, we investigated the impact of LTE scheduling policy on the performance of adaptive video streaming using our laboratory testbed using real video content and clients, with an NS3 emulated LTE network.
● We evaluated different adaptive streaming algorithms including the throughput-based FESTIVE [3] , buffer-based approach (BBA) [4] and default GPAC adaptation.
● Our evaluation results consider different performance metrics including video stalls, quality switches, average quality rate, and overall QoE.

MISLMonday 5 March 12
4 LANMAN 2016
2.0 %
1.5 %
1.0 %
0.5 %
0.0 %
Mobile Video Quality
Source: Conviva Streaming Industry Data, Q1 2016 Report, http://www.conviva.com/streaming-industry-data/

MISLMonday 5 March 12
5 LANMAN 2016
2.0 %
1.5 %
1.0 %
0.5 %
0.0 %Source: Conviva Streaming Industry Data, Q1 2016 Report, http://www.conviva.com/streaming-industry-data/
Video clients stall more in
mobile networks
Mobile Video Quality

MISLMonday 5 March 12
6 LANMAN 2016Source: Conviva Streaming Industry Data, Q1 2016 Report, http://www.conviva.com/streaming-industry-data/
3.5Mbps
3.0Mbps
2.5Mbps
2.0Mbps
1.5Mbps
1.0Mbps
Mobile Video Quality

MISLMonday 5 March 12
7 LANMAN 2016Source: Conviva Streaming Industry Data, Q1 2016 Report, http://www.conviva.com/streaming-industry-data/
Video clients stream lowerquality in mobile networks
3.5Mbps
3.0Mbps
2.5Mbps
2.0Mbps
1.5Mbps
1.0Mbps
Mobile Video Quality

MISLMonday 5 March 12
8 LANMAN 2016
DASH Overview
● DASH creates multiple bitrate versions of the same video clip, which allows the client to adapt to changes in the network, at predefined points in time, typically segment boundaries

MISLMonday 5 March 12
9 LANMAN 2016
DASH Overview● SSTB, ED and BBB are video clips from our dataset
● Highlighted figure illustrates changes in quality rate per segment over time

MISLMonday 5 March 12
10 LANMAN 2016
DASH Overview
● Highlighted figure illustrates delivery rate
● Each block denotes a single segment: width denotes delivery time and height delivery rate

MISLMonday 5 March 12
11 LANMAN 2016
DASH Content Utilised● Recently published at Multi-Media Systems (MMSys 2016)
● All content is encoded in both H.264 (AVC) and H.265 (HEVC). H.264 used in this work.
● Ten quality rates across seven resolutions.
● Twenty three clips from varying genres: action, comedy, documentary, animation, thriller, sci-fi, across three datasets.
● Five different segment durations: 2-, 4-, 6-, 8-, and 10-second for ten- or sixteen-minute videos.
● Three different Datasets: Content-based (used here), Trace-based and Compressed.
www.cs.ucc.ie/misl/research/current/ivid_dataset

MISLMonday 5 March 12
12 LANMAN 2016
Long Term Evolution (LTE) Overview

MISLMonday 5 March 12
13 LANMAN 2016
Long Term Evolution (LTE) Overview
1. Proportional Fairness (PF)
– schedules a user when a users instantaneous channel quality is high relative to the cumulative average channel condition over time.
– most deployed eNodeB (eNB) base stations use PF scheduler
– expected result: all clients should receive adequate throughput, but edge clients may experience issues
2. Frequency Domain Blind Equal Throughput (BET):
– aims to provide equal throughput to all UEs
– Maximizes system fairness by allocating to user with lowest cumulative average rate
– expected result: equalizing throughput may lead to a greater number of switches as clients react to fluctuations in buffer level

MISLMonday 5 March 12
14 LANMAN 2016
Long Term Evolution (LTE) Overview
3. Frequency Domain Maximum Throughput (MT)
– aims to maximize the overall throughput of eNB.
– MT allocates each RB to the user with the best channel condition.
– expected result: may starve edge clients due to lower channel conditions
4. Priority set scheduler (PSS)
– is a QoS aware scheduler which combines time domain (TD) and frequency domain (FD) packet scheduling
– target rate for PSS is set to 700kbps – mid range quality for mobile devices
– expected result: improved quality rate for edge clients

MISLMonday 5 March 12
15 LANMAN 2016
Long Term Evolution (LTE) Overview
● Three Fading Models:
– Static: User Equipment (UE) same fading value per resource block (RB)
– Pedestrian Mobility (3Kmph)
– Vehicular Mobility (30Kmph)
● All Fading Traces were generated by a MATLAB script provided by LENA
Further information and build instructions for the LENA components utilised in this paper are available at:
www.cs.ucc.ie/misl/research/current/ivid_demo/lanman2016

MISLMonday 5 March 12
16 LANMAN 2016
Evaluation Setup
Hybrid physical and simulated infrastructure in which actual DASH video clips are streaming from a server to clients over an LTE air-interface in real-time.

MISLMonday 5 March 12
17 LANMAN 2016
Evaluation Setup
The Network Attached Storage node contains theDASH Dataset [12].

MISLMonday 5 March 12
18 LANMAN 2016
Evaluation Setup
The Master Controller defines the LTE and Client configurations. Such as number and distance of users, fading model, scheduler,
simulation time, adaptation model, and clip index.

MISLMonday 5 March 12
19 LANMAN 2016
Evaluation Setup
The Master Controller is also used to gather metrics from LTE and the clients for post processing.
In this work stream data flowing through the Master Controller is not impeded in anyway.

MISLMonday 5 March 12
20 LANMAN 2016
Evaluation Setup
The NS3-LTE machine implements the LTE Evolved Packet Core (EPC) and air-interface for the desired
number of clients. The three fading models are implemented here.

MISLMonday 5 March 12
21 LANMAN 2016
Evaluation Setup
Our clients, 6 in this evaluation setup, are a mixture of Raspberry Pi-2’s and Netbooks, each containing
GPAC, open-source video framework, and implemented adaptation algorithms.
GPAC: https://gpac.wp.mines-telecom.fr/home/about/

MISLMonday 5 March 12
22 LANMAN 2016
Evaluation Setup
A demonstration of a portable version of our ‘D-LiTE’ testbed is available to be viewed during the demo session of LANMAN:
14:15 to 15:15 today – Look for the demo ‘D-LiTE’

MISLMonday 5 March 12
23 LANMAN 2016
Evaluation Setup● DASH Adaptation Algorithms, widely used in the
Literature:
– FESTIVE [3] :● Throughput-based approach – 30 second max buffer size
● Harmonic mean average for network throughput
● Cautious startup phase, network probing to improve quality
– (BBA) [4], specifically BBA2:● Buffer-based approach – 240 second max buffer size
● Two thresholds to determine if a higher/lower rate should be selected
● Maps future segment transmission cost to improve selection

MISLMonday 5 March 12
24 LANMAN 2016
Evaluation Setup
Seg_# Arr_time Del_Time Stall_Dur Rep_Level Del_Rate Act_Rate Byte_Size Buff_Level
1 1517 1097 0 232 905 248 124131 4.0002 3629 1711 0 752 2104 900 450106 8.0003 8115 4090 0 1774 2016 2062 1031136 12.0004 23418 14936 0 1774 512 1914 957238 0.697
5 27725 1275 0 374 434 138 69286 0.3906 30130 1690 0 374 745 315 157538 1.9857 37117 5004 1001 374 417 522 261058 0.000
8 45637 7172 4520 374 239 429 214866 0.000
9 51840 2906 2203 232 301 219 109544 0.00010 53700 281 0 232 2422 170 85085 2.140
● As stated, the Master Controller, gathers clients metrics and per stream/UE creates a colonized trace file containing stream information per delivered segment, example:

MISLMonday 5 March 12
25 LANMAN 2016
Evaluation Setup
Seg_# Arr_time Del_Time Stall_Dur Rep_Level Del_Rate Act_Rate Byte_Size Buff_Level
1 1517 1097 0 232 905 248 124131 4.0002 3629 1711 0 752 2104 900 450106 8.0003 8115 4090 0 1774 2016 2062 1031136 12.0004 23418 14936 0 1774 512 1914 957238 0.697
5 27725 1275 0 374 434 138 69286 0.3906 30130 1690 0 374 745 315 157538 1.9857 37117 5004 1001 374 417 522 261058 0.000
8 45637 7172 4520 374 239 429 214866 0.000
9 51840 2906 2203 232 301 219 109544 0.00010 53700 281 0 232 2422 170 85085 2.140
● Each row provides per segment information

MISLMonday 5 March 12
26 LANMAN 2016
Evaluation Setup
Seg_# Arr_time Del_Time Stall_Dur Rep_Level Del_Rate Act_Rate Byte_Size Buff_Level
1 1517 1097 0 232 905 248 124131 4.0002 3629 1711 0 752 2104 900 450106 8.0003 8115 4090 0 1774 2016 2062 1031136 12.0004 23418 14936 0 1774 512 1914 957238 0.697
5 27725 1275 0 374 434 138 69286 0.3906 30130 1690 0 374 745 315 157538 1.9857 37117 5004 1001 374 417 522 261058 0.000
8 45637 7172 4520 374 239 429 214866 0.000
9 51840 2906 2203 232 301 219 109544 0.00010 53700 281 0 232 2422 170 85085 2.140
● Column values provide information on:
– Arrival time and delivery time per segment in milliseconds (ms)

MISLMonday 5 March 12
27 LANMAN 2016
Evaluation Setup
Seg_# Arr_time Del_Time Stall_Dur Rep_Level Del_Rate Act_Rate Byte_Size Buff_Level
1 1517 1097 0 232 905 248 124131 4.0002 3629 1711 0 752 2104 900 450106 8.0003 8115 4090 0 1774 2016 2062 1031136 12.0004 23418 14936 0 1774 512 1914 957238 0.697
5 27725 1275 0 374 434 138 69286 0.3906 30130 1690 0 374 745 315 157538 1.9857 37117 5004 1001 374 417 522 261058 0.000
8 45637 7172 4520 374 239 429 214866 0.000
9 51840 2906 2203 232 301 219 109544 0.00010 53700 281 0 232 2422 170 85085 2.140
● Column values provide information on:
– Rebuffering issues and stalls (ms)

MISLMonday 5 March 12
28 LANMAN 2016
Evaluation Setup
Seg_# Arr_time Del_Time Stall_Dur Rep_Level Del_Rate Act_Rate Byte_Size Buff_Level
1 1517 1097 0 232 905 248 124131 4.0002 3629 1711 0 752 2104 900 450106 8.0003 8115 4090 0 1774 2016 2062 1031136 12.0004 23418 14936 0 1774 512 1914 957238 0.697
5 27725 1275 0 374 434 138 69286 0.3906 30130 1690 0 374 745 315 157538 1.9857 37117 5004 1001 374 417 522 261058 0.000
8 45637 7172 4520 374 239 429 214866 0.000
9 51840 2906 2203 232 301 219 109544 0.00010 53700 281 0 232 2422 170 85085 2.140
● Column values provide information on:
– Quality rate switching based on average encoding rate (kbps)

MISLMonday 5 March 12
29 LANMAN 2016
Evaluation Setup
Seg_# Arr_time Del_Time Stall_Dur Rep_Level Del_Rate Act_Rate Byte_Size Buff_Level
1 1517 1097 0 232 905 248 124131 4.0002 3629 1711 0 752 2104 900 450106 8.0003 8115 4090 0 1774 2016 2062 1031136 12.0004 23418 14936 0 1774 512 1914 957238 0.697
5 27725 1275 0 374 434 138 69286 0.3906 30130 1690 0 374 745 315 157538 1.9857 37117 5004 1001 374 417 522 261058 0.000
8 45637 7172 4520 374 239 429 214866 0.000
9 51840 2906 2203 232 301 219 109544 0.00010 53700 281 0 232 2422 170 85085 2.140
● Column values provide information on:
– Delivery (kbps) and actual rate (kbps) of the segment

MISLMonday 5 March 12
30 LANMAN 2016
Evaluation Setup
Seg_# Arr_time Del_Time Stall_Dur Rep_Level Del_Rate Act_Rate Byte_Size Buff_Level
1 1517 1097 0 232 905 248 124131 4.0002 3629 1711 0 752 2104 900 450106 8.0003 8115 4090 0 1774 2016 2062 1031136 12.0004 23418 14936 0 1774 512 1914 957238 0.697
5 27725 1275 0 374 434 138 69286 0.3906 30130 1690 0 374 745 315 157538 1.9857 37117 5004 1001 374 417 522 261058 0.000
8 45637 7172 4520 374 239 429 214866 0.000
9 51840 2906 2203 232 301 219 109544 0.00010 53700 281 0 232 2422 170 85085 2.140
● Column values provide information on:
– Transmission cost in bytes for the requested segment

MISLMonday 5 March 12
31 LANMAN 2016
Evaluation Setup
Seg_# Arr_time Del_Time Stall_Dur Rep_Level Del_Rate Act_Rate Byte_Size Buff_Level
1 1517 1097 0 232 905 248 124131 4.0002 3629 1711 0 752 2104 900 450106 8.0003 8115 4090 0 1774 2016 2062 1031136 12.0004 23418 14936 0 1774 512 1914 957238 0.697
5 27725 1275 0 374 434 138 69286 0.3906 30130 1690 0 374 745 315 157538 1.9857 37117 5004 1001 374 417 522 261058 0.000
8 45637 7172 4520 374 239 429 214866 0.000
9 51840 2906 2203 232 301 219 109544 0.00010 53700 281 0 232 2422 170 85085 2.140
● Column values provide information on:
– Buffer level of the client once a segment has arrived.

MISLMonday 5 March 12
32 LANMAN 2016
Evaluation Setup
l nst :The average number of stalls per session
l tst The average stall duration per session
l rav The average received quality rate per session
l nsw The average number of switches per session
l lsw: The average switching level – how many quality rates are within a single switch jump
l χ : The user quality of experience based on DASH-UE model (IEEE Trans. Broadcasting 2015) an objective metric derived based on subjective evaluations.
● From the columnized trace file we determine:

MISLMonday 5 March 12
33 LANMAN 2016
Evaluation Results – Performance Metrics
BBA
FestiveMobile Pedestrian Fading

MISLMonday 5 March 12
34 LANMAN 2016
Evaluation Results – Performance Metrics
BBA
● Maximum Throughput (MT) has the highest number of stalls (nst ) and stall durations (tst )
● Very high average quality rate (rav)
● Lower number of switches (nsw ) and switch jumps (lsw ) in static in comparison to mobile – we can see switch rates are greater than one, as BBA can jump more than one quality rate per segment

MISLMonday 5 March 12
35 LANMAN 2016
Evaluation Results – Performance Metrics
BBA
● Blind Equal Throughput (BET) has the lowest number of stalls (nst ) but a mid range stall durations (tst ) in static – nothing in mobile
● Relatively low average quality rate (rav)
● High number of switches (nsw ) and switch jumps (lsw ) in both static and mobile

MISLMonday 5 March 12
36 LANMAN 2016
Evaluation Results – Performance Metrics
BBA
● Proportional Fair (PF) & Priority set scheduler (PSS) have a low number of stalls (nst ) and relatively low stall durations (tst ) in static – nothing in mobile
● Mid range number of switches (nsw ) and switch jumps (lsw ) in both static and mobile – both higher in mobile
● Higher average quality rate (rav) in PF

MISLMonday 5 March 12
37 LANMAN 2016
Evaluation Results – Performance Metrics
Festive
● We see similar results in Festive for MT, but due to the cautious nature of festive, we see no stalls (nst ) and stall durations (tst ) in Mobile and single rate switch jumps
Mobile Pedestrian Fading

MISLMonday 5 March 12
38 LANMAN 2016
Evaluation Results – Performance Metrics
Festive
● We see similar results in Festive for MT, but due to the cautious nature of festive, we see no stalls (nst ) and stall durations (tst ) in Mobile and single switch jumps
● BET fairs worse for Festive for both Static and Mobile in stalls (nst ) and stall durations (tst ) but similar for the other metrics
Mobile Pedestrian Fading

MISLMonday 5 March 12
39 LANMAN 2016
Evaluation Results – Performance Metrics
Festive
● We see similar results in Festive for MT, but due to the cautious nature of festive, we see no stalls (nst ) and stall durations (tst ) in Mobile and single switch jumps
● BET fairs worse for Festive for both Static and Mobile in stalls (nst ) and stall durations (tst ) but similar for the other metrics
● PF and PSS are similar but PF improves the quality rate
Mobile Pedestrian Fading
MISLMonday 5 March 12
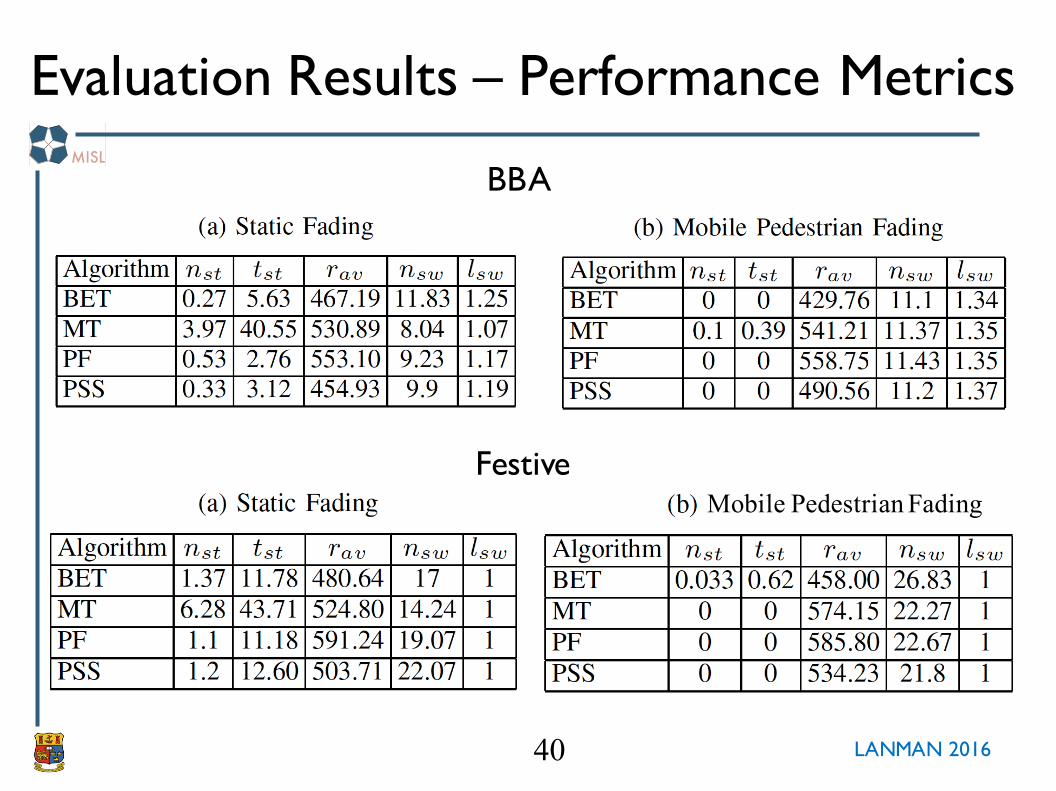
40 LANMAN 2016
Evaluation Results – Performance Metrics
BBA
FestiveMobile Pedestrian Fading

MISLMonday 5 March 12
41 LANMAN 2016
Evaluation Results – Performance Metrics
BBA
Festive
● Less number of stalls (nst ) in BBA due to larger buffer, but can be wasted network resources if abandonment occurs
● Lower switches in BBA due to building the buffer at a lower rate
● Higher average quality rate (rav ) in Festive due to constantly probing the network

MISLMonday 5 March 12
42 LANMAN 2016
Evaluation Results – Average Quality Rate
● Averaged per client
● Better quality rate closer to eNB
● MT high quality rate but too many stalls
● BET too low
● PF and PSS similar but PF better

MISLMonday 5 March 12
43 LANMAN 2016
Evaluation Results – Average Quality Rate
● Static:
– decreasing rates per distance
– Lower MT and higher BET for edge case
● Mobile:
– Increased quality for edge case but lower for close clients
– Lower BET

MISLMonday 5 March 12
44 LANMAN 2016
Evaluation Results – Client QoE
● Clearly stalls at edge clients impacts QoE (MT)
● Equalizing throughput also reduces QoE (BET)
● Edge clients in Static very bad QoE due to abandonment
● Mobile better overall QoE

MISLMonday 5 March 12
45 LANMAN 2016
Conclusion● Key Insight: our performance evaluation shows that
when a UE is mobile there are significantly fewer, reduced duration, stalls, and better average received quality rate, leading to higher user QoE.
– Our results indicate that user mobility within a cell mitigates the effects of long-term fading on video delivery, unlike for static users at the cell-edge where fading effects are significant.
● We show that cell-edge users suffer from significant streaming performance degradation with all schedulers.
● In such settings, we found that the proportional fair scheduler leads to the best QoE on average, but achievable quality will also depend as much on the adaptation algorithm utilised.

MISLMonday 5 March 12
46 LANMAN 2016
Summary
● We utilized a Hybrid physical and simulated infrastructure to evaluate LTE schedulers in NS3
● We used our DASH Dataset to stream actual content to real clients over our ‘D-LiTE’ evaluation platform
● We investigated the impact of LTE scheduling policy on the performance of the adaptive streaming clients
● We presented evaluation results for two adaptive streaming algorithms: the throughput-based FESTIVE [3] , and buffer-based approach (BBA) [4].

MISLMonday 5 March 12
47 LANMAN 2016
Impact of the LTE Scheduler on achieving Good QoE for DASH Video Streaming
Jason J. QuinlanDept. of Computer Science,
University College CorkIreland
http://www.cs.ucc.ie/misl/
Questions???

MISLMonday 5 March 12
48 LANMAN 2016
ADDITIONAL SLIDES

MISLMonday 5 March 12
49 LANMAN 2016
Evaluation Results – PF, Static, 4-sec seg.BBA
Festive