Embed Size (px)
Citation preview

_____________________________________________________________________________________________
Monday, September 29, 2014 at 3pm in Sugar Pine 115
Committee Members: Leslie Buckalew Gary Whitfield Michael Torok Melissa Raby Kathy Sullivan Ted Hamilton Diana Sunday Lindsay Laney Wendy Griffiths Bender Karin Rodts Matt Fox Patricia Ramirez Margo Guzman Marnie Shively Gene Womble Anne Cavagnaro Tim Elizondo Michelle Vidaurri
Guests: Angie Fairchilds, Mary Bylsma
I. Welcome and Introductions II. Enrollment Management Overview
a. Angie shared a power point presentation (attached) that was shown to District Council as part of an enrollment management discussion. The presentation was not shown in full, rather selected slides related to the opening of the discussion
b. The portions of the presentation that were showed focused on first the overview, and then the FTE calculations
i. Overview: 1. To create a new way to schedule moving forward 2. Our FTES target is 2087 (this target does not reflect a growth just sustaining the base from
the previous year) a. We are currently at 740 (we borrowed from Summer and are in a deficit) b. Growth funds are only available if we exceed the target
3. We have been operating from one-time funding and that is going away; there is a structural deficit
4. The committee discussed why enrollment may have decreased dramatically. Ideas shared included the following:
a. State economy slightly improving—return to workforce b. Enrollment cap c. Cancelled classes create a distrust d. Some funding rely on actions that are outside of the College mission (chasing
misaligned funding) ii. Slides and discussion led by Angie:
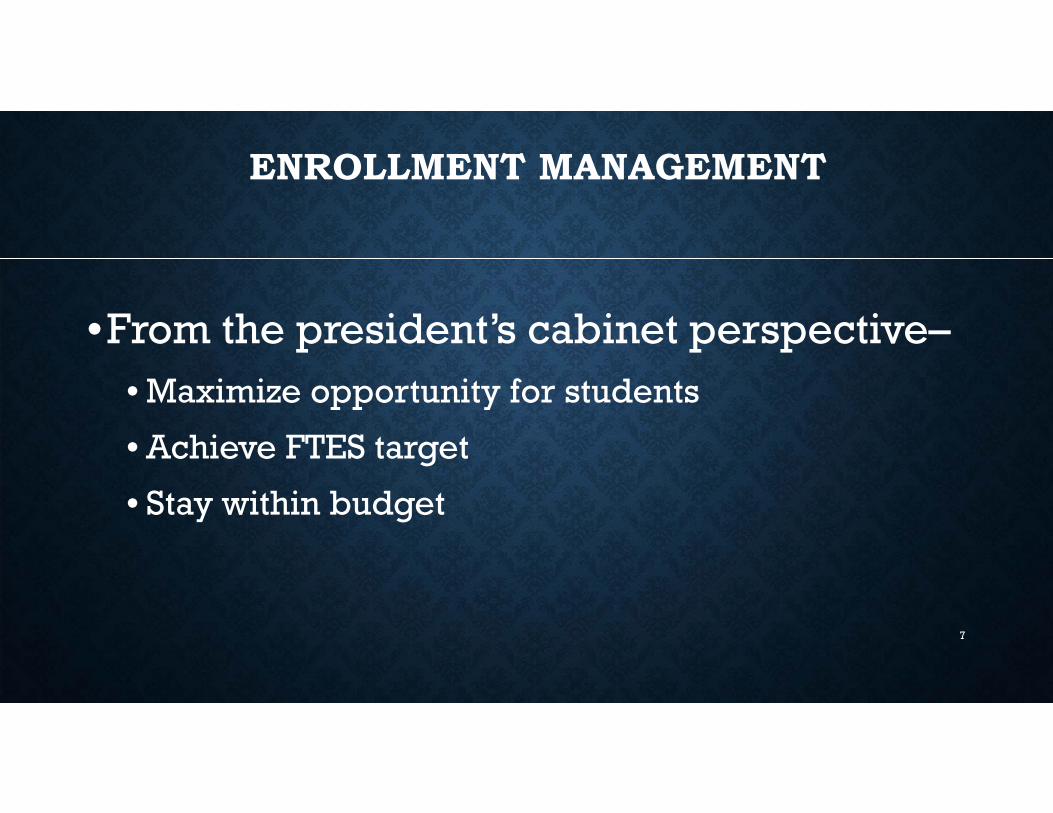
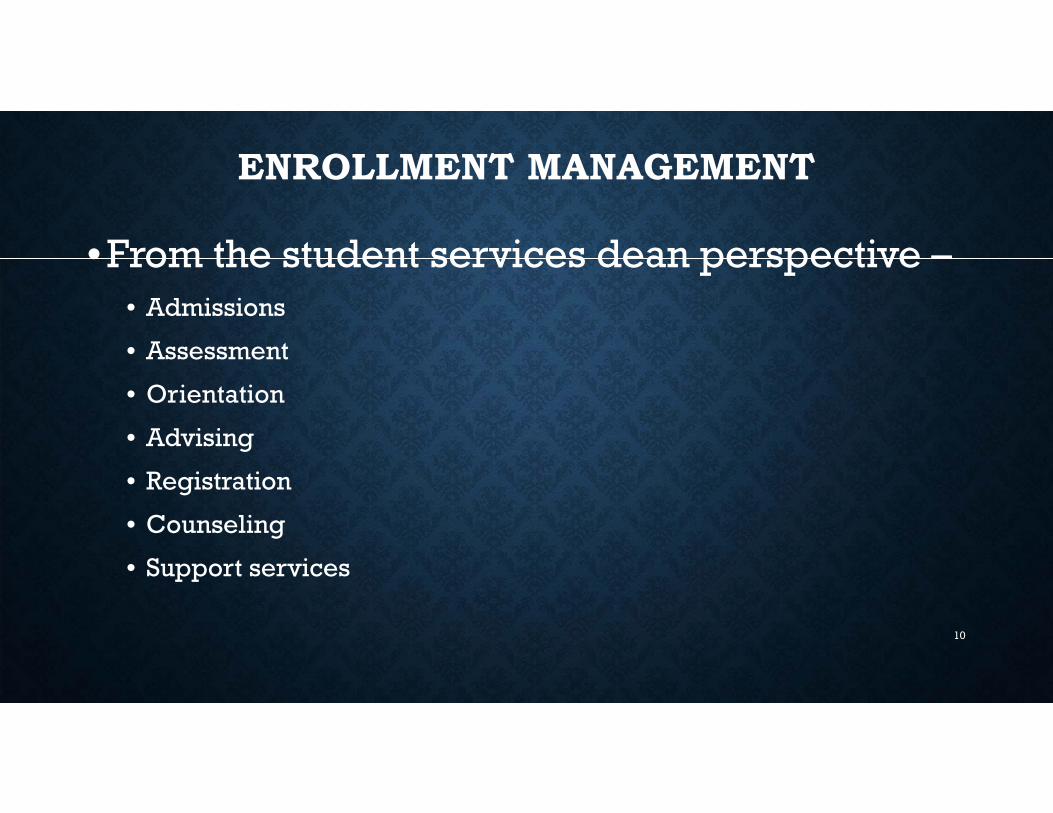
1. Slide 7-9 demonstrated the points of view from various Deans and how they relate to enrollment management and the factors that need to be considered
2. Slide 13 was discussed a. Angie shared that we are spending more to gain FTEs than we will receive, the
breakdown of 1.5:1 (it has been this way historically as well) b. Need to narrow down choices and map out a predictable plan c. We are diluting enrollments, and need to reduce offerings
3. Slide 17 -21 demonstrates the target # / calculation needed to become economically viable with our enrollments.
a. Some key ideas were shared: i. The calculations are based on the assumption that a class has 30-35
students (thus the reason we are paying too much to gain FTES). 1. This is based on a k-14 model—the student attendance accounting
model ii. Apportionment is the State formula for FTES iii. Minimum class size needs to be revisited. At other colleges 15 is typically
the minimum for those special scenarios (not 11). Some colleges have 18-20 as a minimum
4. Slide iii. Resource Allocation
1. A separate discussion included the desire to learn more about the District Resource Allocation Model. Gary shared the location of documents related to this on the District web site.
2. There is an extra 20% allocated to CC due to the inability for our rural college to obtain an economy of scale
3. There is a small college model decided by the State Chancellor’s Office, however because we are part of a larger District, that model is not applied to CC
iv. Spring Schedule 1. The Spring schedule will not go live until due diligence and scrutiny has been applied
v. Other Perspectives 1. The faculty participants on the committee shared their perspectives:
a. Regarding the SSSP, hands are tied, what are the guiding principles i. Hands are tied by SSSP, Basic Skills and Repeatability regs
2. The question was asked, “Do we want to just get them in & out instead of providing and educational experience?”
3. Angie responded: a. We need to be more efficient, financial aid regulations align with a reasonable
amount of time to complete b. We need to make strategic decisions regarding our diminishing enrollment
i. Still offer those low enrolled, higher level courses (math as an example), but offset those offerings with high enrollment classes
vi. Next Steps 1. To be discussed
a. What is cap load? b. EMS detail needed: are all classrooms at capacity c. If every room was full, what is the total calculation d. Discuss SSSP e. Work through plans and scenarios f. Oct 24 meeting: Mary Bylsma and Cynthia Fuhr will come next time and discuss
fiscal implications of offerings

ENROLLMENT MANAGEMENT
An introductory glimpse
at the science of college size

ENROLLMENT MANAGEMENT
• What is enrollment management?
• Why is it important?
• Who is responsible?
• What does it look like?
• Can we get there from here?
2

I can’t wait !
This is gonna be great!!
3
WHAT IS ENROLLMENT MANAGEMENT?
it depends….
4
WHAT IS ENROLLMENT MANAGEMENT?
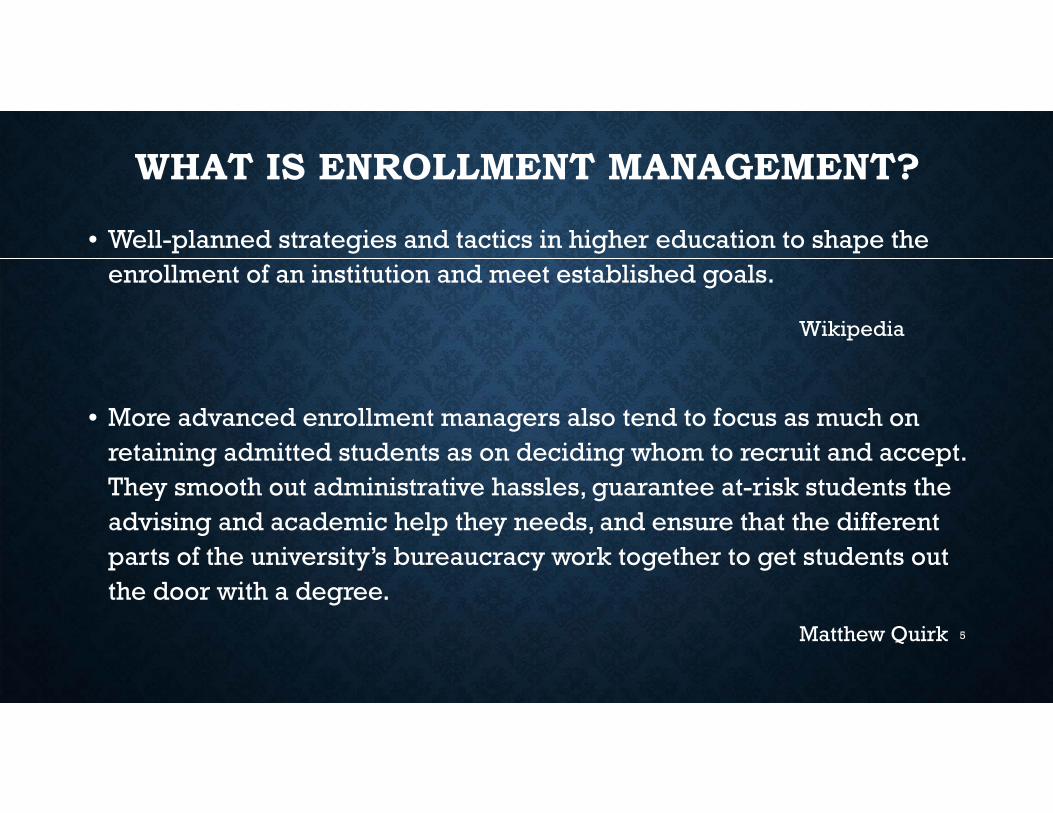
• Well-planned strategies and tactics in higher education to shape the enrollment of an institution and meet established goals.
Wikipedia
• More advanced enrollment managers also tend to focus as much on retaining admitted students as on deciding whom to recruit and accept. They smooth out administrative hassles, guarantee at-risk students the advising and academic help they needs, and ensure that the different parts of the university’s bureaucracy work together to get students out the door with a degree.
Matthew Quirk 5

ENROLLMENT MANAGEMENT @ COMMUNITY COLLEGE
Building a class schedule that enables the college to:
• achieve FTES targets
• meet student demand for access to instructional
programs and courses
• ensures delivery of student support services to maximize
student success
• maintain healthy fiscal position
6
ENROLLMENT MANAGEMENT
•From the president’s cabinet perspective–• Maximize opportunity for students
• Achieve FTES target
• Stay within budget
7

ENROLLMENT MANAGEMENT
• From the instructional dean perspective –• Faculty load and assignment (full and part-time)• FTES targets• Budget• Facilitate degree and certificate completion• Ensure multiple attendance options• Maximize cap load ratios• Program growth or reduction• Faculty hiring
8

(WHAT THE DEANS ARE REALLY THINKING)
How am I going to do that? 9
ENROLLMENT MANAGEMENT
• From the student services dean perspective –• Admissions
• Assessment
• Orientation
• Advising
• Registration
• Counseling
• Support services
10

ENROLLMENT MANAGEMENT
•From the HR perspective –• Recruit, recruit, recruit
• Hire
• Onboard new employees
• Freeze positions
11
ENROLLMENT MANAGEMENT
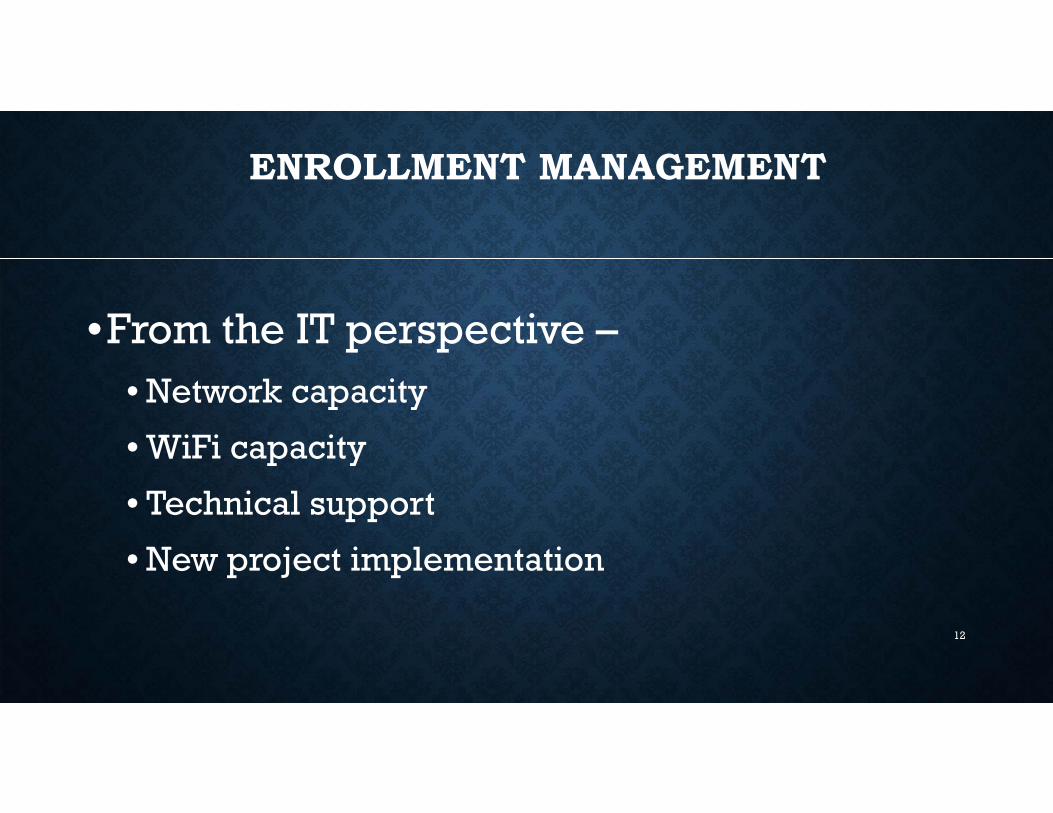
•From the IT perspective –• Network capacity
• WiFi capacity
• Technical support
• New project implementation
12

ENROLLMENT MANAGEMENT
• From the budget perspective –• No overspending!
• Grant and outside funding
• Contract education for credit
• FTES achievement
• No overspending!
13

ENROLLMENT MANAGEMENT
• An institutional commitment and an integral part of strategic
planning
• A clear articulation of institutional enrollment goals (well beyond
sheer numbers)
• A plan that aligns services and resources under the umbrella of a
larger vision
• A data-driven strategy
• A living plan that is constantly changing as institutional needs
change
14

WHO?
• At the district level• Chancellor’s Executive Cabinet
• District Administrative Council
• District Council
Must be a shared vision with clearly articulated goals!
15

WHO?
• At the college level - EVERYONE
• Must be a shared vision with clearly articulated goals!
• Integral part of strategic planning
• Primary responsibility
• Vice President of Instruction
• Instructional Deans
16

WHAT IS THE MAGIC NUMBER?
17

525
• Student contact hours comprising 1 FTES
• Full-time faculty teaching load for 1 year
• Ideal faculty productivity measured by WSCH/FTEF
*Assumptions*
• 18 week semester
• 100% faculty assignment is 15 lecture hours18
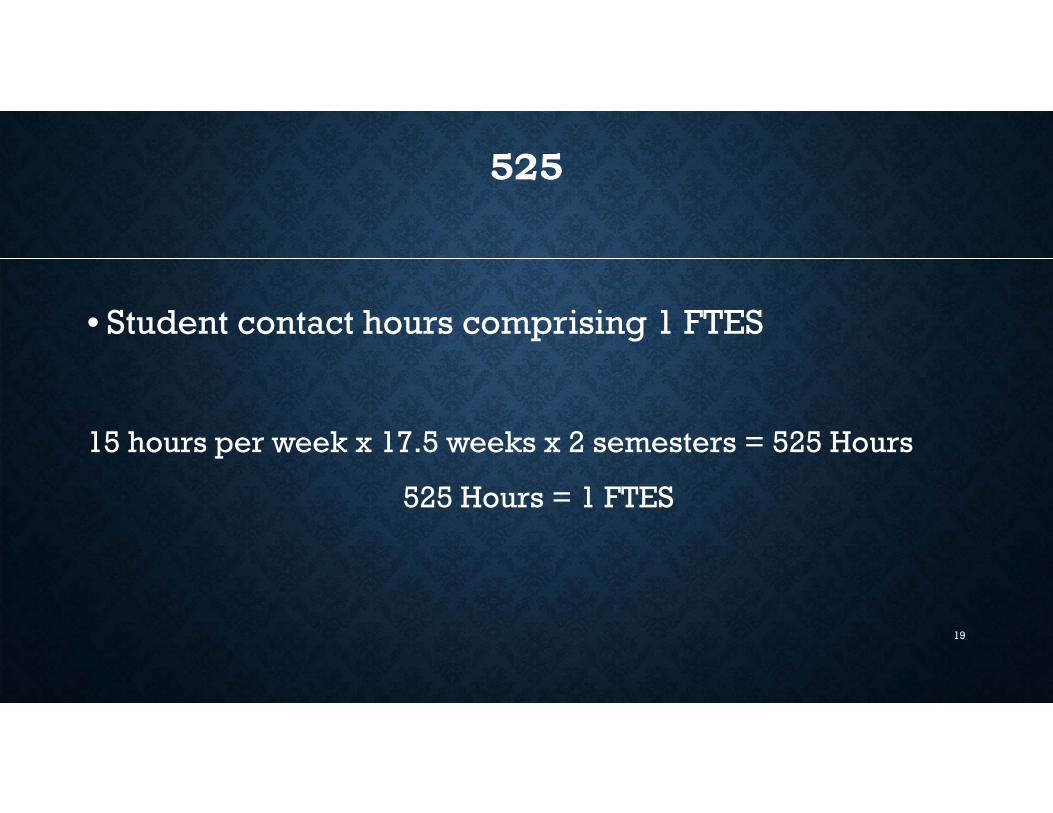
525
• Student contact hours comprising 1 FTES
15 hours per week x 17.5 weeks x 2 semesters = 525 Hours
525 Hours = 1 FTES
19

525
• Full-time faculty teaching load for 1 year
15 lecture hours x 17.5 weeks x 2 semesters = 525 Hours
525 hours = 1 FTEF
20

525
• Ideal faculty productivity measured by WSCH/FTEF
15 lecture hours x 35 students = 525
1.0 FTEF
21

HOW DO WE DO THIS?
• Data driven and data dependent• Historical enrollment, course offerings, and budget data
• Projection tools to determine outcome of “what if” based on
historical data
• Requires active monitoring of progress to afford timely adjustments
• Identification of key performance indicators
• Identification of benchmarks
22
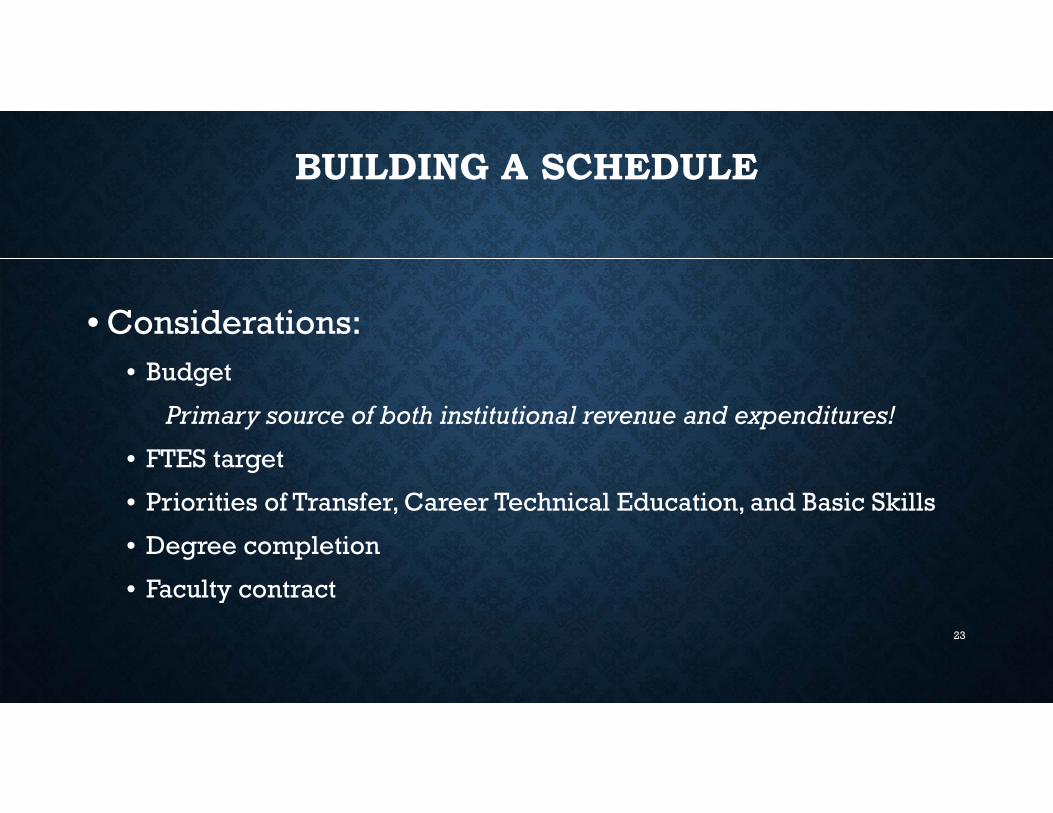
BUILDING A SCHEDULE
• Considerations:• Budget
Primary source of both institutional revenue and expenditures!
• FTES target
• Priorities of Transfer, Career Technical Education, and Basic Skills
• Degree completion
• Faculty contract
23

BUILDING A SCHEDULE
• Fiscal considerations• Institutional capacity for growth
• Capacity for Distance Education and related support services
• Number of faculty in target areas
• Student support services
• Facility support services
• Efficiency
• Demand both up and down (Program discontinuance?)
• Contractual obligations
• Unknowns beyond district control 24

BUILDING A SCHEDULE
• Student considerations
• Data centered decision-making – avoid the trap of myths!
• Evening, weekend, early morning, online options
• Minimize cancellations
• Balance offerings
25

SO WHAT DO DEANS REALLY DO?• Begin with full-time faculty assignments
• Build out from the framework based on:
• Historic course fill rates• Eliminating bottlenecks
• Maintaining balance
• Cap load ratios
• Budget• Space availability
• Adjunct faculty availability
• Productivity
• Degree completion• Rotating schedule
• Stay within budget! 26
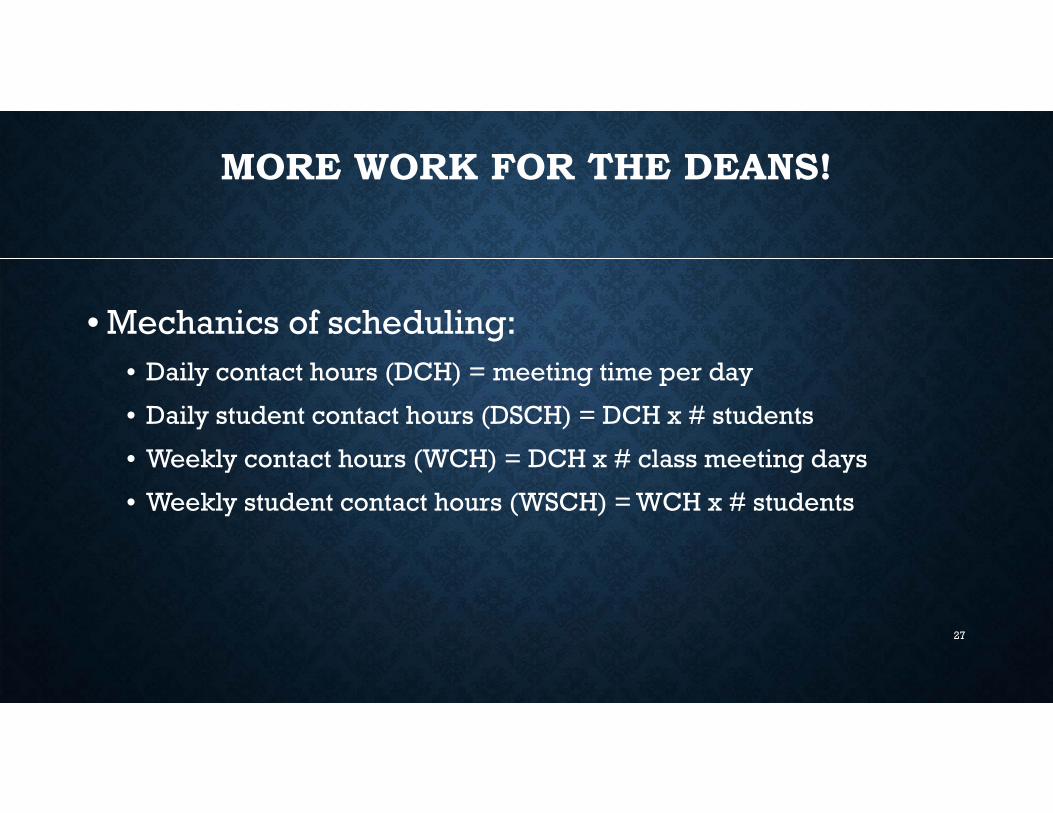
MORE WORK FOR THE DEANS!
• Mechanics of scheduling:• Daily contact hours (DCH) = meeting time per day
• Daily student contact hours (DSCH) = DCH x # students
• Weekly contact hours (WCH) = DCH x # class meeting days
• Weekly student contact hours (WSCH) = WCH x # students
27

DETAILS
• The 50 minute hour• CCC alternative math for calculating contact hours
• Each clock hour consists of 50 minutes of instruction and 10 minutes
of passing time between classes or break time within multi-hour
classes.
28

DETAILS
• The 50 minute hour• As an example class is scheduled from 8:00 – 9:05
8:00 – 8:50 = 1.00 +
8:50 – 9:00 = 0.2 (converted break time) +
9:00 – 9:05 = 0.1
1.3 contact hours
• 50 is the divisor for calculating contact hours for fractional extension of the hour:
65 minutes / 50 = 1.3 contact hours
29

DETAILS
30

MORE DETAILS
• Census – snapshot at 20% point of the course
• Weekly census – attendance reporting for course sections that are regularly scheduled for the full semester.
31

MORE DETAILS
• Daily census – attendance reporting for course
sections that meet on a regular basis for at least five
days, but meet for less than the full semester.
• Intersessions
• Short-term courses within a regular semester
32

MORE DETAILS
• Positive attendance– attendance reporting based on
actual student attendance for the course
• All noncredit courses
• All open entry/open exit courses
• Irregularly scheduled courses
33

MORE DETAILS
• Alternative attendance accounting method
• Independent study/work experience - unit based
rather than contact hours
• Non-classroom based instruction
• Includes online instruction
• WSCH based FTES calculation for lab hours
• Online labs
• TBA hours
34

II was hoping she’d talk about term length multipliers…
35

TERM LENGTH MULTIPLIER
• Number of weeks of instruction in regular fall/spring semesters
• Includes all instructional days, final exam days, and approved flexible calendar days
• Standard Term Length Multiplier = 17.5
• Compressed Calendars range from 16.0 – 17.5
• Quarter System Calendars = 11.67
36

REMEMBER THE MAGIC NUMBER?
• FTES Weekly Census formula
• Calculated at Census
WSCH or (WCH x # students) x Term Length Multiplier
525
Here it is!37

FTES WEEKLY CENSUS EXAMPLE
• 30 students in a class that meets 75 minutes per day twice a week (3.0 WCH) for 17.5
weeks (standard term multiplier)
(3.0 WCH x 30 students) x 17.5 TLM
525 = 3.0 FTES
38

FTES DAILY CENSUS EXAMPLE
• 30 students in a class that meets 90 minutes per day twice a week (1.8 DCH) with 29
class meetings (6 weeks, 5 days per week, less 1 holiday)
(1.8 DCH x 30 students) x 29 class meetings
525 = 2.98 FTES
2.98 FTES < 3.00 FTES….
39

POSITIVE ATTENDANCE FORMULA
Total actual hours of attendance
525
40

SCHEDULING TRIVIA
• A class scheduled for less than a single 50-minute period is not eligible for
apportionment.
• The start and end of each class meeting shall be explicitly stated in every published
schedule of classes and addenda.
• Individual class schedules must be based on five-minute increments for starting and
ending times (e.g., 8:00 a.m to 9:25 a.m., not 8:00 a.m. to 9:26 a.m.).
41

SCHEDULING TRIVIA
• Class scheduling patterns must include passing time for
students to move from one class to the next and for faculty to
take down one class and set up for the next class.
• Class scheduling must be consistent with the hours indicated
in the approved course outline of record.
42

CCFS - 320 REPORT
• Primary basis for college funding
• Cooperative effort among fiscal, instructional, and enrollment
services staff
• Includes all types of attendance accounting methods for each
semester/intersession to arrive at total FTES number:
• Weekly census
• Daily census
• Positive attendance
• Alternative Attendance Accounting43
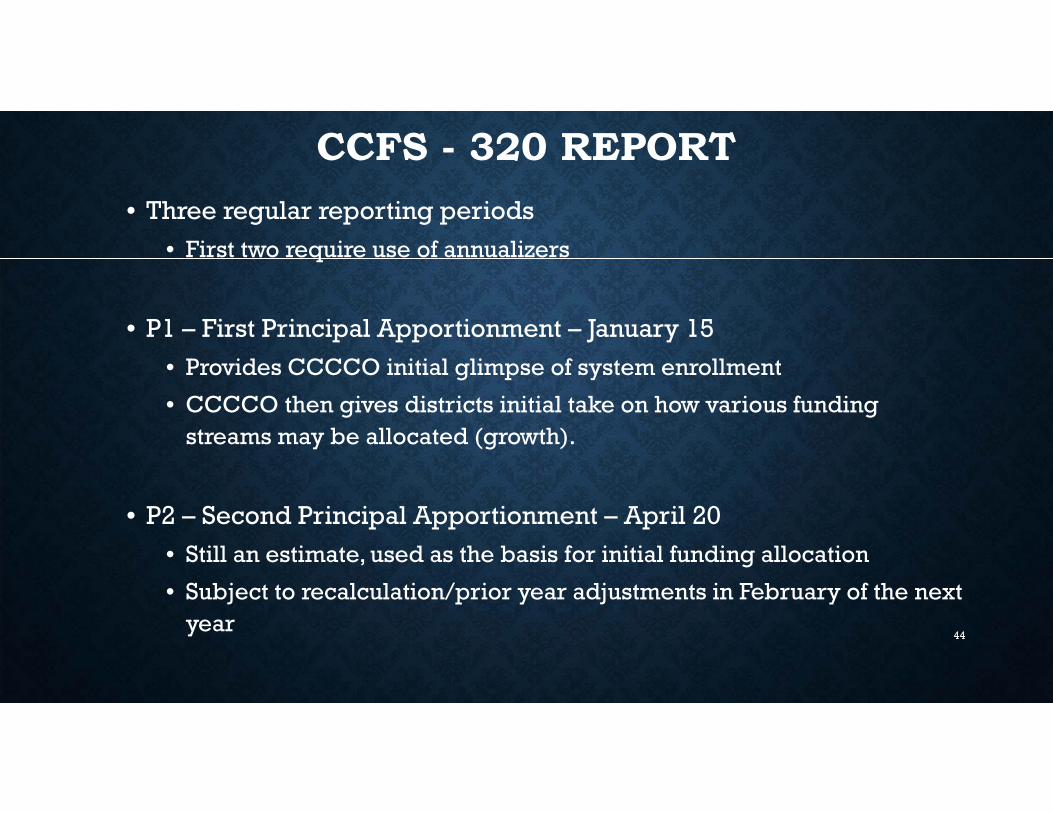
CCFS - 320 REPORT• Three regular reporting periods
• First two require use of annualizers
• P1 – First Principal Apportionment – January 15
• Provides CCCCO initial glimpse of system enrollment
• CCCCO then gives districts initial take on how various funding streams may be allocated (growth).
• P2 – Second Principal Apportionment – April 20
• Still an estimate, used as the basis for initial funding allocation
• Subject to recalculation/prior year adjustments in February of the next year
44

CCFS - 320 REPORT
•Annual Report – July 15
• Recal Report – November 1
• Opportunity to submit amended/corrected report prior to
Recalculation of Apportionment in February of the following year
45

CAN WE GET THERE FROM HERE?
46

RESOURCES
• Student Attendance Accounting Manual
(SAAM)
• CIO Manual
47