Embed Size (px)
Citation preview
Monetary and Fiscal History of Chile: 1960-20171
Rodrigo Caputo
CESS, Oxford University-USACH
Diego Saravia
Central Bank of Chile
August, 2018
1The views expressed here are those of the authors and do not necessarily
re�ect the position of the Central Bank of Chile or its board members.
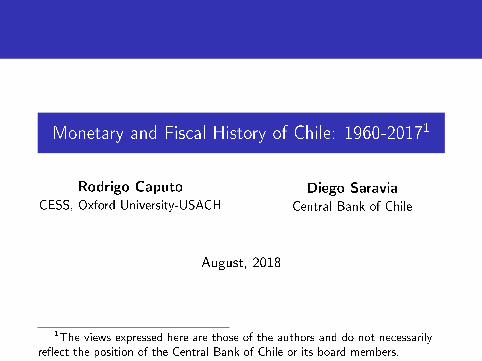
Background
Chile experienced economic and political transformations in
1960-2017
Nominal and real volatility in di�erent periods.
In the 1960s persistent in�ation and "mild" �scal de�cits
In the early 1970s hyperin�ation episodes
In the early 1980s BOP crisis
Since 1990 sustained positive rates of growth and decliningin�ation
Purpose of paper: understand the role of monetary, �scal and
debt management policies in determining the macroeconomic
outcomes

Background
Before 1960 Chile had a long history of chronic in�ation
In the mid 1950s problem became more acute: 85% in�ation
in 1955
Klein-Saks Mission (hired in July 1955) identify four elements:
Fiscal de�citMonetary expansionExchange rate policyWage rate policy

Log of per-capita GDP (1960-2017)

In�ation in log-scale (1960-2017)
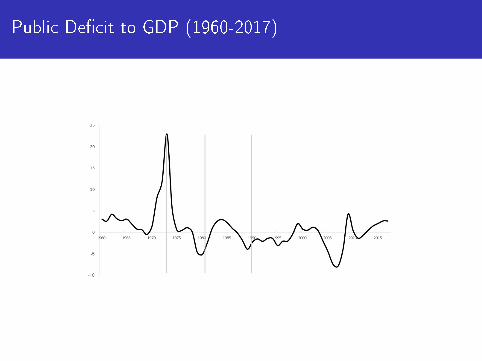
Public De�cit to GDP (1960-2017)

A glance over the period: crucial events
PeriodFixed Exchange
RatesDevaluations
Banking Crisis
and BailoutsHyperin�ations
In�ation rates
(average)
Fiscal De�cits
(average)Severe Crisis
1960-69 1958-62 1962 (30%) 25.15% 2.15
1970-73 1973 (300%) 1973 109.76% 11.02 1973
1974-78 267.55% 1.33 1975
1979-82 Until June 82 1982 (60%) 24.67% -2.17 1981-1982
1983-89 1984 (23.7%) 1985 (10%) 1981-1986 21.32% 0.33 1983
1990-00 11.07% -1.25
2001-17 3.25% -0.71

Analytical framework
Discuss �scal de�cit, debt and monetary trends using the
Fiscal Sector's Budget Constraint:
Bt + btPt + b∗t Et + Mt = Bt−1Rt−1 + bt−1rt−1Pt + b∗t−1r∗t−1Et + Mt−1 + DtPt + T
That can be expressed after some manipulation as:
∆θNt + ∆θrt + ∆θ∗t ξt +(∆MtPt
)1yt︸ ︷︷ ︸
Sources
= θNt−1
(Rt−1
πtgt− 1
)+ θrt−1
(rt−1
gt− 1
)+ ξtθ
∗t−1
(r∗t−1
π∗t gt
− 1
)+ dt + τt
−︸ ︷︷ ︸Obligations

Budget constraint: sources
1970 1980 1990 2000 2010
Year
-0.25
-0.2
-0.15
-0.1
-0.05
0
0.05
0.1
0.15
0.2
N
r
*
( M)/Py

Budget constraint: obligations
1970 1980 1990 2000 2010
Year
-0.1
-0.05
0
0.05
0.1
0.15
Interest Payment Int. Debt (CLP)Interest Payment Int. Debt (USD)Interest Payment Ext. Debt (USD)Public Deficit

1960-1970: Persistent in�ation and "mild" �scal de�cits
Average GDP growth: 4.3%; average in�ation: 25%
Two di�erent administrations: Alessandri (1958-1964) and
Frei-Montalva (1965-1970)
A common goal: to stabilize in�ation (Ffrench-Davis, 1973)
Alessandri initially succeeded, but could not contain �scal
de�cits in later stages
Frei succeeded in reducing �scal de�cits, although in�ation
increased from 1967

1970-1973: Allende
Persistent increase in �scal expenditures and de�cits
Expropriations and increase de�cit in public enterprises
In 1971 the expansionary �scal policy fueled domestic demand
and the economy grew at 9%.
Hyperin�ation in 1973
Fiscal de�cits �nanced mainly with monetary expansionIn 1973 �scal de�cit was 23%, and in�ation averaged 433%In 1973 output declined by 5%

In�ation and high-powered money
1960 1965 1970 1975 1980 1985 1990 1995 2000 2005 2010 2015
Year
0
100
200
300
400
500
600
700
800
900
%
Alessandri Frei M. Allende Pinochet I Pinochet II
Aylwin Frei R. Lagos Bachelet Pinera
Inflation (YoY)Money Growth (YoY)

Seigniorage: important source of funding (1971-1973)
1960 1970 1980 1990 2000 2010
Year
-15
-10
-5
0
5
10
15
20
25
30
% o
ver
GD
P
Alessandri Frei Montalva Allende Pinochet I Pinochet II Aylwin Frei Ruiz-Tagle Lagos Bachelet Piñera Bachelet 2
Total DeficitSegniorage

September 1973-79: Market-oriented reforms, �scal adjustment but slow reductionin in�ation
September 1973-75
Devaluation of 300% in 1973. Price liberalization, economicopenness, �scal adjustment.
In 1974, reduction of the governments de�cit, elimination ofsubsidies, reduction of public employment and (re)privatization of public enterprises.
1974: "Gradualism" in monetary policy to avoid contraction ofcredit and the removal of price controls re�ected in very highin�ation (more than 700% in April).

September 1973-79: Market-oriented reforms, �scal adjustment but slow reductionin in�ation
1976-79
By 1976, no de�cit but in�ation continued to be high (200%).
High level of indexation: wages incorporated 100% of pastin�ation by law (since 1974)
Because of the above, it probably existed a lack of credibilityof the capacity of the government to reduce in�ation quickly
September 1973-79: Market-oriented reforms, �scal adjustment but slow reductionin in�ation
To manage expectations, in 1978 the exchange rate followed a
predetermined rate of devaluation according to in�ation
targets ("La tablita").
In June 1979, �xed exchange rate.
In�ation declined to single-digit levels: 9,5% only in 1981

Financing needs and sources 1960-1978
Alessandri and Frei: lower levels of seigniorage
Allende: no access to foreign debt. Seigniorage main source of
funds
Pinochet: Seigniorage still important, despite declining �scal
de�cits
Table: Budget Constraint Decomposition
Periods 1960-1970 1971-1973 1974-1978 1979-1982 1983-1989 1990-2000 2001-2017
Sources:
Ext. Debt 1.71% -3.41% 1.23% -0.14% -1.06% -1.23% 0.71%
Dom. Debt (CLP + Ind) 0.06% 0.85% -0.02% 1.26% -0.56% -0.33% 1.23%
Dom. Debt (USD) -0.06% -1.32% 3.03% -3.70% 2.68% -1.04% -0.47%
Seigniorage 2.20% 12.87% 6.43% 0.69% 0.82% 0.56% 0.51%
Total Sources 3.91% 8.98% 10.66% -1.90% 1.88% -2.04% 1.98%
Obligations:
ED int. Pay -0.17% -3.20% 1.46% 0.32% 0.60% 0.16% -0.12%
DD. int. pay (CLP) -0.22% -3.00% -1.72% -0.62% -2.74% -0.11% -0.15%
DD. int. pay (USD) -0.06% -0.84% 0.49% -1.48% 0.19% 0.11% 0.06%
Primary De�cit 1.67% 9.10% 1.54% -2.85% -1.02% -3.10% -1.19%
Impl. Transfers (Res.) 2.68% 6.92% 8.88% 2.73% 4.84% 0.90% 3.37%
Total Obligations 3.91% 8.98% 10.66% -1.90% 1.88% -2.04% 1.98%

Transfers and its components: Alessandri and Frei

Transfers and its components: Allende

Transfers and its components: Pinochet 1974-1979
1979-1982: Fixed exchange rate period ending in a crisis.
Euphoria: expansion in the level of indebtedness, consumption,
investment, expectations and asset prices. All these re�ected
in a CA de�cit (14% GDP in 1981).
Real appreciation (wages and other �nancial contracts still
indexed).
In 1981: world entered recession, TOT dropped and interest
rates increased (increased debt burden, �oating rates).
In June of 1982, devaluation of 60%. Debt burden of foreign
debt increased. Debt and Banking crisis and severe recession.
After September 1982, crawling peg with mini-devaluations
following a PPP rule.
In�ation around 20% during the years 82-90.

The �scal burden of the crisis
In 1982 sharp depreciation of peso and lack of international
funds
Banks (most of them) became insolvent
Banks were not able to service its debt
Rescue programs (by the Central Bank and Treasury)implemented
Bank liquidations
CB bought portfolios of private banks
Foreign currency at subsidized prices
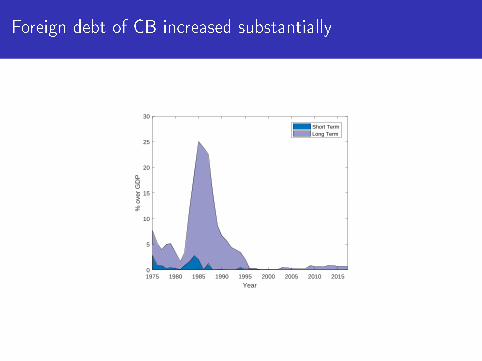
Foreign debt of CB increased substantially
1975 1980 1985 1990 1995 2000 2005 2010 2015
Year
0
5
10
15
20
25
30
% o
ver
GD
P
Short TermLong Term

Rescue plan generated severe CB operational losses
1980 1985 1990 1995 2000 2005 2010 2015
Year
-20
-15
-10
-5
0
5
10
% o
ver
GD
P

Public internal debt
1960 1970 1980 1990 2000 2010
Year
0
10
20
30
40
50
60
% o
ver
GD
PIndexedCLPUSD

Public internal debt (without treasury notes)
1960 1970 1980 1990 2000 2010
Year
0
10
20
30
40
50
60
% o
ver
GD
PIndexedCLPUSD

Financing needs and sources 1983-1989
Main source of �nancing related to domestic credit
Table: Budget Constraint Decomposition
Periods 1960-1970 1971-1973 1974-1978 1979-1982 1983-1989 1990-2000 2001-2017
Sources:
Ext. Debt 1.71% -3.41% 1.23% -0.14% -1.06% -1.23% 0.71%
Dom. Debt (CLP + Ind) 0.06% 0.85% -0.02% 1.26% -0.56% -0.33% 1.23%
Dom. Debt (USD) -0.06% -1.32% 3.03% -3.70% 2.68% -1.04% -0.47%
Seigniorage 2.20% 12.87% 6.43% 0.69% 0.82% 0.56% 0.51%
Total Sources 3.91% 8.98% 10.66% -1.90% 1.88% -2.04% 1.98%
Obligations:
ED int. Pay -0.17% -3.20% 1.46% 0.32% 0.60% 0.16% -0.12%
DD. int. pay (CLP) -0.22% -3.00% -1.72% -0.62% -2.74% -0.11% -0.15%
DD. int. pay (USD) -0.06% -0.84% 0.49% -1.48% 0.19% 0.11% 0.06%
Primary De�cit 1.67% 9.10% 1.54% -2.85% -1.02% -3.10% -1.19%
Impl. Transfers (Res.) 2.68% 6.92% 8.88% 2.73% 4.84% 0.90% 3.37%
Total Obligations 3.91% 8.98% 10.66% -1.90% 1.88% -2.04% 1.98%
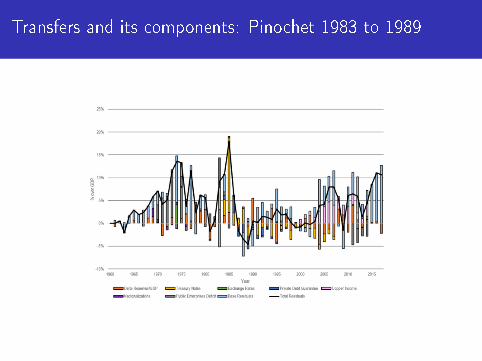
Transfers and its components: Pinochet 1983 to 1989

Declining In�ation and Fiscal Discipline: 1990-2017
Chile avoided default (explicit policy since early 80s)
Cost of the crisis assumed by Treasury and CB
Debt position of government increased. To avoidmonetization:
Public debt was indexed and/or in foreign currency
Also, long maturity of debt (30 years in case of internal debt)

Steady decline in in�ation since 1990
1985 1990 1995 2000 2005 2010 2015
Year
-10
-5
0
5
10
15
20
25
30
35
40
%Pinochet II Aylwin Frei Ruiz-Tagle
Lagos Bachelet Pinera Bachelet II
Inflation (YoY)
Steady decline in in�ation since 1990 and �scal discipline
Evidence that the �scal authority is following a countercyclical
�scal rule
Fiscal copper income, above a reference level, are saved in a
sovereign fund
Part of transfers in latter period related to asset accumulation

Transfers and its components: asset accumulation since2000s

Conclusions
Chile experienced economic and political transformations in
1960-2017
In the 1960s and 1970s in�ation associated to �scal de�cits
Stabilization in the early 1980s through a �xed exchange rate
policy
Severe BOP crisis implied the abandonment of exchange rate
regime
Cost of crisis assumed by CB and Treasury
Systematic policy of �scal surplus since 1987 until today

Appendix

Appendix:Macroeconomic indicators
Growth Public Price Unemployment Real Growth of International
Period of Sector of In�atione Ratef ,g Exchange High Powered Reservesb
GDPa De�cita Copperd Rateh Moneyi
1960 - 1964 (Alessandri) 4,5 2,9 32,5 25,3 7,5 46,5 39,1 2,0
1964 - 1970 (Frei Montalva) 4,2 0,6 56,7 26,1 5,6 53,4 45,1 3,4
1970 - 1973 (Allende) 1,0 13,7 58,9 231,2 4,1 46,9 226,4 2,3
1973 - 1980 (Pinochet I) 4,0 -0,3 73,9 150,7 12,6 72,9 159,4 7,6
1980 - 1990 (Pinochet II) 3,1 -1,0 79,7 19,5 11,8 85,7 16,1 14,7
1990 - 1994 (Aylwin) 7,3 -4,5 103,0 17,7 6,8 103,4 26,5 21,4
1994 - 2000 (Frei Ruiz-Tagle) 5,2 -2,6 99,7 6,1 6,9 84,4 14,0 21,0
2000 - 2006 (Lagos) 4,7 -1,7 101,1 2,9 8,6 96,2 10,1 18,7
2006 - 2010 (Bachelet) 3,8 -3,4 304,5 3,8 7,3 93,8 14,1 12,6
Sources: Central Bank of Chile (2002), "Indicadores Econos y Sociales"; Chilean Copper Comission; Central Bank of Chile website www.bcentral.cl;
Lders and Wagner (2010) "The Republic in Numbers (La Republica en Cifras), EH Clio-Lab Iniciativa Cienti�ca Milenio; and Schmidt-Hebbel and Marshall (1981)
a) Chained GDP
b) As percentage of current GDP
c) Change in Balance of Payments methodology at 1973
d) USD per Pound
e) Change in dec-to-dec CPI
f) as percentage of Labor Force
g) Change in Labor Survey Methodology at 1985
h) Increases indicate real depreciation of the domestic currency
i) Annual Growth of Nominal Monetary Base
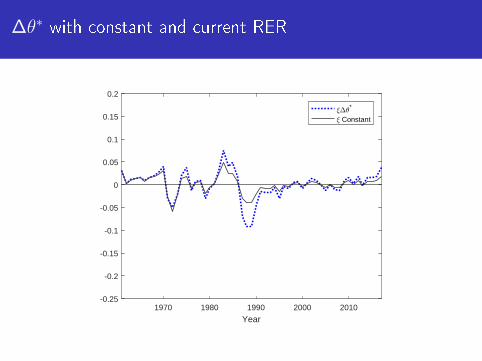
∆θ∗ with constant and current RER
1970 1980 1990 2000 2010
Year
-0.25
-0.2
-0.15
-0.1
-0.05
0
0.05
0.1
0.15
0.2
*
Constant

Levels of θ∗ with constant and current RER
1970 1980 1990 2000 2010
Year
0
0.1
0.2
0.3
0.4
0.5
0.6
*
Constant

Counterfactual Path for Public Debt