Embed Size (px)
Citation preview
MONETARY INCENTIVES
FOR LOW-STAKES TESTS
Harold F. O’Neil, Jr., University of Southern California, CRESST
Jamal Abedi, UCLA/CRESST Charlotte Lee, UCLA/CRESST Judy Miyoshi, UCLA/CRESST
Ann Mastergeorge, UCLA/CRESST
March 2001
National Center for Research on Evaluation,
Standards, and Student Testing (CRESST) Graduate School of Education and Information Studies
Center for the Study of Evaluation University of California at Los Angeles
301 GSE&IS, Box 951522 Los Angeles, CA 90095-1522
(310) 206-1532


The work reported herein was funded at least in part with Federal funds from the U.S. Department of Education under the American Institutes for Research (AIR)/Education Statistical Services Institute (ESSI) contract number RN95127001, Task Order 1.2.93.1, as administered by the National Center for Education Statistics (NCES), U.S. Department of Education. The work reported herein was also supported under the Educational Research and Development Centers Program, PR/Award Number R305B60002, as administered by the Office of Educational Research and Improvement (OERI), U.S. Department of Education.

iii
Foreword
The Research and Development (R&D) series of the reports has been initiated:
To share studies and research that are developmental in nature. The results of
such studies may be revised as the work continues and additional data become
available.
To share results of studies that are, to some extent, on the "cutting edge" of
methodological developments. Emerging analytical approaches and new computer
software development often permit new, and sometimes controversial, analysis to be
done. By participating in "frontier research," we hope to contribute to the resolution of
issues and improve analysis.
To participate in discussions of emerging issues of interest to educational
researchers, statisticians, and the federal statistical community in general. Such reports
may document workshops and symposiums sponsored by the National Center for
Education Statistics (NCES) that address methodological and analytical issues, or may
share and discuss issues regarding NCES practice, procedures, and standards.
The common theme in all three goals is that these reports present results or
discussions that do not reach definitive conclusions at this time, either because the data
are tentative, the methodology is new and developing, or the topic is one on which
there are divergent views. Therefore, the techniques and inferences made from the data
are tentative and are subject to revision. To facilitate the process of closure on the
issues, we invite comments, criticism, and alternatives to what we have done. Such
response should be directed to: Marilyn M. McMillen Chief Statistician Statistical Standards Program National Center for Education Statistics 1990 K Street, NW, Suite 9051 Washington, DC 20006

v
Acknowledgments
We would like to thank all of the students and parents who participated in these
studies, and the school and district personnel who facilitated access to those students.
We would also like to thank the retired school personnel and graduate students who
administered the tests. Their enthusiasm, energy, and competence was remarkable.
A very special thank you to Katie Hutton and Heather Larson. Katie assisted
with data entry and myriad other office tasks that allowed us to meet our daily and site
visit deadlines. Heather provided administrative support at every stage of our work.
Their skill and efficiency facilitated our efforts in a major way and we are grateful. We
owe special gratitude to Katharine Fry and Fred Moss. Both Katharine Fry and Fred
Moss provided superb editorial work. Their labors were indispensable in the
publishing of this report.
This research was monitored initially by Marty Orland and finally by Val Plisko,
both of whom we would like to thank. Finally, we would like to extend our
appreciation to the reviewers who participated either in the National Center for
Education Statistics preliminary design meeting or the adjudication process for the
prior draft of this report. Their thorough and insightful comments improved our
research.


vii
Executive Summary
Recent information in the 1990’s on international assessments (e.g., the Third
International Mathematics and Science Study, or TIMSS) indicates that 12th-grade
students in the United States are doing extremely poorly on such assessments compared
with their peers in other countries (TIMSS, 1998). Similarly, many 12th-grade students
are doing poorly on the National Assessment of Educational Progress (NAEP). In such
tasks and assessments, in almost all cases, U.S. 12th-grade students perform relatively
more poorly than 8th-grade students. For example, in TIMSS, 12th-grade students are
below the international average whereas 8th-grade students are at the international
average.
These poor results are usually attributed to cognitive factors such as students’
opportunities to learn, teachers’ lack of professional preparation, etc. However, a
partial explanation of these results may be motivational. Because the low-stakes (for
students) tests were administered late in these 12th-graders’ final year in high school,
the timing may have negatively affected motivation, and thus performance. This
phenomenon has been labeled “senioritis.” For the high school senior going into the
world of work or on to postsecondary education, tests like TIMSS are clearly low stakes.
Thus, one of the major questions about these tests concerns the possible impact of
motivational factors on the results. If students are not motivated to perform well on
low-stakes tests, then the results may underestimate what students could do if they
gave these assessments their best effort.
Our basic approach was to provide a sufficient monetary incentive to maximize
student effort and therefore increase performance. We expected that we could
stimulate a 0.5 standard deviation increase in performance due to such incentives. Our
results will not generalize, without additional research, to either TIMSS or NAEP.
viii
Further, our results will not generalize to the impact of motivation variables (e.g., effort,
self-efficacy) on the teaching and learning of math. However, we expected our results
to constitute a proof of concept of the importance of manipulating motivation in low-
stakes assessments for 12th graders.
We have promising results based on our prior NAEP motivation research
sponsored by the National Assessment Governing Board (NAGB), and the Office of
Educational Research and Improvement (OERI), National Center for Education
Statistics (NCES). We hypothesized that the incentives would increase effort, which
along with prior knowledge, would improve performance. The effective incentive in
this earlier study was money. In the study (O’Neil, et al., 1992), we manipulated
various incentives (money, task, ego, standard NAEP instructions) for 8th- and 12th-
grade samples of students of various ethnicities (White, Black, Hispanic, and Asian
American).
In general, only the money incentive worked in the 8th grade. The results
showed, in the best case, that the money incentive was effective for a subsample of the
8th-grade students (those who remembered their incentive/treatment group) with easy-
and medium-difficulty items. With respect to item difficulty results, because the
motivational effect was at test time, it was not expected that this increased effort would
improve performance on hard items, because students did not know the content. With
respect to remembering one’s treatment group, presumably if one doesn’t remember the
incentive (money), then one would not increase one’s effort, and thus performance.
However, no incentives were effective for 12th-grade students, even those who
remembered their treatment. The executive summary for a revised version of this study
can be found in Appendix A.
We hypothesized that in our prior study, the lack of effect for 12th graders was
because (a) the amount of money ($1.00 per item) was not large enough for 12th
graders, and further (b) many 12th graders did not believe they would get the money.
ix
Our approach for the current study consisted of manipulating the amount of
money per item correct so as to increase the motivational effect and thus increase
performance. The amount of money given per correct item was either $0 (low-stakes
administration, e.g., TIMSS) or $10 per item correct (which we expected to be effective).
The incentive group was compared with a group receiving standard low-stakes TIMSS
instructions. Consistent with our prior NAEP study, we also collected information on
effort, self-efficacy, and worry. For our assessment we used the released TIMSS math
literacy scale items. This set of items included both multiple-choice and free-response
items.
We hypothesized that students receiving $10 per item correct would perform
significantly higher in math than those who were not receiving any monetary incentive
(the control group). Such students would also exhibit higher effort and self-efficacy but
less worry than control group participants. Our approach consisted of manipulating
the amount of money per item correct so as to increase effort and thus increase math
performance. In general, we expected overall anxiety levels to be low given the low-
stakes nature of the test.
This investigation with 12th graders included a focus group study, a pilot study,
a main study, and a supplementary study with Advanced Placement (AP) students in
mathematics. This latter group was called the AP study. In the focus group study we
explored various levels of incentives. This research is documented in Mastergeorge
(1999). Parents and students who participated in the focus groups suggested that $5 to
$10 per item correct would provide enough motivation for students in Grade 12 to work
harder on math test items. Based on these findings, in the present investigation we
offered students $10 per item correct to find out whether students’ performance on the
selected math items could be increased under such a high-stakes testing condition. We
then compared the performance of students receiving $10 per item correct with the
x
performance of students who responded to the same set of items with no monetary
incentive.
A total of 725 students participated in the pilot, main, and AP studies. There
were 144 students in the pilot study, 415 students in the main study, and 166 students in
the AP study. For the pilot, main, and AP studies, students were selected from 23
different schools (5 schools in the pilot study, 9 schools in the main study, and 9 schools
in the AP study) from southern California school districts in different locations. These
schools had different demographics and different levels of overall student performance.
However the high non-English language background of the sample limits generalizing
the findings. Findings should be interpreted in light of this caution.
Following the focus group study, we conducted the pilot study. The purpose of
the pilot study was to test design issues, examine the accuracy and language of the
instruments, and resolve logistical problems. The results of the pilot study helped us to
refine the instruments and to modify the design. We then conducted the main study
and the AP study.
For an approximately one-hour testing session, the average student in the
incentive condition in the main study received $100 ($80 for an average of 7.96 items
correctly answered and $20 for the two “easy” test items). In the AP study, the average
student received $200. Such incentives were assumed to be motivational for the 12th
graders in our samples. However, the results of the main and AP studies showed no
significant difference between the performance of students in the incentive and control
groups. Statistically, there was no main effect of the incentive treatment. However, in
the main study there was a complex interaction between treatment, sex, and booklet.
However, post hoc comparisons indicated that although the overall interaction was
significant, none of the comparisons of appropriate means were statistically significant.
Thus, we chose to be conservative and not to interpret this interaction as supporting our
major hypothesis. Further, the results of the AP study also did not support the major
xi
hypothesis. The total number of students in the main study was 393 after excluding
students with incomplete data. This number became small when divided into
subgroups by the levels of independent variables such as sex, test form, and treatment.
Due to a small number of subjects, for some of the analyses, there was not enough
power to detect a significant difference, even when the difference was relatively large.
However there was a sufficient number of students in both the main study sample and
the AP study to detect a reasonable main effect for the incentive treatment.
There was a great deal of consistency in the data in both the main and AP study.
For example, males performed significantly better than females in both the main study
and the AP study. These results were expected as the task was mathematics, and with
our local samples we consistently find gender effects on math tests. Although in the
national sample (TIMSS, 1998) there were no significant effects of gender, we find
gender effects with our local southern California samples. Students in both the main
study and the AP study reported significantly more effort in the incentive condition
than in the control condition. Finally, in both studies self-efficacy and effort were
positively related. These latter results make theoretical sense, as Bandura (1986, 1993,
1997) would predict that higher levels of self-efficacy should lead to higher levels of
effort.
We also predicted, based on our prior NAEP research that the incentive
condition should result in higher effort. In both the main and AP studies we found that
students in the incentive group had significantly higher effort than students did in the
control group. In turn, this increased effort should have resulted in better math
performance. So why did we not find a significant main effect of treatment on math
performance, given that there was a main effect of treatment on effort? The major
reason we felt was the lack of relationship between self-reported effort and math
achievement. Unexpectedly, for both the main and AP studies, self-reported effort was
not significantly related to math performance (e.g., r = .007 in the AP study). With
xii
respect to effort, the research literature and our own research using the same measures
indicate that the relationship would be positive (i.e., higher effort leads to better
performance). Not surprisingly, we are puzzled by such findings. The obvious next
step is to replicate with samples more representative of U.S. students generally or in
groups with very different compositions. These studies should be supplemented by a
series of focus groups and cognitive laboratory approaches. There was not an issue of
enough time to complete this test, given the number of not-reached items was very low,
indicating that students had sufficient time to complete almost all items on the test.
Further, there were few items omitted in either study. The not-reached and omitted
information clearly indicates that students had sufficient time to complete the test.
Thus our set of items clearly constituted a power, not a speed test. Further, for the total
math correct, there was no ceiling. In the main study, the mean was 7.96 out of a
possible 24 points (20 items with a few extended response items getting 2 possible
maximum points). For the AP study, the mean was 17.95 out of 24 possible points
(same test as the main study).
In summary, effort was not related to performance, and the conclusion for this
set of studies is that a strong monetary incentive did not increase math performance on
a set of TIMSS released math items with local English Language Learners from samples
of convenience. Further, the inability to find few motivational effects, despite a strong
incentive, random assignment (with equivalence on background characteristics), tests of
high and low performing students, and elimination of non-accurate recall cases, is quite
compelling. It raises some fundamental questions about previous assumptions made
about the motivation effect on test performance and we think that factors in addition to
motivation are coming into play. We believe that there is a senioritis effect, but
understanding its specific motivational effect on test performance and its amelioration
awaits future research.
xiii
Table of Contents
Foreword ......................................................................................................................................iii Acknowledgements .....................................................................................................................v Executive Summary .................................................................................................................. vii Table of Contents...................................................................................................................... xiii List of Tables ............................................................................................................................ xvii List of Figures ............................................................................................................................xxi Introduction .................................................................................................................................. 1
Rationale .................................................................................................................................... 1 Motivational Model ................................................................................................................. 4
General Methodology................................................................................................................ 11 Summary of Focus Group Study.............................................................................................. 15
Parent Focus Groups Discussion: Questions and Answers ............................................. 16 Student Focus Groups Discussion: Questions and Answers........................................... 18
Summary of the Pilot Study...................................................................................................... 23 Main Study .................................................................................................................................. 25
Hypotheses.............................................................................................................................. 25 Participants.............................................................................................................................. 25 Materials .................................................................................................................................. 27 Procedure................................................................................................................................. 34 Main Study Analyses............................................................................................................. 42 Motivation ............................................................................................................................... 54 Relationship Between Math Performance and Motivation.............................................. 62 Analysis of the Omitted and Not-Reached Items.............................................................. 64 Discussion of Main Study ..................................................................................................... 65
AP Study...................................................................................................................................... 71 Overview of Study ................................................................................................................. 71 Participants.............................................................................................................................. 72 AP Study Analyses................................................................................................................. 74 Motivation ............................................................................................................................... 78 Relationship between Math Performance and Motivation .............................................. 82 Analysis of Omitted and Not-Reached Items .................................................................... 84 Discussion AP Study.............................................................................................................. 85
Overall Discussion ..................................................................................................................... 89 References.................................................................................................................................... 97

xv
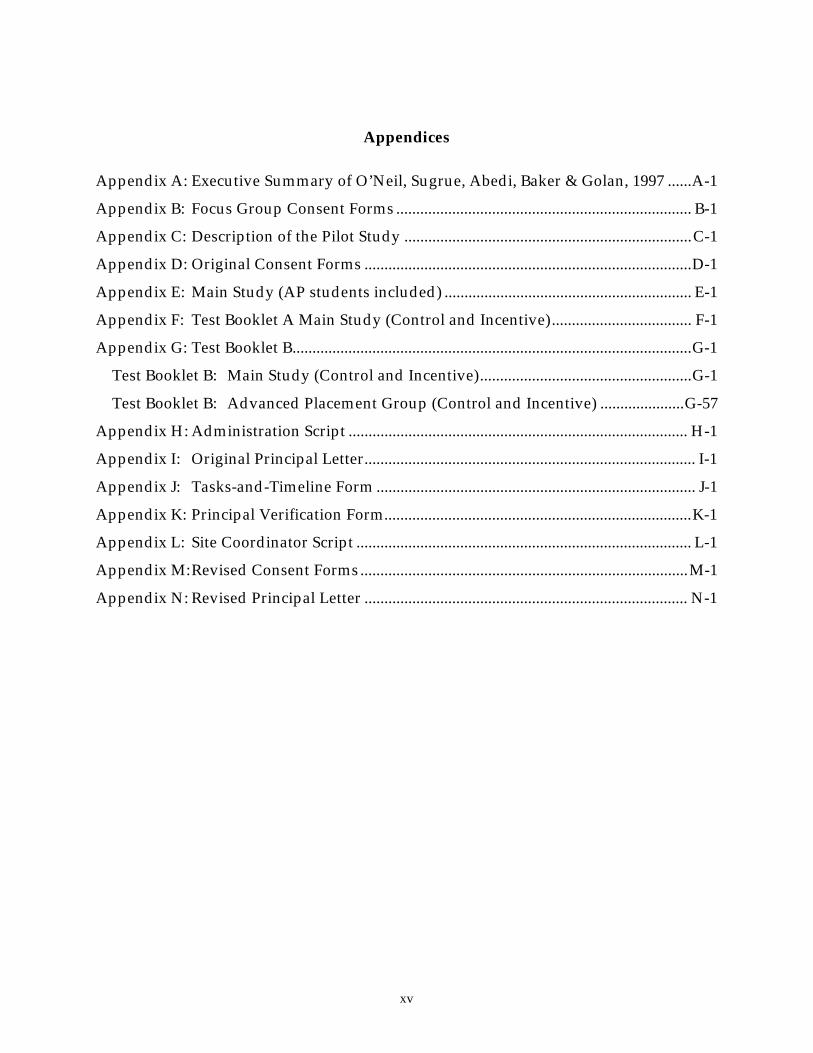
Appendices
Appendix A: Executive Summary of O’Neil, Sugrue, Abedi, Baker & Golan, 1997 ......A-1
Appendix B: Focus Group Consent Forms .......................................................................... B-1
Appendix C: Description of the Pilot Study ........................................................................C-1
Appendix D: Original Consent Forms ..................................................................................D-1
Appendix E: Main Study (AP students included) .............................................................. E-1
Appendix F: Test Booklet A Main Study (Control and Incentive)................................... F-1
Appendix G: Test Booklet B....................................................................................................G-1
Test Booklet B: Main Study (Control and Incentive).....................................................G-1
Test Booklet B: Advanced Placement Group (Control and Incentive) .....................G-57
Appendix H: Administration Script ..................................................................................... H-1
Appendix I: Original Principal Letter................................................................................... I-1
Appendix J: Tasks-and-Timeline Form ................................................................................ J-1
Appendix K: Principal Verification Form.............................................................................K-1
Appendix L: Site Coordinator Script .................................................................................... L-1
Appendix M: Revised Consent Forms..................................................................................M-1
Appendix N: Revised Principal Letter ................................................................................. N-1

xvii
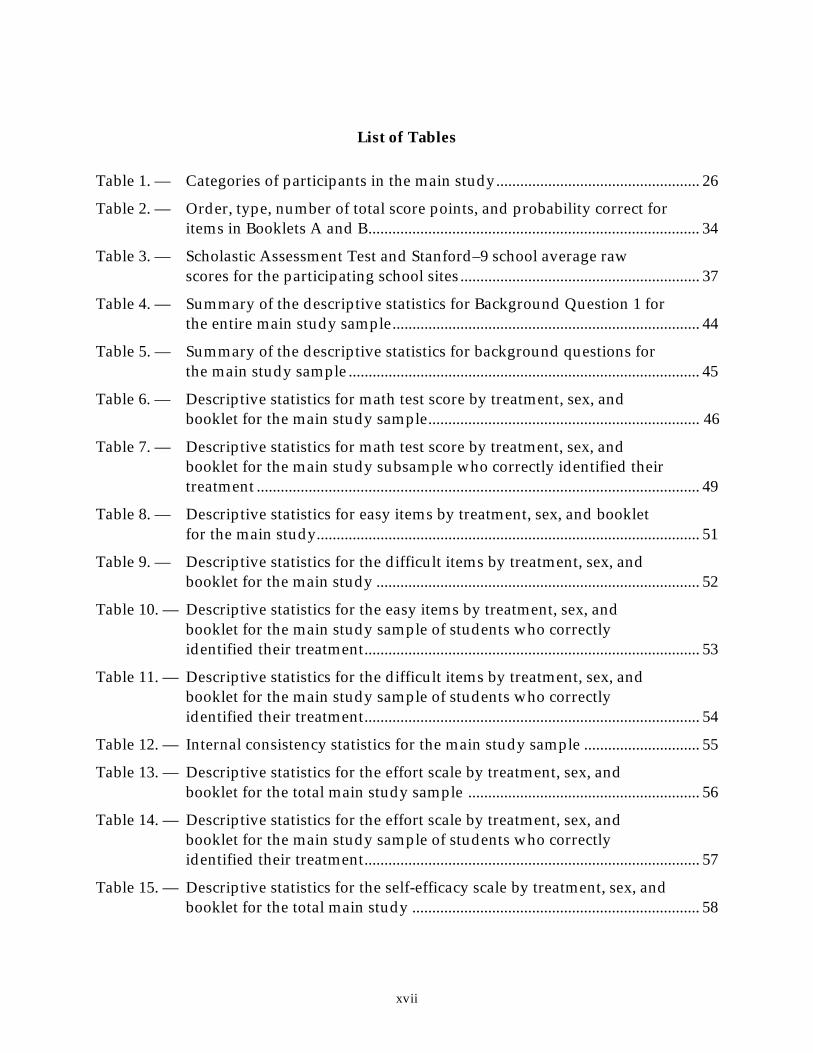
List of Tables
Table 1. — Categories of participants in the main study................................................... 26
Table 2. — Order, type, number of total score points, and probability correct for items in Booklets A and B................................................................................... 34
Table 3. — Scholastic Assessment Test and Stanford–9 school average raw scores for the participating school sites............................................................ 37
Table 4. — Summary of the descriptive statistics for Background Question 1 for the entire main study sample............................................................................. 44
Table 5. — Summary of the descriptive statistics for background questions for the main study sample ........................................................................................ 45
Table 6. — Descriptive statistics for math test score by treatment, sex, and booklet for the main study sample.................................................................... 46
Table 7. — Descriptive statistics for math test score by treatment, sex, and booklet for the main study subsample who correctly identified their treatment ............................................................................................................... 49
Table 8. — Descriptive statistics for easy items by treatment, sex, and booklet for the main study................................................................................................ 51
Table 9. — Descriptive statistics for the difficult items by treatment, sex, and booklet for the main study ................................................................................. 52
Table 10. — Descriptive statistics for the easy items by treatment, sex, and booklet for the main study sample of students who correctly identified their treatment.................................................................................... 53
Table 11. — Descriptive statistics for the difficult items by treatment, sex, and booklet for the main study sample of students who correctly identified their treatment.................................................................................... 54
Table 12. — Internal consistency statistics for the main study sample ............................. 55
Table 13. — Descriptive statistics for the effort scale by treatment, sex, and booklet for the total main study sample .......................................................... 56
Table 14. — Descriptive statistics for the effort scale by treatment, sex, and booklet for the main study sample of students who correctly identified their treatment.................................................................................... 57
Table 15. — Descriptive statistics for the self-efficacy scale by treatment, sex, and booklet for the total main study ........................................................................ 58
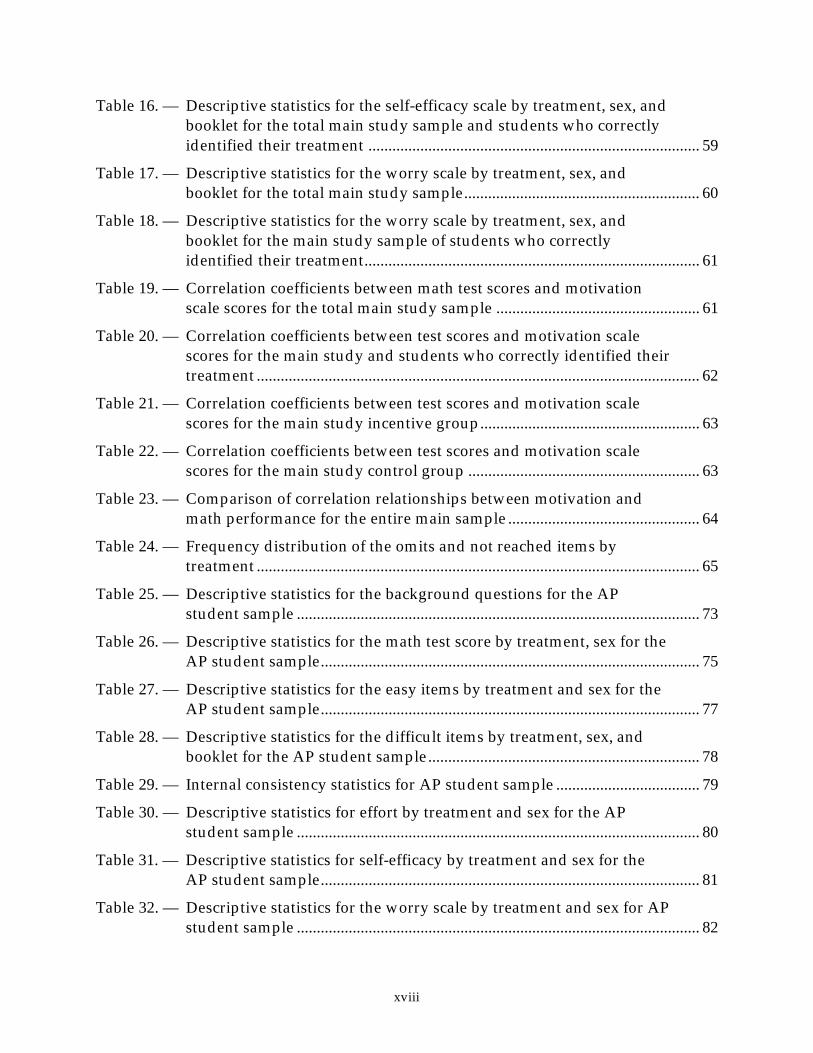
xviii
Table 16. — Descriptive statistics for the self-efficacy scale by treatment, sex, and booklet for the total main study sample and students who correctly identified their treatment ................................................................................... 59
Table 17. — Descriptive statistics for the worry scale by treatment, sex, and booklet for the total main study sample........................................................... 60
Table 18. — Descriptive statistics for the worry scale by treatment, sex, and booklet for the main study sample of students who correctly identified their treatment.................................................................................... 61
Table 19. — Correlation coefficients between math test scores and motivation scale scores for the total main study sample ................................................... 61
Table 20. — Correlation coefficients between test scores and motivation scale scores for the main study and students who correctly identified their treatment ............................................................................................................... 62
Table 21. — Correlation coefficients between test scores and motivation scale scores for the main study incentive group....................................................... 63
Table 22. — Correlation coefficients between test scores and motivation scale scores for the main study control group .......................................................... 63
Table 23. — Comparison of correlation relationships between motivation and math performance for the entire main sample ................................................ 64
Table 24. — Frequency distribution of the omits and not reached items by treatment ............................................................................................................... 65
Table 25. — Descriptive statistics for the background questions for the AP student sample ..................................................................................................... 73
Table 26. — Descriptive statistics for the math test score by treatment, sex for the AP student sample............................................................................................... 75
Table 27. — Descriptive statistics for the easy items by treatment and sex for the AP student sample............................................................................................... 77
Table 28. — Descriptive statistics for the difficult items by treatment, sex, and booklet for the AP student sample.................................................................... 78
Table 29. — Internal consistency statistics for AP student sample .................................... 79
Table 30. — Descriptive statistics for effort by treatment and sex for the AP student sample ..................................................................................................... 80
Table 31. — Descriptive statistics for self-efficacy by treatment and sex for the AP student sample............................................................................................... 81
Table 32. — Descriptive statistics for the worry scale by treatment and sex for AP student sample ..................................................................................................... 82
xix
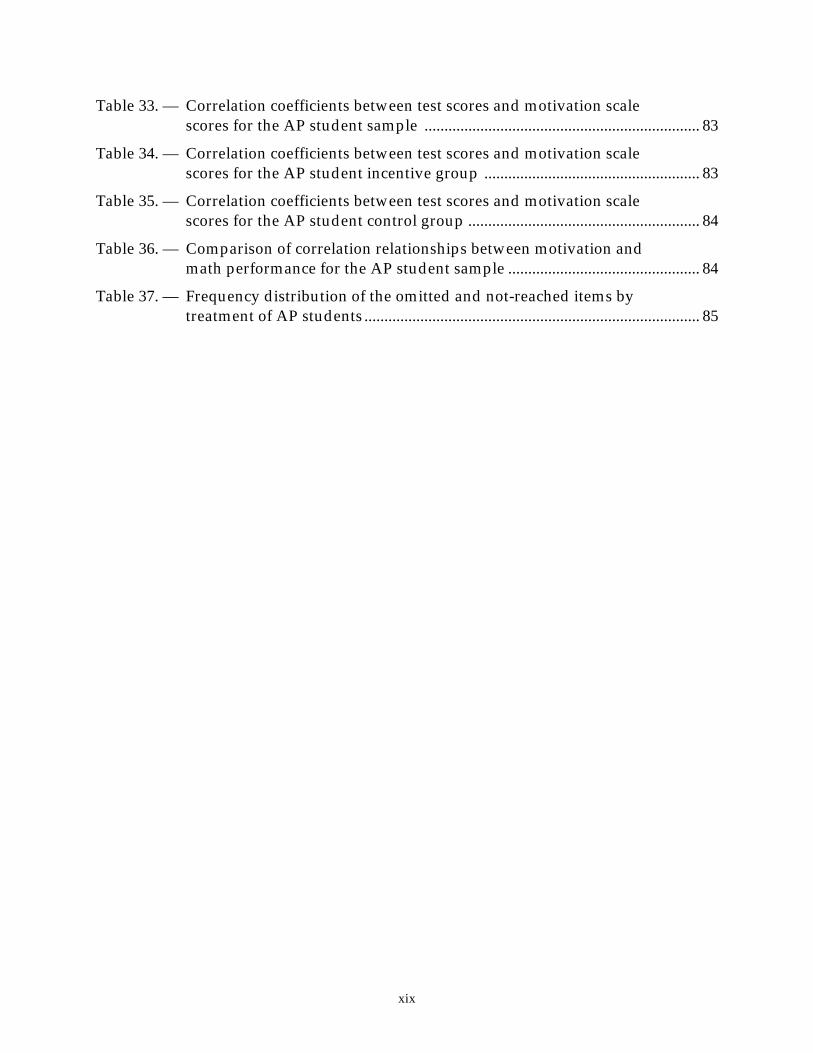
Table 33. — Correlation coefficients between test scores and motivation scale scores for the AP student sample ..................................................................... 83
Table 34. — Correlation coefficients between test scores and motivation scale scores for the AP student incentive group ...................................................... 83
Table 35. — Correlation coefficients between test scores and motivation scale scores for the AP student control group .......................................................... 84
Table 36. — Comparison of correlation relationships between motivation and math performance for the AP student sample ................................................ 84
Table 37. — Frequency distribution of the omitted and not-reached items by treatment of AP students .................................................................................... 85

xxi
List of Figures
Figure 1. — Motivational model for low-stakes testing....................................................... 7
Figure 2. — Example of multiple-choice item ..................................................................... 28
Figure 3. — Example of free-response item ......................................................................... 28
Figure 4. — Scoring rubric for example of free-response item ......................................... 29
Figure 5. — Background questions ....................................................................................... 32
Figure 6. — Practice questions ............................................................................................... 39

1
Introduction
Recent information on international assessments (e.g., the Third International
Mathematics and Science Study, or TIMSS) indicates that 12th-grade students in the
United States are doing extremely poorly on such assessments compared with their
peers in other countries (TIMSS, 1998). Similarly, many 12th-grade students are doing
poorly on the National Assessment of Educational Progress (NAEP). In such tasks and
assessments, in almost all cases, U.S. 12th-grade students perform relatively more
poorly than 8th-grade students. For example, in TIMSS, 12th-grade students are below
the international average whereas 8th-grade students are at the international average.
These poor results in 1994-95 are usually attributed to cognitive factors such as
students’ opportunities to learn, teachers’ lack of professional preparation, etc.
However, a partial explanation of these results may be motivational. Because the low-
stakes (for students) tests were administered late in these 12th-graders’ final year in
high school, this timing may have negatively affected motivation, and thus
performance. This phenomenon has been labeled “senioritis.” For the high school
senior going into the world of work or on to post-secondary education, tests like TIMSS
are clearly low stakes. Thus, one of the major questions about these tests concerns the
possible impact of motivational factors on the results. If students are not motivated to
perform well on low-stakes tests, then the results may underestimate what students
could do if they gave these assessments their best effort.
Rationale
To our knowledge, based on an extensive literature review (to be reported
elsewhere), our research group is the only one conducting research of this type; i.e.,
meaningful monetary incentives with released items from either NAEP or TIMSS with
12th graders. Our literature review findings are also consistent with a meta-analytic
2
review of experiments examining the effects of extrinsic rewards on intrinsic motivation
(Deci, E.L., Koestner, R., & Ryan, R. M. 1999). This study does not review any of our
type of studies. Further, also missed is our prior study (O’Neil, H. F., Jr., Sugrue, B., &
Baker, E. L. 1996). Our basic approach in the present research was to provide sufficient
monetary incentives to maximize student effort and therefore increase performance.
We expected that we could stimulate a 0.5 standard deviation increase in performance
due to monetary incentives. Based on our best case NAEP data (i.e., $1.00 per test item,
8th graders, those who remembered their instructions, on easy items), we got an effect
size of .41. Since we tightened up the experimental procedures and were offering $10.00
per correct item for 12th graders (or an average of $100 for the testing session), we
expected our monetary incentive to work as well as or better than our prior study’s
effective size of .41. Thus, we predicted (we thought) conservatively a .5 effect size.
Subsequent studies could tease out the reason for this effect at test time. Our
results will not generalize, without additional research, to either TIMSS or NAEP.
Further, our results will not generalize to the impact of motivation variables (e.g., effort
and self-efficacy) on the teaching and learning of math. As we focused only on the
assessment of learning, not its development. However, we expected our results to
constitute a proof of concept of the importance of manipulating motivation in low-
stakes assessments for 12th graders.
In summary, we have promising results based on our prior NAEP motivation
research sponsored by the Office of Educational Research and Improvement (OERI),
National Center for Education Statistics (NCES) (See Appendix A for the executive
summary of this report). We hypothesized that the incentives would increase effort,
which along with prior knowledge would improve performance. The effective
incentive in this earlier study was money. In the study (O’Neil, et al., 1992), we
manipulated various incentives (money, task, ego, and standard NAEP instructions) for
3
8th- and 12th-grade samples of students of various ethnicities (White, Black, Hispanic,
and Asian American).
Two issues resulting from our NAEP study were controlled for in the current
study: (a) The incentive effects might be greater if students believed that they would be
rewarded as promised. Some of the participants in our earlier NAEP work were
surprised that we actually provided the money. (b) The incentive effort might be
greater if students remembered the treatment group they were in. Our prior study
indicated that only approximately two thirds of the students remembered (recognized)
what treatment group they were in. We believed that some of the students were not
reading our written instructions carefully. We attempted to increase students’ beliefs
and “remembering” by a combination of (a) a two-item pretest that everyone was
expected to get right, followed by immediate payment of $20 cash for the incentive
condition, followed by (b) oral delivery of test instructions, which required separate
rooms for different treatment conditions, and (c) the math literacy assessment.
In general, for our prior study, only the money incentive worked in the 8th
grade. The results showed, best case, that the money incentive was effective for a
subsample of the 8th-grade students (those who remembered their incentive/treatment
group) with easy and medium difficulty items. With respect to item difficulty results,
because the motivational effect was at test time, it was not expected that this increased
effort would improve performance on hard items, because students did not know the
content. With respect to remembering one’s treatment group, presumably if one
doesn’t remember the incentive (money), then one would not increase one’s effort, and
thus performance. However, no incentives were effective for 12th-grade students, even
those who remembered their treatment.
We hypothesized that in our prior study, the lack of effect for 12th graders was
because (a) the amount of money ($1.00 per item) was not large enough for 12th
4
graders, and further (b) many 12th graders did not believe they would get the money.
Also, we collected the data at the end of the school year for 12th graders (like TIMSS).
Our approach for the current study consisted of manipulating the amount of
money per item correct so as to increase the motivational effect and thus increase
performance. For our assessment we used the released TIMSS math literacy scale items.
This set of items included both multiple-choice and free-response items. The amount of
money given per correct item was either $0 (low-stakes administration, e.g., TIMSS) or
$10 per item correct (which we expected to be effective). The incentive group was
compared with a group receiving standard low-stakes TIMSS instructions. Consistent
with our prior NAEP study, we also collected information on effort, self-efficacy, and
worry.
Motivational Model
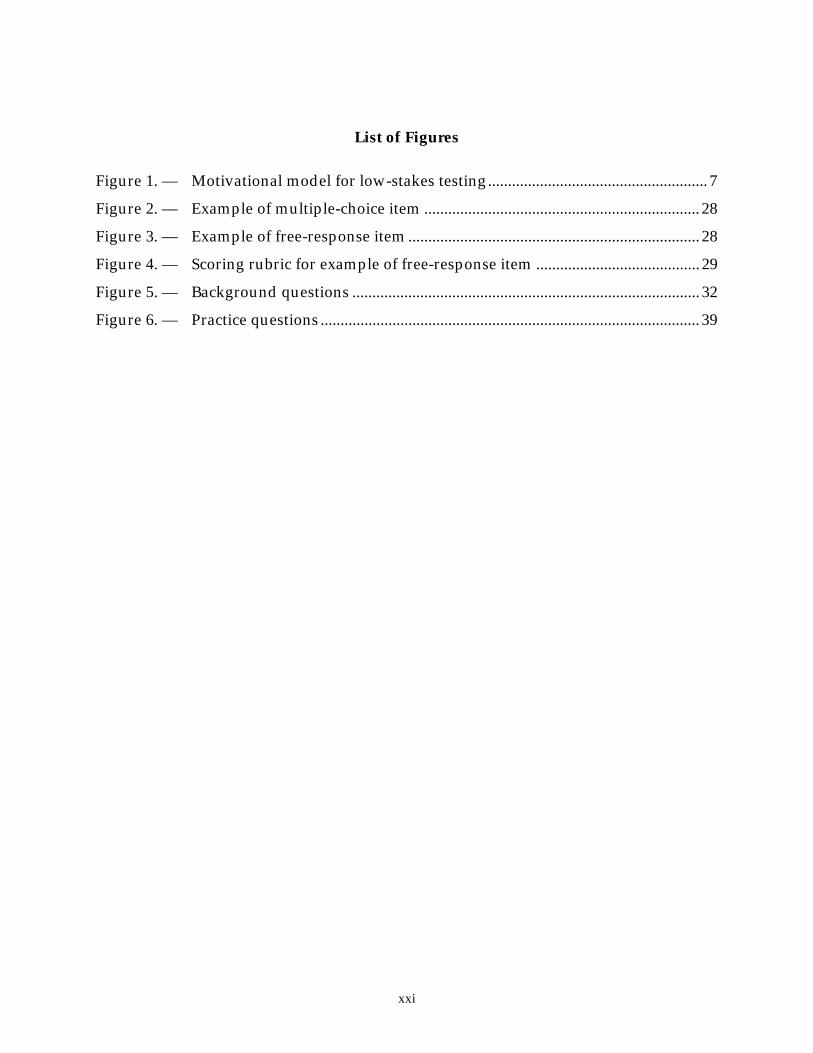
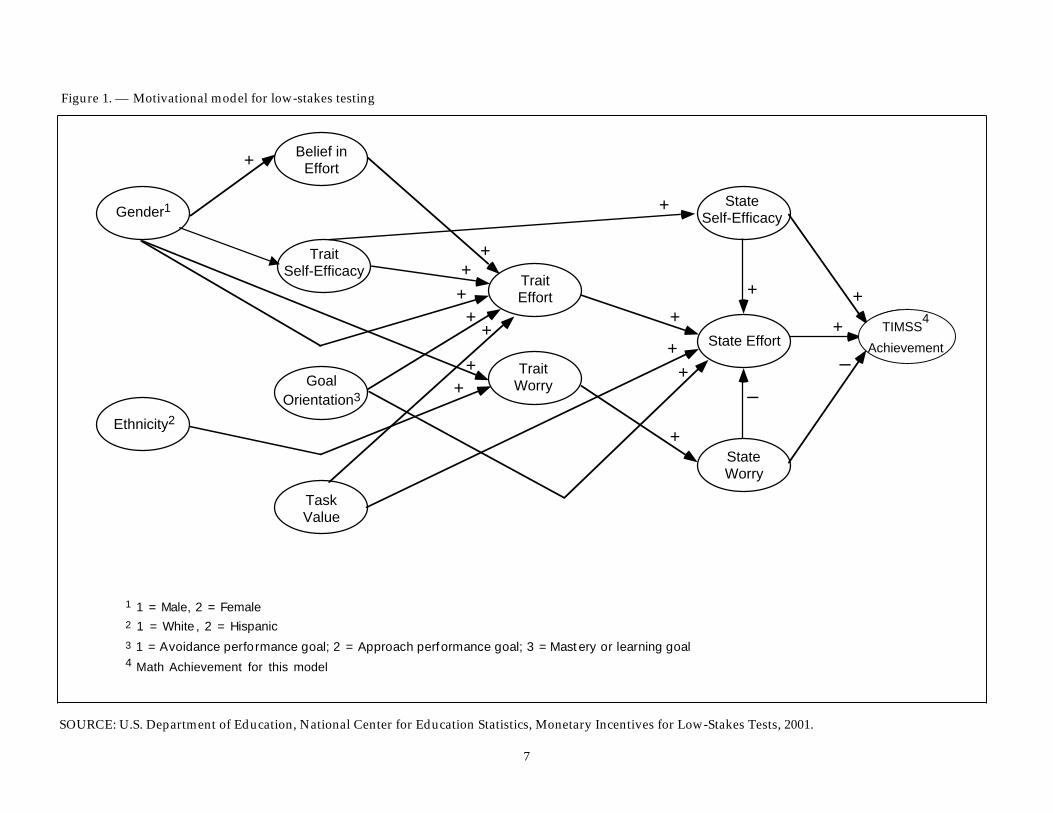
We have provided a first cut of our motivational model for low-stakes testing in
Figure 1. The motivational model is adapted from a value and expectancy model (e.g.,
Pintrich & De Groot, 1990; Wigfield & Eccles, 2000). Basically, one is asking oneself
“Why am I doing this?” (e.g., value) and “Can I do the tasks?” (expectancies, e.g., self-
efficacy). To this basic model we added two critical individual difference variables—
sex and ethnicity. Finally, we added a trait/state conception of most of these variables.
In Figure 1, this set of variables and their relationships are based on the literature and
our expert opinion. We suggest that the latent variables in Figure 1 constitute the major
motivational influences on low-stakes testing. The structural equation modeling format
shows the predicted relations between variables, indicated by arrows (—>) and the
direction of the effect, indicated by positive (+) or negative (–) signs. For example, it is
expected that gender would be positively related to belief in effort (females are
expected to attribute their success on academic tasks to effort more strongly than
males). In turn, belief in effort would be positively related to trait effort (if one
5
attributes success to effort, then one would be more likely to generally work harder on
academic tasks). Further, trait effort is expected to be related positively to state effort (if
one generally works hard on academic tasks, then it is likely that one would work hard
on a particular low-stakes assessments TIMSS). Finally, state effort is related positively
to TIMSS achievement (if one works hard on this particular TIMSS assessment, then one
expects TIMSS achievement would be higher than for those who expend less effort).
Many of the relationships in Figure 1 are expected to be the same across all
content areas. However, in a particular content area, like TIMSS math, the motivational
model includes an arrow with a negative sign between sex and trait self-efficacy
because in math, males tend to have higher self-efficacy than females. For other content
areas this relationship would not be true.
Finally, variables in the figure labeled as “traits” and “states” (e.g., trait worry
and state worry) refer to a trait or state construct. Our definitions of traits and states are
informed by Spielberger’s (1975) discussion of trait and state anxiety. Traits are
considered stable characteristics of a person and are relatively difficult to change. A
trait is a predisposition to manifest a state. Traits are measured in our lab by asking
students to rate questionnaire items on a frequency scale (1 = almost never, 2 = sometimes,
3 = often, 4 = almost always). Students are asked to describe how they generally think or
feel. States refer to the manifestation of the traits in the situation. States (e.g., state
worry) change in intensity and vary over time. States are measured in our lab by asking
students to rate items on an intensity scale (1 = not at all, 2 = somewhat, 3 = moderately so,
4 = very much so). Students are asked to describe either how they feel “right now” or
how they felt while they were taking the test.
The most important motivational influences at test time and measured in this
study are the following: (a) State effort. If students put more effort into the exam, then
they would attempt more items, omit fewer items, and complete the entire set of items.
Given the same level of prior knowledge (or content understanding), a student who put
6
more effort into the exam would get a higher score. (b) State self-efficacy. If a student
had high self-efficacy concerning the content (e.g., math), he or she would put more
effort into the test and thus improve performance. (c) State worry. If a student had
higher state worry, it would interfere with test performance, resulting in a lower TIMSS
score.
7
Figure 1. — Motivational model for low-stakes testing
TraitEffort
Gender1
Ethnicity2
Belief inEffort
State EffortNAEP
Achievement
TaskValue
GoalOrientation3
TraitWorry
TraitSelf-Efficacy
StateWorry
StateSelf-Efficacy
1 1 = Male, 2 = Female2 1 = White , 2 = Hispanic
3 1 = Avoidance performance goal; 2 = Approach performance goal; 3 = Mast ery or learning goal
Motivation Model v.4Figure 1. Mot ivat ional model for low-st akes t est ing.
+
++
+
+
+
++
+
+ +
+
–
–
+
+
+
+
SOURCE: U.S. Department of Education, National Center for Education Statistics, Monetary Incentives for Low-Stakes Tests, 2001.
TIMSS4
Achievement
Math Achievement for this model4

9
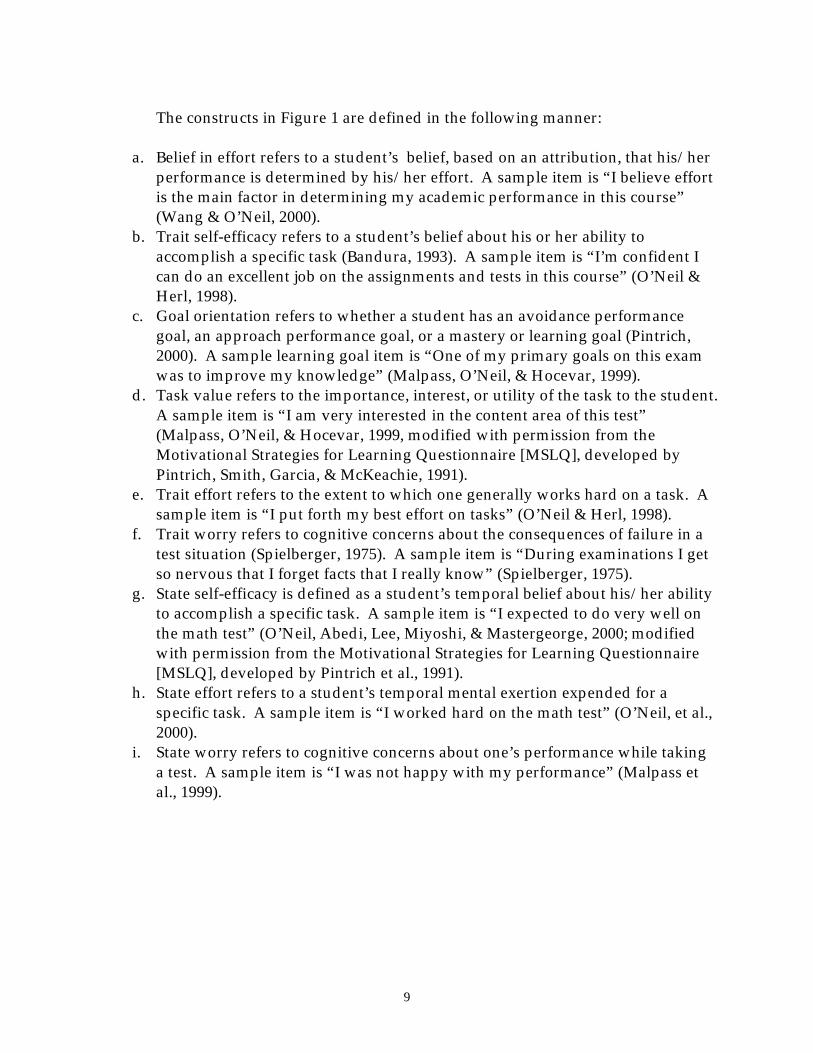
The constructs in Figure 1 are defined in the following manner:
a. Belief in effort refers to a student’s belief, based on an attribution, that his/her performance is determined by his/her effort. A sample item is “I believe effort is the main factor in determining my academic performance in this course” (Wang & O’Neil, 2000).
b. Trait self-efficacy refers to a student’s belief about his or her ability to accomplish a specific task (Bandura, 1993). A sample item is “I’m confident I can do an excellent job on the assignments and tests in this course” (O’Neil & Herl, 1998).
c. Goal orientation refers to whether a student has an avoidance performance goal, an approach performance goal, or a mastery or learning goal (Pintrich, 2000). A sample learning goal item is “One of my primary goals on this exam was to improve my knowledge” (Malpass, O’Neil, & Hocevar, 1999).
d. Task value refers to the importance, interest, or utility of the task to the student. A sample item is “I am very interested in the content area of this test” (Malpass, O’Neil, & Hocevar, 1999, modified with permission from the Motivational Strategies for Learning Questionnaire [MSLQ], developed by Pintrich, Smith, Garcia, & McKeachie, 1991).
e. Trait effort refers to the extent to which one generally works hard on a task. A sample item is “I put forth my best effort on tasks” (O’Neil & Herl, 1998).
f. Trait worry refers to cognitive concerns about the consequences of failure in a test situation (Spielberger, 1975). A sample item is “During examinations I get so nervous that I forget facts that I really know” (Spielberger, 1975).
g. State self-efficacy is defined as a student’s temporal belief about his/her ability to accomplish a specific task. A sample item is “I expected to do very well on the math test” (O’Neil, Abedi, Lee, Miyoshi, & Mastergeorge, 2000; modified with permission from the Motivational Strategies for Learning Questionnaire [MSLQ], developed by Pintrich et al., 1991).
h. State effort refers to a student’s temporal mental exertion expended for a specific task. A sample item is “I worked hard on the math test” (O’Neil, et al., 2000).
i. State worry refers to cognitive concerns about one’s performance while taking a test. A sample item is “I was not happy with my performance” (Malpass et al., 1999).

11
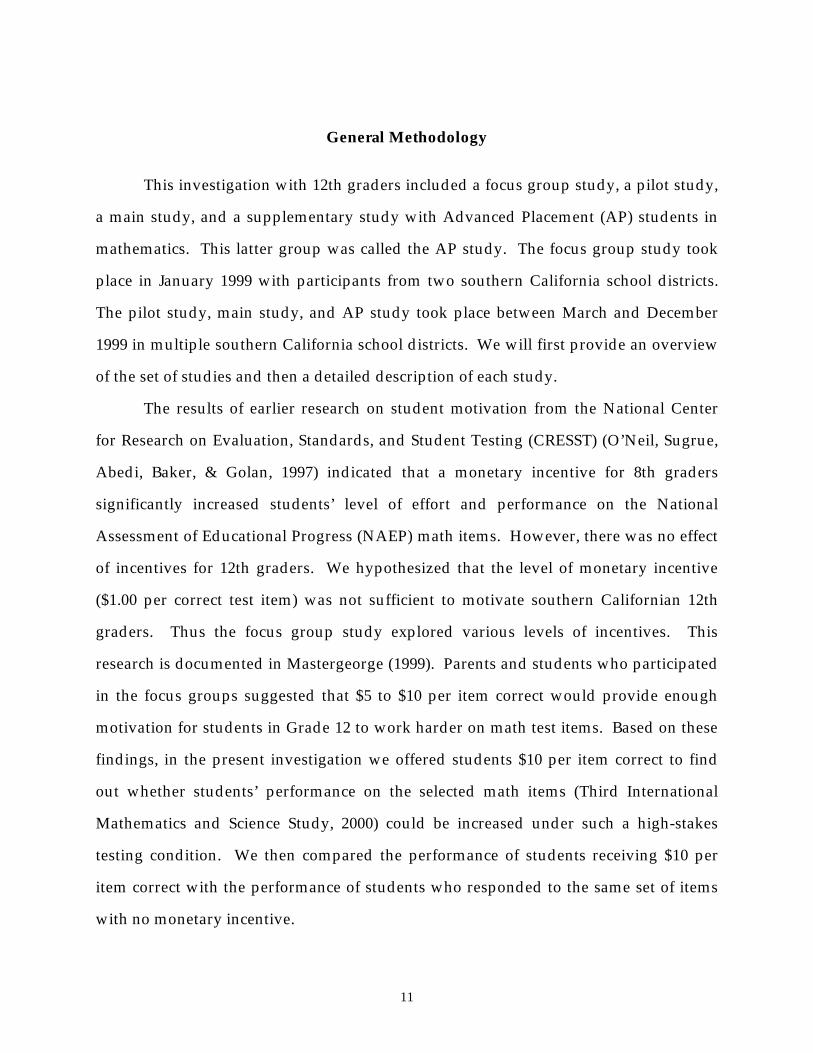
General Methodology
This investigation with 12th graders included a focus group study, a pilot study,
a main study, and a supplementary study with Advanced Placement (AP) students in
mathematics. This latter group was called the AP study. The focus group study took
place in January 1999 with participants from two southern California school districts.
The pilot study, main study, and AP study took place between March and December
1999 in multiple southern California school districts. We will first provide an overview
of the set of studies and then a detailed description of each study.
The results of earlier research on student motivation from the National Center
for Research on Evaluation, Standards, and Student Testing (CRESST) (O’Neil, Sugrue,
Abedi, Baker, & Golan, 1997) indicated that a monetary incentive for 8th graders
significantly increased students’ level of effort and performance on the National
Assessment of Educational Progress (NAEP) math items. However, there was no effect
of incentives for 12th graders. We hypothesized that the level of monetary incentive
($1.00 per correct test item) was not sufficient to motivate southern Californian 12th
graders. Thus the focus group study explored various levels of incentives. This
research is documented in Mastergeorge (1999). Parents and students who participated
in the focus groups suggested that $5 to $10 per item correct would provide enough
motivation for students in Grade 12 to work harder on math test items. Based on these
findings, in the present investigation we offered students $10 per item correct to find
out whether students’ performance on the selected math items (Third International
Mathematics and Science Study, 2000) could be increased under such a high-stakes
testing condition. We then compared the performance of students receiving $10 per
item correct with the performance of students who responded to the same set of items
with no monetary incentive.
12
For the pilot, main, and AP studies, a test booklet was created that included the
following: the released Third International Mathematics and Science Study (TIMSS)
math items, along with two practice items, test instructions, a background
questionnaire, and a state motivation questionnaire consisting of scales for measuring
students’ level of effort, self-efficacy, and worry. In the background questionnaire,
students were asked to indicate what kind of math class they currently were taking,
whether they remembered the testing conditions they were under, and whether a
language other than English was spoken in the home. They were also asked to indicate
whether they had had the opportunity to learn the materials that were covered in the
test and to self-report their Stanford 9 test scores and their grade point average in math.
To control for cheating between students during the testing (e.g., discussing their
work with each other), two parallel forms of the math test were created. Students in
each classroom were also divided into two groups; one group was randomly assigned
to the incentive condition to receive money per item correct, and one group to the
control condition to be tested with no monetary incentive. Each group was tested in a
separate room. Within each group, one of the parallel forms was given systematically
to every other student.
A total of 725 students participated in the pilot, main, and AP studies. There
were 144 students in the pilot study, 415 students in the main study, and 166 students in
the AP study. For the pilot, main, and AP studies, students were selected from 23
different schools (5 schools in the pilot study, 9 schools in the main study, and 9 schools
in the AP study) from southern California school districts in different locations. These
schools had different demographics and different levels of overall student performance.
Following the focus group study, we conducted the pilot study. The purpose of
the pilot study was to test design issues, examine the accuracy and language of the
instruments, and resolve logistical problems. The results of the pilot study helped us to
13
refine the instruments and to modify the design. We then conducted the main study
and the AP study.

15
Summary of Focus Group Study
Parents and students were recruited for participation in the focus groups by
teachers at their school sites in January 1999. A total of eight focus groups (four student
groups and four parent groups) were conducted with students and parents from two
schools in two different districts in the southern California area. The student groups
were composed of sons and daughters of the parent groups. The high math
achievement AP student and parent sample included a total of 12 students and 12
parents in two focus groups of 7 and 5 parents each and two focus groups of 7 and 5
students each; the non-AP low/medium math achievement sample included a total of
15 students and 15 parents in two focus groups of 8 and 7 parents each and two focus
groups of 8 and 7 students each. Students in the low/medium achievement group were
not AP math students. Although we did not originally plan to include Advanced
Placement students in the pilot or main studies, we used them for some of the focus
groups as we expected these parents and students to be most knowledgeable about the
educational system and most verbal and vocal regarding possible problems/issues with
our design.
The focus group high schools were chosen for their diverse representation of
students across ethnicities, socioeconomic status, and academic performance, and for
their participation/non-participation in Advanced Placement (AP) courses. Two
groups—senior high school students (17- and 18-year-olds) taking AP mathematics and
their parents, and senior high school students (17- and 18-year-olds) taking non-AP
courses and their parents—were recruited in order to investigate any similarities or
differences among the students and parents regarding their thoughts about incentives
on low-stakes testing (Mastergeorge, 1999).
16
The focus groups were conducted in January 1999 to obtain both parent and
student perspectives on monetary incentives. A verbal script was read aloud to all
participants and included general information about the format, confidentiality issues,
and any risk or benefit involved in being a participant in the focus group study (See
Mastergeorge, 1999, for focus group script). Focus group consent, assent, and parental
permission forms were then distributed accordingly to all participants (See Appendix B
for Focus Group consent forms for AP participants; see Mastergeorge, 1999, for focus
group consent forms for non-AP participants).
The groups were facilitated by two researchers who engaged participants in
discussion in order to ascertain those conditions that might affect students’ performance
and the amount of money that might increase students’ motivation to perform on a low-
stakes test, as well as to uncover other variables and parameters that might impact the
study (e.g., the amount of incentive per item, parental concerns for monetary incentives,
hurt feelings regarding students chosen for incentive versus non-incentive groups, etc.).
The following description summarizes the results of the focus groups we conducted
with parents and students. A more extensive report was provided in Mastergeorge
(1999). The text below by Mastergeorge is meant to give a flavor of the results. In
general, the results supported our hypotheses, but they also allowed us to refine our
ideas and procedures.
Parent Focus Groups Discussion: Questions and Answers
1. Suppose your child was given an incentive for getting correct answers on a
test. Can you describe/discuss the kinds of “rewards” you would feel
comfortable with for correct test items?
{Query: amount, payment type (e.g., cash, check, and gift certificate)}
{Query: types of stores in the neighborhood available to students}
17
Parents suggested grades, promoting competition between the schools, a
year of paid auto insurance (if they drive), test/class exemptions, extra
credit, gift certificates, and tickets to sports games or concerts. Even if they
did not totally agree with the study being done (paying students to perform
well), they were okay with having money as an incentive as long as the
students understood that this was a one-time study. Many of the parents
reward their kids for good grades by taking them out to dinner, granting
them driving privileges, or giving them the chance to make their own
decisions, etc., or punish them for not getting good grades by removing
driving privileges or "grounding" them. They believe the motivation
should come from the home, but most of the parents seemed to agree that
since this was a one-time thing, they would agree to participate and not be
worried about the money and their children’s motivation. They felt that
cash, checks, and direct deposit would be equally as motivating. Gift
certificates would be motivating as well, but most of the parents thought
their children would prefer money since they would have more choice
about what to do with it. They agreed that savings bonds would not be as
motivating since the payoff is not as immediate. The parents felt that any
amount of money would motivate their teenagers. One group of parents,
who had children in Advanced Placement classes, felt that they would be
comfortable with their children receiving $50 at the most, but the rest of the
groups felt they would not have a problem with their children receiving as
much as $250.
2. Discuss any concerns you might have about your child receiving such an
incentive.
{Query: other students’ envy/jealousy; safety issues; value conflict}
18
Having students receive cash is not a safety concern (in their schools)
especially if they pick it up at the office and the other students do not know
how much they got. Of course, it depends on the area in which you choose
to do the study. If it comes in the form of a check, it could be sent to the
house.
3. Are there other issues that might affect your child’s performance that we
should think about related to a “reward”?
{Query: status of seniors, concern with other issues (e.g., college acceptances
rather than test performance), amount of reward}
There could be hurt feelings. The students may think it is not fair, or they
might feel bad if they do not do well. They should be given a minimum of
something for trying—although they should not be told they would be
getting it.
Student Focus Groups Discussion: Questions and Answers
1. Suppose you were given an incentive (or reward) for getting correct
answers on a test. What kinds of rewards might motivate you to care about
getting a correct answer?
(a) cash {query amounts: $5.00 per item, $10.00 per item}
(b) check {query: check as opposed to cash}
(c) gift certificate {query: types of stores (e.g., Wherehouse, Gap, and
McDonalds}
The most popular answer for all of the students was, as expected, money.
Many thought other incentives, such as certificates, scholarships, grades,
extra credit, class/test exemption, and college recognition, would be
motivating as well, but not as motivating as the cash incentive. The
problems with gift certificates were that students would need to know
19
before the test where the certificate would be from, and they would have to
like the place. The places that were popular would be clothing stores in Los
Angeles such as Macy’s, Old Navy, Footlocker, and the Gap; music stores
such as Sam Goody’s and Blockbuster; restaurants such as the Olive Garden
and TGI Friday’s; and movie theatres such as AMC. Many also thought a
choice of stores would be a good motivating factor, and the places of choice
would depend on the areas that the students lived in. Things like savings
bonds would be less motivating because the rewards are not immediate.
Since many of the students we talked to were planning to go to college next
year, money seemed to be the most useful. The college-bound students
considered money in the form of direct deposit just as motivating as cash (if
they had a bank account), or a check (as long as it was easily cashed.)
However, some of the students stated that cashing a check or money order
can be a big hassle for them, and often involved a service charge for doing
so. Amounts as small as $25 ($1 per question correct for a 25-item test)
could be motivating; students would try for any money they could get.
They felt $5, even $10, per item would be even more motivating, especially
if the test was especially difficult. The value of the amount of money they
could get may be influenced by whether they work or not since they would
consider how much time they would need to spend on the job in order to
get that amount.
2. Do you have any concerns about receiving a reward?
Some students taking the test will be in a group without getting a reward,
and we want to know if you have concerns about this {query: safety issues}.
Most of the students felt that safety was not a concern at their schools.
Students often bring money to school and feel safe doing so since no one
really knows how much they have and there is not much of a problem with
20
theft at school. Even the students of lower income backgrounds felt that it
would not matter if you received as much as $250 because unless someone
knew how much you had, no one would bother you. You could be robbed
at any time, whether you had cash, a check, or a money order. Their
suggestion was to have the school make an announcement that the
participants of the study go to the principal’s office after school and have
them pick up an envelope with the money.
3. Are there any other issues or concerns you might have if you were chosen
to participate in a test like this?
{Query: issues that would facilitate participation, barriers to participation,
e.g., senior status issues/concerns}
There is a concern that some students might feel bad if they tried their best
and did not get any right. If they did not get anything from the study, then
everyone would know that they performed badly. They felt that if you at
least show up and try, you should get something for just participating—
even if it is only a small gift certificate. A few felt that the non-incentive
group should even receive something for participating—of course, they
would not be told before they took the test. (We plan to do this.) There was
also a concern about the unfairness that some students may not have been
taught the material that is covered on the test. They suggested that the best
time of the day to do the study would be in the morning because that is
when they will be the most awake and many students are excused at the
end of the day for sports or other extracurricular activities. Most of the
students felt their parents would support their participation in the study
because they would be getting money that they could use for college. Since
the study is one time only, they did not feel that participation in this study
21
would affect their motivation to perform on other tests that have no
incentives.
In summary, we were examining the effect of fewer dollars per item correct ($2
to $5 per item correct versus $10 per item correct) in the focus group studies. Thus, we
were investigating the magnitude of standard incentives to be used in the main study.
We believed that $10 per test item correct would be appropriate. The $10 figure was
also agreed on (instead of $20 per correct test item) at the National Center for Education
Statistics (NCES) design review of our study, before we initiated the pilot study. For
the focus groups with parents, we were mainly interested in parents’ reaction to the
incentive idea, security concerns in regard to giving students cash, and whether we
should provide payment in the form of checks or certificates. We believed that parental
fears were minimal and that because it was a one-time only study, there would not be
potential opposition. We provided checks as payment.

23
Summary of the Pilot Study
The results of the pilot study guided us in modification of both instruments and
the administration procedures. A more complete description of the pilot study can be
found in Appendix C. Based on what we learned from the pilot study, we made several
major modifications to the consent forms and the logistics of test administration for
subsequent data collection. Among the most important issues emerging from the pilot
testing was the issue that is technically referred to as “diffusion of treatment”
(McMillan & Schumacher, 1997). As indicated in Appendix C there were no significant
differences in math performance between the incentive and control group. We
suspected that in the pilot study, some of the students in the control group may have
found out that there was a monetary incentive and thus were motivated to perform
better on the math test. The source of this possible contamination was the consent letter
and form that we sent to the parents and the school, as required by the University of
California, Los Angeles (UCLA) Human Subjects Protection Committee. Parents and
students had to sign a consent form in order to participate in the study. The consent
form indicated that some students would receive money for each item that they
answered correctly (See Appendix D). Since students in the control group should have
been tested under the “no money was paid to students” testing condition, learning
about the experimental condition may have impacted their performance on the math
test.
We also made some major modifications to the test instructions and the
background questions, beginning with the fourth pilot school site. For example, we
added a question on opportunity to learn (OTL) to see whether students had had an
opportunity to learn the materials that were covered in the math test items. Since we
24
did not have any other measures of students’ academic progress, we also asked
students to self-report their last year’s Stanford 9 scores and their grades in math.
In summary, in the pilot study, we did not find evidence to support our
hypotheses that money would increase students’ performance in math. Male students
performed better on the math items than female students. There was no significant
effect of booklets. The incentive condition did not increase students’ effort or their self-
efficacy or worry. However, we felt that with the revised consent forms and procedures
we were ready to test the hypothesis of this investigation in the main and AP study.
25
Main Study
Hypotheses
We hypothesized that those students receiving $10 per item correct would
perform significantly higher in math than those who were not receiving any monetary
incentive (the control group). Such students would exhibit higher effort and self-
efficacy, but less anxiety than control group participants. Our approach consisted of
manipulating the amount of money per item correct so as to increase effort and thus
increase math performance. In general, we expected overall anxiety levels to be low
given the low-stakes nature of the test. The latter findings would replicate our prior
NAEP findings.
To test the main effects and interaction of treatment and sex, a three-factor
completely crossed Analysis of Variance (ANOVA) model was applied to the data. In
this model, factor 1 was the treatment effect (incentive versus control) factor 2 was sex
(female versus male) and factor 3 was booklet format (A vs. B). It was expected that the
mean math score of the subjects in the incentive group would be higher that the mean
for the control group and males would perform higher on the math test than females.
There were no explicit hypotheses for booklet effect, as this variable was meant to
minimize cheating.
Participants
There were 415 non-AP students from nine school sites in the main study.
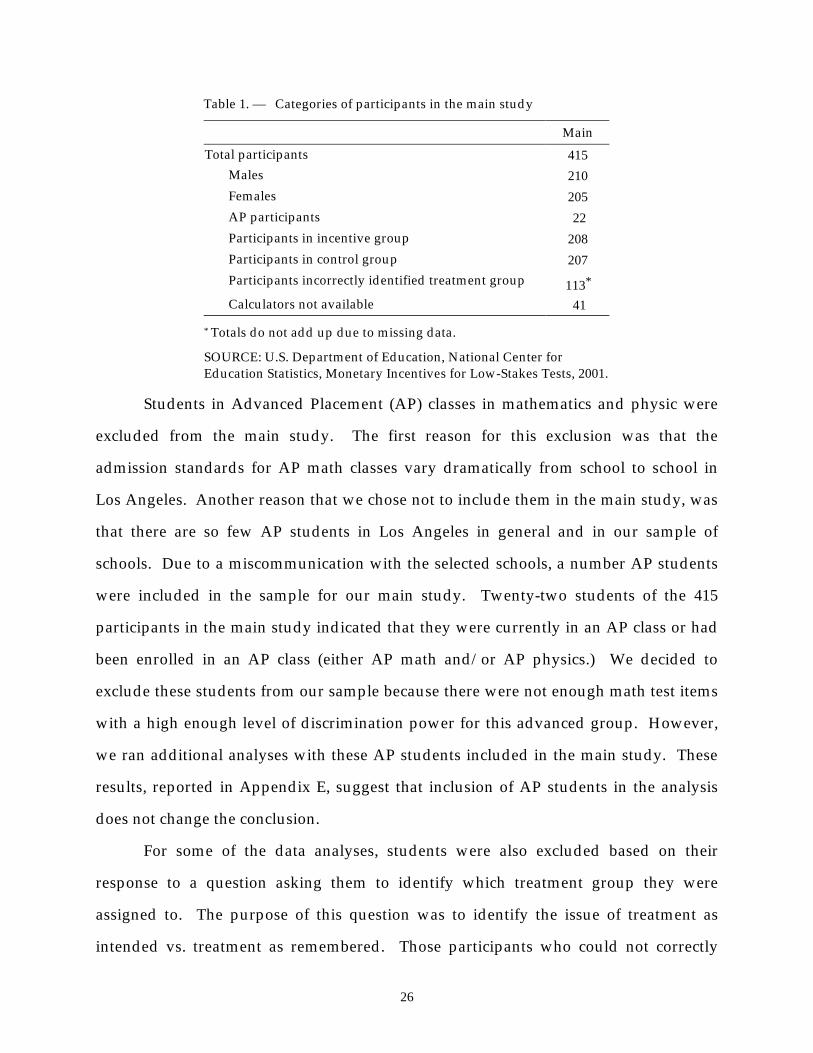
26
Table 1. — Categories of participants in the main study
Main Total participants 415
Males 210 Females 205 AP participants 22 Participants in incentive group 208 Participants in control group 207 Participants incorrectly identified treatment group 113* Calculators not available 41
* Totals do not add up due to missing data.
SOURCE: U.S. Department of Education, National Center for Education Statistics, Monetary Incentives for Low-Stakes Tests, 2001.
Students in Advanced Placement (AP) classes in mathematics and physic were
excluded from the main study. The first reason for this exclusion was that the
admission standards for AP math classes vary dramatically from school to school in
Los Angeles. Another reason that we chose not to include them in the main study, was
that there are so few AP students in Los Angeles in general and in our sample of
schools. Due to a miscommunication with the selected schools, a number AP students
were included in the sample for our main study. Twenty-two students of the 415
participants in the main study indicated that they were currently in an AP class or had
been enrolled in an AP class (either AP math and/or AP physics.) We decided to
exclude these students from our sample because there were not enough math test items
with a high enough level of discrimination power for this advanced group. However,
we ran additional analyses with these AP students included in the main study. These
results, reported in Appendix E, suggest that inclusion of AP students in the analysis
does not change the conclusion.
For some of the data analyses, students were also excluded based on their
response to a question asking them to identify which treatment group they were
assigned to. The purpose of this question was to identify the issue of treatment as
intended vs. treatment as remembered. Those participants who could not correctly
27
identify their treatment group were dropped from the analyses. In the main study, 150
students in the incentive group correctly identified they were to receive money.
However, 5 of those students also responded that they could not remember. In the
control group, 9 students inappropriately responded that they were to receive money
and another 6 students had invalid data; 192 students did not respond to this
alternative. However, there were 35 out of the 192 students who also responded that
they could not remember the instructions.
A few students received booklets that did not contain all test questions; data
from those students were excluded from the analyses. One student answered “1” for all
questions on one section of the test motivation questionnaire and that student’s
responses were excluded from the motivation part of the analyses. In the main study,
due to an unanticipated increase in the number of eligible participants in four
classrooms, calculators were not available for 41 students.
Materials
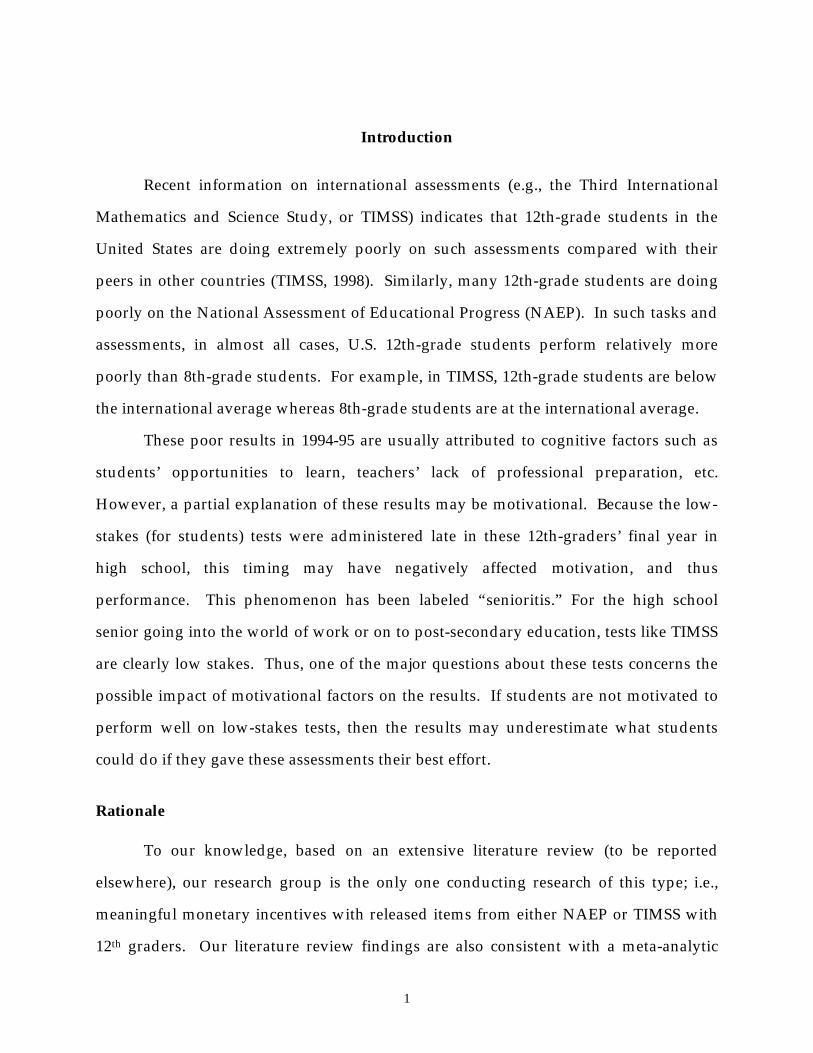
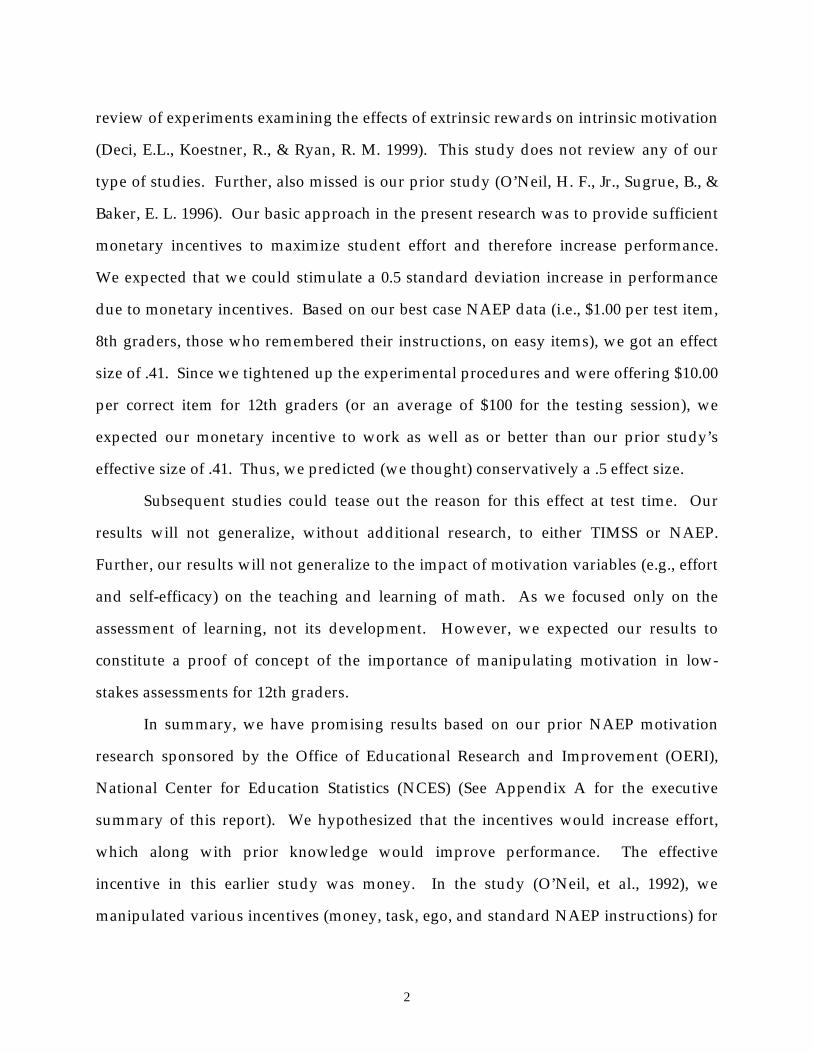
Mathematics Tests. We used the 20 released math literacy items from the Third
International Mathematics and Science Study (TIMSS). The items ranged in level of
difficulty, with the probability of responding correctly in the national sample ranging
from .26 to .86 (p values). The items included 12 multiple-choice questions and 8 free-
response questions. The multiple-choice items had either four- or five-answer options
(See Figure 2 below for a multiple-choice item example with correct answer keyed). The
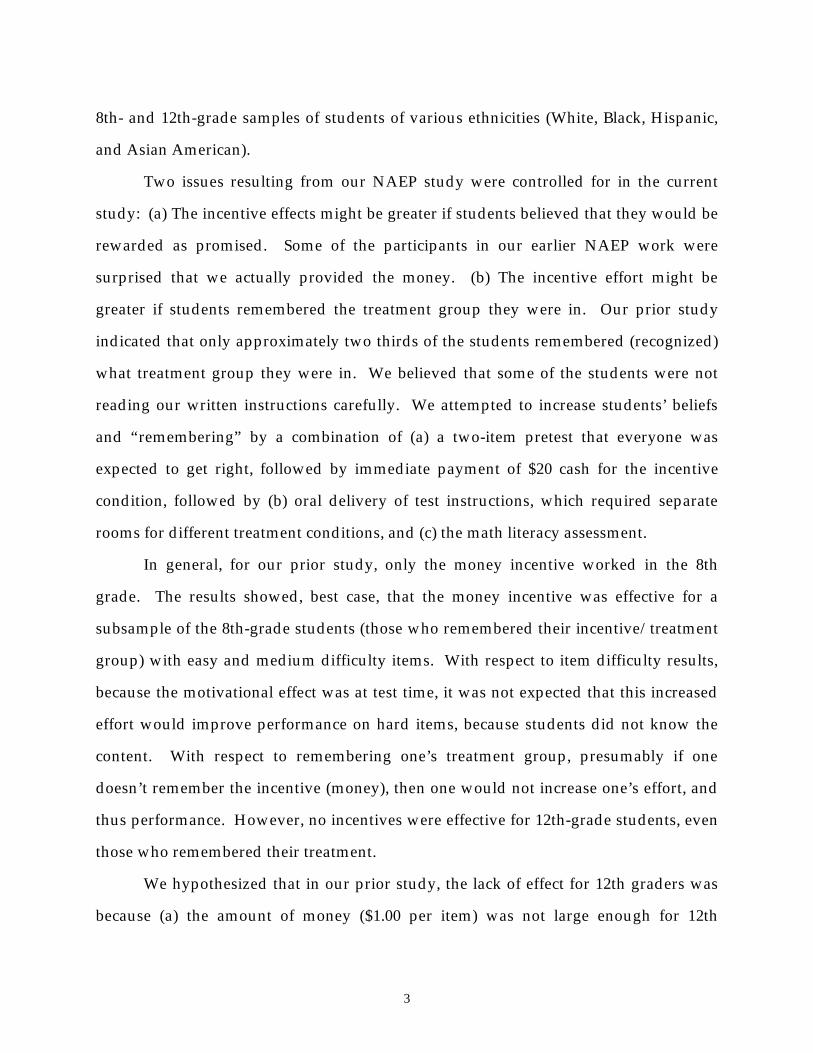
free-response items required that the participants show the calculation process, write
down an explanation for the response, or draw a graph (See Figure 3 below for an item
example and Figure 4 for the scoring rubric).
28
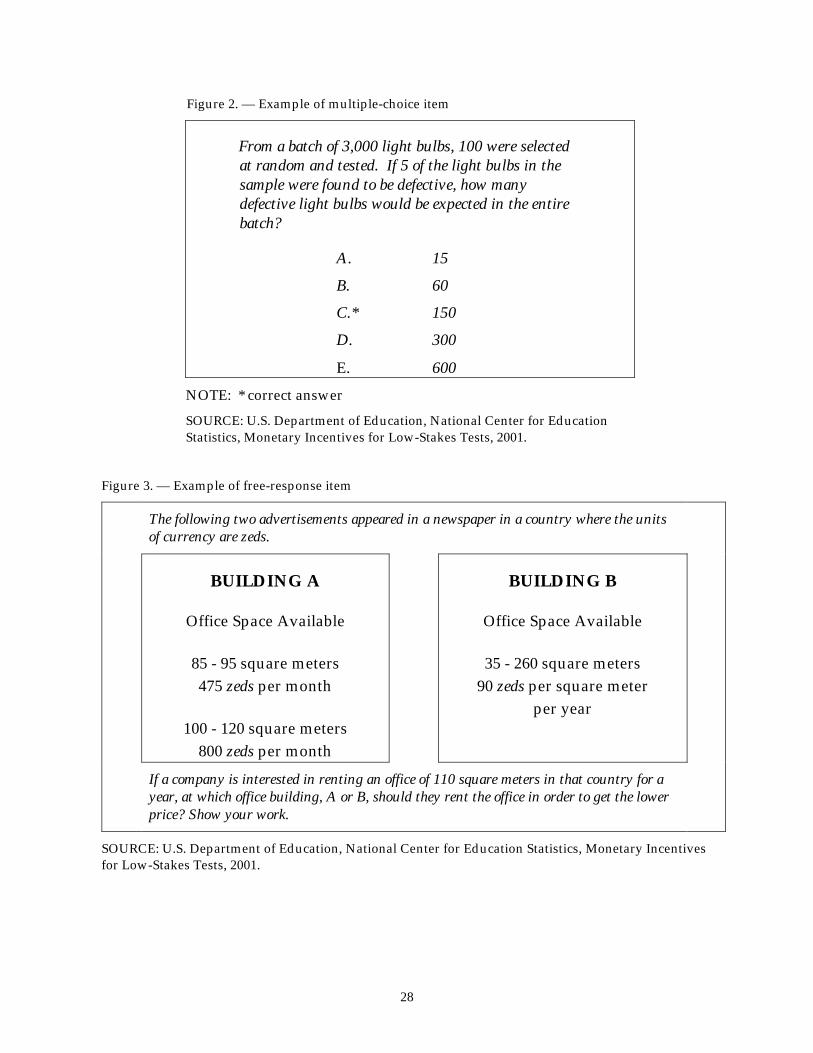
Figure 2. — Example of multiple-choice item
From a batch of 3,000 light bulbs, 100 were selected at random and tested. If 5 of the light bulbs in the sample were found to be defective, how many defective light bulbs would be expected in the entire batch?
A. 15
B. 60
C.* 150
D. 300
E. 600
NOTE: * correct answer
SOURCE: U.S. Department of Education, National Center for Education Statistics, Monetary Incentives for Low-Stakes Tests, 2001.
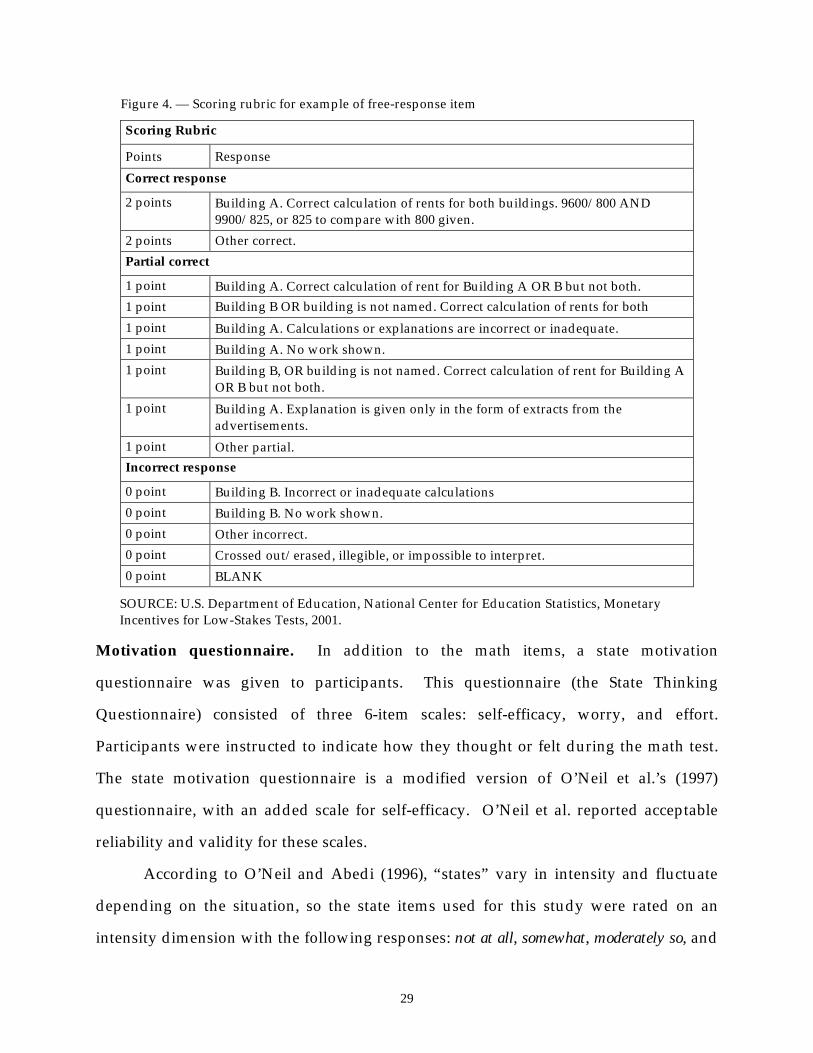
Figure 3. — Example of free-response item
The following two advertisements appeared in a newspaper in a country where the units of currency are zeds.
BUILDING A
Office Space Available
85 - 95 square meters 475 zeds per month
100 - 120 square meters
800 zeds per month
BUILDING B
Office Space Available
35 - 260 square meters
90 zeds per square meter per year
If a company is interested in renting an office of 110 square meters in that country for a year, at which office building, A or B, should they rent the office in order to get the lower price? Show your work.
SOURCE: U.S. Department of Education, National Center for Education Statistics, Monetary Incentives for Low-Stakes Tests, 2001.
29
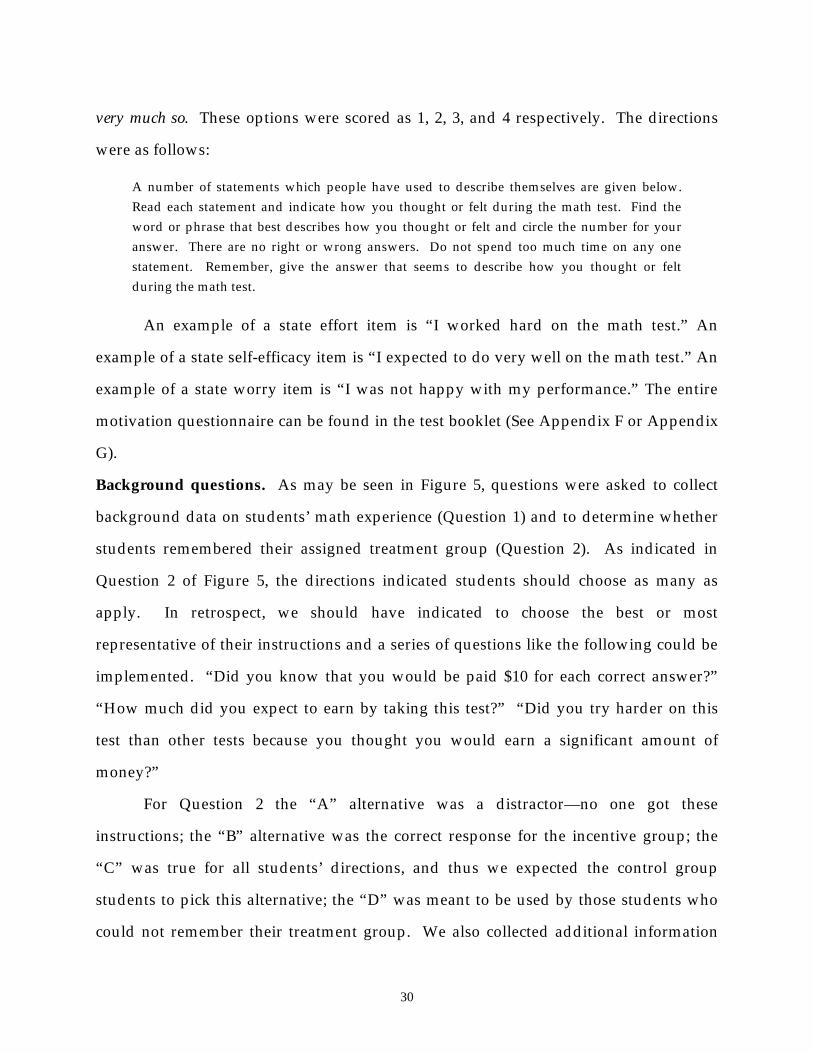
Figure 4. — Scoring rubric for example of free-response item
Scoring Rubric
Points Response Correct response
2 points Building A. Correct calculation of rents for both buildings. 9600/800 AND 9900/825, or 825 to compare with 800 given.
2 points Other correct. Partial correct
1 point Building A. Correct calculation of rent for Building A OR B but not both. 1 point Building B OR building is not named. Correct calculation of rents for both 1 point Building A. Calculations or explanations are incorrect or inadequate. 1 point Building A. No work shown. 1 point Building B, OR building is not named. Correct calculation of rent for Building A
OR B but not both. 1 point Building A. Explanation is given only in the form of extracts from the
advertisements. 1 point Other partial. Incorrect response
0 point Building B. Incorrect or inadequate calculations 0 point Building B. No work shown. 0 point Other incorrect. 0 point Crossed out/erased, illegible, or impossible to interpret. 0 point BLANK
SOURCE: U.S. Department of Education, National Center for Education Statistics, Monetary Incentives for Low-Stakes Tests, 2001.
Motivation questionnaire. In addition to the math items, a state motivation
questionnaire was given to participants. This questionnaire (the State Thinking
Questionnaire) consisted of three 6-item scales: self-efficacy, worry, and effort.
Participants were instructed to indicate how they thought or felt during the math test.
The state motivation questionnaire is a modified version of O’Neil et al.’s (1997)
questionnaire, with an added scale for self-efficacy. O’Neil et al. reported acceptable
reliability and validity for these scales.
According to O’Neil and Abedi (1996), “states” vary in intensity and fluctuate
depending on the situation, so the state items used for this study were rated on an
intensity dimension with the following responses: not at all, somewhat, moderately so, and
30
very much so. These options were scored as 1, 2, 3, and 4 respectively. The directions
were as follows:
A number of statements which people have used to describe themselves are given below. Read each statement and indicate how you thought or felt during the math test. Find the word or phrase that best describes how you thought or felt and circle the number for your answer. There are no right or wrong answers. Do not spend too much time on any one statement. Remember, give the answer that seems to describe how you thought or felt during the math test.
An example of a state effort item is “I worked hard on the math test.” An
example of a state self-efficacy item is “I expected to do very well on the math test.” An
example of a state worry item is “I was not happy with my performance.” The entire
motivation questionnaire can be found in the test booklet (See Appendix F or Appendix
G).
Background questions. As may be seen in Figure 5, questions were asked to collect
background data on students’ math experience (Question 1) and to determine whether
students remembered their assigned treatment group (Question 2). As indicated in
Question 2 of Figure 5, the directions indicated students should choose as many as
apply. In retrospect, we should have indicated to choose the best or most
representative of their instructions and a series of questions like the following could be
implemented. “Did you know that you would be paid $10 for each correct answer?”
“How much did you expect to earn by taking this test?” “Did you try harder on this
test than other tests because you thought you would earn a significant amount of
money?”
For Question 2 the “A” alternative was a distractor—no one got these
instructions; the “B” alternative was the correct response for the incentive group; the
“C” was true for all students’ directions, and thus we expected the control group
students to pick this alternative; the “D” was meant to be used by those students who
could not remember their treatment group. We also collected additional information
31
and students’ math achievement (Question 3), language background (Question 4), SAT-
9 score (Question 5), and opportunity to learn (Questions 6 and 7) (See Figure 5).
In addition, after school site 7, we shortened the answer options for Question 2.
This modified version was used for sites 8–14 and all of the AP sites.
32
Figure 5. — Background questions
1. What kind of classes are you taking this year? Mark all that apply.
(A) I am not taking mathematics this year (B) Regular classes in mathematics (C) AP classes in mathematics (D) Regular classes in physics (E) AP classes in physics
2. As we mentioned in the directions, we used many booklets, each with different
questions. We are interested in how well you remember the directions that were given. Your directions were (choose as many as apply):
(A) “These new test items will allow us to compare your mathematical ability with that of other students in your classroom, in your school, in your school district, and around the world.”
(B) “There are a total of 20 questions…we will give you $10 for each correct answer, just like the easier test you completed.”
(C) “There are a total of 20 questions…if you finish early, you can go back to those questions you could not answer in this section only.”
(D) “Some of the questions will be followed by four or five possible answers indicated with a letter next to it. For these questions, circle the letter next to the answer you consider to be correct, as shown in Example 1."
(E) “I can’t remember.” 3. Mark the statement that best describes your math grades since ninth grade.
(A) Mostly A’s (B) Mostly B’s (C) Mostly C’s (D) Mostly D’s (E) Mostly below D
4. How often do the people in your home speak a language other than English?
(A) Never (B) Sometimes (C) Always
5. What was your total SAT 9 score last year? _________________________ 6. Have all of the concepts presented in these math questions been taught to you in your
previous or current math classes?
(A) Yes (B) No
7. If there are some questions whose concepts you feel have not been taught to you, please
list them below:
SOURCE: U.S. Department of Education, National Center for Education Statistics, Monetary Incentives for Low-Stakes Tests, 2001.
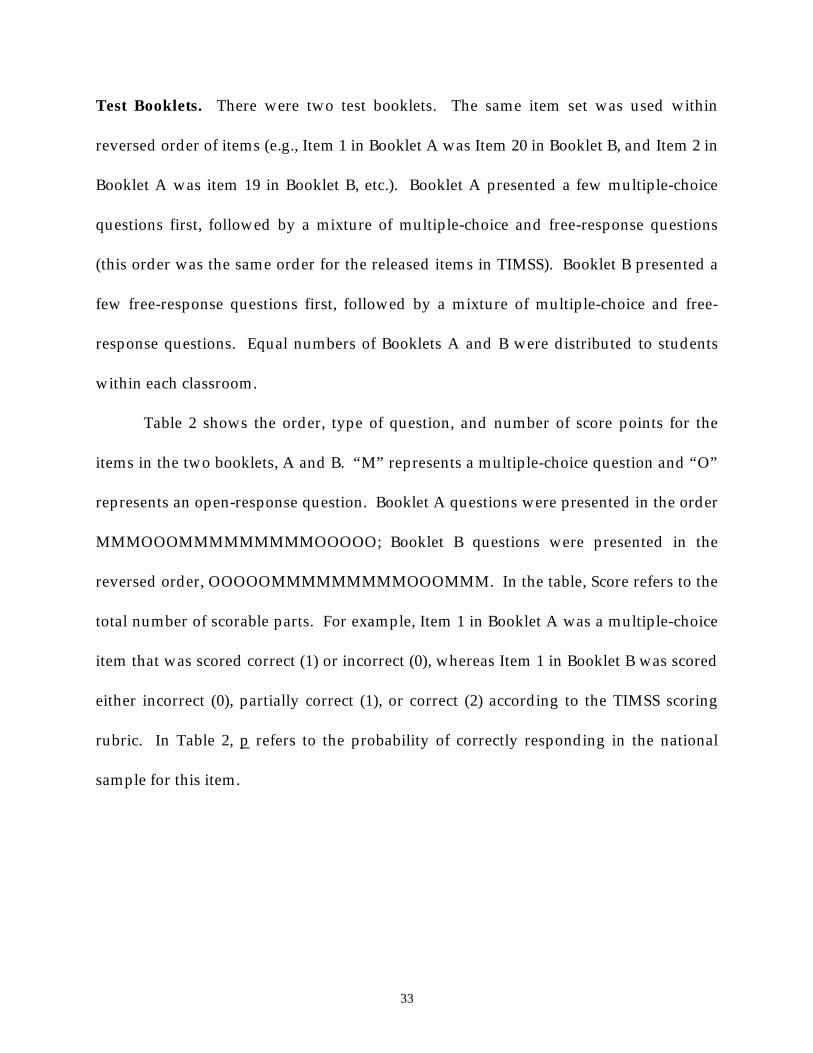
33
Test Booklets. There were two test booklets. The same item set was used within
reversed order of items (e.g., Item 1 in Booklet A was Item 20 in Booklet B, and Item 2 in
Booklet A was item 19 in Booklet B, etc.). Booklet A presented a few multiple-choice
questions first, followed by a mixture of multiple-choice and free-response questions
(this order was the same order for the released items in TIMSS). Booklet B presented a
few free-response questions first, followed by a mixture of multiple-choice and free-
response questions. Equal numbers of Booklets A and B were distributed to students
within each classroom.
Table 2 shows the order, type of question, and number of score points for the
items in the two booklets, A and B. “M” represents a multiple-choice question and “O”
represents an open-response question. Booklet A questions were presented in the order
MMMOOOMMMMMMMMMOOOOO; Booklet B questions were presented in the
reversed order, OOOOOMMMMMMMMMOOOMMM. In the table, Score refers to the
total number of scorable parts. For example, Item 1 in Booklet A was a multiple-choice
item that was scored correct (1) or incorrect (0), whereas Item 1 in Booklet B was scored
either incorrect (0), partially correct (1), or correct (2) according to the TIMSS scoring
rubric. In Table 2, p refers to the probability of correctly responding in the national
sample for this item.
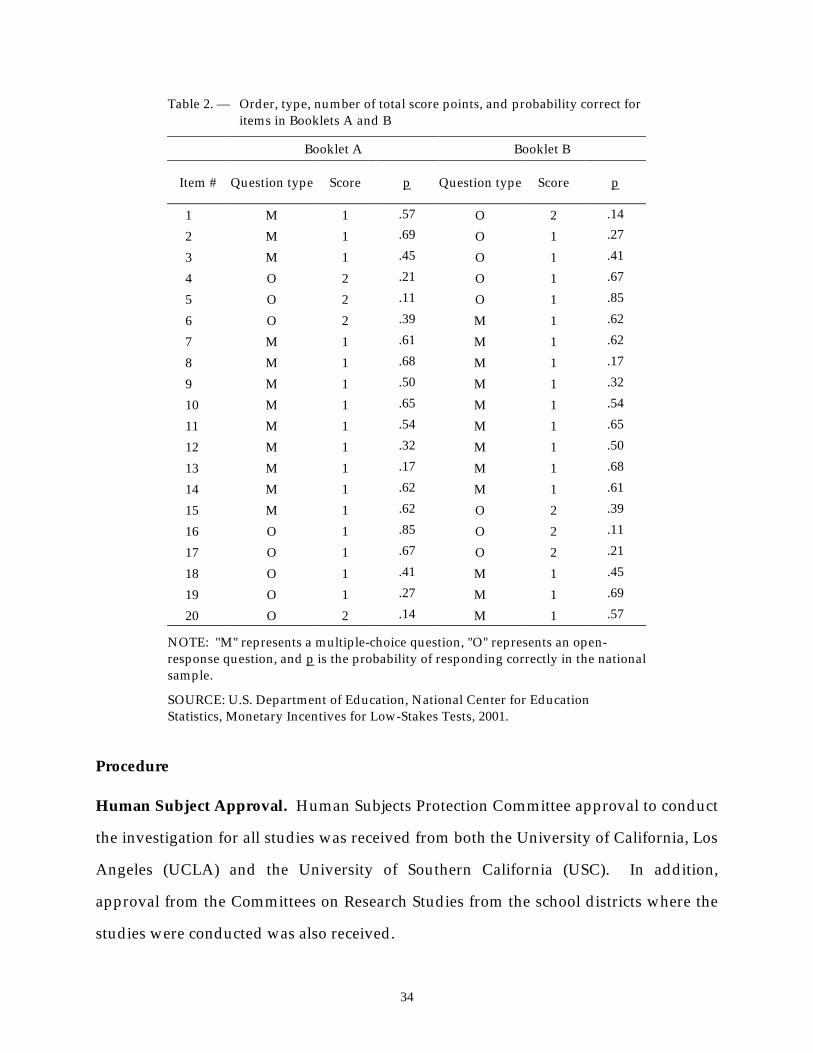
34
Table 2. — Order, type, number of total score points, and probability correct for items in Booklets A and B
Booklet A Booklet B
Item # Question type Score p Question type Score p
1 M 1 .57 O 2 .14
2 M 1 .69 O 1 .27
3 M 1 .45 O 1 .41
4 O 2 .21 O 1 .67
5 O 2 .11 O 1 .85
6 O 2 .39 M 1 .62
7 M 1 .61 M 1 .62
8 M 1 .68 M 1 .17
9 M 1 .50 M 1 .32
10 M 1 .65 M 1 .54
11 M 1 .54 M 1 .65
12 M 1 .32 M 1 .50
13 M 1 .17 M 1 .68
14 M 1 .62 M 1 .61
15 M 1 .62 O 2 .39
16 O 1 .85 O 2 .11
17 O 1 .67 O 2 .21
18 O 1 .41 M 1 .45
19 O 1 .27 M 1 .69
20 O 2 .14 M 1 .57
NOTE: "M" represents a multiple-choice question, "O" represents an open-response question, and p is the probability of responding correctly in the national sample.
SOURCE: U.S. Department of Education, National Center for Education Statistics, Monetary Incentives for Low-Stakes Tests, 2001.
Procedure
Human Subject Approval. Human Subjects Protection Committee approval to conduct
the investigation for all studies was received from both the University of California, Los
Angeles (UCLA) and the University of Southern California (USC). In addition,
approval from the Committees on Research Studies from the school districts where the
studies were conducted was also received.
35
Test Administrators. Test administrators included retired teachers and administrators,
and the National Center for Research on Evaluation, Standards, and Student Testing
(CRESST) research staff. All test administrators had prior experience with test
administration. However, to inform test administrators about the test administration
procedures germane to this study, a training session was held in February 1999. The co-
project directors provided background information about the study and reviewed the
protocol for preparing for and administering the test, which included information about
answering student questions. Test administrators were instructed to read directly from
the test administration script so that all participants across sites would receive the same
directions. Two test administration scripts were developed (see Appendix H), one for
the incentive group and one for the control group.
The training session concluded with a review of the test administration script.
The test administrators worked in pairs and practiced reading the script aloud in order
to familiarize themselves with it.
Four test administrators and a coordinator attended each site. Of the four test
administrators, two were assigned to the incentive group and two were assigned to the
control group. The test administrator who was not the designated script reader
followed along on his/her own copy as the directions were read aloud to the students.
This was done to insure that all information was read to the students, and to provide
individual assistance to students, if necessary. The coordinator monitored and handled
any unforeseen site related questions or issues.
The concept of being paid to do well was explained in the incentive group test
administration script and a reminder phrase was written on the board (i.e.,
$10/QUESTION). The section of the incentive group test directions that addressed the
incentive treatment is as follows:
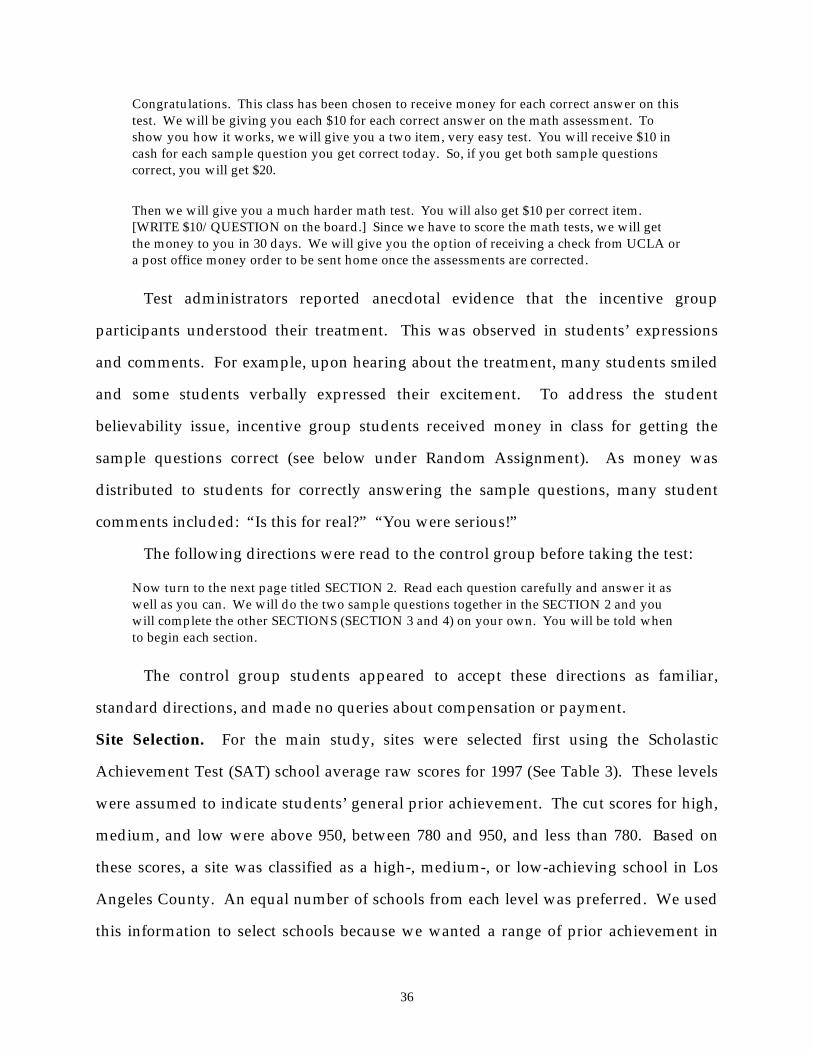
36
Congratulations. This class has been chosen to receive money for each correct answer on this test. We will be giving you each $10 for each correct answer on the math assessment. To show you how it works, we will give you a two item, very easy test. You will receive $10 in cash for each sample question you get correct today. So, if you get both sample questions correct, you will get $20.
Then we will give you a much harder math test. You will also get $10 per correct item. [WRITE $10/QUESTION on the board.] Since we have to score the math tests, we will get the money to you in 30 days. We will give you the option of receiving a check from UCLA or a post office money order to be sent home once the assessments are corrected.
Test administrators reported anecdotal evidence that the incentive group
participants understood their treatment. This was observed in students’ expressions
and comments. For example, upon hearing about the treatment, many students smiled
and some students verbally expressed their excitement. To address the student
believability issue, incentive group students received money in class for getting the
sample questions correct (see below under Random Assignment). As money was
distributed to students for correctly answering the sample questions, many student
comments included: “Is this for real?” “You were serious!”
The following directions were read to the control group before taking the test:
Now turn to the next page titled SECTION 2. Read each question carefully and answer it as well as you can. We will do the two sample questions together in the SECTION 2 and you will complete the other SECTIONS (SECTION 3 and 4) on your own. You will be told when to begin each section.
The control group students appeared to accept these directions as familiar,
standard directions, and made no queries about compensation or payment.
Site Selection. For the main study, sites were selected first using the Scholastic
Achievement Test (SAT) school average raw scores for 1997 (See Table 3). These levels
were assumed to indicate students’ general prior achievement. The cut scores for high,
medium, and low were above 950, between 780 and 950, and less than 780. Based on
these scores, a site was classified as a high-, medium-, or low-achieving school in Los
Angeles County. An equal number of schools from each level was preferred. We used
this information to select schools because we wanted a range of prior achievement in
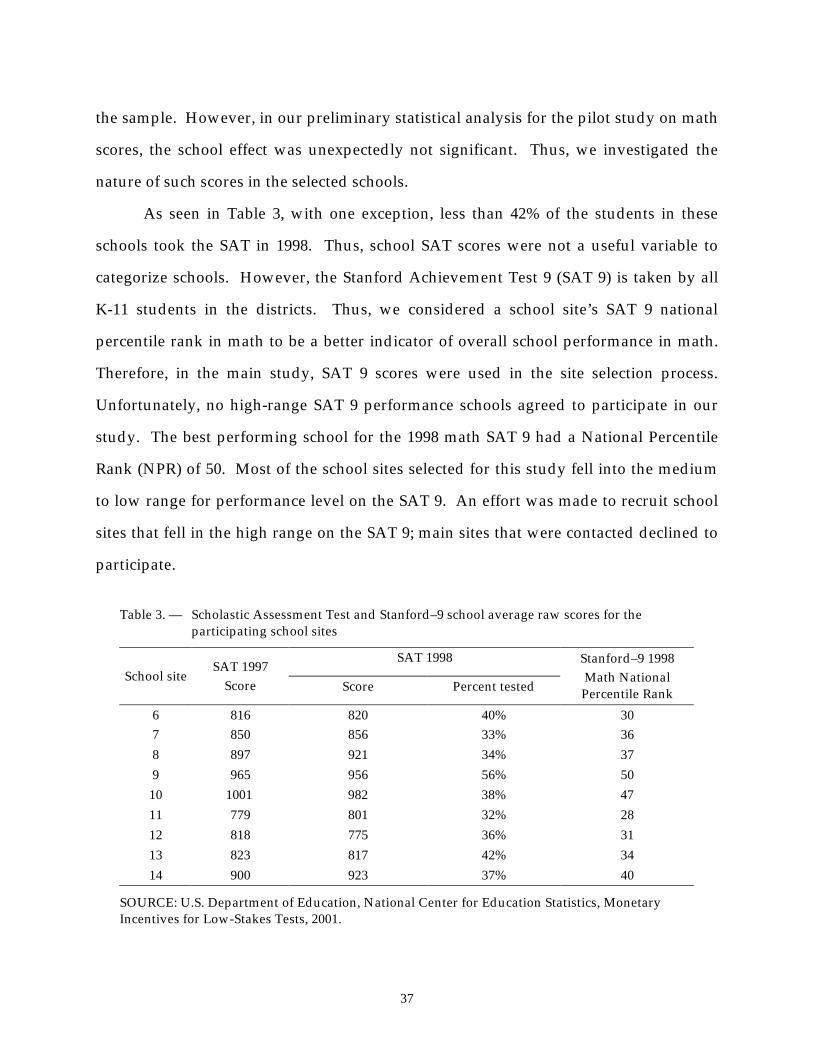
37
the sample. However, in our preliminary statistical analysis for the pilot study on math
scores, the school effect was unexpectedly not significant. Thus, we investigated the
nature of such scores in the selected schools.
As seen in Table 3, with one exception, less than 42% of the students in these
schools took the SAT in 1998. Thus, school SAT scores were not a useful variable to
categorize schools. However, the Stanford Achievement Test 9 (SAT 9) is taken by all
K-11 students in the districts. Thus, we considered a school site’s SAT 9 national
percentile rank in math to be a better indicator of overall school performance in math.
Therefore, in the main study, SAT 9 scores were used in the site selection process.
Unfortunately, no high-range SAT 9 performance schools agreed to participate in our
study. The best performing school for the 1998 math SAT 9 had a National Percentile
Rank (NPR) of 50. Most of the school sites selected for this study fell into the medium
to low range for performance level on the SAT 9. An effort was made to recruit school
sites that fell in the high range on the SAT 9; main sites that were contacted declined to
participate.
Table 3. — Scholastic Assessment Test and Stanford–9 school average raw scores for the participating school sites
SAT 1998 School site
SAT 1997 Score Score Percent tested
Stanford–9 1998 Math National Percentile Rank
6 816 820 40% 30 7 850 856 33% 36 8 897 921 34% 37 9 965 956 56% 50
10 1001 982 38% 47 11 779 801 32% 28 12 818 775 36% 31 13 823 817 42% 34 14 900 923 37% 40
SOURCE: U.S. Department of Education, National Center for Education Statistics, Monetary Incentives for Low-Stakes Tests, 2001.
38
Site recruitment procedures. During the recruitment stage for the main study, a letter
was faxed to each school site’s principal describing the purpose of the study, the
amount of money students would receive, and the monetary compensation provided to
the school site and to the school site personnel who provided assistance (See Appendix
I). The school site personnel consisted of one site coordinator (e.g., a department
chairperson) and two teachers who agreed to participate in the study. For the main
study, math, English, and social studies department chairs were contacted initially at
school sites. When a school agreed to participate, the designated site coordinator would
receive a copy of the letter to the principal (See Appendix I), and the Tasks and Timeline
form for the site coordinator in preparation for the test administration (See Appendix J).
The site coordinator was responsible for locating two 12th-grade non-AP student
classes, two classrooms for testing, and one more school location for non-participant
students. Not all students or parents agreed to participate. The site coordinator was to
confirm clearance to conduct the study with the school principal who was asked to sign
a Principal Verification Form (See Appendix K). Finally, the site coordinator was
responsible for reading aloud a script (See Appendix L) to students before distributing
consent forms and collecting consent forms (See Appendix D for pilot site consent
forms) and sending a list of students eligible to participate in the study to the
researchers.
Random Assignment. After the site coordinator collected the signed parental consent
forms from the teachers and faxed them to the researchers, we randomly assigned
students to either the control group or the experimental group. On the day of testing at
the school site, students in participating classes were separated into control,
experimental, and non-participant groups. We were concerned about this non-
participant issue and publicized the study through the principle, site coordinator and
classroom teachers. We were successful. As based on a sample of 4 initial schools, 80%
of the students chose to participate in the study. The test materials were handed out,
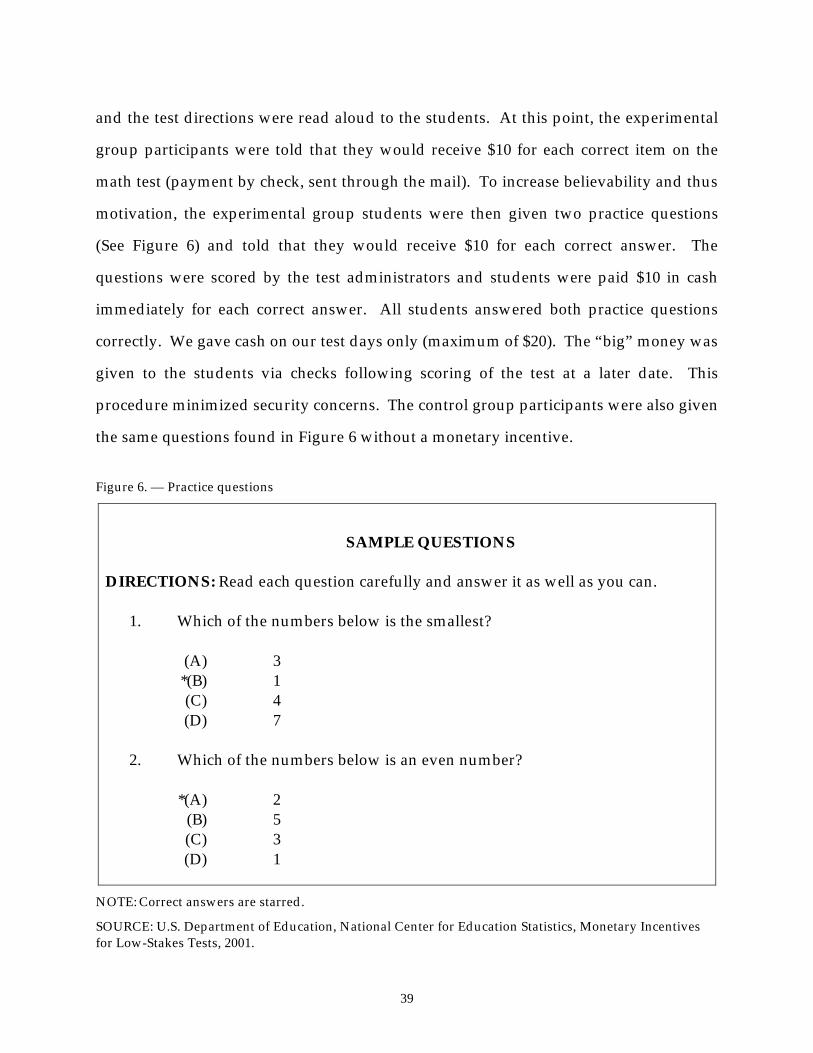
39
and the test directions were read aloud to the students. At this point, the experimental
group participants were told that they would receive $10 for each correct item on the
math test (payment by check, sent through the mail). To increase believability and thus
motivation, the experimental group students were then given two practice questions
(See Figure 6) and told that they would receive $10 for each correct answer. The
questions were scored by the test administrators and students were paid $10 in cash
immediately for each correct answer. All students answered both practice questions
correctly. We gave cash on our test days only (maximum of $20). The “big” money was
given to the students via checks following scoring of the test at a later date. This
procedure minimized security concerns. The control group participants were also given
the same questions found in Figure 6 without a monetary incentive.
Figure 6. — Practice questions
SAMPLE QUESTIONS DIRECTIONS: Read each question carefully and answer it as well as you can.
1. Which of the numbers below is the smallest? (A) 3
*(B) 1 (C) 4 (D) 7
2. Which of the numbers below is an even number?
*(A) 2 (B) 5 (C) 3 (D) 1
NOTE: Correct answers are starred.
SOURCE: U.S. Department of Education, National Center for Education Statistics, Monetary Incentives for Low-Stakes Tests, 2001.
40
Thus the procedures for the control group and the experimental group were the
same with the exception that the control group did not receive payment for any of the
questions. However, the control group did receive $20 at the end of the test
administration for participating. Students in the control group were unaware during
testing that they would receive the $20.
Following the practice questions, students in the experimental group and the
control group were given 25 minutes to complete the math section and another 8
minutes to complete the motivation questionnaire and the background questionnaire.
Students were instructed that they could not go back to one section of the test booklet
once the class had moved on to another section. After the test was completed, the test
materials were collected for both the experimental and control groups, and students
had the opportunity to ask questions regarding the study.
During the main study, the test administrators met at the school sites to discuss
procedures that worked and procedures that needed improvement. Based on these
discussions, test direction modifications were made in a way that ensured that the
integrity of the TIMSS test directions was not compromised. Meetings also were held at
UCLA throughout the pilot study and attended by test administrators and co-project
directors to discuss general progress and any concerns.
As was mentioned earlier, we analyzed the pilot study data in Appendix B (i.e.,
schools 1-5), we unexpectedly found that the control group and experimental group did
not significantly differ in math performance. A review of the consent form revealed
that a monetary incentive was discussed (See Appendix D). We suspected that some of
the control group students may have assumed that they would receive some incentive
money and may have been motivated to perform well. We therefore revised the
consent form (See Appendix M). The revised consent form was submitted to UCLA’s
Human Subjects Protection Committee and approved in May 1999 for use beginning at
School 6.
41
Further analyses were conducted after School 8 and again revealed that the
control group and experimental group did not significantly differ in math performance.
Similar to the consent form review, the principal letter revealed that a monetary
incentive was discussed. We suspected that the principal and teachers at some school
sites may have revealed information about the incentive money to their students. We
therefore revised the principal letter (See Appendix N) and recruited a new group of
school sites in the school district for participation in the study. These sites (i.e., Schools
9, 12, 13, and 14) received the revised principal letter and the revised consent form.
The main study was comprised of five schools that received the original principal
letter and revised consent form and four school sites that received the revised letter and
the revised consent form. Analyses were performed to check whether differences
existed within these groups. We grouped schools into three categories: (a) schools
receiving the original principal letter and original parental consent forms, (b) schools
receiving the original principal letter and revised consent form, and (c) schools
receiving the revised principal letter and revised consent form. The mean math score
(M) for the first group (original letter and original consent) was 10.31 with a standard
deviation (SD) of 4.81, and a sample size (n) of 144; for the second group, the mean was
7.84 (SD = 4.00, n = 238); and for the third group, the mean was 8.53 (SD = 4.00, n = 177).
To test the performance between the three groups of schools across the categories
of treatment (treatment, control), a two-factor ANOVA model was used. Mean
difference between treatment and control groups for all 14 schools (Factor A main
effect) was not significant. Mean differences between the three groups of schools were
significant. To compare the means of the three groups we used the Tukey Honest
Significant Difference (HSD) multiple comparison approach. The results of analyses
indicated the means for group 1 schools were significantly different from group 2 and
from group and that the group 2 mean was not different from the mean for group 3.
42
The interaction between the school groups and treatment was not significant. Thus, the
school factor (the three groups) had no statistical effects as a function of treatment.
Main Study Analyses
All analyses reported below are for two different samples in the main study. The
first sample (n = 393) consists of all appropriate participants (for example, not including
AP students); the second sample (n = 307) consists of students who correctly identified
which treatment instruction they received. For power analyses and computation of
sample size, we used data from our current pilot study and from the earlier CRESST
motivational studies. We estimated the number of subjects that are needed to detect
reasonable differences; for example, a .5 unit difference in math test.
Based on the main study participants’ background information (See Table 4,
Question 1), in regard to the types of math and physics class taken, 13 students in the
incentive group and 9 students in the control group responded that they were enrolled
in either AP math classes and/or AP physics classes. These 22 students were excluded
from all of the analysis in the main study.
Likewise, for Question 2 (See Table 5), in the incentive group, 141 students
responded correctly that they were to receive money. However, 5 of these same
students also responded to the alternative that he/she could not remember the
instructions. Thus, 136 out of 195 students of the incentive group correctly identified
their treatment condition. In the control group, 8 out of 198 students inappropriately
responded that they were to receive money and 190 students did not respond to this
alternative. Moreover, data for 6 students were considered invalid due to errors in test
administration. Among the remaining 184 students, 34 students responded
simultaneously that they did not remember their instructions. Thus, 150 students of the
control group correctly identified their treatment condition.
43
For Question 3 (Table 5), many students confused SAT scores with SAT 9 scores,
and many did not take the SAT. Thus, the answers for this question were mostly
invalid and the data from Question 3 were not included in any of our analyses.
For Question 4 (Table 5), 23 students from the incentive group and 25 students
from the control group self-reported that they never used a language other than English
at home. Fifty-eight students from the incentive group and 63 students from the control
group self-reported that they sometimes use a language other than English at home.
One hundred ten students from the incentive group and 102 students from the control
group self-reported that they always use a language other than English at home.
In the background questionnaire, we asked students whether they speak a
language other than English at home and if they do, how often they use that language.
The response to this question used three categories: always, sometimes, and rarely. We
used a one-factor ANOVA model to compare students’ math performance across the
categories of this variable. Mean score for category 1 (always) was 8.53 (SD = 4.66,
n = 48), for category 2 the mean was 7.29 (SD = 3.59, n = 121), and for category 3, the
mean was 8.31 (SD = 3.68, n = 212). The results of analyses of variance showed the
difference between the three groups to be significant. The significant difference is
mainly due to the difference between group 2 (sometimes) and 3 (rarely). Tukey HDS
tests showed only one significant difference and that is between the mean of group 2
and group 3.
For Question 5 (Table 5), most students in the main study reported that their
math grade was C or below. However, in Question 6, most students responded they
had been taught the concepts.
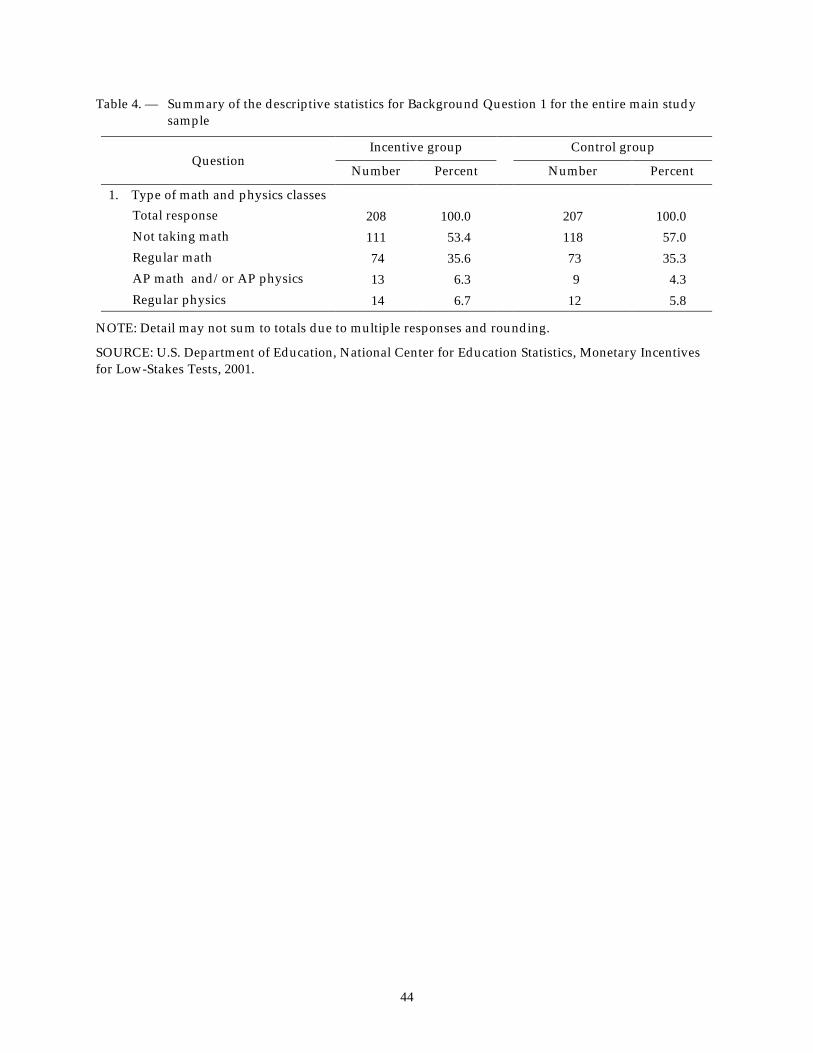
44
Table 4. — Summary of the descriptive statistics for Background Question 1 for the entire main study sample
Incentive group Control group Question
Number Percent Number Percent
1. Type of math and physics classes Total response 208 100.0 207 100.0 Not taking math 111 53.4 118 57.0 Regular math 74 35.6 73 35.3 AP math and/or AP physics 13 6.3 9 4.3 Regular physics 14 6.7 12 5.8
NOTE: Detail may not sum to totals due to multiple responses and rounding.
SOURCE: U.S. Department of Education, National Center for Education Statistics, Monetary Incentives for Low-Stakes Tests, 2001.
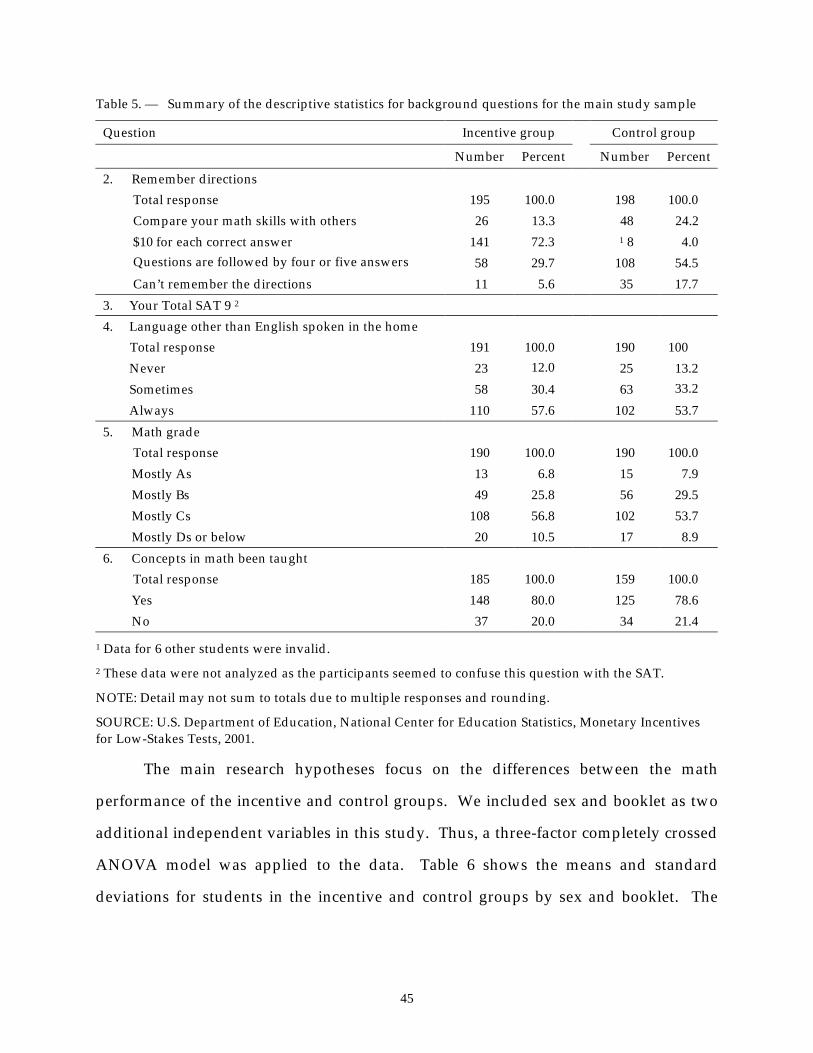
45
Table 5. — Summary of the descriptive statistics for background questions for the main study sample
Question Incentive group Control group
Number Percent Number Percent
2. Remember directions Total response 195 100.0 198 100.0 Compare your math skills with others 26 13.3 48 24.2 $10 for each correct answer 141 72.3 1 8 4.0 Questions are followed by four or five answers 58 29.7 108 54.5 Can’t remember the directions 11 5.6 35 17.7 3. Your Total SAT 9 2 4. Language other than English spoken in the home Total response 191 100.0 190 100 Never 23 12.0 25 13.2 Sometimes 58 30.4 63 33.2 Always 110 57.6 102 53.7 5. Math grade Total response 190 100.0 190 100.0 Mostly As 13 6.8 15 7.9 Mostly Bs 49 25.8 56 29.5 Mostly Cs 108 56.8 102 53.7 Mostly Ds or below 20 10.5 17 8.9 6. Concepts in math been taught Total response 185 100.0 159 100.0 Yes 148 80.0 125 78.6 No 37 20.0 34 21.4
1 Data for 6 other students were invalid. 2 These data were not analyzed as the participants seemed to confuse this question with the SAT.
NOTE: Detail may not sum to totals due to multiple responses and rounding.
SOURCE: U.S. Department of Education, National Center for Education Statistics, Monetary Incentives for Low-Stakes Tests, 2001.
The main research hypotheses focus on the differences between the math
performance of the incentive and control groups. We included sex and booklet as two
additional independent variables in this study. Thus, a three-factor completely crossed
ANOVA model was applied to the data. Table 6 shows the means and standard
deviations for students in the incentive and control groups by sex and booklet. The
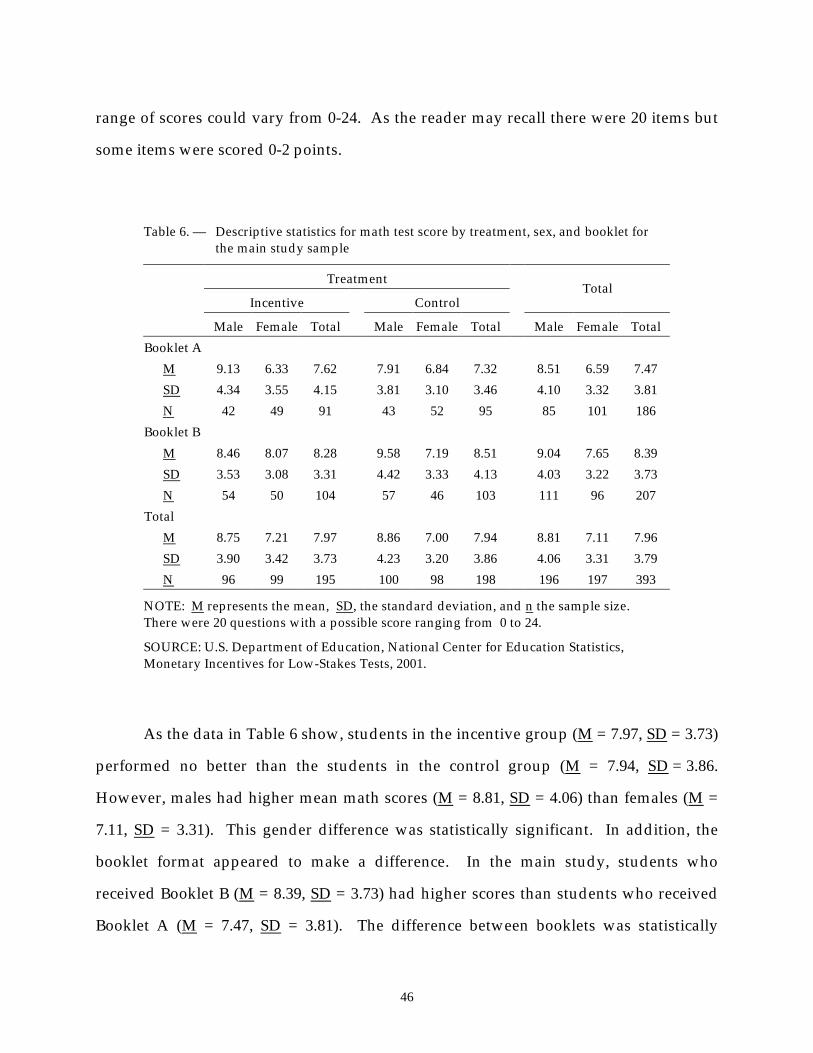
46
range of scores could vary from 0-24. As the reader may recall there were 20 items but
some items were scored 0-2 points.
Table 6. — Descriptive statistics for math test score by treatment, sex, and booklet for the main study sample
Treatment
Incentive Control Total
Male Female Total Male Female Total Male Female Total Booklet A M 9.13 6.33 7.62 7.91 6.84 7.32 8.51 6.59 7.47 SD 4.34 3.55 4.15 3.81 3.10 3.46 4.10 3.32 3.81 N 42 49 91 43 52 95 85 101 186 Booklet B M 8.46 8.07 8.28 9.58 7.19 8.51 9.04 7.65 8.39 SD 3.53 3.08 3.31 4.42 3.33 4.13 4.03 3.22 3.73 N 54 50 104 57 46 103 111 96 207 Total M 8.75 7.21 7.97 8.86 7.00 7.94 8.81 7.11 7.96 SD 3.90 3.42 3.73 4.23 3.20 3.86 4.06 3.31 3.79 N 96 99 195 100 98 198 196 197 393
NOTE: M represents the mean, SD, the standard deviation, and n the sample size. There were 20 questions with a possible score ranging from 0 to 24.
SOURCE: U.S. Department of Education, National Center for Education Statistics, Monetary Incentives for Low-Stakes Tests, 2001.
As the data in Table 6 show, students in the incentive group (M = 7.97, SD = 3.73)
performed no better than the students in the control group (M = 7.94, SD = 3.86.
However, males had higher mean math scores (M = 8.81, SD = 4.06) than females (M =
7.11, SD = 3.31). This gender difference was statistically significant. In addition, the
booklet format appeared to make a difference. In the main study, students who
received Booklet B (M = 8.39, SD = 3.73) had higher scores than students who received
Booklet A (M = 7.47, SD = 3.81). The difference between booklets was statistically
47
significant. The treatment by sex by booklet interaction was also statistically significant.
For Booklet A, males in the incentive group outperformed males in the control group
(M = 9.31 vs. M = 7.91), while mean scores for females in the incentive and control
groups were similar (M = 6.33 and M = 6.84 respectively). However, for Booklet B,
males in the control group outperformed males in the incentive group (M = 9.58 vs. M =
8.46), whereas females in the incentive group outperformed females in the control
group (M = 8.07 vs. M = 7.18). Yet, post hoc analyses of these mean differences
indicated that they were not significantly different. Although the overall interaction
was significant, these means were not significantly different from each other. The
results of Tukey HSD showed that in Booklet A, incentive males scored higher than
incentive females, while in Booklet B, there was no significant difference in mean scores
of incentive males and incentive females. Also, in Booklet A, control males did not
score differently from control females, but in Booklet B, Control males outperformed
control females.
A two-factor analysis of covariance design was used to test the main and
interaction effects of treatment and gender on math when students' reading
performance is controlled for. Thus, SAT 9 reading score was used as a covariate. For
the main study, the mean math score for the incentive group was 7.72 (SD = 3.73, n = 62)
and for the control group, the mean was 7.62 (SD = 4.02, n = 61). The means for the two
groups are very similar, thus, no significant difference was found. For male subjects,
the mean was 8.42 (SD = 3.84, n = 68), for females, the mean was 6.75 (SD = 3.72, n = 55).
The difference between performance of males and females was significant. The
interaction between treatment and sex was not significant. The smaller number of
subjects in this design is caused by missing data on the SAT 9 reading scores. The
adjusted means are: for males M = 8.42; for females M = 6.76; for the control group M =
7.53; for the incentive group M = 7.65.
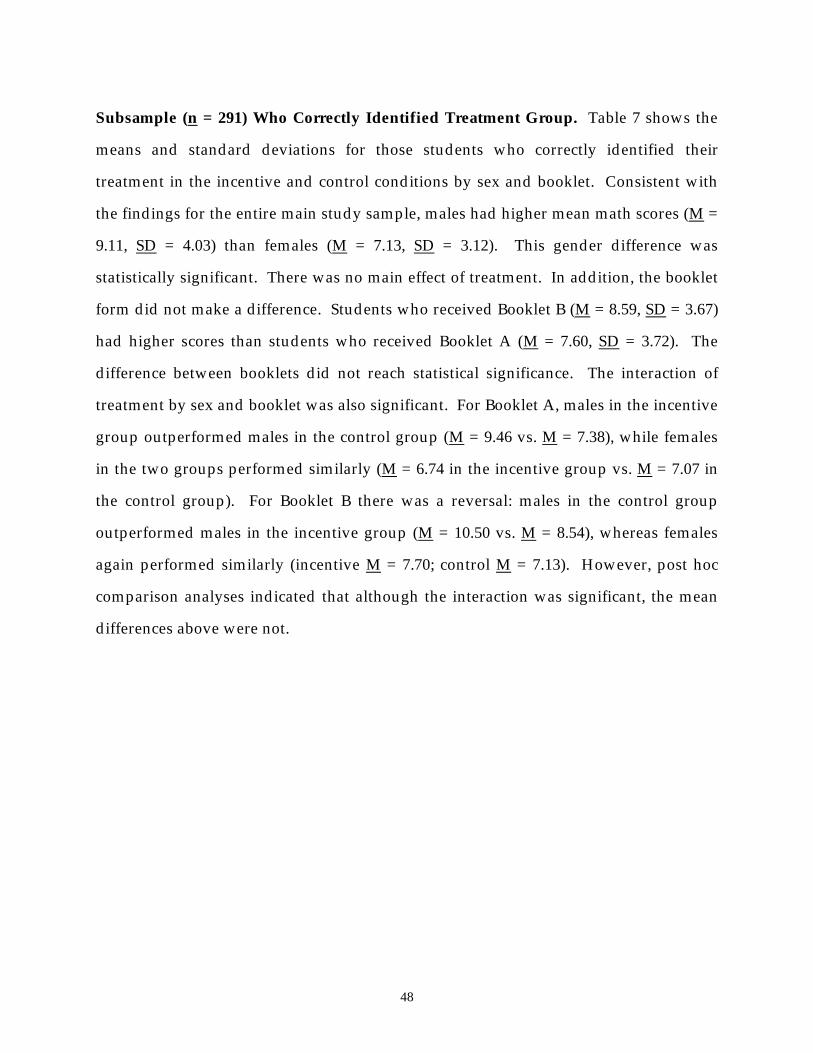
48
Subsample (n = 291) Who Correctly Identified Treatment Group. Table 7 shows the
means and standard deviations for those students who correctly identified their
treatment in the incentive and control conditions by sex and booklet. Consistent with
the findings for the entire main study sample, males had higher mean math scores (M =
9.11, SD = 4.03) than females (M = 7.13, SD = 3.12). This gender difference was
statistically significant. There was no main effect of treatment. In addition, the booklet
form did not make a difference. Students who received Booklet B (M = 8.59, SD = 3.67)
had higher scores than students who received Booklet A (M = 7.60, SD = 3.72). The
difference between booklets did not reach statistical significance. The interaction of
treatment by sex and booklet was also significant. For Booklet A, males in the incentive
group outperformed males in the control group (M = 9.46 vs. M = 7.38), while females
in the two groups performed similarly (M = 6.74 in the incentive group vs. M = 7.07 in
the control group). For Booklet B there was a reversal: males in the control group
outperformed males in the incentive group (M = 10.50 vs. M = 8.54), whereas females
again performed similarly (incentive M = 7.70; control M = 7.13). However, post hoc
comparison analyses indicated that although the interaction was significant, the mean
differences above were not.
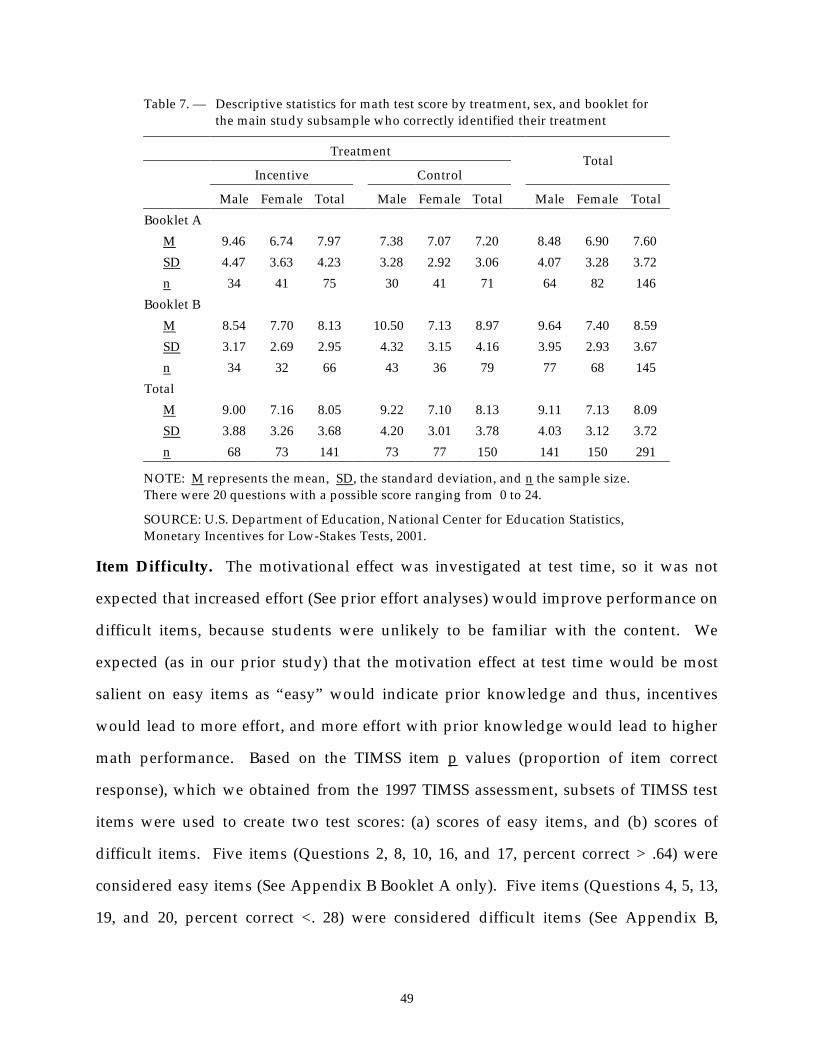
49
Table 7. — Descriptive statistics for math test score by treatment, sex, and booklet for the main study subsample who correctly identified their treatment
Treatment
Incentive Control Total
Male Female Total Male Female Total Male Female Total Booklet A M 9.46 6.74 7.97 7.38 7.07 7.20 8.48 6.90 7.60 SD 4.47 3.63 4.23 3.28 2.92 3.06 4.07 3.28 3.72 n 34 41 75 30 41 71 64 82 146 Booklet B M 8.54 7.70 8.13 10.50 7.13 8.97 9.64 7.40 8.59 SD 3.17 2.69 2.95 4.32 3.15 4.16 3.95 2.93 3.67 n 34 32 66 43 36 79 77 68 145 Total M 9.00 7.16 8.05 9.22 7.10 8.13 9.11 7.13 8.09 SD 3.88 3.26 3.68 4.20 3.01 3.78 4.03 3.12 3.72 n 68 73 141 73 77 150 141 150 291
NOTE: M represents the mean, SD, the standard deviation, and n the sample size. There were 20 questions with a possible score ranging from 0 to 24.
SOURCE: U.S. Department of Education, National Center for Education Statistics, Monetary Incentives for Low-Stakes Tests, 2001.
Item Difficulty. The motivational effect was investigated at test time, so it was not
expected that increased effort (See prior effort analyses) would improve performance on
difficult items, because students were unlikely to be familiar with the content. We
expected (as in our prior study) that the motivation effect at test time would be most
salient on easy items as “easy” would indicate prior knowledge and thus, incentives
would lead to more effort, and more effort with prior knowledge would lead to higher
math performance. Based on the TIMSS item p values (proportion of item correct
response), which we obtained from the 1997 TIMSS assessment, subsets of TIMSS test
items were used to create two test scores: (a) scores of easy items, and (b) scores of
difficult items. Five items (Questions 2, 8, 10, 16, and 17, percent correct > .64) were
considered easy items (See Appendix B Booklet A only). Five items (Questions 4, 5, 13,
19, and 20, percent correct <. 28) were considered difficult items (See Appendix B,
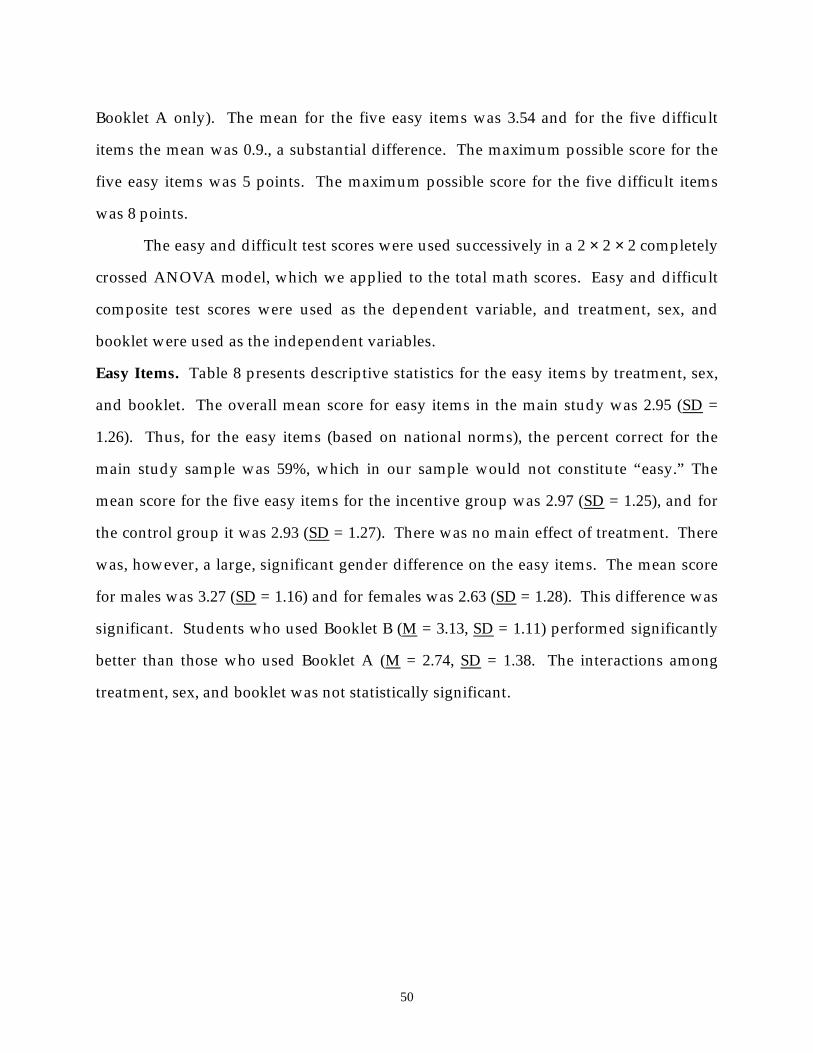
50
Booklet A only). The mean for the five easy items was 3.54 and for the five difficult
items the mean was 0.9., a substantial difference. The maximum possible score for the
five easy items was 5 points. The maximum possible score for the five difficult items
was 8 points.
The easy and difficult test scores were used successively in a 2 × 2 × 2 completely
crossed ANOVA model, which we applied to the total math scores. Easy and difficult
composite test scores were used as the dependent variable, and treatment, sex, and
booklet were used as the independent variables.
Easy Items. Table 8 presents descriptive statistics for the easy items by treatment, sex,
and booklet. The overall mean score for easy items in the main study was 2.95 (SD =
1.26). Thus, for the easy items (based on national norms), the percent correct for the
main study sample was 59%, which in our sample would not constitute “easy.” The
mean score for the five easy items for the incentive group was 2.97 (SD = 1.25), and for
the control group it was 2.93 (SD = 1.27). There was no main effect of treatment. There
was, however, a large, significant gender difference on the easy items. The mean score
for males was 3.27 (SD = 1.16) and for females was 2.63 (SD = 1.28). This difference was
significant. Students who used Booklet B (M = 3.13, SD = 1.11) performed significantly
better than those who used Booklet A (M = 2.74, SD = 1.38. The interactions among
treatment, sex, and booklet was not statistically significant.
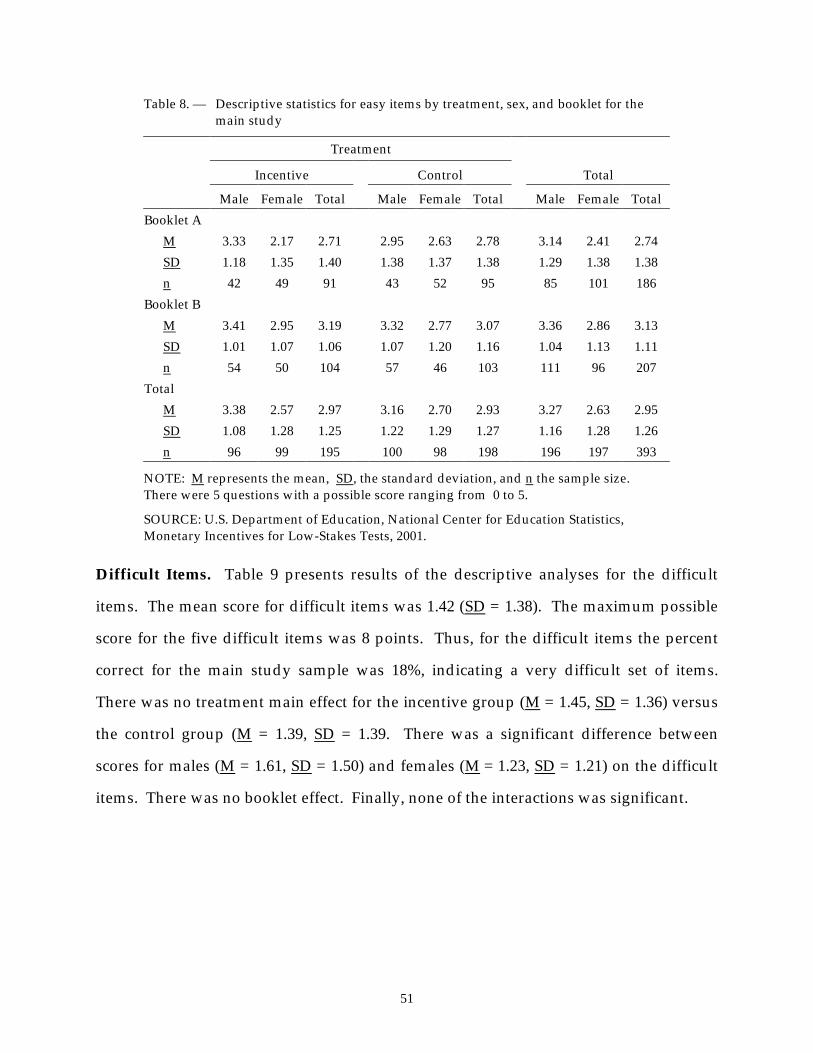
51
Table 8. — Descriptive statistics for easy items by treatment, sex, and booklet for the main study
Treatment
Incentive Control Total
Male Female Total Male Female Total Male Female Total Booklet A M 3.33 2.17 2.71 2.95 2.63 2.78 3.14 2.41 2.74 SD 1.18 1.35 1.40 1.38 1.37 1.38 1.29 1.38 1.38 n 42 49 91 43 52 95 85 101 186 Booklet B M 3.41 2.95 3.19 3.32 2.77 3.07 3.36 2.86 3.13 SD 1.01 1.07 1.06 1.07 1.20 1.16 1.04 1.13 1.11 n 54 50 104 57 46 103 111 96 207 Total M 3.38 2.57 2.97 3.16 2.70 2.93 3.27 2.63 2.95 SD 1.08 1.28 1.25 1.22 1.29 1.27 1.16 1.28 1.26 n 96 99 195 100 98 198 196 197 393
NOTE: M represents the mean, SD, the standard deviation, and n the sample size. There were 5 questions with a possible score ranging from 0 to 5.
SOURCE: U.S. Department of Education, National Center for Education Statistics, Monetary Incentives for Low-Stakes Tests, 2001.
Difficult Items. Table 9 presents results of the descriptive analyses for the difficult
items. The mean score for difficult items was 1.42 (SD = 1.38). The maximum possible
score for the five difficult items was 8 points. Thus, for the difficult items the percent
correct for the main study sample was 18%, indicating a very difficult set of items.
There was no treatment main effect for the incentive group (M = 1.45, SD = 1.36) versus
the control group (M = 1.39, SD = 1.39. There was a significant difference between
scores for males (M = 1.61, SD = 1.50) and females (M = 1.23, SD = 1.21) on the difficult
items. There was no booklet effect. Finally, none of the interactions was significant.
52
Table 9. — Descriptive statistics for the difficult items by treatment, sex, and booklet for the main study
Treatment
Incentive Control Total
Male Female Total Male Female Total Male Female Total Booklet A M 1.73 1.24 1.47 1.58 1.05 1.29 1.65 1.15 1.38 SD 1.54 1.32 1.43 1.54 1.04 1.31 1.53 1.18 1.37 n 42 49 91 43 52 95 85 101 186 Booklet B M 1.41 1.45 1.43 1.74 1.15 1.48 1.58 1.31 1.46 SD 1.34 1.26 1.30 1.61 1.21 1.47 1.49 1.24 1.38 n 54 50 104 57 46 103 111 96 207 Total M 1.55 1.35 1.45 1.67 1.10 1.39 1.61 1.23 1.42 SD 1.43 1.29 1.36 1.57 1.12 1.39 1.50 1.21 1.38 n 96 99 195 100 98 198 196 197 393
NOTE: M represents the mean, SD, the standard deviation, and n, the sample size. There were 5 questions with a possible score ranging from 0 to 8.
SOURCE: U.S. Department of Education, National Center for Education Statistics, Monetary Incentives for Low-Stakes Tests, 2001.
Participants who correctly identified their treatment condition. Table 10 and Table 11
provide results of the descriptive analyses for participants in the main study who
correctly identified their treatment condition. The patterns of results in Table 10 and
Table 11 are very similar to those in Table 8 and Table 9, respectively. They are similar
with respect to gender. In both cases, males outperformed females. There was no
significant difference between the incentive and the control. For easy items only,
booklet form had a main effect on math performance. There were no significant
interactions.
53
Table 10. — Descriptive statistics for the easy items by treatment, sex, and booklet for the main study sample of students who correctly identified their treatment
Treatment
Incentive Control Total
Male Female Total Male Female Total Male Female Total Booklet A M 3.53 2.33 2.87 2.92 2.66 2.77 3.24 2.49 2.82 SD 1.16 1.36 1.40 1.44 1.35 1.39 1.32 1.36 1.39 n 34 41 75 30 41 71 64 82 146 Booklet B M 3.42 2.89 3.16 3.47 2.83 3.18 3.45 2.86 3.17 SD 1.08 0.96 1.05 1.08 1.16 1.15 1.07 1.06 1.10 n 34 32 66 43 36 79 77 68 145 Total M 3.48 2.57 3.01 3.24 2.74 2.98 3.35 2.66 3.00 SD 1.12 1.23 1.25 1.26 1.26 1.28 1.19 1.24 1.27 n 68 73 141 73 77 150 141 150 291
NOTE: M represents the mean, SD, the standard deviation, and n the sample size. There were 5 questions with a possible score ranging from 0 to 5.
SOURCE: U.S. Department of Education, National Center for Education Statistics, Monetary Incentives for Low-Stakes Tests, 2001.
54
Table 11. — Descriptive statistics for the difficult items by treatment, sex, and booklet for the main study sample of students who correctly identified their treatment
Treatment
Incentive Control Total
Male Female Total Male Female Total Male Female Total Booklet A M 1.82 1.38 1.58 1.30 1.15 1.21 1.58 1.26 1.40 SD 1.61 1.38 1.49 1.34 1.05 1.18 1.50 1.22 1.36 n 34 41 75 30 41 71 64 82 146 Booklet B M 1.55 1.35 1.45 2.04 1.19 1.65 1.82 1.26 1.56 SD 1.29 1.10 1.20 1.67 1.19 1.53 1.53 1.14 1.38 n 34 32 66 43 36 79 77 68 145 Total M 1.69 1.37 1.52 1.74 1.16 1.44 1.71 1.26 1.48 SD 1.46 1.25 1.36 1.58 1.11 1.38 1.52 1.18 1.37 n 68 73 141 73 77 150 141 150 291
NOTE: M represents the mean, SD, the standard deviation, and n, the sample size. There were 5 questions with a possible score ranging from 0 to 8.
SOURCE: U.S. Department of Education, National Center for Education Statistics, Monetary Incentives for Low-Stakes Tests, 2001.
Motivation
Internal consistency coefficients were computed for the three motivation scales.
Table 12 reports the internal consistency statistics e.g. Cronbach’s coefficient alpha
(Cronbach, 1951) for the main study.
As the data in Table 12 show, the three motivation scales have a high level of
internal consistency, i.e. the main study alpha coefficients of .85 for effort, .84 for self-
efficacy, and .72 for worry.
55
Table 12. — Internal consistency statistics for the main study sample
Effort Self-efficacy Worry
Items Item/Total correlation
Alpha if item deleted
Item/Total correlation
Alpha if item deleted
Item/Total Correlation
Alpha if item deleted
1 .65 .83 .68 .80 .50 .67 2 .70 .82 .44 .85 .45 .68 3 .54 .85 .73 .79 .36 .71 4 .74 .81 .71 .80 .45 .68 5 .76 .81 .57 .82 .44 .69 6 .48 .86 .58 .82 .52 .66
Alpha .85 .84 .72
NOTE: The sample size was 369.
SOURCE: U.S. Department of Education, National Center for Education Statistics, Monetary Incentives for Low-Stakes Tests, 2001.
To compare students’ responses across categories of treatment
(incentive/control), sex (male/female) and booklets (A/B), a 2 × 2 × 2 ANOVA model
was used. Scores for the three motivation scales (effort, self-efficacy, and worry) were
used as the dependent variables in separate ANOVAs.
Effort: Total Sample. Table 13 reports descriptive statistics including means, standard
deviations, and numbers of subjects for the effort scale. The overall mean score for
effort for the main study was 18.09 (SD = 4.15) out of a possible 24 points, indicating
that the students in the main study exhibited moderate effort. The mean effort for
females and for males was almost identical. The mean effort score for females was 18.25
(SD = 3.30) and for males it was 17.92 (SD = 4.48). No significant difference between
scores for females and males was obtained. There was a significant difference between
the levels of effort across the treatment groups. The mean effort score for the incentive
group was 19.17 (SD = 3.70) and for the control group, the mean was 17.00 (SD = 4.30).
This difference of about 2 score points is significant, which indicates that the incentive
group put more effort into this test. The booklet form did not have a significant effect
on effort. The interactions were not significant.
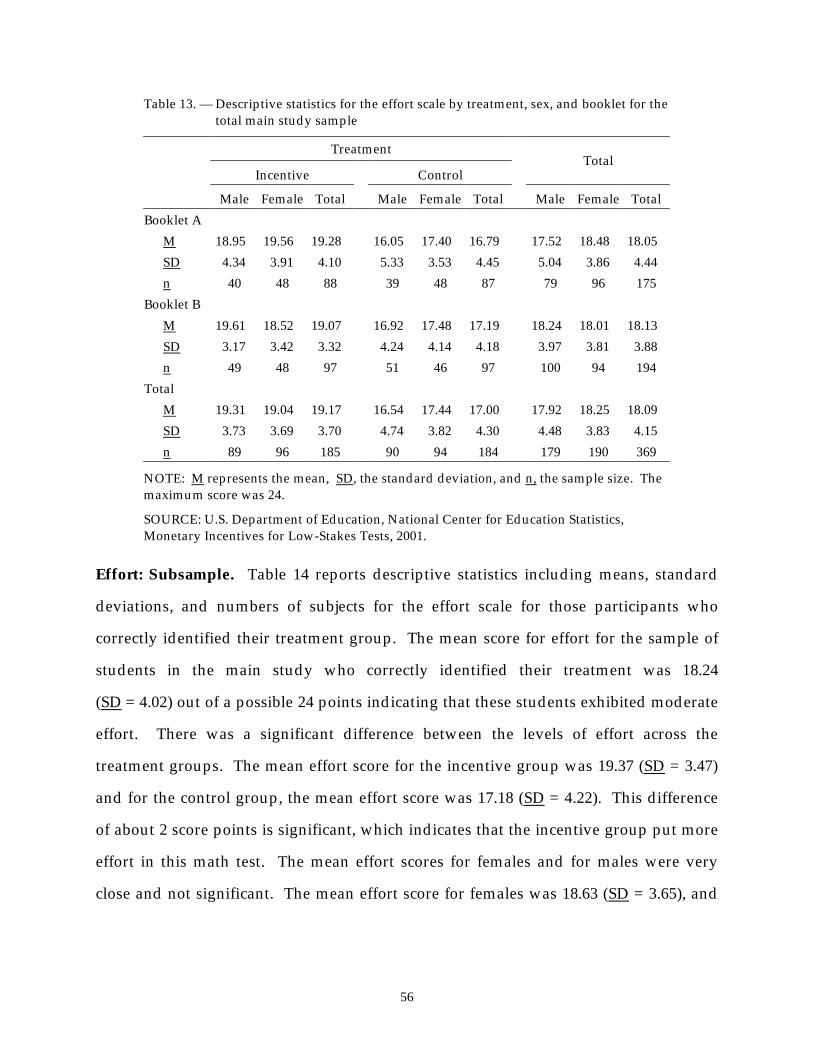
56
Table 13. — Descriptive statistics for the effort scale by treatment, sex, and booklet for the total main study sample
Treatment
Incentive Control Total
Male Female Total Male Female Total Male Female Total Booklet A M 18.95 19.56 19.28 16.05 17.40 16.79 17.52 18.48 18.05 SD 4.34 3.91 4.10 5.33 3.53 4.45 5.04 3.86 4.44 n 40 48 88 39 48 87 79 96 175 Booklet B M 19.61 18.52 19.07 16.92 17.48 17.19 18.24 18.01 18.13 SD 3.17 3.42 3.32 4.24 4.14 4.18 3.97 3.81 3.88 n 49 48 97 51 46 97 100 94 194 Total M 19.31 19.04 19.17 16.54 17.44 17.00 17.92 18.25 18.09 SD 3.73 3.69 3.70 4.74 3.82 4.30 4.48 3.83 4.15 n 89 96 185 90 94 184 179 190 369
NOTE: M represents the mean, SD, the standard deviation, and n, the sample size. The maximum score was 24.
SOURCE: U.S. Department of Education, National Center for Education Statistics, Monetary Incentives for Low-Stakes Tests, 2001.
Effort: Subsample. Table 14 reports descriptive statistics including means, standard
deviations, and numbers of subjects for the effort scale for those participants who
correctly identified their treatment group. The mean score for effort for the sample of
students in the main study who correctly identified their treatment was 18.24
(SD = 4.02) out of a possible 24 points indicating that these students exhibited moderate
effort. There was a significant difference between the levels of effort across the
treatment groups. The mean effort score for the incentive group was 19.37 (SD = 3.47)
and for the control group, the mean effort score was 17.18 (SD = 4.22). This difference
of about 2 score points is significant, which indicates that the incentive group put more
effort in this math test. The mean effort scores for females and for males were very
close and not significant. The mean effort score for females was 18.63 (SD = 3.65), and
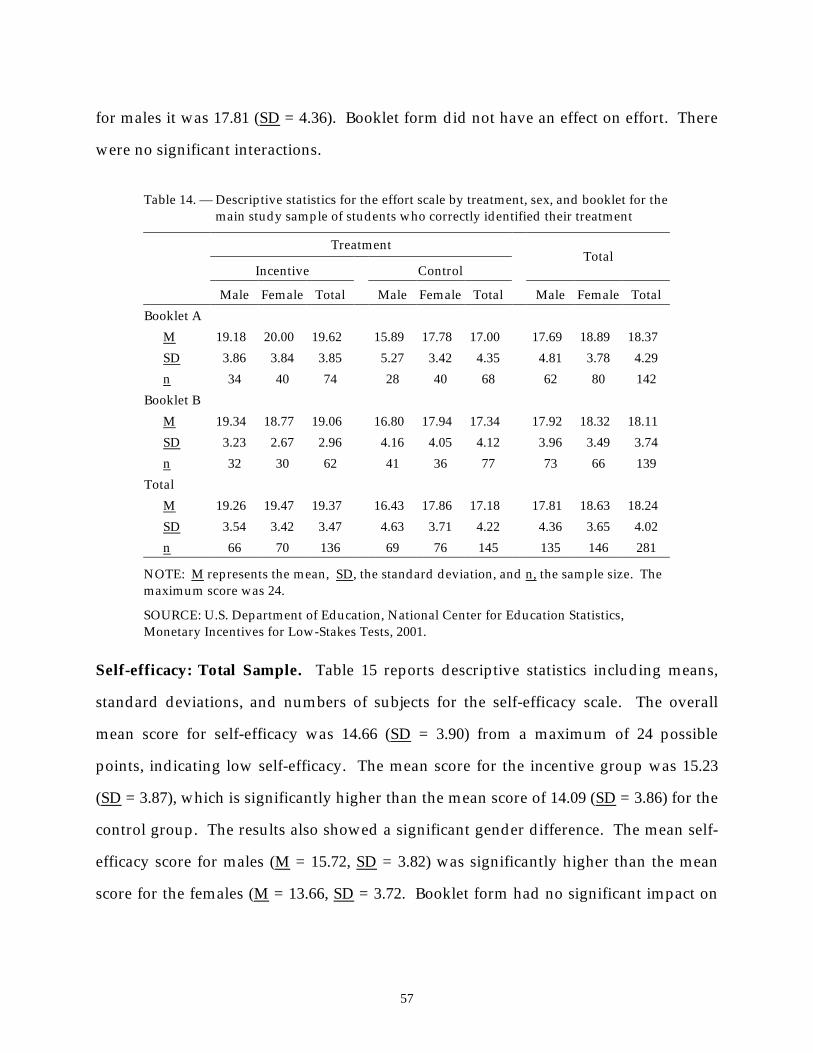
57
for males it was 17.81 (SD = 4.36). Booklet form did not have an effect on effort. There
were no significant interactions.
Table 14. — Descriptive statistics for the effort scale by treatment, sex, and booklet for the main study sample of students who correctly identified their treatment
Treatment
Incentive Control Total
Male Female Total Male Female Total Male Female Total Booklet A M 19.18 20.00 19.62 15.89 17.78 17.00 17.69 18.89 18.37 SD 3.86 3.84 3.85 5.27 3.42 4.35 4.81 3.78 4.29 n 34 40 74 28 40 68 62 80 142 Booklet B M 19.34 18.77 19.06 16.80 17.94 17.34 17.92 18.32 18.11 SD 3.23 2.67 2.96 4.16 4.05 4.12 3.96 3.49 3.74 n 32 30 62 41 36 77 73 66 139 Total M 19.26 19.47 19.37 16.43 17.86 17.18 17.81 18.63 18.24 SD 3.54 3.42 3.47 4.63 3.71 4.22 4.36 3.65 4.02 n 66 70 136 69 76 145 135 146 281
NOTE: M represents the mean, SD, the standard deviation, and n, the sample size. The maximum score was 24.
SOURCE: U.S. Department of Education, National Center for Education Statistics, Monetary Incentives for Low-Stakes Tests, 2001.
Self-efficacy: Total Sample. Table 15 reports descriptive statistics including means,
standard deviations, and numbers of subjects for the self-efficacy scale. The overall
mean score for self-efficacy was 14.66 (SD = 3.90) from a maximum of 24 possible
points, indicating low self-efficacy. The mean score for the incentive group was 15.23
(SD = 3.87), which is significantly higher than the mean score of 14.09 (SD = 3.86) for the
control group. The results also showed a significant gender difference. The mean self-
efficacy score for males (M = 15.72, SD = 3.82) was significantly higher than the mean
score for the females (M = 13.66, SD = 3.72. Booklet form had no significant impact on
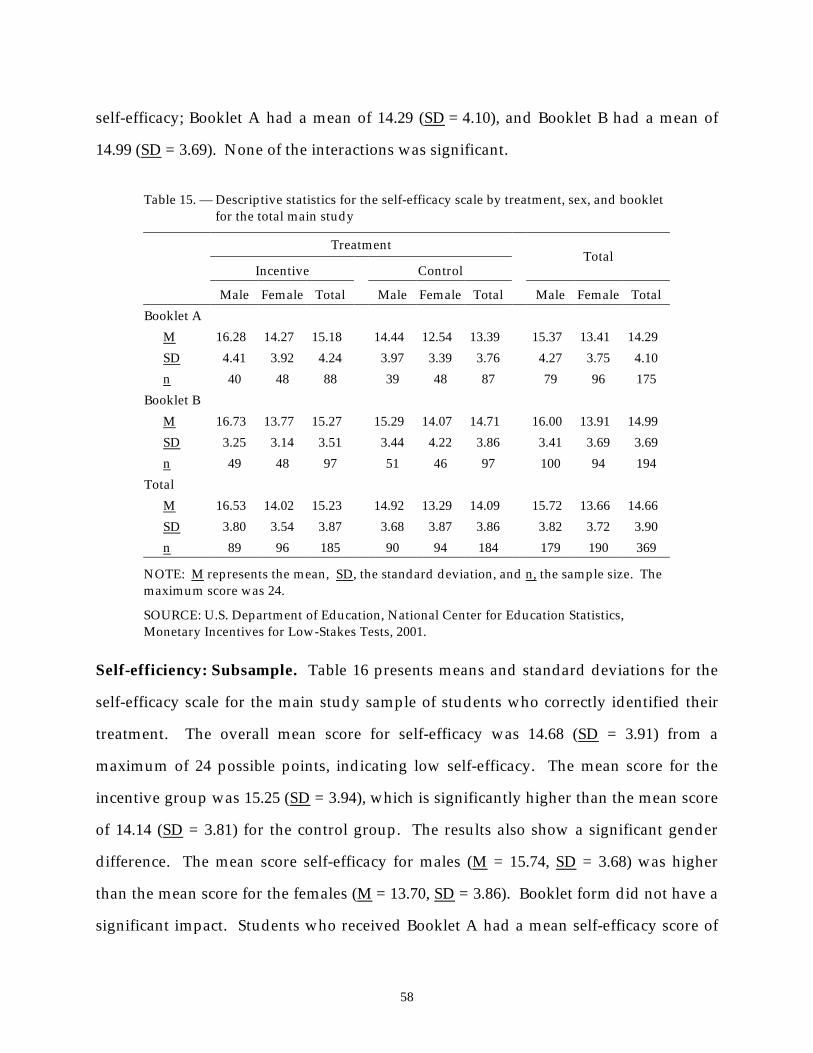
58
self-efficacy; Booklet A had a mean of 14.29 (SD = 4.10), and Booklet B had a mean of
14.99 (SD = 3.69). None of the interactions was significant.
Table 15. — Descriptive statistics for the self-efficacy scale by treatment, sex, and booklet for the total main study
Treatment
Incentive Control Total
Male Female Total Male Female Total Male Female Total Booklet A M 16.28 14.27 15.18 14.44 12.54 13.39 15.37 13.41 14.29 SD 4.41 3.92 4.24 3.97 3.39 3.76 4.27 3.75 4.10 n 40 48 88 39 48 87 79 96 175 Booklet B M 16.73 13.77 15.27 15.29 14.07 14.71 16.00 13.91 14.99 SD 3.25 3.14 3.51 3.44 4.22 3.86 3.41 3.69 3.69 n 49 48 97 51 46 97 100 94 194 Total M 16.53 14.02 15.23 14.92 13.29 14.09 15.72 13.66 14.66 SD 3.80 3.54 3.87 3.68 3.87 3.86 3.82 3.72 3.90 n 89 96 185 90 94 184 179 190 369
NOTE: M represents the mean, SD, the standard deviation, and n, the sample size. The maximum score was 24.
SOURCE: U.S. Department of Education, National Center for Education Statistics, Monetary Incentives for Low-Stakes Tests, 2001.
Self-efficiency: Subsample. Table 16 presents means and standard deviations for the
self-efficacy scale for the main study sample of students who correctly identified their
treatment. The overall mean score for self-efficacy was 14.68 (SD = 3.91) from a
maximum of 24 possible points, indicating low self-efficacy. The mean score for the
incentive group was 15.25 (SD = 3.94), which is significantly higher than the mean score
of 14.14 (SD = 3.81) for the control group. The results also show a significant gender
difference. The mean score self-efficacy for males (M = 15.74, SD = 3.68) was higher
than the mean score for the females (M = 13.70, SD = 3.86). Booklet form did not have a
significant impact. Students who received Booklet A had a mean self-efficacy score of
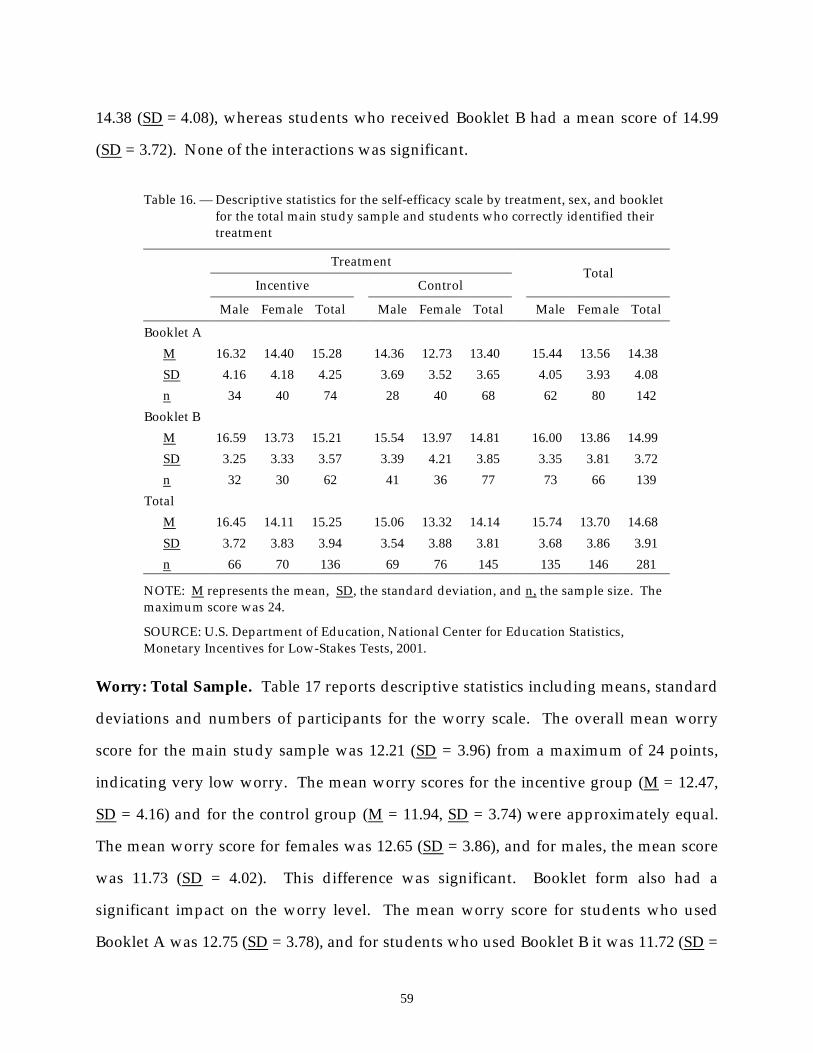
59
14.38 (SD = 4.08), whereas students who received Booklet B had a mean score of 14.99
(SD = 3.72). None of the interactions was significant.
Table 16. — Descriptive statistics for the self-efficacy scale by treatment, sex, and booklet for the total main study sample and students who correctly identified their treatment
Treatment
Incentive Control Total
Male Female Total Male Female Total Male Female Total
Booklet A M 16.32 14.40 15.28 14.36 12.73 13.40 15.44 13.56 14.38 SD 4.16 4.18 4.25 3.69 3.52 3.65 4.05 3.93 4.08 n 34 40 74 28 40 68 62 80 142 Booklet B M 16.59 13.73 15.21 15.54 13.97 14.81 16.00 13.86 14.99 SD 3.25 3.33 3.57 3.39 4.21 3.85 3.35 3.81 3.72 n 32 30 62 41 36 77 73 66 139 Total M 16.45 14.11 15.25 15.06 13.32 14.14 15.74 13.70 14.68 SD 3.72 3.83 3.94 3.54 3.88 3.81 3.68 3.86 3.91 n 66 70 136 69 76 145 135 146 281
NOTE: M represents the mean, SD, the standard deviation, and n, the sample size. The maximum score was 24.
SOURCE: U.S. Department of Education, National Center for Education Statistics, Monetary Incentives for Low-Stakes Tests, 2001.
Worry: Total Sample. Table 17 reports descriptive statistics including means, standard
deviations and numbers of participants for the worry scale. The overall mean worry
score for the main study sample was 12.21 (SD = 3.96) from a maximum of 24 points,
indicating very low worry. The mean worry scores for the incentive group (M = 12.47,
SD = 4.16) and for the control group (M = 11.94, SD = 3.74) were approximately equal.
The mean worry score for females was 12.65 (SD = 3.86), and for males, the mean score
was 11.73 (SD = 4.02). This difference was significant. Booklet form also had a
significant impact on the worry level. The mean worry score for students who used
Booklet A was 12.75 (SD = 3.78), and for students who used Booklet B it was 11.72 (SD =
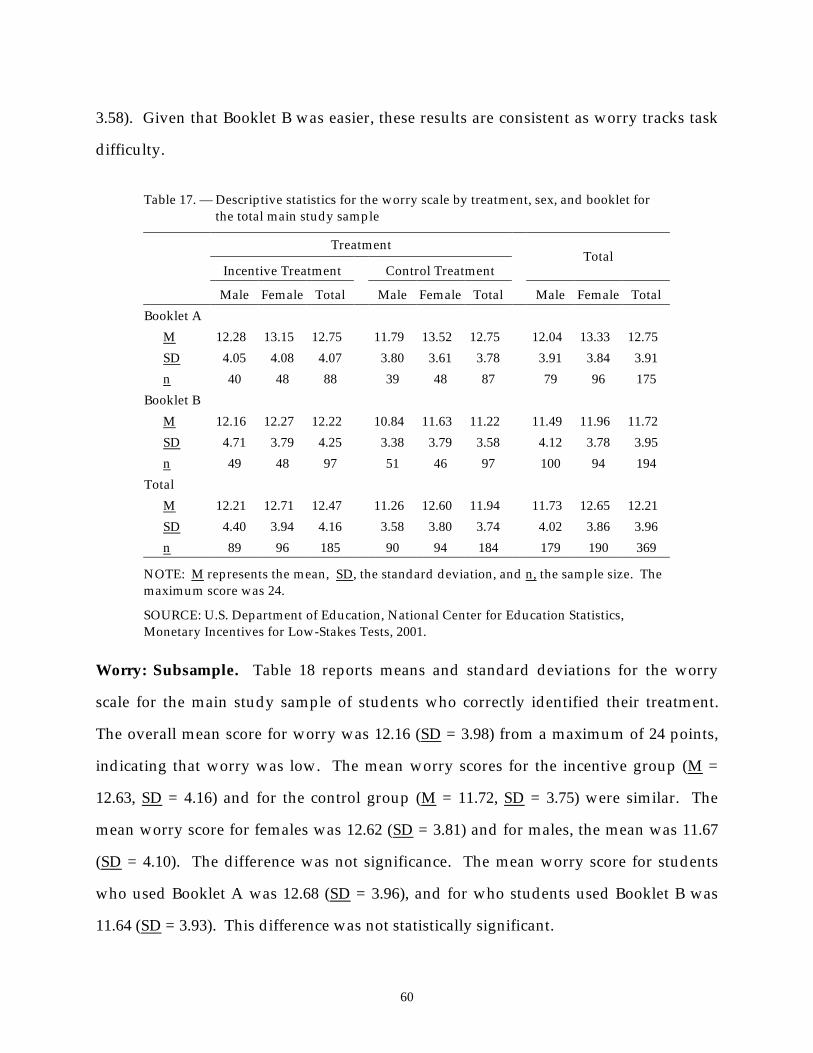
60
3.58). Given that Booklet B was easier, these results are consistent as worry tracks task
difficulty.
Table 17. — Descriptive statistics for the worry scale by treatment, sex, and booklet for the total main study sample
Treatment
Incentive Treatment Control Treatment Total
Male Female Total Male Female Total Male Female Total Booklet A M 12.28 13.15 12.75 11.79 13.52 12.75 12.04 13.33 12.75 SD 4.05 4.08 4.07 3.80 3.61 3.78 3.91 3.84 3.91 n 40 48 88 39 48 87 79 96 175 Booklet B M 12.16 12.27 12.22 10.84 11.63 11.22 11.49 11.96 11.72 SD 4.71 3.79 4.25 3.38 3.79 3.58 4.12 3.78 3.95 n 49 48 97 51 46 97 100 94 194 Total M 12.21 12.71 12.47 11.26 12.60 11.94 11.73 12.65 12.21 SD 4.40 3.94 4.16 3.58 3.80 3.74 4.02 3.86 3.96 n 89 96 185 90 94 184 179 190 369
NOTE: M represents the mean, SD, the standard deviation, and n, the sample size. The maximum score was 24.
SOURCE: U.S. Department of Education, National Center for Education Statistics, Monetary Incentives for Low-Stakes Tests, 2001.
Worry: Subsample. Table 18 reports means and standard deviations for the worry
scale for the main study sample of students who correctly identified their treatment.
The overall mean score for worry was 12.16 (SD = 3.98) from a maximum of 24 points,
indicating that worry was low. The mean worry scores for the incentive group (M =
12.63, SD = 4.16) and for the control group (M = 11.72, SD = 3.75) were similar. The
mean worry score for females was 12.62 (SD = 3.81) and for males, the mean was 11.67
(SD = 4.10). The difference was not significance. The mean worry score for students
who used Booklet A was 12.68 (SD = 3.96), and for who students used Booklet B was
11.64 (SD = 3.93). This difference was not statistically significant.
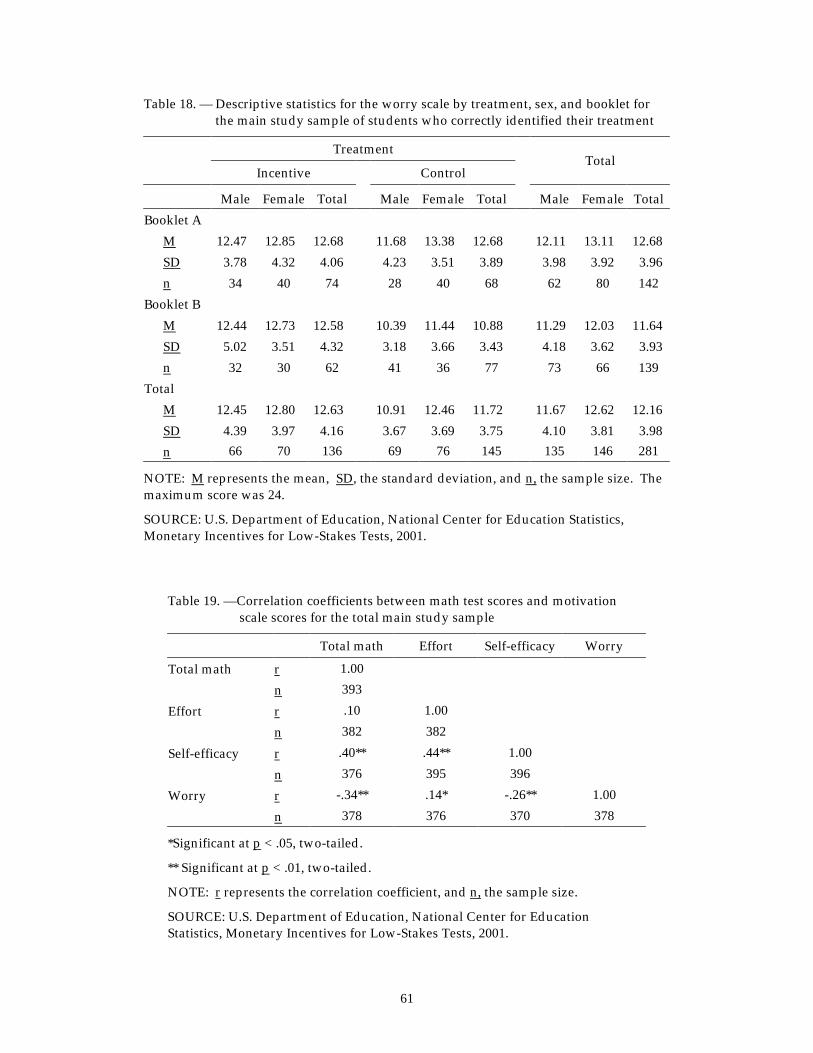
61
Table 18. — Descriptive statistics for the worry scale by treatment, sex, and booklet for the main study sample of students who correctly identified their treatment
Treatment
Incentive Control Total
Male Female Total Male Female Total Male Female Total Booklet A M 12.47 12.85 12.68 11.68 13.38 12.68 12.11 13.11 12.68 SD 3.78 4.32 4.06 4.23 3.51 3.89 3.98 3.92 3.96 n 34 40 74 28 40 68 62 80 142 Booklet B M 12.44 12.73 12.58 10.39 11.44 10.88 11.29 12.03 11.64 SD 5.02 3.51 4.32 3.18 3.66 3.43 4.18 3.62 3.93 n 32 30 62 41 36 77 73 66 139 Total M 12.45 12.80 12.63 10.91 12.46 11.72 11.67 12.62 12.16 SD 4.39 3.97 4.16 3.67 3.69 3.75 4.10 3.81 3.98 n 66 70 136 69 76 145 135 146 281
NOTE: M represents the mean, SD, the standard deviation, and n, the sample size. The maximum score was 24.
SOURCE: U.S. Department of Education, National Center for Education Statistics, Monetary Incentives for Low-Stakes Tests, 2001.
Table 19. —Correlation coefficients between math test scores and motivation scale scores for the total main study sample
Total math Effort Self-efficacy Worry
Total math r 1.00 n 393 Effort r .10 1.00 n 382 382 Self-efficacy r .40** .44** 1.00 n 376 395 396 Worry r -.34** .14* -.26** 1.00 n 378 376 370 378
*Significant at p < .05, two-tailed.
** Significant at p < .01, two-tailed.
NOTE: r represents the correlation coefficient, and n, the sample size.
SOURCE: U.S. Department of Education, National Center for Education Statistics, Monetary Incentives for Low-Stakes Tests, 2001.
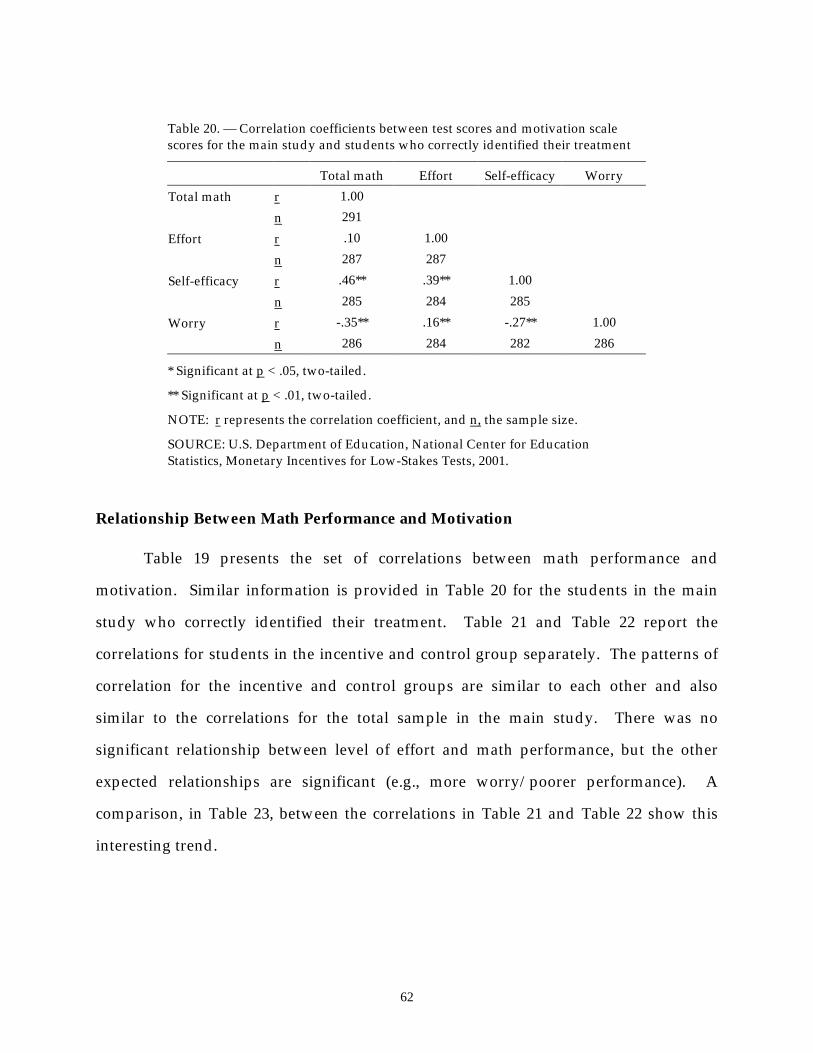
62
Table 20. — Correlation coefficients between test scores and motivation scale scores for the main study and students who correctly identified their treatment
Total math Effort Self-efficacy Worry Total math r 1.00 n 291 Effort r .10 1.00 n 287 287 Self-efficacy r .46** .39** 1.00 n 285 284 285 Worry r -.35** .16** -.27** 1.00 n 286 284 282 286
* Significant at p < .05, two-tailed.
** Significant at p < .01, two-tailed.
NOTE: r represents the correlation coefficient, and n, the sample size.
SOURCE: U.S. Department of Education, National Center for Education Statistics, Monetary Incentives for Low-Stakes Tests, 2001.
Relationship Between Math Performance and Motivation
Table 19 presents the set of correlations between math performance and
motivation. Similar information is provided in Table 20 for the students in the main
study who correctly identified their treatment. Table 21 and Table 22 report the
correlations for students in the incentive and control group separately. The patterns of
correlation for the incentive and control groups are similar to each other and also
similar to the correlations for the total sample in the main study. There was no
significant relationship between level of effort and math performance, but the other
expected relationships are significant (e.g., more worry/poorer performance). A
comparison, in Table 23, between the correlations in Table 21 and Table 22 show this
interesting trend.
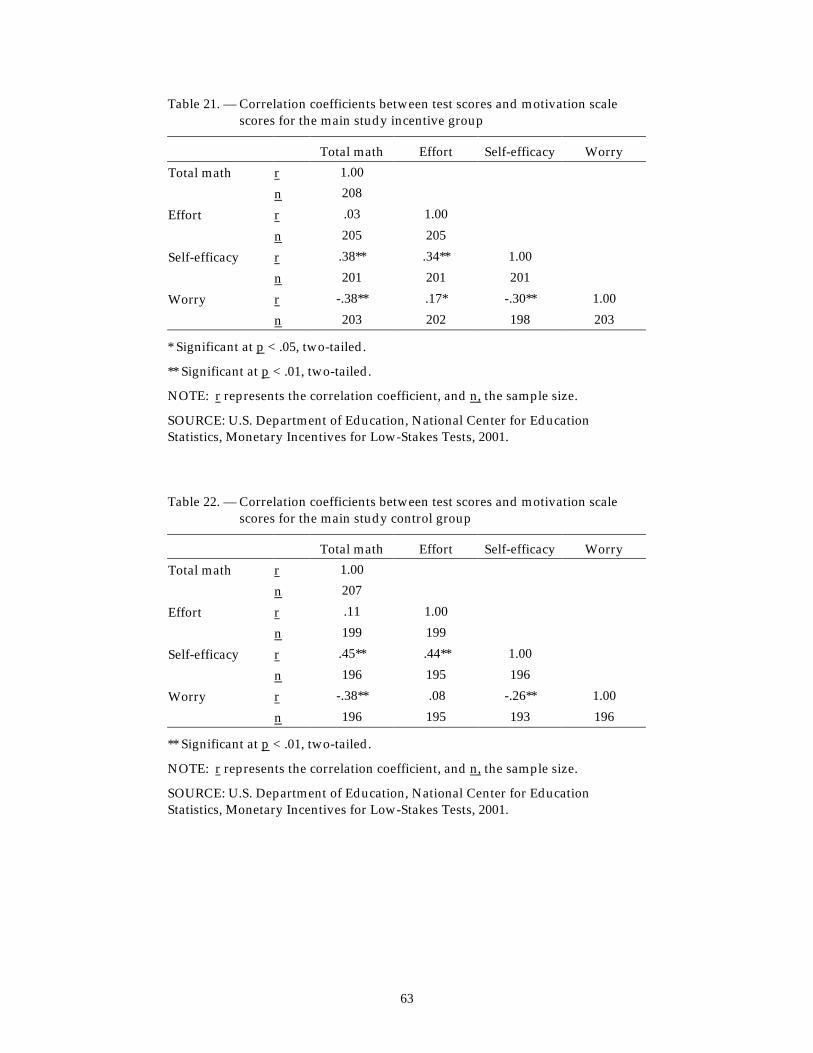
63
Table 21. — Correlation coefficients between test scores and motivation scale scores for the main study incentive group
Total math Effort Self-efficacy Worry Total math r 1.00 n 208 Effort r .03 1.00 n 205 205 Self-efficacy r .38** .34** 1.00 n 201 201 201 Worry r -.38** .17* -.30** 1.00 n 203 202 198 203
* Significant at p < .05, two-tailed.
** Significant at p < .01, two-tailed.
NOTE: r represents the correlation coefficient, and n, the sample size.
SOURCE: U.S. Department of Education, National Center for Education Statistics, Monetary Incentives for Low-Stakes Tests, 2001.
Table 22. — Correlation coefficients between test scores and motivation scale scores for the main study control group
Total math Effort Self-efficacy Worry Total math r 1.00 n 207 Effort r .11 1.00 n 199 199 Self-efficacy r .45** .44** 1.00 n 196 195 196 Worry r -.38** .08 -.26** 1.00 n 196 195 193 196
** Significant at p < .01, two-tailed.
NOTE: r represents the correlation coefficient, and n, the sample size.
SOURCE: U.S. Department of Education, National Center for Education Statistics, Monetary Incentives for Low-Stakes Tests, 2001.
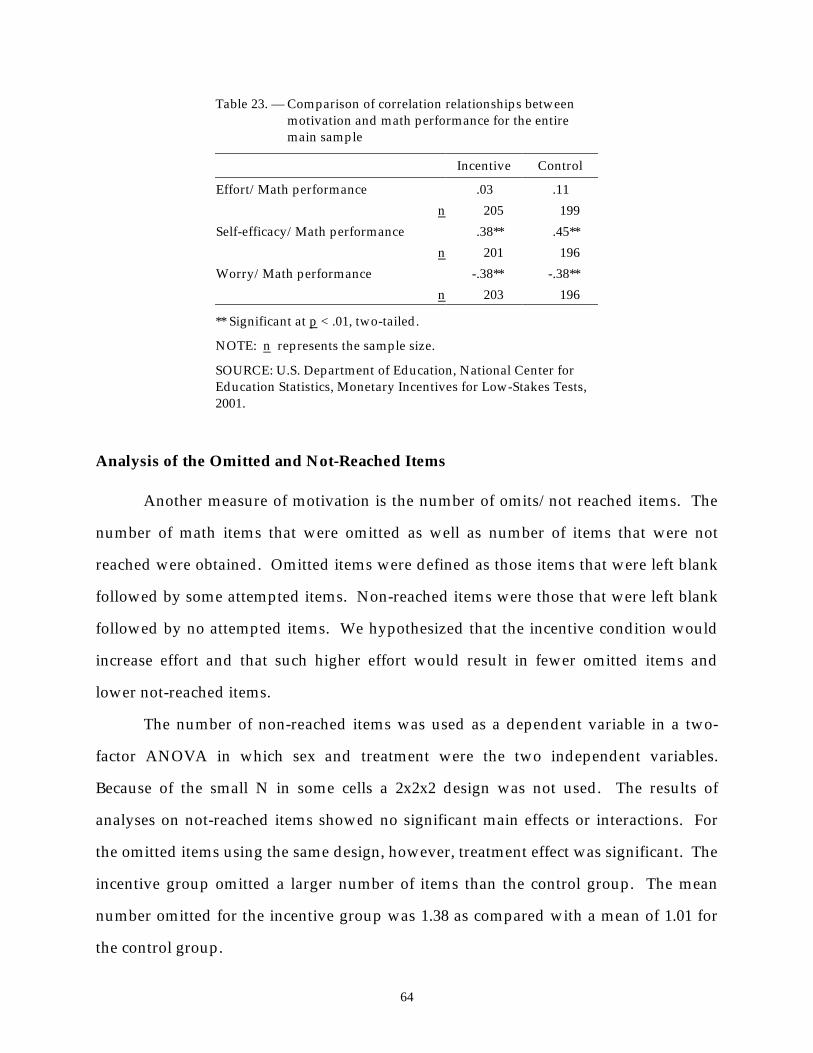
64
Table 23. — Comparison of correlation relationships between motivation and math performance for the entire main sample
Incentive Control
Effort/Math performance .03 .11 n 205 199
Self-efficacy/Math performance .38** .45** n 201 196
Worry/Math performance -.38** -.38** n 203 196
** Significant at p < .01, two-tailed. NOTE: n represents the sample size.
SOURCE: U.S. Department of Education, National Center for Education Statistics, Monetary Incentives for Low-Stakes Tests, 2001.
Analysis of the Omitted and Not-Reached Items
Another measure of motivation is the number of omits/not reached items. The
number of math items that were omitted as well as number of items that were not
reached were obtained. Omitted items were defined as those items that were left blank
followed by some attempted items. Non-reached items were those that were left blank
followed by no attempted items. We hypothesized that the incentive condition would
increase effort and that such higher effort would result in fewer omitted items and
lower not-reached items.
The number of non-reached items was used as a dependent variable in a two-
factor ANOVA in which sex and treatment were the two independent variables.
Because of the small N in some cells a 2x2x2 design was not used. The results of
analyses on not-reached items showed no significant main effects or interactions. For
the omitted items using the same design, however, treatment effect was significant. The
incentive group omitted a larger number of items than the control group. The mean
number omitted for the incentive group was 1.38 as compared with a mean of 1.01 for
the control group.
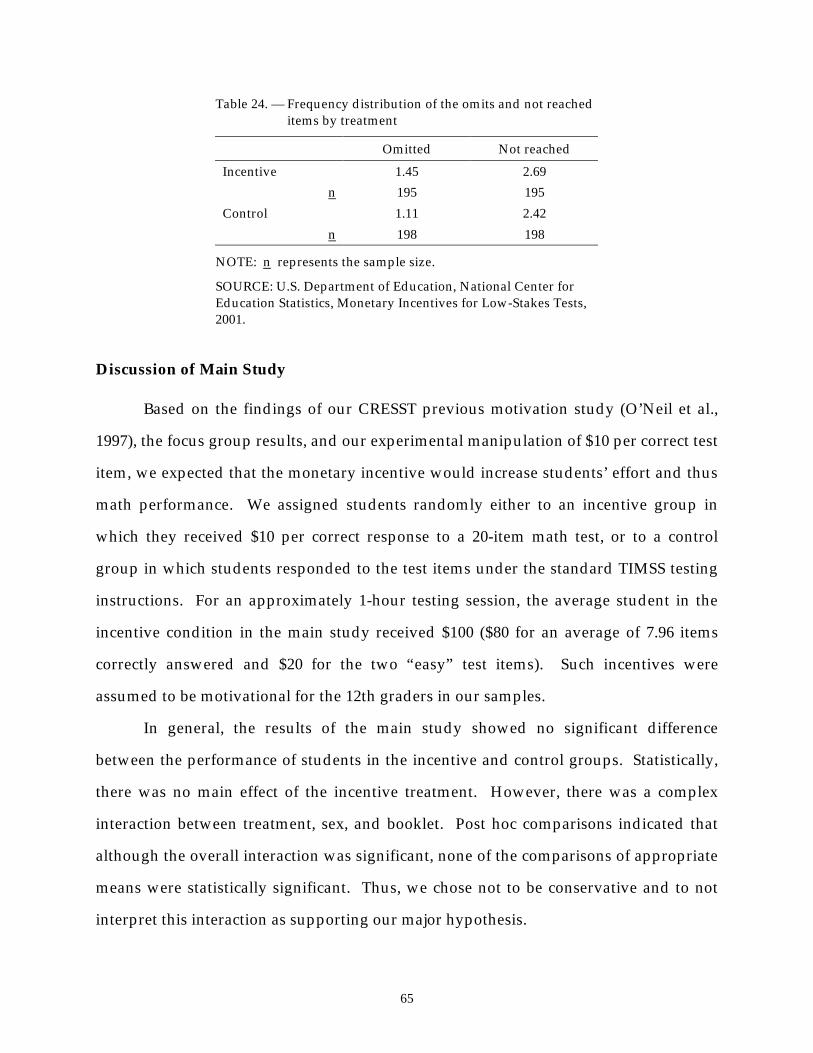
65
Table 24. — Frequency distribution of the omits and not reached items by treatment
Omitted Not reached
Incentive 1.45 2.69 n 195 195
Control 1.11 2.42 n 198 198
NOTE: n represents the sample size.
SOURCE: U.S. Department of Education, National Center for Education Statistics, Monetary Incentives for Low-Stakes Tests, 2001.
Discussion of Main Study
Based on the findings of our CRESST previous motivation study (O’Neil et al.,
1997), the focus group results, and our experimental manipulation of $10 per correct test
item, we expected that the monetary incentive would increase students’ effort and thus
math performance. We assigned students randomly either to an incentive group in
which they received $10 per correct response to a 20-item math test, or to a control
group in which students responded to the test items under the standard TIMSS testing
instructions. For an approximately 1-hour testing session, the average student in the
incentive condition in the main study received $100 ($80 for an average of 7.96 items
correctly answered and $20 for the two “easy” test items). Such incentives were
assumed to be motivational for the 12th graders in our samples.
In general, the results of the main study showed no significant difference
between the performance of students in the incentive and control groups. Statistically,
there was no main effect of the incentive treatment. However, there was a complex
interaction between treatment, sex, and booklet. Post hoc comparisons indicated that
although the overall interaction was significant, none of the comparisons of appropriate
means were statistically significant. Thus, we chose not to be conservative and to not
interpret this interaction as supporting our major hypothesis.
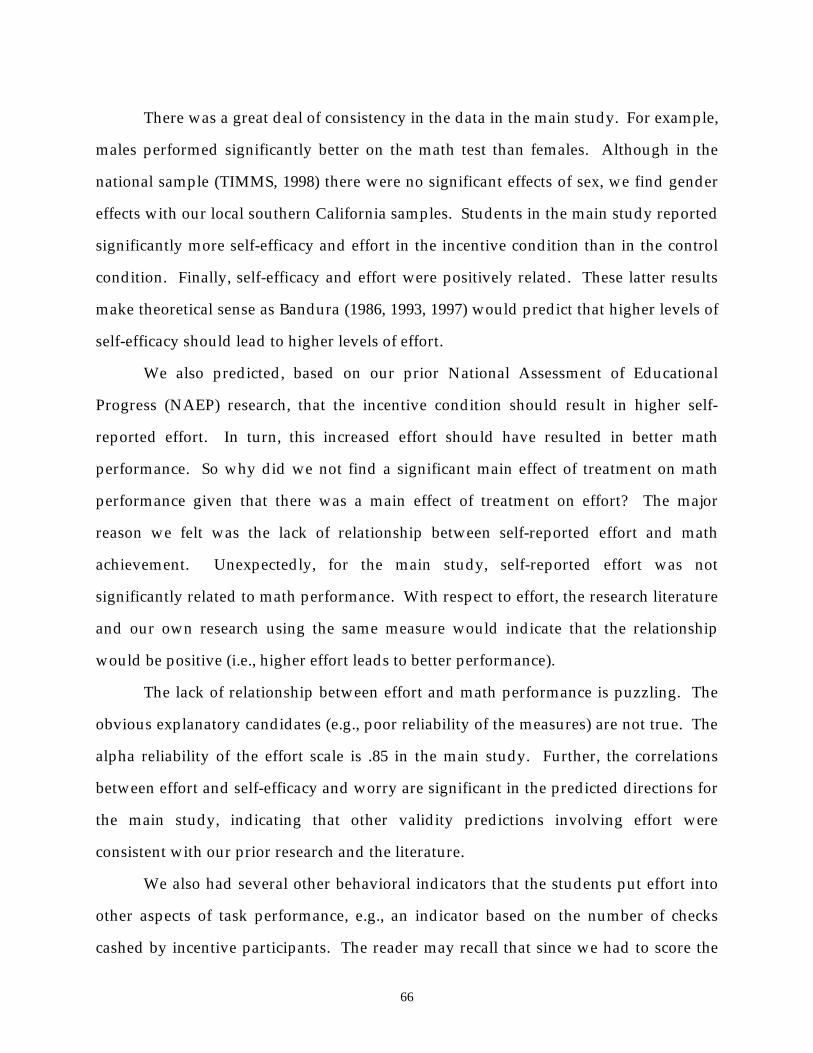
66
There was a great deal of consistency in the data in the main study. For example,
males performed significantly better on the math test than females. Although in the
national sample (TIMMS, 1998) there were no significant effects of sex, we find gender
effects with our local southern California samples. Students in the main study reported
significantly more self-efficacy and effort in the incentive condition than in the control
condition. Finally, self-efficacy and effort were positively related. These latter results
make theoretical sense as Bandura (1986, 1993, 1997) would predict that higher levels of
self-efficacy should lead to higher levels of effort.
We also predicted, based on our prior National Assessment of Educational
Progress (NAEP) research, that the incentive condition should result in higher self-
reported effort. In turn, this increased effort should have resulted in better math
performance. So why did we not find a significant main effect of treatment on math
performance given that there was a main effect of treatment on effort? The major
reason we felt was the lack of relationship between self-reported effort and math
achievement. Unexpectedly, for the main study, self-reported effort was not
significantly related to math performance. With respect to effort, the research literature
and our own research using the same measure would indicate that the relationship
would be positive (i.e., higher effort leads to better performance).
The lack of relationship between effort and math performance is puzzling. The
obvious explanatory candidates (e.g., poor reliability of the measures) are not true. The
alpha reliability of the effort scale is .85 in the main study. Further, the correlations
between effort and self-efficacy and worry are significant in the predicted directions for
the main study, indicating that other validity predictions involving effort were
consistent with our prior research and the literature.
We also had several other behavioral indicators that the students put effort into
other aspects of task performance, e.g., an indicator based on the number of checks
cashed by incentive participants. The reader may recall that since we had to score the
67
performance items and to minimize security concerns (cash in the hands of 12th
graders), we asked the students, before the math test, to fill out a form indicating where
we should send the money they would get for performing successfully on the math test.
For the pilot and main study the 279 participants who requested a check (one student
requested a money order), 272 students’ checks (or 98%) cleared the bank. The reasons
why 6 students did not cash their checks are unknown. Thus, students in the incentive
condition were motivated to expend effort to correctly fill out the forms in the student
test booklet to obtain the money.
Other behavioral information seems to indicate that our oral and written
instructions resulted in students paying attention to our instructions on math items in
general. For example, the two “easy items” were also completed without error for all
incentive and control group participants, indicating that the experimental controls (e.g.,
for believability) were effective. An interesting finding was that the incentive group
had significantly fewer omitted items, thus their strategy was to attempt fewer items
(not more as we expected) in order to make sure that they would get the items right.
Given that there was no significant difference in total math performance between the
two groups, the incentive group strategy resulted in few items attempted but a higher
success for those items.
With respect to our other major experimental control, i.e., oral instructions to
ensure participants would remember the treatment group they were in, we were less
successful. In general, for the main study, few students in the control group thought
they would receive money for items correct. In the main study, only 8 out of 198
students (4%) thought they were to receive money. However, only 136 out of 195
incentive group students (70%) correctly identified their experimental condition. In our
prior NAEP study, only 66% of the 12th grade students remembered that they were to
receive money. Thus, in the main study, combining oral and written instructions was
not as effective as we hoped when compared to written instructions in the NAEP study.
68
There are a couple issues that speaks to our location in Los Angeles. One way in
which the sample of students used in this study is not a representative sample of all the
students in the United States is that so many of them are from families that do not speak
English at home. Well over half never speak English at home, while less than 15
percent only speak English at home. The high non-English language background of the
sample limits generalizing the findings. Findings should be interpreted in light of this
caution. It may also be that race-ethnicity composition is not representative of the
United States as a whole. We do not know the racial-ethnic background of the students
as we did not request it.
The findings are also the same for the analyses using a subset of the items (i.e.,
the "easy" and the “difficult” ones). Moreover, we ran additional analyses with AP
students included in the main sample study. The results were exactly the same on math
as when the AP students were excluded (See Appendix E). Thus, we feel that, although
troubling, the finding that 30% of the students could not remember that they were to
receive money does not affect our conclusions.
In our prior NAEP study, in which a money incentive was not motivating for
12th graders, we hypothesized that the lack of effect for 12th graders was because
(a) the amount of money ($1.00 per item) was not large enough for 12th graders, and
further (b) many 12th graders did not believe they would get the money. By
comparison, in the present study, we felt that both conditions (i.e., amount of money
and believability) were satisfactory and should have worked, but did not. Like the
main study, our chain of logic was that the money would be an incentive to increase
effort and therefore improve math performance. We succeeded in increasing effort
(measured by self-report and number of checks that cleared), but the incentive
condition did not facilitate math performance. The mechanism of high effort leading to
better math performance for those with prior knowledge at test time was based on our
prior research, the literature, and common sense.
69
Presumably, since the incentive condition increased effort in the main study, if
self-reported effort were related to performance, then the incentive condition would
have increased math performance. One might argue that there were suggestions of an
incentive effect—for example, the significant triple interaction between incentive, sex,
and booklet in the main study. Such an effect was relatively weak, as post hoc
comparisons indicated no significant difference for the mean comparisons. Thus, as
mentioned earlier, we discounted this interaction. These analyses by "treatments as
intended" vs. "treatments as remembered" were preplanned. The first is good practice
and exploits randomization. The second is good practice, often less interpretable, and
does not exploit randomization. Nonetheless, we got the same conclusions. In
summary, effort was not related to performance, and the conclusion for this study is
that a monetary incentive did not increase math performance on a set of TIMMS
released math items. The high non-English language background of the sample limits
generalizing the findings and the findings should be interpreted in light of this caution.

71
AP Study
Overview of Study
The Advanced Placement (AP) study was performed after the main study, with
AP students as participants. Our results in the main study indicated no treatment effect
on math scores. Further, in the main study, our overall math achievement levels on the
Science Study Third International Mathematics and Science Study (TIMSS) released
items were very low (an average of approximately 8 out of a total possible score of 24).
We suspected that the low average math scores might reflect both lack of content
knowledge and lack of motivation. Therefore, we decided to include AP students in a
supplemental study to contrast their results with results from the main study. We
expected the AP math students to have more prior knowledge than non-AP students in
the main study. Since the incentive effect would be at test time, prior knowledge was
essential if students put more effort into the test. They needed to know the material. A
new human subjects application form was submitted to the University of California,
Los Angeles (UCLA) Human Subjects Protection Committee office and was approved.
The revised principal letter and revised consent form from the main study were used in
the AP study. To specifically narrow the comparison, only one type of booklet was
used instead of two. We used Booklet B, the "easier" booklet. We tried to set up a best
case for observing the impact of the money incentive, i.e., students with high prior
knowledge (AP students), with an easier booklet (Booklet B). The procedures and
measures remained the same as in the main study. The same set of released items was
used in both the AP and the main studies. After administration at the third site in the
AP study, one question (Question 5) was added to determine how generation affects
motivation.
72
Participants
Nine school sites agreed to participate in the AP study. A total of 166 AP
students (90 male and 76 female) participated. However, we dropped one school site
(with 3 male and 3 female students) due to an administration error. Thus, in the final
sample for this study there were 160 participants (87 males and 73 females).
Table 25 displays the background information for AP students on courses taken,
remembering their treatment group, language spoken in the home, math grades, and
whether the content had been taught to them. Most of the 160 participants indicated
that they were taking an AP math class. In those instances in which a student indicated
that s/he was not taking a math class, we reviewed the class roster submitted by the
school site’s assistant principal for which class this student was enrolled. In each case
we found that the class was in fact an AP Calculus class. In addition, we examined the
Advanced Placement consent forms that had been signed by these students and their
guardians. These forms indicated that each of these students had taken or was
currently taking AP Calculus. These students were not dropped from the sample. A
few additional students indicated that they were not in an AP math class. We discussed
these students with their teachers; the students were in fact AP students and thus were
not dropped from the sample. With respect to Question 2, none of the students in the
control group made the wrong assumption that they would get paid for this study;
however, only 72 students in the incentive group clearly responded that they knew
there was a monetary award. Thus, 13 students (15%) did not respond that they were to
get $10 for each correct answer. About one third of the students used English all the
time at home. And 153 out of 160 students had math grades above B. Only 4 students
responded that they had not been taught the concepts before. Question 3 “Last years
SAT 9 score” was not analyzed as it was clear to us that students confused this question
with asking about the Scholastic Achievement Test (SAT). Likewise, Question 5 about
whether the student was born in the United States was not analyzed, nor, in this case,
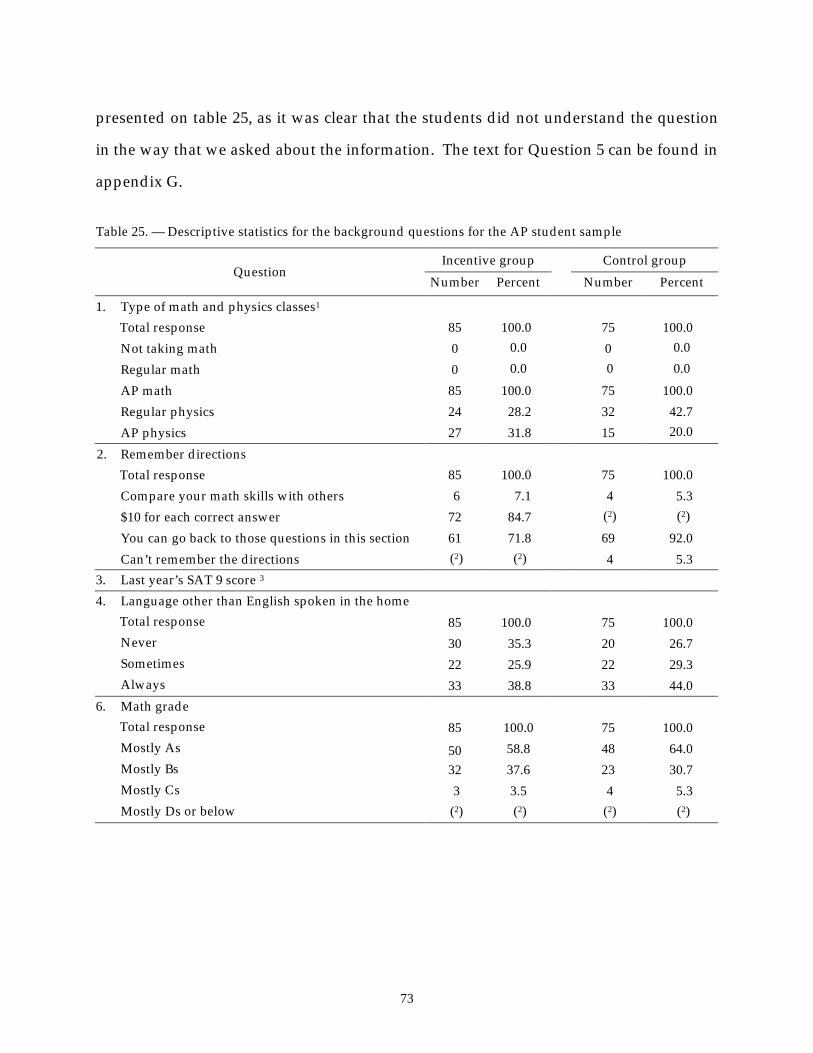
73
presented on table 25, as it was clear that the students did not understand the question
in the way that we asked about the information. The text for Question 5 can be found in
appendix G.
Table 25. — Descriptive statistics for the background questions for the AP student sample
Incentive group Control group Question
Number Percent Number Percent
1. Type of math and physics classes1 Total response 85 100.0 75 100.0 Not taking math 0 0.0 0 0.0 Regular math 0 0.0 0 0.0 AP math 85 100.0 75 100.0 Regular physics 24 28.2 32 42.7 AP physics 27 31.8 15 20.0
2. Remember directions Total response 85 100.0 75 100.0 Compare your math skills with others 6 7.1 4 5.3 $10 for each correct answer 72 84.7 (2) (2) You can go back to those questions in this section 61 71.8 69 92.0 Can’t remember the directions (2) (2) 4 5.3
3. Last year’s SAT 9 score 3 4. Language other than English spoken in the home
Total response 85 100.0 75 100.0 Never 30 35.3 20 26.7 Sometimes 22 25.9 22 29.3 Always 33 38.8 33 44.0
6. Math grade Total response 85 100.0 75 100.0 Mostly As 50 58.8 48 64.0 Mostly Bs 32 37.6 23 30.7 Mostly Cs 3 3.5 4 5.3 Mostly Ds or below (2) (2) (2) (2)
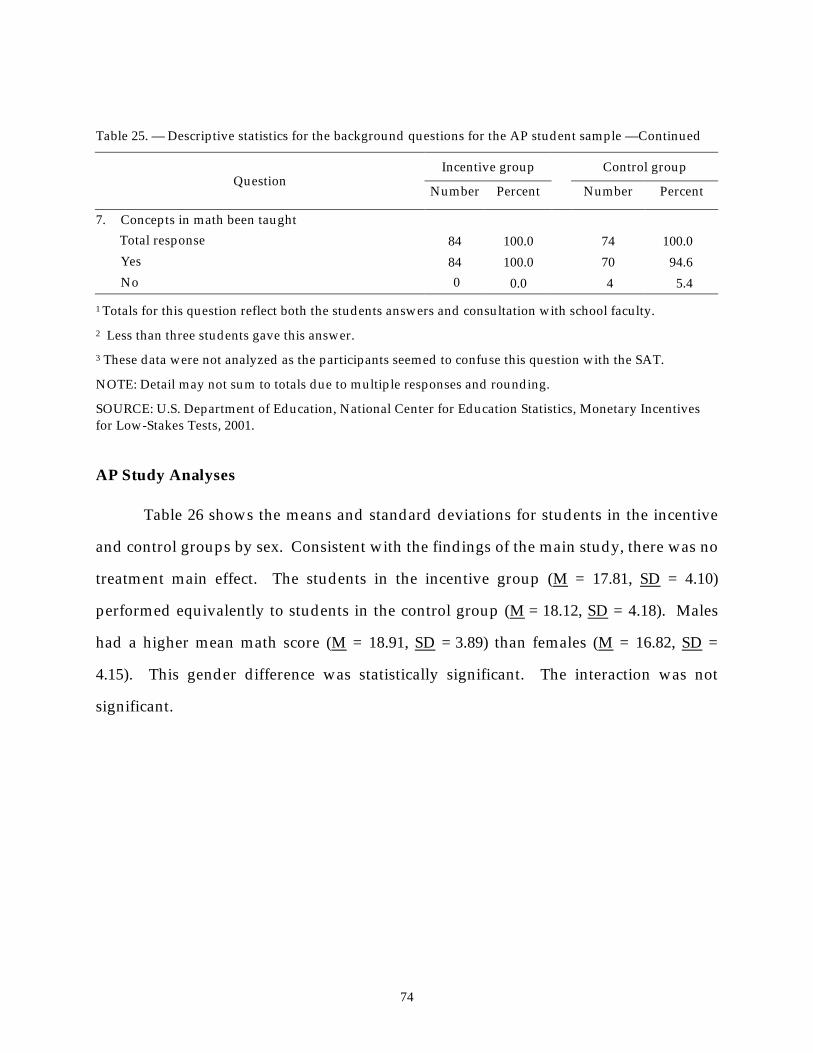
74
Table 25. — Descriptive statistics for the background questions for the AP student sample —Continued
Incentive group Control group Question
Number Percent Number Percent
7. Concepts in math been taught Total response 84 100.0 74 100.0 Yes 84 100.0 70 94.6 No 0 0.0 4 5.4
1 Totals for this question reflect both the students answers and consultation with school faculty. 2 Less than three students gave this answer. 3 These data were not analyzed as the participants seemed to confuse this question with the SAT.
NOTE: Detail may not sum to totals due to multiple responses and rounding.
SOURCE: U.S. Department of Education, National Center for Education Statistics, Monetary Incentives for Low-Stakes Tests, 2001.
AP Study Analyses
Table 26 shows the means and standard deviations for students in the incentive
and control groups by sex. Consistent with the findings of the main study, there was no
treatment main effect. The students in the incentive group (M = 17.81, SD = 4.10)
performed equivalently to students in the control group (M = 18.12, SD = 4.18). Males
had a higher mean math score (M = 18.91, SD = 3.89) than females (M = 16.82, SD =
4.15). This gender difference was statistically significant. The interaction was not
significant.
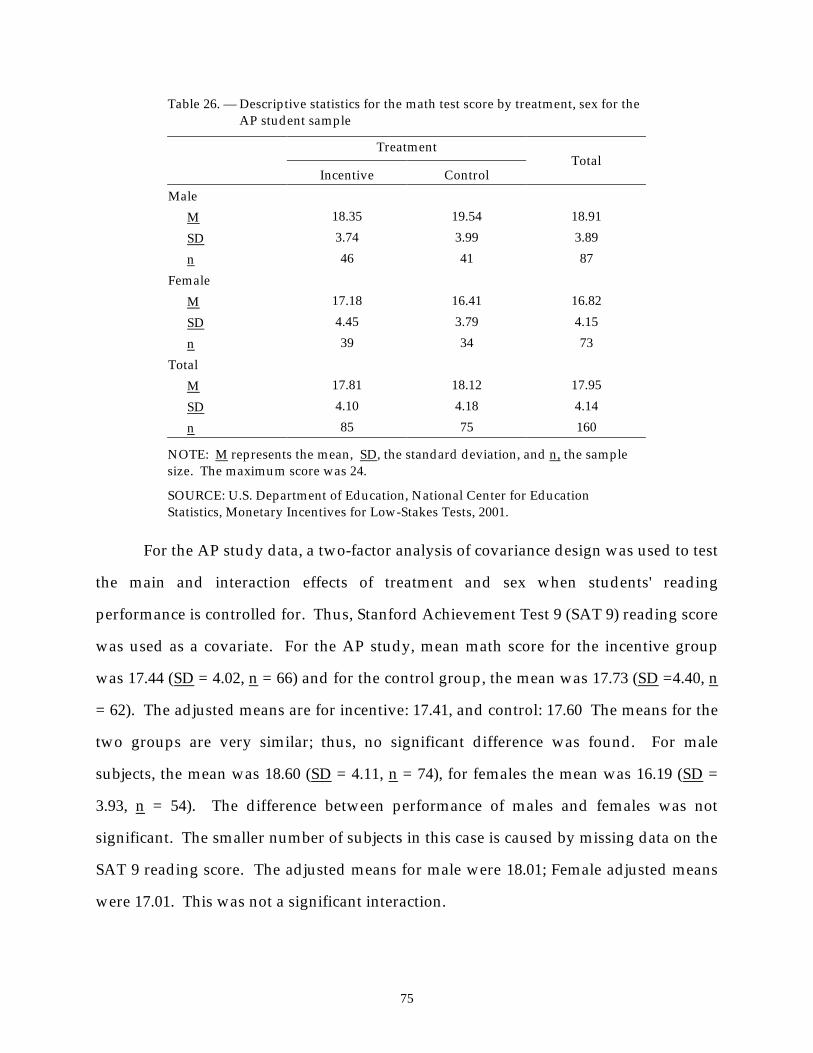
75
Table 26. — Descriptive statistics for the math test score by treatment, sex for the AP student sample
Treatment
Incentive Control Total
Male M 18.35 19.54 18.91 SD 3.74 3.99 3.89 n 46 41 87 Female M 17.18 16.41 16.82 SD 4.45 3.79 4.15 n 39 34 73 Total M 17.81 18.12 17.95 SD 4.10 4.18 4.14 n 85 75 160
NOTE: M represents the mean, SD, the standard deviation, and n, the sample size. The maximum score was 24.
SOURCE: U.S. Department of Education, National Center for Education Statistics, Monetary Incentives for Low-Stakes Tests, 2001.
For the AP study data, a two-factor analysis of covariance design was used to test
the main and interaction effects of treatment and sex when students' reading
performance is controlled for. Thus, Stanford Achievement Test 9 (SAT 9) reading score
was used as a covariate. For the AP study, mean math score for the incentive group
was 17.44 (SD = 4.02, n = 66) and for the control group, the mean was 17.73 (SD =4.40, n
= 62). The adjusted means are for incentive: 17.41, and control: 17.60 The means for the
two groups are very similar; thus, no significant difference was found. For male
subjects, the mean was 18.60 (SD = 4.11, n = 74), for females the mean was 16.19 (SD =
3.93, n = 54). The difference between performance of males and females was not
significant. The smaller number of subjects in this case is caused by missing data on the
SAT 9 reading score. The adjusted means for male were 18.01; Female adjusted means
were 17.01. This was not a significant interaction.
76
Item Difficulty. As mentioned earlier, the incentive effect was expected only for
content that the students already knew, so it was predicted for AP students in the
incentive condition that increased effort would improve performance on easier items,
because students would be familiar with the content. As with the main study, based on
the TIMSS’ item p-values (proportion of item correct response), which we obtained
from the 1997 TIMSS assessment, subsets of TIMSS test items were used to create two
test scores: (a) a score for easy items, and (b) a score for difficult items. Five items
(questions 2, 8, 10, 16, and 17, percent correct > .64) were considered easy items (See
Appendix B, Booklet A). Five items (Questions 4, 5, 13, 19, and 20, percent correct <. 28)
were considered difficult items (See Appendix B, Booklet A). The mean for the five easy
items was 3.54 and for the five difficult items the mean was 0.90.
The easy and difficult test scores were used successively in the same 2 × 2
completely crossed Analysis of Variance (ANOVA) models, which we applied to the
total math scores. Treatment and sex were used as the independent variables.
Easy Items. Table 27 presents descriptive statistics for the easy items by treatment and
sex. The maximum possible score for the five easy items is 5 points. The overall mean
score for easy items for AP students was 4.35 (SD = .71). Thus, for the easy items, the
percent of correct items for the entire AP sample was 87%, indicating an easy test for
these AP students. As the data in Table 27 suggest, there was little difference between
control group and incentive group performance. The mean score for the easy items was
4.34 (SD = .68) for the incentive group and 4.36 (SD = .75) for the control group. The
mean math score for males (M = 4.45, SD = .66) was significantly higher than for
females (M = 4.23, SD = .75. The interaction was not statistically significance.
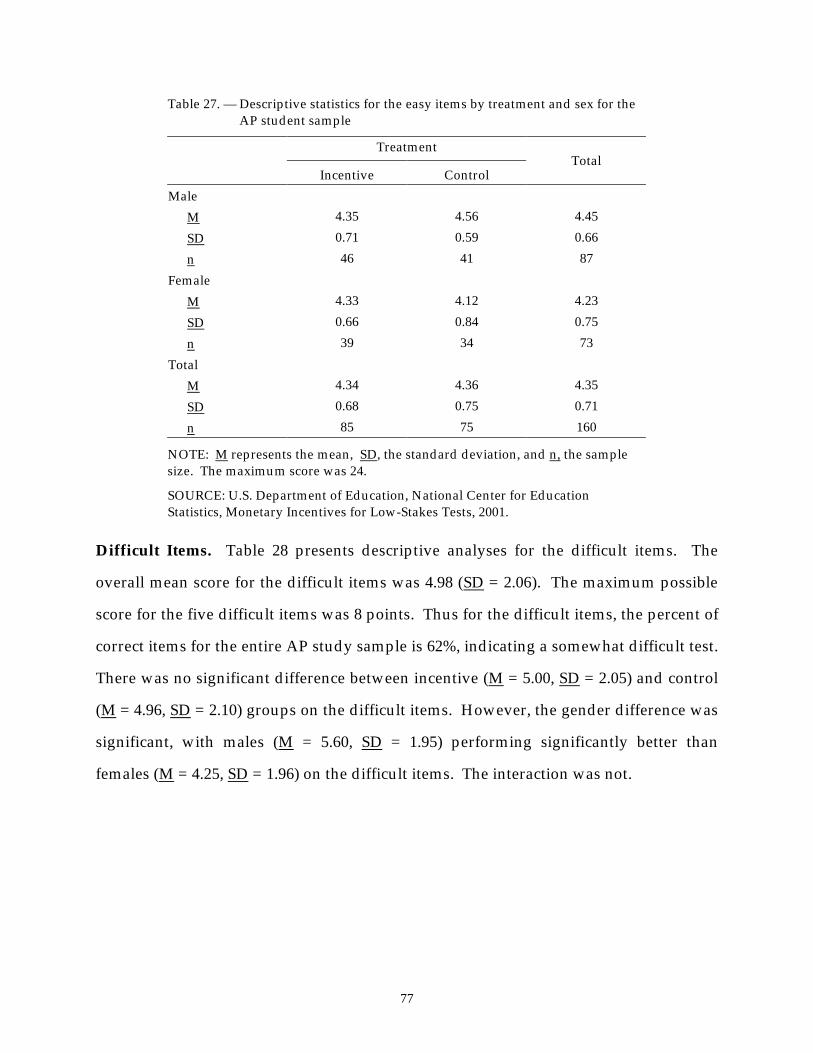
77
Table 27. — Descriptive statistics for the easy items by treatment and sex for the AP student sample
Treatment
Incentive Control Total
Male M 4.35 4.56 4.45 SD 0.71 0.59 0.66 n 46 41 87 Female M 4.33 4.12 4.23 SD 0.66 0.84 0.75 n 39 34 73 Total M 4.34 4.36 4.35 SD 0.68 0.75 0.71 n 85 75 160
NOTE: M represents the mean, SD, the standard deviation, and n, the sample size. The maximum score was 24.
SOURCE: U.S. Department of Education, National Center for Education Statistics, Monetary Incentives for Low-Stakes Tests, 2001.
Difficult Items. Table 28 presents descriptive analyses for the difficult items. The
overall mean score for the difficult items was 4.98 (SD = 2.06). The maximum possible
score for the five difficult items was 8 points. Thus for the difficult items, the percent of
correct items for the entire AP study sample is 62%, indicating a somewhat difficult test.
There was no significant difference between incentive (M = 5.00, SD = 2.05) and control
(M = 4.96, SD = 2.10) groups on the difficult items. However, the gender difference was
significant, with males (M = 5.60, SD = 1.95) performing significantly better than
females (M = 4.25, SD = 1.96) on the difficult items. The interaction was not.
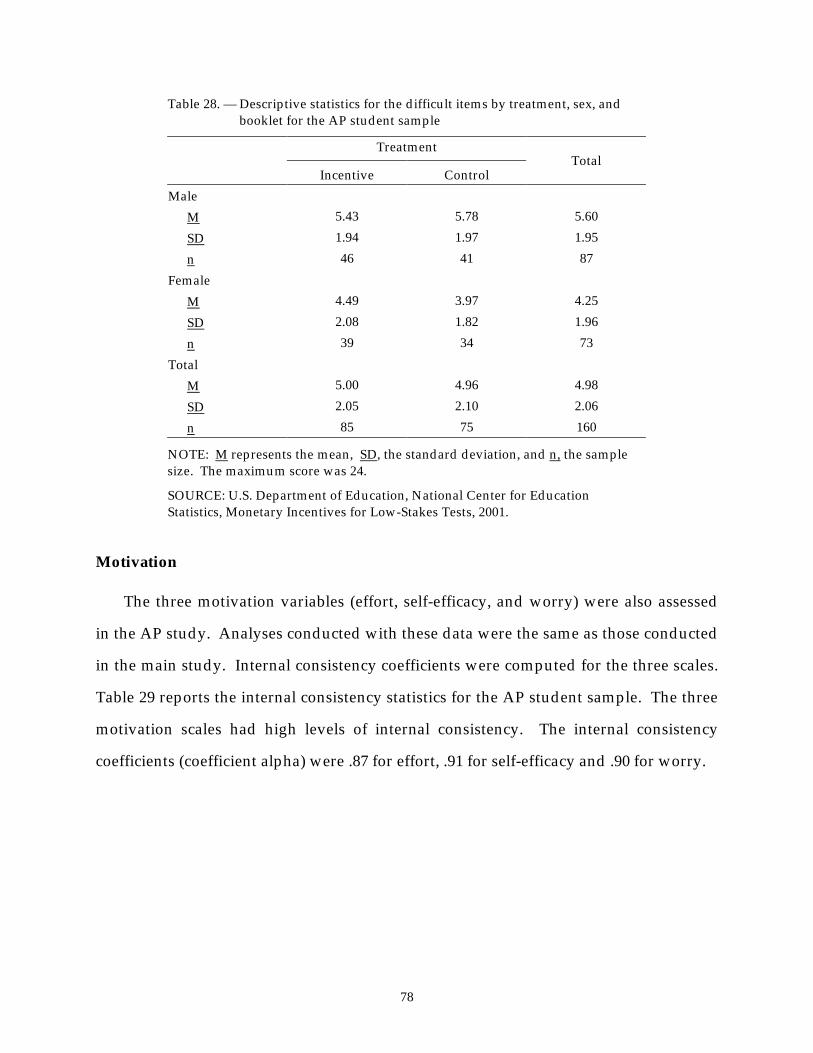
78
Table 28. — Descriptive statistics for the difficult items by treatment, sex, and booklet for the AP student sample
Treatment
Incentive Control Total
Male M 5.43 5.78 5.60 SD 1.94 1.97 1.95 n 46 41 87 Female M 4.49 3.97 4.25 SD 2.08 1.82 1.96 n 39 34 73 Total M 5.00 4.96 4.98 SD 2.05 2.10 2.06 n 85 75 160
NOTE: M represents the mean, SD, the standard deviation, and n, the sample size. The maximum score was 24.
SOURCE: U.S. Department of Education, National Center for Education Statistics, Monetary Incentives for Low-Stakes Tests, 2001.
Motivation
The three motivation variables (effort, self-efficacy, and worry) were also assessed
in the AP study. Analyses conducted with these data were the same as those conducted
in the main study. Internal consistency coefficients were computed for the three scales.
Table 29 reports the internal consistency statistics for the AP student sample. The three
motivation scales had high levels of internal consistency. The internal consistency
coefficients (coefficient alpha) were .87 for effort, .91 for self-efficacy and .90 for worry.
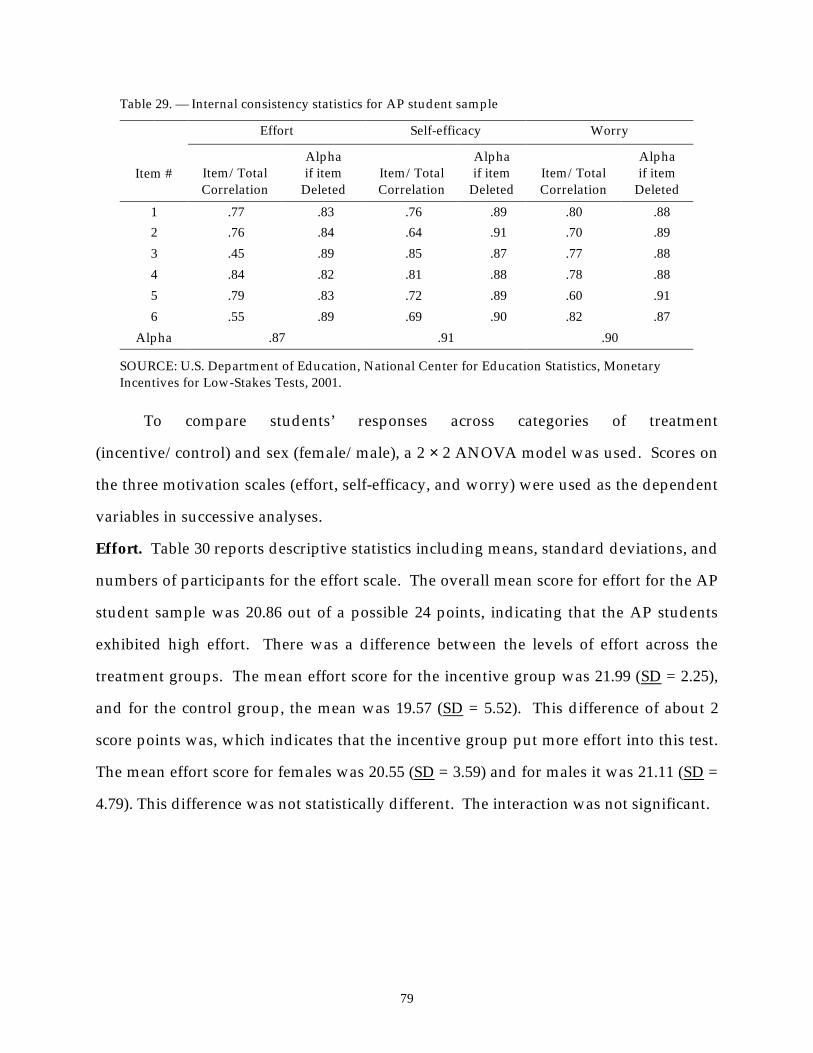
79
Table 29. — Internal consistency statistics for AP student sample
Effort Self-efficacy Worry
Item #
Item/Total Correlation
Alpha if item
Deleted
Item/Total Correlation
Alpha if item
Deleted
Item/Total Correlation
Alpha if item
Deleted
1 .77 .83 .76 .89 .80 .88 2 .76 .84 .64 .91 .70 .89 3 .45 .89 .85 .87 .77 .88 4 .84 .82 .81 .88 .78 .88 5 .79 .83 .72 .89 .60 .91 6 .55 .89 .69 .90 .82 .87
Alpha .87 .91 .90
SOURCE: U.S. Department of Education, National Center for Education Statistics, Monetary Incentives for Low-Stakes Tests, 2001.
To compare students’ responses across categories of treatment
(incentive/control) and sex (female/male), a 2 × 2 ANOVA model was used. Scores on
the three motivation scales (effort, self-efficacy, and worry) were used as the dependent
variables in successive analyses.
Effort. Table 30 reports descriptive statistics including means, standard deviations, and
numbers of participants for the effort scale. The overall mean score for effort for the AP
student sample was 20.86 out of a possible 24 points, indicating that the AP students
exhibited high effort. There was a difference between the levels of effort across the
treatment groups. The mean effort score for the incentive group was 21.99 (SD = 2.25),
and for the control group, the mean was 19.57 (SD = 5.52). This difference of about 2
score points was, which indicates that the incentive group put more effort into this test.
The mean effort score for females was 20.55 (SD = 3.59) and for males it was 21.11 (SD =
4.79). This difference was not statistically different. The interaction was not significant.
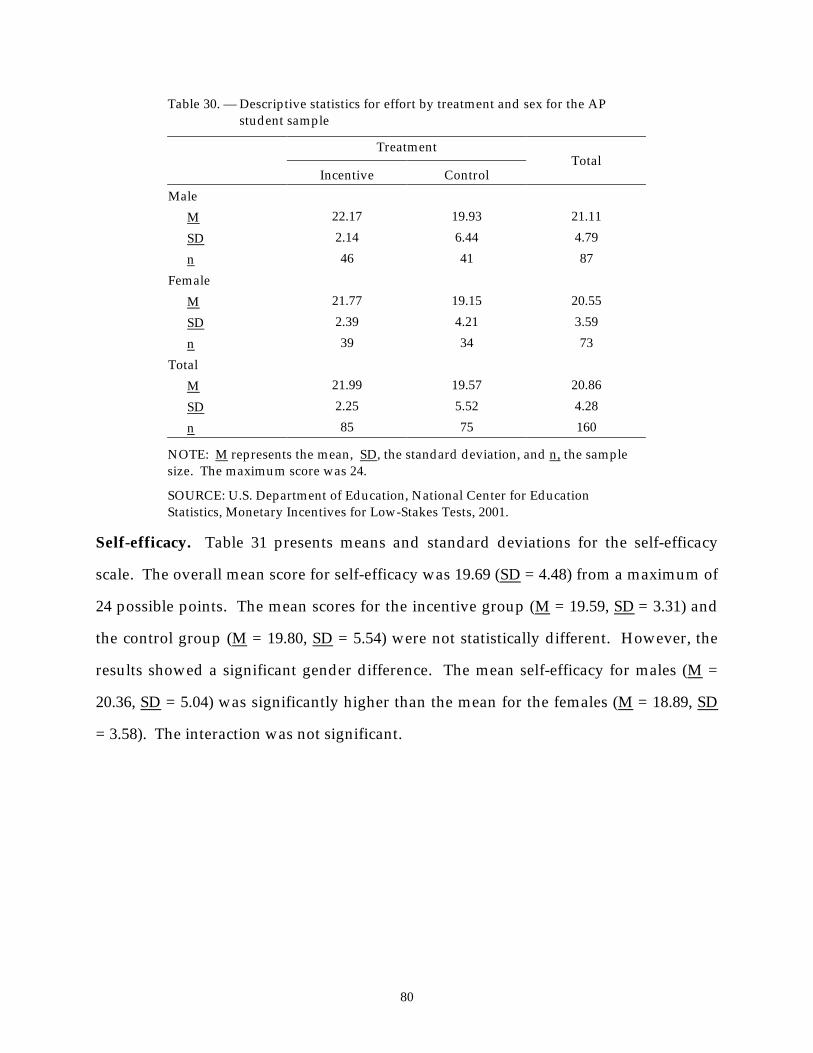
80
Table 30. — Descriptive statistics for effort by treatment and sex for the AP student sample
Treatment
Incentive Control Total
Male M 22.17 19.93 21.11 SD 2.14 6.44 4.79 n 46 41 87 Female M 21.77 19.15 20.55 SD 2.39 4.21 3.59 n 39 34 73 Total M 21.99 19.57 20.86 SD 2.25 5.52 4.28 n 85 75 160
NOTE: M represents the mean, SD, the standard deviation, and n, the sample size. The maximum score was 24.
SOURCE: U.S. Department of Education, National Center for Education Statistics, Monetary Incentives for Low-Stakes Tests, 2001.
Self-efficacy. Table 31 presents means and standard deviations for the self-efficacy
scale. The overall mean score for self-efficacy was 19.69 (SD = 4.48) from a maximum of
24 possible points. The mean scores for the incentive group (M = 19.59, SD = 3.31) and
the control group (M = 19.80, SD = 5.54) were not statistically different. However, the
results showed a significant gender difference. The mean self-efficacy for males (M =
20.36, SD = 5.04) was significantly higher than the mean for the females (M = 18.89, SD
= 3.58). The interaction was not significant.
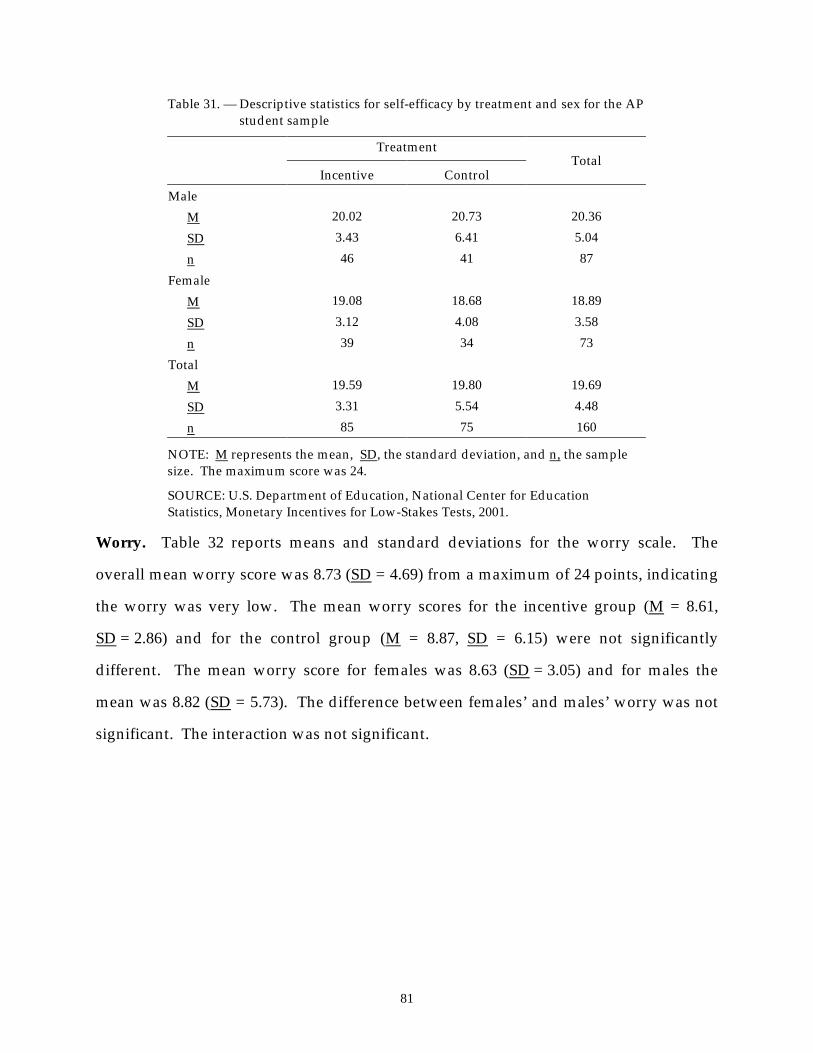
81
Table 31. — Descriptive statistics for self-efficacy by treatment and sex for the AP student sample
Treatment
Incentive Control Total
Male M 20.02 20.73 20.36 SD 3.43 6.41 5.04 n 46 41 87 Female M 19.08 18.68 18.89 SD 3.12 4.08 3.58 n 39 34 73 Total M 19.59 19.80 19.69 SD 3.31 5.54 4.48 n 85 75 160
NOTE: M represents the mean, SD, the standard deviation, and n, the sample size. The maximum score was 24.
SOURCE: U.S. Department of Education, National Center for Education Statistics, Monetary Incentives for Low-Stakes Tests, 2001.
Worry. Table 32 reports means and standard deviations for the worry scale. The
overall mean worry score was 8.73 (SD = 4.69) from a maximum of 24 points, indicating
the worry was very low. The mean worry scores for the incentive group (M = 8.61,
SD = 2.86) and for the control group (M = 8.87, SD = 6.15) were not significantly
different. The mean worry score for females was 8.63 (SD = 3.05) and for males the
mean was 8.82 (SD = 5.73). The difference between females’ and males’ worry was not
significant. The interaction was not significant.
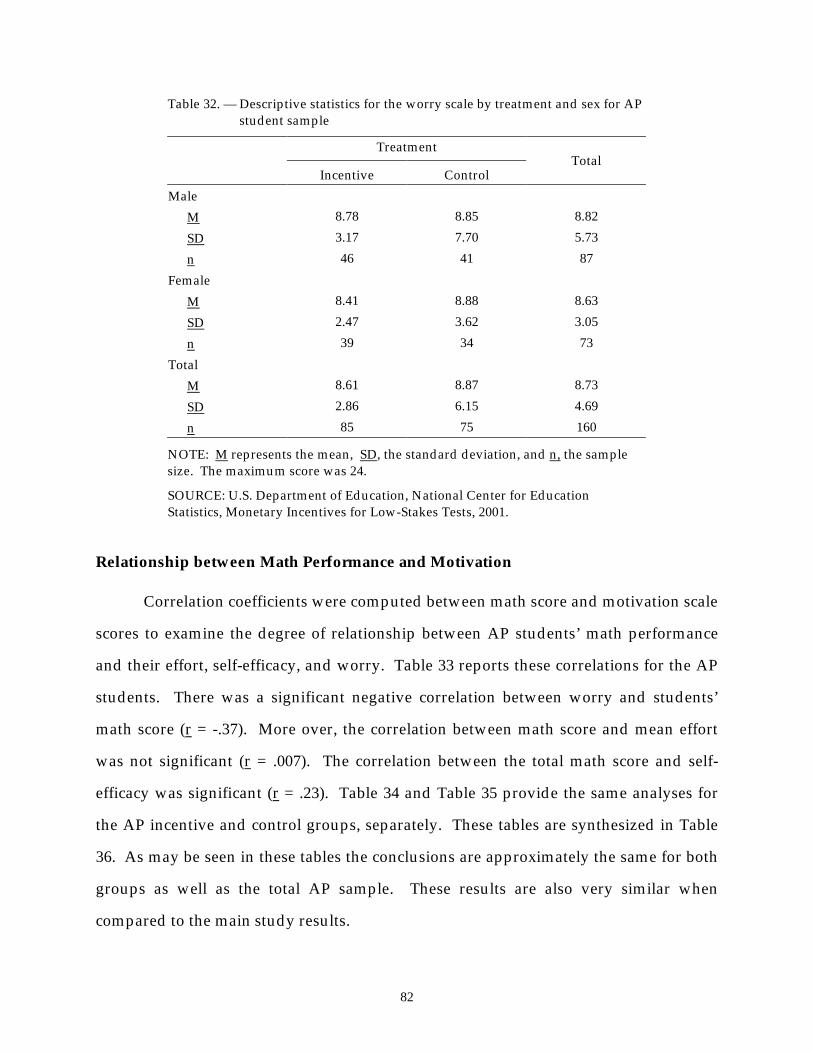
82
Table 32. — Descriptive statistics for the worry scale by treatment and sex for AP student sample
Treatment
Incentive Control Total
Male M 8.78 8.85 8.82 SD 3.17 7.70 5.73 n 46 41 87 Female M 8.41 8.88 8.63 SD 2.47 3.62 3.05 n 39 34 73 Total M 8.61 8.87 8.73 SD 2.86 6.15 4.69 n 85 75 160
NOTE: M represents the mean, SD, the standard deviation, and n, the sample size. The maximum score was 24.
SOURCE: U.S. Department of Education, National Center for Education Statistics, Monetary Incentives for Low-Stakes Tests, 2001.
Relationship between Math Performance and Motivation
Correlation coefficients were computed between math score and motivation scale
scores to examine the degree of relationship between AP students’ math performance
and their effort, self-efficacy, and worry. Table 33 reports these correlations for the AP
students. There was a significant negative correlation between worry and students’
math score (r = -.37). More over, the correlation between math score and mean effort
was not significant (r = .007). The correlation between the total math score and self-
efficacy was significant (r = .23). Table 34 and Table 35 provide the same analyses for
the AP incentive and control groups, separately. These tables are synthesized in Table
36. As may be seen in these tables the conclusions are approximately the same for both
groups as well as the total AP sample. These results are also very similar when
compared to the main study results.
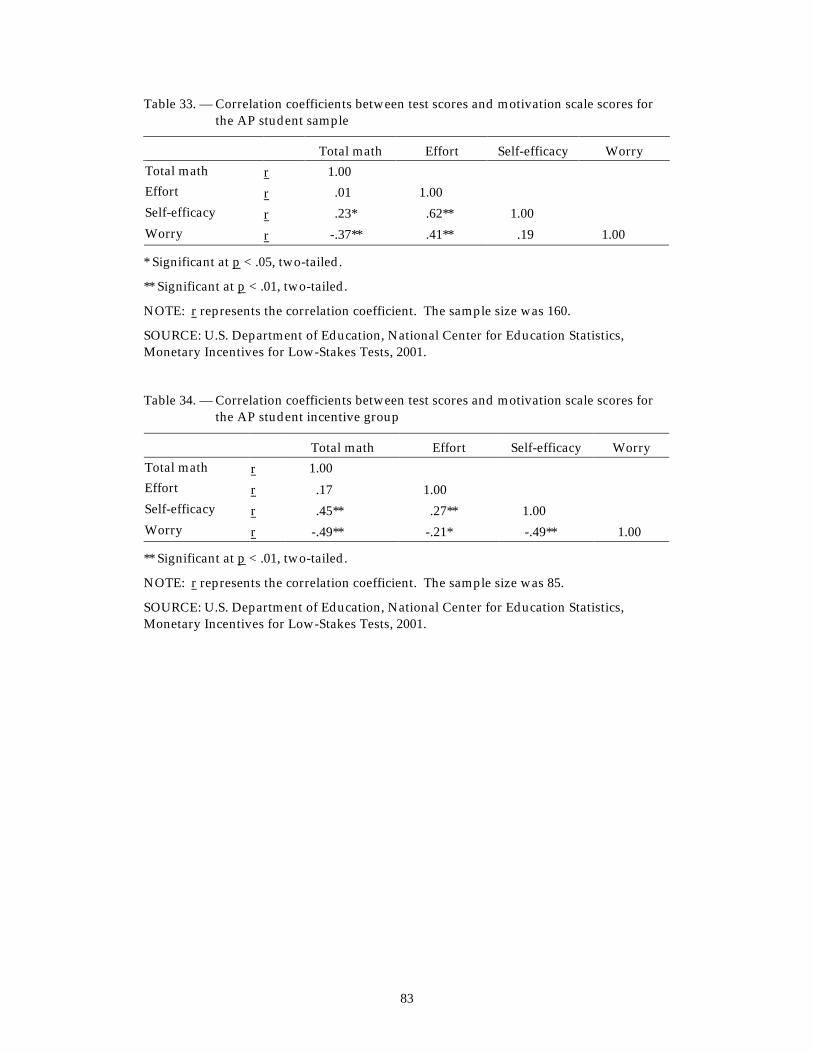
83
Table 33. — Correlation coefficients between test scores and motivation scale scores for the AP student sample
Total math Effort Self-efficacy Worry Total math r 1.00 Effort r .01 1.00 Self-efficacy r .23* .62** 1.00 Worry r -.37** .41** .19 1.00
* Significant at p < .05, two-tailed.
** Significant at p < .01, two-tailed.
NOTE: r represents the correlation coefficient. The sample size was 160.
SOURCE: U.S. Department of Education, National Center for Education Statistics, Monetary Incentives for Low-Stakes Tests, 2001.
Table 34. — Correlation coefficients between test scores and motivation scale scores for the AP student incentive group
Total math Effort Self-efficacy Worry Total math r 1.00 Effort r .17 1.00 Self-efficacy r .45** .27** 1.00 Worry r -.49** -.21* -.49** 1.00
** Significant at p < .01, two-tailed.
NOTE: r represents the correlation coefficient. The sample size was 85.
SOURCE: U.S. Department of Education, National Center for Education Statistics, Monetary Incentives for Low-Stakes Tests, 2001.
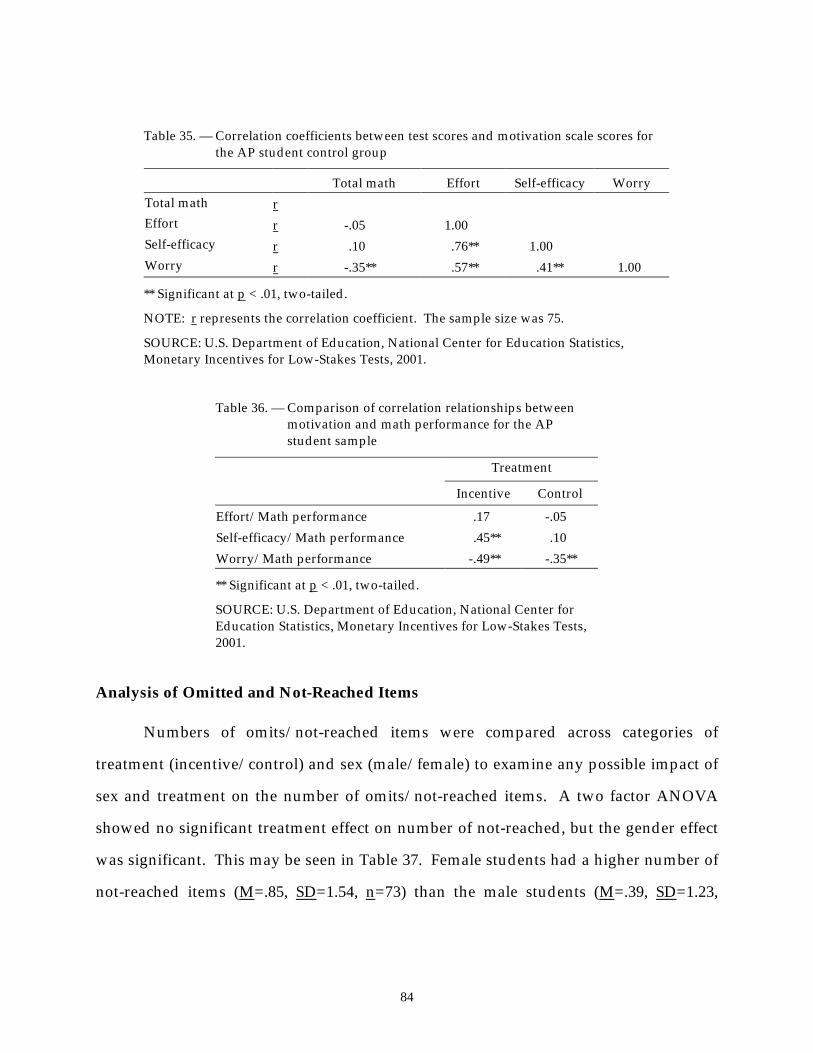
84
Table 35. — Correlation coefficients between test scores and motivation scale scores for the AP student control group
Total math Effort Self-efficacy Worry Total math r Effort r -.05 1.00 Self-efficacy r .10 .76** 1.00 Worry r -.35** .57** .41** 1.00
** Significant at p < .01, two-tailed.
NOTE: r represents the correlation coefficient. The sample size was 75.
SOURCE: U.S. Department of Education, National Center for Education Statistics, Monetary Incentives for Low-Stakes Tests, 2001.
Table 36. — Comparison of correlation relationships between motivation and math performance for the AP student sample
Treatment
Incentive Control
Effort/Math performance .17 -.05 Self-efficacy/Math performance .45** .10 Worry/Math performance -.49** -.35**
** Significant at p < .01, two-tailed.
SOURCE: U.S. Department of Education, National Center for Education Statistics, Monetary Incentives for Low-Stakes Tests, 2001.
Analysis of Omitted and Not-Reached Items
Numbers of omits/not-reached items were compared across categories of
treatment (incentive/control) and sex (male/female) to examine any possible impact of
sex and treatment on the number of omits/not-reached items. A two factor ANOVA
showed no significant treatment effect on number of not-reached, but the gender effect
was significant. This may be seen in Table 37. Female students had a higher number of
not-reached items (M=.85, SD=1.54, n=73) than the male students (M=.39, SD=1.23,
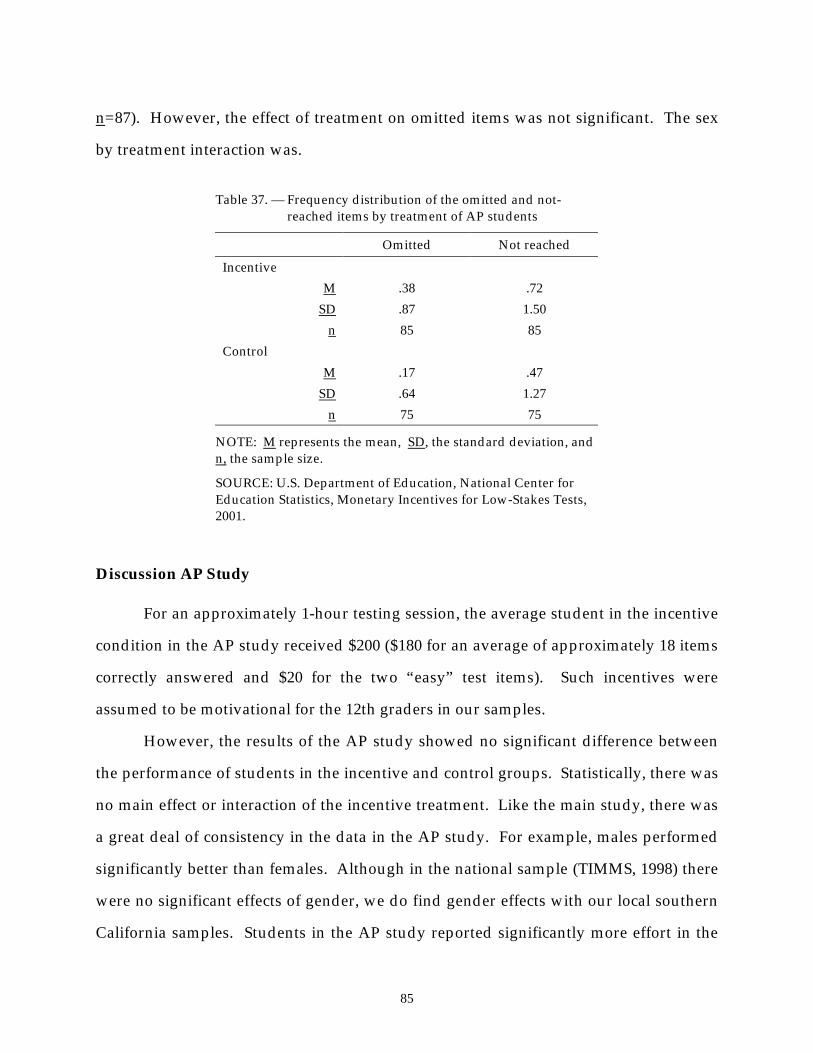
85
n=87). However, the effect of treatment on omitted items was not significant. The sex
by treatment interaction was.
Table 37. — Frequency distribution of the omitted and not-reached items by treatment of AP students
Omitted Not reached
Incentive M .38 .72
SD .87 1.50 n 85 85
Control M .17 .47
SD .64 1.27 n 75 75
NOTE: M represents the mean, SD, the standard deviation, and n, the sample size.
SOURCE: U.S. Department of Education, National Center for Education Statistics, Monetary Incentives for Low-Stakes Tests, 2001.
Discussion AP Study
For an approximately 1-hour testing session, the average student in the incentive
condition in the AP study received $200 ($180 for an average of approximately 18 items
correctly answered and $20 for the two “easy” test items). Such incentives were
assumed to be motivational for the 12th graders in our samples.
However, the results of the AP study showed no significant difference between
the performance of students in the incentive and control groups. Statistically, there was
no main effect or interaction of the incentive treatment. Like the main study, there was
a great deal of consistency in the data in the AP study. For example, males performed
significantly better than females. Although in the national sample (TIMMS, 1998) there
were no significant effects of gender, we do find gender effects with our local southern
California samples. Students in the AP study reported significantly more effort in the
86
incentive condition than in the control condition. The groups did not differ with respect
to self-efficacy and worry. Finally, self-efficacy and effort were positively related.
We also predicted, based on our prior National Assessment of Educational
Progress (NAEP) research and the main study, that the incentive condition should
result in higher self-reported effort. In turn, this increased effort should have resulted
in better math performance. So why did we not find a significant main effect of
treatment on math performance, given that there was a main effect of treatment on
effort in both the AP and main study? The major reason we felt was the lack of
relationship between self-reported effort and math achievement. Unexpectedly, for the
AP study, self-reported effort was not significantly related to math performance (i.e. r =
.007).
The lack of relationship between effort and math performance is puzzling. Like
the main study, the obvious explanatory candidates (e.g., poor reliability of the
measures) are not true. The alpha reliability of the effort scale is .87 in the AP study.
Further, the correlations between effort and self-efficacy and worry are significant in the
predicted directions for the AP study, indicating that other validity predictions
involving effort were consistent with our prior research and the literature.
We also had several other behavioral indicators that the students put effort into
other aspects of task performance, e.g., an indicator based on the number of checks
cashed by incentive participants. The reader may recall that since we had to score the
performance items and to minimize security concerns (cash in the hands of 12th
graders), we asked the students, before the math test, to fill out a form indicating where
we should send the money they would get for performing successfully on the math test.
The reader may also recall that for the AP study 85 students were assigned to the
incentive group for the final sample. An additional three students participated as
incentive group participants, but their data was dropped from the final sample due to
an administrative error. However, they were still compensated for being incentive
87
group participants. In total, 88 check request forms were completed by incentive group
participants. In most cases checks were issued and cleared the bank. Thus, students in
the incentive condition were motivated to expend effort to correctly fill out the forms in
the student test booklet to obtain the money.
Other behavioral information seems to indicate that our oral and written
instructions resulted in students paying attention to our instructions on math items in
general. For example, the two “easy items” were also completed without error for all
incentive and control group participants, indicating that the experimental controls (e.g.,
for believability) were effective.
With respect to our other major experimental control, i.e., oral instructions to
ensure participants would remember the treatment group they were in, we were more
successful in the AP study than in the main study. In general, for students in the AP
study, none of the students in the control group thought they would receive money for
items correct. Moreover, 72 out of 85 incentive group students (85%) correctly
identified their experimental condition. Thus, in the AP study, combining oral and
written instructions was as effective as we hoped, when compared to written
instructions in the earlier NAEP study.
Our chain of logic was that the money would be an incentive to increase effort
for those with high prior knowledge and would therefore improve math performance.
The average of approximately 18 correct was more than double the performance of the
non-AP main study students on the same test. Thus, even with high prior knowledge,
there was no sign significant effect effort of treatment. We succeeded in increasing
effort (measured by self-report and number of checks that cleared), but the incentive
condition did not facilitated math performance.
Presumably, since the incentive condition increased effort in the AP study, if self-
reported effort were related to performance, then the incentive condition would have
increased math performance. In summary, effort was not related to performance, and
88
the conclusion for this AP study is that a monetary incentive did not increase math
performance on a set of TIMMS released math items for AP students.
89
Overall Discussion
Recent information in the 1990’s on international assessments (e.g., the Third
International Mathematics and Science Study, or TIMSS) indicates that 12th-grade
students in the United States are doing extremely poorly on such assessments compared
with their peers in other countries (TIMSS, 1998). Similarly, many 12th-grade students
are doing poorly on the National Assessment of Educational Progress (NAEP). In such
tasks and assessments, in almost all cases, U.S. 12th-grade students perform relatively
more poorly than 8th-grade students. For example, in TIMSS, 12th-grade students are
below the international average whereas 8th-grade students are at the international
average.
These poor results are usually attributed to cognitive factors such as students’
opportunities to learn, teachers’ lack of professional preparation, etc. However, a
partial explanation of these results may be motivational. Because the low-stakes (for
students) tests were administered late in these 12th-graders’ final year in high school,
the timing may have negatively affected motivation, and thus performance. This
phenomenon has been labeled “senioritis.” For the high school senior going into the
world of work or on to post-secondary education, tests like TIMSS are clearly low
stakes. Thus, one of the major questions about these tests concerns the possible impact
of motivational factors on the results. If students are not motivated to perform well on
low-stakes tests, then the results may underestimate what students could do if they
gave these assessments their best effort.
Our basic approach was to provide a sufficient monetary incentive to maximize
student effort and therefore increase performance. We expected that we could
stimulate a 0.5 standard deviation increase in performance due to such incentives. Our
results will not generalize, without additional research, to either TIMSS or NAEP.
90
Further, our results will not generalize to the impact of motivation variables (e.g., effort,
self-efficacy) on the teaching and learning of math. However, we expected our results
to constitute a proof of concept of the importance of manipulating motivation in low-
stakes assessments for 12th graders.
We have promising results based on our prior NAEP motivation research
sponsored by the National Assessment Governing Board (NAGB), and the Office of
Educational Research and Improvement (OERI), National Center for Education
Statistics (NCES). We hypothesized that the incentives would increase effort, which
along with prior knowledge, would improve performance. The effective incentive in
this earlier study was money. In the study (O’Neil, et al., 1992), we manipulated
various incentives (money, task, ego, standard NAEP instructions) for 8th- and 12th-
grade samples of students of various ethnicities (White, Black, Hispanic, and Asian
American).
In general, only the money incentive worked in the 8th grade. The results
showed, in the best case, that the money incentive was effective for a subsample of the
8th-grade students (those who remembered their incentive/treatment group) with easy-
and medium-difficulty items. With respect to item difficulty results, because the
motivational effect was at test time, it was not expected that this increased effort would
improve performance on hard items, because students did not know the content. With
respect to remembering one’s treatment group, presumably if one doesn’t remember the
incentive (money), then one would not increase one’s effort, and thus performance.
However, no incentives were effective for 12th-grade students, even those who
remembered their treatment. The executive summary from this study can be found in
Appendix A.
We hypothesized that in our prior study, the lack of effect for 12th graders was
because (a) the amount of money ($1.00 per item) was not large enough for 12th
graders, and further (b) many 12th graders did not believe they would get the money.

91
Our approach for the current study consisted of manipulating the amount of
money per item correct so as to increase the motivational effect and thus increase
performance. The amount of money given per correct item was either $0 (low-stakes
administration, e.g., TIMSS) or $10 per item correct (which we expected to be effective).
The incentive group was compared with a group receiving standard low-stakes TIMSS
instructions. Consistent with our prior NAEP study, we also collected information on
effort, self-efficacy, and worry. For our assessment we used the released TIMSS math
literacy scale items. This set of items included both multiple-choice and free-response
items.
We hypothesized that students receiving $10 per item correct would perform
significantly higher in math than those who were not receiving any monetary incentive
(the control group). Such students would also exhibit higher effort and self-efficacy but
less worry than control group participants. Our approach consisted of manipulating
the amount of money per item correct so as to increase effort and thus increase math
performance. In general, we expected overall anxiety levels to be low given the low-
stakes nature of the test.
This investigation with 12th graders included a focus group study, a pilot study,
a main study, and a supplementary study with Advanced Placement (AP) students in
mathematics. This latter group was called the AP study. In the focus group study we
explored various levels of incentives. This research is documented in Mastergeorge
(1999). Parents and students who participated in the focus groups suggested that $5 to
$10 per item correct would provide enough motivation for students in Grade 12 to work
harder on math test items. Based on these findings, in the present investigation we
offered students $10 per item correct to find out whether students’ performance on the
selected math items could be increased under such a high-stakes testing condition. We
then compared the performance of students receiving $10 per item correct with the
92
performance of students who responded to the same set of items with no monetary
incentive.
A total of 725 students participated in the pilot, main, and AP studies. There
were 144 students in the pilot study, 415 students in the main study, and 166 students in
the AP study. For the pilot, main, and AP studies, students were selected from 23
different schools (5 schools in the pilot study, 9 schools in the main study, and 9 schools
in the AP study) from southern California school districts in different locations. These
schools had different demographics and different levels of overall student performance.
Following the focus group study, we conducted the pilot study. The purpose of
the pilot study was to test design issues, examine the accuracy and language of the
instruments, and resolve logistical problems. The results of the pilot study helped us to
refine the instruments and to modify the design. We then conducted the main study
and the AP study.
For an approximately one-hour testing session, the average student in the
incentive condition in the main study received $100 ($80 for an average of 7.96 items
correctly answered and $20 for the two “easy” test items). In the AP study, the average
student received $200. Such incentives were assumed to be motivational for the 12th
graders in our samples. However, the results of the main and AP studies showed no
significant difference between the performance of students in the incentive and control
groups. Statistically, there was no main effect of the incentive treatment. However, in
the main study there was a complex interaction between treatment, sex, and booklet.
However, post hoc comparisons indicated that although the overall interaction was
significant, none of the comparisons of appropriate means were statistically significant.
Thus, we chose to be conservative and not to interpret this interaction as supporting our
major hypothesis. Further, the results of the AP study also did not support the major
hypothesis. The total number of students in the main study was 393 after excluding
students with incomplete data. This number became small when divided into
93
subgroups by the levels of independent variables such as sex, test form, and treatment.
Due to a small number of subjects, for some of the analyses, there was not enough
power to detect a significant difference, even when the difference was relatively large.
However there was a sufficient number of students in both the main study sample and
the AP study to detect a reasonable main effect for the incentive treatment.
There was a great deal of consistency in the data in both the main and AP study.
For example, males performed significantly better than females in both the main study
and the AP study. These results were expected as the task was mathematics, and with
our local samples we consistently find gender effects on math tests. Although in the
national sample (TIMSS, 1998) there were no significant effects of sex, we find gender
effects with our local southern California samples. Students in both the main study and
the AP study reported significantly more effort in the incentive condition than in the
control condition. Finally, in both studies self-efficacy and effort were positively
related. These latter results make theoretical sense, as Bandura (1986, 1993, 1997) would
predict that higher levels of self-efficacy should lead to higher levels of effort.
We also predicted, based on our prior NAEP research that the incentive
condition should result in higher effort. In both the main and AP studies we found that
students in the incentive group had significantly higher effort than students did in the
control group. In turn, this increased effort should have resulted in better math
performance. So why did we not find a significant main effect of treatment on math
performance, given that there was a main effect of treatment on effort? The major
reason we felt was the lack of relationship between self-reported effort and math
achievement. Unexpectedly, for both the main and AP studies, self-reported effort was
not significantly related to math performance (e.g., r = .007 in the AP study). With
respect to effort, the research literature and our own research using the same measures
indicate that the relationship would be positive (i.e., higher effort leads to better
performance). Not surprisingly, we are puzzled by such findings. The obvious next
94
step is to conduct a series of focus groups and cognitive laboratory approaches to better
understand these issues. There was an not issue of enough time to complete this test,
given the number of not-reached items was very low, indicating that students had
sufficient time to complete almost all items on the test. Further, there were few items
omitted in either study. The not-reached and omitted information clearly indicates that
students had sufficient time to complete the test. Thus our set of items clearly
constituted a power, not a speed test. Further, for the total math correct, there was no
ceiling. In the main study, the mean was 7.96 (SD 3.79) out of a possible 24 points (20
items with a few extended response items getting 2 possible maximum points). For the
AP study, the mean was 17.95 (SD = 4.14) out of 24 possible points (same test as the
main study).
There are a couple issues that speaks to our location in Los Angeles. One way in
which the sample of students used in this study is not a representative sample of all the
students in the United States is that so many of them are from families that do not speak
English at home. Well over half never speak English at home, while less than 15
percent only speak English at home. The high non-English language background of the
sample limits generalizing the findings. Findings should be interpreted in light of this
caution. It may also be that race-ethnicity composition is not representative of the
United States as a whole. We do not know the racial-ethnic background of the students
as we did not request it.
In summary, effort was not related to performance, and the conclusion for this
set of studies is that a strong monetary incentive did not increase math performance on
a set of TIMSS released math items with local English Language Learners from samples
of convenience. Further, the inability to find few motivational effects, despite a strong
incentive, random assignment (with equivalence on background characteristics), tests of
high and low performing students, and elimination of non-accurate recall cases, is quite
compelling. It raises some fundamental questions about previous assumptions made
95
about the motivation effect on test performance and we think that factors in addition to
motivation are coming into play. We believe that there is a senioritis effect, but
understanding its specific motivational effect on test performance and its amelioration
awaits future research. However the high non-English language background of the
sample limits generalizing the findings and these findings should be interpreted in light
of this caution.

97
References
Bandura, A. (1986). Social foundations of thought and action: a social cognitive theory. Englewood Cliffs, NJ: Prentice Hall.
Bandura, A. (1993). Perceived self-efficacy in cognitive development and functioning. Educational Psychologist, 28(2), 117-148.
Bandura, A. (1997). Self-efficacy: the exercise of control. New York: Freeman.
Cronbach, L. J. (1951). Coefficient alpha and the internal structure of tests. Psychometrika, 16, 297-334.
Deci, E. L., Koestner, R., & Ryan, R.M. (1999). A meta-analytic review of experiments examining the effects of extrinsic rewards on intrinsic motivation. Psychological Bulletin, 125, 627-668
Harmon, M., Smith, T. A., Martin, M. O., Kelly, D. L., Beaton, A. E., Mullis, I. V. S., Gonzalez, E. J., & Orpwood, G. (1997). Performance assessment in IEA’s Third International Mathematics and Science Study (TIMSS). Chestnut Hill, MA: Boston College, TIMSS Intenational Study Center.
Malpass, J. R., O’Neil, H. F., Jr., & Hocevar, D. (1999). Self-regulation, goal orientation, self-efficacy, worry, and high-stakes math achievement for mathematically gifted high school students. Roeper Review, 21, 281-188.
Mastergeorge, A. (1999, June). Focus groups on motivational incentives for low-stakes tests with senior high school students and their parents (Report to AIR/ESSI). Los Angeles: University of California, Center for Research on Evaluation, Standards, and Student Testing.
McMillan, J. H., & Schumacher, S. (1997). Research in education (4th ed.). New York: Longman.
O’Neil, H. F., Jr., & Abedi, J. (1996). Reliability and validity of a state meta-cognitive inventory: Potential for alternative assessment. Journal of Educational Research, 89, 234-245.
O’Neil, H. F., Jr., Abedi, J., Lee, C.-L., Miyoshi, J., & Mastergeorge, A. (2000). Motivational incentives for low-stakes tests (Draft final report to NCES, contract # RN95127001, Task Order 1.2.93.1). Los Angeles: University of California, Center for Research on Evaluation, Standards, and Student Testing.
98
O’Neil, H. F., Jr., & Herl, H. E. (1998, April). Reliability and validity of a trait measure of self-regulation. Presented at the annual meeting of the American Educational Research Association, San Diego, CA.
O’Neil, H. F., Jr., Sugrue, B., Abedi, J., Baker, E. L., & Golan, S. (1992). Final report of experimental studies on motivation and NAEP test performance (Report to NCES, Grant # RS90159001). Los Angeles: University of California, Center for Research on Evaluation, Standards, and Student Testing.
O’Neil, H. F., Jr., Sugrue, B., Abedi, J., Baker, E. L., & Golan, S. (1997). Final report of experimental studies on motivation and NAEP test performance (CSE Tech. Rep. No. 427). Los Angeles: University of California, Center for Research on Evaluation, Standards, and Student Testing.
O’Neil, H. F., Jr., Sugrue, B., & Baker, E. L. (1996). Effects of motivational interventions on the National Assessment of Educational Progress mathematics performance. Educational Assessment, 3, 135-157.
Pintrich, P.R., & De Groot, E. V. (1990). Motivational and self-regulated learning components of classroom academic performance. Journal of Educational Psychology, 82, 33-40.
Pintrich, P. R. (2000). Multiple goals, multiple pathways: The role of goal orientation in learning and achievement. Journal of Educational Psychology, 92, 544-555.
Pintrich, P. R., Smith, D. A. F., Garcia, T., & McKeachie, W. J. (1991). A manual for the use of the Motivated Strategies For Learning Questionnaire (Tech. Rep. No. 91-B-004). Ann Arbor: University of Michigan, National Center for Research to Improve Postsecondary Teaching and Learning.
Spielberger, C. D. (1975). Anxiety: State-trait process. In C. D. Spielberger & I. G. Sarason (Eds.), Stress and anxiety (Vol. 1, pp. 115-143). Washington, DC: Hemisphere.
Third International Mathematics and Science Study. (1997, September). Performance assessment in IEA's third international mathematics and science study (TIMSS). International Association for the Evaluation of Educational Achievement.
Third International Mathematics and Science Study. (1998). Pursuing excellence: a study of U.S. twelfth-grade mathematics and science achievement in international context. (Rept. No. NCES 98-049). Office of Educational Research and Improvement: U.S. Department of Education.
99
Third International Mathematics and Science Study. (2000). TIMSS released item set for the final year of secondary school. Available 11 July 2000, http://timss.bc.edu/TIMSS1/TIMSSPDF/C_items.pdf
Wang, S.-L., & O’Neil, H. F., Jr. (2000). Role of motivational beliefs on students’ achievement in Taiwan. Manuscript submitted for publication. Los Angeles, University of Southern California, Rossier School of Education.
Wigfield, A., & Eccles, J. (2000). Expectancy-value theory of achievement motivation. Contemporary Educational Psychology, 25, 68-81.

Appendix A
Executive Summary of O’Neil, Sugrue, Abedi, Baker & Golan, 1997

1A -
Executive Summary (O’Neil et al., 1997)
Final Report of Experimental Studieson Motivation and NAEP Test Performance
EXECUTIVE SUMMARY
Harold F. O’Neil, Jr., CRESST/University of Southern CaliforniaBrenda Sugrue, CRESST/University of California, Los Angeles
Jamal Abedi, CRESST/University of California, Los AngelesEva L. Baker, CRESST/University of California, Los AngelesShari Golan, CRESST/University of California, Los Angeles
Introduction
The Cognitive Science Laboratory of the University of Southern Californiahas a subcontract with the Center for Research on Evaluation, Standards, andStudent Testing (CRESST) at the University of California, Los Angeles, to assistin the research on the experimental effects of motivation on the NationalAssessment of Educational Progress (NAEP). The University of Colorado/CRESST has conducted a study on embedded NAEP tests in a state assessment.In turn, CRESST/UCLA has an existing contract from the National Center forEducation Statistics (NCES) to conduct validity studies on NAEP. CRESST/UCLA areas of interest include both assessment and policy issues. The purposeof this report (the Final Report on our USC subcontract) is to document a seriesof collaborative studies on the experimental effects of motivation on a low-stakes(to the student) standardized test.
The Research Question
One of the major validity questions that has been raised in relation to theNational Assessment of Educational Progress (NAEP) concerns the possibleimpact of motivational factors on the NAEP results. If students are notmotivated to perform well on NAEP tests, and if the lack of motivation results inpoor performance, then NAEP findings are underestimates of studentachievement.
The possibility that NAEP underestimates what students could do if theygave the assessment their best effort has been a concern for some time. Shanker(1990), for example, noted that “one of the most frequently offered theories aboutthe low NAEP scores is that kids know the tests don’t count” and therefore “maydecide it’s not worth their while to put forth any effort.” He went on to arguethat because of the importance of NAEP as a source of information about studentachievement, “we ought to clear up this question about its validity.” Responsesto the NAEP mathematics field test questions (Educational Testing Service, 1991)also indicate the need to investigate effort in the context of low-stakes NAEPtesting. When asked, “How hard did you try on this test?” 28% of 8th gradersresponded “Somewhat hard” or “Not at all hard,” whereas 51% of 12th gradersanswered in this manner. Similarly, when asked, “How important was it for you
2A -
to do well on this test?” 36% of 8th graders responded “Somewhat important” or“Not very important,” whereas 62% of 12th graders gave this response.
The Studies
To test the theory that increased motivation to perform well on a NAEPtest would be reflected in increased effort and improved performance on the test,a series of studies was conducted in 1992 by UCLA’s Center for the Study ofEvaluation and its National Center for Research on Evaluation, Standards, andStudent Testing (CRESST). The studies investigated the effects of variousmotivational conditions on the performance of 8th- and 12th-grade students on asubset of released items from the 1990 NAEP mathematics test.
Mathematics was selected because it is a content area that many studentsnot only find difficult but also dislike, want to avoid, or feel anxious about. Inaddition, mathematics is an area that has been singled out for special attention byits choice as the first content domain in the NAEP Trial State Assessment and forthe assessment of the President’s and Governors’ National Education Goals.
The studies were conducted at two grade levels, 8 and 12. Grade 12 wasselected because it is the grade where concerns about motivation are mostserious. We did not want to limit the study to that grade, however, becausenegative effects of low motivation observed at Grade 12, if any, might notgeneralize to other grades. Therefore, we thought it important to replicate thestudies at a second grade level. At Grade 8, it would be possible to implementsome sort of remediation, if desired.
In order to link any observed performance differences to differentialinvestment of effort or to differences in metacognition, anxiety, and perceivedability, these variables were measured via a modified self-assessmentquestionnaire (O’Neil, Baker, Jacoby, Ni, & Wittrock, 1990) The history of thedevelopment and validation of this instrument is described in detail later in thisreport.
It was reasoned that the motivational treatments might have differenteffects on subgroups of students whose performance on NAEP mathematics testscurrently differs. Therefore, the studies investigated possible differential effectsof the motivational conditions on the performance, and perceived effort,metacognition, mathematics ability, and anxiety of male and female studentswith different ethnic backgrounds (White, African American, Latino, Asian).
A number of pilot studies were conducted to select the motivationalconditions that might influence test performance. (Each of these is described indetail later in the report.) An initial “focus-group study” revealed that both 8th-and 12th-grade students would be motivated by financial rewards to try harderon tests. A second pilot study compared the performance of 8th- and 12th-gradestudents who received three different financial rewards (or no reward). Thestudy yielded no differences among test scores of 8th- or 12th-grade studentswho received any of three financial incentives and students who received
3A -
standard NAEP test instructions. Based on previous research and on our feelingthat 50 cents per item might not be enough to motivate Los Angeles teenagers, afinancial incentive condition offering a larger reward of $1 per correct item wasincluded in the main study.
A third pilot study investigated the differential effects of various goalorientation conditions. One group of students was told that the goal of the testwas to provide a personal challenge and accomplishment (task-oriented goal); asecond group was told that the goal was to compare their mathematical abilitywith that of other students (competitive or ego-oriented goal); a third group wastold that the goal of the test was to evaluate the effectiveness of their teachers(teacher-oriented goal); a fourth group in this pilot study got the standard NAEPtest instructions. Eighth-grade students (in classes tested first) who were toldthat the goal was to compare their mathematics ability with that of othersobtained higher scores than 8th-grade students who received standard NAEPinstructions. However, because this finding was inconsistent with previousresearch on the relationship of goal orientation and performance (see ourliterature review), both the personal accomplishment goal and the competitivegoal were retained as motivational conditions in the main study.
The main study compared the effects of three experimental motivationalconditions (financial reward, competition, personal accomplishment) andstandard NAEP test instructions on the mathematics performance of 8th- and12th-grade students. In addition, for 12th-grade students, a fifth condition wasadded: Students were offered a certificate of accomplishment if they scored in thetop 10% of their class. The results indicated that the offer of a financial rewardcan improve the performance of 8th-grade students. The 8th-grade students whowere offered a financial reward also reported investing more effort during thetest than did 8th-grade students who received the standard NAEP testinstructions. Goal orientation manipulations did not result in significantdifferences on any outcome variable. In 12th grade, no differences wereobserved in test performance among students who were exposed to the differentmotivational conditions. However, 12th-grade students who were offered thefinancial reward reported more metacognitive activity during the test.Treatment did not interact with ethnicity or gender in its effect on any outcomevariable in either 8th or 12th grade.The Implications
The 8th-grade findings indicate that, indeed, we may be underestimatingthe achievement of students when we use scores on “low-stakes” tests as theindicators of achievement. While offering all students a financial reward forperformance on such tests is not practical, there may be other ways of rewardingstudents for high achievement on such tests that would lead them to invest theirmaximum effort.

Appendix B
Focus Group Consent Forms

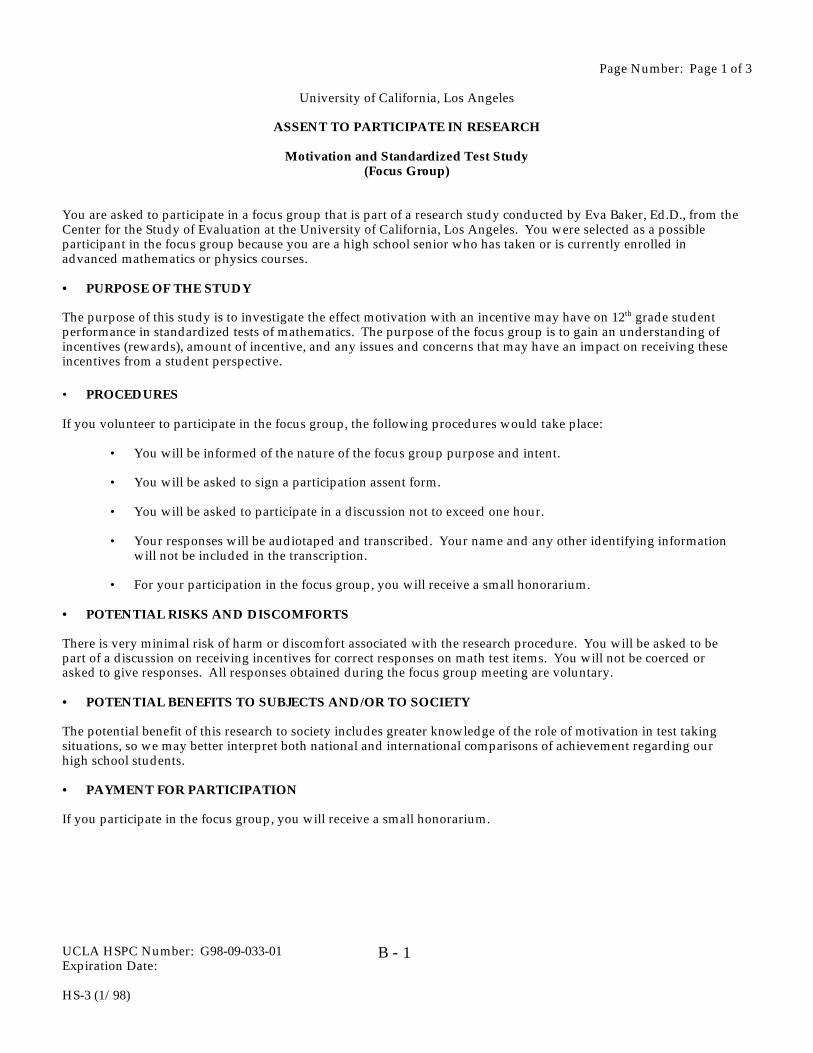
UCLA HSPC Number: G98-09-033-01Expiration Date:
HS-3 (1/98)
1B -
Page Number: Page 1 of 3
University of California, Los Angeles
ASSENT TO PARTICIPATE IN RESEARCH
Motivation and Standardized Test Study(Focus Group)
You are asked to participate in a focus group that is part of a research study conducted by Eva Baker, Ed.D., from theCenter for the Study of Evaluation at the University of California, Los Angeles. You were selected as a possibleparticipant in the focus group because you are a high school senior who has taken or is currently enrolled inadvanced mathematics or physics courses.
• PURPOSE OF THE STUDY The purpose of this study is to investigate the effect motivation with an incentive may have on 12th grade studentperformance in standardized tests of mathematics. The purpose of the focus group is to gain an understanding ofincentives (rewards), amount of incentive, and any issues and concerns that may have an impact on receiving theseincentives from a student perspective. • PROCEDURES If you volunteer to participate in the focus group, the following procedures would take place:
• You will be informed of the nature of the focus group purpose and intent. • You will be asked to sign a participation assent form. • You will be asked to participate in a discussion not to exceed one hour. • Your responses will be audiotaped and transcribed. Your name and any other identifying information
will not be included in the transcription. • For your participation in the focus group, you will receive a small honorarium.
• POTENTIAL RISKS AND DISCOMFORTS There is very minimal risk of harm or discomfort associated with the research procedure. You will be asked to bepart of a discussion on receiving incentives for correct responses on math test items. You will not be coerced orasked to give responses. All responses obtained during the focus group meeting are voluntary. • POTENTIAL BENEFITS TO SUBJECTS AND/OR TO SOCIETY The potential benefit of this research to society includes greater knowledge of the role of motivation in test takingsituations, so we may better interpret both national and international comparisons of achievement regarding ourhigh school students. • PAYMENT FOR PARTICIPATION If you participate in the focus group, you will receive a small honorarium.

UCLA HSPC Number: G98-09-033-01Expiration Date:
HS-3 (1/98)
2B -
Page Number: Page 2 of 3
• CONFIDENTIALITY Any information that is obtained in connection with this focus group and is identified with you will remainconfidential and will be disclosed only with your permission or as required by law. • PARTICIPATION AND WITHDRAWAL You can choose whether to be in the focus group or not. If you volunteer to be in the focus group, you maywithdraw at any time without consequences of any kind. You may also refuse to answer any questions you don'twant to answer and still remain in the focus group. The investigator may withdraw you from this research ifcircumstances arise which warrant doing so. • IDENTIFICATION OF INVESTIGATORS If you have any questions or concerns about the research or participation in the focus group, please feel free tocontact Dr. Jamal Abedi at the Center for the Study of Evaluation on the campus of UCLA, at 310-206-4346, or Dr.Eva Baker, also at the Center for the Study of Evaluation on the campus of UCLA, at 310-206-1532. • RIGHTS OF RESEARCH SUBJECTS You may withdraw your assent at any time and discontinue participation without penalty. You are not waving anylegal claims, rights or remedies because of your participation in this research study. If you have questions regardingyour rights as a research subject, contact the Office for Protection of Research Subjects, 2107 Ueberroth Building,UCLA. Box 951694, Los Angeles, CA 90095-1694, (310) 825-8714.
UCLA HSPC Number: G98-09-033-01Expiration Date:
HS-3 (1/98)
3B -
Page Number: Page 3 of 3
SIGNATURE OF RESEARCH SUBJECT OR LEGAL REPRESENTATIVE PLEASE READ CAREFULLY AND CHECK ONE BOX: r I understand the procedures described above, and that this study is a project of UCLA and that it is not
sponsored or funded by XXX. My questions have been answered to my satisfaction, and I AGREE toparticipate in this focus group. I have been given a copy of this form.
r I understand the procedures described above, and that this study is a project of UCLA and that it is not
sponsored or funded by XXX. My questions have been answered to my satisfaction, and I DO NOT AGREEto participate in this focus group. I have been given a copy of this form.
Name of Subject Date Signature for Adolescent Assent
SIGNATURE OF INVESTIGATOR (If required by the HSPC.) In my judgment the subject is voluntarily and knowingly giving informed assent and possesses the legal capacity togive informed assent to participate in this research study. Signature of Investigator Date
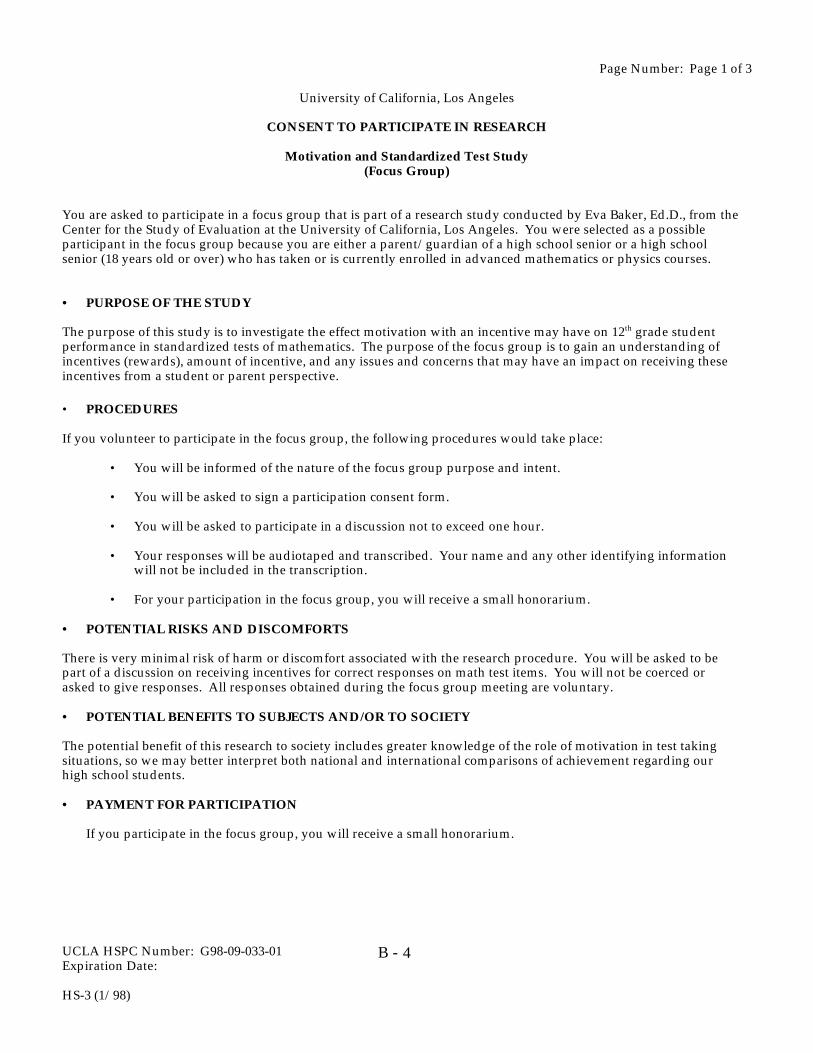
UCLA HSPC Number: G98-09-033-01Expiration Date:
HS-3 (1/98)
4B -
Page Number: Page 1 of 3
University of California, Los Angeles
CONSENT TO PARTICIPATE IN RESEARCH
Motivation and Standardized Test Study(Focus Group)
You are asked to participate in a focus group that is part of a research study conducted by Eva Baker, Ed.D., from theCenter for the Study of Evaluation at the University of California, Los Angeles. You were selected as a possibleparticipant in the focus group because you are either a parent/guardian of a high school senior or a high schoolsenior (18 years old or over) who has taken or is currently enrolled in advanced mathematics or physics courses.
• PURPOSE OF THE STUDY The purpose of this study is to investigate the effect motivation with an incentive may have on 12th grade studentperformance in standardized tests of mathematics. The purpose of the focus group is to gain an understanding ofincentives (rewards), amount of incentive, and any issues and concerns that may have an impact on receiving theseincentives from a student or parent perspective. • PROCEDURES If you volunteer to participate in the focus group, the following procedures would take place:
• You will be informed of the nature of the focus group purpose and intent. • You will be asked to sign a participation consent form. • You will be asked to participate in a discussion not to exceed one hour. • Your responses will be audiotaped and transcribed. Your name and any other identifying information
will not be included in the transcription. • For your participation in the focus group, you will receive a small honorarium.
• POTENTIAL RISKS AND DISCOMFORTS There is very minimal risk of harm or discomfort associated with the research procedure. You will be asked to bepart of a discussion on receiving incentives for correct responses on math test items. You will not be coerced orasked to give responses. All responses obtained during the focus group meeting are voluntary. • POTENTIAL BENEFITS TO SUBJECTS AND/OR TO SOCIETY The potential benefit of this research to society includes greater knowledge of the role of motivation in test takingsituations, so we may better interpret both national and international comparisons of achievement regarding ourhigh school students. • PAYMENT FOR PARTICIPATION
If you participate in the focus group, you will receive a small honorarium.
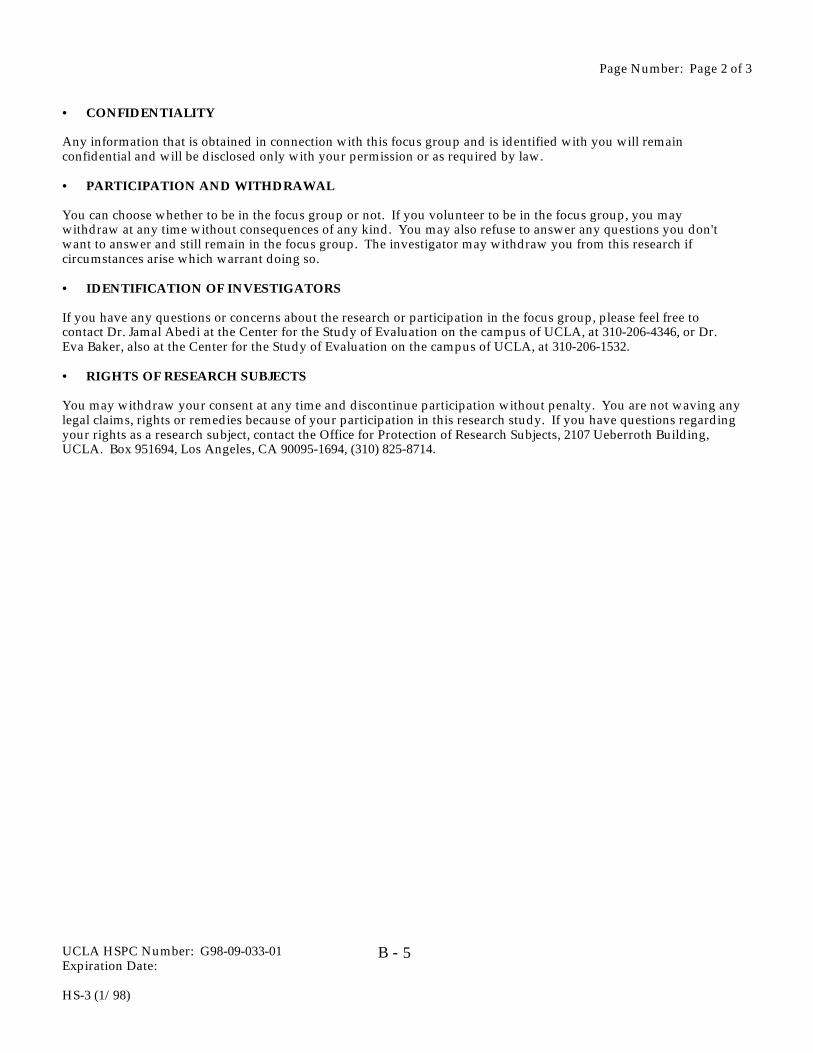
UCLA HSPC Number: G98-09-033-01Expiration Date:
HS-3 (1/98)
5B -
Page Number: Page 2 of 3
• CONFIDENTIALITY Any information that is obtained in connection with this focus group and is identified with you will remainconfidential and will be disclosed only with your permission or as required by law. • PARTICIPATION AND WITHDRAWAL You can choose whether to be in the focus group or not. If you volunteer to be in the focus group, you maywithdraw at any time without consequences of any kind. You may also refuse to answer any questions you don'twant to answer and still remain in the focus group. The investigator may withdraw you from this research ifcircumstances arise which warrant doing so. • IDENTIFICATION OF INVESTIGATORS If you have any questions or concerns about the research or participation in the focus group, please feel free tocontact Dr. Jamal Abedi at the Center for the Study of Evaluation on the campus of UCLA, at 310-206-4346, or Dr.Eva Baker, also at the Center for the Study of Evaluation on the campus of UCLA, at 310-206-1532. • RIGHTS OF RESEARCH SUBJECTS You may withdraw your consent at any time and discontinue participation without penalty. You are not waving anylegal claims, rights or remedies because of your participation in this research study. If you have questions regardingyour rights as a research subject, contact the Office for Protection of Research Subjects, 2107 Ueberroth Building,UCLA. Box 951694, Los Angeles, CA 90095-1694, (310) 825-8714.
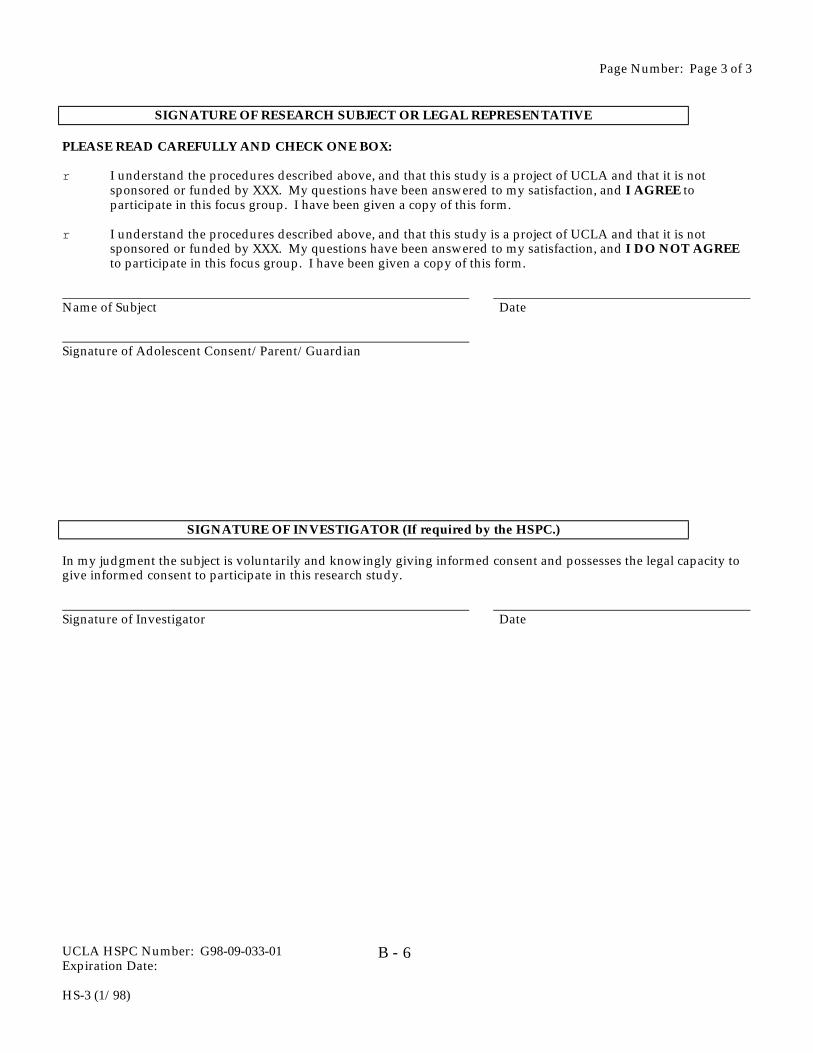
UCLA HSPC Number: G98-09-033-01Expiration Date:
HS-3 (1/98)
6B -
Page Number: Page 3 of 3
SIGNATURE OF RESEARCH SUBJECT OR LEGAL REPRESENTATIVE PLEASE READ CAREFULLY AND CHECK ONE BOX: r I understand the procedures described above, and that this study is a project of UCLA and that it is not
sponsored or funded by XXX. My questions have been answered to my satisfaction, and I AGREE toparticipate in this focus group. I have been given a copy of this form.
r I understand the procedures described above, and that this study is a project of UCLA and that it is not
sponsored or funded by XXX. My questions have been answered to my satisfaction, and I DO NOT AGREEto participate in this focus group. I have been given a copy of this form.
Name of Subject Date Signature of Adolescent Consent/Parent/Guardian
SIGNATURE OF INVESTIGATOR (If required by the HSPC.) In my judgment the subject is voluntarily and knowingly giving informed consent and possesses the legal capacity togive informed consent to participate in this research study. Signature of Investigator Date
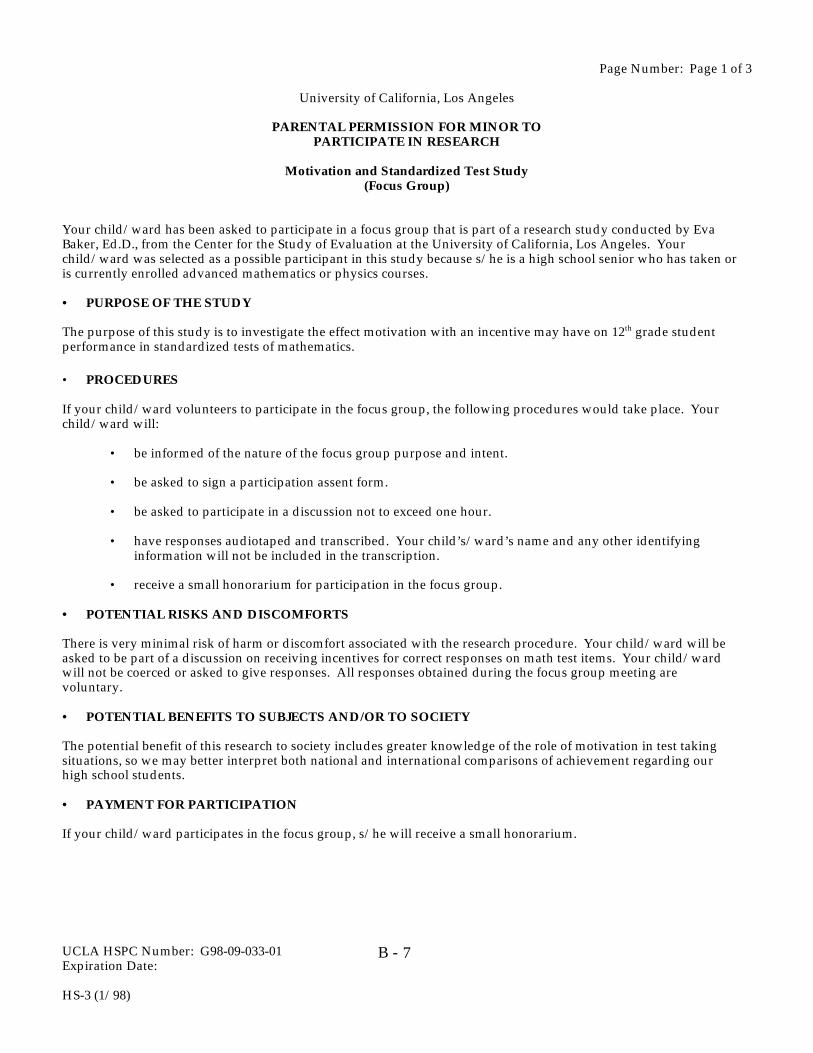
UCLA HSPC Number: G98-09-033-01Expiration Date:
HS-3 (1/98)
7B -
Page Number: Page 1 of 3
University of California, Los Angeles
PARENTAL PERMISSION FOR MINOR TOPARTICIPATE IN RESEARCH
Motivation and Standardized Test Study
(Focus Group) Your child/ward has been asked to participate in a focus group that is part of a research study conducted by EvaBaker, Ed.D., from the Center for the Study of Evaluation at the University of California, Los Angeles. Yourchild/ward was selected as a possible participant in this study because s/he is a high school senior who has taken oris currently enrolled advanced mathematics or physics courses. • PURPOSE OF THE STUDY The purpose of this study is to investigate the effect motivation with an incentive may have on 12th grade studentperformance in standardized tests of mathematics. • PROCEDURES If your child/ward volunteers to participate in the focus group, the following procedures would take place. Yourchild/ward will:
• be informed of the nature of the focus group purpose and intent. • be asked to sign a participation assent form. • be asked to participate in a discussion not to exceed one hour. • have responses audiotaped and transcribed. Your child’s/ward’s name and any other identifying
information will not be included in the transcription. • receive a small honorarium for participation in the focus group.
• POTENTIAL RISKS AND DISCOMFORTS There is very minimal risk of harm or discomfort associated with the research procedure. Your child/ward will beasked to be part of a discussion on receiving incentives for correct responses on math test items. Your child/wardwill not be coerced or asked to give responses. All responses obtained during the focus group meeting arevoluntary. • POTENTIAL BENEFITS TO SUBJECTS AND/OR TO SOCIETY The potential benefit of this research to society includes greater knowledge of the role of motivation in test takingsituations, so we may better interpret both national and international comparisons of achievement regarding ourhigh school students. • PAYMENT FOR PARTICIPATION If your child/ward participates in the focus group, s/he will receive a small honorarium.
UCLA HSPC Number: G98-09-033-01Expiration Date:
HS-3 (1/98)
8B -
Page Number: Page 2 of 3 • CONFIDENTIALITY Any information that is obtained in connection with this focus group and is identified with your child/ward willremain confidential and will be disclosed only with your permission or as required by law. • PARTICIPATION AND WITHDRAWAL Your child/ward can choose whether to be in the focus group or not. If s/he volunteers to be in the focus group,s/he may withdraw at any time without consequences of any kind. Your child/ward may also refuse to answer anyquestions s/he doesn’t want to answer and still remain in the study. The investigator may withdraw yourchild/ward from this research if circumstances arise which warrant doing so. • IDENTIFICATION OF INVESTIGATORS If you have any questions or concerns about the focus group or the research, please feel free to contact Dr. JamalAbedi at the Center for the Study of Evaluation on the campus of UCLA, at 310-206-4346, or Dr. Eva Baker, also atthe Center for the Study of Evaluation on the campus of UCLA, at 310-206-1532. • RIGHTS OF RESEARCH SUBJECTS
Your child/ward may withdraw her/his assent at any time and discontinue participation without penalty. Yourchild/ward is not waving any legal claims, rights or remedies because of his/her participation in this research study.If your child/ward has questions regarding his/her rights as a research subject, contact the Office for Protection ofResearch Subjects, 2107 Ueberroth Building, UCLA. Box 951694, Los Angeles, CA 90095-1694, (310) 825-8714.
UCLA HSPC Number: G98-09-033-01Expiration Date:
HS-3 (1/98)
9B -
Page Number: Page 3 of 3
SIGNATURE OF RESEARCH SUBJECT OR LEGAL REPRESENTATIVE
PLEASE READ CAREFULLY AND CHECK ONE BOX:
r I understand the procedures described above, and that this study is a project of UCLA and that it is notsponsored or funded by XXX. My questions have been answered to my satisfaction, and I GIVEPERMISSION for my child/ward to participate in this focus group. I have been given a copy of this form.
r I understand the procedures described above, and that this study is a project of UCLA and that it is notsponsored or funded by XXX. My questions have been answered to my satisfaction, and I DO NOT GIVEPERMISSION for my child/ward to participate in this focus group. I have been given a copy of this form.
Name of Child/Ward
Name of Parent/Guardian
Signature of Parent/Guardian Date
SIGNATURE OF INVESTIGATOR (If required by the HSPC.)
In my judgment the subject is voluntarily and knowingly giving informed consent and possesses the legal capacity togive informed consent to participate in this research study.
Signature of Investigator Date

Appendix C
Description of the Pilot Study

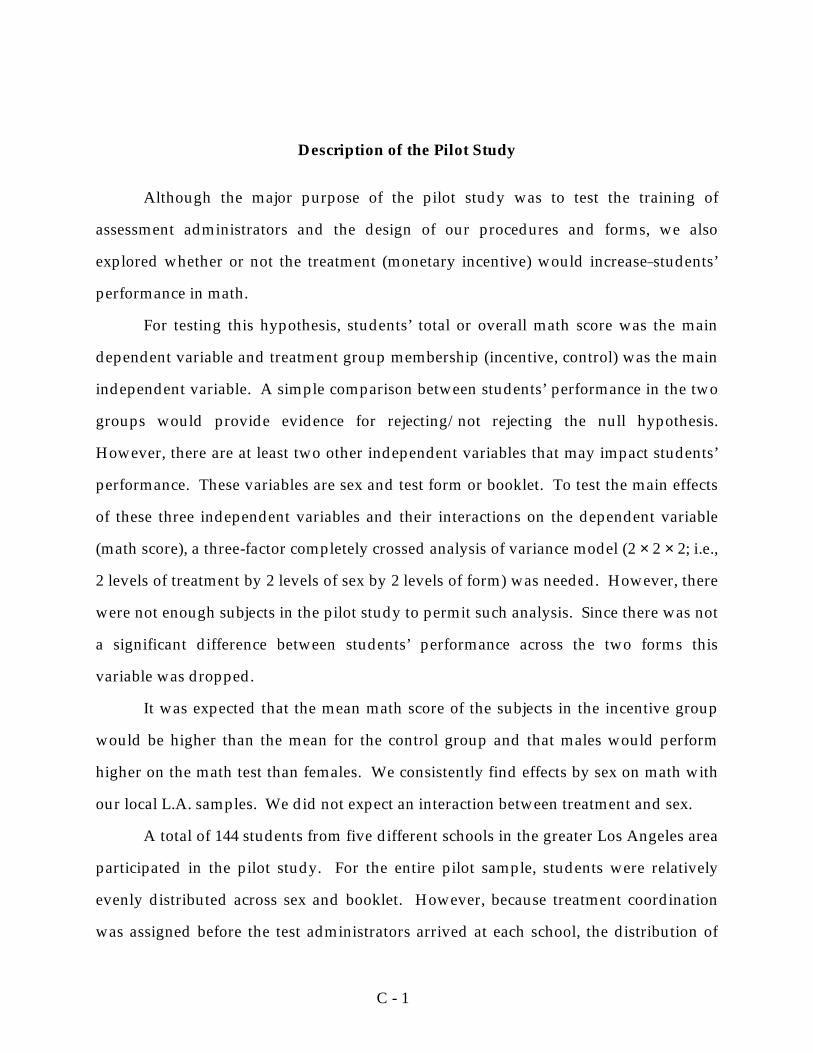
C - 1
Description of the Pilot Study
Although the major purpose of the pilot study was to test the training of
assessment administrators and the design of our procedures and forms, we also
explored whether or not the treatment (monetary incentive) would increase students’
performance in math.
For testing this hypothesis, students’ total or overall math score was the main
dependent variable and treatment group membership (incentive, control) was the main
independent variable. A simple comparison between students’ performance in the two
groups would provide evidence for rejecting/not rejecting the null hypothesis.
However, there are at least two other independent variables that may impact students’
performance. These variables are sex and test form or booklet. To test the main effects
of these three independent variables and their interactions on the dependent variable
(math score), a three-factor completely crossed analysis of variance model (2 × 2 × 2; i.e.,
2 levels of treatment by 2 levels of sex by 2 levels of form) was needed. However, there
were not enough subjects in the pilot study to permit such analysis. Since there was not
a significant difference between students’ performance across the two forms this
variable was dropped.
It was expected that the mean math score of the subjects in the incentive group
would be higher than the mean for the control group and that males would perform
higher on the math test than females. We consistently find effects by sex on math with
our local L.A. samples. We did not expect an interaction between treatment and sex.
A total of 144 students from five different schools in the greater Los Angeles area
participated in the pilot study. For the entire pilot sample, students were relatively
evenly distributed across sex and booklet. However, because treatment coordination
was assigned before the test administrators arrived at each school, the distribution of
C - 2
students within treatment varied slightly due to unforeseen circumstances such as
absenteeism, student decision on the test day to not participate, as well as student
decision on test day to participate. For those students who chose to participate on the
test day and who brought a signed assent and parental permission form or a consent
form were assigned to a group.
Background information for the pilot sample is provided in Table B1. In the test
booklet, two versions of the background questions were used to elicit information about
students. Sites 1–3 received version 1 (Questions 1 and 2), and sites 4 and 5 received
version 2 (Questions 3, 4, 5, 6 and 7 as well as Questions 1 and 2). Figure C1 displays
the background questions for version 1. Figure C2 displays the background questions
for version 2.
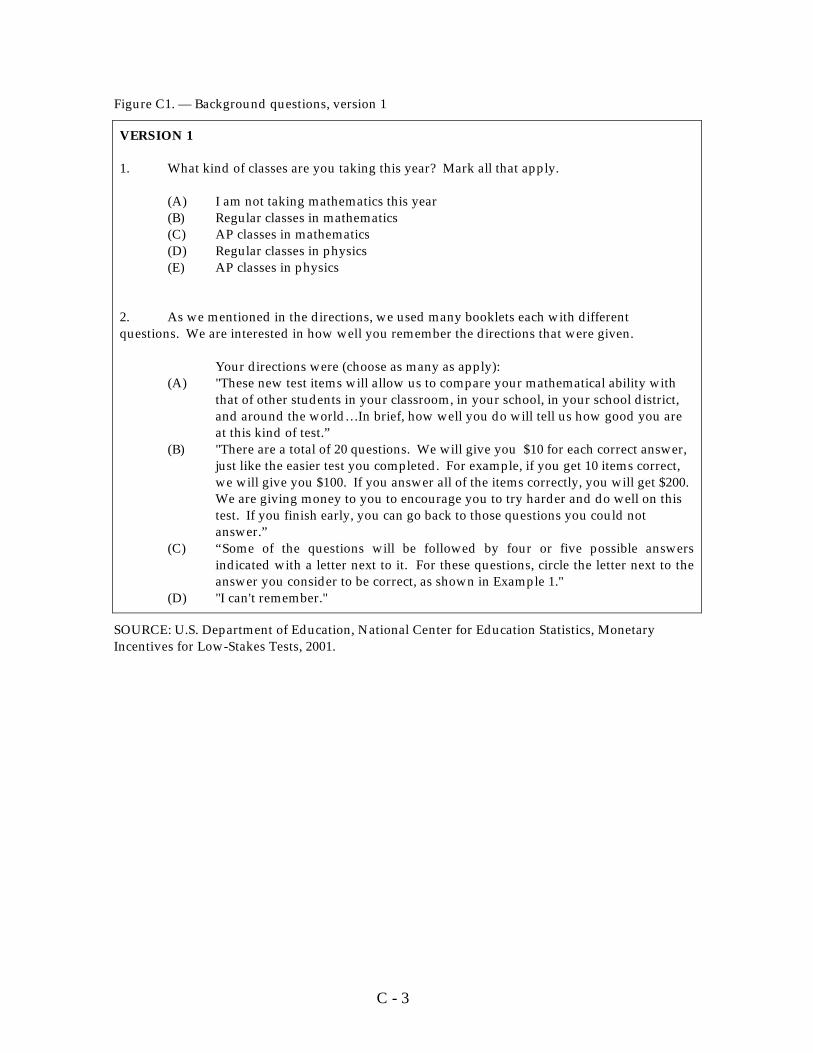
C - 3
Figure C1. — Background questions, version 1
VERSION 1 1. What kind of classes are you taking this year? Mark all that apply.
(A) I am not taking mathematics this year (B) Regular classes in mathematics (C) AP classes in mathematics (D) Regular classes in physics (E) AP classes in physics
2. As we mentioned in the directions, we used many booklets each with different questions. We are interested in how well you remember the directions that were given.
Your directions were (choose as many as apply): (A) "These new test items will allow us to compare your mathematical ability with
that of other students in your classroom, in your school, in your school district, and around the world…In brief, how well you do will tell us how good you are at this kind of test.”
(B) "There are a total of 20 questions. We will give you $10 for each correct answer, just like the easier test you completed. For example, if you get 10 items correct, we will give you $100. If you answer all of the items correctly, you will get $200. We are giving money to you to encourage you to try harder and do well on this test. If you finish early, you can go back to those questions you could not answer.”
(C) “Some of the questions will be followed by four or five possible answers indicated with a letter next to it. For these questions, circle the letter next to the answer you consider to be correct, as shown in Example 1."
(D) "I can't remember."
SOURCE: U.S. Department of Education, National Center for Education Statistics, Monetary Incentives for Low-Stakes Tests, 2001.
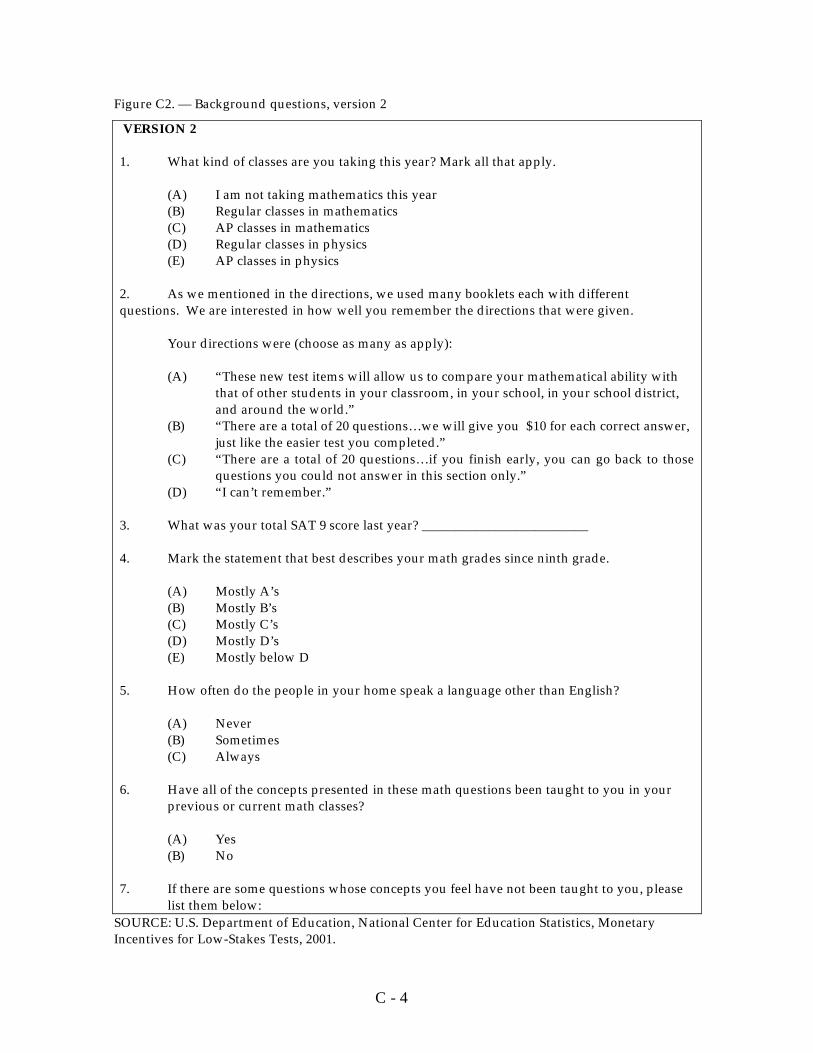
C - 4
Figure C2. — Background questions, version 2
VERSION 2 1. What kind of classes are you taking this year? Mark all that apply.
(A) I am not taking mathematics this year (B) Regular classes in mathematics (C) AP classes in mathematics (D) Regular classes in physics (E) AP classes in physics
2. As we mentioned in the directions, we used many booklets each with different questions. We are interested in how well you remember the directions that were given. Your directions were (choose as many as apply):
(A) “These new test items will allow us to compare your mathematical ability with that of other students in your classroom, in your school, in your school district, and around the world.”
(B) “There are a total of 20 questions…we will give you $10 for each correct answer, just like the easier test you completed.”
(C) “There are a total of 20 questions…if you finish early, you can go back to those questions you could not answer in this section only.”
(D) “I can’t remember.” 3. What was your total SAT 9 score last year? _________________________ 4. Mark the statement that best describes your math grades since ninth grade.
(A) Mostly A’s (B) Mostly B’s (C) Mostly C’s (D) Mostly D’s (E) Mostly below D
5. How often do the people in your home speak a language other than English?
(A) Never (B) Sometimes (C) Always
6. Have all of the concepts presented in these math questions been taught to you in your
previous or current math classes?
(A) Yes (B) No
7. If there are some questions whose concepts you feel have not been taught to you, please
list them below: SOURCE: U.S. Department of Education, National Center for Education Statistics, Monetary Incentives for Low-Stakes Tests, 2001.
C - 5
For Question 1, type of math and physics classes, 8 students in the incentive
group and 8 students in the control group indicated that they took either AP math
and/or AP physics classes. These students should not have been in the sample, as our
design required non-AP students. We dropped the 16 students who had indicated that
they took these AP classes from the pilot study sample. Likewise, for Question 2, 52 out
of 72 students in the incentive group correctly identified that they were to receive
money. In the control group, 10 out of 72 (14%) of the students inappropriately thought
they were to receive money. Sixty-two (86%) of the control group students did not
respond to this question. However, there were 8 students in the control group who also
responded that they did not remember any instructions. Subsequent analysis also
dropped these participants. There were two students with missing data.
We added more questions to the background questionnaire as the pilot study
progressed. Thus, the questions about the student’s language proficiency (language
spoken at home) and math grades were added after data collection was completed at
schools 1, 2, and 3. For Question 4, 14 students in the incentive group and 23 students
in the control group reported that they always use a language other than English at
home. For Question 5, most participants’ math grades were C and below (25 students
in the incentive group and 25 students in the control group, or 68%). Finally, for
Question 6, 58 of the students responded they had been taught the concepts. The reader
should note that question 3 was dropped for analyses as the student responses
indicated that they confused the SAT 9 with the SAT.
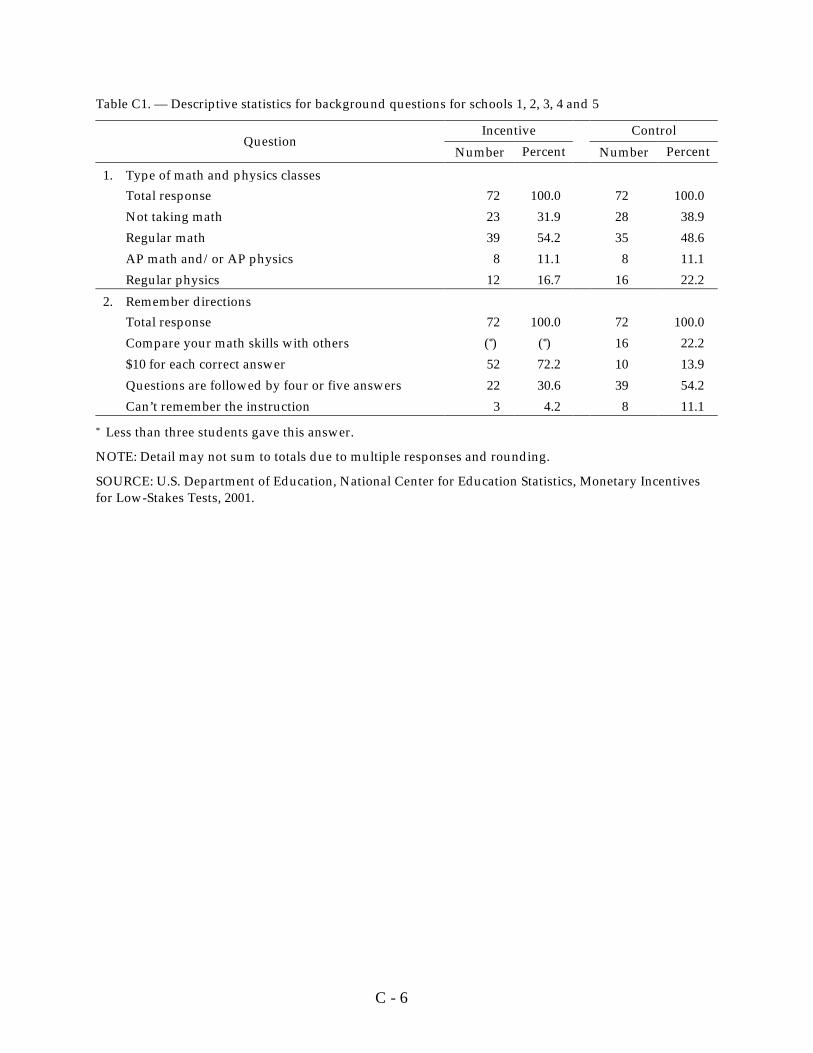
C - 6
Table C1. — Descriptive statistics for background questions for schools 1, 2, 3, 4 and 5
Incentive Control Question
Number Percent Number Percent
1. Type of math and physics classes Total response 72 100.0 72 100.0 Not taking math 23 31.9 28 38.9 Regular math 39 54.2 35 48.6 AP math and/or AP physics 8 11.1 8 11.1 Regular physics 12 16.7 16 22.2
2. Remember directions Total response 72 100.0 72 100.0 Compare your math skills with others (*) (*) 16 22.2 $10 for each correct answer 52 72.2 10 13.9 Questions are followed by four or five answers 22 30.6 39 54.2 Can’t remember the instruction 3 4.2 8 11.1
* Less than three students gave this answer.
NOTE: Detail may not sum to totals due to multiple responses and rounding.
SOURCE: U.S. Department of Education, National Center for Education Statistics, Monetary Incentives for Low-Stakes Tests, 2001.
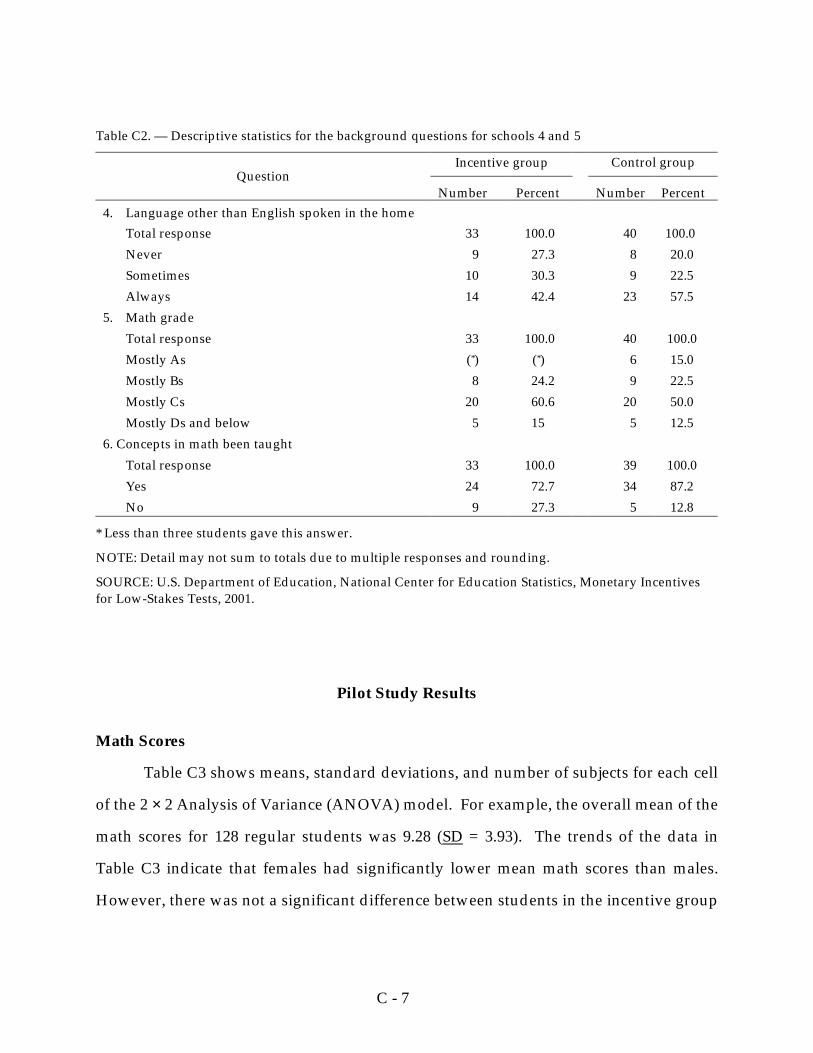
C - 7
Table C2. — Descriptive statistics for the background questions for schools 4 and 5
Incentive group Control group Question
Number Percent Number Percent 4. Language other than English spoken in the home
Total response 33 100.0 40 100.0 Never 9 27.3 8 20.0 Sometimes 10 30.3 9 22.5 Always 14 42.4 23 57.5
5. Math grade Total response 33 100.0 40 100.0 Mostly As (*) (*) 6 15.0 Mostly Bs 8 24.2 9 22.5 Mostly Cs 20 60.6 20 50.0 Mostly Ds and below 5 15 5 12.5
6. Concepts in math been taught Total response 33 100.0 39 100.0 Yes 24 72.7 34 87.2 No 9 27.3 5 12.8
* Less than three students gave this answer.
NOTE: Detail may not sum to totals due to multiple responses and rounding.
SOURCE: U.S. Department of Education, National Center for Education Statistics, Monetary Incentives for Low-Stakes Tests, 2001.
Pilot Study Results
Math Scores
Table C3 shows means, standard deviations, and number of subjects for each cell
of the 2 × 2 Analysis of Variance (ANOVA) model. For example, the overall mean of the
math scores for 128 regular students was 9.28 (SD = 3.93). The trends of the data in
Table C3 indicate that females had significantly lower mean math scores than males.
However, there was not a significant difference between students in the incentive group
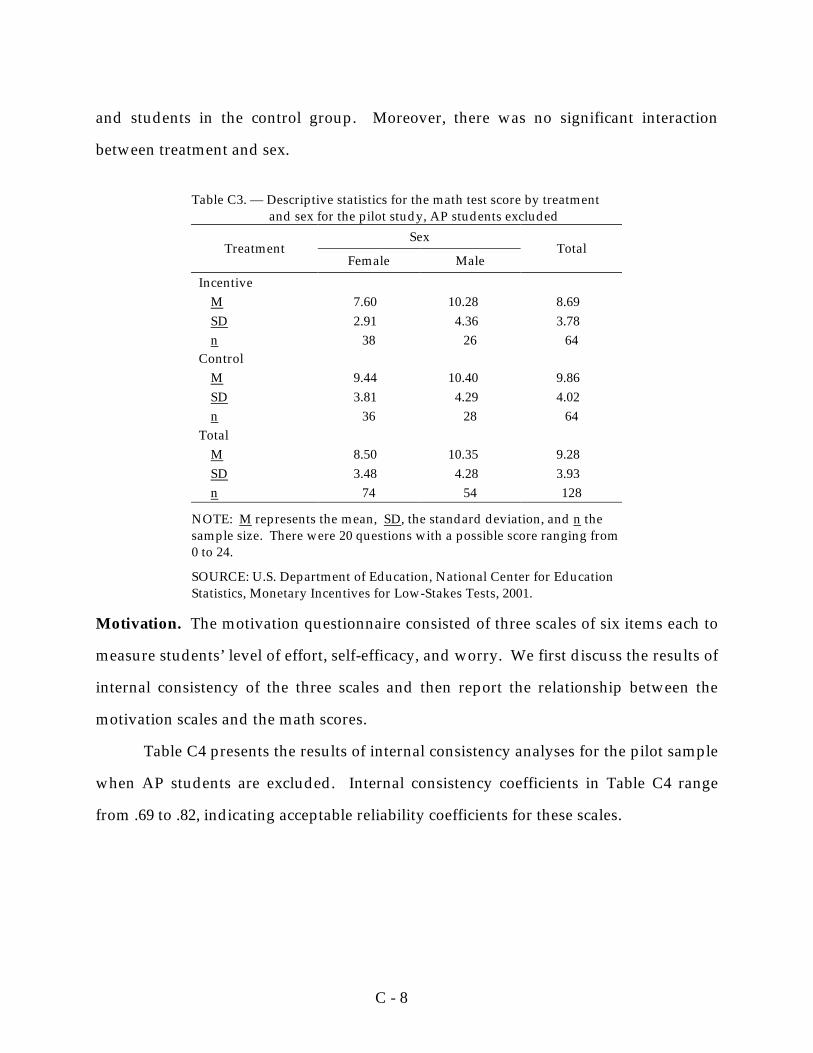
C - 8
and students in the control group. Moreover, there was no significant interaction
between treatment and sex.
Table C3. — Descriptive statistics for the math test score by treatment and sex for the pilot study, AP students excluded
Sex Treatment
Female Male Total
Incentive M SD n
7.60 2.91
38
10.28
4.36 26
8.69 3.78
64 Control
M SD n
9.44 3.81
36
10.40
4.29 28
9.86 4.02
64 Total
M SD n
8.50 3.48
74
10.35
4.28 54
9.28 3.93 128
NOTE: M represents the mean, SD, the standard deviation, and n the sample size. There were 20 questions with a possible score ranging from 0 to 24.
SOURCE: U.S. Department of Education, National Center for Education Statistics, Monetary Incentives for Low-Stakes Tests, 2001.
Motivation. The motivation questionnaire consisted of three scales of six items each to
measure students’ level of effort, self-efficacy, and worry. We first discuss the results of
internal consistency of the three scales and then report the relationship between the
motivation scales and the math scores.
Table C4 presents the results of internal consistency analyses for the pilot sample
when AP students are excluded. Internal consistency coefficients in Table C4 range
from .69 to .82, indicating acceptable reliability coefficients for these scales.
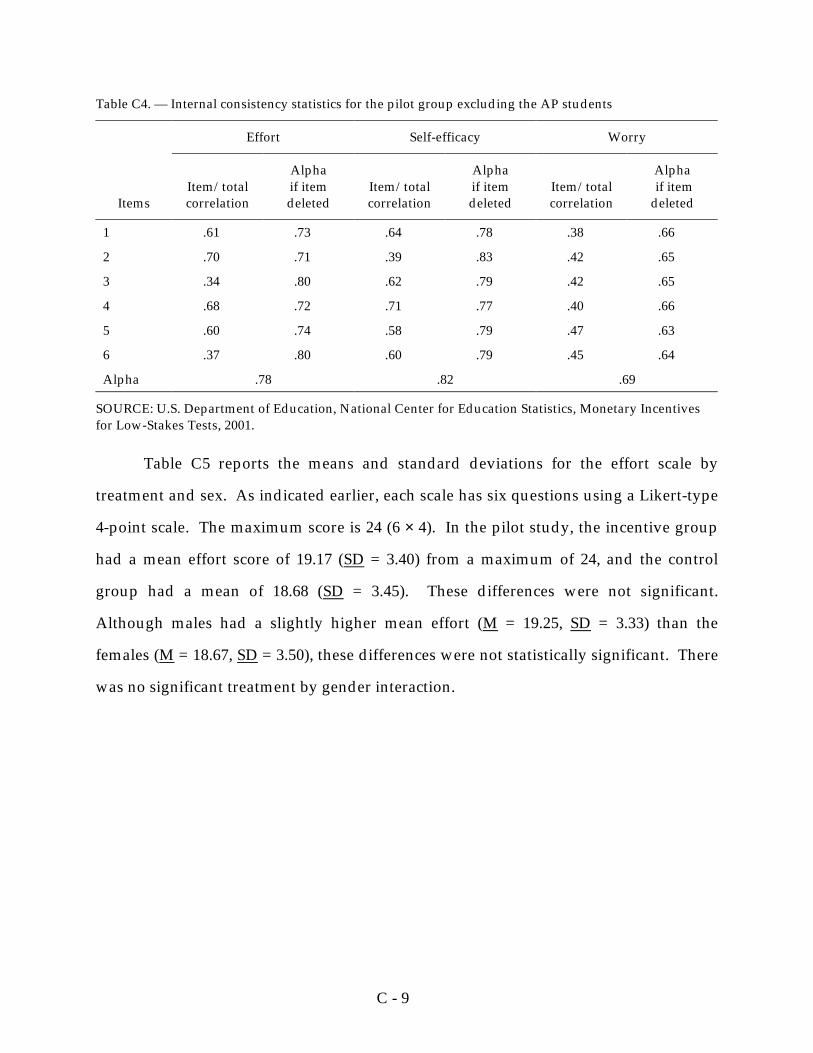
C - 9
Table C4. — Internal consistency statistics for the pilot group excluding the AP students
Effort Self-efficacy Worry
Items
Item/total correlation
Alpha if item deleted
Item/total correlation
Alpha if item deleted
Item/total correlation
Alpha if item deleted
1 .61 .73 .64 .78 .38 .66
2 .70 .71 .39 .83 .42 .65
3 .34 .80 .62 .79 .42 .65
4 .68 .72 .71 .77 .40 .66
5 .60 .74 .58 .79 .47 .63
6 .37 .80 .60 .79 .45 .64
Alpha .78 .82 .69
SOURCE: U.S. Department of Education, National Center for Education Statistics, Monetary Incentives for Low-Stakes Tests, 2001.
Table C5 reports the means and standard deviations for the effort scale by
treatment and sex. As indicated earlier, each scale has six questions using a Likert-type
4-point scale. The maximum score is 24 (6 × 4). In the pilot study, the incentive group
had a mean effort score of 19.17 (SD = 3.40) from a maximum of 24, and the control
group had a mean of 18.68 (SD = 3.45). These differences were not significant.
Although males had a slightly higher mean effort (M = 19.25, SD = 3.33) than the
females (M = 18.67, SD = 3.50), these differences were not statistically significant. There
was no significant treatment by gender interaction.
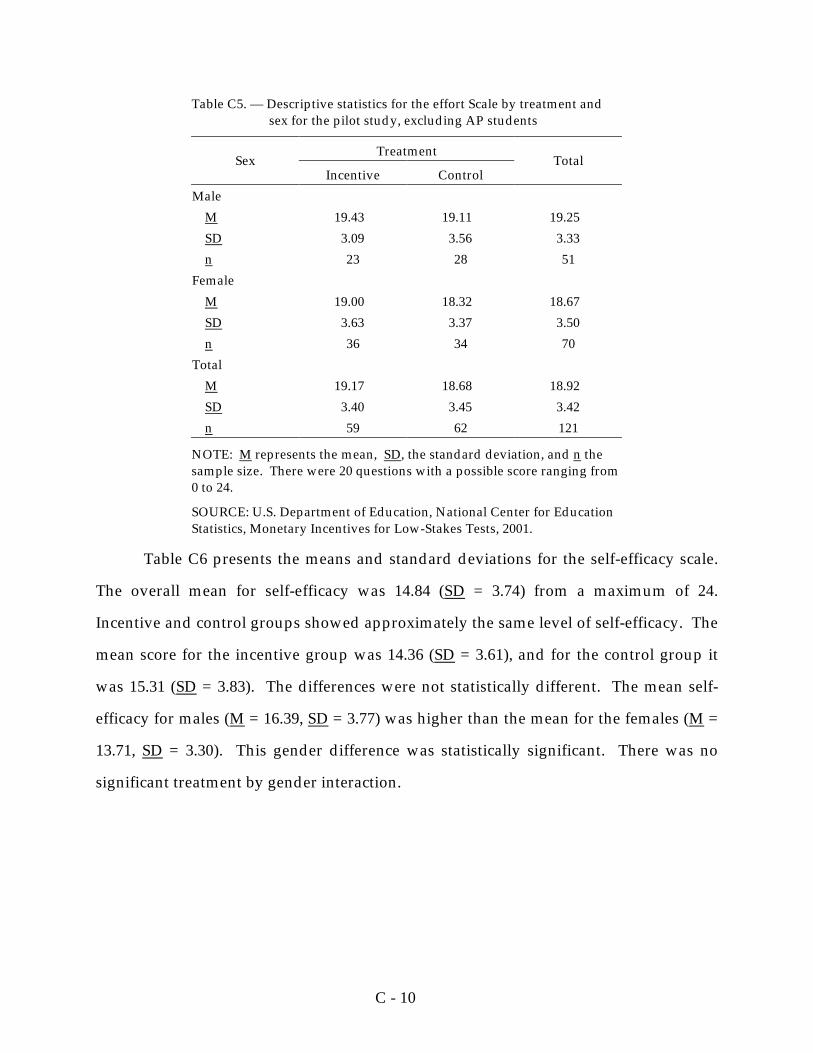
C - 10
Table C5. — Descriptive statistics for the effort Scale by treatment and sex for the pilot study, excluding AP students
Treatment Sex
Incentive Control Total
Male M 19.43 19.11 19.25 SD 3.09 3.56 3.33 n 23 28 51
Female M 19.00 18.32 18.67 SD 3.63 3.37 3.50 n 36 34 70
Total M 19.17 18.68 18.92 SD 3.40 3.45 3.42 n 59 62 121
NOTE: M represents the mean, SD, the standard deviation, and n the sample size. There were 20 questions with a possible score ranging from 0 to 24.
SOURCE: U.S. Department of Education, National Center for Education Statistics, Monetary Incentives for Low-Stakes Tests, 2001.
Table C6 presents the means and standard deviations for the self-efficacy scale.
The overall mean for self-efficacy was 14.84 (SD = 3.74) from a maximum of 24.
Incentive and control groups showed approximately the same level of self-efficacy. The
mean score for the incentive group was 14.36 (SD = 3.61), and for the control group it
was 15.31 (SD = 3.83). The differences were not statistically different. The mean self-
efficacy for males (M = 16.39, SD = 3.77) was higher than the mean for the females (M =
13.71, SD = 3.30). This gender difference was statistically significant. There was no
significant treatment by gender interaction.
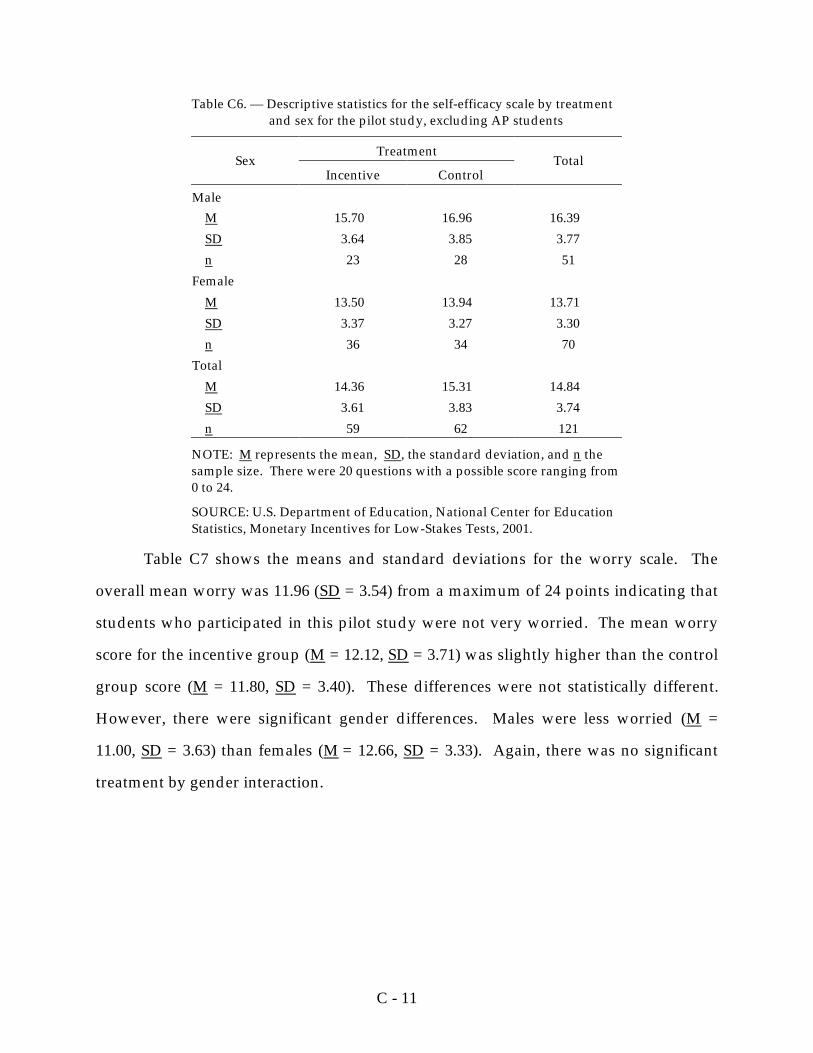
C - 11
Table C6. — Descriptive statistics for the self-efficacy scale by treatment and sex for the pilot study, excluding AP students
Treatment Sex
Incentive Control Total
Male M 15.70 16.96 16.39 SD 3.64 3.85 3.77 n 23 28 51
Female M 13.50 13.94 13.71 SD 3.37 3.27 3.30 n 36 34 70
Total M 14.36 15.31 14.84 SD 3.61 3.83 3.74 n 59 62 121
NOTE: M represents the mean, SD, the standard deviation, and n the sample size. There were 20 questions with a possible score ranging from 0 to 24.
SOURCE: U.S. Department of Education, National Center for Education Statistics, Monetary Incentives for Low-Stakes Tests, 2001.
Table C7 shows the means and standard deviations for the worry scale. The
overall mean worry was 11.96 (SD = 3.54) from a maximum of 24 points indicating that
students who participated in this pilot study were not very worried. The mean worry
score for the incentive group (M = 12.12, SD = 3.71) was slightly higher than the control
group score (M = 11.80, SD = 3.40). These differences were not statistically different.
However, there were significant gender differences. Males were less worried (M =
11.00, SD = 3.63) than females (M = 12.66, SD = 3.33). Again, there was no significant
treatment by gender interaction.
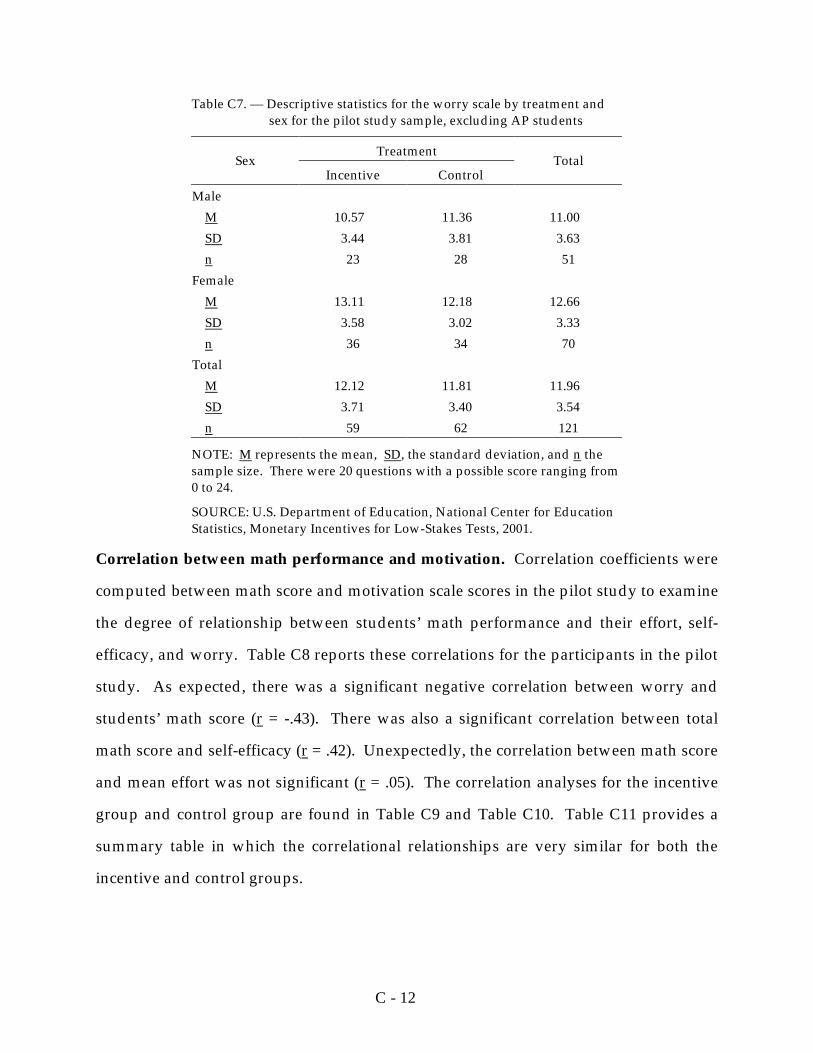
C - 12
Table C7. — Descriptive statistics for the worry scale by treatment and sex for the pilot study sample, excluding AP students
Treatment Sex
Incentive Control Total
Male M 10.57 11.36 11.00 SD 3.44 3.81 3.63 n 23 28 51
Female M 13.11 12.18 12.66 SD 3.58 3.02 3.33 n 36 34 70
Total M 12.12 11.81 11.96 SD 3.71 3.40 3.54 n 59 62 121
NOTE: M represents the mean, SD, the standard deviation, and n the sample size. There were 20 questions with a possible score ranging from 0 to 24.
SOURCE: U.S. Department of Education, National Center for Education Statistics, Monetary Incentives for Low-Stakes Tests, 2001.
Correlation between math performance and motivation. Correlation coefficients were
computed between math score and motivation scale scores in the pilot study to examine
the degree of relationship between students’ math performance and their effort, self-
efficacy, and worry. Table C8 reports these correlations for the participants in the pilot
study. As expected, there was a significant negative correlation between worry and
students’ math score (r = -.43). There was also a significant correlation between total
math score and self-efficacy (r = .42). Unexpectedly, the correlation between math score
and mean effort was not significant (r = .05). The correlation analyses for the incentive
group and control group are found in Table C9 and Table C10. Table C11 provides a
summary table in which the correlational relationships are very similar for both the
incentive and control groups.
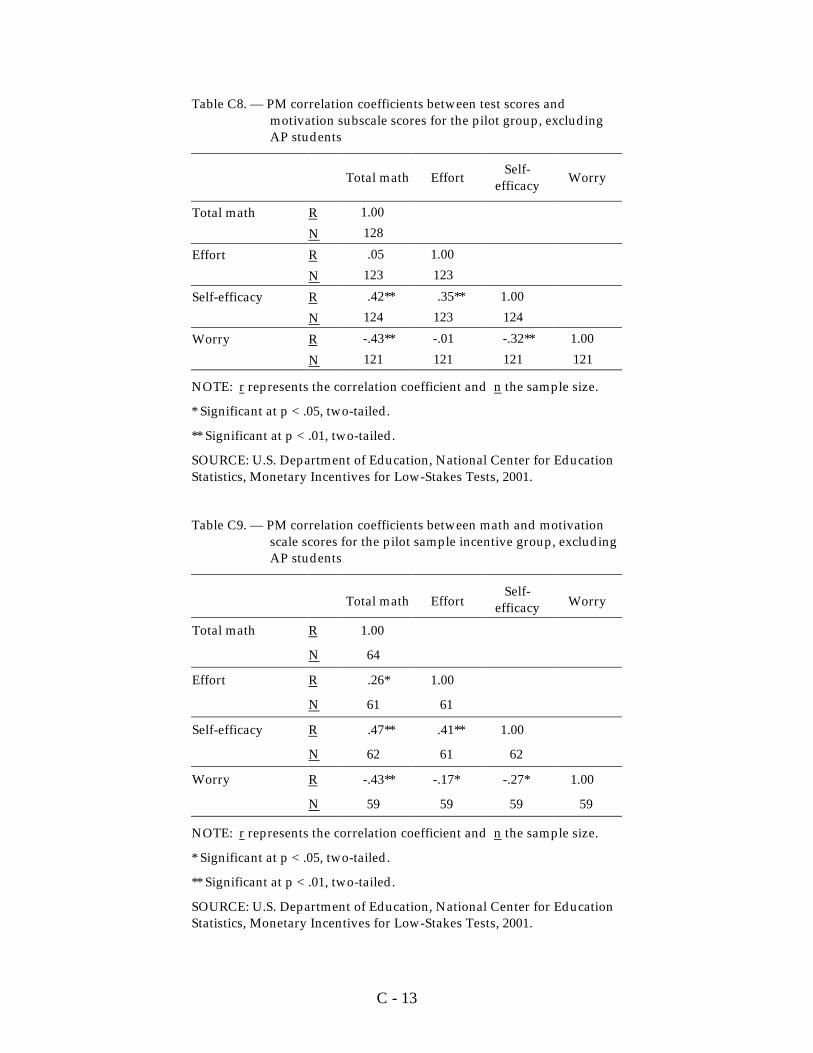
C - 13
Table C8. — PM correlation coefficients between test scores and motivation subscale scores for the pilot group, excluding AP students
Total math Effort Self-
efficacy Worry
Total math R 1.00 N 128 Effort R .05 1.00 N 123 123 Self-efficacy R .42** .35** 1.00 N 124 123 124 Worry R -.43** -.01 -.32** 1.00 N 121 121 121 121
NOTE: r represents the correlation coefficient and n the sample size.
* Significant at p < .05, two-tailed.
** Significant at p < .01, two-tailed.
SOURCE: U.S. Department of Education, National Center for Education Statistics, Monetary Incentives for Low-Stakes Tests, 2001.
Table C9. — PM correlation coefficients between math and motivation scale scores for the pilot sample incentive group, excluding AP students
Total math Effort Self-
efficacy Worry
Total math R 1.00
N 64
Effort R .26* 1.00
N 61 61
Self-efficacy R .47** .41** 1.00
N 62 61 62
Worry R -.43** -.17* -.27* 1.00
N 59 59 59 59
NOTE: r represents the correlation coefficient and n the sample size.
* Significant at p < .05, two-tailed.
** Significant at p < .01, two-tailed.
SOURCE: U.S. Department of Education, National Center for Education Statistics, Monetary Incentives for Low-Stakes Tests, 2001.
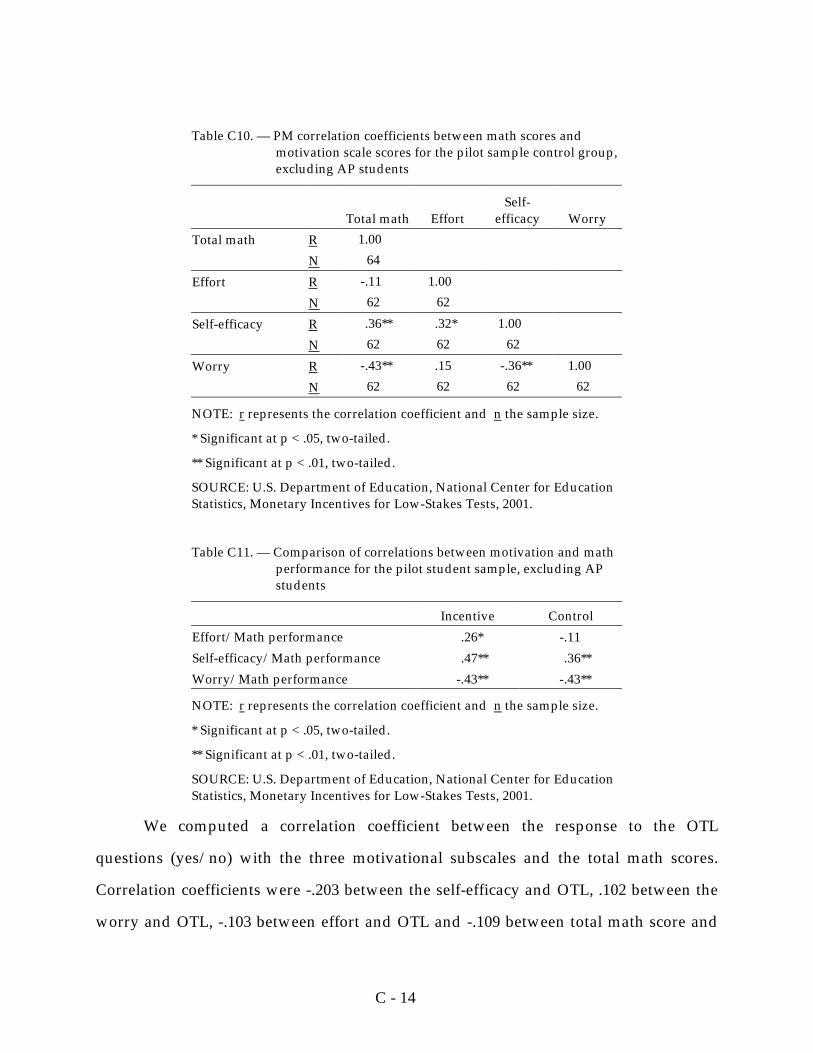
C - 14
Table C10. — PM correlation coefficients between math scores and motivation scale scores for the pilot sample control group, excluding AP students
Total math Effort Self-
efficacy Worry Total math R 1.00 N 64 Effort R -.11 1.00 N 62 62 Self-efficacy R .36** .32* 1.00 N 62 62 62 Worry R -.43** .15 -.36** 1.00 N 62 62 62 62
NOTE: r represents the correlation coefficient and n the sample size.
* Significant at p < .05, two-tailed.
** Significant at p < .01, two-tailed.
SOURCE: U.S. Department of Education, National Center for Education Statistics, Monetary Incentives for Low-Stakes Tests, 2001.
Table C11. — Comparison of correlations between motivation and math performance for the pilot student sample, excluding AP students
Incentive Control Effort/Math performance .26* -.11 Self-efficacy/Math performance .47** .36** Worry/Math performance -.43** -.43**
NOTE: r represents the correlation coefficient and n the sample size.
* Significant at p < .05, two-tailed.
** Significant at p < .01, two-tailed.
SOURCE: U.S. Department of Education, National Center for Education Statistics, Monetary Incentives for Low-Stakes Tests, 2001.
We computed a correlation coefficient between the response to the OTL
questions (yes/no) with the three motivational subscales and the total math scores.
Correlation coefficients were -.203 between the self-efficacy and OTL, .102 between the
worry and OTL, -.103 between effort and OTL and -.109 between total math score and
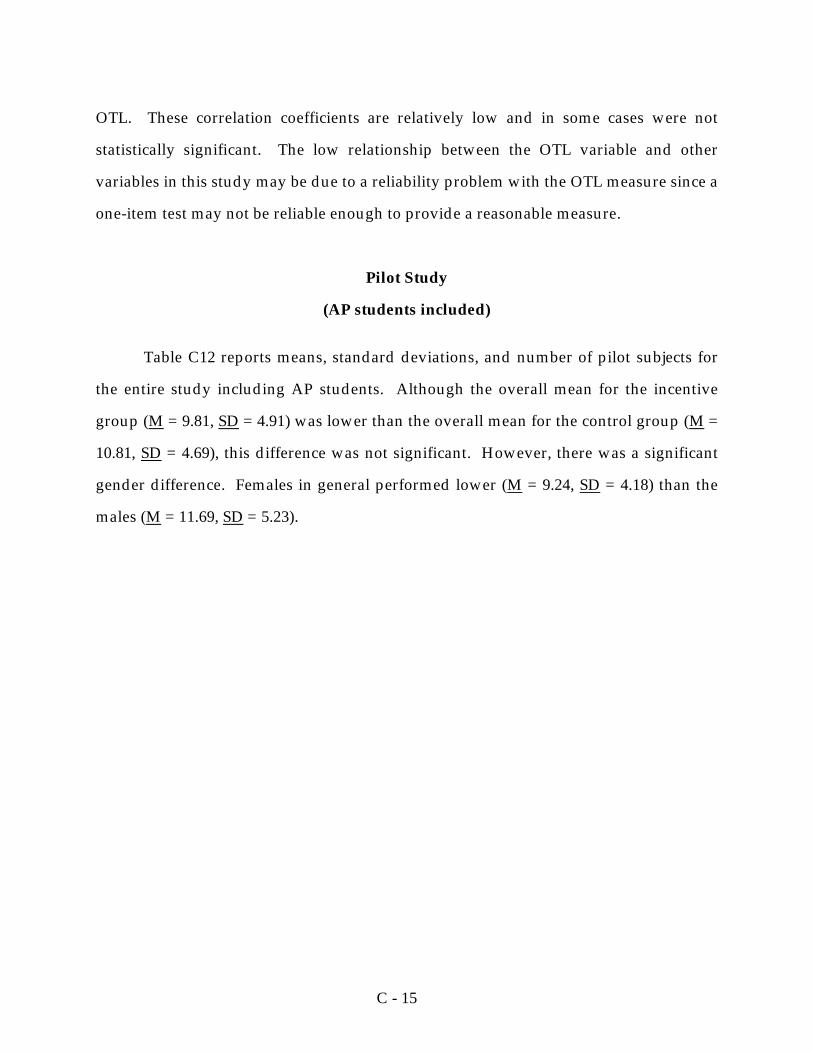
C - 15
OTL. These correlation coefficients are relatively low and in some cases were not
statistically significant. The low relationship between the OTL variable and other
variables in this study may be due to a reliability problem with the OTL measure since a
one-item test may not be reliable enough to provide a reasonable measure.
Pilot Study
(AP students included)
Table C12 reports means, standard deviations, and number of pilot subjects for
the entire study including AP students. Although the overall mean for the incentive
group (M = 9.81, SD = 4.91) was lower than the overall mean for the control group (M =
10.81, SD = 4.69), this difference was not significant. However, there was a significant
gender difference. Females in general performed lower (M = 9.24, SD = 4.18) than the
males (M = 11.69, SD = 5.23).
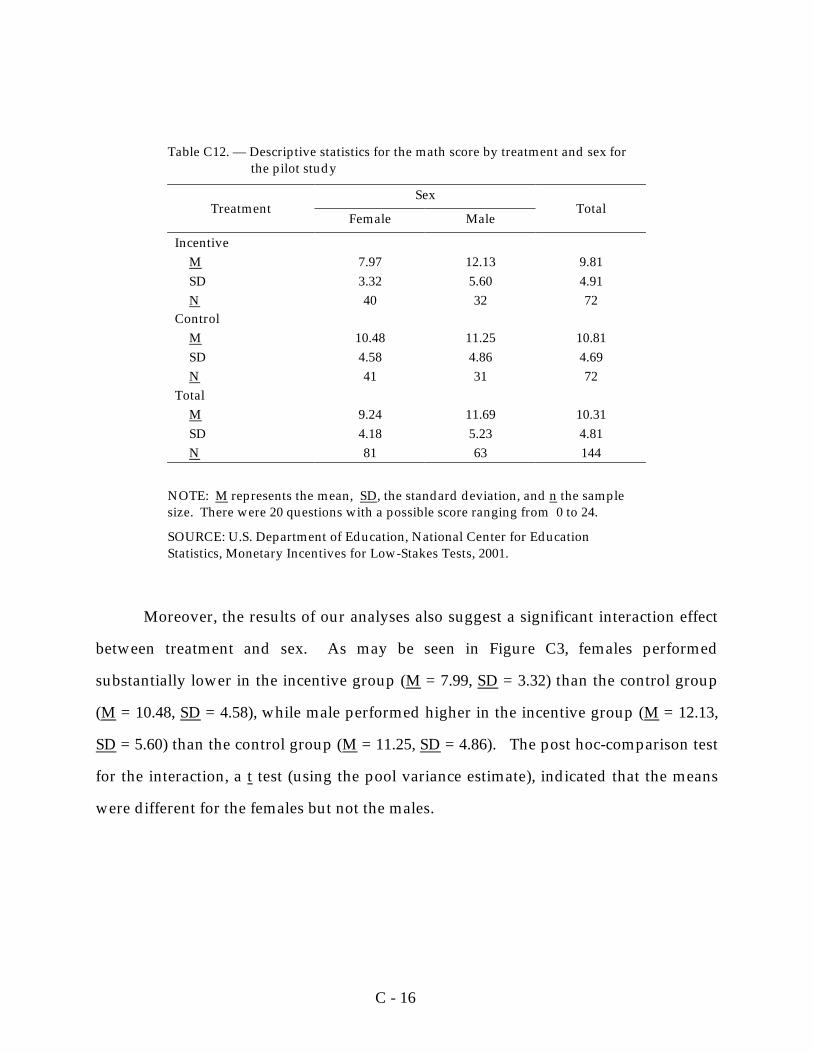
C - 16
Table C12. — Descriptive statistics for the math score by treatment and sex for the pilot study
Sex Treatment
Female Male Total
Incentive M SD N
7.97 3.32 40
12.13 5.60 32
9.81 4.91 72
Control M SD N
10.48 4.58 41
11.25 4.86 31
10.81 4.69 72
Total M SD N
9.24 4.18 81
11.69 5.23 63
10.31 4.81 144
NOTE: M represents the mean, SD, the standard deviation, and n the sample size. There were 20 questions with a possible score ranging from 0 to 24.
SOURCE: U.S. Department of Education, National Center for Education Statistics, Monetary Incentives for Low-Stakes Tests, 2001.
Moreover, the results of our analyses also suggest a significant interaction effect
between treatment and sex. As may be seen in Figure C3, females performed
substantially lower in the incentive group (M = 7.99, SD = 3.32) than the control group
(M = 10.48, SD = 4.58), while male performed higher in the incentive group (M = 12.13,
SD = 5.60) than the control group (M = 11.25, SD = 4.86). The post hoc-comparison test
for the interaction, a t test (using the pool variance estimate), indicated that the means
were different for the females but not the males.
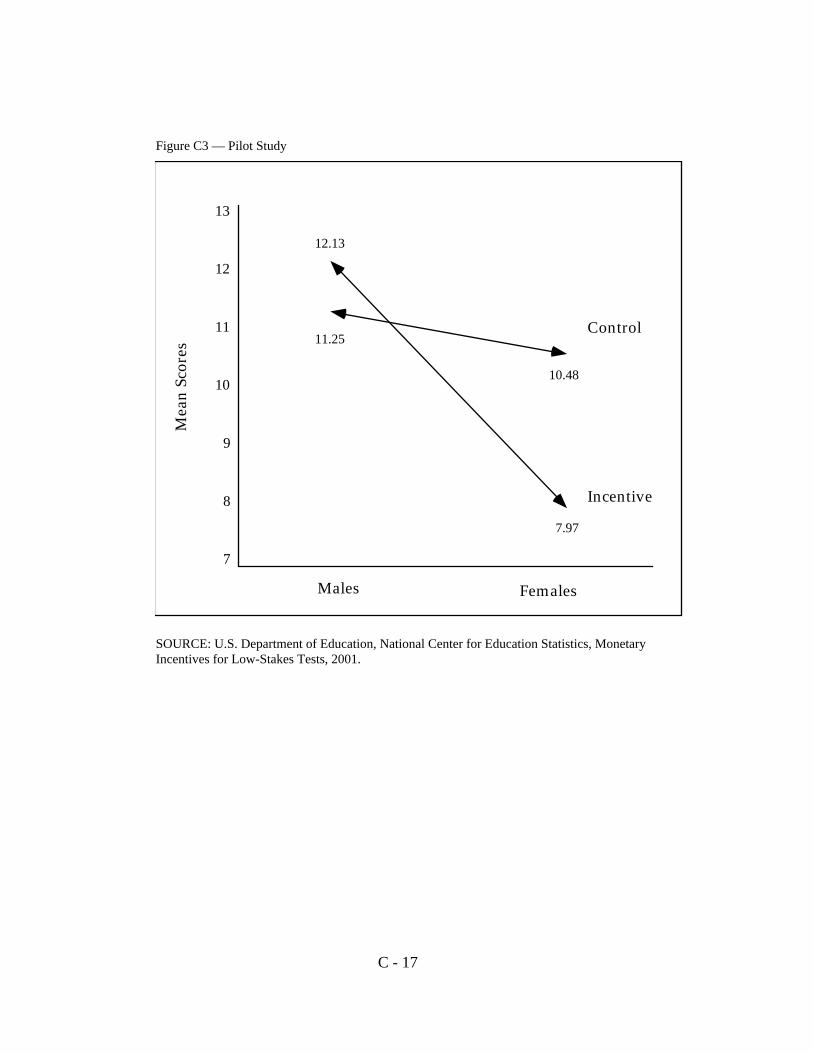
C - 17
Figure C3 — Pilot Study
Mea
n Sc
ores
Males Females
Incentive
Control
12.13
13
12
11
10
9
8
7
11.25
10.48
7.97
SOURCE: U.S. Department of Education, National Center for Education Statistics, MonetaryIncentives for Low-Stakes Tests, 2001.


Appendix D
Original Consent Forms

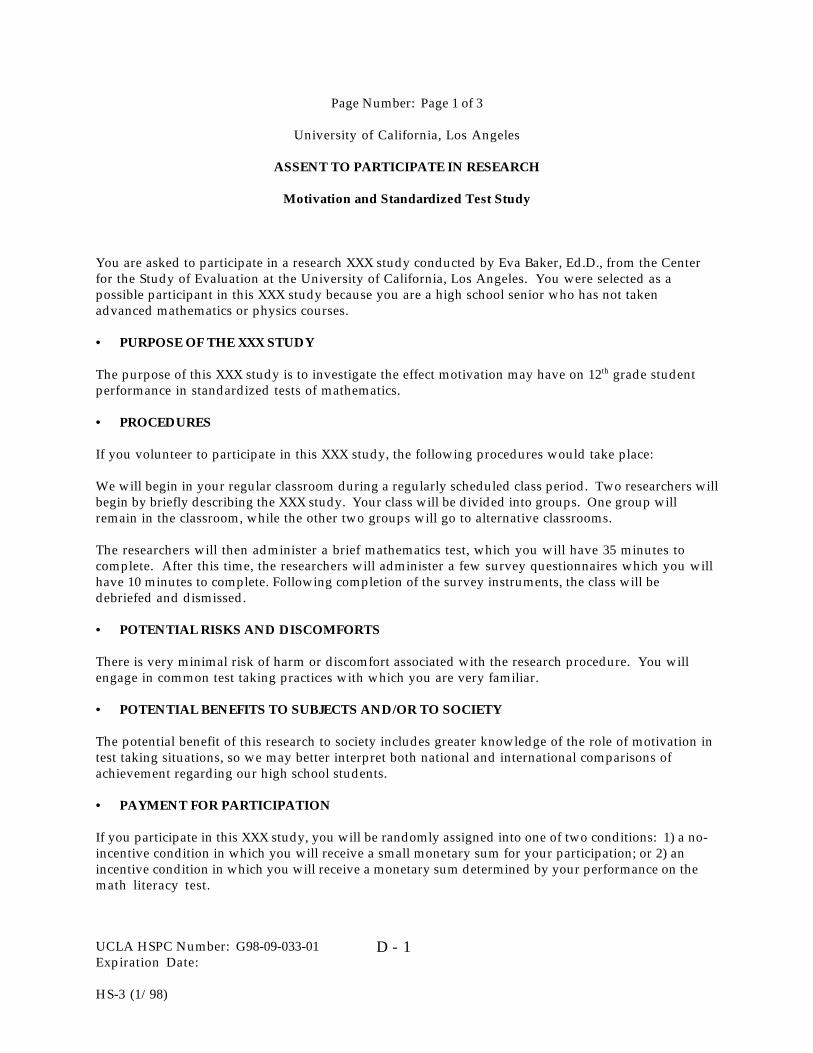
UCLA HSPC Number: G98-09-033-01Expiration Date:
HS-3 (1/98)
1D -
Page Number: Page 1 of 3
University of California, Los Angeles
ASSENT TO PARTICIPATE IN RESEARCH
Motivation and Standardized Test Study
You are asked to participate in a research XXX study conducted by Eva Baker, Ed.D., from the Centerfor the Study of Evaluation at the University of California, Los Angeles. You were selected as apossible participant in this XXX study because you are a high school senior who has not takenadvanced mathematics or physics courses.
• PURPOSE OF THE XXX STUDY The purpose of this XXX study is to investigate the effect motivation may have on 12th grade studentperformance in standardized tests of mathematics. • PROCEDURES If you volunteer to participate in this XXX study, the following procedures would take place: We will begin in your regular classroom during a regularly scheduled class period. Two researchers willbegin by briefly describing the XXX study. Your class will be divided into groups. One group willremain in the classroom, while the other two groups will go to alternative classrooms. The researchers will then administer a brief mathematics test, which you will have 35 minutes tocomplete. After this time, the researchers will administer a few survey questionnaires which you willhave 10 minutes to complete. Following completion of the survey instruments, the class will bedebriefed and dismissed. • POTENTIAL RISKS AND DISCOMFORTS There is very minimal risk of harm or discomfort associated with the research procedure. You willengage in common test taking practices with which you are very familiar. • POTENTIAL BENEFITS TO SUBJECTS AND/OR TO SOCIETY The potential benefit of this research to society includes greater knowledge of the role of motivation intest taking situations, so we may better interpret both national and international comparisons ofachievement regarding our high school students. • PAYMENT FOR PARTICIPATION If you participate in this XXX study, you will be randomly assigned into one of two conditions: 1) a no-incentive condition in which you will receive a small monetary sum for your participation; or 2) anincentive condition in which you will receive a monetary sum determined by your performance on themath literacy test.
UCLA HSPC Number: G98-09-033-01Expiration Date:
HS-3 (1/98)
2D -
Page Number: Page 2 of 3 • CONFIDENTIALITY Any information that is obtained in connection with this XXX study and is identified with you willremain confidential and will be disclosed only with your permission or as required by law. • PARTICIPATION AND WITHDRAWAL You can choose whether to be in this XXX study or not. If you volunteer to be in this XXX study, you maywithdraw at any time without consequences of any kind. You may also refuse to answer any questionsyou don't want to answer and still remain in the XXX study. The investigator may withdraw you fromthis research if circumstances arise which warrant doing so. • IDENTIFICATION OF INVESTIGATORS If you have any questions or concerns about the research, please feel free to contact Dr. Jamal Abedi atthe Center for the Study of Evaluation on the campus of UCLA, at 310-206-4346, or Dr. Eva Baker, alsoat the Center for the Study of Evaluation on the campus of UCLA, at 310-206-1532. • RIGHTS OF RESEARCH SUBJECTS You may withdraw your assent at any time and discontinue participation without penalty. You are notwaving any legal claims, rights or remedies because of your participation in this research XXX study.If you have questions regarding your rights as a research subject, contact the Office for Protection ofResearch Subjects, 2107 Ueberroth Building, UCLA. Box 951694, Los Angeles, CA 90095-1694, (310) 825-8714.
UCLA HSPC Number: G98-09-033-01Expiration Date:
HS-3 (1/98)
3D -
Page Number: Page 3 of 3
SIGNATURE OF RESEARCH SUBJECT OR LEGAL REPRESENTATIVE PLEASE READ CAREFULLY AND CHECK PLEASE READ CAREFULLY AND CHECK ONE BOX: r I understand the procedures described above, and that this study is a project of UCLA and that
it is not sponsored or funded by XXX. My questions have been answered to my satisfaction, and IAGREE to participate in this XXX study. I have been given a copy of this form.
r I understand the procedures described above, and that this study is a project of UCLA and that
it is not sponsored or funded by XXX. My questions have been answered to my satisfaction, and IDO NOT AGREE to participate in this XXX study. I have been given a copy of this form.
Name of Subject Date Signature for Adolescent Assent
SIGNATURE OF INVESTIGATOR (If required by the HSPC.) In my judgment the subject is voluntarily and knowingly giving informed assent and possesses the legalcapacity to give informed assent to participate in this research XXX study. Signature of Investigator Date
UCLA HSPC Number: G98-09-033-01Expiration Date:
HS-3 (1/98)
4D -
Page Number: Page 1 of 3
University of California, Los Angeles
CONSENT TO PARTICIPATE IN RESEARCH
Motivation and Standardized Test Study
You are asked to participate in a research XXX study conducted by Eva Baker, Ed.D., from the Centerfor the Study of Evaluation at the University of California, Los Angeles. You were selected as apossible participant in this XXX study because you are a high school senior who has not takenadvanced mathematics or physics courses. • PURPOSE OF THE XXX STUDY The purpose of this XXX study is to investigate the effect motivation may have on 12th grade studentperformance in standardized tests of mathematics. • PROCEDURES If you volunteer to participate in this XXX study, the following procedures would take place: We will begin in your regular classroom during a regularly scheduled class period. Two researchers willbegin by briefly describing the XXX study. Your class will be divided into groups. One group willremain in the classroom, while the other two groups will go to alternative classrooms. The researchers will then administer a brief mathematics test, which you will have 35 minutes tocomplete. After this time, the researchers will administer a few survey questionnaires which you willhave 10 minutes to complete. Following completion of the survey instruments, the class will bedebriefed and dismissed. • POTENTIAL RISKS AND DISCOMFORTS There is very minimal risk of harm or discomfort associated with the research procedure. You willengage in common test taking practices with which you are very familiar. • POTENTIAL BENEFITS TO SUBJECTS AND/OR TO SOCIETY The potential benefit of this research to society includes greater knowledge of the role of motivation intest taking situations, so we may better interpret both national and international comparisons ofachievement regarding our high school students.
UCLA HSPC Number: G98-09-033-01Expiration Date:
HS-3 (1/98)
5D -
Page Number: Page 2 of 3 • PAYMENT FOR PARTICIPATION If you participate in this XXX study, you will be randomly assigned into one of two conditions: 1) a no-incentive condition in which you will receive a small monetary sum for your participation; or 2) anincentive condition in which you will receive a monetary sum determined by your performance on themath literacy test. • CONFIDENTIALITY Any information that is obtained in connection with this XXX study and is identified with you willremain confidential and will be disclosed only with your permission or as required by law. • PARTICIPATION AND WITHDRAWAL You can choose whether to be in this XXX study or not. If you volunteer to be in this XXX study, you maywithdraw at any time without consequences of any kind. You may also refuse to answer any questionsyou don't want to answer and still remain in the XXX study. The investigator may withdraw you fromthis research if circumstances arise which warrant doing so. • IDENTIFICATION OF INVESTIGATORS If you have any questions or concerns about the research, please feel free to contact Dr. Jamal Abedi atthe Center for the Study of Evaluation on the campus of UCLA, at 310-206-4346, or Dr. Eva Baker, alsoat the Center for the Study of Evaluation on the campus of UCLA, at 310-206-1532. • RIGHTS OF RESEARCH SUBJECTS You may withdraw your consent at any time and discontinue participation without penalty. You are notwaving any legal claims, rights or remedies because of your participation in this research XXX study.If you have questions regarding your rights as a research subject, contact the Office for Protection ofResearch Subjects, 2107 Ueberroth Building, UCLA. Box 951694, Los Angeles, CA 90095-1694, (310) 825-8714.

UCLA HSPC Number: G98-09-033-01Expiration Date:
HS-3 (1/98)
6D -
Page Number: Page 3 of 3
SIGNATURE OF RESEARCH SUBJECT OR LEGAL REPRESENTATIVE PLEASE READ CAREFULLY AND CHECK ONE BOX: r I understand the procedures described above, and that this study is a project of UCLA and that
it is not sponsored or funded by XXX. My questions have been answered to my satisfaction, and IAGREE to participate in this XXX study. I have been given a copy of this form.
r I understand the procedures described above, and that this study is a project of UCLA and that
it is not sponsored or funded by XXX. My questions have been answered to my satisfaction, and IDO NOT AGREE to participate in this XXX study. I have been given a copy of this form.
Name of Subject Date Signature for Adolescent Consent
SIGNATURE OF INVESTIGATOR (If required by the HSPC.) In my judgment the subject is voluntarily and knowingly giving informed consent and possesses the legalcapacity to give informed consent to participate in this research XXX study. Signature of Investigator Date
UCLA HSPC Number: G98-09-033-01Expiration Date:
HS-3 (1/98)
7D -
Page Number: Page 1 of 3
University of California, Los Angeles
PARENTAL PERMISSION FOR MINOR TOPARTICIPATE IN RESEARCH
Motivation and Standardized Test Study
Your child/ward has been asked to participate in a research XXX study conducted by Eva Baker, Ed.D.,from the Center for the Study of Evaluation at the University of California, Los Angeles. Yourchild/ward was selected as a possible participant in this XXX study because s/he is a high schoolsenior who has not taken advanced mathematics or physics courses. • PURPOSE OF THE PILOT STUDY The purpose of this XXX study is to investigate the effect motivation may have on 12th grade studentperformance in standardized tests of mathematics. • PROCEDURES If your child/ward volunteers to participate in this XXX study, the following procedures would takeplace: We will begin in the regular classroom during a regularly scheduled class period. Two researchers willbegin by briefly describing the XXX study. The class will be divided into groups. One group will remainin the classroom, while the other two groups will go to alternative classrooms. The researchers will then administer a brief mathematics test, which the students will have 35minutes to complete. After this time, the researchers will administer a few survey questionnaireswhich the students will have 10 minutes to complete. Following completion of the survey instruments,the class will be debriefed and dismissed. • POTENTIAL RISKS AND DISCOMFORTS There is very minimal risk of harm or discomfort associated with the research procedure. Yourchild/ward will engage in common test taking practices with which s/he is very familiar. • POTENTIAL BENEFITS TO SUBJECTS AND/OR TO SOCIETY The potential benefit of this research to society includes greater knowledge of the role of motivation intest taking situations, so we may better interpret both national and international comparisons ofachievement regarding our high school students.
UCLA HSPC Number: G98-09-033-01Expiration Date:
HS-3 (1/98)
8D -
Page Number: Page 2 of 3 • PAYMENT FOR PARTICIPATION If your child/ward participates in this XXX study, s/he will be randomly assigned into one of twoconditions: 1) a no-incentive condition in which s/he will receive a small monetary sum for yourparticipation; or 2) an incentive condition in which s/he will receive a monetary sum determined byyour performance on the math literacy test. • CONFIDENTIALITY Any information that is obtained in connection with this XXX study and is identified with yourchild/ward will remain confidential and will be disclosed only with your permission or as required bylaw. • PARTICIPATION AND WITHDRAWAL Your child/ward can choose whether to be in this XXX study or not. If s/he volunteers to be in this XXXstudy, s/he may withdraw at any time without consequences of any kind. Your child/ward may alsorefuse to answer any questions s/he doesn’t want to answer and still remain in the XXX study. Theinvestigator may withdraw your child/ward from this research if circumstances arise which warrantdoing so. • IDENTIFICATION OF INVESTIGATORS If you have any questions or concerns about the research, please feel free to contact Dr. Jamal Abedi atthe Center for the Study of Evaluation on the campus of UCLA, at 310-206-4346, or Dr. Eva Baker, alsoat the Center for the Study of Evaluation on the campus of UCLA, at 310-206-1532. • RIGHTS OF RESEARCH SUBJECTS
Your child/ward may withdraw her/his assent at any time and discontinue participation withoutpenalty. Your child/ward is not waving any legal claims, rights or remedies because of his/herparticipation in this research XXX study. If your child/ward has questions regarding his/her rights asa research subject, contact the Office for Protection of Research Subjects, 2107 Ueberroth Building,UCLA. Box 951694, Los Angeles, CA 90095-1694, (310) 825-8714.

UCLA HSPC Number: G98-09-033-01Expiration Date:
HS-3 (1/98)
9D -
Page Number: Page 3 of 3
SIGNATURE OF RESEARCH SUBJECT OR LEGAL REPRESENTATIVE
PLEASE READ CAREFULLY AND CHECK ONE BOX:
r I understand the procedures described above, and that this study is a project of UCLA and thatit is not sponsored or funded by XXX. My questions have been answered to my satisfaction, and IGIVE PERMISSION for my child/ward to participate in this XXX study. I have been given acopy of this form.
r I understand the procedures described above, and that this study is a project of UCLA and thatit is not sponsored or funded by XXX. My questions have been answered to my satisfaction, and IDO NOT GIVE PERMISSION for my child/ward to participate in this XXX study. I have beengiven a copy of this form.
Name of Child/Ward
Name of Parent/Guardian
Signature of Parent/Guardian Date
SIGNATURE OF INVESTIGATOR (If required by the HSPC.)
In my judgment the subject is voluntarily and knowingly giving informed consent and possesses the legalcapacity to give informed consent to participate in this research XXX study.
Signature of Investigator Date

Appendix E
Main Study(AP students included)

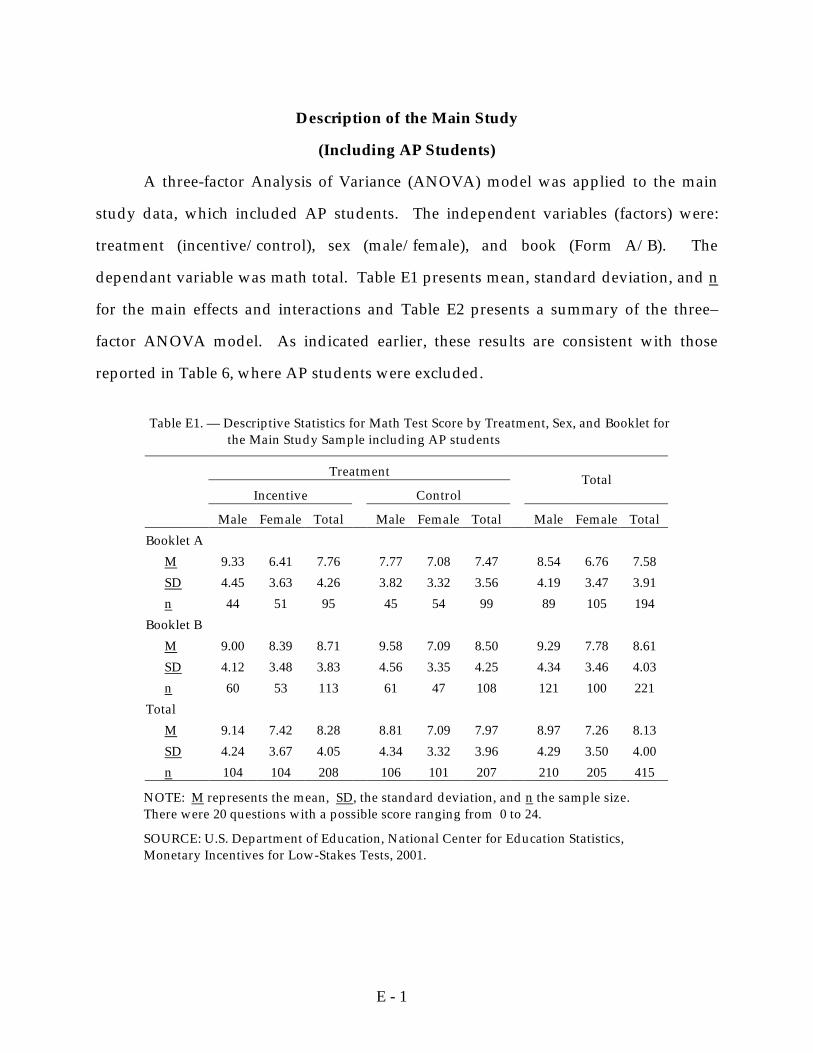
E - 1
Description of the Main Study
(Including AP Students)
A three-factor Analysis of Variance (ANOVA) model was applied to the main
study data, which included AP students. The independent variables (factors) were:
treatment (incentive/control), sex (male/female), and book (Form A/B). The
dependant variable was math total. Table E1 presents mean, standard deviation, and n
for the main effects and interactions and Table E2 presents a summary of the three–
factor ANOVA model. As indicated earlier, these results are consistent with those
reported in Table 6, where AP students were excluded.
Table E1. — Descriptive Statistics for Math Test Score by Treatment, Sex, and Booklet for the Main Study Sample including AP students
Treatment
Incentive Control Total
Male Female Total Male Female Total Male Female Total Booklet A M 9.33 6.41 7.76 7.77 7.08 7.47 8.54 6.76 7.58 SD 4.45 3.63 4.26 3.82 3.32 3.56 4.19 3.47 3.91 n 44 51 95 45 54 99 89 105 194 Booklet B M 9.00 8.39 8.71 9.58 7.09 8.50 9.29 7.78 8.61 SD 4.12 3.48 3.83 4.56 3.35 4.25 4.34 3.46 4.03 n 60 53 113 61 47 108 121 100 221 Total M 9.14 7.42 8.28 8.81 7.09 7.97 8.97 7.26 8.13 SD 4.24 3.67 4.05 4.34 3.32 3.96 4.29 3.50 4.00 n 104 104 208 106 101 207 210 205 415
NOTE: M represents the mean, SD, the standard deviation, and n the sample size. There were 20 questions with a possible score ranging from 0 to 24.
SOURCE: U.S. Department of Education, National Center for Education Statistics, Monetary Incentives for Low-Stakes Tests, 2001.
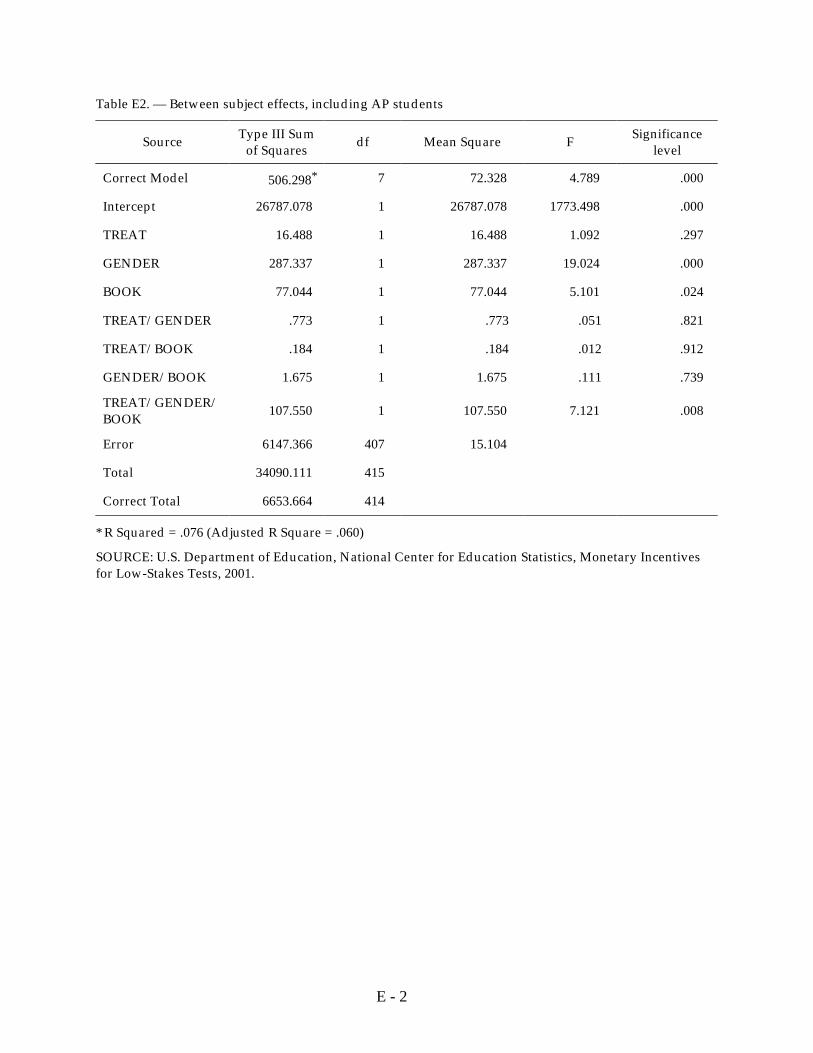
E - 2
Table E2. — Between subject effects, including AP students
Source Type III Sum of Squares df Mean Square F Significance
level
Correct Model 506.298* 7 72.328 4.789 .000
Intercept 26787.078 1 26787.078 1773.498 .000
TREAT 16.488 1 16.488 1.092 .297
GENDER 287.337 1 287.337 19.024 .000
BOOK 77.044 1 77.044 5.101 .024
TREAT/GENDER .773 1 .773 .051 .821
TREAT/BOOK .184 1 .184 .012 .912
GENDER/BOOK 1.675 1 1.675 .111 .739
TREAT/GENDER/BOOK 107.550 1 107.550 7.121 .008
Error 6147.366 407 15.104
Total 34090.111 415
Correct Total 6653.664 414
* R Squared = .076 (Adjusted R Square = .060)
SOURCE: U.S. Department of Education, National Center for Education Statistics, Monetary Incentives for Low-Stakes Tests, 2001.
Appendix F
Test Booklet A
Main Study(Control and Incentive)

UCLA/CRESST Low Stakes Motivation Study—CGBooklet A
MS-6to71F -
UCLA/CRESST STUDY
Name: ______________________________
Gender: Male or Female (circle one)

UCLA/CRESST Low Stakes Motivation Study—CGBooklet A
MS-6to72F -
SECTION 1
GENERAL DIRECTIONS
In this booklet, you will find questions about mathematics. Because there are differentbooklets, the other students around you may be working on booklets that are differentfrom yours. You will have 25 minutes to answer all of the questions in this section.Please read each question carefully and answer it as well as you can.
You will be told when to begin work on this booklet. If you finish answering thequestions before time is called, you may go over your work and review your answers.
If you decide to change an answer to a question, erase or cross out your first choice andthen circle the letter next to the answer you consider correct.
For other questions you will be asked to write short answers in the space provided inyour booklet. For these questions, you may use words, drawings, numbers, orequations in your answers.
Even if you use a calculator, when the question asks you to show ALL of your work it isvery important that you give as complete an answer as you can. Please use the extraspace on the page to do your work. You will not be penalized for guessing or providingincorrect responses so you should attempt to answer every question.
STOP

UCLA/CRESST Low Stakes Motivation Study—CGBooklet A
MS-6to73F -
SECTION 2
SAMPLE QUESTIONS
DIRECTIONS: Read each question carefully and answer it as well as you can.
1. Which of the numbers below is the smallest?
(A) 3
(B) 1
(C) 4
(D) 7
2. Which of the numbers below is an even number?
(A) 2
(B) 5
(C) 3
(D) 1
STOP

UCLA/CRESST Low Stakes Motivation Study—CGBooklet A
MS-6to74F -
SECTION 3
MATH ASSESSMENT
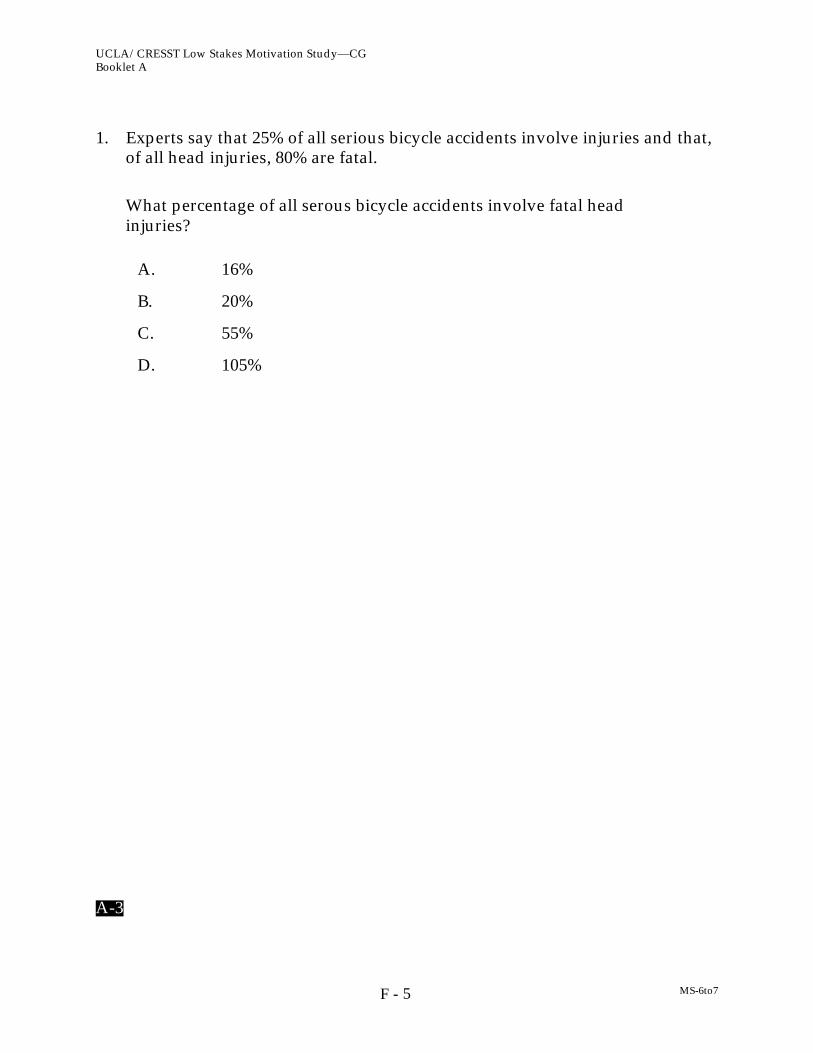
UCLA/CRESST Low Stakes Motivation Study—CGBooklet A
MS-6to75F -
1. Experts say that 25% of all serious bicycle accidents involve injuries and that,of all head injuries, 80% are fatal.
What percentage of all serous bicycle accidents involve fatal headinjuries?
A. 16%
B. 20%
C. 55%
D. 105%
A-3

UCLA/CRESST Low Stakes Motivation Study—CGBooklet A
MS-6to76F -
2. If the population increases by the same rate from the year 1990 to the year2000 as in the years from 1980 to 1990, approximately what is the expectedpopulation by the year 2000?
A. 47 million
B. 50 million
C. 53 million
D. 58 million
A-4
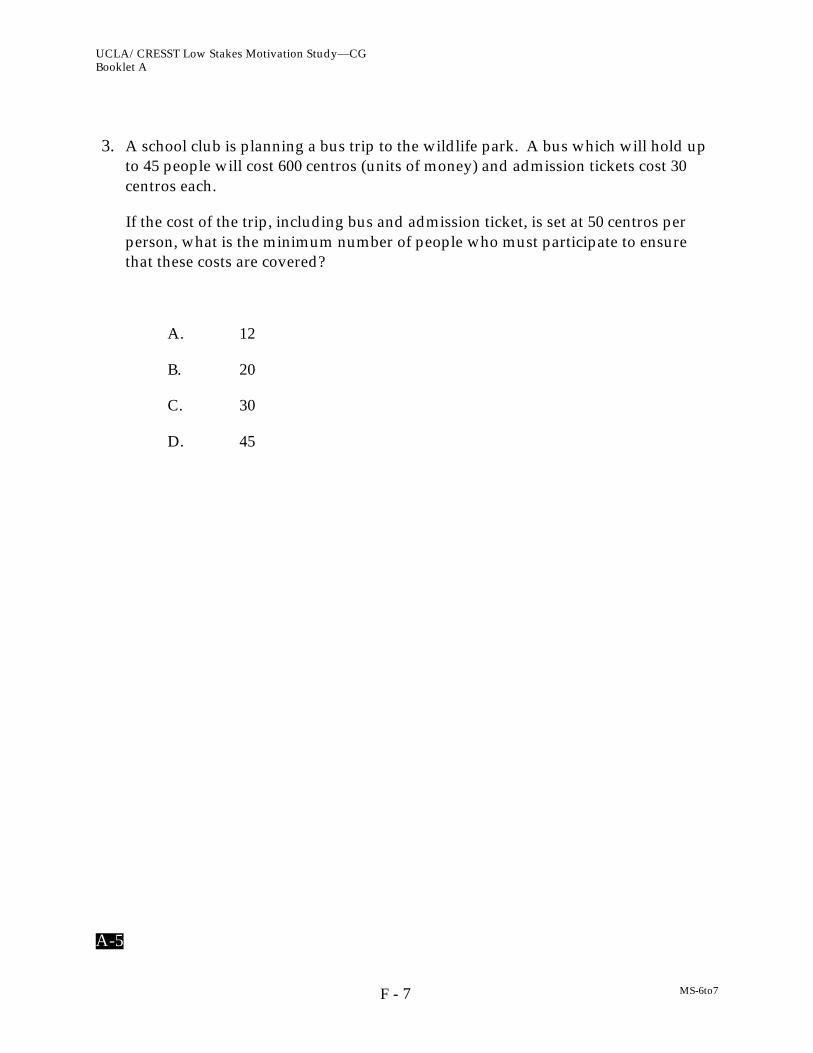
UCLA/CRESST Low Stakes Motivation Study—CGBooklet A
MS-6to77F -
3. A school club is planning a bus trip to the wildlife park. A bus which will hold upto 45 people will cost 600 centros (units of money) and admission tickets cost 30centros each.
If the cost of the trip, including bus and admission ticket, is set at 50 centros perperson, what is the minimum number of people who must participate to ensurethat these costs are covered?
A. 12
B. 20
C. 30
D. 45
A-5

UCLA/CRESST Low Stakes Motivation Study—CGBooklet A
MS-6to78F -
4. The graphs give information about sales of CDs and other sound recordingmedia in Zedland. Zeds are the monetary units used in Zedland.
With the aid of both graphs calculate how much money was spentby 12-19 year olds on CDs in 1992. Show your work.
A-8
Value of various sound recording media sold in Zedland (millions of zeds)
0
100
200
300
400
500
600
700
800
1987 1988 1989 1990 1991 1992
music cassettesrecordsCD
UCLA/CRESST Low Stakes Motivation Study—CGBooklet A
MS-6to79F -
5. Using the set of axes below, sketch a graph which shows the relationshipbetween the height of a person and his/her age from birth to 30 years. Besure to label your graph, and include a realistic scale on each axis.
A-10

UCLA/CRESST Low Stakes Motivation Study—CGBooklet A
MS-6to710F -
6. The following two advertisements appeared in a newspaper in a country where theunits of currency are zeds.
If a company is interested in renting an office of 110 square meters in that countryfor a year, at which office building, A or B, should they rent the office in order toget the lower price? Show your work.
A-12
BUILDING A
Office Space Available
85 - 95 square meters475 zeds per month
100 - 120 square meters800 zeds per month
BUILDING B
Office Space Available
35 - 260 square meters90 zeds per square meter
per year
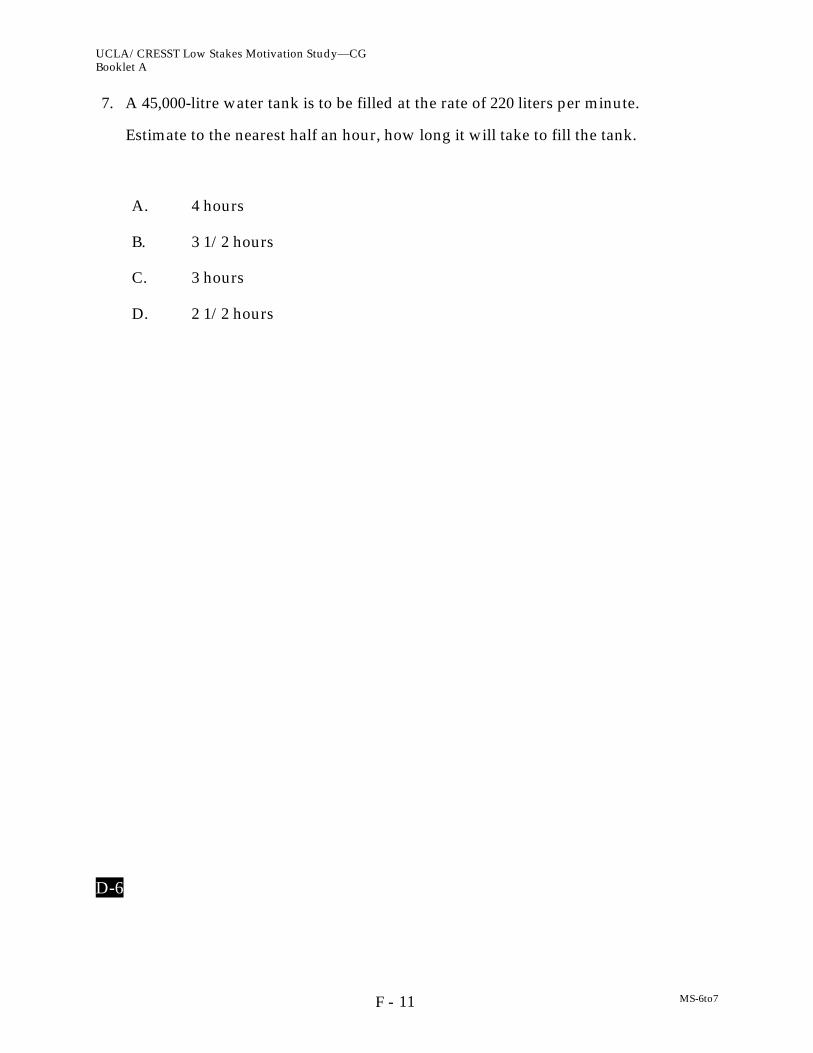
UCLA/CRESST Low Stakes Motivation Study—CGBooklet A
MS-6to711F -
7. A 45,000-litre water tank is to be filled at the rate of 220 liters per minute.
Estimate to the nearest half an hour, how long it will take to fill the tank.
A. 4 hours
B. 3 1/2 hours
C. 3 hours
D. 2 1/2 hours
D-6
UCLA/CRESST Low Stakes Motivation Study—CGBooklet A
MS-6to712F -
8. If there are 300 calories in 100 grams of a certain food, how many calories are therein a 30-gram portion of that food?
A. 90
B. 100
C. 900
D. 1000
E. 9000
D-7
UCLA/CRESST Low Stakes Motivation Study—CGBooklet A
MS-6to713F -
9. In a vineyard there are 210 rows of vines. Each row is 192 m long and plants areplanted 4 m apart. On average, each plant produces 9 kg of grapes each season.
The total amount of grapes produced by the vineyard each season is closest to
A. 10 000 kg
B. 100 000 kg
C. 400 000 kg
D. 1 600 000 kg
D-8

UCLA/CRESST Low Stakes Motivation Study—CGBooklet A
MS-6to714F -
10. A store is having a '20% off' sale. The normal price of a stereo system is $1250.
What is the price of the stereo system after the 20 % discount is applied?
A. $1000
B. $1050
C. $1230
D. $1500
D-9

UCLA/CRESST Low Stakes Motivation Study—CGBooklet A
MS-6to715F -
11.
Each of the small squares in the figure is 1 square unit. Which is the bestestimate of the area of the shaded region?
A. 10 square units
B. 12 square units
C. 14 square units
D. 16 square units
E. 18 square units
D-10
UCLA/CRESST Low Stakes Motivation Study—CGBooklet A
MS-6to716F -
12. Stu wants to wrap some ribbon around a box as shown and have 25 cm left to tie abow.
How long a piece of ribbon does he need?
A. 46 cm
B. 52 cm
C. 65 cm
D. 71 cm
E. 77 cm
D-11
UCLA/CRESST Low Stakes Motivation Study—CGBooklet A
MS-6to717F -
13. Brighto soap powder is packed in cube-shaped cartons. A carton measures 10 cmon each side.
The company decides to increase the length of each edge of the carton by10 per cent.
How much does the volume increase?
A. 10 cm3
B. 21 cm3
C. 100 cm3
D. 331 cm3
D-12

UCLA/CRESST Low Stakes Motivation Study—CGBooklet A
MS-6to718F -
14. In a school election with three candidates, Joe received 120 votes, Mary received 50votes, and George received 30 votes.
What percentage of the total number of votes did Joe receive?
A. 60%
B. 66 2/3%
C. 80%
D. 120%
D-13
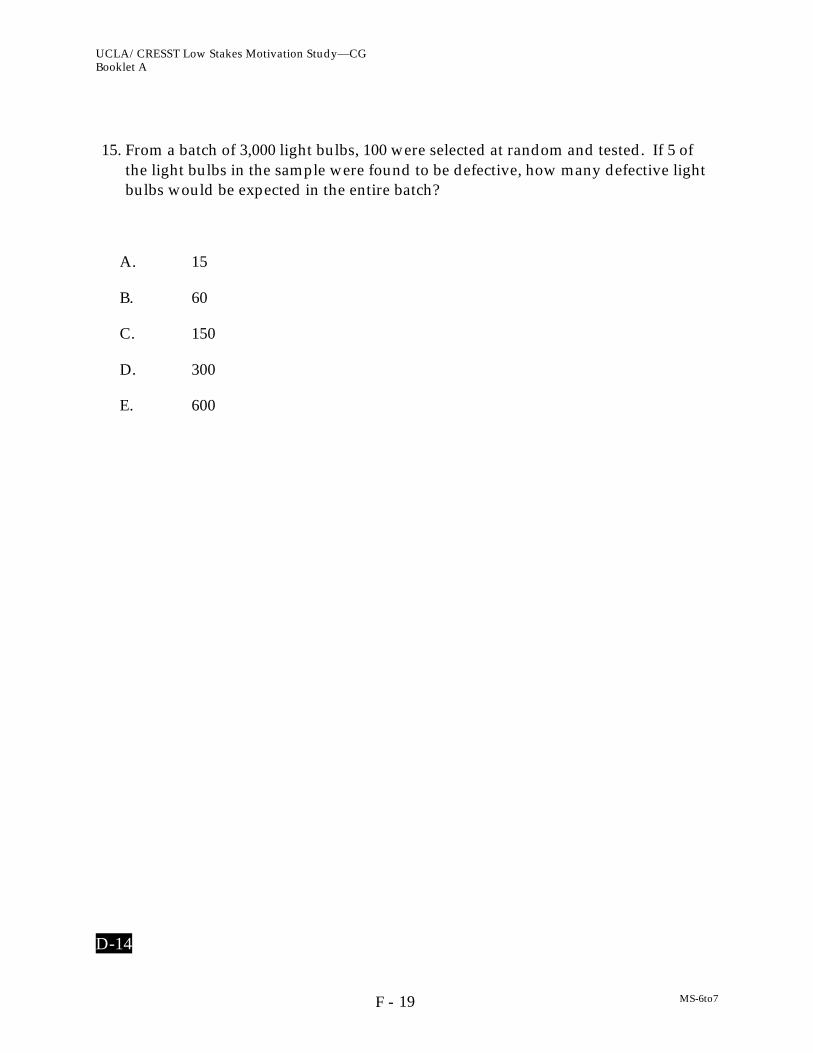
UCLA/CRESST Low Stakes Motivation Study—CGBooklet A
MS-6to719F -
15. From a batch of 3,000 light bulbs, 100 were selected at random and tested. If 5 ofthe light bulbs in the sample were found to be defective, how many defective lightbulbs would be expected in the entire batch?
A. 15
B. 60
C. 150
D. 300
E. 600
D-14
UCLA/CRESST Low Stakes Motivation Study—CGBooklet A
MS-6to720F -
16. Kelly went for a drive in her car. During the drive, a cat ran in front of the car.Kelly slammed on the brakes and missed the cat.
Slightly shaken, Kelly decided to return home by a shorter route. The graphbelow is a record of the car's speed during the drive.
a) What was the maximum speed of the car during the drive?
b) What time was it when Kelly slammed on the brakes to avoid the cat?
D-15a
D-15b
UCLA/CRESST Low Stakes Motivation Study—CGBooklet A
MS-6to721F -
17. Teresa wants to record 5 songs on tape. The length of time each song plays foris shown in the table.
Song Length of Time
1
2
3
4
5
2 minutes 41 seconds
3 minutes 10 seconds
2 minutes 51 seconds
3 minutes
3 minutes 32 seconds
Estimate to the nearest minute the total time taken for all five songs to play andexplain how this estimate was made.
Estimate: _______________________
Explain:
D-16a
D-16b
UCLA/CRESST Low Stakes Motivation Study—CGBooklet A
MS-6to722F -
18. A TV reporter showed this graph and said:
"There's been a huge increase in the number of robberies this year."
Do you consider the reporter's statement to be a reasonable interpretation of thegraph? Briefly explain.
D-17
STOP

UCLA/CRESST Low Stakes Motivation Study—CGBooklet A
MS-6to723F -
SECTION 4
DIRECTIONS: A number of statements which people have used to describethemselves are given below. Read each statement and indicate how you thought or feltduring the math test. Find the word or phrase, which best describes how you thoughtor felt and circle the number for your answer. There are no right or wrong answers. Donot spend too much time on any one statement. Remember to give the answer that
best describes how you thought or felt during the math test.
Not atall Somewhat
ModeratelySo
Verymuch so
1. I concentrated as hard as I couldduring the math test.
1 2 3 4
2. I expected to do very well on themath test.
1 2 3 4
3. I thought my score would be sobad that everyone, includingmyself, would be disappointed.
1 2 3 4
4. I worked hard on the math test. 1 2 3 4
5. I had no doubts about mycapability to do well on the mathtest.
1 2 3 4
6. I was afraid I should have studiedmore for this test.
1 2 3 4
7. I kept working, even on difficultquestions.
1 2 3 4
8. I think I will receive a good scoreon this test.
1 2 3 4
9. I was not happy with myperformance.
1 2 3 4
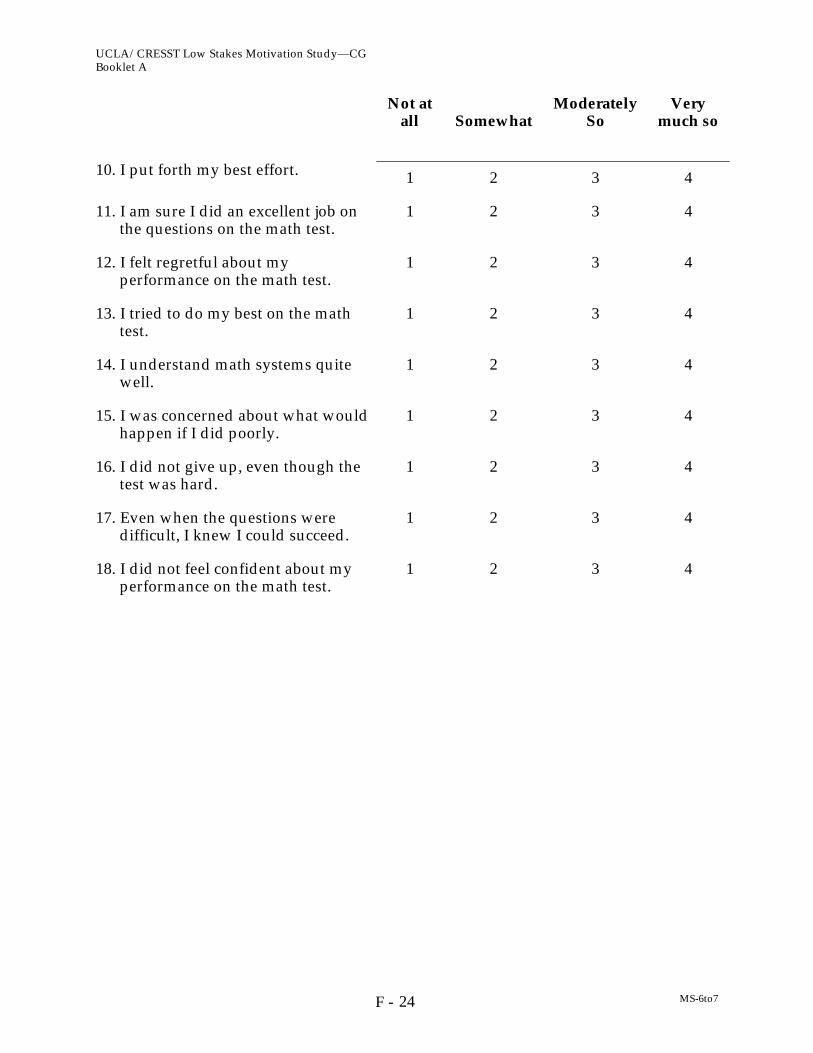
UCLA/CRESST Low Stakes Motivation Study—CGBooklet A
MS-6to724F -
Not atall Somewhat
ModeratelySo
Verymuch so
10. I put forth my best effort. 1 2 3 4
11. I am sure I did an excellent job onthe questions on the math test.
1 2 3 4
12. I felt regretful about myperformance on the math test.
1 2 3 4
13. I tried to do my best on the mathtest.
1 2 3 4
14. I understand math systems quitewell.
1 2 3 4
15. I was concerned about what wouldhappen if I did poorly.
1 2 3 4
16. I did not give up, even though thetest was hard.
1 2 3 4
17. Even when the questions weredifficult, I knew I could succeed.
1 2 3 4
18. I did not feel confident about myperformance on the math test.
1 2 3 4
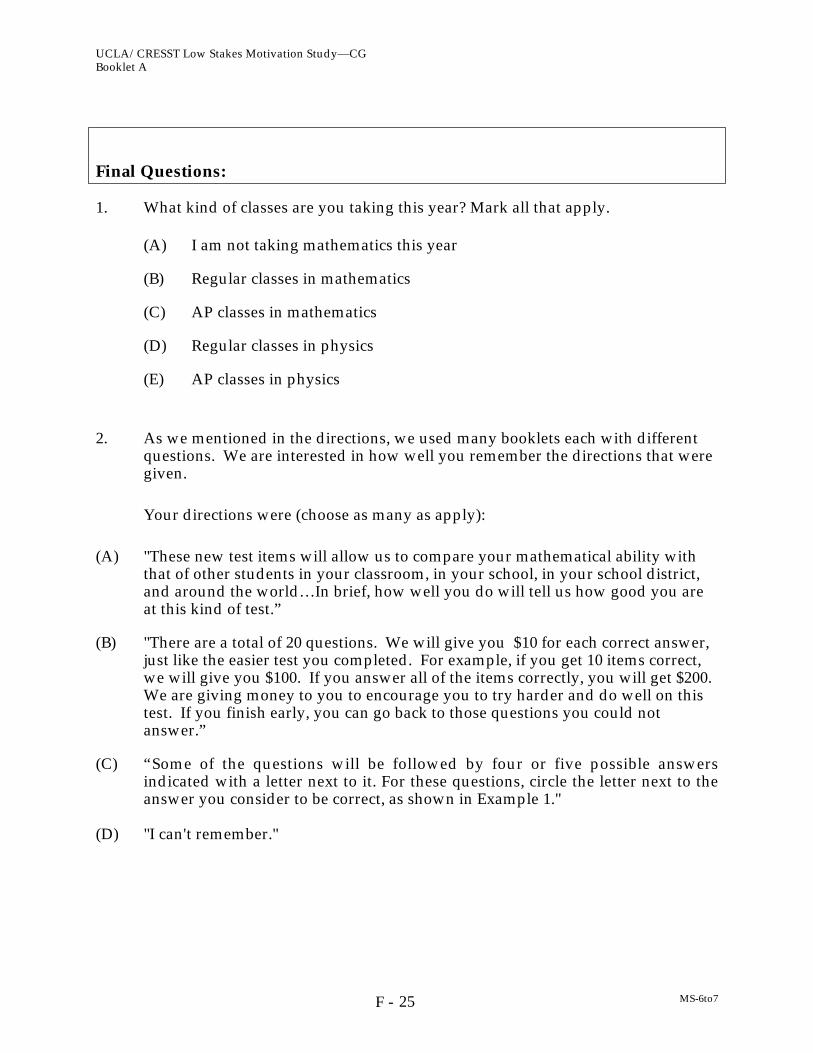
UCLA/CRESST Low Stakes Motivation Study—CGBooklet A
MS-6to725F -
Final Questions:
1. What kind of classes are you taking this year? Mark all that apply.
(A) I am not taking mathematics this year
(B) Regular classes in mathematics
(C) AP classes in mathematics
(D) Regular classes in physics
(E) AP classes in physics
2. As we mentioned in the directions, we used many booklets each with differentquestions. We are interested in how well you remember the directions that weregiven.
Your directions were (choose as many as apply):
(A) "These new test items will allow us to compare your mathematical ability withthat of other students in your classroom, in your school, in your school district,and around the world…In brief, how well you do will tell us how good you areat this kind of test.”
(B) "There are a total of 20 questions. We will give you $10 for each correct answer,just like the easier test you completed. For example, if you get 10 items correct,we will give you $100. If you answer all of the items correctly, you will get $200.We are giving money to you to encourage you to try harder and do well on thistest. If you finish early, you can go back to those questions you could notanswer.”
(C) “Some of the questions will be followed by four or five possible answersindicated with a letter next to it. For these questions, circle the letter next to theanswer you consider to be correct, as shown in Example 1."
(D) "I can't remember."
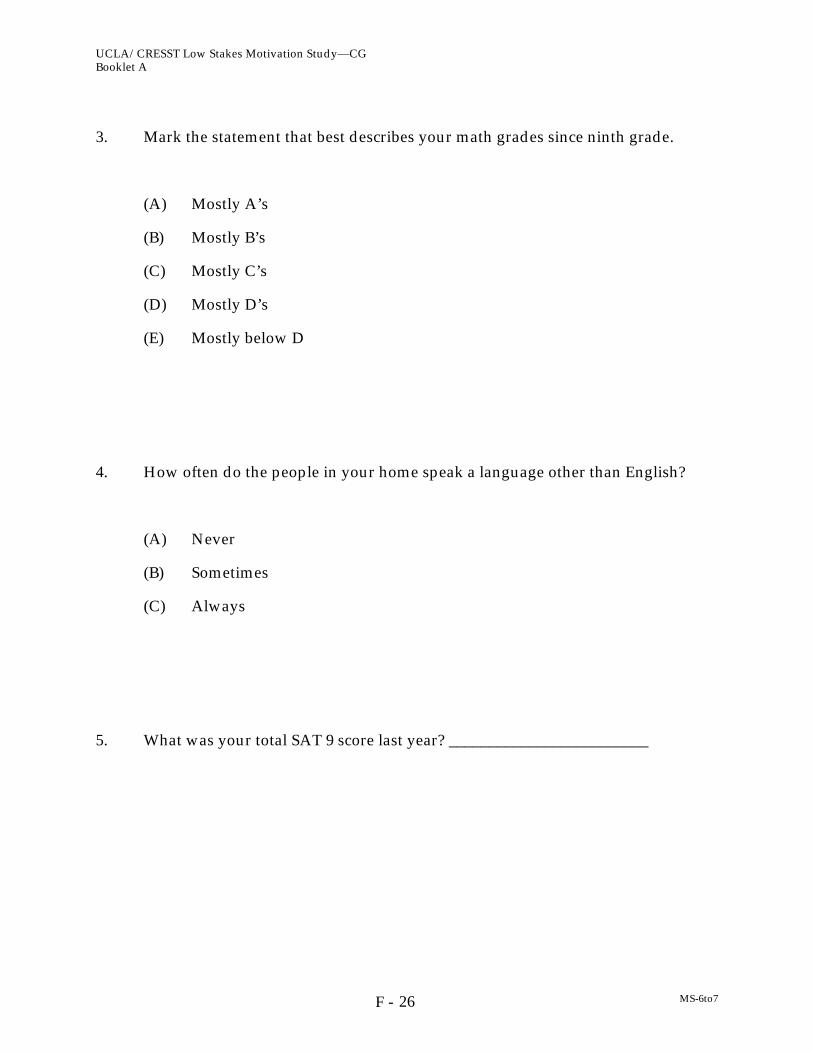
UCLA/CRESST Low Stakes Motivation Study—CGBooklet A
MS-6to726F -
3. Mark the statement that best describes your math grades since ninth grade.
(A) Mostly A’s
(B) Mostly B’s
(C) Mostly C’s
(D) Mostly D’s
(E) Mostly below D
4. How often do the people in your home speak a language other than English?
(A) Never
(B) Sometimes
(C) Always
5. What was your total SAT 9 score last year? _________________________
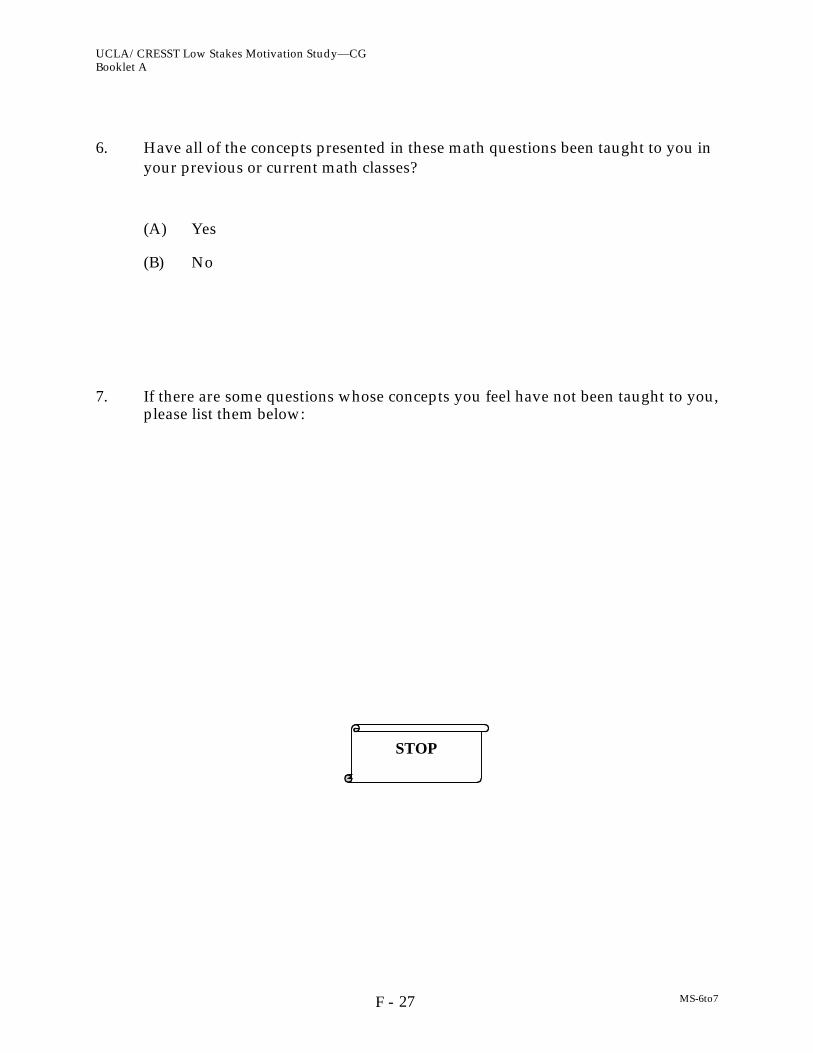
UCLA/CRESST Low Stakes Motivation Study—CGBooklet A
MS-6to727F -
6. Have all of the concepts presented in these math questions been taught to you inyour previous or current math classes?
(A) Yes
(B) No
7. If there are some questions whose concepts you feel have not been taught to you,please list them below:
STOP
UCLA/CRESST Low Stakes Motivation Study—IGBooklet A
MS-6to728F -
UCLA/CRESST STUDY
Name: ______________________________
Gender: Male or Female (circle one)
UCLA/CRESST Low Stakes Motivation Study—IGBooklet A
MS-6to729F -
SECTION 1
GENERAL DIRECTIONS
In this booklet, you will find questions about mathematics. Because there are differentbooklets, the other students around you may be working on booklets that are differentfrom yours. You will have 25 minutes to answer all of the questions in this section.Read each question carefully and answer it as well as you can.
You will be told when to begin work on this booklet. If you finish answering thequestions before time is called, you may go over your work and review your answers.
If you decide to change an answer to a question, cross out or completely erase your firstchoice and then circle the letter next to the answer you consider correct.
For other questions you will be asked to write short answers in the space provided inyour booklet. For these questions, you may use words, drawings, numbers, orequations in your answers.
Even if you use a calculator, when the question asks you to show ALL of your work it isvery important that you give as complete an answer as you can. Please use the extraspace on the page to do your work. You will not be penalized for guessing or providingincorrect responses so you should attempt to answer every question.
STOP
UCLA/CRESST Low Stakes Motivation Study—IGBooklet A
MS-6to730F -
SECTION 2
SAMPLE QUESTIONS
DIRECTIONS: Read each question carefully and answer it as well as you can.
1. Which of the numbers below is the smallest?
A. 3
B. 1
C. 4
D. 7
2. Which of the numbers below is an even number?
A. 2
B. 5
C. 3
D. 1
STOP
UCLA/CRESST Low Stakes Motivation Study—IGBooklet A
MS-6to731F -
SECTION 3
MATH ASSESSMENT
UCLA/CRESST Low Stakes Motivation Study—IGBooklet A
MS-6to732F -
1. Experts say that 25% of all serious bicycle accidents involve injuries and that,of all head injuries, 80% are fatal.
What percentage of all serous bicycle accidents involve fatal head injuries?
A. 16%
B. 20%
C. 55%
D. 105%
A-3
UCLA/CRESST Low Stakes Motivation Study—IGBooklet A
MS-6to733F -
2. If the population increases by the same rate from the year 1990 to the year2000 as in the years from 1980 to 1990, approximately what is the expectedpopulation by the year 2000?
A. 47 million
B. 50 million
C. 53 million
D. 58 million
A-4
UCLA/CRESST Low Stakes Motivation Study—IGBooklet A
MS-6to734F -
3. A school club is planning a bus trip to the wildlife park. A bus which will holdup to 45 people will cost 600 centros (units of money) and admission tickets cost30 centros each.
If the cost of the trip, including bus and admission ticket, is set at 50 centros perperson, what is the minimum number of people who must participate to ensurethat these costs are covered?
A. 12
B. 20
C. 30
D. 45
A-5

UCLA/CRESST Low Stakes Motivation Study—IGBooklet A
MS-6to735F -
4. The graphs give information about sales of CDs and other sound recordingmedia in Zedland. Zeds are the monetary units used in Zedland.
A-8
With the aid of both graphs calculate how much money was spent by 12-19year olds on CDs in 1992. Show your work.
Value of various sound recording media sold in Zedland (millions of zeds)
0
100
200
300
400
500
600
700
800
1987 1988 1989 1990 1991 1992
music cassettesrecordsCD
UCLA/CRESST Low Stakes Motivation Study—IGBooklet A
MS-6to736F -
5. Using the set of axes below, sketch a graph which shows the relationshipbetween the height of a person and his/her age from birth to 30 years. Besure to label your graph, and include a realistic scale on each axis.
A-10
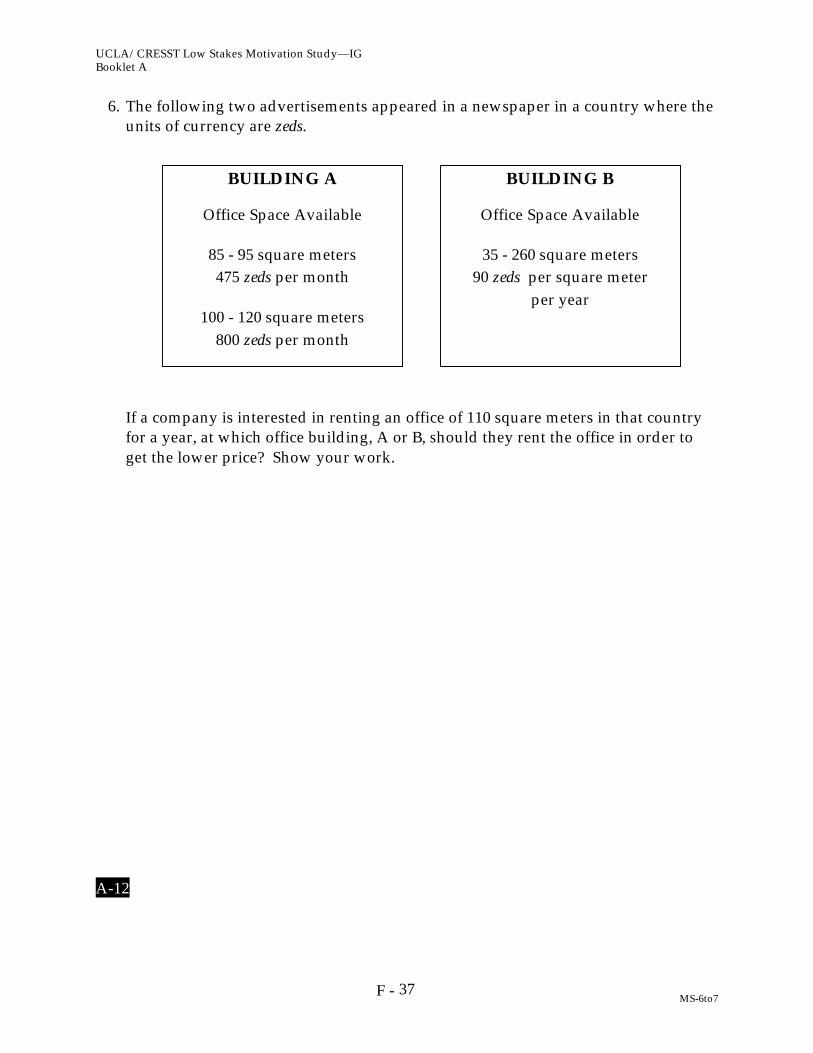
UCLA/CRESST Low Stakes Motivation Study—IGBooklet A
MS-6to737F -
6. The following two advertisements appeared in a newspaper in a country where theunits of currency are zeds.
If a company is interested in renting an office of 110 square meters in that countryfor a year, at which office building, A or B, should they rent the office in order toget the lower price? Show your work.
A-12
BUILDING A
Office Space Available
85 - 95 square meters475 zeds per month
100 - 120 square meters800 zeds per month
BUILDING B
Office Space Available
35 - 260 square meters90 zeds per square meter
per year
UCLA/CRESST Low Stakes Motivation Study—IGBooklet A
MS-6to738F -
7. A 45,000-litre water tank is to be filled at the rate of 220 liters per minute.
Estimate to the nearest half an hour, how long it will take to fill the tank.
A. 4 hours
B. 3 1/2 hours
C. 3 hours
D. 2 1/2 hours
D-6
UCLA/CRESST Low Stakes Motivation Study—IGBooklet A
MS-6to739F -
8. If there are 300 calories in 100 grams of a certain food, how many calories are therein a 30-gram portion of that food?
A. 90
B. 100
C. 900
D. 1000
E. 9000
D-7

UCLA/CRESST Low Stakes Motivation Study—IGBooklet A
MS-6to740F -
9. In a vineyard there are 210 rows of vines. Each row is 192 m long and plants areplanted 4 m apart. On average, each plant produces 9 kg of grapes each season.
The total amount of grapes produced by the vineyard each season is closest to
A. 10 000 kg
B. 100 000 kg
C. 400 000 kg
D. 1 600 000 kg
D-8
UCLA/CRESST Low Stakes Motivation Study—IGBooklet A
MS-6to741F -
10. A store is having a '20% off' sale. The normal price of a stereo system is $1250.
What is the price of the stereo system after the 20 % discount is applied?
A. $1000
B. $1050
C. $1230
D. $1500
D-9
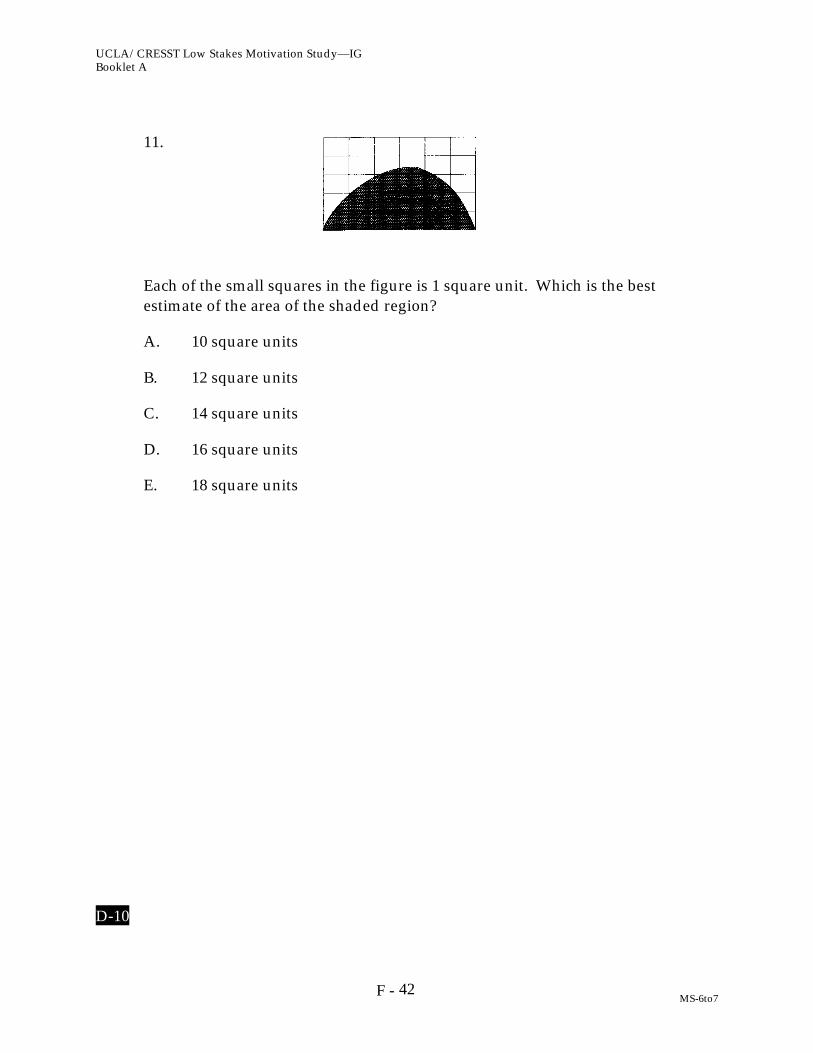
UCLA/CRESST Low Stakes Motivation Study—IGBooklet A
MS-6to742F -
11.
Each of the small squares in the figure is 1 square unit. Which is the bestestimate of the area of the shaded region?
A. 10 square units
B. 12 square units
C. 14 square units
D. 16 square units
E. 18 square units
D-10
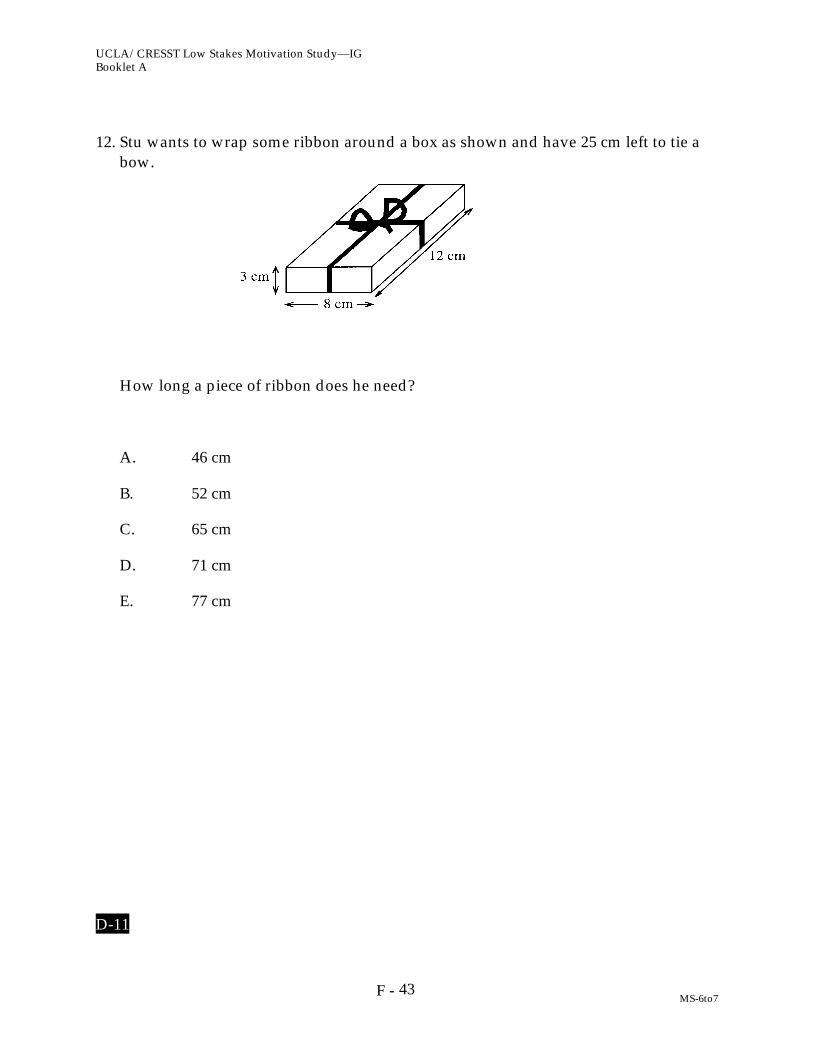
UCLA/CRESST Low Stakes Motivation Study—IGBooklet A
MS-6to743F -
12. Stu wants to wrap some ribbon around a box as shown and have 25 cm left to tie abow.
How long a piece of ribbon does he need?
A. 46 cm
B. 52 cm
C. 65 cm
D. 71 cm
E. 77 cm
D-11
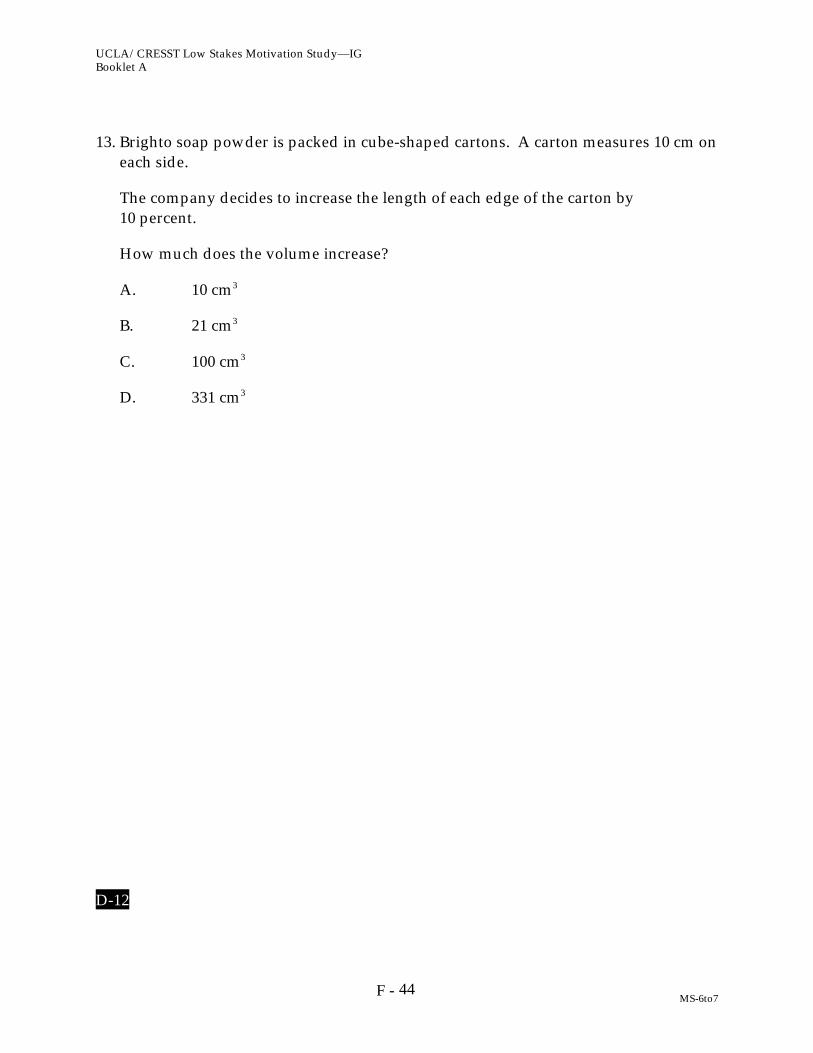
UCLA/CRESST Low Stakes Motivation Study—IGBooklet A
MS-6to744F -
13. Brighto soap powder is packed in cube-shaped cartons. A carton measures 10 cm oneach side.
The company decides to increase the length of each edge of the carton by10 percent.
How much does the volume increase?
A. 10 cm3
B. 21 cm3
C. 100 cm3
D. 331 cm3
D-12
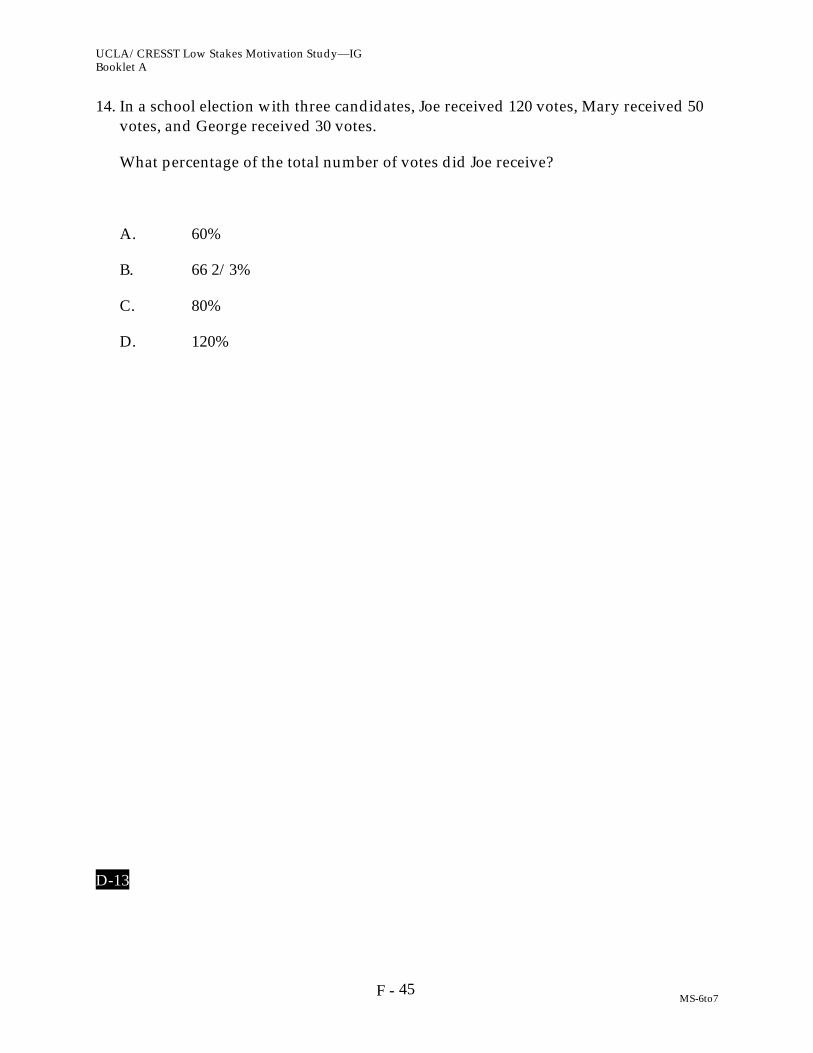
UCLA/CRESST Low Stakes Motivation Study—IGBooklet A
MS-6to745F -
14. In a school election with three candidates, Joe received 120 votes, Mary received 50votes, and George received 30 votes.
What percentage of the total number of votes did Joe receive?
A. 60%
B. 66 2/3%
C. 80%
D. 120%
D-13
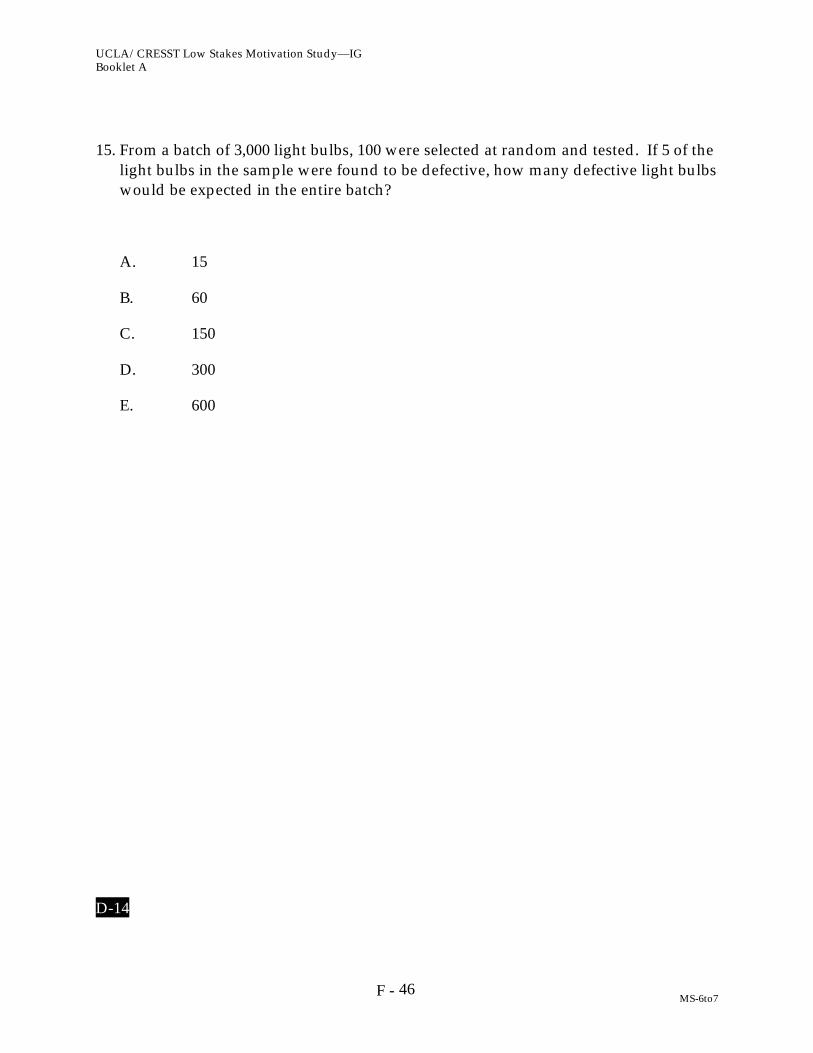
UCLA/CRESST Low Stakes Motivation Study—IGBooklet A
MS-6to746F -
15. From a batch of 3,000 light bulbs, 100 were selected at random and tested. If 5 of thelight bulbs in the sample were found to be defective, how many defective light bulbswould be expected in the entire batch?
A. 15
B. 60
C. 150
D. 300
E. 600
D-14
UCLA/CRESST Low Stakes Motivation Study—IGBooklet A
MS-6to747F -
16. Kelly went for a drive in her car. During the drive, a cat ran in front of the car.Kelly slammed on the brakes and missed the cat.
Slightly shaken, Kelly decided to return home by a shorter route. The graphbelow is a record of the car's speed during the drive.
a) What was the maximum speed of the car during the drive?
b) What time was it when Kelly slammed on the brakes to avoid the cat?
D-15a
D-15b
UCLA/CRESST Low Stakes Motivation Study—IGBooklet A
MS-6to748F -
17. Teresa wants to record 5 songs on tape. The length of time each song plays foris shown in the table.
Song Length of Time
1
2
3
4
5
2 minutes 41 seconds
3 minutes 10 seconds
2 minutes 51 seconds
3 minutes
3 minutes 32 seconds
Estimate to the nearest minute the total time taken for all five songs to play andexplain how this estimate was made.
Estimate: _______________________
Explain:
D-16a
D-16b
UCLA/CRESST Low Stakes Motivation Study—IGBooklet A
MS-6to749F -
18. A TV reporter showed this graph and said:
"There's been a huge increase in the number of robberies this year."
Do you consider the reporter's statement to be a reasonable interpretation of thegraph? Briefly explain.
D-17
STOP
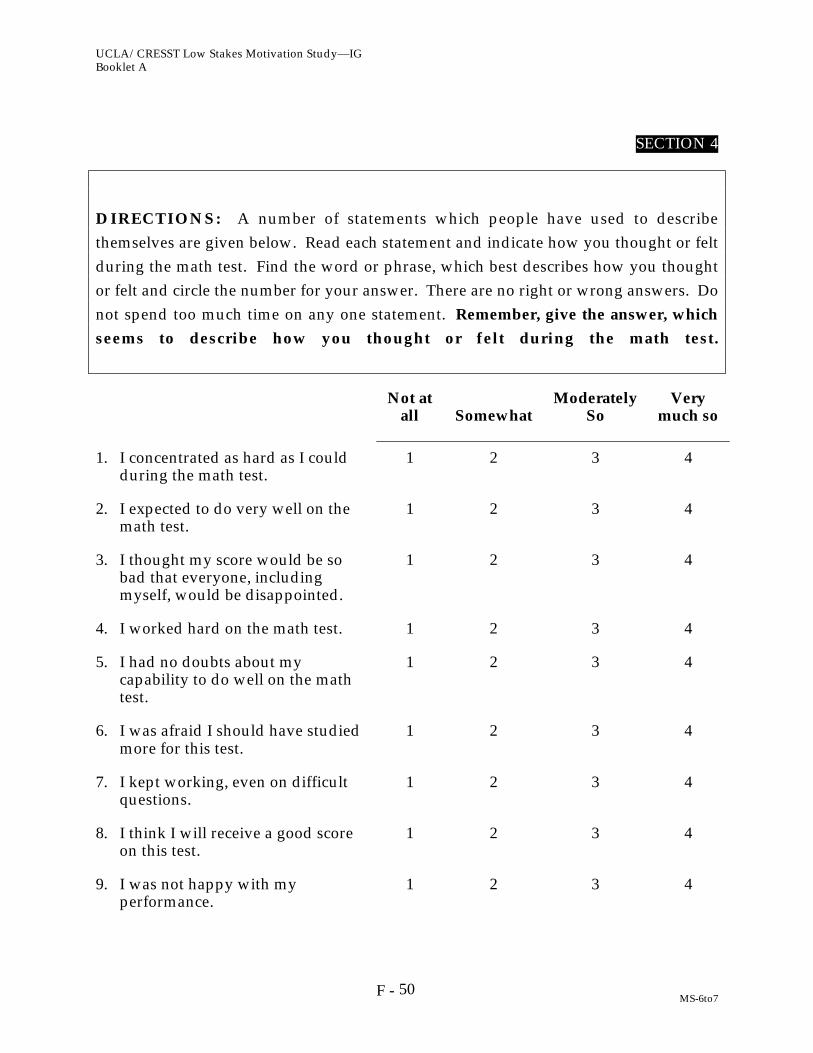
UCLA/CRESST Low Stakes Motivation Study—IGBooklet A
MS-6to750F -
SECTION 4
DIRECTIONS: A number of statements which people have used to describethemselves are given below. Read each statement and indicate how you thought or feltduring the math test. Find the word or phrase, which best describes how you thoughtor felt and circle the number for your answer. There are no right or wrong answers. Donot spend too much time on any one statement. Remember, give the answer, which
seems to describe how you thought or felt during the math test.
Not atall Somewhat
ModeratelySo
Verymuch so
1. I concentrated as hard as I couldduring the math test.
1 2 3 4
2. I expected to do very well on themath test.
1 2 3 4
3. I thought my score would be sobad that everyone, includingmyself, would be disappointed.
1 2 3 4
4. I worked hard on the math test. 1 2 3 4
5. I had no doubts about mycapability to do well on the mathtest.
1 2 3 4
6. I was afraid I should have studiedmore for this test.
1 2 3 4
7. I kept working, even on difficultquestions.
1 2 3 4
8. I think I will receive a good scoreon this test.
1 2 3 4
9. I was not happy with myperformance.
1 2 3 4
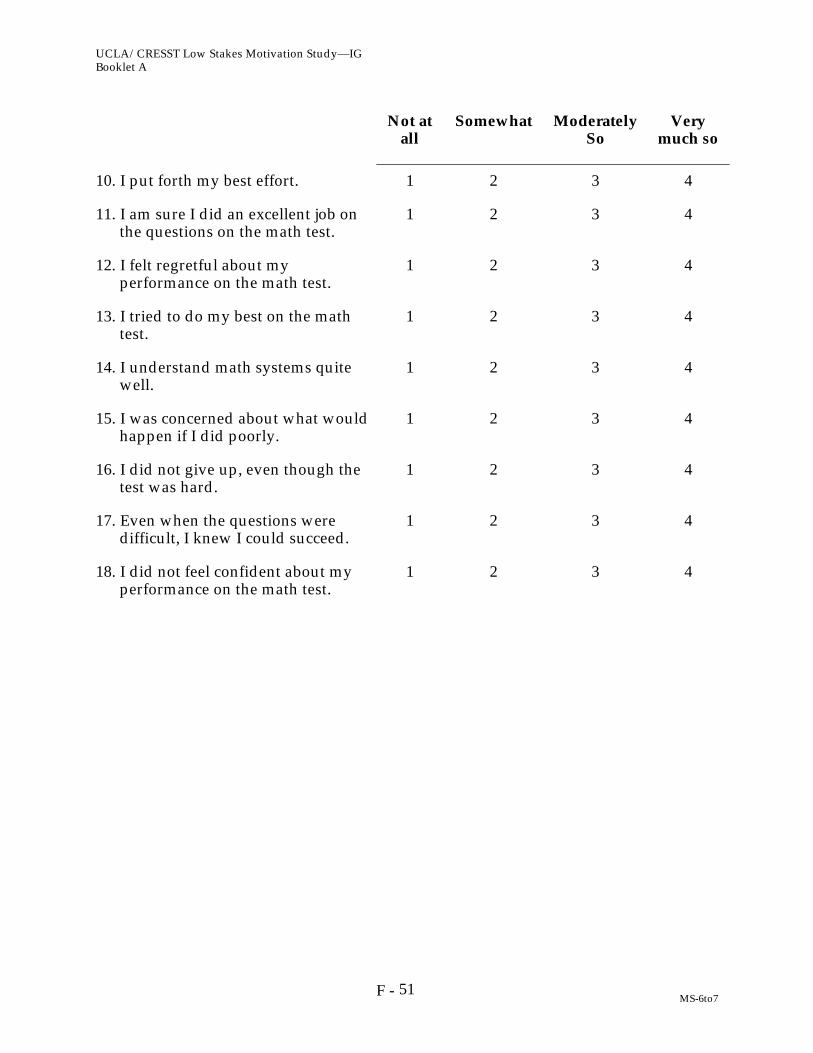
UCLA/CRESST Low Stakes Motivation Study—IGBooklet A
MS-6to751F -
Not atall
Somewhat ModeratelySo
Verymuch so
10. I put forth my best effort. 1 2 3 4
11. I am sure I did an excellent job onthe questions on the math test.
1 2 3 4
12. I felt regretful about myperformance on the math test.
1 2 3 4
13. I tried to do my best on the mathtest.
1 2 3 4
14. I understand math systems quitewell.
1 2 3 4
15. I was concerned about what wouldhappen if I did poorly.
1 2 3 4
16. I did not give up, even though thetest was hard.
1 2 3 4
17. Even when the questions weredifficult, I knew I could succeed.
1 2 3 4
18. I did not feel confident about myperformance on the math test.
1 2 3 4

UCLA/CRESST Low Stakes Motivation Study—IGBooklet A
MS-6to752F -
Final Questions:
1. What kind of classes are you taking this year? Mark all that apply.
(A) I am not taking mathematics this year
(B) Regular classes in mathematics
(C) AP classes in mathematics
(D) Regular classes in physics
(E) AP classes in physics
2. As we mentioned in the directions, we used many booklets each with differentquestions. We are interested in how well you remember the directions that weregiven.
Your directions were (choose as many as apply):
(A) "These new test items will allow us to compare your mathematical ability withthat of other students in your classroom, in your school, in your school district,and around the world…In brief, how well you do will tell us how good you areat this kind of test.”
(B) "There are a total of 20 questions. We will give you $10 for each correct answer,just like the easier test you completed. For example, if you get 10 items correct,we will give you $100. If you answer all of the items correctly, you will get $200.We are giving money to you to encourage you to try harder and do well on thistest. If you finish early, you can go back to those questions you could notanswer.”
(C) “Some of the questions will be followed by four or five possible answersindicated with a letter next to it. For these questions, circle the letter next to theanswer you consider to be correct, as shown in Example 1."
(D) "I can't remember."
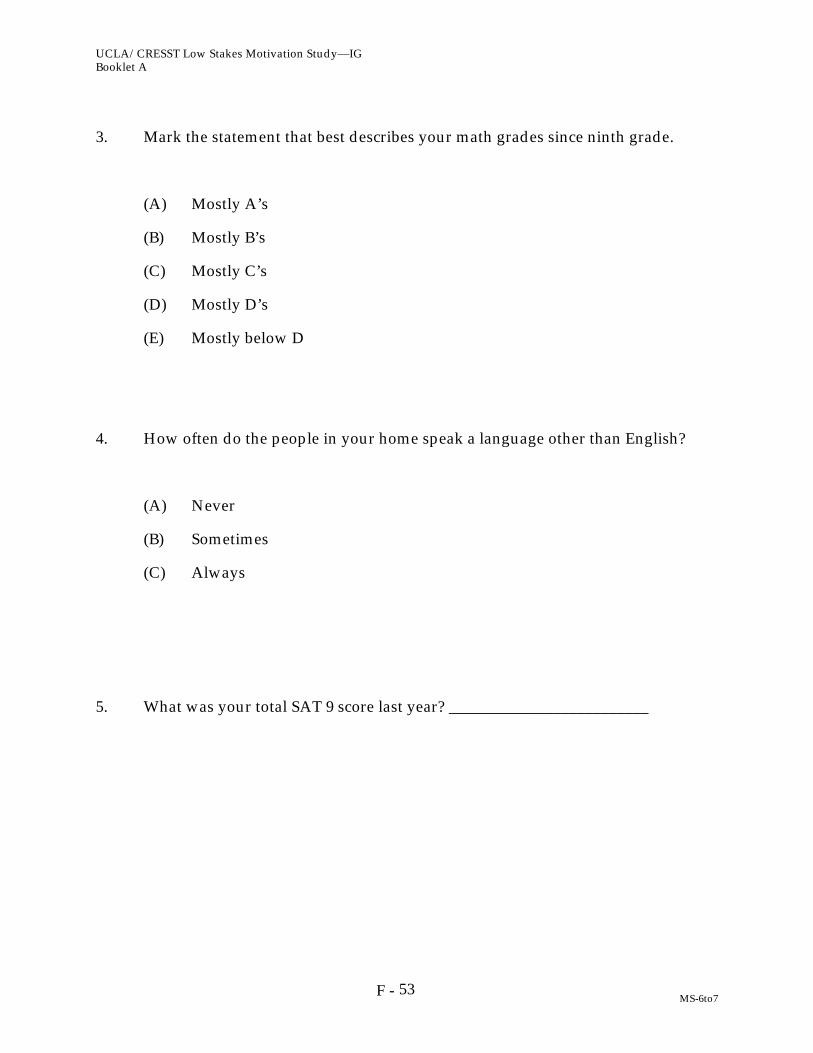
UCLA/CRESST Low Stakes Motivation Study—IGBooklet A
MS-6to753F -
3. Mark the statement that best describes your math grades since ninth grade.
(A) Mostly A’s
(B) Mostly B’s
(C) Mostly C’s
(D) Mostly D’s
(E) Mostly below D
4. How often do the people in your home speak a language other than English?
(A) Never
(B) Sometimes
(C) Always
5. What was your total SAT 9 score last year? _________________________
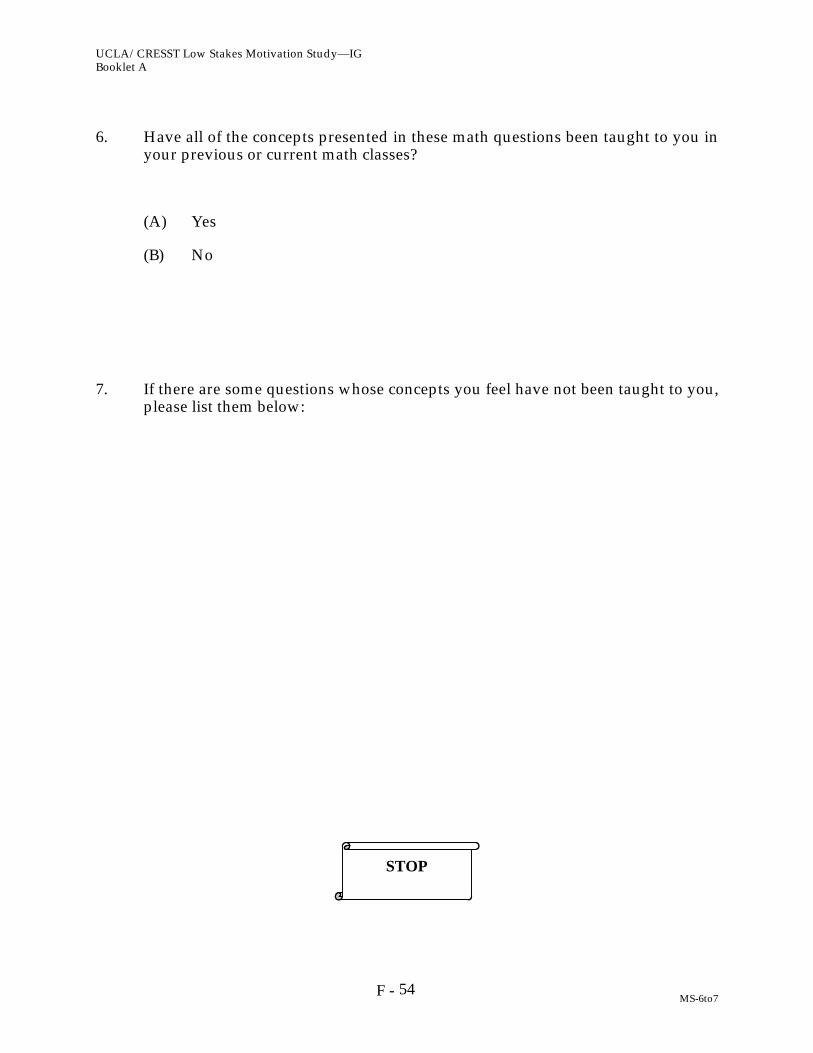
UCLA/CRESST Low Stakes Motivation Study—IGBooklet A
MS-6to754F -
6. Have all of the concepts presented in these math questions been taught to you inyour previous or current math classes?
(A) Yes
(B) No
7. If there are some questions whose concepts you feel have not been taught to you,please list them below:
STOP
UCLA/CRESST Low Stakes Motivation Study—IGBooklet A
MS-6to755F -
NAME: __________________________________
I received $ _________ for participating in the Incentive Group of the
UCLA/CRESST Low-Stakes Motivation Study.
SIGNATURE: __________________________________

Appendix G
Test Booklet B
Main Study(Control and Incentive)
—AND—
Test Booklet B
Advanced Placement Study(Control and Incentive)
Test Booklet A was not used for the Advanced Placement Group

1G -
Test Booklet B
Main Study(Control and Incentive)
UCLA/CRESST Low Stakes Motivation Study—CGBooklet B
MS-6to72G -
UCLA/CRESST STUDY
Name: ______________________________
Gender: Male or Female (circle one)

UCLA/CRESST Low Stakes Motivation Study—CGBooklet B
MS-6to73G -
SECTION 1
GENERAL DIRECTIONS
In this booklet, you will find questions about mathematics. Because there are differentbooklets, the other students around you may be working on booklets that are differentfrom yours. You will have 25 minutes to answer all of the questions in this section.Please read each question carefully and answer it as well as you can.
You will be told when to begin work on this booklet. If you finish answering thequestions before time is called, you may go over your work and review your answers.
If you decide to change an answer to a question, erase or cross out your first choice andthen circle the letter next to the answer you consider correct.
For other questions you will be asked to write short answers in the space provided inyour booklet. For these questions, you may use words, drawings, numbers, orequations in your answers.
Even if you use a calculator, when the question asks you to show ALL of your work it isvery important that you give as complete an answer as you can. Please use the extraspace on the page to do your work. You will not be penalized for guessing or providingincorrect responses so you should attempt to answer every question.
STOP

UCLA/CRESST Low Stakes Motivation Study—CGBooklet B
MS-6to74G -
SECTION 2
SAMPLE QUESTIONS
DIRECTIONS: Read each question carefully and answer it as well as you can.
1. Which of the numbers below is the smallest?
(A) 3
(B) 1
(C) 4
(D) 7
2. Which of the numbers below is an even number?
(A) 2
(B) 5
(C) 3
(D) 1
STOP

UCLA/CRESST Low Stakes Motivation Study—CGBooklet B
MS-6to75G -
SECTION 3
MATH ASSESSMENT

UCLA/CRESST Low Stakes Motivation Study—CGBooklet B
MS-6to76G -
1. A TV reporter showed this graph and said:
"There's been a huge increase in the number of robberies this year."
Do you consider the reporter's statement to be a reasonable interpretation of thegraph? Briefly explain.
D-17
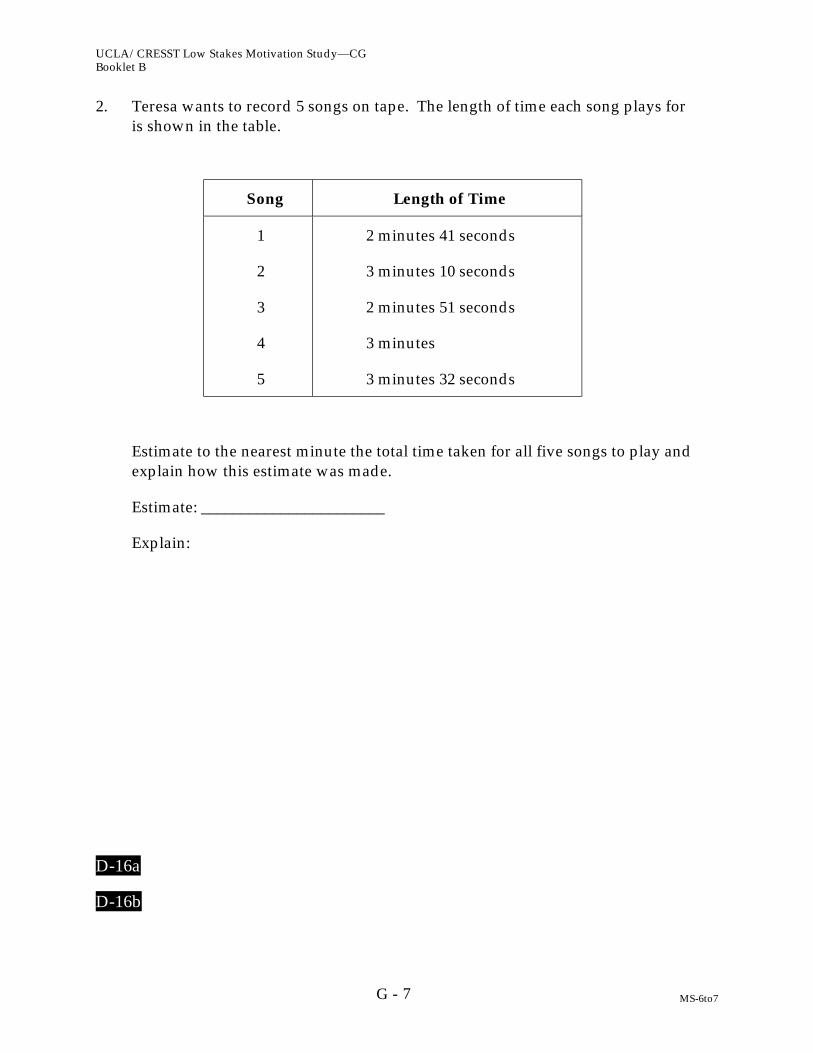
UCLA/CRESST Low Stakes Motivation Study—CGBooklet B
MS-6to77G -
2. Teresa wants to record 5 songs on tape. The length of time each song plays foris shown in the table.
Song Length of Time
1
2
3
4
5
2 minutes 41 seconds
3 minutes 10 seconds
2 minutes 51 seconds
3 minutes
3 minutes 32 seconds
Estimate to the nearest minute the total time taken for all five songs to play andexplain how this estimate was made.
Estimate: _______________________
Explain:
D-16a
D-16b

UCLA/CRESST Low Stakes Motivation Study—CGBooklet B
MS-6to78G -
3. Kelly went for a drive in her car. During the drive, a cat ran in front of the car.Kelly slammed on the brakes and missed the cat.
Slightly shaken, Kelly decided to return home by a shorter route. The graphbelow is a record of the car's speed during the drive.
a) What was the maximum speed of the car during the drive?
b) What time was it when Kelly slammed on the brakes to avoid the cat?
D-15a
D-15b

UCLA/CRESST Low Stakes Motivation Study—CGBooklet B
MS-6to79G -
4. From a batch of 3,000 light bulbs, 100 were selected at random and tested. If 5 ofthe light bulbs in the sample were found to be defective, how many defective lightbulbs would be expected in the entire batch?
A. 15
B. 60
C. 150
D. 300
E. 600
D-14
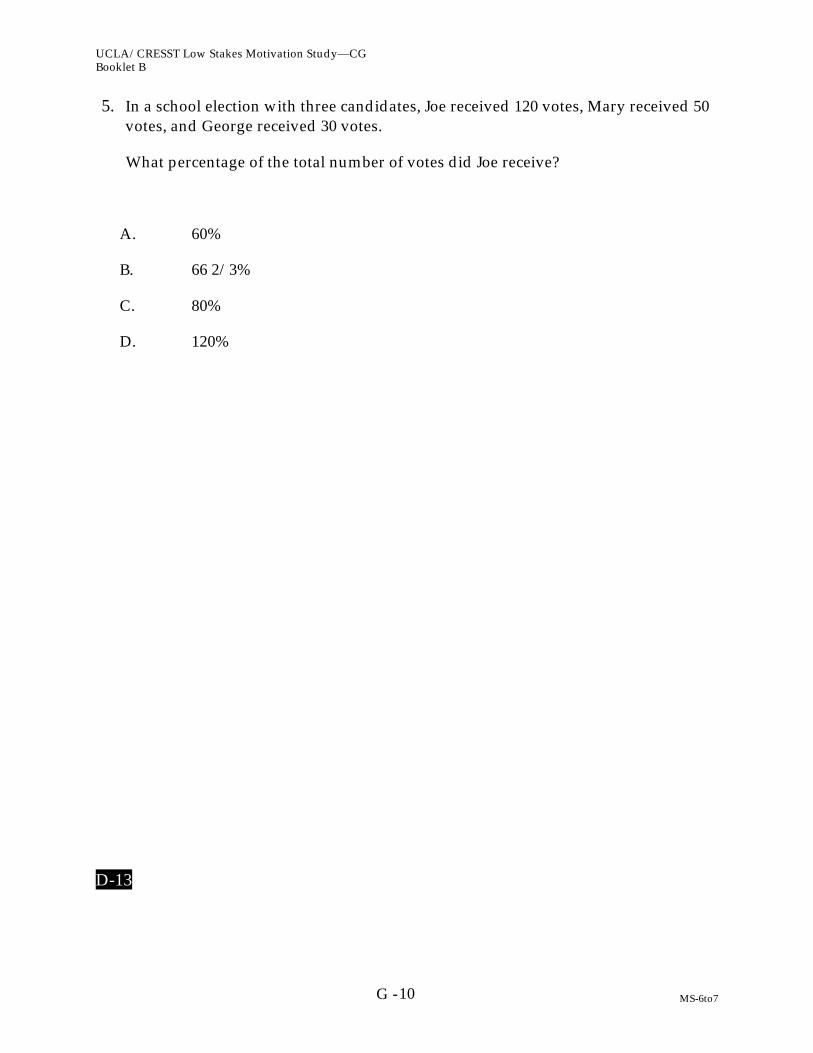
UCLA/CRESST Low Stakes Motivation Study—CGBooklet B
MS-6to710G -
5. In a school election with three candidates, Joe received 120 votes, Mary received 50votes, and George received 30 votes.
What percentage of the total number of votes did Joe receive?
A. 60%
B. 66 2/3%
C. 80%
D. 120%
D-13
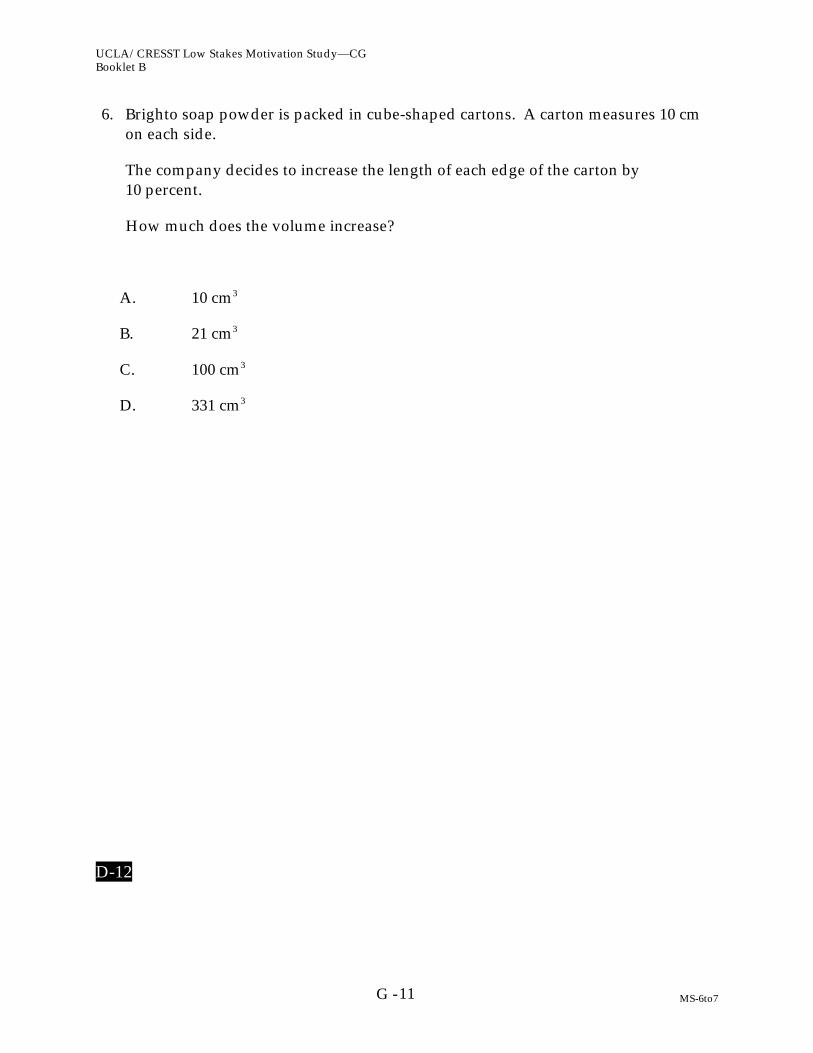
UCLA/CRESST Low Stakes Motivation Study—CGBooklet B
MS-6to711G -
6. Brighto soap powder is packed in cube-shaped cartons. A carton measures 10 cmon each side.
The company decides to increase the length of each edge of the carton by10 percent.
How much does the volume increase?
A. 10 cm3
B. 21 cm3
C. 100 cm3
D. 331 cm3
D-12

UCLA/CRESST Low Stakes Motivation Study—CGBooklet B
MS-6to712G -
7. Stu wants to wrap some ribbon around a box as shown and have 25 cm left to tie abow.
How long a piece of ribbon does he need?
A. 46 cm
B. 52 cm
C. 65 cm
D. 71 cm
E. 77 cm
D-11
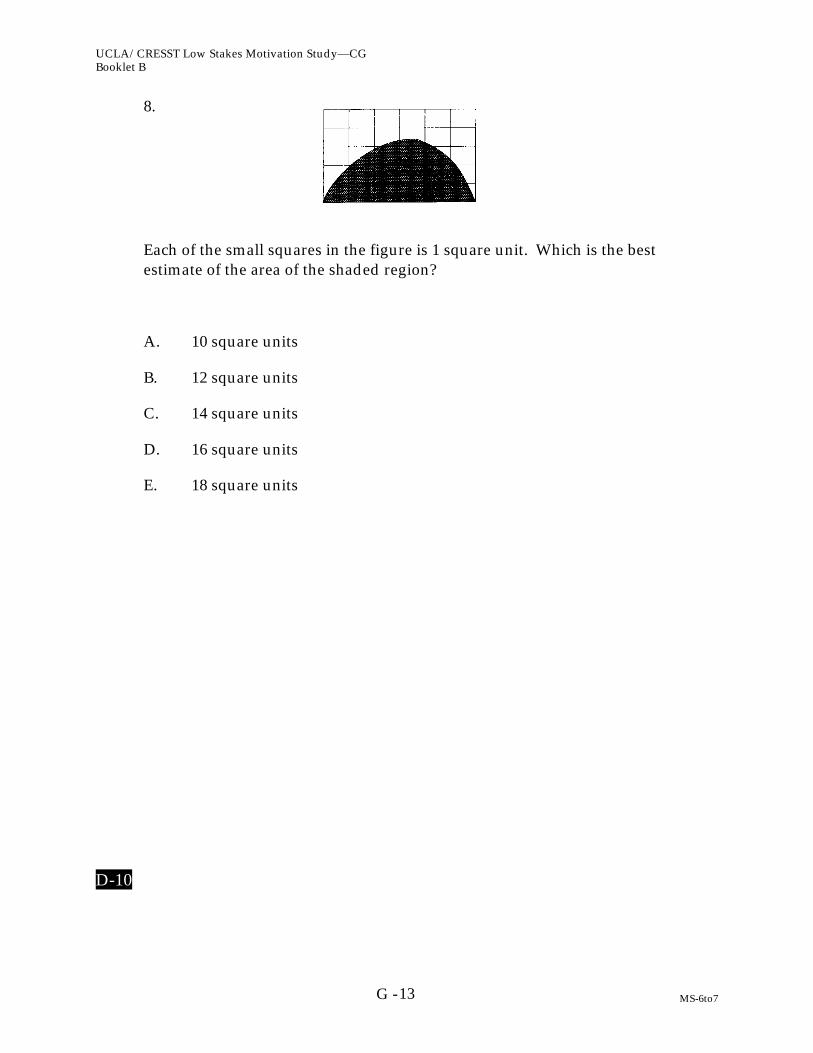
UCLA/CRESST Low Stakes Motivation Study—CGBooklet B
MS-6to713G -
8.
Each of the small squares in the figure is 1 square unit. Which is the bestestimate of the area of the shaded region?
A. 10 square units
B. 12 square units
C. 14 square units
D. 16 square units
E. 18 square units
D-10

UCLA/CRESST Low Stakes Motivation Study—CGBooklet B
MS-6to714G -
9. A store is having a '20% off' sale. The normal price of a stereo system is $1250.
What is the price of the stereo system after the 20 % discount is applied?
A. $1000
B. $1050
C. $1230
D. $1500
D-9

UCLA/CRESST Low Stakes Motivation Study—CGBooklet B
MS-6to715G -
10. In a vineyard there are 210 rows of vines. Each row is 192 m long and plants areplanted 4 m apart. On average, each plant produces 9 kg of grapes each season.
The total amount of grapes produced by the vineyard each season is closest to
A. 10 000 kg
B. 100 000 kg
C. 400 000 kg
D. 1 600 000 kg
D-8

UCLA/CRESST Low Stakes Motivation Study—CGBooklet B
MS-6to716G -
11. If there are 300 calories in 100 grams of a certain food, how many calories are therein a 30-gram portion of that food?
A. 90
B. 100
C. 900
D. 1000
E. 9000
D-7
UCLA/CRESST Low Stakes Motivation Study—CGBooklet B
MS-6to717G -
12. A 45,000-litre water tank is to be filled at the rate of 220 liters per minute.
Estimate to the nearest half an hour, how long it will take to fill the tank.
A. 4 hours
B. 3 1/2 hours
C. 3 hours
D. 2 1/2 hours
D-6

UCLA/CRESST Low Stakes Motivation Study—CGBooklet B
MS-6to718G -
13. The following two advertisements appeared in a newspaper in a country where theunits of currency are zeds.
If a company is interested in renting an office of 110 square meters in that countryfor a year, at which office building, A or B, should they rent the office in order toget the lower price? Show your work.
A-12
BUILDING A
Office Space Available
85 - 95 square meters475 zeds per month
100 - 120 square meters800 zeds per month
BUILDING B
Office Space Available
35 - 260 square meters90 zeds per square meter
per year

UCLA/CRESST Low Stakes Motivation Study—CGBooklet B
MS-6to719G -
14. Using the set of axes below, sketch a graph which shows the relationshipbetween the height of a person and his/her age from birth to 30 years. Besure to label your graph, and include a realistic scale on each axis.
A-10

UCLA/CRESST Low Stakes Motivation Study—CGBooklet B
MS-6to720G -
15. The graphs give information about sales of CDs and other sound recordingmedia in Zedland. Zeds are the monetary units used in Zedland.
With the aid of both graphs calculate how much money was spentby 12-19 year olds on CDs in 1992. Show your work.
A-8
Value of various sound recording media sold in Zedland (millions of zeds)
0
100
200
300
400
500
600
700
800
1987 1988 1989 1990 1991 1992
music cassettesrecordsCD
UCLA/CRESST Low Stakes Motivation Study—CGBooklet B
MS-6to721G -
16. A school club is planning a bus trip to the wildlife park. A bus which will hold upto 45 people will cost 600 centros (units of money) and admission tickets cost 30centros each.
If the cost of the trip, including bus and admission ticket, is set at 50 centros perperson, what is the minimum number of people who must participate to ensurethat these costs are covered?
A. 12
B. 20
C. 30
D. 45
A-5
UCLA/CRESST Low Stakes Motivation Study—CGBooklet B
MS-6to722G -
17. If the population increases by the same rate from the year 1990 to the year2000 as in the years from 1980 to 1990, approximately what is the expectedpopulation by the year 2000?
A. 47 million
B. 50 million
C. 53 million
D. 58 million
A-4

UCLA/CRESST Low Stakes Motivation Study—CGBooklet B
MS-6to723G -
18. Experts say that 25% of all serious bicycle accidents involve injuries and that,of all head injuries, 80% are fatal.
What percentage of all serious bicycle accidents involve fatal headinjuries?
A. 16%
B. 20%
C. 55%
D. 105%
D-17
STOP

UCLA/CRESST Low Stakes Motivation Study—CGBooklet B
MS-6to724G -
SECTION 4
DIRECTIONS: A number of statements which people have used to describethemselves are given below. Read each statement and indicate how you thought or feltduring the math test. Find the word or phrase, which best describes how you thoughtor felt and circle the number for your answer. There are no right or wrong answers. Donot spend too much time on any one statement. Remember to give the answer that
best describes how you thought or felt during the math test.
Not atall Somewhat
ModeratelySo
Verymuch so
1. I concentrated as hard as I couldduring the math test.
1 2 3 4
2. I expected to do very well on themath test.
1 2 3 4
3. I thought my score would be sobad that everyone, includingmyself, would be disappointed.
1 2 3 4
4. I worked hard on the math test. 1 2 3 4
5. I had no doubts about mycapability to do well on the mathtest.
1 2 3 4
6. I was afraid I should have studiedmore for this test.
1 2 3 4
7. I kept working, even on difficultquestions.
1 2 3 4
8. I think I will receive a good scoreon this test.
1 2 3 4
9. I was not happy with myperformance.
1 2 3 4

UCLA/CRESST Low Stakes Motivation Study—CGBooklet B
MS-6to725G -
Not atall Somewhat
ModeratelySo
Verymuch so
10. I put forth my best effort. 1 2 3 4
11. I am sure I did an excellent job onthe questions on the math test.
1 2 3 4
12. I felt regretful about myperformance on the math test.
1 2 3 4
13. I tried to do my best on the mathtest.
1 2 3 4
14. I understand math systems quitewell.
1 2 3 4
15. I was concerned about what wouldhappen if I did poorly.
1 2 3 4
16. I did not give up, even though thetest was hard.
1 2 3 4
17. Even when the questions weredifficult, I knew I could succeed.
1 2 3 4
18. I did not feel confident about myperformance on the math test.
1 2 3 4

UCLA/CRESST Low Stakes Motivation Study—CGBooklet B
MS-6to726G -
Final Questions:
1. What kind of classes are you taking this year? Mark all that apply.
(A) I am not taking mathematics this year
(B) Regular classes in mathematics
(C) AP classes in mathematics
(D) Regular classes in physics
(E) AP classes in physics
2. As we mentioned in the directions, we used many booklets each with differentquestions. We are interested in how well you remember the directions that weregiven.
Your directions were (choose as many as apply):
(A) "These new test items will allow us to compare your mathematical ability withthat of other students in your classroom, in your school, in your school district,and around the world…In brief, how well you do will tell us how good you areat this kind of test.”
(B) "There are a total of 20 questions. We will give you $10 for each correct answer,just like the easier test you completed. For example, if you get 10 items correct,we will give you $100. If you answer all of the items correctly, you will get $200.We are giving money to you to encourage you to try harder and do well on thistest. If you finish early, you can go back to those questions you could notanswer.”
(C) “Some of the questions will be followed by four or five possible answersindicated with a letter next to it. For these questions, circle the letter next to theanswer you consider to be correct, as shown in Example 1."
(D) "I can't remember."
UCLA/CRESST Low Stakes Motivation Study—CGBooklet B
MS-6to727G -
3. What was your total SAT 9 score last year? _________________________
4. How often do the people in your home speak a language other than English?
(A) Never
(B) Sometimes
(C) Always
5. Mark the statement that best describes your math grades since ninth grade.
(A) Mostly A’s
(B) Mostly B’s
(C) Mostly C’s
(D) Mostly D’s
(E) Mostly below D

UCLA/CRESST Low Stakes Motivation Study—CGBooklet B
MS-6to728G -
6. Have all of the concepts presented in these math questions been taught to you inyour previous or current math classes?
(A) Yes
(B) No
7. If there are some questions whose concepts you feel have not been taught to you,please list them below:
STOP
UCLA/CRESST Low Stakes Motivation Study—IGBooklet B
MS-6to729G -
UCLA/CRESST STUDY
Name: ______________________________
Gender: Male or Female (circle one)
UCLA/CRESST Low Stakes Motivation Study—IGBooklet B
MS-6to730G -
SECTION 1
GENERAL DIRECTIONS
In this booklet, you will find questions about mathematics. Because there are differentbooklets, the other students around you may be working on booklets that are differentfrom yours. You will have 25 minutes to answer all of the questions in this section.Please read each question carefully and answer it as well as you can.
You will be told when to begin work on this booklet. If you finish answering thequestions before time is called, you may go over your work and review your answers.
If you decide to change an answer to a question, erase or cross out your first choice andthen circle the letter next to the answer you consider correct.
For other questions you will be asked to write short answers in the space provided inyour booklet. For these questions, you may use words, drawings, numbers, orequations in your answers.
Even if you use a calculator, when the question asks you to show ALL of your work it isvery important that you give as complete an answer as you can. Please use the extraspace on the page to do your work. You will not be penalized for guessing or providingincorrect responses so you should attempt to answer every question.
STOP

UCLA/CRESST Low Stakes Motivation Study—IGBooklet B
MS-6to731G -
SECTION 2
SAMPLE QUESTIONS
DIRECTIONS: Read each question carefully and answer it as well as you can.
1. Which of the numbers below is the smallest?
(A) 3
(B) 1
(C) 4
(D) 7
2. Which of the numbers below is an even number?
(A) 2
(B) 5
(C) 3
(D) 1
STOP

UCLA/CRESST Low Stakes Motivation Study—IGBooklet B
MS-6to732G -
SECTION 3
MATH ASSESSMENT
UCLA/CRESST Low Stakes Motivation Study—IGBooklet B
MS-6to733G -
1. A TV reporter showed this graph and said:
"There's been a huge increase in the number of robberies this year."
Do you consider the reporter's statement to be a reasonable interpretation of thegraph? Briefly explain.
D-17
UCLA/CRESST Low Stakes Motivation Study—IGBooklet B
MS-6to734G -
2. Teresa wants to record 5 songs on tape. The length of time each song plays foris shown in the table.
Song Length of Time
1
2
3
4
5
2 minutes 41 seconds
3 minutes 10 seconds
2 minutes 51 seconds
3 minutes
3 minutes 32 seconds
Estimate to the nearest minute the total time taken for all five songs to play andexplain how this estimate was made.
Estimate: _______________________
Explain:
D-16a
D-16b
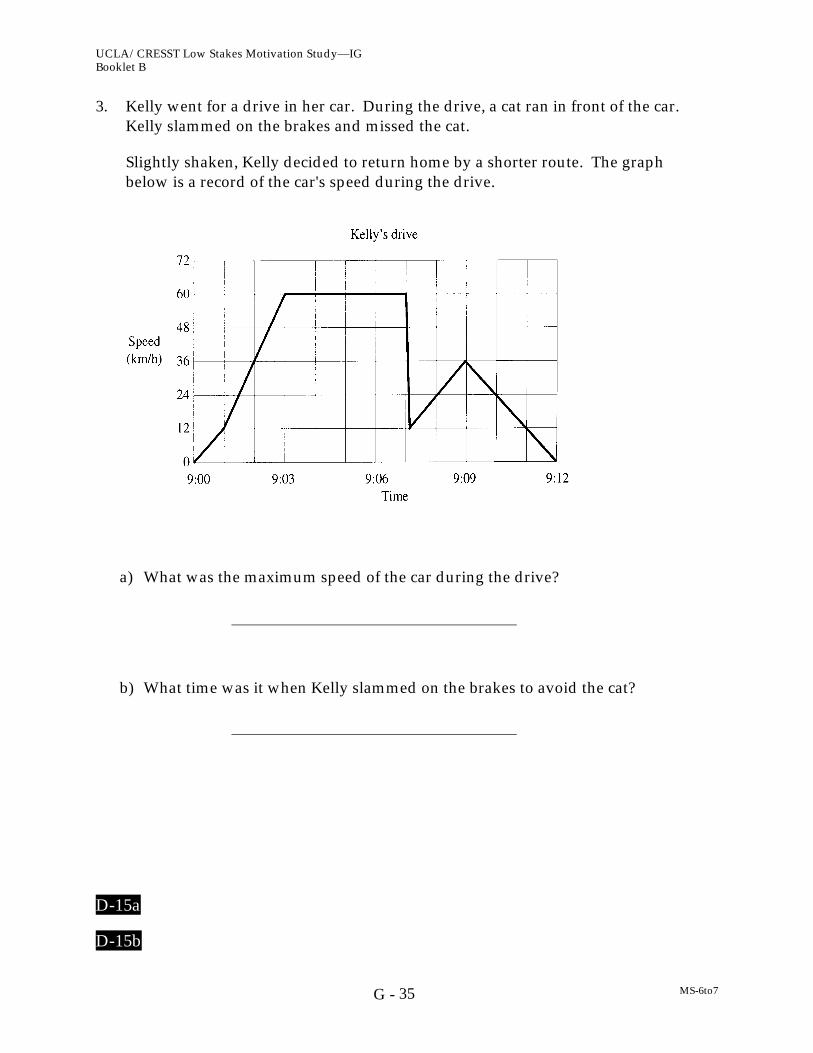
UCLA/CRESST Low Stakes Motivation Study—IGBooklet B
MS-6to735G -
3. Kelly went for a drive in her car. During the drive, a cat ran in front of the car.Kelly slammed on the brakes and missed the cat.
Slightly shaken, Kelly decided to return home by a shorter route. The graphbelow is a record of the car's speed during the drive.
a) What was the maximum speed of the car during the drive?
b) What time was it when Kelly slammed on the brakes to avoid the cat?
D-15a
D-15b
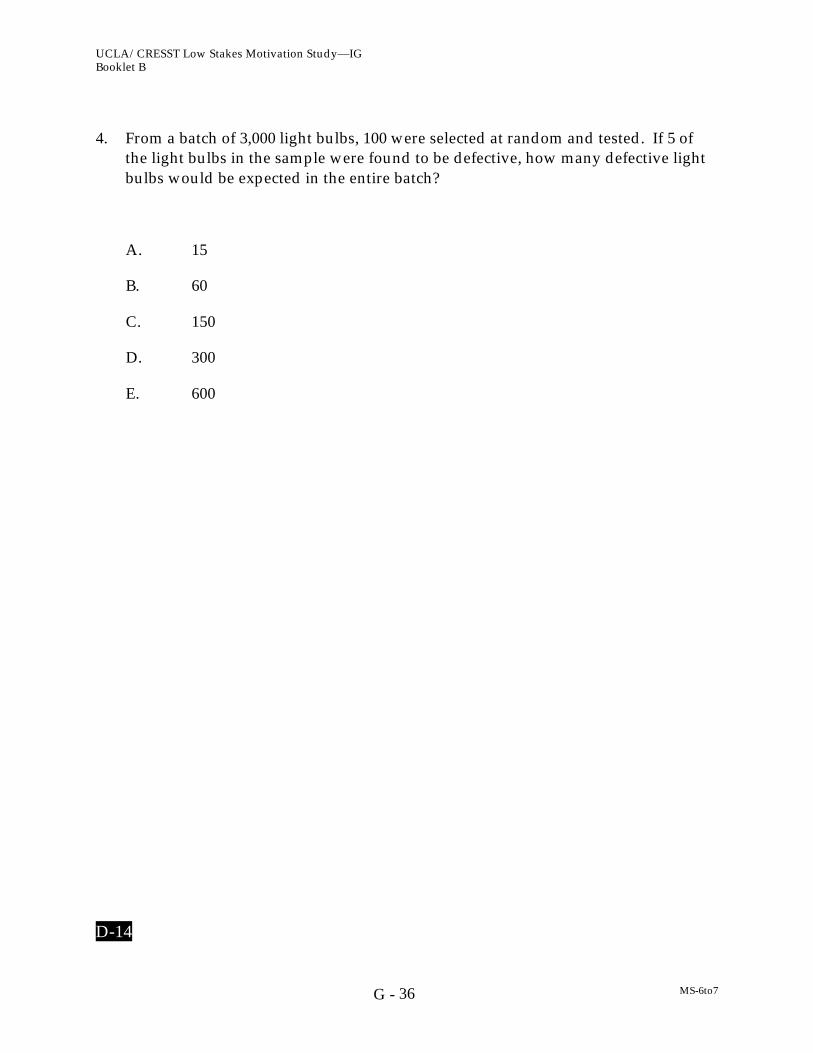
UCLA/CRESST Low Stakes Motivation Study—IGBooklet B
MS-6to736G -
4. From a batch of 3,000 light bulbs, 100 were selected at random and tested. If 5 ofthe light bulbs in the sample were found to be defective, how many defective lightbulbs would be expected in the entire batch?
A. 15
B. 60
C. 150
D. 300
E. 600
D-14

UCLA/CRESST Low Stakes Motivation Study—IGBooklet B
MS-6to737G -
5. In a school election with three candidates, Joe received 120 votes, Mary received 50votes, and George received 30 votes.
What percentage of the total number of votes did Joe receive?
A. 60%
B. 66 2/3%
C. 80%
D. 120%
D-13

UCLA/CRESST Low Stakes Motivation Study—IGBooklet B
MS-6to738G -
6. Brighto soap powder is packed in cube-shaped cartons. A carton measures 10 cmon each side.
The company decides to increase the length of each edge of the carton by10 percent.
How much does the volume increase?
A. 10 cm3
B. 21 cm3
C. 100 cm3
D. 331 cm3
D-12
UCLA/CRESST Low Stakes Motivation Study—IGBooklet B
MS-6to739G -
7. Stu wants to wrap some ribbon around a box as shown and have 25 cm left to tie abow.
How long a piece of ribbon does he need?
A. 46 cm
B. 52 cm
C. 65 cm
D. 71 cm
E. 77 cm
D-11

UCLA/CRESST Low Stakes Motivation Study—IGBooklet B
MS-6to740G -
8.
Each of the small squares in the figure is 1 square unit. Which is the bestestimate of the area of the shaded region?
A. 10 square units
B. 12 square units
C. 14 square units
D. 16 square units
E. 18 square units
D-10
UCLA/CRESST Low Stakes Motivation Study—IGBooklet B
MS-6to741G -
9. A store is having a '20% off' sale. The normal price of a stereo system is $1250.
What is the price of the stereo system after the 20 % discount is applied?
A. $1000
B. $1050
C. $1230
D. $1500
D-9

UCLA/CRESST Low Stakes Motivation Study—IGBooklet B
MS-6to742G -
10. In a vineyard there are 210 rows of vines. Each row is 192 m long and plants areplanted 4 m apart. On average, each plant produces 9 kg of grapes each season.
The total amount of grapes produced by the vineyard each season is closest to
A. 10 000 kg
B. 100 000 kg
C. 400 000 kg
D. 1 600 000 kg
D-8
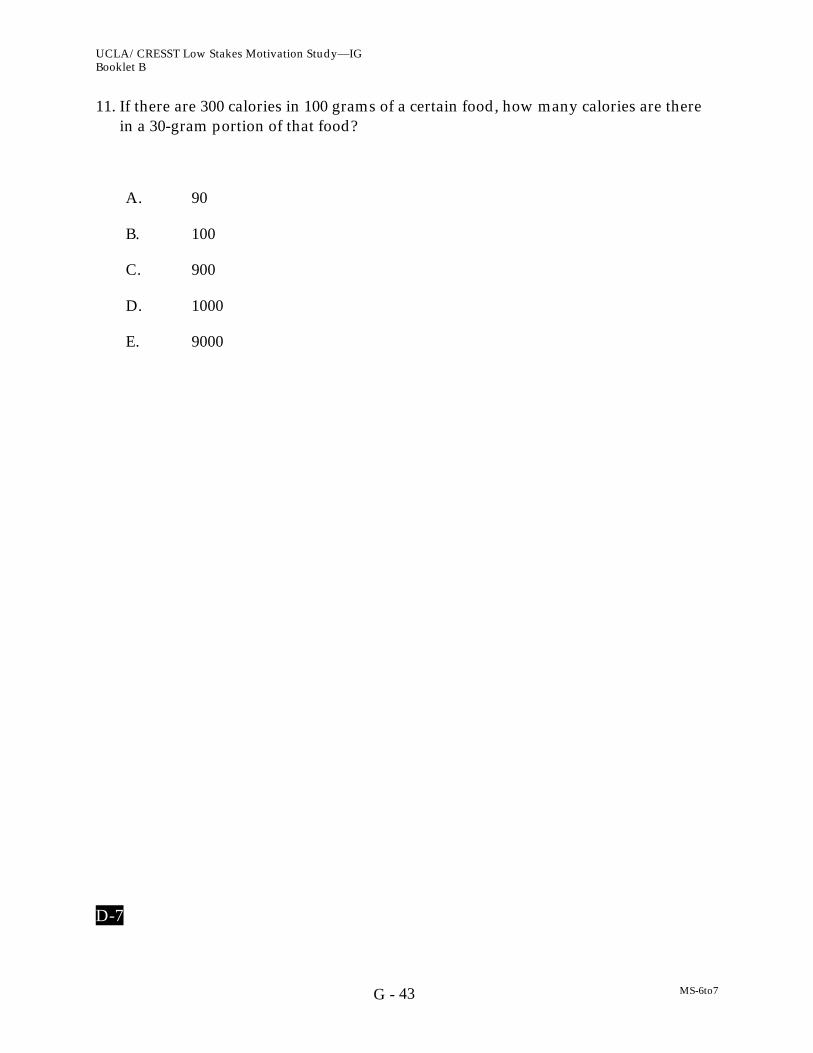
UCLA/CRESST Low Stakes Motivation Study—IGBooklet B
MS-6to743G -
11. If there are 300 calories in 100 grams of a certain food, how many calories are therein a 30-gram portion of that food?
A. 90
B. 100
C. 900
D. 1000
E. 9000
D-7

UCLA/CRESST Low Stakes Motivation Study—IGBooklet B
MS-6to744G -
12. A 45,000-litre water tank is to be filled at the rate of 220 liters per minute.
Estimate to the nearest half an hour, how long it will take to fill the tank.
A. 4 hours
B. 3 1/2 hours
C. 3 hours
D. 2 1/2 hours
D-6

UCLA/CRESST Low Stakes Motivation Study—IGBooklet B
MS-6to745G -
13. The following two advertisements appeared in a newspaper in a country where theunits of currency are zeds.
If a company is interested in renting an office of 110 square meters in that countryfor a year, at which office building, A or B, should they rent the office in order toget the lower price? Show your work.
A-12
BUILDING A
Office Space Available
85 - 95 square meters475 zeds per month
100 - 120 square meters800 zeds per month
BUILDING B
Office Space Available
35 - 260 square meters90 zeds per square meter
per year

UCLA/CRESST Low Stakes Motivation Study—IGBooklet B
MS-6to746G -
14. Using the set of axes below, sketch a graph which shows the relationshipbetween the height of a person and his/her age from birth to 30 years. Besure to label your graph, and include a realistic scale on each axis.
A-10
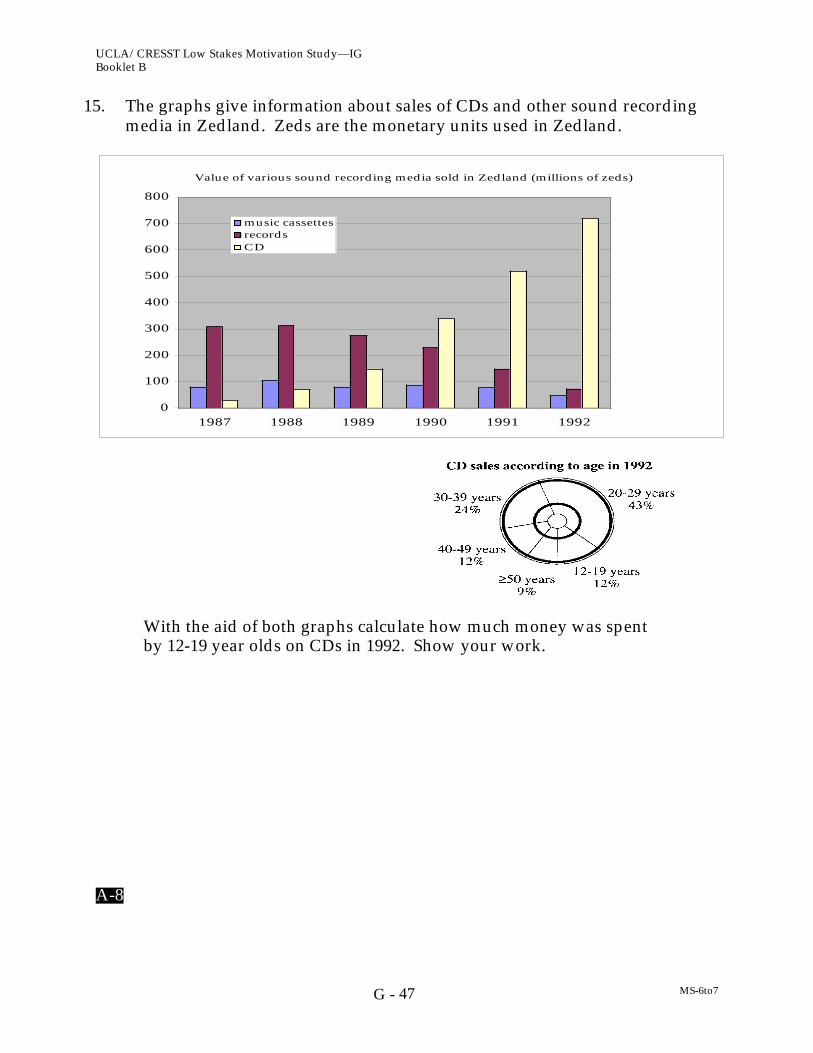
UCLA/CRESST Low Stakes Motivation Study—IGBooklet B
MS-6to747G -
15. The graphs give information about sales of CDs and other sound recordingmedia in Zedland. Zeds are the monetary units used in Zedland.
With the aid of both graphs calculate how much money was spentby 12-19 year olds on CDs in 1992. Show your work.
A-8
Value of various sound recording media sold in Zedland (millions of zeds)
0
100
200
300
400
500
600
700
800
1987 1988 1989 1990 1991 1992
music cassettesrecordsCD

UCLA/CRESST Low Stakes Motivation Study—IGBooklet B
MS-6to748G -
16. A school club is planning a bus trip to the wildlife park. A bus which will hold upto 45 people will cost 600 centros (units of money) and admission tickets cost 30centros each.
If the cost of the trip, including bus and admission ticket, is set at 50 centros perperson, what is the minimum number of people who must participate to ensurethat these costs are covered?
A. 12
B. 20
C. 30
D. 45
A-5
UCLA/CRESST Low Stakes Motivation Study—IGBooklet B
MS-6to749G -
17. If the population increases by the same rate from the year 1990 to the year2000 as in the years from 1980 to 1990, approximately what is the expectedpopulation by the year 2000?
A. 47 million
B. 50 million
C. 53 million
D. 58 million
A-4
UCLA/CRESST Low Stakes Motivation Study—IGBooklet B
MS-6to750G -
18. Experts say that 25% of all serious bicycle accidents involve injuries and that,of all head injuries, 80% are fatal.
What percentage of all serious bicycle accidents involve fatal headinjuries?
A. 16%
B. 20%
C. 55%
D. 105%
D-17
STOP
UCLA/CRESST Low Stakes Motivation Study—IGBooklet B
MS-6to751G -
SECTION 4
DIRECTIONS: A number of statements which people have used to describethemselves are given below. Read each statement and indicate how you thought or feltduring the math test. Find the word or phrase, which best describes how you thoughtor felt and circle the number for your answer. There are no right or wrong answers. Donot spend too much time on any one statement. Remember to give the answer that
best describes how you thought or felt during the math test.
Not atall Somewhat
ModeratelySo
Verymuch so
1. I concentrated as hard as I couldduring the math test.
1 2 3 4
2. I expected to do very well on themath test.
1 2 3 4
3. I thought my score would be sobad that everyone, includingmyself, would be disappointed.
1 2 3 4
4. I worked hard on the math test. 1 2 3 4
5. I had no doubts about mycapability to do well on the mathtest.
1 2 3 4
6. I was afraid I should have studiedmore for this test.
1 2 3 4
7. I kept working, even on difficultquestions.
1 2 3 4
8. I think I will receive a good scoreon this test.
1 2 3 4
9. I was not happy with myperformance.
1 2 3 4

UCLA/CRESST Low Stakes Motivation Study—IGBooklet B
MS-6to752G -
Not atall Somewhat
ModeratelySo
Verymuch so
10. I put forth my best effort. 1 2 3 4
11. I am sure I did an excellent job onthe questions on the math test.
1 2 3 4
12. I felt regretful about myperformance on the math test.
1 2 3 4
13. I tried to do my best on the mathtest.
1 2 3 4
14. I understand math systems quitewell.
1 2 3 4
15. I was concerned about what wouldhappen if I did poorly.
1 2 3 4
16. I did not give up, even though thetest was hard.
1 2 3 4
17. Even when the questions weredifficult, I knew I could succeed.
1 2 3 4
18. I did not feel confident about myperformance on the math test.
1 2 3 4

UCLA/CRESST Low Stakes Motivation Study—IGBooklet B
MS-6to753G -
Final Questions:
1. What kind of classes are you taking this year? Mark all that apply.
(A) I am not taking mathematics this year
(B) Regular classes in mathematics
(C) AP classes in mathematics
(D) Regular classes in physics
(E) AP classes in physics
2. As we mentioned in the directions, we used many booklets each with differentquestions. We are interested in how well you remember the directions that weregiven.
Your directions were (choose as many as apply):
(A) "These new test items will allow us to compare your mathematical ability withthat of other students in your classroom, in your school, in your school district,and around the world…In brief, how well you do will tell us how good you areat this kind of test.”
(B) "There are a total of 20 questions. We will give you $10 for each correct answer,just like the easier test you completed. For example, if you get 10 items correct,we will give you $100. If you answer all of the items correctly, you will get $200.We are giving money to you to encourage you to try harder and do well on thistest. If you finish early, you can go back to those questions you could notanswer.”
(C) “Some of the questions will be followed by four or five possible answersindicated with a letter next to it. For these questions, circle the letter next to theanswer you consider to be correct, as shown in Example 1."
(D) "I can't remember."
UCLA/CRESST Low Stakes Motivation Study—IGBooklet B
MS-6to754G -
3. What was your total SAT 9 score last year? _________________________
4. How often do the people in your home speak a language other than English?
(A) Never
(B) Sometimes
(C) Always
5. Mark the statement that best describes your math grades since ninth grade.
(A) Mostly A’s
(B) Mostly B’s
(C) Mostly C’s
(D) Mostly D’s
(E) Mostly below D
UCLA/CRESST Low Stakes Motivation Study—IGBooklet B
MS-6to755G -
6. Have all of the concepts presented in these math questions been taught to you inyour previous or current math classes?
(A) Yes
(B) No
7. If there are some questions whose concepts you feel have not been taught to you,please list them below:
STOP
UCLA/CRESST Low Stakes Motivation Study—IGBooklet B
MS-6to756G -
NAME: __________________________________
I received $ _________ for participating in the Incentive Group of the
UCLA/CRESST Low-Stakes Motivation Study.
SIGNATURE: __________________________________
57G -
Test Booklet B
Advanced Placement Group(Control and Incentive)
Test Booklet A was not used for the Advanced Placement Group
UCLA/CRESST Low Stakes Motivation Study—CG
AP-17to2358G -
UCLA/CRESST STUDY
Name: ______________________________
Gender: Male or Female (circle one)

UCLA/CRESST Low Stakes Motivation Study—CG
AP-17to2359G -
SECTION 1
GENERAL DIRECTIONS
In this booklet, you will find questions about mathematics. Because there are differentbooklets, the other students around you may be working on booklets that are differentfrom yours. You will have 25 minutes to answer all of the questions in this section.Please read each question carefully and answer it as well as you can.
You will be told when to begin work on this booklet. If you finish answering thequestions before time is called, you may go over your work and review your answers.
If you decide to change an answer to a question, erase or cross out your first choice andthen circle the letter next to the answer you consider correct.
For other questions you will be asked to write short answers in the space provided inyour booklet. For these questions, you may use words, drawings, numbers, orequations in your answers.
Even if you use a calculator, when the question asks you to show ALL of your work it isvery important that you give as complete an answer as you can. Please use the extraspace on the page to do your work. You will not be penalized for guessing or providingincorrect responses so you should attempt to answer every question.
STOP

UCLA/CRESST Low Stakes Motivation Study—CG
AP-17to2360G -
SECTION 2
SAMPLE QUESTIONS
DIRECTIONS: Read each question carefully and answer it as well as you can.
1. Which of the numbers below is the smallest?
(A) 3
(B) 1
(C) 4
(D) 7
2. Which of the numbers below is an even number?
(A) 2
(B) 5
(C) 3
(D) 1
STOP

UCLA/CRESST Low Stakes Motivation Study—CG
AP-17to2361G -
SECTION 3
MATH ASSESSMENT
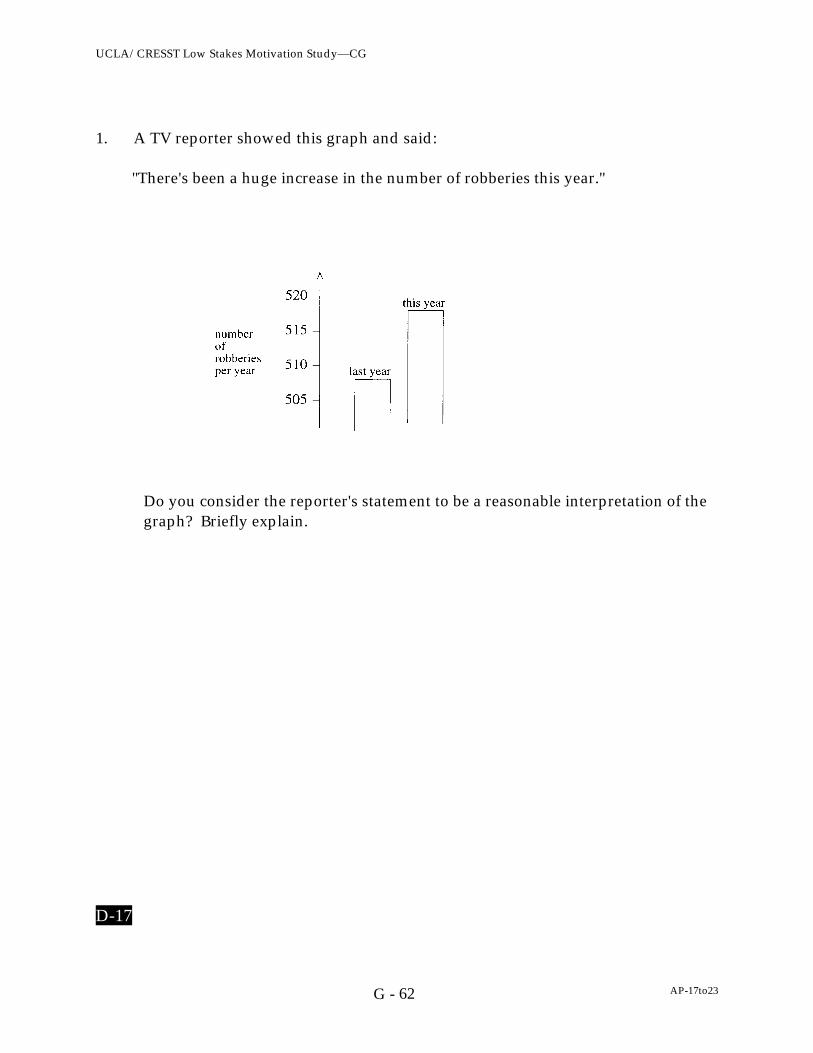
UCLA/CRESST Low Stakes Motivation Study—CG
AP-17to2362G -
1. A TV reporter showed this graph and said:
"There's been a huge increase in the number of robberies this year."
Do you consider the reporter's statement to be a reasonable interpretation of thegraph? Briefly explain.
D-17

UCLA/CRESST Low Stakes Motivation Study—CG
AP-17to2363G -
2. Teresa wants to record 5 songs on tape. The length of time each song plays foris shown in the table.
Song Length of Time
1
2
3
4
5
2 minutes 41 seconds
3 minutes 10 seconds
2 minutes 51 seconds
3 minutes
3 minutes 32 seconds
Estimate to the nearest minute the total time taken for all five songs to play andexplain how this estimate was made.
Estimate: _______________________
Explain:
D-16a
D-16b
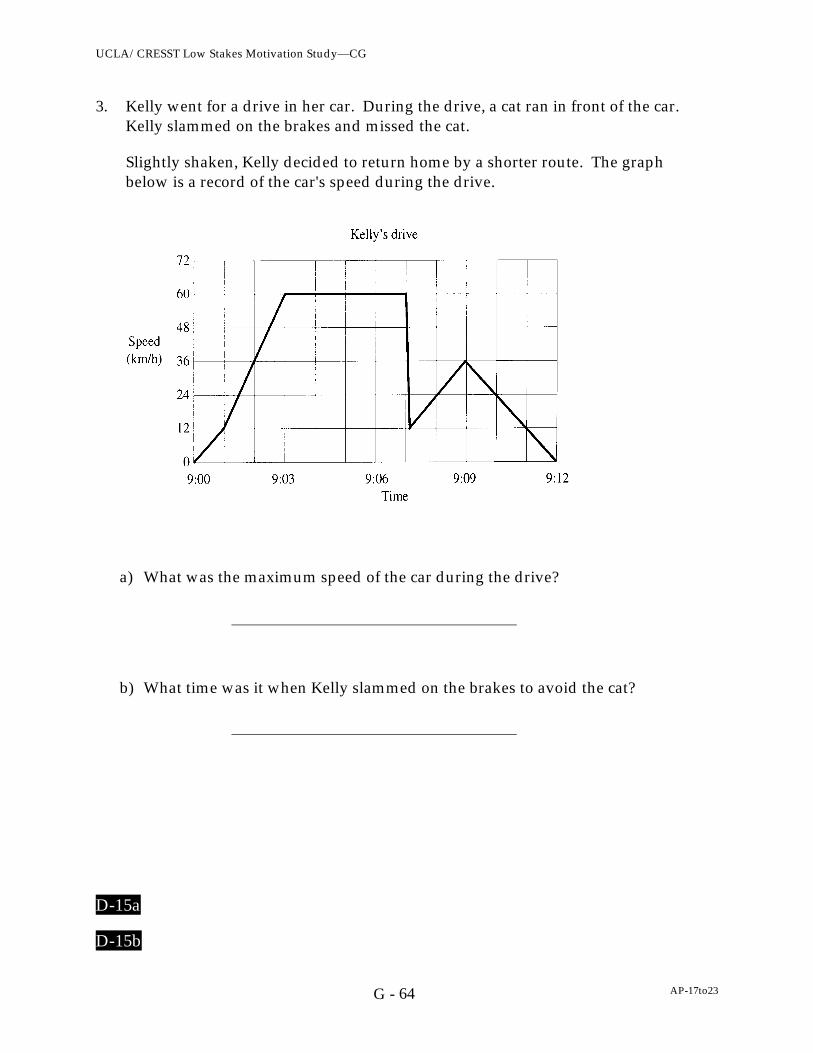
UCLA/CRESST Low Stakes Motivation Study—CG
AP-17to2364G -
3. Kelly went for a drive in her car. During the drive, a cat ran in front of the car.Kelly slammed on the brakes and missed the cat.
Slightly shaken, Kelly decided to return home by a shorter route. The graphbelow is a record of the car's speed during the drive.
a) What was the maximum speed of the car during the drive?
b) What time was it when Kelly slammed on the brakes to avoid the cat?
D-15a
D-15b

UCLA/CRESST Low Stakes Motivation Study—CG
AP-17to2365G -
4. From a batch of 3,000 light bulbs, 100 were selected at random and tested. If 5 ofthe light bulbs in the sample were found to be defective, how many defective lightbulbs would be expected in the entire batch?
A. 15
B. 60
C. 150
D. 300
E. 600
D-14
UCLA/CRESST Low Stakes Motivation Study—CG
AP-17to2366G -
5. In a school election with three candidates, Joe received 120 votes, Mary received 50votes, and George received 30 votes.
What percentage of the total number of votes did Joe receive?
A. 60%
B. 66 2/3%
C. 80%
D. 120%
D-13

UCLA/CRESST Low Stakes Motivation Study—CG
AP-17to2367G -
6. Brighto soap powder is packed in cube-shaped cartons. A carton measures 10 cmon each side.
The company decides to increase the length of each edge of the carton by10 percent.
How much does the volume increase?
A. 10 cm3
B. 21 cm3
C. 100 cm3
D. 331 cm3
D-12

UCLA/CRESST Low Stakes Motivation Study—CG
AP-17to2368G -
7. Stu wants to wrap some ribbon around a box as shown and have 25 cm left to tie abow.
How long a piece of ribbon does he need?
A. 46 cm
B. 52 cm
C. 65 cm
D. 71 cm
E. 77 cm
D-11

UCLA/CRESST Low Stakes Motivation Study—CG
AP-17to2369G -
8.
Each of the small squares in the figure is 1 square unit. Which is the bestestimate of the area of the shaded region?
A. 10 square units
B. 12 square units
C. 14 square units
D. 16 square units
E. 18 square units
D-10
UCLA/CRESST Low Stakes Motivation Study—CG
AP-17to2370G -
9. A store is having a '20% off' sale. The normal price of a stereo system is $1250.
What is the price of the stereo system after the 20 % discount is applied?
A. $1000
B. $1050
C. $1230
D. $1500
D-9
UCLA/CRESST Low Stakes Motivation Study—CG
AP-17to2371G -
10. In a vineyard there are 210 rows of vines. Each row is 192 m long and plants areplanted 4 m apart. On average, each plant produces 9 kg of grapes each season.
The total amount of grapes produced by the vineyard each season is closest to
A. 10 000 kg
B. 100 000 kg
C. 400 000 kg
D. 1 600 000 kg
D-8
UCLA/CRESST Low Stakes Motivation Study—CG
AP-17to2372G -
11. If there are 300 calories in 100 grams of a certain food, how many calories are therein a 30-gram portion of that food?
A. 90
B. 100
C. 900
D. 1000
E. 9000
D-7
UCLA/CRESST Low Stakes Motivation Study—CG
AP-17to2373G -
12. A 45,000-litre water tank is to be filled at the rate of 220 liters per minute.
Estimate to the nearest half an hour, how long it will take to fill the tank.
A. 4 hours
B. 3 1/2 hours
C. 3 hours
D. 2 1/2 hours
D-6
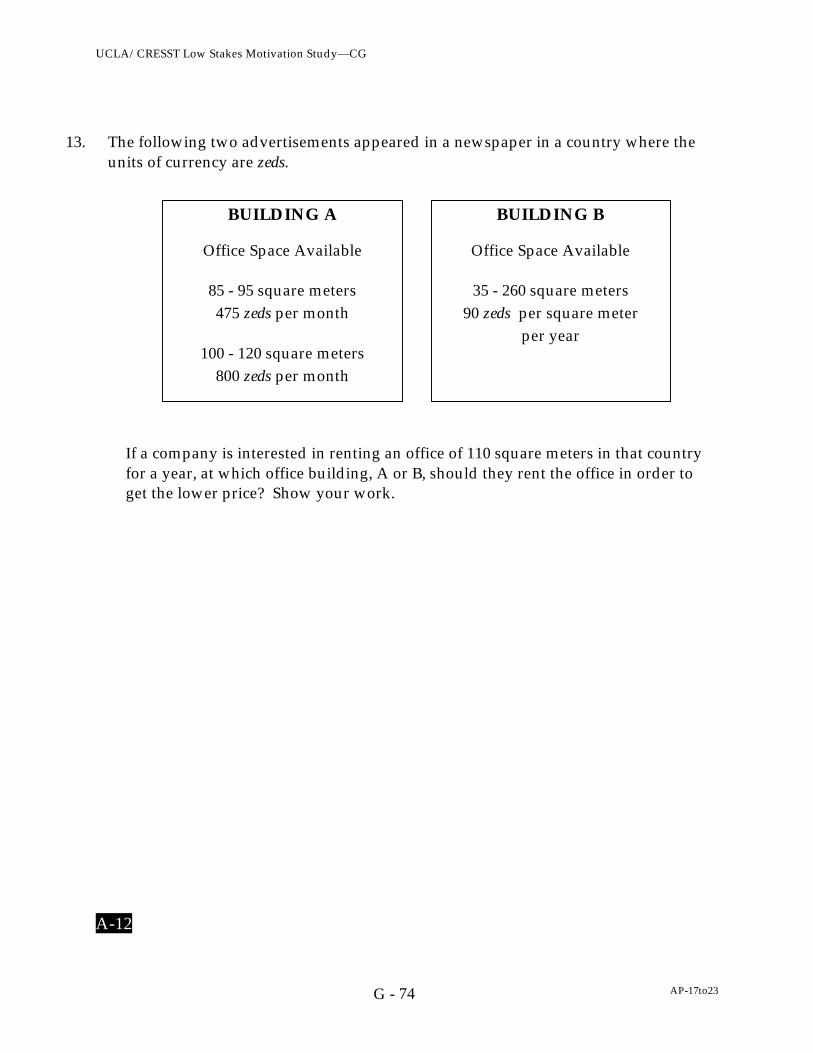
UCLA/CRESST Low Stakes Motivation Study—CG
AP-17to2374G -
13. The following two advertisements appeared in a newspaper in a country where theunits of currency are zeds.
If a company is interested in renting an office of 110 square meters in that countryfor a year, at which office building, A or B, should they rent the office in order toget the lower price? Show your work.
A-12
BUILDING A
Office Space Available
85 - 95 square meters475 zeds per month
100 - 120 square meters800 zeds per month
BUILDING B
Office Space Available
35 - 260 square meters90 zeds per square meter
per year

UCLA/CRESST Low Stakes Motivation Study—CG
AP-17to2375G -
14. Using the set of axes below, sketch a graph which shows the relationshipbetween the height of a person and his/her age from birth to 30 years. Besure to label your graph, and include a realistic scale on each axis.
A-10

UCLA/CRESST Low Stakes Motivation Study—CG
AP-17to2376G -
15. The graphs give information about sales of CDs and other sound recordingmedia in Zedland. Zeds are the monetary units used in Zedland.
With the aid of both graphs calculate how much money was spentby 12-19 year olds on CDs in 1992. Show your work.
A-8
Value of various sound recording media sold in Zedland (millions of zeds)
0
100
200
300
400
500
600
700
800
1987 1988 1989 1990 1991 1992
music cassettesrecordsCD
UCLA/CRESST Low Stakes Motivation Study—CG
AP-17to2377G -
16. A school club is planning a bus trip to the wildlife park. A bus which will hold upto 45 people will cost 600 centros (units of money) and admission tickets cost 30centros each.
If the cost of the trip, including bus and admission ticket, is set at 50 centros perperson, what is the minimum number of people who must participate to ensurethat these costs are covered?
A. 12
B. 20
C. 30
D. 45
A-5
UCLA/CRESST Low Stakes Motivation Study—CG
AP-17to2378G -
17. If the population increases by the same rate from the year 1990 to the year2000 as in the years from 1980 to 1990, approximately what is the expectedpopulation by the year 2000?
A. 47 million
B. 50 million
C. 53 million
D. 58 million
A-4

UCLA/CRESST Low Stakes Motivation Study—CG
AP-17to2379G -
18. Experts say that 25% of all serious bicycle accidents involve injuries and that,of all head injuries, 80% are fatal.
What percentage of all serious bicycle accidents involve fatal headinjuries?
A. 16%
B. 20%
C. 55%
D. 105%
D-17
STOP
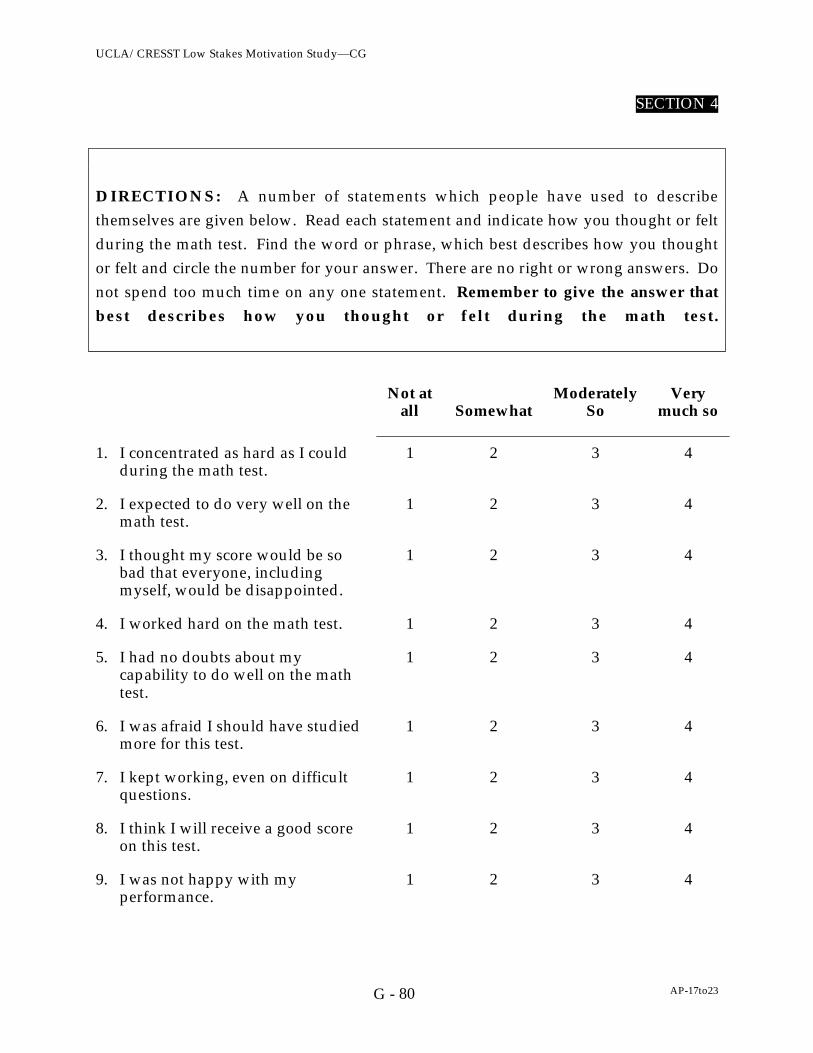
UCLA/CRESST Low Stakes Motivation Study—CG
AP-17to2380G -
SECTION 4
DIRECTIONS: A number of statements which people have used to describethemselves are given below. Read each statement and indicate how you thought or feltduring the math test. Find the word or phrase, which best describes how you thoughtor felt and circle the number for your answer. There are no right or wrong answers. Donot spend too much time on any one statement. Remember to give the answer that
best describes how you thought or felt during the math test.
Not atall Somewhat
ModeratelySo
Verymuch so
1. I concentrated as hard as I couldduring the math test.
1 2 3 4
2. I expected to do very well on themath test.
1 2 3 4
3. I thought my score would be sobad that everyone, includingmyself, would be disappointed.
1 2 3 4
4. I worked hard on the math test. 1 2 3 4
5. I had no doubts about mycapability to do well on the mathtest.
1 2 3 4
6. I was afraid I should have studiedmore for this test.
1 2 3 4
7. I kept working, even on difficultquestions.
1 2 3 4
8. I think I will receive a good scoreon this test.
1 2 3 4
9. I was not happy with myperformance.
1 2 3 4
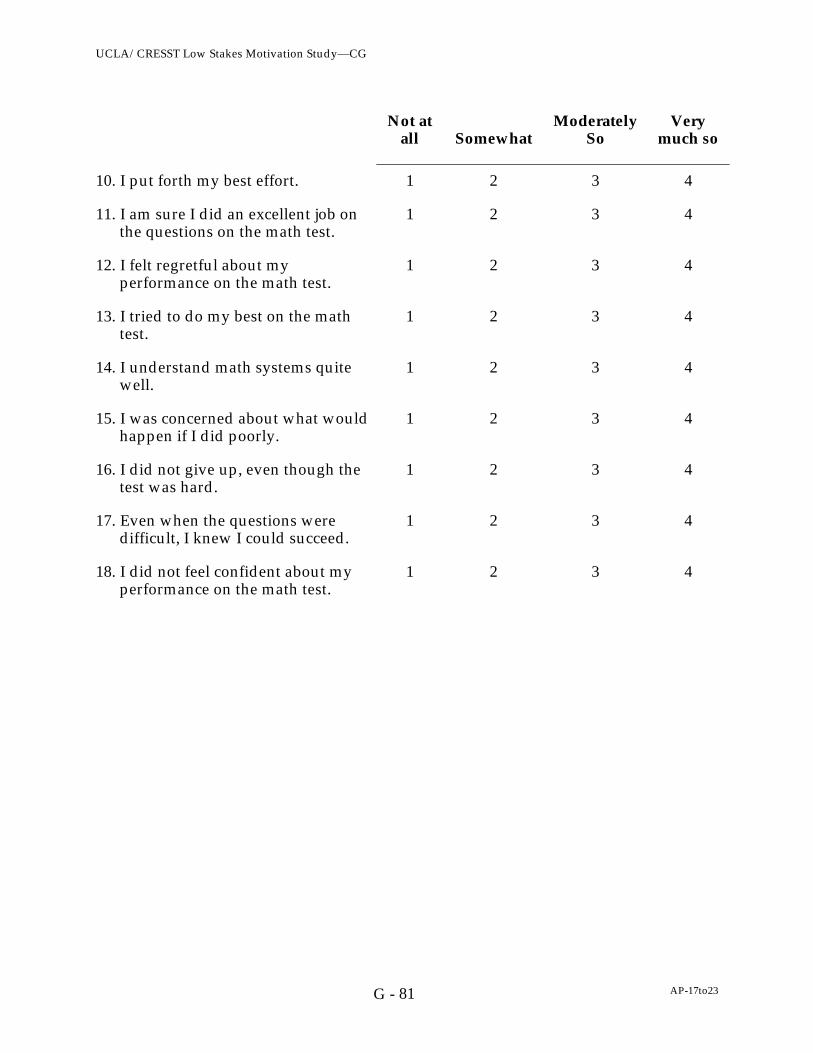
UCLA/CRESST Low Stakes Motivation Study—CG
AP-17to2381G -
Not atall Somewhat
ModeratelySo
Verymuch so
10. I put forth my best effort. 1 2 3 4
11. I am sure I did an excellent job onthe questions on the math test.
1 2 3 4
12. I felt regretful about myperformance on the math test.
1 2 3 4
13. I tried to do my best on the mathtest.
1 2 3 4
14. I understand math systems quitewell.
1 2 3 4
15. I was concerned about what wouldhappen if I did poorly.
1 2 3 4
16. I did not give up, even though thetest was hard.
1 2 3 4
17. Even when the questions weredifficult, I knew I could succeed.
1 2 3 4
18. I did not feel confident about myperformance on the math test.
1 2 3 4
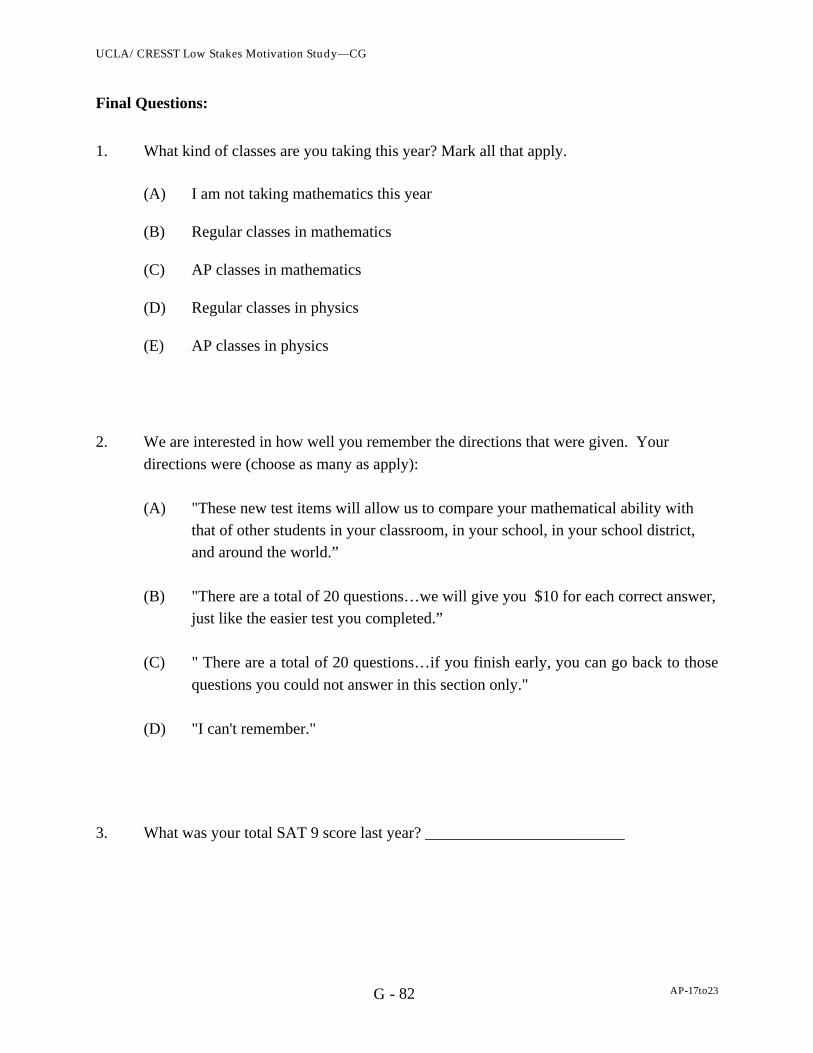
UCLA/CRESST Low Stakes Motivation Study—CG
AP-17to2382G -
Final Questions:
1. What kind of classes are you taking this year? Mark all that apply.
(A) I am not taking mathematics this year
(B) Regular classes in mathematics
(C) AP classes in mathematics
(D) Regular classes in physics
(E) AP classes in physics
2. We are interested in how well you remember the directions that were given. Your
directions were (choose as many as apply):
(A) "These new test items will allow us to compare your mathematical ability withthat of other students in your classroom, in your school, in your school district,and around the world.”
(B) "There are a total of 20 questions…we will give you $10 for each correct answer,just like the easier test you completed.”
(C) " There are a total of 20 questions…if you finish early, you can go back to those
questions you could not answer in this section only."
(D) "I can't remember."
3. What was your total SAT 9 score last year? _________________________

UCLA/CRESST Low Stakes Motivation Study—CG
AP-17to2383G -
4. How often do the people in your home speak a language other than English?
(A) Never
(B) Sometimes
(C) Always
5. Please answer the following family and generation questions:
born in the U.S. raised in the U.S.
a. I was Yes No Don’t Know Yes No Don’t Know
b. My mother was Yes No Don’t Know Yes No Don’t Know
c. Her parents (mygrandparents) were Yes No Don’t Know Yes No Don’t Know
d. My father was Yes No Don’t Know Yes No Don’t Know
e. His parents (my
grandparents) were Yes No Don’t Know Yes No Don’t Know
6. Mark the statement that best describes your math grades since ninth grade.
(A) Mostly A’s
(B) Mostly B’s
(C) Mostly C’s
(D) Mostly D’s
(E) Mostly below D
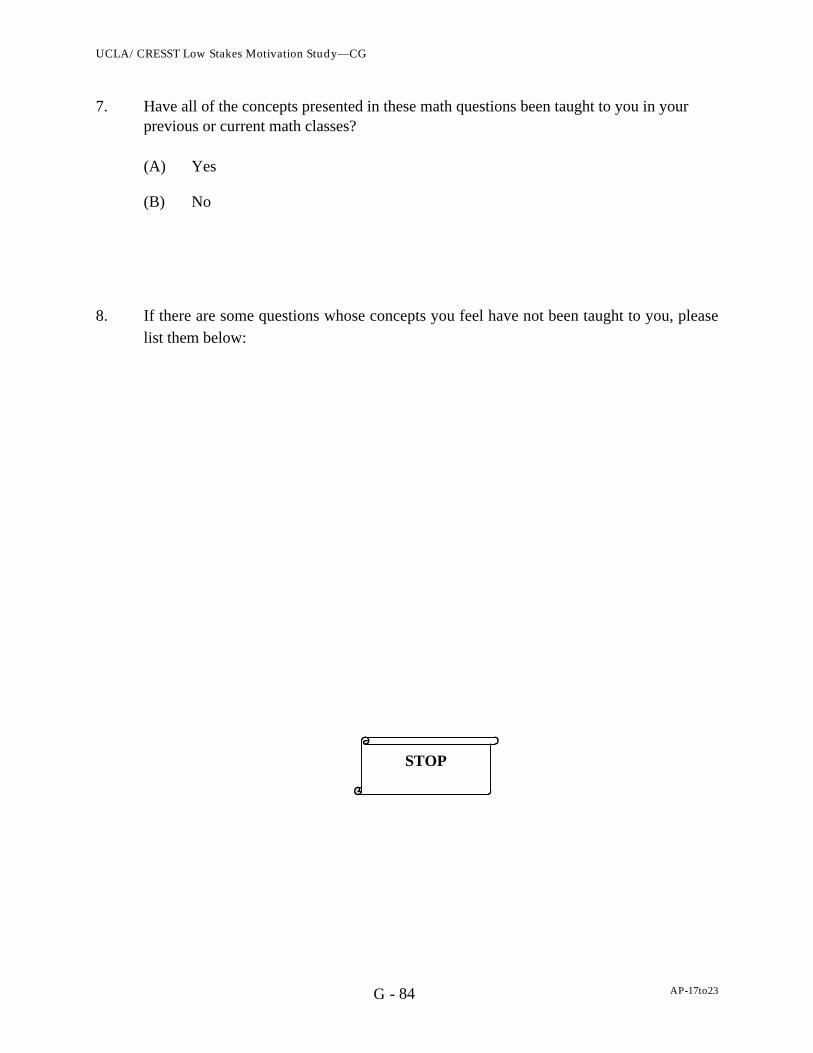
UCLA/CRESST Low Stakes Motivation Study—CG
AP-17to2384G -
7. Have all of the concepts presented in these math questions been taught to you in yourprevious or current math classes?
(A) Yes
(B) No
8. If there are some questions whose concepts you feel have not been taught to you, pleaselist them below:
STOP

UCLA/CRESST Low Stakes Motivation Study—IG
AP-17to23G - 85
UCLA/CRESST STUDY
Name: ______________________________
Gender: Male or Female (circle one)
UCLA/CRESST Low Stakes Motivation Study—IG
AP-17to23G - 86
SECTION 1
GENERAL DIRECTIONS
In this booklet, you will find questions about mathematics. Because there are differentbooklets, the other students around you may be working on booklets that are differentfrom yours. You will have 25 minutes to answer all of the questions in this section.Please read each question carefully and answer it as well as you can.
You will be told when to begin work on this booklet. If you finish answering thequestions before time is called, you may go over your work and review your answers.
If you decide to change an answer to a question, erase or cross out your first choice andthen circle the letter next to the answer you consider correct.
For other questions you will be asked to write short answers in the space provided inyour booklet. For these questions, you may use words, drawings, numbers, orequations in your answers.
Even if you use a calculator, when the question asks you to show ALL of your work it isvery important that you give as complete an answer as you can. Please use the extraspace on the page to do your work. You will not be penalized for guessing or providingincorrect responses so you should attempt to answer every question.
STOP
UCLA/CRESST Low Stakes Motivation Study—IG
AP-17to23G - 87
SECTION 2
SAMPLE QUESTIONS
DIRECTIONS: Read each question carefully and answer it as well as you can.
1. Which of the numbers below is the smallest?
(A) 3
(B) 1
(C) 4
(D) 7
2. Which of the numbers below is an even number?
(A) 2
(B) 5
(C) 3
(D) 1
STOP
UCLA/CRESST Low Stakes Motivation Study—IG
AP-17to23G - 88
SECTION 3
MATH ASSESSMENT

UCLA/CRESST Low Stakes Motivation Study—IG
AP-17to23G - 89
1. A TV reporter showed this graph and said:
"There's been a huge increase in the number of robberies this year."
Do you consider the reporter's statement to be a reasonable interpretation of thegraph? Briefly explain.
D-17

UCLA/CRESST Low Stakes Motivation Study—IG
AP-17to23G - 90
2. Teresa wants to record 5 songs on tape. The length of time each song plays foris shown in the table.
Song Length of Time
1
2
3
4
5
2 minutes 41 seconds
3 minutes 10 seconds
2 minutes 51 seconds
3 minutes
3 minutes 32 seconds
Estimate to the nearest minute the total time taken for all five songs to play andexplain how this estimate was made.
Estimate: _______________________
Explain:
D-16a
D-16b

UCLA/CRESST Low Stakes Motivation Study—IG
AP-17to23G - 91
3. Kelly went for a drive in her car. During the drive, a cat ran in front of the car.Kelly slammed on the brakes and missed the cat.
Slightly shaken, Kelly decided to return home by a shorter route. The graphbelow is a record of the car's speed during the drive.
a) What was the maximum speed of the car during the drive?
b) What time was it when Kelly slammed on the brakes to avoid the cat?
D-15a
D-15b

UCLA/CRESST Low Stakes Motivation Study—IG
AP-17to23G - 92
4. From a batch of 3,000 light bulbs, 100 were selected at random and tested. If 5 ofthe light bulbs in the sample were found to be defective, how many defective lightbulbs would be expected in the entire batch?
A. 15
B. 60
C. 150
D. 300
E. 600
D-14

UCLA/CRESST Low Stakes Motivation Study—IG
AP-17to23G - 93
5. In a school election with three candidates, Joe received 120 votes, Mary received 50votes, and George received 30 votes.
What percentage of the total number of votes did Joe receive?
A. 60%
B. 66 2/3%
C. 80%
D. 120%
D-13

UCLA/CRESST Low Stakes Motivation Study—IG
AP-17to23G - 94
6. Brighto soap powder is packed in cube-shaped cartons. A carton measures 10 cmon each side.
The company decides to increase the length of each edge of the carton by10 percent.
How much does the volume increase?
A. 10 cm3
B. 21 cm3
C. 100 cm3
D. 331 cm3
D-12

UCLA/CRESST Low Stakes Motivation Study—IG
AP-17to23G - 95
7. Stu wants to wrap some ribbon around a box as shown and have 25 cm left to tie abow.
How long a piece of ribbon does he need?
A. 46 cm
B. 52 cm
C. 65 cm
D. 71 cm
E. 77 cm
D-11

UCLA/CRESST Low Stakes Motivation Study—IG
AP-17to23G - 96
8.
Each of the small squares in the figure is 1 square unit. Which is the bestestimate of the area of the shaded region?
A. 10 square units
B. 12 square units
C. 14 square units
D. 16 square units
E. 18 square units
D-10

UCLA/CRESST Low Stakes Motivation Study—IG
AP-17to23G - 97
9. A store is having a '20% off' sale. The normal price of a stereo system is $1250.
What is the price of the stereo system after the 20 % discount is applied?
A. $1000
B. $1050
C. $1230
D. $1500
D-9

UCLA/CRESST Low Stakes Motivation Study—IG
AP-17to23G - 98
10. In a vineyard there are 210 rows of vines. Each row is 192 m long and plants areplanted 4 m apart. On average, each plant produces 9 kg of grapes each season.
The total amount of grapes produced by the vineyard each season is closest to
A. 10 000 kg
B. 100 000 kg
C. 400 000 kg
D. 1 600 000 kg
D-8

UCLA/CRESST Low Stakes Motivation Study—IG
AP-17to23G - 99
11. If there are 300 calories in 100 grams of a certain food, how many calories are therein a 30-gram portion of that food?
A. 90
B. 100
C. 900
D. 1000
E. 9000
D-7

UCLA/CRESST Low Stakes Motivation Study—IG
AP-17to23G - 100
12. A 45,000-litre water tank is to be filled at the rate of 220 liters per minute.
Estimate to the nearest half an hour, how long it will take to fill the tank.
A. 4 hours
B. 3 1/2 hours
C. 3 hours
D. 2 1/2 hours
D-6

UCLA/CRESST Low Stakes Motivation Study—IG
AP-17to23G - 101
13. The following two advertisements appeared in a newspaper in a country where theunits of currency are zeds.
If a company is interested in renting an office of 110 square meters in that countryfor a year, at which office building, A or B, should they rent the office in order toget the lower price? Show your work.
A-12
BUILDING A
Office Space Available
85 - 95 square meters475 zeds per month
100 - 120 square meters800 zeds per month
BUILDING B
Office Space Available
35 - 260 square meters90 zeds per square meter
per year
UCLA/CRESST Low Stakes Motivation Study—IG
AP-17to23G - 102
14. Using the set of axes below, sketch a graph which shows the relationshipbetween the height of a person and his/her age from birth to 30 years. Besure to label your graph, and include a realistic scale on each axis.
A-10

UCLA/CRESST Low Stakes Motivation Study—IG
AP-17to23G - 103
15. The graphs give information about sales of CDs and other sound recordingmedia in Zedland. Zeds are the monetary units used in Zedland.
With the aid of both graphs calculate how much money was spentby 12-19 year olds on CDs in 1992. Show your work.
A-8
Value of various sound recording media sold in Zedland (millions of zeds)
0
100
200
300
400
500
600
700
800
1987 1988 1989 1990 1991 1992
music cassettesrecordsCD

UCLA/CRESST Low Stakes Motivation Study—IG
AP-17to23G - 104
16. A school club is planning a bus trip to the wildlife park. A bus which will hold upto 45 people will cost 600 centros (units of money) and admission tickets cost 30centros each.
If the cost of the trip, including bus and admission ticket, is set at 50 centros perperson, what is the minimum number of people who must participate to ensurethat these costs are covered?
A. 12
B. 20
C. 30
D. 45
A-5

UCLA/CRESST Low Stakes Motivation Study—IG
AP-17to23G - 105
17. If the population increases by the same rate from the year 1990 to the year2000 as in the years from 1980 to 1990, approximately what is the expectedpopulation by the year 2000?
A. 47 million
B. 50 million
C. 53 million
D. 58 million
A-4

UCLA/CRESST Low Stakes Motivation Study—IG
AP-17to23G - 106
18. Experts say that 25% of all serious bicycle accidents involve injuries and that,of all head injuries, 80% are fatal.
What percentage of all serious bicycle accidents involve fatal headinjuries?
A. 16%
B. 20%
C. 55%
D. 105%
D-17
STOP

UCLA/CRESST Low Stakes Motivation Study—IG
AP-17to23G - 107
SECTION 4
DIRECTIONS: A number of statements which people have used to describethemselves are given below. Read each statement and indicate how you thought or feltduring the math test. Find the word or phrase, which best describes how you thoughtor felt and circle the number for your answer. There are no right or wrong answers. Donot spend too much time on any one statement. Remember to give the answer that
best describes how you thought or felt during the math test.
Not atall Somewhat
ModeratelySo
Verymuch so
1. I concentrated as hard as I couldduring the math test.
1 2 3 4
2. I expected to do very well on themath test.
1 2 3 4
3. I thought my score would be sobad that everyone, includingmyself, would be disappointed.
1 2 3 4
4. I worked hard on the math test. 1 2 3 4
5. I had no doubts about mycapability to do well on the mathtest.
1 2 3 4
6. I was afraid I should have studiedmore for this test.
1 2 3 4
7. I kept working, even on difficultquestions.
1 2 3 4
8. I think I will receive a good scoreon this test.
1 2 3 4
9. I was not happy with myperformance.
1 2 3 4

UCLA/CRESST Low Stakes Motivation Study—IG
AP-17to23G - 108
Not atall Somewhat
ModeratelySo
Verymuch so
10. I put forth my best effort. 1 2 3 4
11. I am sure I did an excellent job onthe questions on the math test.
1 2 3 4
12. I felt regretful about myperformance on the math test.
1 2 3 4
13. I tried to do my best on the mathtest.
1 2 3 4
14. I understand math systems quitewell.
1 2 3 4
15. I was concerned about what wouldhappen if I did poorly.
1 2 3 4
16. I did not give up, even though thetest was hard.
1 2 3 4
17. Even when the questions weredifficult, I knew I could succeed.
1 2 3 4
18. I did not feel confident about myperformance on the math test.
1 2 3 4

UCLA/CRESST Low Stakes Motivation Study—IG
AP-17to23G - 109
Final Questions:
1. What kind of classes are you taking this year? Mark all that apply.
(A) I am not taking mathematics this year
(B) Regular classes in mathematics
(C) AP classes in mathematics
(D) Regular classes in physics
(E) AP classes in physics
2. We are interested in how well you remember the directions that were given. Your
directions were (choose as many as apply):
(A) "These new test items will allow us to compare your mathematical ability withthat of other students in your classroom, in your school, in your school district,and around the world.”
(B) "There are a total of 20 questions…we will give you $10 for each correct answer,just like the easier test you completed.”
(C) " There are a total of 20 questions…if you finish early, you can go back to those
questions you could not answer in this section only."
(D) "I can't remember."
3. What was your total SAT 9 score last year? _________________________
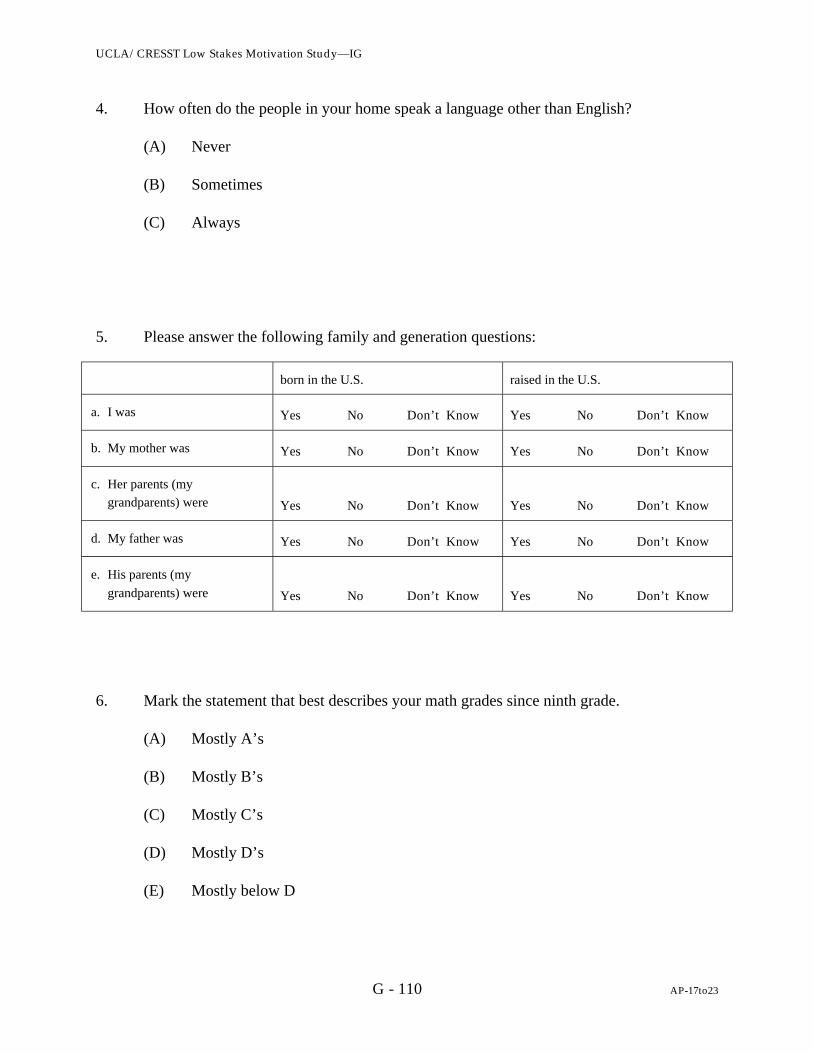
UCLA/CRESST Low Stakes Motivation Study—IG
AP-17to23G - 110
4. How often do the people in your home speak a language other than English?
(A) Never
(B) Sometimes
(C) Always
5. Please answer the following family and generation questions:
born in the U.S. raised in the U.S.
a. I was Yes No Don’t Know Yes No Don’t Know
b. My mother was Yes No Don’t Know Yes No Don’t Know
c. Her parents (mygrandparents) were Yes No Don’t Know Yes No Don’t Know
d. My father was Yes No Don’t Know Yes No Don’t Know
e. His parents (my
grandparents) were Yes No Don’t Know Yes No Don’t Know
6. Mark the statement that best describes your math grades since ninth grade.
(A) Mostly A’s
(B) Mostly B’s
(C) Mostly C’s
(D) Mostly D’s
(E) Mostly below D
UCLA/CRESST Low Stakes Motivation Study—IG
AP-17to23G - 111
7. Have all of the concepts presented in these math questions been taught to you in yourprevious or current math classes?
(A) Yes
(B) No
8. If there are some questions whose concepts you feel have not been taught to you, pleaselist them below:
STOP
UCLA/CRESST Low Stakes Motivation Study—IG
AP-17to23G - 112
NAME: __________________________________
I received $ _________ for participating in the Incentive Group of the
UCLA/CRESST Low-Stakes Motivation Study.
SIGNATURE: __________________________________
Appendix H
Administration Script


1H -
ADMINISTRATION SCRIPT
INCENTIVE GROUP
SSSEEESSSSSSIIIOOONNN AAADDDMMMIIINNNIIISSSTTTRRRAAATTTIIIOOONNN SSSCCCRRRIIIPPPTTT
INSTRUCTIONS TO THE ADMINISTRATOR ARE PRINTED IN BOLDCAPITAL LETTERS AND SHOULD NOT BE READ TO THE STUDENTS.ALL WORDS IN PLAIN PRINT ARE TO BE READ TO THE STUDENTS.
2H -
IIINNNTTTRRROOODDDUUUCCCTTTIIIOOONNN [[[TTTIIIMMMEEE::: 555 MMMIIINNNUUUTTTEEESSS]]]
Please check the two lists for your name, take all of your belongings, and reportto your assigned room. Since we only have this class period for the assessment,please proceed as quickly as possible.
If your name does not appear on either list, please wait patiently in your seat andwe will assign you to a group.
SSSEEECCCTTTIIIOOONNN 111 [[[TTTIIIMMMEEE::: 111555 MMMIIINNNUUUTTTEEESSS]]]
ONCE THE GROUPS HAVE BEEN SUCCESSFULLY SEPARATED AND AREENTERING THE DESIGNATED ROOMS:Hello. My name is ____________ and this is my colleague ____________. We are partof a research center at UCLA. Today you will be participating in a study on howmotivation affects testing. To make sure that all students receive the same instructions,I will be reading them to you from a script.
The purpose of this study is to provide information on the knowledge and attitudes ofyoung people. As part of the study, you will answer questions about yourself andabout mathematics. It will take 50 minutes. You will not be allowed to ask questionsduring the assessment. Please do the best you can.
You will not need to use any of your personal items—except a calculator if youlike—but will use the test booklet and pencil that is on your desk/that we aredistributing. We will be by to distribute a calculator to you if you need one.
***[AS NEEDED: PLEASE DO NOT OPEN THE TEST BOOKLET.]***
PLEASE TURN YOU TEST BOOKLET OVER TO THE FRONT COVER PAGE. PRINTYOUR NAME AND CIRCLE YOUR GENDER IN THE SPACES PROVIDED ON THECOVER PAGE.
Open the booklet to the first page titled SECTION 1. Read the directions to yourself as Iread them aloud:
In this booklet, you will find questions about mathematics. Because thereare many different booklets, the other students around you may beworking on booklets that are different from yours. You will have 25minutes to answer all of the questions in this section. Read each questioncarefully and answer it as well as you can.
You will be told when to begin work on this booklet. If you finishanswering the questions before time is called, you may go over your workand review your answers.
3H -
If you decide to change an answer to a question, cross out or completelyerase your first choice and then circle the letter next to the answer youconsider correct.
For other questions, you will be asked to write short answers in the spaceprovided in your booklet. For these questions, you may use words,drawings, numbers, or equations in your answers.
Even if you use a calculator, when the question asks you to show ALL ofyour work it is very important that you give as complete an answer as youcan. Please use the extra space on the page to do your work. You will notbe penalized for guessing or providing incorrect responses so you shouldattempt to answer every question.
***end of instructions in test booklet—continue reading***
SECTION 2 [TIME: 10 Minutes]
Now turn to the next page titled SECTION 2. We will do the two sample questionstogether in SECTION 2 and you will complete the other SECTIONS (SECTION 3 and 4)on your own. You will be told when to begin each section. Stop when you see this sign:
DISPLAY PICTURE OF STOP SIGN
If you finish a section early, you may check your work on that section only. Do notbegin another section until you are told to continue.
Congratulations. This class has been chosen to receive money for each correct answeron this test. We will be giving you each $10 for each correct answer on the mathassessment. To show you how it works, we will give you a two item, very easy test.You will receive $10 in cash for each sample question you get correct today. So, if youget both sample questions correct, you will get $20.
Then we will give you a much harder math test. You will also get $10 per correct item.[WRITE $10/QUESTION on the board.] Since we have to score the math tests, we willget the money to you in 30 days. We will give you the option of receiving a check fromUCLA or a post office money order to be sent home once the assessments are corrected.
Now turn to page 3 titled SECTION 2.
STOP
4H -
Read Sample 1.
READ SAMPLE 1 AND ANSWER CHOICES:
1. Which of the numbers below is the smallest?
A. 3
B. 1
C. 4
D. 7
Circle the letter that corresponds with the best answer.
2. Which of the numbers below is an even number?
A. 2
B. 5
C. 3
D. 1
Again, circle the letter that corresponds with the best answer.
After you are done, please sit quietly as we come around to check your answers andgive you $10 for each correct one. We need you to sign your name on PAGE 28 of yourbooklet and fill in the amount you received where it says "I received…"
AS YOU CHECK THE STUDENTS' ANSWERS, IF THE ANSWERS ARECORRECT, GIVE THE STUDENT $10 FOR EACH CORRECTLY ANSWEREDQUESTION. YOU CAN PROMPT EACH STUDENT TO BEGINCOMPLETING THE LAST PAGE (CHECK REQUEST FORM) OF THE TESTBOOKLET AS YOU GO AROUND THE CLASSROOM.
Please turn your test booklet over to the back cover. Clearly indicate your preference ofpayment by marking the box that corresponds to either a check or a money order. Besure to include your social security number and the address where you would like tohave it sent to. These items are essential. If you do not fill them out or don't know yoursocial security number, be sure to write your telephone number so that theUCLA/CRESST staff can contact you, otherwise we will have no way of paying you.After you have completed the form, please wait quietly for others to finish.
5H -
AFTER THE STUDENTS HAVE COMPLETED THE FORMS:
The sample questions do not reflect the difficulty of the questions on the mathassessment we have for you in SECTION 3 of the test booklet. Remember to read eachquestion carefully. Follow the instructions for each question; you will either circle theletter corresponding to the correct answer for each question or write your answer in thespace provided. If you change your answer, erase your first answer completely. If youfinish the section early check over your work. Do not proceed on to the other sectionsuntil you are told to do so.
SSSEEECCCTTTIIIOOONNN 333 [[[TTTIIIMMMEEE::: 222555 MMMIIINNNUUUTTTEEESSS]]]
We are ready to begin the math assessment now. Turn to PAGE 4 in your test booklet.We cannot answer any questions during the assessment. If you have a question, save ituntil the end of the class and we will answer it then. If you need another pencil at anytime, raise your hand and we will bring one to you. If you need to do some calculationsto get an answer, do them in the space provided in the booklet. If you run out of roomon a particular question, continue your work on the back of the page.
Remember we will give you $10 for each correct answer, just like the easier sample testthat you completed.
WWWRRRIIITTTEEE $$$111000...000000 OOONNN TTTHHHEEE CCCHHHAAALLLKKKBBBOOOAAARRRDDD OOORRR OOOVVVEEERRRHHHEEEAAADDD...
There are a total of 20 questions in SECTION 3. Although the questions are numbered 1through 18, question numbers 2 and 3 have two parts and will be counted as twoquestions each. You have the opportunity to receive $20 each for questions 2 and 3, ifyou answer both parts correctly. If you answer all of the items correctly, you willreceive $200. We are giving money to you to encourage you to try harder and do wellon this test. If you finish early, you can go back to those questions you could notanswer in this section only.
Now turn to PAGE 5 which is SECTION 3. You will have 25 minutes to complete thissection. Try not to spend too much time on any one question. If you cannot answer aquestion, proceed to the next one. You may begin now.
RECORD START TIME AND FINISH TIME ON THE CHALKBOARD OROVERHEAD.
FIVE MINUTES BEFORE TIME IS UP:
You have five minutes left. Remember to answer both parts of questions 2 and 3.
WRITE "5 MINUTES LEFT" ON THE CHALKBOARD OR OVERHEADPROJECTOR"
ONE MINUTE BEFORE TIME IS UP:
6H -
You have one minute to finish this section.
SSSEEECCCTTTIIIOOONNN 444 [[[TTTIIIMMMEEE::: 888 MMMIIINNNUUUTTTEEESSS]]]
Okay. That is the end of SECTION 3. Please stop where you are. Now turn toSECTION 4 on page 23. You will be given 8 minutes to complete this section.
IF APPLICABLE: IF the bell rings before we have stopped, please continue to work.We will pass out tardy excuses.
Remember to read the directions before you proceed on to question 1. When you arefinished with this section, please turn your booklet over.
We will be by to pick up your calculator while you complete SECTION 4 [Prompt testadministrator who is not reading script to pick up calculators.].
You may begin now.
AFTER 8 MINUTES:
Okay please stop. If you are not finished, please stop and turn your booklets over. Wewill come by to pick up your test booklet. You can keep your pencil. Check if you haveyour name and gender marked on the front of your test.
PICK UP ANY REMAINING BOOKLETS
We will be sending each of you a letter next month, which will contain your results anda check or money order. We would like to thank you for being part of our study.Before we leave, do you have any questions for us?
AFTER ANSWERING ANY QUESTIONS THE STUDENTS MAY HAVE:
Thank you again for participating in our study. If you have any further questions,please call XXX XXX at CRESST at (310) xxx-xxxxs (PUT NAME AND NUMBER ONBOARD, IF POSSIBLE.]
Please wait until the bell rings and then you are excused to leave.
7H -
ADMINISTRATION SCRIPT
CONTROL GROUP
SSSEEESSSSSSIIIOOONNN AAADDDMMMIIINNNIIISSSTTTRRRAAATTTIIIOOONNN SSSCCCRRRIIIPPPTTT
INSTRUCTIONS TO THE ADMINISTRATOR ARE PRINTED IN BOLDCAPITAL LETTERS AND SHOULD NOT BE READ TO THE STUDENTS.ALL WORDS IN PLAIN PRINT ARE TO BE READ TO THE STUDENTS.
8H -
IIINNNTTTRRROOODDDUUUCCCTTTIIIOOONNN [[[TTTIIIMMMEEE::: 555 MMMIIINNNUUUTTTEEESSS]]]
Please check the two lists for your name, take all of your belongings, and reportto your assigned room. Since we only have this class period for the assessment,please proceed as quickly as possible.
If your name does not appear on either list, please wait patiently in your seat andwe will assign you to a group.
SSSEEECCCTTTIIIOOONNN 111 [[[TTTIIIMMMEEE::: 111000 MMMIIINNNUUUTTTEEESSS]]]
ONCE THE GROUPS HAVE BEEN SUCCESSFULLY SEPARATED AND AREENTERING THE DESIGNATED ROOMS:Hello. My name is ____________ and this is my colleague ____________. We are partof a research center at UCLA. Today you will be participating in a study on howmotivation affects testing. To make sure that all students receive the same instructions,I will be reading them to you from a script.
The purpose of this study is to provide information on the knowledge and attitudes ofyoung people. As part of the study, you will answer questions about yourself andabout mathematics. It will take 50 minutes. You will not be allowed to ask questionsduring the assessment. Please do the best you can.
PLESAE DO NOT OPEN THE TEST BOOKLET.
You will not need to use any of your personal items—except a calculator if youlike—but will use the test booklet and pencil that is on your desk/that we aredistributing. We will be by to distribute a calculator to you if you need one.
PLEASE TURN YOU TEST BOOKLET OVER TO THE FRONT COVER PAGE. PRINTYOUR NAME AND CIRCLE YOUR GENDER IN THE SPACES PROVIDED ON THECOVER PAGE.
Open the booklet to the first page titled SECTION 1. Read the directions to yourself as Iread them aloud:
In this booklet, you will find questions about mathematics. Because thereare different booklets, the other students around you may be working onbooklets that are different from yours. You will have 25 minutes toanswer all of the questions in this section. Read each question carefullyand answer it as well as you can.
9H -
You will be told when to begin work on this booklet. If you finishanswering the questions before time is called, you may go over your workand review your answers.
If you decide to change an answer to a question, erase or cross out yourfirst choice and then circle the letter next to the answer you considercorrect.
For other questions you will be asked to write short answers in the spaceprovided in your booklet. For these questions, you may use words,drawings, numbers, or equations in your answers.
Even if you use a calculator, when the question asks you to show ALL ofyour work it is very important that you give as complete an answer as youcan. Please use the extra space on the page to do your work. You will notbe penalized for guessing or providing incorrect responses so you shouldattempt to answer every question.
***end of instructions in test booklet—continue reading***
SSSEEECCCTTTIIIOOONNN 222 [[[TTTIIIMMMEEE::: 555 MMMIIINNNUUUTTTEEESSS]]]
Now turn to the next page titled SECTION 2. Read each question carefully and answerit as well as you can. We will do the two sample questions together in the SECTION 2and you will complete the other SECTIONS (SECTION 3 and 4) on your own. You willbe told when to begin each section. Stop when you see this sign:
DISPLAY PICTURE OF STOP SIGN
If you finish a section early, you may check your work on that section only. Do notbegin another section until you are told to continue.
Read Sample 1.
READ SAMPLE 1 AND ANSWER CHOICES:
1. Which of the numbers below is the smallest?
E. 3
F. 1
STOP
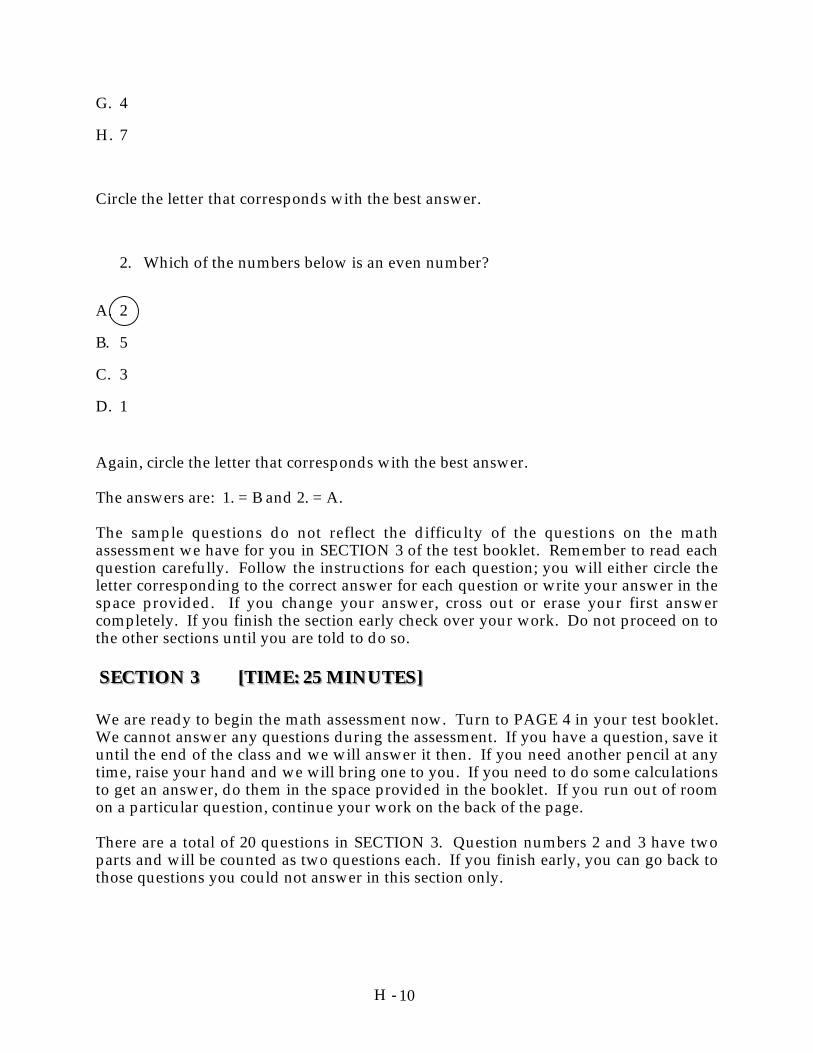
10H -
G. 4
H. 7
Circle the letter that corresponds with the best answer.
2. Which of the numbers below is an even number?
A. 2
B. 5
C. 3
D. 1
Again, circle the letter that corresponds with the best answer.
The answers are: 1. = B and 2. = A.
The sample questions do not reflect the difficulty of the questions on the mathassessment we have for you in SECTION 3 of the test booklet. Remember to read eachquestion carefully. Follow the instructions for each question; you will either circle theletter corresponding to the correct answer for each question or write your answer in thespace provided. If you change your answer, cross out or erase your first answercompletely. If you finish the section early check over your work. Do not proceed on tothe other sections until you are told to do so.
SSSEEECCCTTTIIIOOONNN 333 [[[TTTIIIMMMEEE::: 222555 MMMIIINNNUUUTTTEEESSS]]]
We are ready to begin the math assessment now. Turn to PAGE 4 in your test booklet.We cannot answer any questions during the assessment. If you have a question, save ituntil the end of the class and we will answer it then. If you need another pencil at anytime, raise your hand and we will bring one to you. If you need to do some calculationsto get an answer, do them in the space provided in the booklet. If you run out of roomon a particular question, continue your work on the back of the page.
There are a total of 20 questions in SECTION 3. Question numbers 2 and 3 have twoparts and will be counted as two questions each. If you finish early, you can go back tothose questions you could not answer in this section only.
11H -
Now turn to PAGE 5 to start the test. You will have 25 minutes to complete this section.Try not to spend too much time on one question. If you cannot answer it, proceed tothe next one.
RECORD START TIME AND FINISH TIME ON THE CHALKBOARD OROVERHEAD.
FIVE MINUTES BEFORE TIME IS UP:
You have five minutes left. Remember to answer both parts of questions 2 and 3.
WRITE "5 MINUTES LEFT" ON THE CHALKBOARD
ONE MINUTE BEFORE TIME IS UP:
You have one minute to finish this section.
SECTION 4 [TIME: 8 MINUTES]Okay. That is the end of SECTION 3. Please stop where you are. Now turn toSECTION 4 on page 23. You will be given 8 minutes to complete this section.
IF APPLICABLE: IF the bell rings before we have stopped, please continue to work.We will pass out tardy excuses.
Remember to read the directions before you proceed on to question 1. When you arefinished with this section, please turn your booklet over.
We will be by to pick up your calculator while you complete SECTION 4 [Prompt testadministrator who is not reading script to pick up calculators.].
You may begin now.
AFTER 8 MINUTES:
Okay please stop. If you are not finished, please stop and turn your booklets over. Youcan keep your pencil. Check if you have your name and gender marked on the front ofyour test.
Remember, this is a study about motivation. Just so you know, the other students in theclass had the opportunity to get money for participating in their part of the study. Theyhad the opportunity of receiving money for each item they answered correctly on theassessment. We are giving each of you $20 to thank you for your participation in thisstudy. You were randomly assigned to the control group. Thus, each student had anequal chance of being in the incentive or control group.
12H -
We will be sending each of you a letter next month, which will contain your results. Wewould like to thank you again for being part of our study. As we come around to eachof you, we will need you to sign the last page of your test booklet where it asks for yoursignature, and fill in $20.00 for the amount received. This will verify to UCLA that youreceived money for participating in this study. Please be patient and wait for everyoneto receive their money. You will be excused once the bell rings.
As we distribute your money, do you have any questions for us?
Thank you again for participating in our study. If you have any further questions,please call XXX XXX at CRESST at (310) xxx-xxxx (PUT NAME AND NUMBER ONBOARD, IF POSSIBLE.]
Please wait until the bell rings and then you are excused to leave.
DISTRIBUTE ONE ENVELOPE TO EACH STUDENT AND MAKE SUREEACH STUDENT SIGNS HIS OR HER NAME ON THE LAST PAGE OF THEBOOKLET.

Appendix I
Original Principal Letter

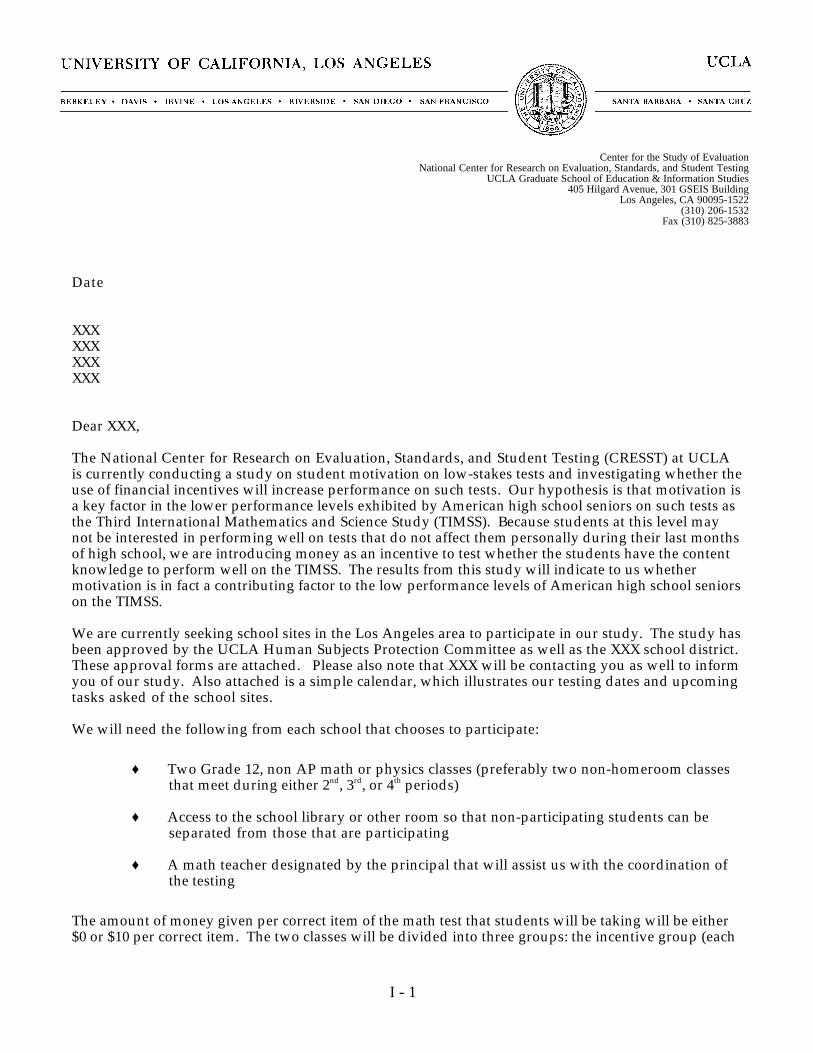
I - 1
Center for the Study of EvaluationNational Center for Research on Evaluation, Standards, and Student Testing
UCLA Graduate School of Education & Information Studies405 Hilgard Avenue, 301 GSEIS Building
Los Angeles, CA 90095-1522(310) 206-1532
Fax (310) 825-3883
Date
XXXXXXXXXXXX
Dear XXX,
The National Center for Research on Evaluation, Standards, and Student Testing (CRESST) at UCLAis currently conducting a study on student motivation on low-stakes tests and investigating whether theuse of financial incentives will increase performance on such tests. Our hypothesis is that motivation isa key factor in the lower performance levels exhibited by American high school seniors on such tests asthe Third International Mathematics and Science Study (TIMSS). Because students at this level maynot be interested in performing well on tests that do not affect them personally during their last monthsof high school, we are introducing money as an incentive to test whether the students have the contentknowledge to perform well on the TIMSS. The results from this study will indicate to us whethermotivation is in fact a contributing factor to the low performance levels of American high school seniorson the TIMSS.
We are currently seeking school sites in the Los Angeles area to participate in our study. The study hasbeen approved by the UCLA Human Subjects Protection Committee as well as the XXX school district.These approval forms are attached. Please also note that XXX will be contacting you as well to informyou of our study. Also attached is a simple calendar, which illustrates our testing dates and upcomingtasks asked of the school sites.
We will need the following from each school that chooses to participate:
♦ Two Grade 12, non AP math or physics classes (preferably two non-homeroom classesthat meet during either 2nd, 3rd, or 4th periods)
♦ Access to the school library or other room so that non-participating students can beseparated from those that are participating
♦ A math teacher designated by the principal that will assist us with the coordination ofthe testing
The amount of money given per correct item of the math test that students will be taking will be either$0 or $10 per correct item. The two classes will be divided into three groups: the incentive group (each
I - 2
student will receive $10 for each correct item in the form of a check or money order after tests havebeen corrected); the control group (each student will receive $0 for each correct item, but will receive$20 cash for their participation); and the non-participating group (who will be separated from theincentive and control groups). The students in the incentive group will also receive $20 cash foranswering two very easy sample questions correctly (this was implemented into the study so thatbelievability is established among the students receiving money for providing correct answers). We willalso be collecting data on state effort, self-efficacy, and worry.
We would like to conduct the Pilot Study during the week of March 8, 1999. The Main Study willbe conducted the week of March 22, 1999 - April 9, 1999. Due to time constraints, we are onlyseeking schools to participate who will be available for testing during these timeframes. We will bepaying each teacher $75 for letting us use their valuable class time and for helping us with thecoordination of the testing. We will also be paying each school site $100 to be used as designated bythe school principal.
If you have any questions or concerns, please contact XXX at XXX or me, XXX, at XXX. We will becontacting your school soon to follow up on your possible interest in participating. Thank you for yourconsideration.
Sincerely,
XXXProject Director
Appendix J
Tasks-and-Timeline Form

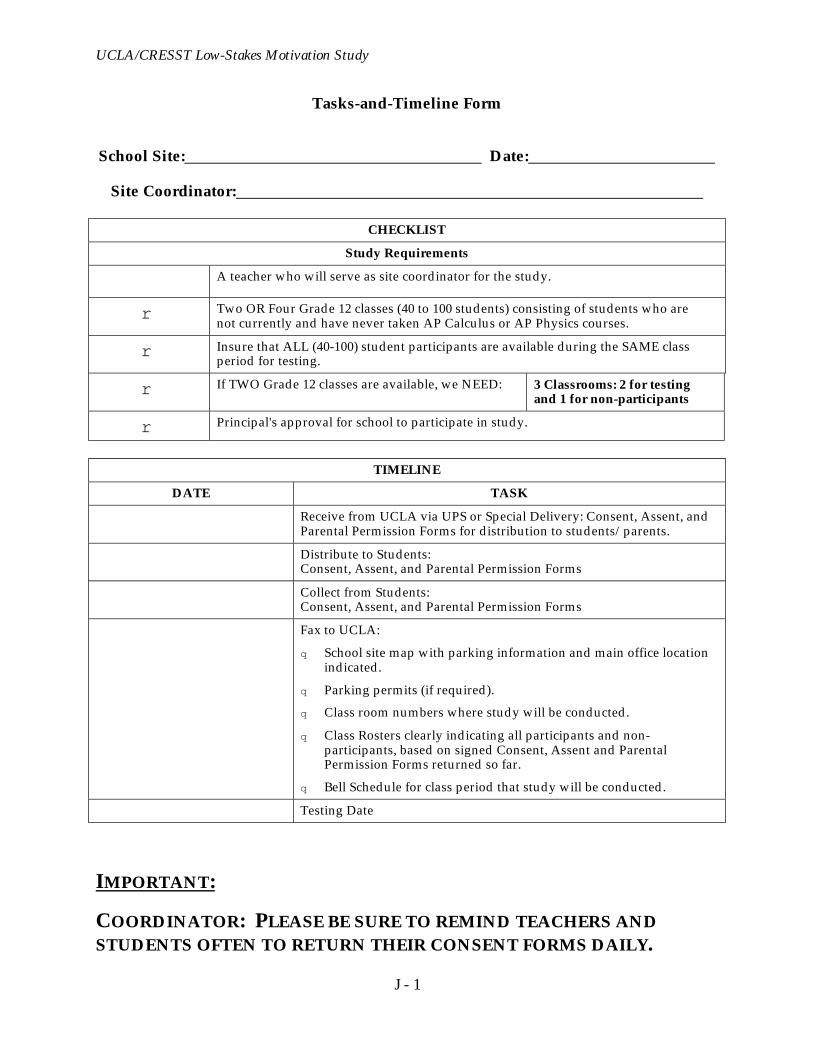
UCLA/CRESST Low-Stakes Motivation Study
J - 1
Tasks-and-Timeline Form
School Site: Date:
Site Coordinator:
CHECKLIST
Study Requirements
A teacher who will serve as site coordinator for the study.
r Two OR Four Grade 12 classes (40 to 100 students) consisting of students who arenot currently and have never taken AP Calculus or AP Physics courses.
r Insure that ALL (40-100) student participants are available during the SAME classperiod for testing.
r If TWO Grade 12 classes are available, we NEED: 3 Classrooms: 2 for testingand 1 for non-participants
r Principal's approval for school to participate in study.
TIMELINE
DATE TASK
Receive from UCLA via UPS or Special Delivery: Consent, Assent, andParental Permission Forms for distribution to students/parents.
Distribute to Students:Consent, Assent, and Parental Permission Forms
Collect from Students:Consent, Assent, and Parental Permission Forms
Fax to UCLA:
q School site map with parking information and main office locationindicated.
q Parking permits (if required).
q Class room numbers where study will be conducted.
q Class Rosters clearly indicating all participants and non-participants, based on signed Consent, Assent and ParentalPermission Forms returned so far.
q Bell Schedule for class period that study will be conducted.
Testing Date
IMPORTANT:
COORDINATOR: PLEASE BE SURE TO REMIND TEACHERS ANDSTUDENTS OFTEN TO RETURN THEIR CONSENT FORMS DAILY.


Appendix K
Principal Verification Form

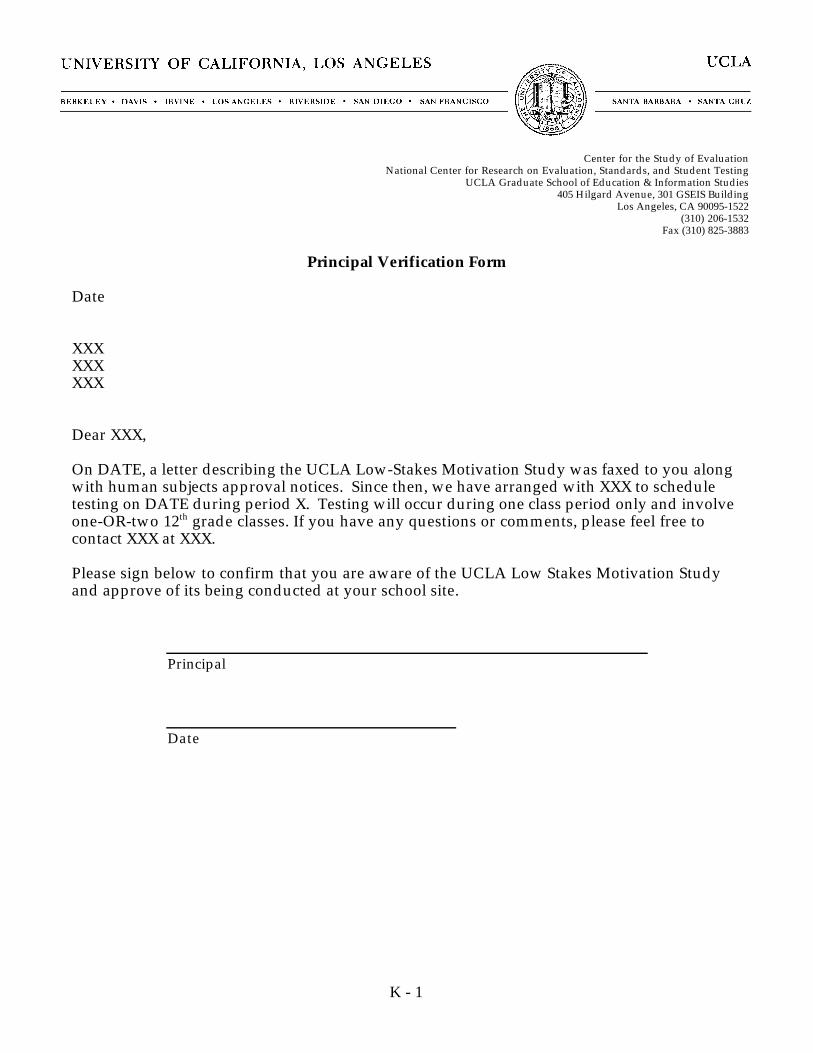
K - 1
Center for the Study of EvaluationNational Center for Research on Evaluation, Standards, and Student Testing
UCLA Graduate School of Education & Information Studies405 Hilgard Avenue, 301 GSEIS Building
Los Angeles, CA 90095-1522(310) 206-1532
Fax (310) 825-3883
Principal Verification Form
Date
XXXXXXXXX
Dear XXX,
On DATE, a letter describing the UCLA Low-Stakes Motivation Study was faxed to you alongwith human subjects approval notices. Since then, we have arranged with XXX to scheduletesting on DATE during period X. Testing will occur during one class period only and involveone-OR-two 12th grade classes. If you have any questions or comments, please feel free tocontact XXX at XXX.
Please sign below to confirm that you are aware of the UCLA Low Stakes Motivation Studyand approve of its being conducted at your school site.
Principal
Date

Appendix L
Site Coordinator Script

UCLA HSPC Number: G98-09-033-01 5/17/99 v.2Expiration Date:
HS-3 (1/98)
L - 1
University of California, Los Angeles
VERBAL SCRIPT TO PARTICIPANTS IN RESEARCH
Motivation and Standardized Test Study
1. UCLA is asking you to take part in a research study because they are trying to learn more aboutmotivation and test performance.
2. If you agree to be in this study you will be asked to take a math literacy test lasting approximatelyone class period.
3. There are no risks associated with your involvement in this study. Your individual test results willnot be released or used for any purpose outside of this research.
4. The potential benefit of this research to society includes greater knowledge of the role of motivationin test taking situations, so researchers at UCLA may better interpret both national and internationalcomparisons of achievement regarding high school students.
5. Please talk this over with your parents before you decide whether or not to participate. Your parentswill need to give their permission for you to take part in this study. But even if your parents say“yes” you can still decide not to do this.
6. If you don’t want to be in this study, you don’t have to participate. Remember, being in this study isup to you and no one will be upset if you don’t want to participate or even if you change your mindlater and want to stop.
7. You can ask any questions that you have about the study. If you have a question later that you didn’tthink of now, you can call XXX at XXX, who is one of the researchers at UCLA conducting this study.


Appendix M
Revised Consent Forms

UCLA HSPC Number: G98-09-033-01Expiration Date:
HS-3 (1/98)
1M -
Page Number: Page 1 of 3
University of California, Los Angeles
ASSENT TO PARTICIPATE IN RESEARCH
Motivation and Standardized Test Study
You are asked to participate in a research XXX study conducted by Eva Baker, Ed.D., from the Centerfor the Study of Evaluation at the University of California, Los Angeles. You were selected as apossible participant in this XXX study because you are a high school senior who has not takenadvanced mathematics or physics courses.
• PURPOSE OF THE XXX STUDY The purpose of this XXX study is to investigate the effect motivation may have on 12th grade studentperformance in standardized tests of mathematics. • PROCEDURES If you volunteer to participate in this XXX study, the following procedures would take place: We will begin in your regular classroom during a regularly scheduled class period. Two researchers willbegin by briefly describing the XXX study. Your class will be divided into groups. One group willremain in the classroom, while the other two groups will go to alternative classrooms. The researchers will then administer a brief mathematics test, which you will have 35 minutes tocomplete. After this time, the researchers will administer a few survey questionnaires which you willhave 10 minutes to complete. Following completion of the survey instruments, the class will bedebriefed and dismissed. • POTENTIAL RISKS AND DISCOMFORTS There is very minimal risk of harm or discomfort associated with the research procedure. You willengage in common test taking practices with which you are very familiar. • POTENTIAL BENEFITS TO SUBJECTS AND/OR TO SOCIETY The potential benefit of this research to society includes greater knowledge of the role of motivation intest taking situations, so we may better interpret both national and international comparisons ofachievement regarding our high school students. • COMPENSATION FOR PARTICIPATION If your child/ward participates in this study, s/he will be randomly assigned into one of two groups:control or experimental. Every student will receive some form of compensation.

UCLA HSPC Number: G98-09-033-01Expiration Date:
HS-3 (1/98)
2M -
Page Number: Page 2 of 3 • CONFIDENTIALITY Any information that is obtained in connection with this XXX study and is identified with you willremain confidential and will be disclosed only with your permission or as required by law. • PARTICIPATION AND WITHDRAWAL You can choose whether to be in this XXX study or not. If you volunteer to be in this XXX study, you maywithdraw at any time without consequences of any kind. You may also refuse to answer any questionsyou don't want to answer and still remain in the XXX study. The investigator may withdraw you fromthis research if circumstances arise which warrant doing so. • IDENTIFICATION OF INVESTIGATORS If you have any questions or concerns about the research, please feel free to contact Dr. Jamal Abedi atthe Center for the Study of Evaluation on the campus of UCLA, at 310-206-4346, or Dr. Eva Baker, alsoat the Center for the Study of Evaluation on the campus of UCLA, at 310-206-1532. • RIGHTS OF RESEARCH SUBJECTS You may withdraw your assent at any time and discontinue participation without penalty. You are notwaving any legal claims, rights or remedies because of your participation in this research XXX study.If you have questions regarding your rights as a research subject, contact the Office for Protection ofResearch Subjects, 2107 Ueberroth Building, UCLA. Box 951694, Los Angeles, CA 90095-1694, (310) 825-8714.
UCLA HSPC Number: G98-09-033-01Expiration Date:
HS-3 (1/98)
3M -
Page Number: Page 3 of 3
SIGNATURE OF RESEARCH SUBJECT OR LEGAL REPRESENTATIVE PLEASE READ CAREFULLY AND CHECK ONE BOX: q I understand the procedures described above, and that this study is a project of UCLA and that
it is not sponsored or funded by XXX. My questions have been answered to my satisfaction, and IAGREE to participate in this XXX study. I have been given a copy of this form.
q I understand the procedures described above, and that this study is a project of UCLA and that
it is not sponsored or funded by XXX. My questions have been answered to my satisfaction, and IDO NOT AGREE to participate in this XXX study. I have been given a copy of this form.
Name of Subject Date Signature for Adolescent Assent
SIGNATURE OF INVESTIGATOR (If required by the HSPC.) In my judgment the subject is voluntarily and knowingly giving informed assent and possesses the legalcapacity to give informed assent to participate in this research XXX study. Signature of Investigator Date
UCLA HSPC Number: G98-09-033-01Expiration Date:
HS-3 (1/98)
4M -
Page Number: Page 1 of 3
University of California, Los Angeles
CONSENT TO PARTICIPATE IN RESEARCH
Motivation and Standardized Test Study
You are asked to participate in a research XXX study conducted by Eva Baker, Ed.D., from the Centerfor the Study of Evaluation at the University of California, Los Angeles. You were selected as apossible participant in this XXX study because you are a high school senior who has not takenadvanced mathematics or physics courses. • PURPOSE OF THE XXX STUDY The purpose of this XXX study is to investigate the effect motivation may have on 12th grade studentperformance in standardized tests of mathematics. • PROCEDURES If you volunteer to participate in this XXX study, the following procedures would take place: We will begin in your regular classroom during a regularly scheduled class period. Two researchers willbegin by briefly describing the XXX study. Your class will be divided into groups. One group willremain in the classroom, while the other two groups will go to alternative classrooms. The researchers will then administer a brief mathematics test, which you will have 35 minutes tocomplete. After this time, the researchers will administer a few survey questionnaires which you willhave 10 minutes to complete. Following completion of the survey instruments, the class will bedebriefed and dismissed. • POTENTIAL RISKS AND DISCOMFORTS There is very minimal risk of harm or discomfort associated with the research procedure. You willengage in common test taking practices with which you are very familiar. • POTENTIAL BENEFITS TO SUBJECTS AND/OR TO SOCIETY The potential benefit of this research to society includes greater knowledge of the role of motivation intest taking situations, so we may better interpret both national and international comparisons ofachievement regarding our high school students. • COMPENSATION FOR PARTICIPATION If your child/ward participates in this study, s/he will be randomly assigned into one of two groups:control or experimental. Every student will receive some form of compensation.

UCLA HSPC Number: G98-09-033-01Expiration Date:
HS-3 (1/98)
5M -
Page Number: Page 2 of 3 • CONFIDENTIALITY Any information that is obtained in connection with this XXX study and is identified with you willremain confidential and will be disclosed only with your permission or as required by law. • PARTICIPATION AND WITHDRAWAL You can choose whether to be in this XXX study or not. If you volunteer to be in this XXX study, you maywithdraw at any time without consequences of any kind. You may also refuse to answer any questionsyou don't want to answer and still remain in the XXX study. The investigator may withdraw you fromthis research if circumstances arise which warrant doing so. • IDENTIFICATION OF INVESTIGATORS If you have any questions or concerns about the research, please feel free to contact Dr. Jamal Abedi atthe Center for the Study of Evaluation on the campus of UCLA, at 310-206-4346, or Dr. Eva Baker, alsoat the Center for the Study of Evaluation on the campus of UCLA, at 310-206-1532. • RIGHTS OF RESEARCH SUBJECTS You may withdraw your consent at any time and discontinue participation without penalty. You are notwaving any legal claims, rights or remedies because of your participation in this research XXX study.If you have questions regarding your rights as a research subject, contact the Office for Protection ofResearch Subjects, 2107 Ueberroth Building, UCLA. Box 951694, Los Angeles, CA 90095-1694, (310) 825-8714.
UCLA HSPC Number: G98-09-033-01Expiration Date:
HS-3 (1/98)
6M -
Page Number: Page 3 of 3
SIGNATURE OF RESEARCH SUBJECT OR LEGAL REPRESENTATIVE PLEASE READ CAREFULLY AND CHECK ONE BOX: q I understand the procedures described above, and that this study is a project of UCLA and that
it is not sponsored or funded by XXX. My questions have been answered to my satisfaction, and IAGREE to participate in this XXX study. I have been given a copy of this form.
q I understand the procedures described above, and that this study is a project of UCLA and that
it is not sponsored or funded by XXX. My questions have been answered to my satisfaction, and IDO NOT AGREE to participate in this XXX study. I have been given a copy of this form.
Name of Subject Date Signature for Adolescent Consent
SIGNATURE OF INVESTIGATOR (If required by the HSPC.) In my judgment the subject is voluntarily and knowingly giving informed consent and possesses the legalcapacity to give informed consent to participate in this research XXX study. Signature of Investigator Date
UCLA HSPC Number: G98-09-033-01Expiration Date:
HS-3 (1/98)
7M -
Page Number: Page 1 of 3
University of California, Los Angeles
PARENTAL PERMISSION FOR MINOR TOPARTICIPATE IN RESEARCH
Motivation and Standardized Test Study
Your child/ward has been asked to participate in a research XXX study conducted by Eva Baker, Ed.D.,from the Center for the Study of Evaluation at the University of California, Los Angeles. Yourchild/ward was selected as a possible participant in this XXX study because s/he is a high schoolsenior who has not taken advanced mathematics or physics courses. • PURPOSE OF THE PILOT STUDY The purpose of this XXX study is to investigate the effect motivation may have on 12th grade studentperformance in standardized tests of mathematics. • PROCEDURES If your child/ward volunteers to participate in this XXX study, the following procedures would takeplace: We will begin in the regular classroom during a regularly scheduled class period. Two researchers willbegin by briefly describing the XXX study. The class will be divided into groups. One group will remainin the classroom, while the other two groups will go to alternative classrooms. The researchers will then administer a brief mathematics test, which the students will have 35minutes to complete. After this time, the researchers will administer a few survey questionnaireswhich the students will have 10 minutes to complete. Following completion of the survey instruments,the class will be debriefed and dismissed. • POTENTIAL RISKS AND DISCOMFORTS There is very minimal risk of harm or discomfort associated with the research procedure. Yourchild/ward will engage in common test taking practices with which s/he is very familiar. • POTENTIAL BENEFITS TO SUBJECTS AND/OR TO SOCIETY The potential benefit of this research to society includes greater knowledge of the role of motivation intest taking situations, so we may better interpret both national and international comparisons ofachievement regarding our high school students. • COMPENSATION FOR PARTICIPATION If your child/ward participates in this study, s/he will be randomly assigned into one of two groups:control or experimental. Every student will receive some form of compensation.
UCLA HSPC Number: G98-09-033-01Expiration Date:
HS-3 (1/98)
8M -
Page Number: Page 2 of 3 • CONFIDENTIALITY Any information that is obtained in connection with this XXX study and is identified with yourchild/ward will remain confidential and will be disclosed only with your permission or as required bylaw. • PARTICIPATION AND WITHDRAWAL Your child/ward can choose whether to be in this XXX study or not. If s/he volunteers to be in this XXXstudy, s/he may withdraw at any time without consequences of any kind. Your child/ward may alsorefuse to answer any questions s/he doesn’t want to answer and still remain in the XXX study. Theinvestigator may withdraw your child/ward from this research if circumstances arise which warrantdoing so. • IDENTIFICATION OF INVESTIGATORS If you have any questions or concerns about the research, please feel free to contact Dr. Jamal Abedi atthe Center for the Study of Evaluation on the campus of UCLA, at 310-206-4346, or Dr. Eva Baker, alsoat the Center for the Study of Evaluation on the campus of UCLA, at 310-206-1532. • RIGHTS OF RESEARCH SUBJECTS
Your child/ward may withdraw her/his assent at any time and discontinue participation withoutpenalty. Your child/ward is not waving any legal claims, rights or remedies because of his/herparticipation in this research XXX study. If your child/ward has questions regarding his/her rights asa research subject, contact the Office for Protection of Research Subjects, 2107 Ueberroth Building,UCLA. Box 951694, Los Angeles, CA 90095-1694, (310) 825-8714.
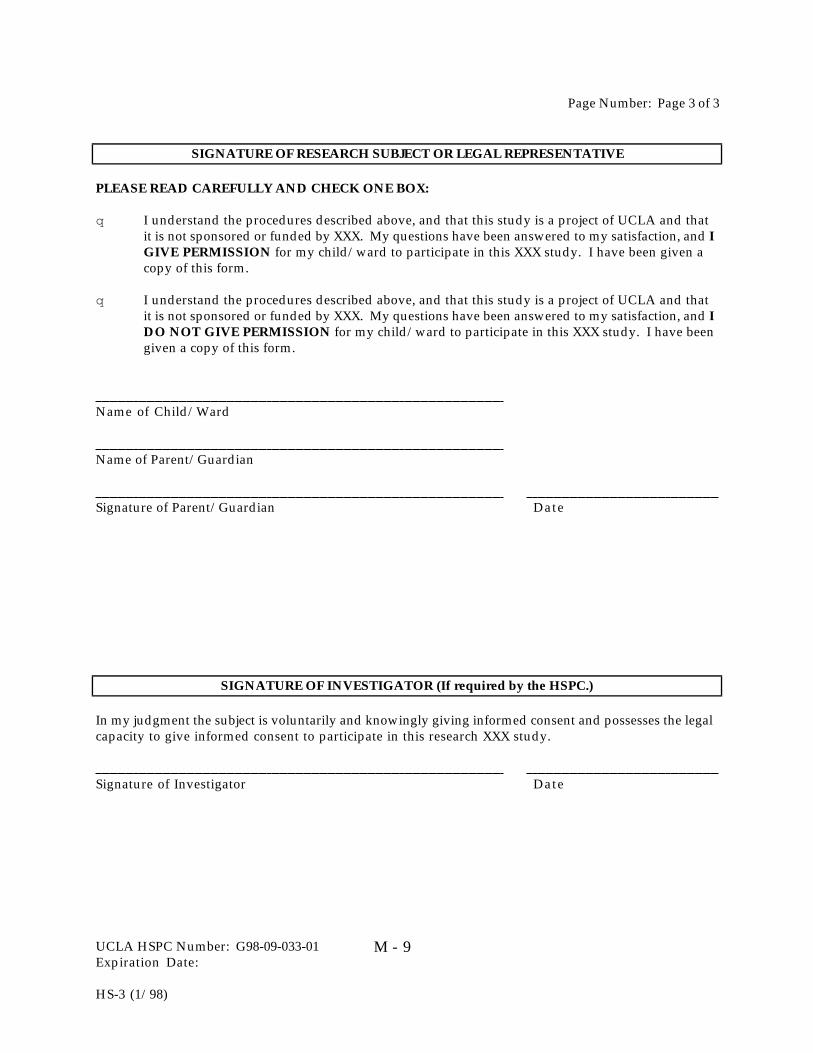
UCLA HSPC Number: G98-09-033-01Expiration Date:
HS-3 (1/98)
9M -
Page Number: Page 3 of 3
SIGNATURE OF RESEARCH SUBJECT OR LEGAL REPRESENTATIVE
PLEASE READ CAREFULLY AND CHECK ONE BOX:
q I understand the procedures described above, and that this study is a project of UCLA and thatit is not sponsored or funded by XXX. My questions have been answered to my satisfaction, and IGIVE PERMISSION for my child/ward to participate in this XXX study. I have been given acopy of this form.
q I understand the procedures described above, and that this study is a project of UCLA and thatit is not sponsored or funded by XXX. My questions have been answered to my satisfaction, and IDO NOT GIVE PERMISSION for my child/ward to participate in this XXX study. I have beengiven a copy of this form.
Name of Child/Ward
Name of Parent/Guardian
Signature of Parent/Guardian Date
SIGNATURE OF INVESTIGATOR (If required by the HSPC.)
In my judgment the subject is voluntarily and knowingly giving informed consent and possesses the legalcapacity to give informed consent to participate in this research XXX study.
Signature of Investigator Date

Appendix N
Revised Principal Letter

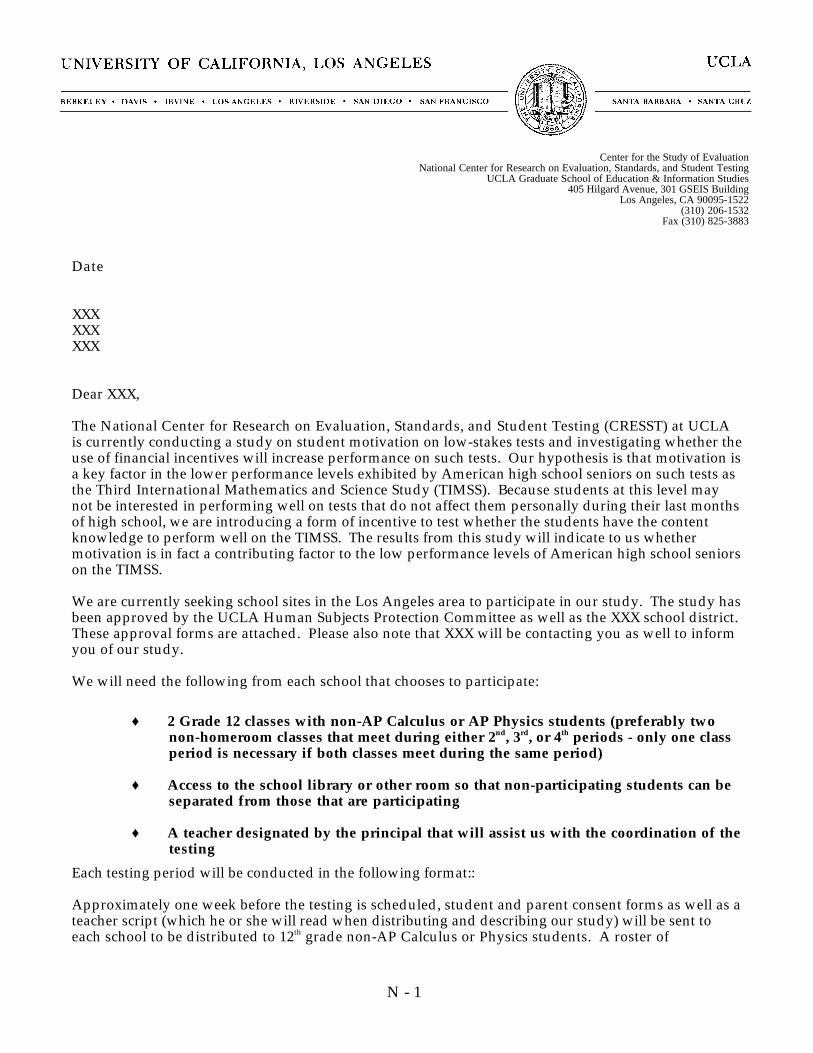
N - 1
Center for the Study of EvaluationNational Center for Research on Evaluation, Standards, and Student Testing
UCLA Graduate School of Education & Information Studies405 Hilgard Avenue, 301 GSEIS Building
Los Angeles, CA 90095-1522(310) 206-1532
Fax (310) 825-3883
Date
XXXXXXXXX
Dear XXX,
The National Center for Research on Evaluation, Standards, and Student Testing (CRESST) at UCLAis currently conducting a study on student motivation on low-stakes tests and investigating whether theuse of financial incentives will increase performance on such tests. Our hypothesis is that motivation isa key factor in the lower performance levels exhibited by American high school seniors on such tests asthe Third International Mathematics and Science Study (TIMSS). Because students at this level maynot be interested in performing well on tests that do not affect them personally during their last monthsof high school, we are introducing a form of incentive to test whether the students have the contentknowledge to perform well on the TIMSS. The results from this study will indicate to us whethermotivation is in fact a contributing factor to the low performance levels of American high school seniorson the TIMSS.
We are currently seeking school sites in the Los Angeles area to participate in our study. The study hasbeen approved by the UCLA Human Subjects Protection Committee as well as the XXX school district.These approval forms are attached. Please also note that XXX will be contacting you as well to informyou of our study.
We will need the following from each school that chooses to participate:
♦ 2 Grade 12 classes with non-AP Calculus or AP Physics students (preferably twonon-homeroom classes that meet during either 2nd, 3rd, or 4th periods - only one classperiod is necessary if both classes meet during the same period)
♦ Access to the school library or other room so that non-participating students can beseparated from those that are participating
♦ A teacher designated by the principal that will assist us with the coordination of thetesting
Each testing period will be conducted in the following format::
Approximately one week before the testing is scheduled, student and parent consent forms as well as ateacher script (which he or she will read when distributing and describing our study) will be sent toeach school to be distributed to 12th grade non-AP Calculus or Physics students. A roster of
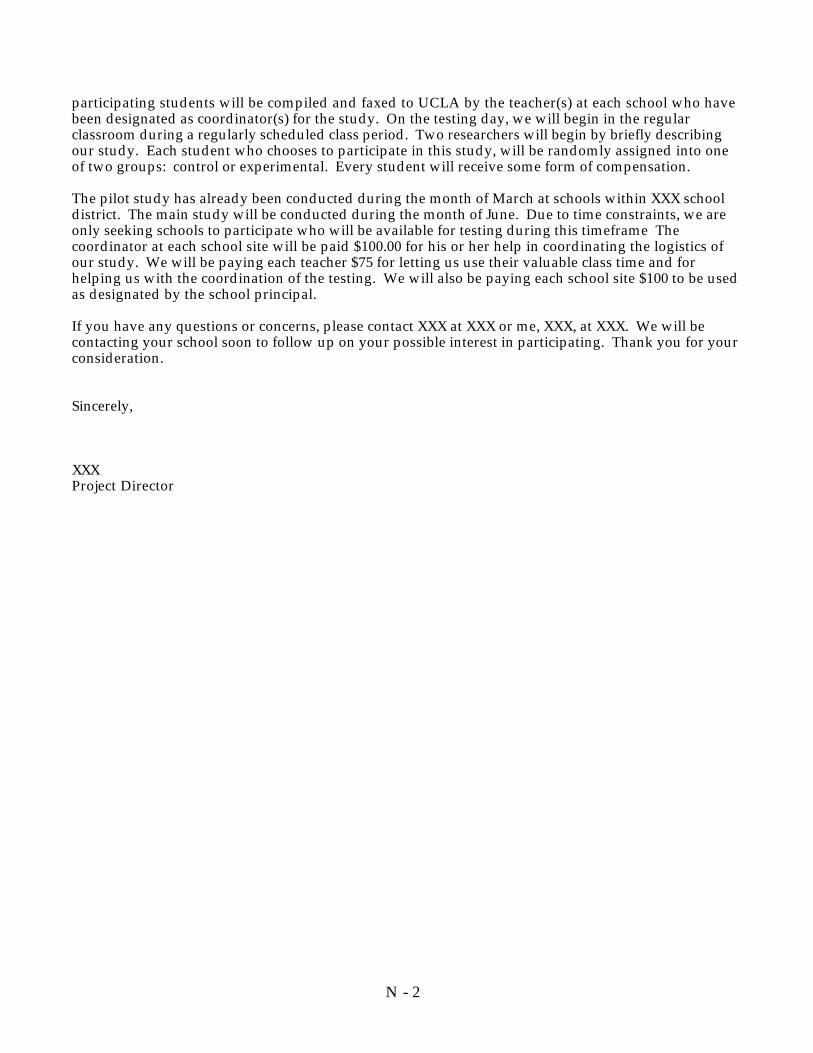
N - 2
participating students will be compiled and faxed to UCLA by the teacher(s) at each school who havebeen designated as coordinator(s) for the study. On the testing day, we will begin in the regularclassroom during a regularly scheduled class period. Two researchers will begin by briefly describingour study. Each student who chooses to participate in this study, will be randomly assigned into oneof two groups: control or experimental. Every student will receive some form of compensation.
The pilot study has already been conducted during the month of March at schools within XXX schooldistrict. The main study will be conducted during the month of June. Due to time constraints, we areonly seeking schools to participate who will be available for testing during this timeframe Thecoordinator at each school site will be paid $100.00 for his or her help in coordinating the logistics ofour study. We will be paying each teacher $75 for letting us use their valuable class time and forhelping us with the coordination of the testing. We will also be paying each school site $100 to be usedas designated by the school principal.
If you have any questions or concerns, please contact XXX at XXX or me, XXX, at XXX. We will becontacting your school soon to follow up on your possible interest in participating. Thank you for yourconsideration.
Sincerely,
XXXProject Director