Embed Size (px)
Citation preview

MONETARY POLICY & THE ECONOMY Q4/20 – Q1/21 131
The effects of the monetary policy response to the COVID-19 pandemic: preliminary evidence from a pilot study using Austrian bank-level data
Claudia Kwapil, Kilian Rieder1
Refereed by: Olivier Vergote, European Central Bank
The Eurosystem’s monetary policy response to the COVID-19 crisis has been swift and powerful. Its policy package contained both extensions and enlargements of existing unconventional monetary policy measures, including the further loosening of their respective conditions. The Eurosystem also introduced new measures to meet the extraordinary challenge posed by the economic fallout of the COVID-19 pandemic. In this paper, we provide a pilot study to analyze the credit supply effects of one important building block of the monetary policy rescue package: the Eurosystem’s targeted longer-term refinancing operations (TLTROs). The modalities and conditions of the current vintage of TLTRO, TLTRO III, were significantly relaxed in spring 2020 in response to the COVID-19 pandemic. We draw on Austrian bank-level data and exploit an instrumental variable strategy to approximate the effects of the June 2020 TLTRO uptake on banks’ supply of new loans. We find evidence for an unambiguously positive effect of TLTRO participation on the supply of new loans in Austria. The estimated credit supply elasticity, how-ever, differs substantially (ranging between 0.26 and 1.00), depending on the specification and caveats considered.
JEL classification: E44, E51, E52, E58Keywords: COVID-19, monetary policy, targeted longer-term refinancing operations, credit supply
The COVID-19 shock resulted in a worldwide economic downturn. According to the latest estimates by Eurosystem staff (2020), the associated recession in the euro area will reduce the euro area’s GDP level by 7.3% in 2020. Fenz and Schneider (2020) expect Austria’s GDP to decline by approximately 7% as well. This downturn in economic activity is going hand in hand with lower inflation. The December Eurosystem staff economic projections (2020) show that the COVID-19 pandemic and the related containment measures will leave inflation rates in the euro area only slightly above zero in 2020. Moreover, the shock will dampen inflation devel-opments over a prolonged period of time and will thus be likely to cause increases in the Harmonised Index of Consumer Prices (HICP) that will be significantly below the Eurosystem’s price stability objective in the years to come.
Moreover, in view of the spreading of the coronavirus, financial markets showed severe signs of stress. At the end of February and the beginning of March 2020, global risk aversion rose sharply. Consequently, market volatility surged, equity prices plummeted, and risk premia widened. Safe-haven flows led to a
1 Oesterreichische Nationalbank, Economic Analysis Division, [email protected] and [email protected]. Opinions expressed by the authors of studies do not necessarily reflect the official viewpoint of the Oesterreichische Nationalbank or the Eurosystem. The authors would like to thank Olivier Vergote (European Central Bank), Ernest Gnan, María Teresa Valderrama (both OeNB) and Clemens Jobst (University of Vienna) for their helpful comments and valuable suggestions.

The effects of the monetary policy response to the COVID-19 pandemic: preliminary evidence from a pilot study using Austrian bank-level data
132 OESTERREICHISCHE NATIONALBANK
marked decline of euro area long-term risk-free rates, while spreads between sov-ereign bonds in some euro area countries increased. Following the spreading of the coronavirus and the related lockdowns, money market rates increased. In other words, banks’ financing conditions deteriorated significantly, posing a threat to the stable supply of credit and, as a corollary, also to economic activity.
To prevent a reduction in credit supply that would worsen the economic situa-tion and to bring inflation back to its target level of close to, but below, 2% in the medium term, the Eurosystem has put together a comprehensive package of mon-etary policy measures. First, it increased the purchasing volume of its current securities purchase program (extended asset purchase programme – APP) and introduced a new program (pandemic emergency purchase programme – PEPP) that complements the APP by introducing higher flexibility in proportion to the severity of the crisis. Together, the purchasing volume of both programs amounts to nearly EUR 2.5 trillion. Thus, the Eurosystem central banks significantly increased the amount of corporate bonds, bank-issued covered bonds and sover-eign bonds they will buy until the end of March 2022.2 The Eurosystem’s corporate sector purchasing operations address the deteriorating market conditions in the wake of the COVID-19 pandemic. Hence, these operations reduce the interest rate costs companies face when issuing new bonds and they make it easier for compa-nies to float new issues on the primary market. The very same logic applies to bank-issued covered bonds. Given the “benchmark” status of government bonds, sovereign bond purchasing programs in turn reduce the interest rate level and the financing costs for all economic sectors and for numerous financial instruments, including risk capital, via a reduction in government bond yields over the entire range of maturities. Thus, as a result of the related asset purchases, many areas of the economy benefit from more favorable financing conditions in the capital markets.
Small and medium-sized enterprises (SMEs) and households, however, rarely have access to capital markets and depend on bank credit instead. Frequently, their only source of external finance are bank loans, and the conditions at which these are provided are crucial for the implementation of consumption and investment projects. Consequently, were the COVID-19 crisis to impair the banking sector’s capacity to provide adequate funding to SMEs and households, euro area economic growth would suffer, and the inflation outlook would be dampened even further.
The second part of the Eurosystem’s monetary policy response to the COVID-19 pandemic is, therefore, designed to strengthen the supply of bank loans to the real economy by providing ample sources of refinancing at lower interest rates and longer maturities than before the COVID-19 shock. In addition to its regular refinancing operations, the Eurosystem started to offer banks two new refinancing programs – pandemic emergency longer-term refinancing operations (PELTROs) and a modified version of the third generation of targeted longer-term refinancing operations (TLTRO III) – at interest rates that are below the rate on its main refinancing operation (currently 0%) and at maturities of between one and three years. Both programs are carried out through a fixed-rate tender procedure with full allotment, which means that banks’ demand is met in full (if they comply with the eligibility requirements). The reasoning behind these measures is that
2 The above estimate of the combined APP and PEPP purchasing volume of EUR 2.5 trillion is based on the assumption that the APP will also be continued until March 2022.

The effects of the monetary policy response to the COVID-19 pandemic: preliminary evidence from a pilot study using Austrian bank-level data
MONETARY POLICY & THE ECONOMY Q4/20 – Q1/21 133
banks subsequently pass on their favorable refinancing conditions to the real econ-omy. Central bank loans with longer maturities are intended to give banks more security regarding their medium-term refinancing situation and refinancing costs, so that refinancing obstacles to loan provision are removed.
Since the Eurosystem only provides collateralized loans, the third building block of its policy response to the COVID-19 pandemic are significantly eased collateral requirements to anticipate potential borrowing constraints and widen access to central bank refinancing. Accepting lower-quality collateral ensures that banks have more assets they can mobilize as collateral with the Eurosystem so they can participate in the liquidity-providing operations and continue to provide fund-ing to the euro area economy. To increase the pool of eligible assets, the Eurosys-tem reduced the applied haircuts and relaxed the conditions at which credit claims can be accepted as collateral. Moreover, the Eurosystem’s monetary policy re-sponse includes a rating freeze. Hence, rating downgrades that are attributable to the economic fallout of the COVID-19 pandemic alone and that would normally entail a deterioration of asset ratings below minimum credit quality requirements, will not cause marketable assets to become ineligible as collateral in Eurosystem operations. This measure reduces potential procyclical dynamics in credit markets and ensures the continued availability of collateral.
Finally, prudential authorities across the euro area have relaxed capital require-ments and have granted banks more operational flexibility to maintain the flow of credit to the economy.3 Moreover, fiscal policy provided loan guarantees and debt moratoria.
The Eurosystem’s policy response to the COVID-19 shock must be regarded as an encompassing package whose individual measures reinforce each other in their aim of combating the financial fallout of the COVID-19 pandemic, thereby sup-porting the economy and bringing inflation back to target. As a corollary, the monetary policy measures should be discussed and calibrated jointly (see Altavilla et al., 2020a; Rostagno et al., 2019). Recent impact assessments of individual policy measures, however, have proven helpful in evaluating the aggregate effects of unconventional monetary policy measures on economic growth and inflation developments over the last decade (see e.g. Altavilla et al., 2019; Boeckx et al., 2020; Eser et al., 2019; Heider et al., 2019).
Building on the empirical literature that has analyzed the effect of central bank lending on banks’ credit supply before the COVID-19 pandemic (e.g. Afonso and Sousa-Leite, 2020; Andreeva and Garcia-Posada, 2020; Bats and Hudepohl, 2019; Esposito et al., 2020; Laine, 2019)4, we focus on one important part of the above-mentioned monetary policy responses to the COVID-19 crisis: the Eurosys-tem’s TLTROs. We provide a pilot study analyzing the effects of TLTROs on Austrian banks’ loan supply since the outbreak of the COVID-19 pandemic. Our empirical strategy is based on bank-level (micro)data, which we use to identify the causal effect of TLTROs on banks’ credit supply. We face two endogeneity con-cerns in this endeavor, namely the self-selection of banks into TLTROs and the
3 For a detailed description of all macroprudential and supervisory measures in response to the COVID-19 pandemic in the euro area, see Altavilla et al. (2020a).
4 Alves et al. (2016), Andrade et al. (2019), Carpinelli and Crosignani (2017) as well as Garcia-Posada and Marchetti (2015) provide empirical evidence on the effect of LTROs – the untargeted predecessors of TLTROs – on credit supply in the euro area.

The effects of the monetary policy response to the COVID-19 pandemic: preliminary evidence from a pilot study using Austrian bank-level data
134 OESTERREICHISCHE NATIONALBANK
difficulty of distinguishing credit supply from credit demand responses. First, as TLTROs do not represent a randomly assigned treatment, banks with certain char-acteristics (e.g. banks that plan to provide credit to the real economy anyway) may be more likely to participate than others. If left unaddressed, this selection of banks into TLTROs would be likely to result in biased estimators. Following Afonso and Sousa-Leite (2020), Andreeva and Garcia-Posada (2020), Benetton and Fantino (2018) as well as Esposito et al. (2020), we draw on an instrumental vari-able strategy to deal with these concerns. Second, it is notoriously difficult to dis-tinguish between credit demand and credit supply forces at the bank level (see e.g. Andrade et al., 2019; Carpinelli and Crosignani, 2017; Khwaja and Mian, 2008; Schnabl, 2012) as we only observe equilibrium outcomes in credit markets. The COVID-19 shock that triggered the provision of TLTROs III also affected credit demand (e.g. by increasing demand for loans by affected customers). To estimate unbiased credit supply elasticities to TLTRO uptake, we thus must credibly disen-tangle credit demand from credit supply forces. For this purpose, we control for a bank-specific covariate that takes into account the composition of each bank’s cus-tomer base just before the outbreak of the COVID-19 pandemic and combines this information with data on how hard each sector in the customer base was hit by the COVID-19 shock. Together, these two strategies should help us identify the plau-sibly causal effects of TLTRO uptake on Austrian banks’ supply of new loans.
In this pilot study, we find evidence for an unambiguously positive effect of TLTRO uptake on loan supply for the period from July to September 2020. The credit supply elasticities estimated for Austrian banks range from 0.26 to 1.00, depending on the respective econometric specification and on whether we allow for anticipation effects in credit supply, whether we restrict our attention to eligible loans only or whether we look at all categories of new loans supplied. Hence, while the positive sign of the estimated elasticity seems robust, we fully acknowledge that the wide range of estimates points to considerable uncertainty about the magnitude of this positive effect. Moreover, we would like to caution against over-interpreting the size of the estimated elasticities for two reasons. First, while some studies find elasticities significantly higher than 0.26, the specific economic background of our study (i.e. a pandemic crisis, and our restricted sample) may not be directly comparable to the contexts of previous work. Second, it is difficult to gauge how bank credit would have evolved without TLTRO support.
We contribute to the literature in two ways. First, our study extends previous efforts to evaluate the impact of unconventional monetary policies in response to the COVID-19 crisis. It provides a first, almost real-time analysis of the Euro system’s monetary policy response to the pandemic. Although our estimates are prelimi-nary and subject to many caveats, we still hope that our study will prove useful for the further calibration and fine-tuning of current measures as the Eurosystem con-tinues to fight the economic fallout of the COVID-19 crisis. Second, building on the work of Puhr and Schneider (2020), we create a COVID-19 shock indicator for Austrian banks’ credit demand that carefully traces how hard each individual cus-tomer base was hit by the pandemic and the related containment measures.
The remainder of this study is structured as follows. Section 1 explores the specific modalities of TLTROs and studies how they were adapted to meet the extraordinary pressures of the current crisis. We also report the main aggregate facts documenting the uptake of TLTROs by the Austrian banking sector. Section 2

The effects of the monetary policy response to the COVID-19 pandemic: preliminary evidence from a pilot study using Austrian bank-level data
MONETARY POLICY & THE ECONOMY Q4/20 – Q1/21 135
provides a discussion of the empirical challenges faced when estimating the credit supply response to banks’ TLTRO borrowing. In section 3, we explain our empirical strategy and sources in more detail. In section 4, we present our estimation results for the impact of TLTRO uptake on bank-level credit. Finally, section 5 concludes.
1 Targeted longer-term refinancing operations (TLTROs)Banking sector credit intermediation is central for investment in the euro area in general and in Austria in particular, especially for SMEs and households with no other sources of finance. To stimulate the supply of loans and thus to provide the real economy, and consequently inflation, with a positive impetus, the Eurosystem launched TLTROs already back in September 2014. In contrast to other refinanc-ing operations, this funding-for-lending scheme contains incentives for banks to grant loans to the private sector.
In September 2019, the Eurosystem launched the third generation of TLTROs (TLTRO III). This program consists of ten operations (TLTRO III.1 to TLTRO III.10) conducted at a quarterly frequency between September 2019 and December 2021. Each operation comes with a maturity of three years. Although TLTRO III already existed before the COVID-19 crisis, its conditions were adjusted in the light of the new challenges. Consequently, the first two operations before the COVID-19 shock (TLTRO III.1 in September 2019 and TLTRO III.2 in December 2019) were offered on different terms than the subsequent five operations.5,6
TLTROs are targeted operations, because the amount that banks can borrow is linked to the size of their existing portfolio of loan to the private sector. Banks heavily engaged in private sector lending can thus borrow a relatively higher amount (compared to the size of their balance sheet). Since TLTRO III.3 of March 2020, banks have been able to borrow up to 50% of the outstanding amount of their loans to nonfinancial corporations and households as of February 28, 2019 (including loans to nonprofit institutions serving households and excluding loans to households for house purchase).7 This so-called borrowing allowance is reduced accordingly if a bank has already borrowed under TLTRO II and TLTRO III beforehand. Put differently, participating banks’ TLTRO borrowing cannot exceed 50% of their eligible loan portfolio at any moment during the lifespan of the oper-ations in question. In addition, TLTRO loans are collateralized, like any other central bank loan. Hence, the maximum amount a participant can borrow is not just restricted by the remainder of the borrowing allowance, but also by the eligible collateral available to the respective bank.
Designed as a funding-for-lending scheme, TLTROs are not only targeted (as explained above), but also have a built-in incentive for banks to provide loans to the private sector. Under TLTRO III, the interest rate charged by the Eurosystem is
5 In December 2020, the Eurosystem once again recalibrated the setup of the TLTROs III. In this study, however, we focus on the immediate reaction of bank lending to the decisions of spring 2020 and therefore describe the conditions that applied to TLTRO III at that point in time.
6 In addition to changing TLTRO III conditions due to the COVID-19 pandemic, in March 2020 the Eurosystem introduced longer-term refinancing operations (LTROs) to provide immediate liquidity support to the financial system also for the period between TLTROs. The LTROs provided liquidity at the deposit facility rate to bridge the period until the TLTRO III.4 in June 2020.
7 The Eurosystem excludes loans for house purchase from the amount of outstanding loans to avoid contributing to an overheating of real estate markets and to forestall potential house price bubbles.

The effects of the monetary policy response to the COVID-19 pandemic: preliminary evidence from a pilot study using Austrian bank-level data
136 OESTERREICHISCHE NATIONALBANK
linked to each participating bank’s lending performance. If a bank provides more loans to nonfinancial corporations and households (except loans to households for house purchase) than a predefined benchmark amount, the interest rate on its TLTRO III borrowings becomes more attractive. If a bank’s eligible loan portfolio beats the benchmark by at least 1.15% on March 31, 20218, it will achieve the max-imum discount on the interest rate and will be “charged” the average interest rate on the deposit facility (DF rate) over the lifespan of the respective TLTRO III (cur-rently –0.5%). In other words, given the current conditions, a bank that effectively obtains the maximum discount receives (rather than being charged) an interest rate of 0.5% for borrowing central bank money. If the eligible loan portfolio of the respective bank is lower than the benchmark, the applied interest rate will be the average interest rate in the main refinancing operation (MRO rate) over the lifes-pan of the respective TLTRO III (currently 0%). Finally, if a participant’s loan book beats the benchmark by less than 1.15%, the interest rate to be applied will be graduated linearly between the average MRO rate and the average DF rate, depend-ing on the percentage by which the participant exceeds the benchmark amount.
To take into account the particularly difficult circumstances prevailing during the COVID-19 crisis, a so-called special interest rate period was introduced for the time between June 24, 2020, and June 23, 2021. In this one-year period, the interest rate can be as low as the DF rate minus 50 basis points (currently –1%) if the partic-ipating bank keeps its eligible loan portfolio at a constant level between March 1, 2020, and March 31, 2021. If this condition is met, the maximum discount on the interest rate will also be applied for the rest of the lifespan of the respective TLTRO (currently –0.5%). Even for banks which are not able to meet this condition during the special reference period, the interest rate in the special interest rate period will still be lowered to the average MRO rate minus 50 basis points (see figure 1). Finally, while the initial maturity of three years was maintained even after the COVID-19 shock, an early repayment option was introduced. Any amount borrowed under TLTROs III can be repaid 12 months after the settlement of each operation, starting in September 2021.
8 The second reference period runs from April 1, 2019, to March 31, 2021.
Range of interest rates applied to all TLTROs III
Figure 1
Source: OeNB.
Sep. 2019 to June 2020
Interst rate for banks not meeting any lending condition
June 2020 to June 2021Special interest rate period
June 2021 to Sep. 2023
0.0
–0.5
–1.0
Interest rate for banks meeting the lending conditions
The effects of the monetary policy response to the COVID-19 pandemic: preliminary evidence from a pilot study using Austrian bank-level data
MONETARY POLICY & THE ECONOMY Q4/20 – Q1/21 137
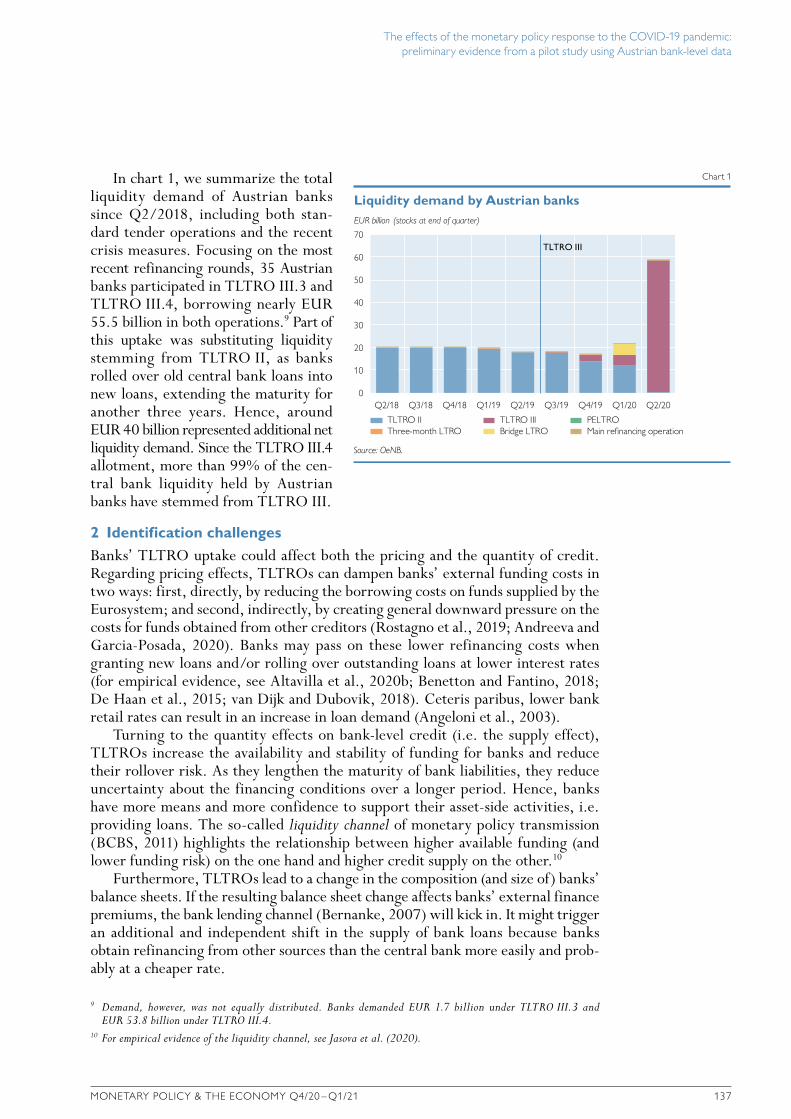
In chart 1, we summarize the total liquidity demand of Austrian banks since Q2/2018, including both stan-dard tender operations and the recent crisis measures. Focusing on the most recent refinancing rounds, 35 Austrian banks participated in TLTRO III.3 and TLTRO III.4, borrowing nearly EUR 55.5 billion in both operations.9 Part of this uptake was substituting liquidity stemming from TLTRO II, as banks rolled over old central bank loans into new loans, extending the maturity for another three years. Hence, around EUR 40 billion represented additional net liquidity demand. Since the TLTRO III.4 allotment, more than 99% of the cen-tral bank liquidity held by Austrian banks have stemmed from TLTRO III.
2 Identification challengesBanks’ TLTRO uptake could affect both the pricing and the quantity of credit. Regarding pricing effects, TLTROs can dampen banks’ external funding costs in two ways: first, directly, by reducing the borrowing costs on funds supplied by the Eurosystem; and second, indirectly, by creating general downward pressure on the costs for funds obtained from other creditors (Rostagno et al., 2019; Andreeva and Garcia-Posada, 2020). Banks may pass on these lower refinancing costs when granting new loans and/or rolling over outstanding loans at lower interest rates (for empirical evidence, see Altavilla et al., 2020b; Benetton and Fantino, 2018; De Haan et al., 2015; van Dijk and Dubovik, 2018). Ceteris paribus, lower bank retail rates can result in an increase in loan demand (Angeloni et al., 2003).
Turning to the quantity effects on bank-level credit (i.e. the supply effect), TLTROs increase the availability and stability of funding for banks and reduce their rollover risk. As they lengthen the maturity of bank liabilities, they reduce uncertainty about the financing conditions over a longer period. Hence, banks have more means and more confidence to support their asset-side activities, i.e. providing loans. The so-called liquidity channel of monetary policy transmission (BCBS, 2011) highlights the relationship between higher available funding (and lower funding risk) on the one hand and higher credit supply on the other.10
Furthermore, TLTROs lead to a change in the composition (and size of) banks’ balance sheets. If the resulting balance sheet change affects banks’ external finance premiums, the bank lending channel (Bernanke, 2007) will kick in. It might trigger an additional and independent shift in the supply of bank loans because banks obtain refinancing from other sources than the central bank more easily and prob-ably at a cheaper rate.
9 Demand, however, was not equally distributed. Banks demanded EUR 1.7 billion under TLTRO III.3 and EUR 53.8 billion under TLTRO III.4.
10 For empirical evidence of the liquidity channel, see Jasova et al. (2020).
EUR billion (stocks at end of quarter)
70
60
50
40
30
20
10
0
Liquidity demand by Austrian banks
Chart 1
Source: OeNB.
TLTRO II TLTRO III PELTROThree-month LTRO Bridge LTRO Main refinancing operation
Q2/18 Q3/18 Q4/18 Q1/19 Q2/19 Q3/19 Q4/19 Q1/20 Q2/20
TLTRO III

The effects of the monetary policy response to the COVID-19 pandemic: preliminary evidence from a pilot study using Austrian bank-level data
138 OESTERREICHISCHE NATIONALBANK
An additional channel might work through the combination of TLTROs and the significantly eased collateral requirements. The mix may change banks’ risk tolerance and hence the degree of risk they are willing to accept in their portfolios.11 Consequently, the risk-taking channel (Borio and Zhu, 2007) could also be a lever through which TLTROs might affect banks’ credit supply.
Finally, the favorable interest rates at which TLTROs III are offered reduce banks’ refinancing costs and strengthen bank equity. Therefore, TLTRO uptake may contribute to an increase in the amount of new loans via the capital channel of bank lending (Stein, 1998; van den Heuvel, 2002). The “tiering” system of reserves – which provides banks with the opportunity to deposit a certain amount of their central bank reserves with the Eurosystem at a 0% interest rate – reinforces this channel. The fact that banks can take up sums in TLTROs that are large relative to their outstanding loan portfolios suggests that the credit supply effects of TLTRO participation (taking all above-mentioned channels together) might be sizable.12
In this study, we focus on the quantity impact of TLTRO uptakes: We propose an evaluation of the bank-level elasticity of new loans (measured in EUR) in reac-tion to TLTRO uptake. For this purpose, we concentrate on the TLTRO III.4 uptake (on June 24, 2020) by Austrian banks. In our baseline model, we estimate the elasticity of the TLTRO III.4 uptake with regard to the supply of new loans aggregated at the bank level in the three months following the tender (July, August and September 2020).
In evaluating the credit supply effect of the TLTRO III.4 uptake for Austrian banks, our study faces a series of empirical challenges which complicate the iden-tification of reliable causal effects. First, given our focus on Austria, rather than the euro area, our estimation is based on a small sample of banks. Thus, the advan-tage of having access to precise monthly bank-level data on new loans and the exact TLTRO uptake for Austrian banks comes at the price of sample size. At the time of writing, only 55 Austrian banks were eligible to participate in Eurosystem tender operations. 14 out of these 55 banks drop from our estimation sample because they do not report to the OeNB’s internal monthly monetary statistics on new loans. Hence, we obtain an effective estimation sample containing 41 banks.13
Our study only sheds light on the direct effects of TLTRO III.4 participation on the supply of new loans. Part of the total effect of TLTROs on the supply of new loans, however, may materialize due to the tenders’ dampening impact on aggregate market interest rates. Hence, banks which did not directly participate in TLTROs could have equally benefited from lower refinancing costs in the open market following TLTROs. As a corollary, nonparticipating banks may have also increased their credit supply to the real economy in reaction to TLTROs (see Andreeva and Garcia-Posada, 2020). Overall, our analysis may therefore underestimate the total credit supply impact of TLTROs.
Second, endogeneity concerns loom large when it comes to estimating the credit supply response to monetary policy measures, particularly so in the case of
11 The empirical results of Andrade et al. (2019) suggest that “[…] firms belonging to the newly eligible credit category indeed benefited from a stronger transmission of the LTRO liquidity […]”.
12 For empirical evidence on the quantity effect of TLTROs before the COVID-19 pandemic, see Afonso and Sousa-Leite (2020), Andreeva and Garcia-Posada (2020), Bats and Hudepohl (2019) and Laine (2019).
13 Only nine banks out of the remaining group of 41 banks did not participate in the TLTRO III.4. Six out of these nine banks have never participated in any TLTRO.
The effects of the monetary policy response to the COVID-19 pandemic: preliminary evidence from a pilot study using Austrian bank-level data
MONETARY POLICY & THE ECONOMY Q4/20 – Q1/21 139
TLTROs. As described in detail in Andrade et al. (2019), two main worries stand out in this regard. On the one hand, banks choose to ask for liquidity in TLTROs. Even conditional on participation the amount, an individual bank borrowed from the Eurosystem in TLTRO III.4 clearly cannot be viewed as an exogenous contin-uous treatment variable: The uptake is likely a function of several observable and unobservable bank-level characteristics. On the other hand, it is notoriously diffi-cult to distinguish credit demand from credit supply forces at the bank level (see e.g. Andrade et al., 2019; Carpinelli and Crosignani, 2017; Khwaja and Mian, 2008; Schnabl, 2012). Credit demand at the bank level can have different impacts on the amount of new loans individual institutions grant to their customers. Hence, chances are high that TLTRO uptake is endogenous to (expected) credit demand. Overall, endogeneity concerns would likely bias the treatment effect into an, a priori, unclear direction. For example, if credit demand and TLTRO uptake are positively correlated at the bank level, we might spuriously attribute some of the demand effects to our treatment variable and overestimate the impact of tender participa-tion. In contrast, some banks may simply have an incentive to borrow more in terms of TLTROs to replace relatively more expensive funding sources by cheaper ones. This might hold true especially for banks with a large amount of retail deposit funding if these institutions cannot fully pass on negative interest rates to their customers (see e.g. Heider et al., 2020). Since banks that experience lower profit-ability due to the squeeze in their interest rate margins might grant fewer new loans, simple OLS estimates may be biased downward. Including controls related to banks’ capital position can alleviate but may not fully capture this downward bias.
Governmental loan guarantees and moratoria, which were put in place in reac-tion to the economic fallout of the COVID-19 pandemic in spring 2020, represent an additional endogeneity concern. Loan guarantees and/or moratoria may be cor-related with both TLTRO uptake and the supply of new loans at the bank level. In this case, leaving these two covariates out of our estimation equation might trigger omitted variable bias. For example, without an adequate empirical strategy to address this concern, we might spuriously attribute part of the positive effect of loan guar-antees to TLTRO uptake.
Third, on top of selection bias and the difficulty of purging the loan supply response from developments in credit demand, three additional challenges pose a threat to causal effect identification. All three concerns fit under the umbrella of “measure-ment error” in the outcome variable of interest and are likely to trigger a down-ward bias in the estimated treatment effect, resulting in an overly and incorrectly low credit supply elasticity of TLTRO uptake at the bank level. For one, banks might have anticipated their uptake in the June 2020 TLTRO round as the favor-able conditions governing TLTRO III.4 had been known several weeks in advance.14 As a corollary, the amount of new loans granted by Austrian banks in the three months following TLTRO III.4 uptake may only imperfectly capture the actual loan supply that might be tied to TLTRO III.4 borrowing if the size of anticipation effects were fully known.
For another, significant distortions in the elasticity of bank-level credit supply to TLTRO uptakes may derive from delaying effects, i.e. the reverse phenomenon of anticipatory movements in the supply of new loans. For example, the findings of
14 Depending on the specific innovations in question, the relevant reference date is either March 12, 2020 or April 30, 2020.

The effects of the monetary policy response to the COVID-19 pandemic: preliminary evidence from a pilot study using Austrian bank-level data
140 OESTERREICHISCHE NATIONALBANK
Gibson et al. (2020) suggest that central bank funding affects bank lending not only shortly after a TLTRO uptake, but over a longer horizon. Hence, banks which participated in TLTRO III.4 may not have (fully) tapped into their additional, TLTRO-induced funding because they plan or expect to grant new loans only later in the year (in our case, after September 2020). Unfortunately, time alone does not solve this measurement problem. Since the June 2020 round, additional TLTRO III tenders took place in September and December 2020 and will continue to take place until 2021. Therefore, over time, it becomes more difficult to disentangle the effects of any single TLTRO round on the supply of new loans.
Finally, some Austrian banks participate in the TLTRO as group bidders. Group bidders constitute financial institutions that bid in Eurosystem tenders on behalf of several other institutions (plus themselves). Group bidders subsequently allocate their TLTRO uptake among the group members, according to the members’ needs (this allocation is likely, but not necessarily, determined prior to the actual uptake). While we are able to identify group bidders, we cannot allocate their uptake to the individual financial institutions within the group that are the actual end users of the funds. Thus, we might considerably underestimate the credit supply elasticity of TLTRO uptake because we match group bidders’ uptake only to the new loans granted by the group’s single bidding institution.15
It is important to note that these three measurement challenges do not per se represent substantive explanations for a loan supply elasticity smaller than one. Rather, the assumption is that, if these three effects were not present, we would be in a position to more accurately estimate the treatment effect of TLTRO uptake (ceteris paribus), whatever its true size. A substantive explanation, in contrast, would provide plausible reasons for an estimated elasticity persistently smaller than one even after the three measurement challenges discussed above are fully taken into account. We will come back to this point in more detail in section 4, where we discuss our preliminary estimation results.
3 Empirical strategy and dataWe pursue a three-pronged empirical strategy to address the challenges outlined in the previous section. First, at the heart of our identification strategy lies an instrumental variable (IV) approach as pioneered by Benetton and Fantino (2018) and applied by Afonso and Sousa-Leite (2020), Andreeva and Garcia-Posada (2020) as well as in Esposito et al. (2020). It is designed to address the potential bias in our treatment effect deriving from the endogeneity of TLTRO uptakes at the bank level. Second, we also control for a series of bank-level balance sheet and financial covariates that could be relevant predictors of banks’ TLTRO uptake. Third, on the basis of sector-level loan portfolio decompositions and sector-specific
15 To address this potential mismatch, one could aggregate the groups’ supply of new loans and substitute this amount for the sum granted by the single bidding institution. Extending this strategy to all control variables would boil down to creating a “synthetic” bank reflecting the entire bidding group. For this approach to work, however, the allocation of the borrowing uptake among the group members would have to be known – in particular, we would have to know which group members, if any, did not receive or claim a part of the uptake. Otherwise, the synthetic bank’s total supply of new loans may be incorrectly computed: If a specific bank from a bidding group did not receive or claim any of the TLTRO funds, its credit supply should not form part of the synthetic bank’s sum of new loans. Without this information, the synthetization strategy would not mitigate, but most likely reverse the direction of the bias in our treatment coefficient.

The effects of the monetary policy response to the COVID-19 pandemic: preliminary evidence from a pilot study using Austrian bank-level data
MONETARY POLICY & THE ECONOMY Q4/20 – Q1/21 141
COVID-19 shocks, we create a bank-level control variable for credit demand reflecting each individual bank’s business model and/or client base.
To address endogeneity concerns, we instrument TLTRO III.4 uptake at the bank level with the remainder of a given bank’s TLTRO borrowing allowance as measured just before TLTRO III.4 uptake.16 The rationale behind this instrumental variable strategy is as follows. First, the borrowing allowance itself is arguably exogenous with regard to the bank-level supply of credit since June 2020 because it is computed as a deterministic function of banks’ eligible lending portfolio at the end of February 2019. Second, the extent to which banks made use of their bor-rowing allowance prior to the outbreak of the COVID-19 crisis is orthogonal to the shock that arrived in February 2020. Third, while available data show that the remainder of the bank-specific borrowing allowance is not a good predictor of banks’ TLTRO uptake for any of the previous bidding rounds, IV relevance should be high for TLTRO III.4. The borrowing allowance (BA) should have become rel-atively more binding in peak crisis times: The demand for central bank refinancing probably increased over the months following the lockdowns and the borrowing conditions for TLTRO III.4 were even more favorable than those for previous rounds. To illustrate these points, in charts 2 and 3 we compare the correlation between bank-level TLTRO uptake and the bank-specific BA for TLTRO III.4 to the correlation observed between the very same covariates for TLTRO III.3. Whereas we find no evidence of a link between the BA and TLTRO uptake for the earlier round, the correlation is strong and positive for the June 2020 operation. Furthermore, the positive correlation shown in chart 3 is robust to excluding the potentially influential observation in the right upper corner of the chart (see “linear fit excluding potentially influential observation”). This finding thus bodes well for IV relevance and the strength of our first stage.
Our main identification assumption is that the following exclusion restriction holds: Conditional on our control variables, the remainder of the BA just before
16 For a definition of banks’ TLTRO borrowing allowance, and changes to its modalities over time, see section 1.
TLTRO III.3 uptake (EUR million)
Borrowing allowance before TLTRO III.3 (EUR million)
16000
14000
12000
10000
8000
6000
4000
2000
0
First-stage relevance: bank-level TLTRO borrowing allowance and uptake (TLTRO III.3)
Chart 2
Scatter plot Linear fit
0 2000 4000 6000 8000 10000 12000 14000 16000
Source: OeNB, authors' calculations.

The effects of the monetary policy response to the COVID-19 pandemic: preliminary evidence from a pilot study using Austrian bank-level data
142 OESTERREICHISCHE NATIONALBANK
TLTRO III.4 should have only affected the supply of new loans via the actual bank-specific TLTRO uptake of June 2020. To ascertain conditional IV independence, we control for the following balance sheet and financial variables at the bank level: banks’ total assets and tier 1 capital ratio, a bank-specific credit demand proxy (see next paragraph), a group bidder dummy indicating whether a bank in the sample bids on behalf of a group of financial institutions, and a dummy for collateral scarcity, flagging bidding banks which were close to exhausting their collateral deposited with the Oesterreichische Nationalbank (OeNB).17 In light of recent contributions (Sugo and Vergote, 2020), we would ideally like to control for more detailed infor-mation on collateral holdings at the bank level, but for now data availability and confidentiality issues limit our set of variables.
We generally plan to extend our set of control variables as we move our analysis beyond the pilot study stage. At this point, however, our small sample size would seem to call for a parsimonious specification anyway. We acknowledge all the potential caveats attached to this parsimonious set of control variables, particularly in terms of omitted variable bias.18
We complement these balance sheet and financial variables with a bank-specific continuous variable that reflects the degree of exposure of a given bank’s clients to the COVID-19 shock. We use this variable to proxy for potential credit demand facing the bank since the shock hit. Our bank-specific credit demand variable is computed as follows. We first decompose every bank’s portfolio of loans to non-financial corporations and households (including nonprofit institutions serving households) according to the clients’ economic sectors at the NACE 2 level. We
17 Banks can raise the amount of deposited collateral at any time. Hence, as long as a bank has eligible collateral for Eurosystem operations, the prepledged amount does not constitute a true borrowing constraint. Still, banks might regard the amount of prepledged collateral as fixed over the short term, in which case they might act as if reaching a borrowing threshold when having exhausted their prepledged collateral deposits.
18 In particular, we would like to point out that banks specialized in lending can be expected to both have a larger BA and lend more in July, August and September 2020. Although we control for bank size and customer base-related demand effects, residual omitted variable bias still remains a potential concern. We thank Olivier Vergote for flagging this aspect.
TLTRO III.4 uptake (EUR million)
Borrowing allowance before TLTRO III.4 (EUR million)
16000
14000
12000
10000
8000
6000
4000
2000
0
First-stage relevance: bank-level TLTRO borrowing allowance and uptake (TLTRO III.4)
Chart 3
Scatter plot Linear fit Linear fit (excluding potentially influential observation)
0 2000 4000 6000 8000 10000 12000 14000 16000
Source: OeNB, authors' calculations.

The effects of the monetary policy response to the COVID-19 pandemic: preliminary evidence from a pilot study using Austrian bank-level data
MONETARY POLICY & THE ECONOMY Q4/20 – Q1/21 143
chose the December 31, 2019 call date for the loan portfolio decomposition to take a snapshot of banks’ usual client base prior to the COVID-19 shock. We then match the aggregated loan amounts at the NACE 2 level to the mean, median, maximum and minimum monthly deviation (between March and June 2020) of the value added from pre-crisis trends (deviations in %) of each NACE 2 sector (see below for our data sources). Based on NACE 2-level data on the loans extended by each bank and the corresponding NACE 2 shocks (i.e. deviations), we proceed to compute a weighted bank-specific demand shock (DSi ) for each bank i:
where n runs from 1 to q and gives the number of sectors we take into account. An important caveat concerning this variable is that our loan data do not assign NACE codes to loans granted to non-self-employed households. The share of loans falling into this category varies substantially from bank to bank in our sample (be-tween 1% and 95%).
As we do not have any information on the employment background (in partic-ular, on the respective sector of employment) of the borrowing non-self-employed households, the implicit assumption we make is that their sectoral distribution at the bank level is, on average, identical to the distribution of loans for which we have the corresponding NACE 2 classification. Depending on how accurate this assumption is, we might substantially over- or underestimate the bank-specific credit demand shock triggered by the COVID-19 crisis.19 We report the summary statistics for all our left-hand and right-hand side variables in table 1.
19 Because of confidentiality restrictions, we cannot share the size of the individual bank-level demand shocks.
Page 17 of 30
specification anyway. We acknowledge all the potential caveats attached to this parsimonious set
of control variables, particularly in terms of omitted variable bias.18
We complement these balance sheet and financial variables with a bank-specific continuous
variable that reflects the degree of exposure of a given bank’s clients to the COVID-19 shock. We
use this variable to proxy for potential credit demand facing the bank since the shock hit. Our
bank-specific credit demand variable is computed as follows. We first decompose every bank’s
portfolio of loans to nonfinancial corporations and households (including nonprofit institutions
serving households) according to the clients’ economic sectors at the NACE 2 level. We chose the
December 31, 2019 call date for the loan portfolio decomposition to take a snapshot of banks’
usual client base prior to the COVID-19 shock. We then match the aggregated loan amounts at
the NACE 2 level to the mean, median, maximum and minimum monthly deviation (between
March and June 2020) of the value added from pre-crisis trends (deviations in %) of each NACE 2
sector (see below for our data sources). Based on NACE 2-level data on the loans extended by
each bank and the corresponding NACE 2 shocks (i.e. deviations), we proceed to compute a
weighted bank-specific demand shock (𝐷𝐷𝐷𝐷𝑖𝑖) for each bank 𝑖𝑖:
𝐷𝐷𝐷𝐷𝑖𝑖 = ∑ 𝑁𝑁𝑁𝑁𝑁𝑁𝑁𝑁2 𝑠𝑠ℎ𝑜𝑜𝑜𝑜𝑜𝑜𝑛𝑛 × 𝑁𝑁𝑁𝑁𝑁𝑁𝑁𝑁2 𝑙𝑙𝑜𝑜𝑙𝑙𝑙𝑙 𝑙𝑙𝑎𝑎𝑜𝑜𝑎𝑎𝑙𝑙𝑎𝑎𝑛𝑛,𝑖𝑖𝑎𝑎𝑜𝑜𝑎𝑎𝑙𝑙𝑙𝑙 𝑙𝑙𝑜𝑜𝑙𝑙𝑙𝑙𝑠𝑠 𝑎𝑎𝑜𝑜 𝑁𝑁𝑁𝑁𝑁𝑁 𝑙𝑙𝑙𝑙𝑎𝑎 𝐻𝐻𝐻𝐻𝑖𝑖
𝑞𝑞
𝑛𝑛=1
where n runs from 1 to q and gives the number of sectors we take into account. An important
caveat concerning this variable is that our loan data do not assign NACE codes to loans granted to
non-self-employed households. The share of loans falling into this category varies substantially
from bank to bank in our sample (between 1% and 95%).
As we do not have any information on the employment background (in particular, on the
respective sector of employment) of the borrowing non-self-employed households, the implicit
assumption we make is that their sectoral distribution at the bank level is, on average, identical to
the distribution of loans for which we have the corresponding NACE 2 classification. Depending
on how accurate this assumption is, we might substantially over- or underestimate the bank-
18 In particular, we would like to point out that banks specialized in lending can be expected to both have a larger BA and lend more in July and August 2020. Although we control for bank size and customer base-related demand effects, residual omitted variable bias still remains a potential concern. We thank Olivier Vergote for flagging this aspect.
Table 1
Summary Statistics
Variable name Number of observations
Mean Median Standard deviation
Minimum Maximum
New ENL, July to September 2020 (EUR million) 41 309.993 150.162 461.647 0 2444.809New total loans, July to September 2020 (EUR million) 41 397.279 207.93 582.459 0 3014.533New ENL, March to September 2020 (EUR million) 41 876.732 370.347 1586.084 0.039 9250.786TLTRO III.4 uptake (EUR million) 41 1309.584 330 2635.708 0 15400TLTRO III.3 uptake (EUR million) 41 41.951 0 150.607 0 900Borrowing allowance pre-TLTRO III.4 (EUR million, conservative) 35 2816.63 1565.05 3327.25 52.15 15415.26Borrowing allowance pre-TLTRO III.4 (EUR million, complemented) 41 2435.695 1107.9 3207.044 47.702 15415.26Total assets (EUR million) 41 14980.139 7026.864 21959.722 457.78 98021.933Group bidder dummy 41 0.22 0 0.419 0 1Collateral scarcity dummy 41 0.195 0 0.401 0 1Tier 1 capital ratio (unweighted, percentage points) 41 0.088 0.077 0.054 0.04 0.371Mean demand shock (%) 41 –14.872 –13.252 5.617 –34.326 –7.695Median demand shock (%) 41 –13.795 –12.246 5.497 –33.261 –6.604Maximum demand shock (%) 41 –21.774 –20.084 7.487 –45.329 –11.918Minimum demand shock (%) 41 –10.123 –9.022 4.096 –25.454 –4.749
Source: Authors’ calculations.
Note: ENL means “eligible net lending,” i.e. banks’ loans to nonfinancial corporations, to nonprofit institutions serving households and to households (excluding loans for house purchase). The conservative sample for the borrowing allowance includes all banks that participated in at least one TLTRO. These banks self-reported the data relevant for the computation of the borrowing allowance in the corresponding TLTRO reporting template. The complemented sample for the borrowing allowance includes the conservative sample plus an additional six banks which, albeit eligible, never participated in TLTROs and whose hypothetical borrowing allowance was reconstructed using OeNB proprietary data.

The effects of the monetary policy response to the COVID-19 pandemic: preliminary evidence from a pilot study using Austrian bank-level data
144 OESTERREICHISCHE NATIONALBANK
To compile and compute the variables required for our estimations, we draw on several data sources. Our TLTRO-specific control variables are based on OeNB proprietary data. We obtain balance sheet data, ratios and detailed data on banks’ loan portfolios (including the monthly supply of new loans) from the OeNB’s internal monthly monetary statistics. Finally, the NACE 2 sector-level COVID-19 shock we use to construct our credit demand proxy is based on another contribu-tion in this issue of Monetary Policy & the Economy (Puhr and Schneider, 2020).
For the first stage of our two-stage least squares (2SLS) instrumental variable strategy, we estimate the following model:
Model 1:
where Ti represents the bank-level uptake from TLTRO III.4; τ is a constant; IVi stands for the instrumental variable, i.e. the remainder of the BA prior to TLTRO III.4; Ei is a vector of control variables containing all the covariates mentioned above; and ei is a standard error term. For the second stage, we use the predicted value of Ti, T ̂ i, derived from model 1 as our main independent variable of interest:
Model 2:
where Yi represents our main outcome of interest, the total bank-level supply of new loans to nonfinancial corporations and households (including nonprofit institutions serving households but excluding loans for house purchase) in July, August and September 2020; T ̂ i is the instrumented bank-level uptake from TLTRO III.4; Ei remains as defined in model 1; and ui is again a standard error term.
Apart from our main outcome variable (i.e. new loans to nonfinancial corpora-tions and households including non-profit institutions serving households but excluding loans for house purchase in July, August and September 2020), we also run our 2SLS regressions with two alternative outcome variables for the supply of new loans at the bank level. First, we re-estimate model 2 for the total sum of new loans to nonfinancial corporations and households in July, August and September 2020. We draw on this wider definition of the supply of new loans to obtain some initial evidence regarding the questions of whether banks use TLTRO funds mainly to expand their eligible net lending or whether they also draw on these funds to grant loans beyond this category.
Second, we also run model 2 by extending backward the time horizon of our main outcome variable of interest. More precisely, we re-estimate model 2 by drawing on the supply of new loans to nonfinancial corporations and households (including non-profit institutions serving households but excluding loans for house purchase) for the entire period between March and September 2020. Naturally, this third specification is econometrically problematic as we use a dependent vari-able that is partly determined by developments prior to our treatment of interest, the bank-level uptake from TLTRO III.4. Our main rationale for still estimating and reporting the results of this specification is that we regard them us an upper
Page 19 of 30
To compile and compute the variables required for our estimations, we draw on several data
sources. Our TLTRO-specific control variables are based on OeNB proprietary data. We obtain
balance sheet data, ratios and detailed data on banks’ loan portfolios (including the monthly supply
of new loans) from the OeNB’s internal monthly monetary statistics. Finally, the NACE 2 sector-
level COVID-19 shock we use to construct our credit demand proxy is based on another
contribution in this issue of Monetary Policy & the Economy (Puhr and Schneider, 2020).
For the first stage of our two-stage least squares (2SLS) instrumental variable strategy, we estimate
the following model:
Model 1: 𝑇𝑇𝑖𝑖 = 𝜏𝜏 + 𝛿𝛿𝐼𝐼𝐼𝐼𝑖𝑖 + Γ𝑬𝑬𝑖𝑖 + 𝑒𝑒𝑖𝑖 where 𝑇𝑇𝑖𝑖 represents the bank-level uptake from TLTRO III.4; 𝜏𝜏 is a constant; 𝐼𝐼𝐼𝐼𝑖𝑖 stands for the
instrumental variable, i.e. the remainder of the BA prior to TLTRO III.4; 𝑬𝑬𝑖𝑖 is a vector of control
variables containing all the covariates mentioned above; and 𝑒𝑒𝑖𝑖 is a standard error term. For the
second stage, we use the predicted value of 𝑇𝑇𝑖𝑖, �̂�𝑇𝑖𝑖, derived from model 1 as our main independent
variable of interest:
Model 2: 𝑌𝑌𝑖𝑖 = 𝜏𝜏 + 𝛽𝛽�̂�𝑇𝑖𝑖 + Π𝑬𝑬𝑖𝑖 + 𝑢𝑢𝑖𝑖 where 𝑌𝑌𝑖𝑖 represents our main outcome of interest, the total bank-level supply of new loans to
nonfinancial corporations and households (including nonprofit institutions serving households but
excluding loans for house purchase) in July, August and September 2020; �̂�𝑇𝑖𝑖 is the instrumented
bank-level uptake from TLTRO III.4; 𝑬𝑬𝑖𝑖 remains as defined in model 1; and 𝑢𝑢𝑖𝑖 is again a standard
error term.
Apart from our main outcome variable (i.e. new loans to nonfinancial corporations and
households including non-profit institutions serving households but excluding loans for house
purchase in July, August and September 2020), we also run our 2SLS regressions with two
alternative outcome variables for the supply of new loans at the bank level. First, we re-estimate
model 2 for the total sum of new loans to nonfinancial corporations and households in July, August
and September 2020. We draw on this wider definition of the supply of new loans to obtain some
initial evidence regarding the questions of whether banks use TLTRO funds mainly to expand
their eligible net lending or whether they also draw on these funds to grant loans beyond this
category.

The effects of the monetary policy response to the COVID-19 pandemic: preliminary evidence from a pilot study using Austrian bank-level data
MONETARY POLICY & THE ECONOMY Q4/20 – Q1/21 145
bound for our treatment effects.20 Whereas the treatment coefficient from the July, August and September 2020 specification likely represents a lower-bound estimate of the true underlying credit supply elasticity, drawing on the total supply of new loans between March and September 2020 provides a proxy for an upper bound taking into account potential anticipation effects. Of course, by assuming that all new loans granted in the months prior to TLTRO III.4 uptake constitute loans given in anticipation of the June 2020 uptake, the March to September 2020 specification probably provides a very crude upper-bound estimate of the treat-ment effect.
4 Preliminary econometric resultsAll coefficients reported in this section reflect the estimation results for our pre-ferred specification, using the median weighted bank-specific demand shock.21 Before discussing our 2SLS results below, we report basic OLS regression results in table 2 to convey a first impression of the association between banks’ TLTRO uptake and the supply of new loans in Austria. The naïve OLS regressions suggest a statistically highly significant positive elasticity of credit supply in response to TLTRO uptake. The estimates range between 0.15 and 0.58, depending on the outcome variable used (see columns 1 to 3 of table 2). Hence, the OLS results associate a EUR 1 rise in uptake with a EUR 0.15 to EUR 0.58 rise in additional new loans. Moreover, table 2 shows that our dummy for collateral scarcity may be linked to a lower supply of new loans (bearing statistical significance in two of the three specifications). A more pronounced bank-level demand shock is also consis-tently negatively associated with the supply of new loans (however, statistically significance is reached in only one of the specifications).22 A bank experiencing a 1% higher (negative) median shock is associated with an approximately EUR 7.8 mil-lion to EUR 18.2 million lower credit supply. Other control variables contained in Ei do not emerge as significant in any of the three specifications in table 2.23
20 Many customers tapped into pre-existing credit lines with their banks during the early months of the COVID-19 pandemic. Hence, TLTRO III.4 uptake could replace and complement funding sources that were used to grant loans during this early period. Furthermore, it should be noted that loans granted during that period also ended up counting toward achieving the benchmark targets (see section 1).
21 Controlling for the mean, maximum or minimum shock variable instead does not qualitatively change our results. These additional regression results are available from the authors on demand.
22 By construction, the weighted bank-specific demand shock is negative for all banks (i.e. the NACE 2-level deviations bear a negative sign).
23 Given our small sample and the relatively large number of partly collinear controls, we would like to caution against overinterpreting the coefficients on Ei in the current version of this study.

The effects of the monetary policy response to the COVID-19 pandemic: preliminary evidence from a pilot study using Austrian bank-level data
146 OESTERREICHISCHE NATIONALBANK
Although the results displayed in table 2 suggest a strong relationship between TLTRO uptake and the supply of new loans in Austria, the estimation results are subject to a long list of caveats explained in section 2. Hence, to be in a position to attach a more causal interpretation to our findings in table 2, we move beyond simple OLS regressions by turning to our instrumental variable strategy. Table 3 shows the results of our first-stage regressions, for which we report two specifications. First, we rely only on a limited sample of 35 banks (“conservative sample”), which includes all those institutions that participated in TLTROs at least once. These banks self-reported the relevant data for BA computation in the Eurosystem’ TLTRO reporting template. Second, we also estimate the first-stage drawing on a “comple-mented sample” including 41 banks (the conservative sample plus an additional six banks which, albeit eligible, never participated in TLTROs). Since the six additional banks never participated in a TLTRO, they did not report BA data via the Eurosys-tem template. Therefore, we reconstructed their hypothetical BA using OeNB pro-prietary data, following the rules of the Eurosystem template as closely as possible.
The first-stage results for the two samples are very similar. We report the cor-responding coefficients in columns 1 and 2 of table 3. The most important insight from table 3 is that our first stage works well, despite the small samples we have at our disposal. The F-statistics for the exclusion of our instrument amount to 12.92 and 15.71, for the conservative and complemented samples respectively. Moreover, given the high R-squared of 0.85 and 0.86, the first-stage regressions appear to capture a large fraction of the variation in banks’ TLTRO III.4 uptake. The coeffi-cients attached to our instrumental variable are 0.55 and 0.54, respectively. This suggests that – conditional on Ei – a EUR 1 rise in the remaining BA is associated with an about EUR 0.55 rise in TLTRO III.4 uptake at the bank level. Since the
Table 2
OLS regression results
(1) (2) (3)
VariableNew ENL (July to September 2020, EUR million)
All new loans (July to September 2020, EUR million)
New ENL (March to September 2020, EUR million)
TLTRO III.4 uptake (EUR million) 0.145*** 0.197*** 0.578***(0.027) (0.034) (0.084)
Total assets (EUR million) 0.003 0.001 0.006(0.003) (0.004) (0.009)
Group bidder dummy 84.438 113.479 –151.821(83.251) (106.510) (258.850)
Collateral scarcity dummy –219.319** –203.625 –865.474**(103.036) (131.823) (320.369)
Tier 1 ratio (unweighted, percentage points) –150.536 –510.392 405.890(649.783) (831.324) (2020.361)
Median demand shock (%) 7.836 13.260* 18.186(6.056) (7.748) (18.829)
Constant 219.648* 368.383** 452.173(109.720) (140.374) (341.151)
Observations 41 41 41R-squared 0.83 0.83 0.86
Source: Authors’ calculations.
Note: ENL means “eligible net lending,” i.e. banks’ loans to nonfinancial corporations, to nonprofit institutions serving households and to households (excluding loans for house purchase). “All new loans” mean banks’ loans to nonfinancial corporations, to nonprofit institutions serving house-holds and to households (including loans for house purchase). Standard errors in parentheses. *** p<0.01, ** p<0.05, * p<0.1.

The effects of the monetary policy response to the COVID-19 pandemic: preliminary evidence from a pilot study using Austrian bank-level data
MONETARY POLICY & THE ECONOMY Q4/20 – Q1/21 147
weighted bank-specific demand shock is negative for all banks (i.e. the NACE 2-level deviations bear a negative sign), a bank experiencing a 1% higher (negative) median shock is associated with an approximately EUR 22 million to EUR 25 million higher uptake in the TLTRO III.4 round. Given a mean uptake of EUR 1,300 million and a mean median shock of about 14%, this coefficient appears to exhibit a plau-sible order of magnitude.
We summarize our second-stage results in table 4. The main take-away from table 4 is that – in line with contributions by Afonso and Sousa-Leite (2020) and Andrade et al. (2019) – the bank-level uptake during the TLTRO III.4 round has a positive, statistically highly significant effect on the supply of new loans. This con-clusion holds for the two first-stage samples and all three outcome variable speci-fications discussed above. The estimated credit supply elasticity, however, varies substantially depending on the specification considered. When drawing on our conservative sample baseline outcome specification (July, August and September 2020, excluding loans for house purchase), we obtain an elasticity of 0.26. In other words, our 2SLS estimation yields a lower-bound treatment effect that associates a EUR 1 rise in uptake with a EUR 0.26 rise in additional new loans (see column 1 of table 4). Our upper-bound estimate for the credit supply elasticity of TLTRO III.4 uptakes based on the backward extension of the time horizon for new loans amounts to 0.99 (see column 5 of table 4) for the conservative first stage sample.24
24 While this point estimate is large, we would like to emphasize again that we consider it an upper bound rather than a realistic estimate of the true underlying treatment effect.
Table 3
First-stage regression results
(1) (2)
Variable TLTRO III.4 uptake (EUR million)
TLTRO III.4 uptake (EUR million)
(conservative sample) (complemented sample)
Borrowing allowance pre-TLTRO III.4 (EUR million) 0.551*** 0.540***(0.153) (0.136)
Total assets (EUR million) 0.030 0.030*(0.020) (0.018)
Group bidder dummy –1377.363** –1381.937**(576.586) (523.560)
Collateral scarcity dummy 1600.632*** 1589.831***(538.647) (489.114)
Tier 1 ratio (unweighted, percentage points) –3037.478 –3218.885(3834.268) (3392.217)
Median demand shock (%) –22.355 –24.631(39.285) (31.861)
Constant –554.561 –525.658(710.957) (591.574)
Observations 35 41R-squared 0.85 0.86F-statistic for exclusion of instrument 12.92 15.71
Source: Authors’ calculations.
Note: The conservative sample includes all banks that participated in at least one TLTRO. These banks self-reported the data relevant for the computation of the borrowing allowance in the corresponding TLTRO reporting template. The complemented sample includes the conservative sample plus an additional six banks which, albeit eligible, never participated in TLTROs and whose hypothetical borrowing allowance was reconstructed using OeNB proprietary data. Standard errors in parentheses. *** p<0.01, ** p<0.05, * p<0.1.

The effects of the monetary policy response to the COVID-19 pandemic: preliminary evidence from a pilot study using Austrian bank-level data
148 OESTERREICHISCHE NATIONALBANK
When drawing on the complemented first stage sample, the estimated elasticities are slightly higher (0.27 and 1.00 in columns 2 and 6 of table 4, respectively). Finally, the treatment coefficient for the July, August and September 2020 specifi-cations including loans for house purchase (columns 3 and 4 of table 4) is estimated at EUR 0.32 for each additional EUR 1 taken up in the TLTRO III.4 round. Over-all, our 2SLS estimates would thus suggest that a naïve OLS approach tends to underestimate the credit supply elasticity of the TLTRO III.4 uptake. As discussed above, the downward bias in simple OLS regressions may be driven by banks which draw on TLTROs in a particularly extensive manner to replace more expensive funding sources, while on average granting fewer new loans due to profitability concerns or impaired balance sheets.
Our results corroborate the findings of the latest euro area bank lending survey (ECB, 2020). A net percentage of 47% of euro area banks participating in the sur-vey indicate that TLTRO III had a positive impact on their credit supply to firms in the past six months. In the April 2020 survey, the net percentage was only 11%. Hence, TLTRO III.4 noticeably changed loan supply dynamics. Moreover, banks said they expected an equally strong positive impact of TLTRO III on lending volumes also in the next six months.
Whereas the TLTRO III.4 uptake appears to have had an unambiguously posi-tive impact on the supply of new loans by participating banks, we cannot give a precise point estimate for this positive effect. The range provided by our estimated lower-bound and upper-bound elasticity is considerable and reflects the myriad of caveats and assumptions of our pilot study. Thus, it is important to emphasize, once again, which conclusions cannot be drawn from our results.
First, based on our estimates we cannot conclude that banks effectively use only a small fraction of the funds taken up to grant new loans, while the remainder is “lying idle.” According to this narrative, banks are simply parking tender liquidity on their current accounts with the central bank. This conclusion would commit the fallacy of omitting potential anticipation and delaying effects. Moreover, it would fully discount those potential positive effects of TLTROs on aggregate interest rates which we are likely to neglect in this study given our focus on the effect of direct participation. Although we attempt to gauge the bias induced by an
Table 4
Second-stage regression results
VariableNew ENL (July to September 2020, EUR million)
New ENL (July to September 2020, EUR million)
All new loans (July to September 2020, EUR million)
All new loans (July to September 2020, EUR million)
New ENL (March to September 2020, EUR million)
New ENL (March to September 2020, EUR million)
(1) (2) (3) (4) (5) (6)
TLTRO III.4 uptake (EUR million) 0.259*** 0.268*** 0.315*** 0.320*** 0.985*** 1.00***
(0.058) (0.055) (0.070) (0.065) (0.191) (0.179)
Observations 35 41 35 41 35 41R-squared 0.73 0.73 0.76 0.76 0.76 0.76Ei control vector √ √ √ √ √ √
Source: Authors’ calculations.
Note: ENL means “eligible net lending,” i.e. banks’ loans to nonfinancial corporations, to nonprofit institutions serving households and to households (excluding loans for house purchase). “All new loans” mean banks’ loans to nonfinancial corporations, to nonprofit institutions serving households and to households (including loans for house purchase). Standard errors in parentheses. *** p<0.01, ** p<0.05, * p<0.1.

The effects of the monetary policy response to the COVID-19 pandemic: preliminary evidence from a pilot study using Austrian bank-level data
MONETARY POLICY & THE ECONOMY Q4/20 – Q1/21 149
anticipatory supply of new loans, the current level of uncertainty makes it hard to evaluate the future role of delaying effects. Yet, since banks might still increase their credit supply considerably in the months to come, we are inclined to inter-pret our lower-bound estimates as conservative because, by definition, they only capture the short-run effects of banks’ TLTRO III.4 participation.
Second, our results do not necessarily imply that TLTROs have sizable indirect effects by exercising general downward pressure on the costs of funds obtained from other creditors. Although the presence of indirect effects could explain a high credit supply elasticity close to 1, we are not confident enough in our upper-bound estimate to interpret the results as convincing evidence for the existence of a prom-inent “external cost” channel.
Having said this, while we are confident about the positive sign associated to our treatment coefficient, we think that at present no cogent, definite statement regarding the “true” size of the underlying credit supply elasticity of TLTRO III.4 uptakes is possible. On the one hand, the true treatment coefficient may be consid-erably lower than 1. In this case, banks might effectively be parking a fraction of their TLTRO funding for purposes other than granting new loans. It should be noted, however, that banks that “park” the liquidity obtained from TLTRO fund-ing on their current accounts with the central bank are not necessarily free from liquidity constraints thwarting an expansion of their loan supply.25 Cautionary or regulatory motives may explain why banks temporarily “park” central bank fund-ing. These motives, however, may apply equally to banks experiencing liquidity constraints and to banks which are not liquidity constrained. On the other hand, via increased pressure on participating banks’ market funding costs that boosts the loan supply of nonparticipating banks, banks’ TLTRO III.4 uptake could also exhibit a true underlying credit supply elasticity close to 1.
5 ConclusionsThe Eurosystems’s monetary policy response to the COVID-19 crisis contained both extensions and enlargements of existing unconventional monetary policy measures. In addition, the Eurosystem also introduced new measures to meet the extraordinary challenge posed by the economic fallout of the COVID-19 pan-demic. In this paper, we provide a pilot study to analyze the credit supply effects of one important part of this rescue package: the Eurosystem’s targeted longer-term refinancing operations (TLTRO). We draw on Austrian bank-level data and exploit a two-stage instrumental variable (2SLS) strategy to approximate the causal effects of the June 2020 TLTRO uptake on banks’ supply of new loans. We find evidence for an unambiguously positive effect of TLTRO participation on loan supply in Austria. Yet, the precise point estimate resulting from our 2SLS strategy is subject to many caveats as we cannot fully incorporate potential anticipation and delay effects. Moreover, on the basis of our current sample and data, we are not able to capture the potentially positive credit supply effects that derive from TLTROs’ impact on aggregate market interest rates.
25 Banks’ supply of new loans may be hampered by liquidity constraints, i.e. a relative lack of free resources to lend out to their customers (asset-side constraints) and/or a relative lack of stable funding for new loans ( funding-side constraints).

The effects of the monetary policy response to the COVID-19 pandemic: preliminary evidence from a pilot study using Austrian bank-level data
150 OESTERREICHISCHE NATIONALBANK
We hope to be able to scale the present study and replicate it at the euro area level, including a longer time horizon following the June 2020 TLTRO uptake, to be able to better address some of these empirical challenges in the future.26 Fur-thermore, not least since the ECB’s monetary policy decisions of December 2020 entailed a recalibration of TLTRO conditions, including an enlargement of banks’ borrowing allowance to 55% of the stock of their eligible loans, more research is warranted to evaluate the effects of TLTROs on an ongoing basis. Another inter-esting but challenging avenue for further research would consist in quantifying the indirect effect of TLTROs on the credit supply of nonparticipating banks. For this purpose, it would be necessary to disentangle the impact of TLTROs from the effects of other unconventional monetary policy tools (e.g. the corporate sector purchase programme) on aggregate funding conditions. Finally, it would be worth-while investigating how firms and households, which benefit from the increased supply of new loans following TLTRO, invest these additional funds. While these analyses are beyond the scope of the present study, we hope our contribution will motivate researchers in academia and at central banks to investigate these ques-tions in more detail.
ReferencesAfonso, A. and J. Sousa-Leite. 2020. The transmission of unconventional monetary policy to
bank credit supply: Evidence from the TLTRO. In: The Manchester School 88(S1). 151–171.Altavilla, C.,Brugnoli, L., Gürkaynak, R., Motto, R. and G. Ragusa. 2019. Measuring
euro area monetary policy. In: Journal of Monetary Economics 108. 162–179.Altavilla, C., Barbiero, F., Boucinha, M. and L. Burlon. 2020a. The great lockdown: pandemic
response policies and bank lending conditions. ECB Working Paper 2465. September 2020.Altavilla, C., Canova, F. and M. Ciccarelli. 2020b. Mending the broken link: Heterogeneous
bank lending rates and monetary policy pass-through. In: Journal of Monetary Economics 110. 81–98.
Alves, N., Bonfim, D. and C. Soares. 2016. Surviving the perfect storm: the role of the lender of last resort. Banco de Portugal Working Paper 17. September 2016.
Andrade, P., Cahn, C., Fraisse, H. and J. Mésonnier. 2019. Can the provision of long-term liquidity help to avoid a credit crunch? Evidence from the Eurosystem’s TLTRO. In: Journal of the European Economic Association 17(4). 1070–1106.
Andreeva, D. and M. Garcia-Posada. 2020. The impact of the ECB’s Targeted Long-Term Refinancing Operations on banks’ lending policies: the role of competition. In: Journal of Banking and Finance, forthcoming.
Angeloni, I., Kashyap, A. and B. Mojon (eds.). 2003. Monetary Transmission in the euro area. Cambridge University Press.
Bats, J. and T. Hudepohl. 2019. Impact of targeted credit easing by the ECB: bank-level evidence. DeNederlandsche Bank Working Paper 631. April 2019.
BCBS. 2011. The transmission channels between the financial and real sectors: a critical survey of the literature. Basel Committee on Banking Supervision Working Paper 18. February 2011.
Benetton, M. and D. Fantino. 2018. Competition and the pass-through of unconventional monetary policy: evidence from TLTROs. Banca d’Italia Working Paper 1187, September 2018.
26 Additional extensions worth considering are the explicit inclusion of TLTRO III.3 and LTRO uptakes in our analysis. We would like to thank Olivier Vergote for suggesting these extensions.

The effects of the monetary policy response to the COVID-19 pandemic: preliminary evidence from a pilot study using Austrian bank-level data
MONETARY POLICY & THE ECONOMY Q4/20 – Q1/21 151
Bernanke, B. 2007. The Financial Accelerator and the Credit Channel. Speech given at The Credit Channel of Monetary Policy in the Twenty-first Century Conference, Federal Reserve Bank of Atlanta. June 2007.
Boeck, J., Perea, M. and G. Peersman. 2020. The transmission mechanism of credit support policies in the euro area. In: European Economic Review 124. May 2020.
Borio, C. and H. Zhu. 2012. Capital regulation, risk-taking and monetary policy: A missing link in the transmission mechanism? In: Journal of Financial Stability 8(4). 236–251.
Carpinelli, L. and M. Crosignani. 2017. The effect of central bank liquidity injections on bank credit supply. In: Finance and Economics Discussion Series 2017-038. Board of Governors of the Federal Reserve System. March 2017.
De Haan, L., van den End, J. and P. Vermeulen. 2015. Lenders on the storm of wholesale funding shocks: Saved by the central bank? DeNederlandsche Bank Working Paper 456. January 2015.
ECB. 2020. Euro area bank lending survey. October 2020. https://www.ecb.europa.eu/stats/ecb_surveys/bank_lending_survey/html/ecb.blssurvey-2020q4~e89c77d212.en.html
Eser, F., Lemke, W., Nyholm, K., Radde, S. and A. Vladu. 2019. Tracing the impact of the ECB’s asst purchase programme on the yield curve. ECB Working Paper 2293. July 2019.
Esposito, L., Fantino, D. and Y. Sung. 2020. The impact of TLTRO2 on the Italian credit market: some econometric evidence. Banca d’Italia Working Paper 1264, February 2020.
Eurosystem staff. 2020. Eurosystem staff macroeconomic projections for the euro area. December 2020. https://www.ecb.europa.eu/pub/projections/html/ecb.projections202012_ eurosystemstaff~bf8254a10a.en.html
Fenz, G. and M. Schneider. 2020. Second wave of COVID-19 pandemic delays economic recovery. In: OeNB. Monetary Policy & the Economy Q4/20 – Q1/21.
Garcia-Posada, M. and M. Marchetti. 2015. The Bank Lending Channel of Unconventional Monetary Policy: the Impact of the VLTROS on Credit Supply in Spain. Banco de Espana Working Paper 1512. February 2016.
Gibson, H., Hall, S., Petroulas, P. and G. Tavlas. 2020. On the effects of the ECB’s funding policies on bank lending. In: Journal of International Money and Finance 102.
Heider, F., Saidi, F. and G. Schepens. 2019. Life below Zero: Bank Lending under Negative Policy Rates. In: Review of Financial Studies 32(10). 3728–3761.
Heider, F., Saidi, F. and G. Schepens. 2020. Banks and negative interest rates. In: Annual Review of Financial Economics (forthcoming).
Jasova, M., Mendicino, M. and D. Supera. (2018). Rollover Risk and Bank Lending Behavior: Evidence from Unconventional Central Bank Liquidity. 2018 Meeting Papers 500, Society for Economic Dynamics.
Khwaja, I. and A. Mian. 2008. Tracing the Impact of Bank Liquidity Shocks: Evidence from an Emerging Market. In: American Economic Review 98(4). 1413–1442.
Laine, O. 2019. The effect of TLTRO-II on bank lending. Bank of Finland Research Discussion Papers 7. April 2019.
Puhr, C. and M. Schneider. 2020 Have mitigating measures helped prevent insolvencies in Austria amid the the COVID-19 pandemic? In: OeNB. Monetary Policy & the Economy Q4/20 – Q1/21.
Rostagno, M., Altavilla, C., Carboni, G., Lemke, W., Motto, R. Saint Guilhem, A. and J. Yiangou. 2019. A Tale of Two Decades: the ECB’s Monetary Policy at 20. ECB Working Paper 2346. December 2019.

The effects of the monetary policy response to the COVID-19 pandemic: preliminary evidence from a pilot study using Austrian bank-level data
152 OESTERREICHISCHE NATIONALBANK
Schnabl, P. 2012. The International Transmission of Bank Liquidity Shocks: Evidence from an Emerging Market. In: The Journal of Finance 67(3). 897–932.
Stein, J. 1998. An adverse-selection model of bank asset and liability management with implications for the transmission of monetary policy. In: RAND Journal of Economics 29(3). 466–486.
Sugo, T. and O. Vergote. 2020. Who takes the ECB’s targeted funding? ECB Working Paper 2439. July 2020.
Van den Heuvel, S. 2002. Does bank capital matter for monetary transmission? In: Federal Reserve Bank of New York Economic Policy Review 8(1). 259–265.
Van Dijk, M. and A. Dubovik. 2018. Effects of Unconventional Monetary Policy on European Corporate Credit. CPB Netherlands Bureau for Economic Policy Analysis Discussion Paper 372. January 2018.