Embed Size (px)
Citation preview
VN Monetary Policy – Tu Packard: page 1
Monetary Policy in Vietnam:
Alternatives to Inflation Targeting
Le Anh Tu Packard ([email protected]; [email protected]; [email protected])
Second Draft July 2005.
Paper prepared for the Danang July 28 – 30, 2005 Summer Symposium on Continuing Economic and Social Renovation for Development. The author’s research on monetary policy in Vietnam is a component of a multicountry research project on “Alternatives to Inflation Targeting Monetary Policy for Stable and Egalitarian Growth in Developing Countries” sponsored by the Political Economy Research Institute (PERI) at the University of Massachusetts, Amherst. Financial support for this project has been provided by the United Nations Department of Economic and Social Affairs (UNDESA), the Ford Foundation, and the Rockefeller Brothers Foundation. A previous draft of this paper was presented to the May 2005 CEDES/Amherst Research Conference in Buenos Aires. The author is indebted to Gerald Epstein, Jaime Ros, and Lance Taylor for their insightful comments and valuable ideas. She takes responsibility for all remaining errors and omissions.
VN Monetary Policy – Tu Packard: page 2
Abstract
The focus of this paper is on the conduct of monetary policy in Vietnam: how it is
made, and how it should be made. It examines the factors that should guide monetary
policy, and takes the position that the primary task of the central bank should be to
achieve an appropriate mix of macro-prices that best supports rapid and sustainable
economic growth. The feasible parameters of this mix are determined by the current state
of Vietnam’s transition to a more market-oriented economy and challenges posed by
dollarization, financial repression, informal and underdeveloped financial markets, and
rapid international economic integration.
An important finding is that critical elements remain missing in the body of
knowledge, institutional arrangements, tools and rules needed to increase the
effectiveness of monetary policy. The paper concludes by considering alternatives to the
inflation targeting policy that has been widely adopted by central banks in both
developed and developing countries, and proposes an alternative intermediate target – a
stable and competitive real exchange rate – that is more appropriate for the coming period
of greater openness and intensified competition in both domestic and export markets.
VN Monetary Policy – Tu Packard: page 3
List of Acronyms and Abbreviations ASEAN Association of South East Asian Nations BFTV Bank for Foreign Trade of Vietnam BIDV Bank for Investment and Development of Vietnam CEPT Common Effective Preferential Tariff CIEM Central Institute for Economic Management CMEA Council of Mutual Economic Assistance CPRGS Comprehensive Poverty Reduction and Growth Strategy DAF Development Assistance Fund FDI Foreign Direct Investment FIE Foreign-Invested Enterprise GC General Corporation GDI Gender-related Development Index GDP Gross Domestic Product GNP Gross National Product GSO General Statistical Office HDI Human Development Index IMF International Monetary Fund JV Joint Venture NEER Nominal Effective Exchange Rate ODA Official Development Assistance PE Private Enterprise PER Public Expenditure Review PRGF Poverty Reduction and Growth Facility PRSC Poverty Reduction Support Credit RCC Rural Credit Cooperative REER Real Effective Exchange Rate ROSCA Rotating Savings and Credit Associations SBV State Bank of Vietnam SOCB State-Owned Commercial Bank SOE State-Owned Enterprise UCC Urban Credit Cooperative UNDP United Nations Development Programme VCP Vietnam Communist Party VLSS Vietnam Living Standards Survey WTO World Trade Organization
VN Monetary Policy – Tu Packard: page 4
Table of Contents
Abstract .......................................................................................................................... 2
List of Acronyms and Abbreviations ............................................................................... 3
1. Introduction .............................................................................................................. 5
1.1 Monetary Policy for New Phase of Accelerated Globalization............................ 5
1.2 Vietnam’s Central Bank: Main Tasks and Concerns ........................................... 8
1.3 Vietnam’s Banking System: Brief History........................................................ 11
2. The Macro Economy and Transmission Mechanisms.............................................. 18
2.1 GDP and Macro Aggregates: Mechanisms of Adjustment ............................... 18
2.1.1 Incomplete Information on Monetary Aggregates and Domestic Credit ...... 18
2.1.2 Interest Rate Channel................................................................................. 22
2.1.3 Exchange Rate Channel and Determinants of Net Foreign Assets .............. 26
2.2 Employment and Labor Market Structure......................................................... 34
3 Macroeconomics and Central Bank Institutional Framework .................................. 37
3.1 Issues Surrounding Scope for Inflation Targeting ............................................. 37
3.2 Identification of Linkages Between Macro Prices ............................................. 40
4 Investigating Alternatives to Inflation Targeting ..................................................... 42
4.1 Identifying Alternatives in Terms of “Real” Targets ......................................... 42
5 References .............................................................................................................. 45
VN Monetary Policy – Tu Packard: page 5
1. Introduction
1.1 Monetary Policy for New Phase of Accelerated Globalization
Vietnam, a transition economy that broadly followed the East Asian “developmental
state”1 model during the first fifteen years of its reform process known as Doi Moi, is
entering a new phase of development. This new phase will likely see a speeding up of
globalization, shaped by the terms of its trade agreements with bilateral and regional
trading partners and accession to the World Trade Organization (WTO). The nature of
the opportunities and risks presented during this phase are matters of great concern,
especially to population groups that are least able to cope with volatility from external
shocks. Recognizing these challenges, the government has launched extensive
consultations to identify appropriate macroeconomic and monetary policies to help their
nation weather successfully this period of unprecedented exposure to the vicissitudes of
the global economy. To this end, the State Bank of Vietnam (SBV) also has prepared a
plan on the banking sector’s international economic integration.2
This paper hopes to contribute to Vietnam’s search for policies that promote growth
while keeping the macroeconomy on an even keel. Its specific focus is on the conduct of
monetary policy: how it is made, and how it should be made. It examines the factors that
should guide monetary policy, and takes the position that the primary task of the central
bank during this coming period should be to maintain the right mix of macro-prices to
1 The “mission” of a “developmentalist” state is to promote sustained economic development through steady high rates of economic growth and structural change in the productive system (Castells 1992). Mkandawire further describes the developmental state as one that seriously attempts to deploy its administrative and political resources to the task of economic development. 2 State Bank of Vietnam “Plan on International Economic Integration of the Banking Sector of Vietnam” issued together with Decision No. 663/QD-NHNN on June 26, 2003 (Decision of the Governor of the State Bank on the plan on international economic integration of the banking sector). Hereafter this document will be referred to as the SBV 2003 International Economic Integration Plan. The SBV argues that active participation in globalization and integration with the world economy will act as a locomotive to help Vietnam to grow and catch up with countries in the Pacific Asia region, strengthen the capacity of entrepreneurs, transform Vietnam’s industry structure, and improve factor mobility.
VN Monetary Policy – Tu Packard: page 6
support rapid and sustainable3 economic growth and structural change geared towards
industrialization, modernization and higher value-added production of goods and
services. Of course, the parameters of this mix are determined by the current state of
Vietnam’s transition to a more market-oriented economy and the challenges posed by
dollarization, financial repression, informal and underdeveloped financial markets, and
rapid international economic integration.
An important finding is that critical elements remain missing in the body of
knowledge,4 institutional arrangements, tools and rules needed to increase the
effectiveness of monetary policy. The paper focuses on two important gaps: the need to
strengthen the central bank’s knowledge base and develop rules for monetary policy that
are realistic and geared towards the new challenges facing the Vietnamese economy. It
considers alternatives to the inflation targeting policy that has been widely adopted by
central banks in both developed and developing countries, and proposes a different
intermediate target – a stable and competitive real exchange rate (RER) – that is more
appropriate for the coming period of greater openness and intensified competition in both
domestic and export markets. Maintained over an extended period, a stable and
competitive RER promotes a pro-growth allocation of resources, reinforces
macroeconomic and financial stability, and encourages financial market development.
The paper argues that a stable and competitive RER is a superior intermediate target
for five reasons. First, this target clearly implements the Law on the State Bank of
Vietnam (SBV),5 which states that the SBV’s task is to stabilize the value of the
currency. Second, it improves the transparency of monetary policy and strengthens
confidence in the central bank’s ability to conduct monetary policy effectively because
the targeted rate of currency exchange is both sustainable and growth enhancing. In other
words, the central bank is assigned a task that is realistic and therefore doable. Third, a
stable and competitive RER can contribute substantially to economic growth and
employment creation if it is supported by complementary fiscal, monetary, and industrial
3 Clearly, if growth is to be sustainable, it must be able to contain inflation. 4 As described in Section 2.1.1, the government is operating somewhat in the dark as it attempts to manage aggregate liquidity. 5 Law on the State Bank is dated December 12, 1997.
VN Monetary Policy – Tu Packard: page 7
policies. Fourth, it can have positive medium- to long-term impacts on structural change
and development through a variety of channels: resource allocation, shifts in production
techniques, growth of capital stock including stock of human capital (Frenkel and Taylor
2005)6. Fifth, compared to a strict focus on inflation targeting which tends to slow
economic growth and lower employment growth (Epstein 2003), a real exchange rate
target is actually a more effective stabilizing force and can do a better job in dampening
output volatility during periods of global turbulence.
A stable and competitive RER’s long-term positive impact7 on resource allocation
and the composition of output takes place through its influence, both direct and indirect,
on key macro prices such as the domestic interest rate, the relative price of traded to non-
traded goods, the relative cost of capital and labor, and the import-export price ratio.8
Enterprises in Vietnam have shown that they understand the powerful impact of price
changes on profitability9, and therefore are likely to make long-term investment and
production plans based on price signals that they believe to be permanent rather than
temporary.
6 Frenkel and Taylor (2005) emphasize that the real exchange rate must be kept at a stable and competitive level for a relatively long period if the positive effects are to take place. The reason is that responses to the new (competitive) set of relative prices take time because they involve restsructuring firms and sectoral labor market behavior. This takes place over time via changes in the pattern of output among firms and sectors, and adjustments in technology and organization of production. 7 The long-term effects take into account the time lag from when investment decisions are made and productivity gains are realized. 8 The cost of capital goods and intermediate inputs affects the export/import price ratio. 9 This can be demonstrated through simulations of Vietnam’s input-output tables and through analysis of individual firms. For example, sensitivity analysis carried out by management consultants of three large firms in the state enterprise paper industry indicates that a 10 percent increase in product price will increase the firm’s profit margin by between 64 and 121 percent (Packard 2004).
VN Monetary Policy – Tu Packard: page 8
1.2 Vietnam’s Central Bank: Main Tasks and Concerns
Reforms in Vietnam’s monetary and financial sector have been an integral part of the
Doi Moi reforms launched in 1989. Similar to China’s reforms, they include the
establishment of a two-tier banking system, gradual liberalization of interest rates and the
exchange rate, decreased reliance on direct controls over credit growth, and greater
emphasis on using indirect instruments of monetary policy (see Section 1.3). During the
past 15 years, the government adopted prudent fiscal and monetary policies while
permitting rapid credit growth when the threat of inflation receded. As a result, Vietnam
was able to maintain a high rate of economic growth, macroeconomic stability and low
inflation over a prolonged period (1990 – 2005).
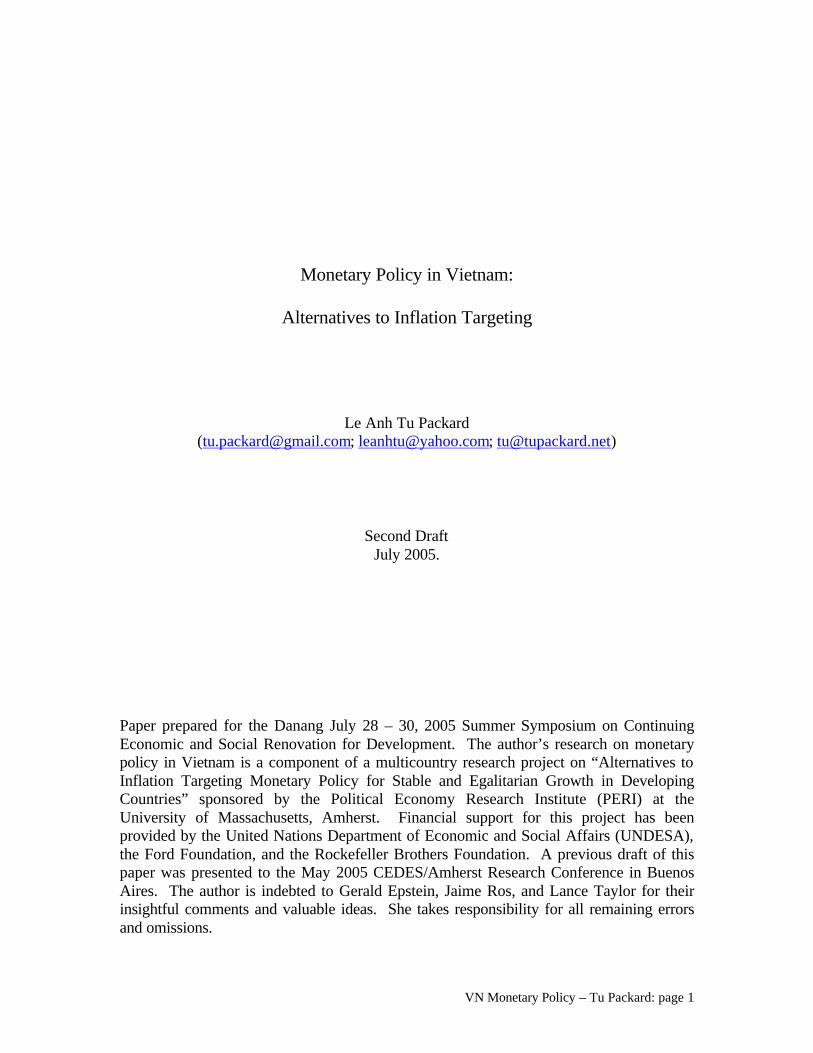
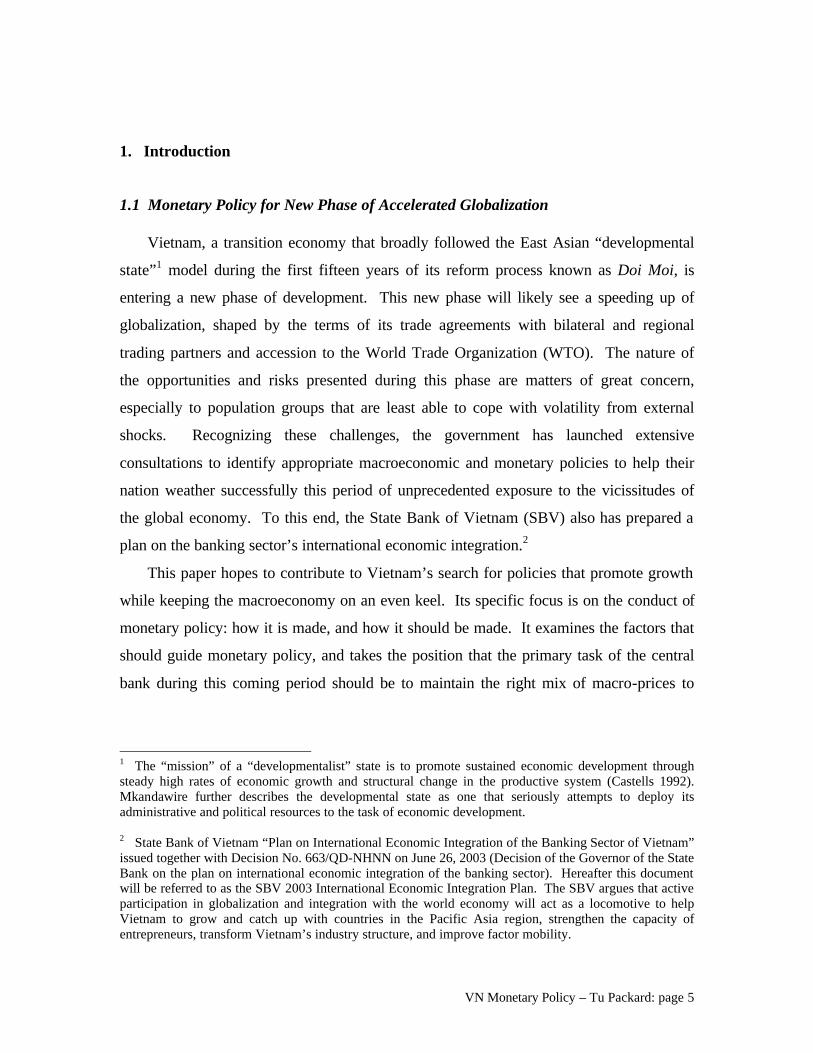
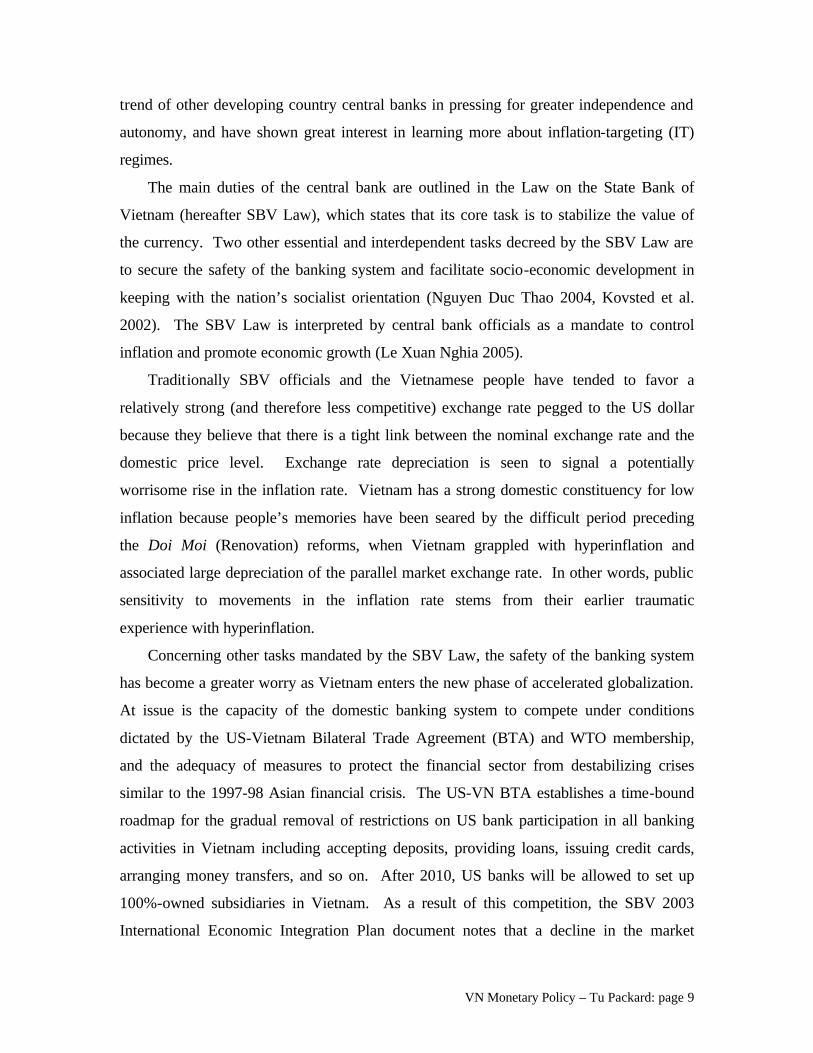
This positive economic environment laid the groundwork and provided support for
greater financial deepening (shown in Figure 1), as measured by the ratio of M2 to
nominal GDP. The evolution of this ratio may be viewed as a proxy for public
confidence in the state’s macroeconomic management capability. Recently Vietnam’s
central bank has been taking advantage of the credibility that it gained in controlling
inflation to quietly implement strategies to de-dollarize the economy, chiefly by making
dollar deposits less attractive than dong deposits. SBV officials also have followed the
Figure 1. Evolution of financial deepening and dollarization: 1986-2003
0.0%
10 .0%20 .0%
30 .0%40 .0%
50 .0%
60 .0%70 .0%
80 .0%
1986
1988
1990
1992
1994
1996
1998
2000
2002
F i nanc ia l deepen ing : M 2 /nom inal G D PCur rency ou t s i de banks /nom inal G D P"Do l la r i za t ion " : Fo re ign cu r rency depos i t s /M 2
VN Monetary Policy – Tu Packard: page 9
trend of other developing country central banks in pressing for greater independence and
autonomy, and have shown great interest in learning more about inflation-targeting (IT)
regimes.
The main duties of the central bank are outlined in the Law on the State Bank of
Vietnam (hereafter SBV Law), which states that its core task is to stabilize the value of
the currency. Two other essential and interdependent tasks decreed by the SBV Law are
to secure the safety of the banking system and facilitate socio-economic development in
keeping with the nation’s socialist orientation (Nguyen Duc Thao 2004, Kovsted et al.
2002). The SBV Law is interpreted by central bank officials as a mandate to control
inflation and promote economic growth (Le Xuan Nghia 2005).
Traditionally SBV officials and the Vietnamese people have tended to favor a
relatively strong (and therefore less competitive) exchange rate pegged to the US dollar
because they believe that there is a tight link between the nominal exchange rate and the
domestic price level. Exchange rate depreciation is seen to signal a potentially
worrisome rise in the inflation rate. Vietnam has a strong domestic constituency for low
inflation because people’s memories have been seared by the difficult period preceding
the Doi Moi (Renovation) reforms, when Vietnam grappled with hyperinflation and
associated large depreciation of the parallel market exchange rate. In other words, public
sensitivity to movements in the inflation rate stems from their earlier traumatic
experience with hyperinflation.
Concerning other tasks mandated by the SBV Law, the safety of the banking system
has become a greater worry as Vietnam enters the new phase of accelerated globalization.
At issue is the capacity of the domestic banking system to compete under conditions
dictated by the US-Vietnam Bilateral Trade Agreement (BTA) and WTO membership,
and the adequacy of measures to protect the financial sector from destabilizing crises
similar to the 1997-98 Asian financial crisis. The US-VN BTA establishes a time-bound
roadmap for the gradual removal of restrictions on US bank participation in all banking
activities in Vietnam including accepting deposits, providing loans, issuing credit cards,
arranging money transfers, and so on. After 2010, US banks will be allowed to set up
100%-owned subsidiaries in Vietnam. As a result of this competition, the SBV 2003
International Economic Integration Plan document notes that a decline in the market
VN Monetary Policy – Tu Packard: page 10
share of Vietnamese commercial banks is anticipated, because US and other foreign
banks (which have requested the same treatement as US banks) have superior technology
and better credit analysis and risk management skills. At the same time, central bank
officials hope that competition from foreign banks will spur the banking system to reform
and renovate, and that domestic banks will learn from their foreign rivals and restructure.
In their view, exposure to foreign competition will speed up modernization of the
banking sector, develop financial markets, improve management capability, and bring
financial industry regulations up to international standards (SBV 2003 International
Economic Integration Plan).
While banking issues are outside the scope of this paper, monetary policy’s influence
on financial sector development is important to note. This takes place through its impact
on key macro prices such as the real exchange rate and interest rate differentials as well
as through policy and institutional decisions regarding controls on cross-border capital
flows and exchange rate policy. This in turn affects the growth path of the economy
including the financial sector.
The third pillar of the SBV law – promoting socio-economic development while
preserving the nation’s socialist orientation – is in effect a declaration that the ultimate
objective of central bank policy including monetary policy should be to promote the
social well-being of the people and to expand their capabilities.10
10 I assume that the authors of the SBV Law are sympathetic to the “human development approach” articulated by the United Nations and reaffirmed in the government’s 2002 Comprehensive Poverty Reduction and Growth Strategy (CPRGS) document. Development is “conceptualized as the broadening of people’s choices” by expanding their “capabilities” to live a long and healthy life, to be well nourished and clothed, to be knowledgeable, to have access to resources and opportunities that ensure an adequate standard of living. Other important capabilities include the ability to have self-esteem, to be treated with dignity, and to be free from systematic social exclusion due to discrimination or other factors (UNRISD 2005).
VN Monetary Policy – Tu Packard: page 11
1.3 Vietnam’s Banking System: Brief History
Prior to 1989, as with other centrally-planned economies (CPEs), the State owned
and controlled Vietnam’s single-tier banking system, directed bank lending, and – due to
scarce resources – imposed credit rationing. Trade and infrastructure finance were
managed by two specialized banks. The Bank for Foreign Trade of Vietnam (BFTV),
established in 1963, had a monopoly over the financing of foreign trade and foreign
exchange transactions. The Bank for Investment and Development of Vietnam (BIDV),
established in 1958, handled the financing of public works, infrastructure projects, and
equipment for SOEs (World Bank 1991).
The SBV was the sole provider of domestic banking services through a vast branch
network. Its task was to ensure that financial resources were allocated to economic units
in accordance with the state economic plan. SBV offices functioned as the interface
between state planning, the national budget, and various state entities that included some
12,000 state-owned enterprises (SOEs).11 Lending decisions were not commercially
based, and for this reason the SBV bank network had little experience with standard
commercial banking functions such as credit analysis or risk management. During this
period, domestic and international payment systems were so slow that payment by check
between provinces often took from two to six months to clear12. As a result, many
11 In 1989, the SOE sector was made up of about 12,000 enterprises, of which 3100 were in industry; while the remaining were in trade, construction, agriculture and services. Most SOEs were provincial or district enterprises that were managed by the Industrial Bureaus of the provincial or district People’s Committees (World Bank 1991). The reform of state enterprises, a key component of the Doi Moi reforms, subject the SOEs to a hard budget constraint. A massive restructuring of the state enterprise sector took place. By 1992 the number of SOEs fell by nearly half to 6,545 enterprises, and their labor force was cut from 2.7 million to 1.7 million (IMF 1998). 12 Initially the SOEs were allowed to make payments to third parties by issuing checks drawn on their accounts, but many abused the system by generating unauthorized overdrafts. Moreover, they used their political influence to avoid sanctions. In response, the SBV restricted not only the use of checks drawn by the SOEs on their own accounts, but also of bank drafts or cashier’s checks for interprovincial payments. Banks were prohibited from opening correspondent accounts with banks in other provinces. All interprovincial interbank transactions had to be conducted through the SBV. In other words, the SBV effectively replaced the check payment system by a more cumbersome arrangement involving multiple SBV branches at various stages in the payment. This slowed down the money transfer process, and payment delays of between two and six months became common (World Bank 1991).
VN Monetary Policy – Tu Packard: page 12
enterprises ignored the check payment system and instead used couriers to make direct
cash payments (World Bank 1991).
Vietnam’s monetary history during the mid 1980s was marked by recurrent fiscal
crises and government measures to monetize sharply rising fiscal deficits because
revenue growth failed to keep pace with rising expenditures13. The state had great
difficulty imposing fiscal discipline on its constituent parts. SOEs operated under the soft
budget constraint that was common among socialist countries. To circumvent credit
rationing, they engaged in unauthorized credit creation through various means such as
abuse of the check payment system (see footnote 8) and use of supplier credits14 as a
substitute for borrowing in credit markets. These practices had inflationary
consequences, created financial problems for the SBV, and contributed to a deterioration
in the consolidated balance sheets of SOEs, because the accumulation of ‘accounts
payable’ debits in the balance sheets of debtor SOEs was mirrored in ‘accounts
receivable’ credits in the balance sheets of creditor SOEs.
Before money and capital markets were established during the 1990s, household
liquid and semi-liquid assets mainly consisted of the domestic currency, gold, hard
currency notes, and easily tradeable commodities such as rice. Remittances from
overseas Vietnamese15 contributed to the dollarization of the economy and growth of the
domestic stock of hard currency notes (which was and still is mainly denominated in US
dollars). Throughout the 1980s, to protect the value of their assets during periods of
inflation volatility and hyperinflation, households attempted to draw down their domestic
currency holdings and replace them with gold, rice and US dollar assets. This drove up
13 The expenditures included the costs of maintaining a large military force, direct subsidies to SOEs, and indirect subsidies associated with price controls. 14 This is done by delaying or failing to repay credit extended by their suppliers which generally were other SOEs. The Vietnamese term employed by SOE managers to describe this practice is chiem von nhau (conquering each other’s working capital). 15 This usually took place through informal channels due to unfavorable regulations governing formal money transfers. Recipients were forced to take the money in Vietnamese currency at an exchange rate that effectively gave them half or sometimes a third of the amount they could get in the open market (Beresford and Dang Phong 2000).
VN Monetary Policy – Tu Packard: page 13
the black market price of gold and US dollars16. Continued efforts by households and
other economic agents to protect themselves from inflation by getting rid of their
domestic currency holdings (causing the ratio of currency outside banks to nominal GDP
to decline from 9.2 percent in 1986 to 6.6 percent in 1988) only worsened the inflationary
spiral.
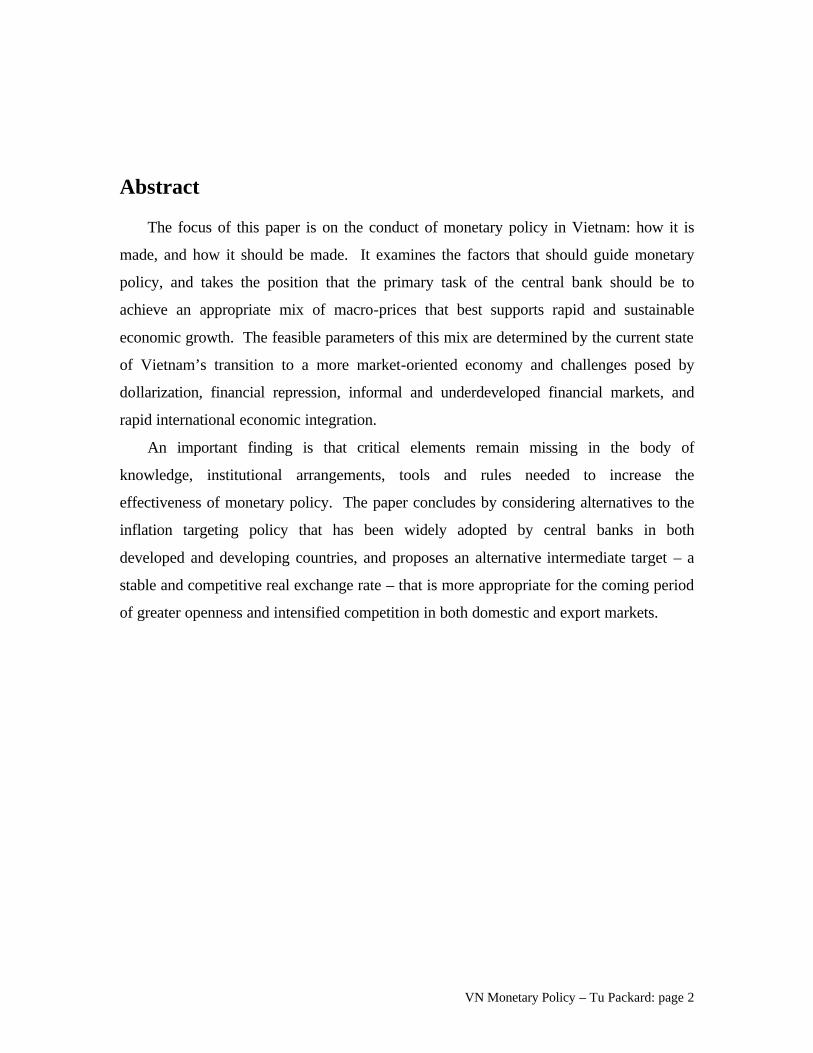
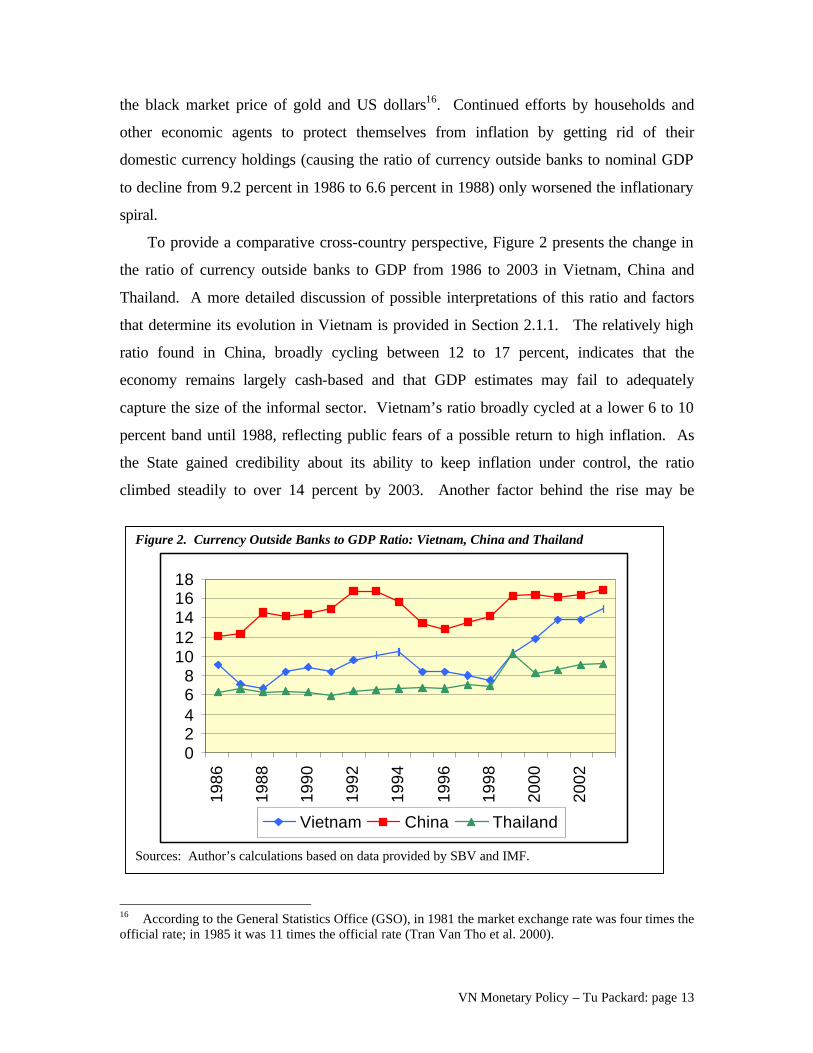
To provide a comparative cross-country perspective, Figure 2 presents the change in
the ratio of currency outside banks to GDP from 1986 to 2003 in Vietnam, China and
Thailand. A more detailed discussion of possible interpretations of this ratio and factors
that determine its evolution in Vietnam is provided in Section 2.1.1. The relatively high
ratio found in China, broadly cycling between 12 to 17 percent, indicates that the
economy remains largely cash-based and that GDP estimates may fail to adequately
capture the size of the informal sector. Vietnam’s ratio broadly cycled at a lower 6 to 10
percent band until 1988, reflecting public fears of a possible return to high inflation. As
the State gained credibility about its ability to keep inflation under control, the ratio
climbed steadily to over 14 percent by 2003. Another factor behind the rise may be
16 According to the General Statistics Office (GSO), in 1981 the market exchange rate was four times the official rate; in 1985 it was 11 times the official rate (Tran Van Tho et al. 2000).
Figure 2. Currency Outside Banks to GDP Ratio: Vietnam, China and Thailand
02468
1012141618
1986
1988
1990
1992
1994
1996
1998
2000
2002
Vietnam China Thailand
Sources: Author’s calculations based on data provided by SBV and IMF.
VN Monetary Policy – Tu Packard: page 14
structural changes in the economy as well as underestimation of the size of the informal
sector. Thailand had a lower ratio of around 6 percent that remained quite stable until the
1997-98 financial crisis. A less steep climb of this ratio (compared to Vietnam) from
2000 on may indicate that a structural shift is taking place in the Thai economy.
The 1987-89 macroeconomic and fiscal crisis17 and hyperinflation provided the
impetus for the comprehensive and coordinated Doi Moi reforms that included reforms in
Vietnam’s banking and financial sector. In 1988 the Prime Minister signed Decree No.
53/ND which ended the monobank system and created a two-tier system consisting of the
SBV as the central bank and four state-owned commercial banks (SOCBs). In addition to
the BFTV and BIDV, two new SOCBs were created out of two SBV departments. The
Industrial and Commercial Bank of Vietnam (ICBV) was created out of SBV’s industrial
and commercial loan department, and the Agricultural Bank of Vietnam (ABV) was
created from the agricultural credit department. In addition, the government ended
BFTV’s monopoly on financing foreign trade and BIDV’s monopoly on providing long-
term finance. The intent was to increase management autonomy and responsibility, and
to introduce the pressure of competition in order to improve bank performance (World
Bank 1991).
In 1990, the government issued two ordinances on banking which established the
objectives, duties and purposes of operations for each tier of the banking system. The
SBV was given responsibility for state management of banking systems and assumed the
duties of a central bank. The Commercial Bank Ordinance provided the legal framework
for commercial banks and other financial institutions. The government liberalized entry
into the banking system and lifted rules on sectoral specialization of the SOCBs.
Commercial banks were given responsibility for the operation and control of their
finances and implementation of universal banking activities. As a result, the banking
sector expanded rapidly and banks began to offer a wider range of services. By end of
1996 the financial sector consisted of 4 SOCBs, 52 joint stock banks, 23 branches of
foreign banks, 4 joint venture banks, 62 representative offices of foreign banks, 68 credit
17 External shocks such as the collapse of trade with the CMEA and the end of external financing by the former USSR contributed to the macroeconomic crisis.
VN Monetary Policy – Tu Packard: page 15
cooperatives, about 900 people’s credit funds, 2 finance companies, and 1 state-owned
insurance company (IMF 1998).
Without the banking reforms, the government’s other structural reforms and
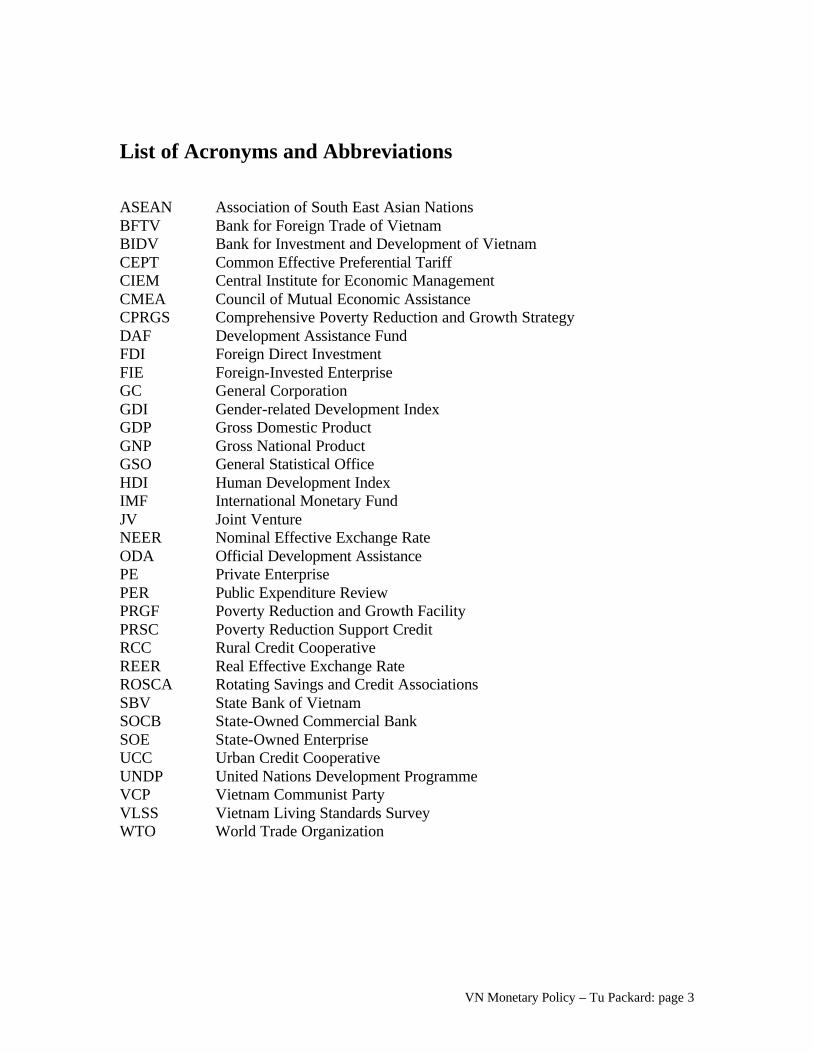
stabilization measures would have been less effective. The combined effect of
unification and massive devaluation of the exchange rate18, legalization of gold trading,
domestic price liberalization, sharp increases in deposit interest rates, imposition of a
18 The official VND/USD exchange rate went from 375 VND per USD in 1988 to 4635 VND per USD in 1989, which all but eliminated the gap with the parallel market rate.
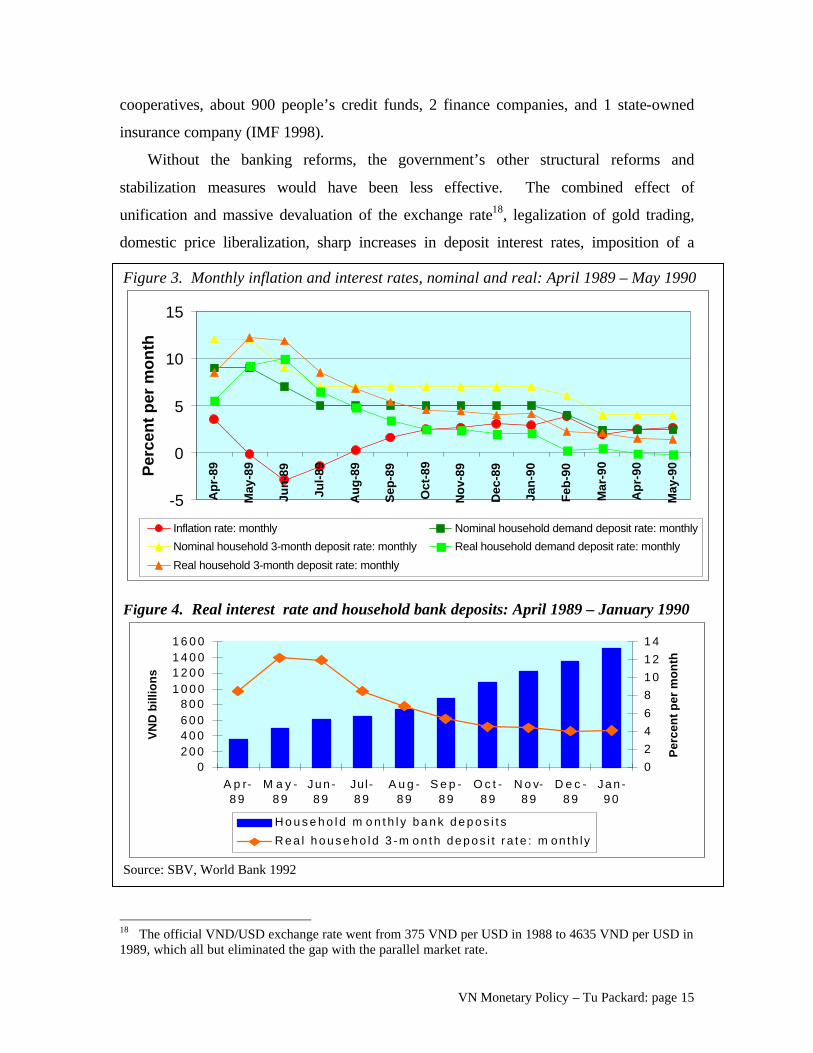
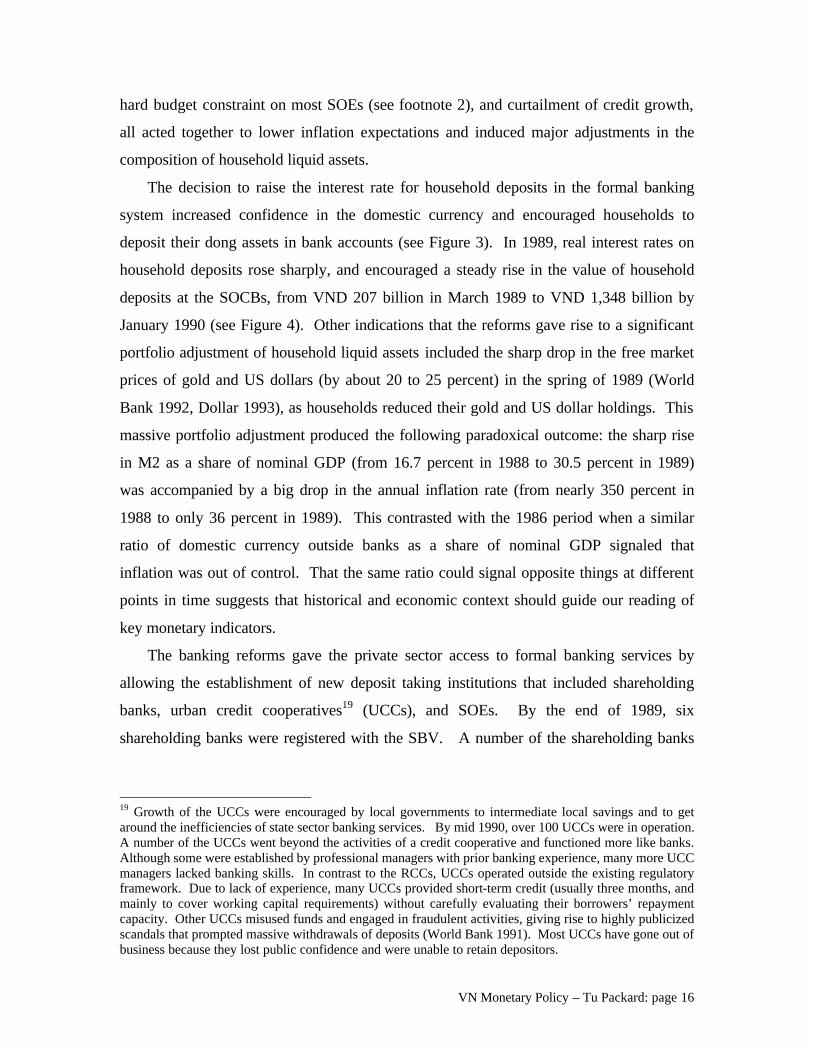
Figure 3. Monthly inflation and interest rates, nominal and real: April 1989 – May 1990
-5
0
5
10
15
Ap
r-89
Ma
y-8
9
Ju
n-8
9
Ju
l-8
9
Au
g-8
9
Sep
-89
Oc
t-8
9
No
v-89
Dec-8
9
Jan
-90
Feb
-90
Ma
r-9
0
Ap
r-90
Ma
y-9
0Pe
rce
nt
pe
r m
on
th
Inflation rate: monthly Nominal household demand deposit rate: monthly
Nominal household 3-month deposit rate: monthly Real household demand deposit rate: monthly
Real household 3-month deposit rate: monthly
Figure 4. Real interest rate and household bank deposits: April 1989 – January 1990
02 0 04 0 06 0 08 0 0
1 0 0 01 2 0 01 4 0 01 6 0 0
A p r-8 9
M a y -8 9
J u n -8 9
Jul-8 9
A u g -8 9
S e p -8 9
O c t -8 9
N o v-8 9
D e c -8 9
J a n -9 0
VN
D b
illi
on
s
0
2
4
6
8
1 0
1 2
1 4
Pe
rce
nt
pe
r m
on
th
H o u s e h o l d m o n t h l y b a n k d e p o s i t s
R e a l h o u s e h o l d 3 - m o n t h d e p o s i t r a t e : m on th ly
Source: SBV, World Bank 1992
VN Monetary Policy – Tu Packard: page 16
hard budget constraint on most SOEs (see footnote 2), and curtailment of credit growth,
all acted together to lower inflation expectations and induced major adjustments in the
composition of household liquid assets.
The decision to raise the interest rate for household deposits in the formal banking
system increased confidence in the domestic currency and encouraged households to
deposit their dong assets in bank accounts (see Figure 3). In 1989, real interest rates on
household deposits rose sharply, and encouraged a steady rise in the value of household
deposits at the SOCBs, from VND 207 billion in March 1989 to VND 1,348 billion by
January 1990 (see Figure 4). Other indications that the reforms gave rise to a significant
portfolio adjustment of household liquid assets included the sharp drop in the free market
prices of gold and US dollars (by about 20 to 25 percent) in the spring of 1989 (World
Bank 1992, Dollar 1993), as households reduced their gold and US dollar holdings. This
massive portfolio adjustment produced the following paradoxical outcome: the sharp rise
in M2 as a share of nominal GDP (from 16.7 percent in 1988 to 30.5 percent in 1989)
was accompanied by a big drop in the annual inflation rate (from nearly 350 percent in
1988 to only 36 percent in 1989). This contrasted with the 1986 period when a similar
ratio of domestic currency outside banks as a share of nominal GDP signaled that
inflation was out of control. That the same ratio could signal opposite things at different
points in time suggests that historical and economic context should guide our reading of
key monetary indicators.
The banking reforms gave the private sector access to formal banking services by
allowing the establishment of new deposit taking institutions that included shareholding
banks, urban credit cooperatives19 (UCCs), and SOEs. By the end of 1989, six
shareholding banks were registered with the SBV. A number of the shareholding banks
19 Growth of the UCCs were encouraged by local governments to intermediate local savings and to get around the inefficiencies of state sector banking services. By mid 1990, over 100 UCCs were in operation. A number of the UCCs went beyond the activities of a credit cooperative and functioned more like banks. Although some were established by professional managers with prior banking experience, many more UCC managers lacked banking skills. In contrast to the RCCs, UCCs operated outside the existing regulatory framework. Due to lack of experience, many UCCs provided short-term credit (usually three months, and mainly to cover working capital requirements) without carefully evaluating their borrowers’ repayment capacity. Other UCCs misused funds and engaged in fraudulent activities, giving rise to highly publicized scandals that prompted massive withdrawals of deposits (World Bank 1991). Most UCCs have gone out of business because they lost public confidence and were unable to retain depositors.
VN Monetary Policy – Tu Packard: page 17
had mixed ownership (SBV and private shareholders), with SBV shareholdings being
gradually bought back by the private shareholders (World Bank 1991).
The SBV employs both direct and indirect instruments to conduct monetary policy.
Direct instruments are thought to be more effective during the current phase of Vietnam’s
transition economy. Motivated by the desire to create more indirect instruments, and to
further develop the domestic financial market, the SBV in 1994 established interbank
markets for foreign exchange and short-term domestic bonds. Buying and selling rates in
the interbank foreign exchange market are allowed to move within a band around an
official reference rate that the SBV sets daily (World Bank 1997). Treasury-bill auctions
were introduced in mid 1995 to allow market forces a greater role in determining interest
rates.
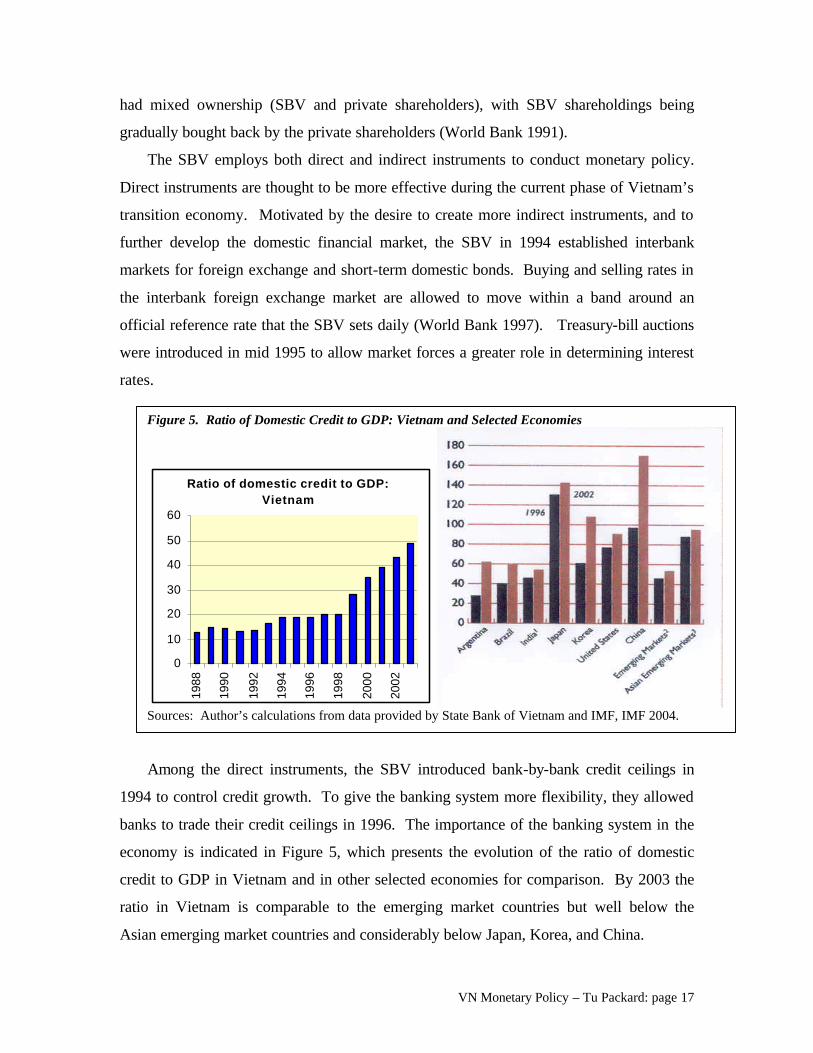
Among the direct instruments, the SBV introduced bank-by-bank credit ceilings in
1994 to control credit growth. To give the banking system more flexibility, they allowed
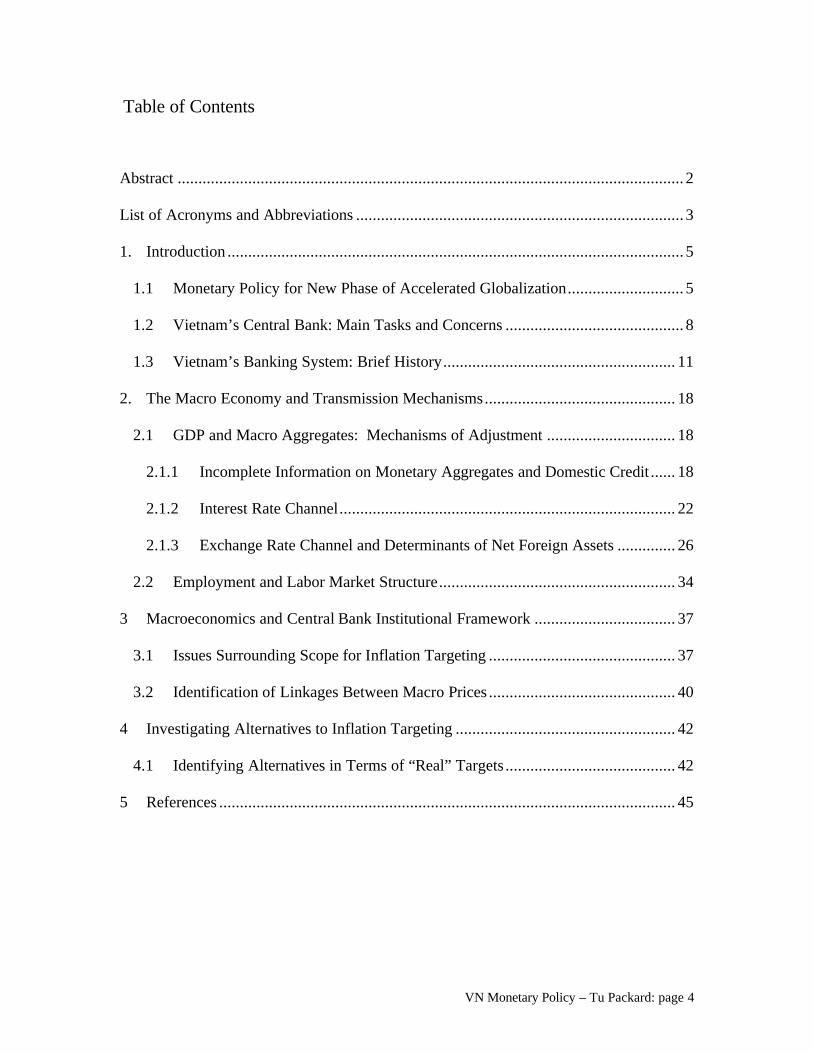
banks to trade their credit ceilings in 1996. The importance of the banking system in the
economy is indicated in Figure 5, which presents the evolution of the ratio of domestic
credit to GDP in Vietnam and in other selected economies for comparison. By 2003 the
ratio in Vietnam is comparable to the emerging market countries but well below the
Asian emerging market countries and considerably below Japan, Korea, and China.
Figure 5. Ratio of Domestic Credit to GDP: Vietnam and Selected Economies
Ratio of domestic credit to GDP: Vietnam
0
10
20
30
40
50
60
1988
1990
1992
1994
1996
1998
2000
2002
Sources: Author’s calculations from data provided by State Bank of Vietnam and IMF, IMF 2004.
VN Monetary Policy – Tu Packard: page 18
2. The Macro Economy and Transmission Mechanisms
2.1 GDP and Macro Aggregates: Mechanisms of Adjustment 2.1.1 Incomplete Information on Monetary Aggregates and Domestic Credit
The effective conduct of monetary policy using standard intermediate targets requires
a much better understanding of actual transmission mechanisms in Vietnam than we have
at present. The basic problem is incomplete information: we do not have reliable data on
key variables contained in standard IS-LM equations that describe interactions between
the goods market and the money market. Vietnam’s ongoing structural transformation
also obscures the picture20.
To illustrate: aggregate money supply and important components of the money
demand function are unknown due to partial dollarization of the Vietnamese economy
(Hauskrecht and Nguyen 2004) and inadequate information about the quantity of US
dollars and stock of gold outside the banking system that are used as a medium of
exchange and a store of value21. For this reason the theoretical link between money and
prices turns out to be difficult to verify empirically. Not surprisingly, a VAR analysis of
inflation dynamics in Vietnam carried out by IMF staff found that the role of monetary
aggregates on the CPI was not robust and provided little guide to monetary policy.
The reasons for this finding is easily seen with reference to the well-known Quantity
Theory of Money (QTOM) identity
MV=PQ
where the pass-through from money (M) to prices (P) is complete and straightforward
assuming that velocity (V) is constant. However, in Vietnam “true” M is an elusive
variable. Broad money (M) is at minimum the sum of M2 (recorded by the SBV),
foreign deposits held in banks (also recorded) and foreign currency holdings and gold in
circulation (not officially recorded). It is also likely that the domestic and foreign
20 For this reason, it may be more realistic to assume that key parameters of the economy are better approximated by time-varying instead of fixed coefficients (Packard and Thurman 1996). 21 Both function as “a quasi second legal tender” or “parallel currency” in the economy (Hauskrecht and Nguyen 2004). The government can track the quantity of currency outside banks and the quantity of dong and dollar deposits. However, the quantity of gold and hard currency held by households and other economic agents that are used as a medium of exchange and store of wealth is not known.
VN Monetary Policy – Tu Packard: page 19
currency will have different velocities (Hauskrescht and Nguyen 2004) and different
(policy influenced) trajectories.
The implication for monetary policy is that it is not feasible to employ a monetary
aggregate such as M2 as an intermediate target. The authorities cannot know how to
manipulate M2 to get the desired impact on the price level because the relationship
between M2 and the inflation rate is neither close nor stable. It also is not possible to
estimate the time lag between the transmission of a monetary policy impulse and its
impact on the real economy. While monetary aggregates are not suitable intermediate
targets, they should be utilized as monitoring variables that aid the analysis of economic
and financial conditions, so policymakers can better assess the response of key economic
players to monetary policy impulses. As shown below, careful analysis of changes in
velocity is especially useful in increasing our understanding of transmission mechanisms
and developments in the economy that may have policy significance.
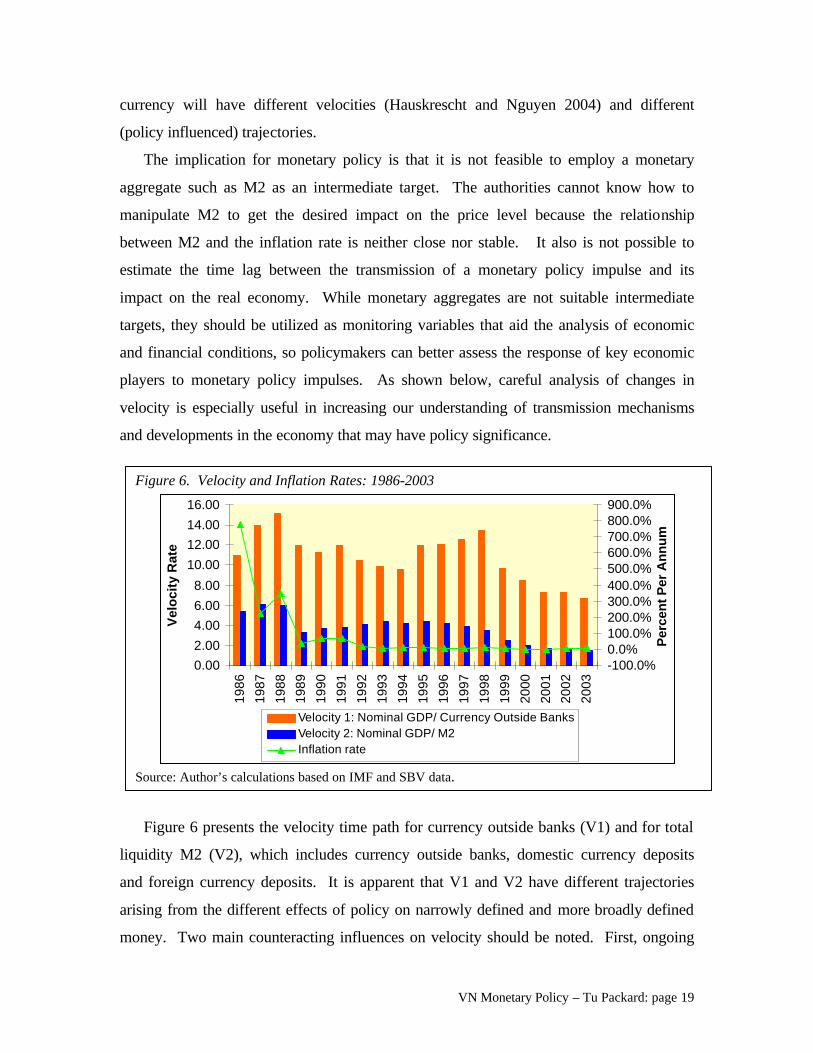
Figure 6 presents the velocity time path for currency outside banks (V1) and for total
liquidity M2 (V2), which includes currency outside banks, domestic currency deposits
and foreign currency deposits. It is apparent that V1 and V2 have different trajectories
arising from the different effects of policy on narrowly defined and more broadly defined
money. Two main counteracting influences on velocity should be noted. First, ongoing
Figure 6. Velocity and Inflation Rates: 1986-2003
0.00
2.00
4.00
6.00
8.00
10.00
12.00
14.00
16.00
1986
1987
1988
1989
1990
1991
1992
1993
1994
1995
1996
1997
1998
1999
2000
2001
2002
2003
Ve
loc
ity
Ra
te
-100.0%0.0%100.0%200.0%300.0%400.0%500.0%600.0%700.0%800.0%900.0%
Per
cen
t P
er A
nn
um
Velocity 1: Nominal GDP/ Currency Outside BanksVelocity 2: Nominal GDP/ M2Inflation rate
Source: Author’s calculations based on IMF and SBV data.
VN Monetary Policy – Tu Packard: page 20
structural reform in the financial sector and improvements in the payment system have
the effect of raising velocity. Offsetting this is greater confidence in the domestic
currency (due to success in bringing inflation under control), which encourages
households and other economic agents to switch to the domestic currency, causing a
decline in velocity and greater monetary deepening (see Figure 12). The marked decline
in V2 from 1999 on may reflect a dishoarding of US dollars and gold as households and
other economic actors increased their participation in the formal banking system.
In a multiple currency economy, declining V1 is consistent with financial sector
development because it signals a portfolio shift away from gold and US dollars towards
the domestic currency. As shown in Figure 6, portfolio shift appears to dominate
movements in V1 during this phase of economic transition, and the observed episodes of
decline in V1 correlates with the period of greater success in inflation control. At the
same time, the rise in V1 from 1994 to 1998 is difficult to interpret, because it is not clear
how much of this rise is attributable to improvements in the payment system (and
corresponds to the decline in V2), and how much is attributable to lack of confidence in
the value of the domestic currency. The observed decline in V1 during the period from
1999 to 2003 may reflect greater growth in the informal economy that is not recorded as
GDP by the government statistical office, given that during this period the growth rate of
currency outside banks averaged 28 percent while the nominal GDP growth rate averaged
only 11 percent. It may also be that the GDP deflator is underestimated.
The other critical information gap has to do with the provision of domestic credit.
Given the existence of financial repression and credit rationing in the Vietnamese
economy, it is reasonable to assume that a significant portion of interfirm credit is
extended to credit constrained enterprises that would have preferred to receive bank
credit to finance their working capital requirements. However, there are no reliable
estimates of the magnitude of interfirm credit as a percent of aggregate credit creation,22
22 Empirical evidence on interfirm credit is sparse, but what is known indicates that the amount is not trivial. A 2002 survey of 1119 nonstate enterprises found that from 1994 to 2002, 46 percent of credit constrained firms managed to access external funds. Analysis of this survey data also suggests that the informal sector may represent 30 – 35 percent of the credit market (Rand 2004). With respect to firms in the state sector, a 1997 survey of 3000 state-owned enterprises (SOEs) conducted by the Ministry of Finance revealed that on average, accounts payable and accounts receivable represented 35.5 and 17.3 percent respectively of turnover.
VN Monetary Policy – Tu Packard: page 21
and the quality of their accounts receivable (which may pose a significant risk to the
banking system) is not known. For this reason, the central bank is somewhat in the dark
as it attempts to manage aggregate liquidity, and is dependent on a limited set of
indicators to determine if it is on the right track. Complicating this task is the unclear
link between bank credit growth, the inflation rate, and actual borrowing by business
enterprises (see Figure 4) due to the coexistence of formal and informal financial
markets, and the role of interfirm credit. During periods of structural transformation
driven by regulatory change and rapid growth in the range of financial services provided,
the application of standard procedures to assess whether a high rate of credit growth is
indeed inflationary and warrants concern is likely to mislead. Policy analysts need
supplemental information23 to be able to distinguish between a genuine increase in
aggregate credit (due for example to lax monetary or fiscal policy), and change in the
composition of credit due to the increasing formalization of credit (more loans recorded
by the formal banking system) and related decline in lending in the informal sector (fewer
unrecorded loans).
23 The additional information needed are: representative household and enterprise survey data conducted at least once every two years to determine if there has been a significant change in financing source (such as a major shift from borrowing in the informal financial sector to borrowing in the formal financial sector). Other useful information includes changes in financial sector regulations that may affect credit allocation by lending source, and estimates of interfirm credit extended by SOEs that are reported on a regular basis to the Ministry of Finance.
VN Monetary Policy – Tu Packard: page 22
2.1.2 Interest Rate Channel
The interaction between domestic interest rates and the real exchange rate has
powerful effects on output and employment. In an economy with underutilized
resources, a stable and undervalued real exchange rate helps to maintain a low interest
rate environment24, and the combined effect of these two key macro prices (competitive
real exchange rate and low interest rate) should strongly support rapid output and
employment growth if there are no significant bottlenecks on the supply side. Low
interest rates stimulate domestic demand by encouraging private investment, investment
in higher education, and spending on consumer durables. On the supply side, growth of
the capital stock (including human capital stock) through higher net investment supports
expansion of the economy’s productive capacity and increases labor productivity.
The link between the short-term interest rate controlled by the SBV and the
commercial bank lending rate is straightforward, and has direct impact on the activities of
enterprises, particularly SOEs, that borrow in the formal financial sector. The link
between the SBV controlled short-term interest rate and the unobserved lending rate in
the informal financial sector is less clear. Under conditions of credit market
segmentation, financial repression, and credit rationing, the impact of changes in the
interest rate on aggregate demand necessarily follows a circuitous route.
Firms that have access to the formal banking system can operate as financial
intermediaries to credit constrained firms by providing the latter with trade credit. In
other words, they play a role in credit creation through the informal financial market.
Thus, interfirm credit in Vietnam may be considered an imperfect substitute for bank
credit. Nonbank firms that function as intermediaries would be expected to charge an
implicit markup on the interest rate that they are charged by the bank, and this markup
may take the form of covert price discrimination (McMillan and Woodruff 1999). A
tightening of monetary policy, either through the imposition of bank-by-bank credit
ceilings and/or increase in bank lending rates, will increase the borrowing costs of firms
24 The theory of uncovered interest parity (UIP) – that foreign interest income expressed in the domestic currency should equal the domestic interest rate – suggests a strong link between low domestic interest rates and a weak (or competitive) exchange rate.
VN Monetary Policy – Tu Packard: page 23
that receive bank credit. Their higher borrowing costs are then passed on to credit
constrained firms, squeezing the latter’s ability to raise sufficient working capital to
finance their operations, with predictably negative effects on firm output, profitability,
and investment spending.
The gradual decline in the share of public investment in gross capital formation25, and
corresponding rise in the share of enterprise (and household) investment, suggests that
interest rate movements are gradually having a stronger impact on the real economy26.
This change in the composition of investment spending also indicates that a gradual
flattening of the IS curve has been taking place during the period of structural
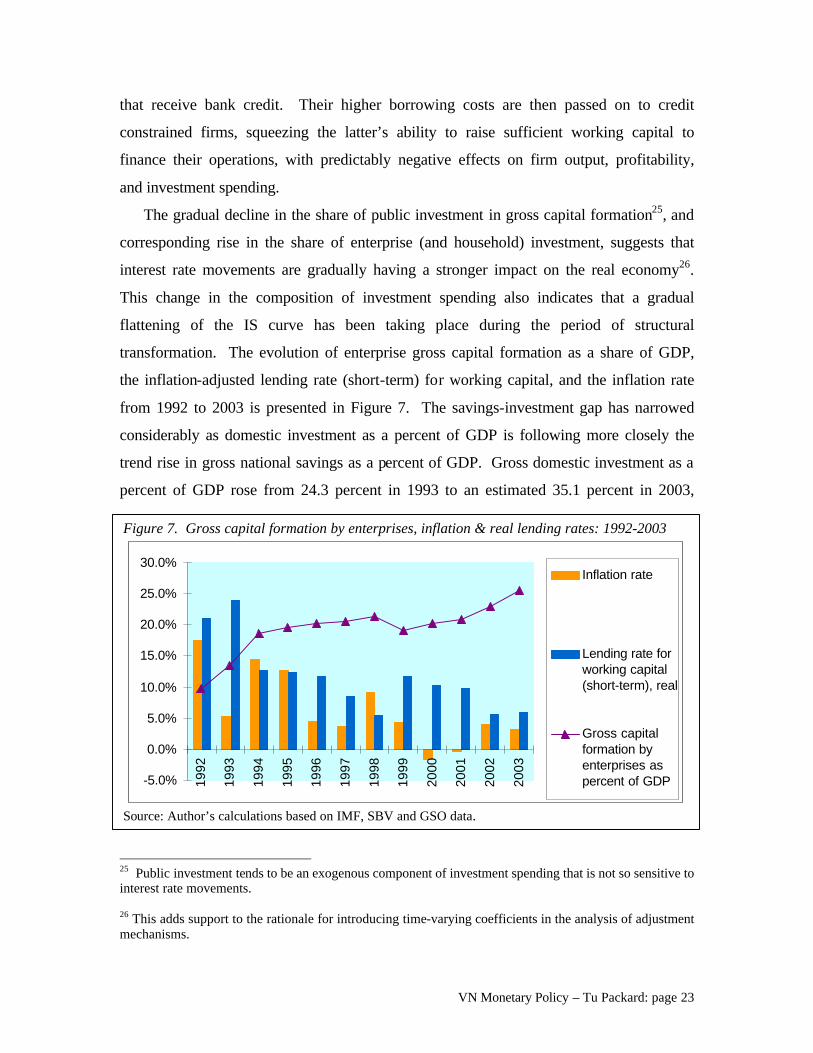
transformation. The evolution of enterprise gross capital formation as a share of GDP,
the inflation-adjusted lending rate (short-term) for working capital, and the inflation rate
from 1992 to 2003 is presented in Figure 7. The savings-investment gap has narrowed
considerably as domestic investment as a percent of GDP is following more closely the
trend rise in gross national savings as a percent of GDP. Gross domestic investment as a
percent of GDP rose from 24.3 percent in 1993 to an estimated 35.1 percent in 2003,
25 Public investment tends to be an exogenous component of investment spending that is not so sensitive to interest rate movements. 26 This adds support to the rationale for introducing time-varying coefficients in the analysis of adjustment mechanisms.
Figure 7. Gross capital formation by enterprises, inflation & real lending rates: 1992-2003
-5.0%
0.0%
5.0%
10.0%
15.0%
20.0%
25.0%
30.0%
1992
1993
1994
1995
1996
1997
1998
1999
2000
2001
2002
2003
Inflation rate
Lending rate forworking capital(short-term), real
Gross capitalformation byenterprises aspercent of GDP
Source: Author’s calculations based on IMF, SBV and GSO data.
VN Monetary Policy – Tu Packard: page 24
while gross national savings as a percent of GDP rose from 12.2 percent to 32.6 percent
over the same period (World Bank 2004).
The graphical presentation of the data conveys the impression that during the early
reform years, institutional and structural factors played an even more important a role
than macroeconomic prices such as inflation and interest rates in determining enterprise
fixed asset investment as a share of GDP. Despite high real lending rates in 1992 and
1993, enterprise gross capital formation rose sharply from a very low base in response to
a more favorable business environment associated with market-oriented reforms and
stabilization of the macroeconomy. From 1995 to 1998, the increase in enterprise
investment as a share of GDP rose more slowly (finally dipping in 199927 due to the
effects of the Asian financial crisis), despite a decline in real lending rates during that
period. From 1999 on, gross capital formation by enterprises as a share of GDP has risen
more rapidly as real lending rates have declined (in other words, both variables are now
moving in the right direction relative to each other).
More research is needed to examine the hypothesis that the transmission lag of
interest rate movements on the real economy may be longer than previously thought28.
One reason for the longer lag is that the main source of financing for gross capital
formation by nonstate enterprises is retained earnings (due to credit constraints and the
undeveloped state of financial markets), which is a function of enterprise profitability and
the firm’s growth prospects, and therefore indirectly a function of aggregate demand.
27 I estimate that enterprise gross capital formation may have fallen by about 6.6 percent in real terms in 1999. There are no official estimates of enterprise investment (defined as the sum of investment by state, non-state and foreign invested enterprises). The GSO estimates total gross capital formation without disaggregating public spending on infrastructure from investment spending by business enterprises. My preliminary and very approximate estimate of enterprise investment is derived from subtracting state capital expenditure from gross capital formation (all in nominal terms), and assuming that its share of nominal GDP would be the same as its share of real GDP (in other words, I do not account for changes in relative prices that may affect share estimates). This approach has important limitations because private investment is likely to be underestimated by the government, which means that total gross capital formation may be underestimated. The reason: private enterprises have a strong incentive to avoid disclosing information about their activities to officials to reduce their tax exposure and to avoid the attention of rent-seeking officials (Packard and Thurman 1996). 28 For this reason, lagged variables should be introduced in analyzing the relationship between interest rate movements and real variables. According to the IMF, the SBV considers the transmission mechanism of interest rates on inflation to be weak and slow because its indirect instruments are not very effective due to the highly segmented and illiquid government securities market (IMF 2004).
VN Monetary Policy – Tu Packard: page 25
The inelasticity of nominal dong interest rates (see Section 1.2) is a puzzle since the
SBV has liberalized interest rates. Other political forces may be at work to pressure the
SOCBs to keep rates at concessional levels. The narrow spread between deposit and
lending rates is hurting their profitability.
VN Monetary Policy – Tu Packard: page 26
2.1.3 Exchange Rate Channel and Determinants of Net Foreign Assets
A stable and competitive real exchange rate (RER) not only helps to maintain low
interest rates, but it also affects key relative prices (between tradable and nontradable
goods, capital goods and labor, and indirectly on exports and imports through
intermediate input and capital goods costs). These are the primary channels for the RER
to influence aggregate demand and resource allocation (Frenkel and Taylor 2005).
The full impact of the central bank’s exchange rate policy29 on the real economy is
not easily determined because we do not know how the growth of monetary aggregates
are actually affected by Vietnam’s informally pegged exchange rate regime. The SBV
does not provide information on its interventions in the foreign exchange market30 and
there is no explicit sterilization policy. An examination of the detrended growth path31 of
net foreign assets, net domestic assets, and M2 suggests that the authorities may have
engaged in some sterilization, but there is no clear pattern that would suggest a
systematic effort to sterilize. This absence of systematic sterilization does not appear to
have a negative impact on monetary aggregates as the growth rate of M2 has not been
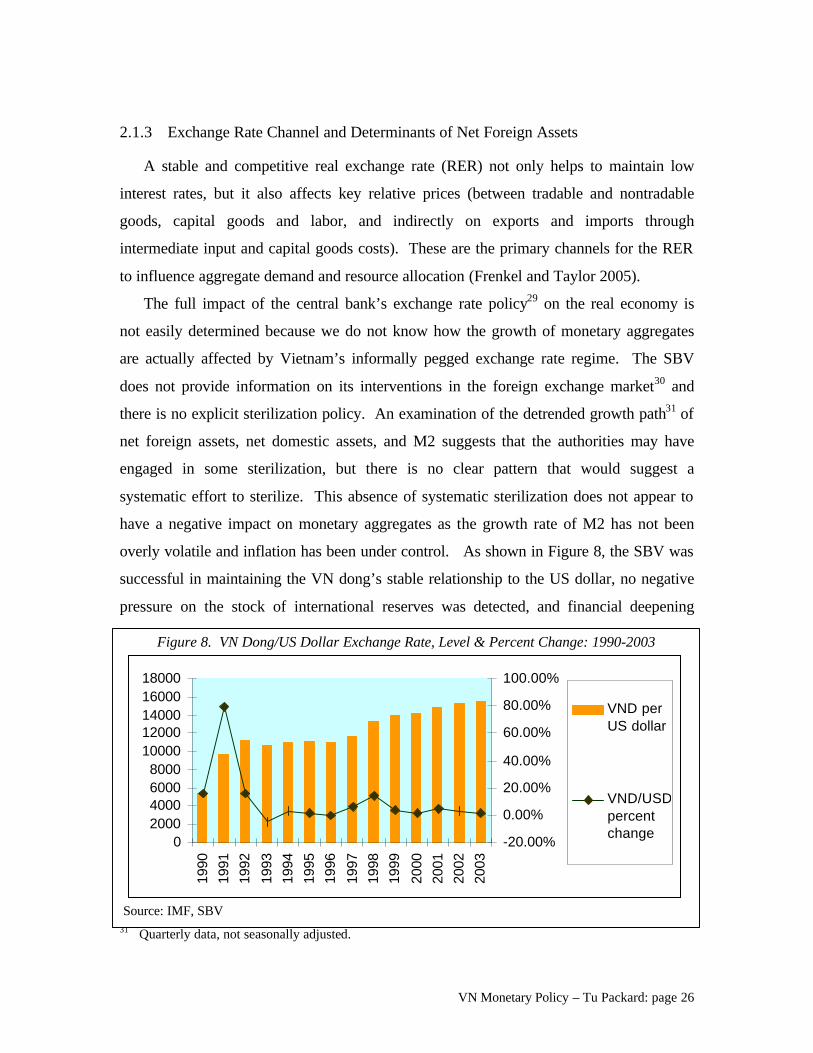
overly volatile and inflation has been under control. As shown in Figure 8, the SBV was
successful in maintaining the VN dong’s stable relationship to the US dollar, no negative
pressure on the stock of international reserves was detected, and financial deepening
29 The SBV’s policy has been to maintain a stable relationship vis-à-vis the U.S. dollar, while permitting a gradual depreciation in an effort to balance the need for export competitiveness with the need to reassure domestic currency holders of the Vietnamese dong’s integrity as a store of value. 30 For this reason, it is difficult to determine whether there is upward or downward pressure on the domestic currency. 31 Quarterly data, not seasonally adjusted.
Figure 8. VN Dong/US Dollar Exchange Rate, Level & Percent Change: 1990-2003
02000400060008000
1000012000140001600018000
1990
1991
1992
1993
1994
1995
1996
1997
1998
1999
2000
2001
2002
2003
-20.00%
0.00%
20.00%
40.00%
60.00%
80.00%
100.00%
VND perUS dollar
VND/USDpercentchange
Source: IMF, SBV
VN Monetary Policy – Tu Packard: page 27
expanded rapidly from 1999 on (see Figure 12), which indicates growing confidence in
the domestic currency.
Using monthly data from 1992 to 1999, a CIEM (government research institute) study
employed VAR models with error correction terms to study the relationship between
money, prices, and output (Vo Tri Thanh et al. 2001). The actual variables used were
currency outside banks, M1, M2, the consumer price index (CPI), the interbank exchange
rate, and industrial output in real terms. The study found that changes in monetary
aggregates did not appear to have predictive power regarding the future movement of
inflation or output growth (this is not surprising, for reasons explained in Section 2.1.1).
Instead, the results from the VAR models suggest that money growth responded to past
movements in inflation and output, indicating that money supply was passive
(endogenous) during that period. However, the interbank exchange rate was found to
contain significant advance information on the evolution of output. For this reason, an
important monetary variable that is likely to influence inflation and output growth may be
net foreign assets, which should be included in the VAR analysis.
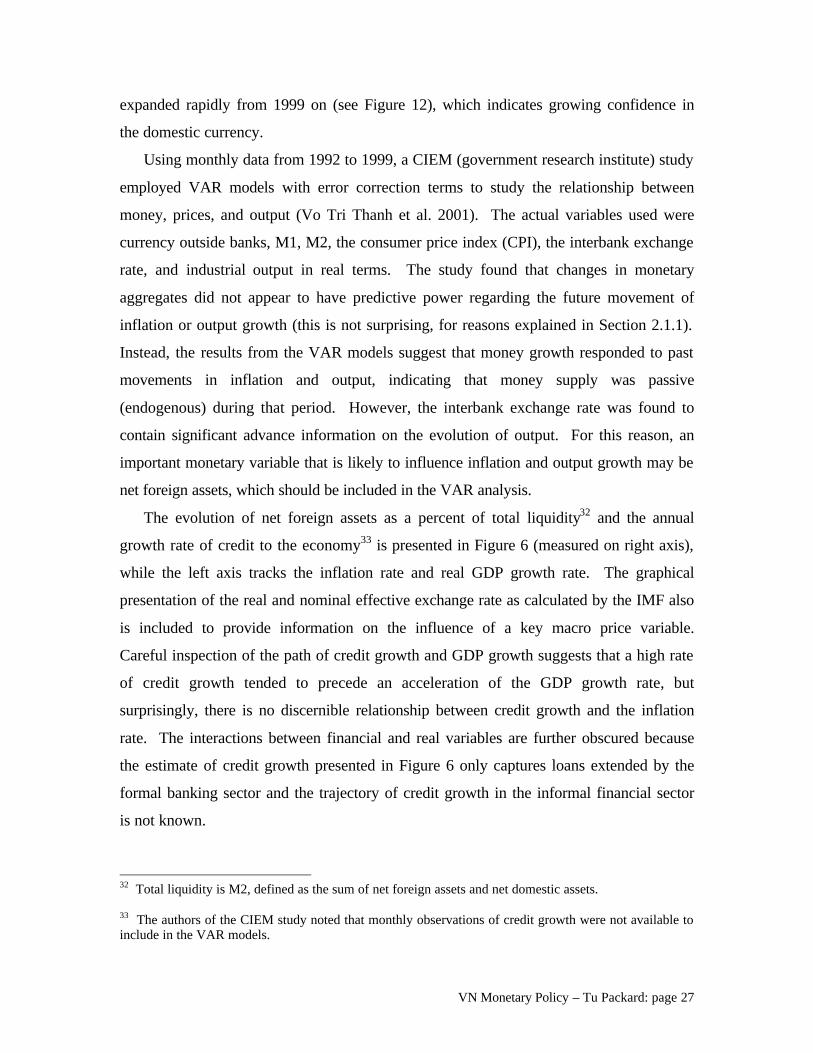
The evolution of net foreign assets as a percent of total liquidity32 and the annual
growth rate of credit to the economy33 is presented in Figure 6 (measured on right axis),
while the left axis tracks the inflation rate and real GDP growth rate. The graphical
presentation of the real and nominal effective exchange rate as calculated by the IMF also
is included to provide information on the influence of a key macro price variable.
Careful inspection of the path of credit growth and GDP growth suggests that a high rate
of credit growth tended to precede an acceleration of the GDP growth rate, but
surprisingly, there is no discernible relationship between credit growth and the inflation
rate. The interactions between financial and real variables are further obscured because
the estimate of credit growth presented in Figure 6 only captures loans extended by the
formal banking sector and the trajectory of credit growth in the informal financial sector
is not known.
32 Total liquidity is M2, defined as the sum of net foreign assets and net domestic assets. 33 The authors of the CIEM study noted that monthly observations of credit growth were not available to include in the VAR models.
VN Monetary Policy – Tu Packard: page 28
The trend appreciation of the nominal effective exchange rate from 1995 to early
1998 overlaps with the rising share of net foreign assets as a percent of total liquidity
(from 1994 to 2000). This change in the relative price of tradables to nontradables
caused a slowing of export growth, made imports more attractive, and brought down the
GDP growth rate34 as well as credit growth. The combined effect of exchange rate
appreciation and slower GDP growth rate helped to bring down the inflation rate, which
stood at over 12 percent in 1995 and fell to a deflationary –1.6 percent in 2000 and –0.4
percent in 2001.
34 The contractionary effects of the 1997-98 Asian financial crisis on Vietnam’s exports and foreign direct investment (FDI) also should be noted.
Figure 9. Evolution of Net Foreign Assets,Credit to the Economy, Inflation and GDP.
0.0%
10.0%
20.0%
30.0%
40.0%
50.0%
60.0%
1992
1993
1994
1995
1996
1997
1998
1999
2000
2001
2002
2003
-5.0%
0.0%
5.0%
10.0%
15.0%
20.0%Net foreignassets % of M2
Credit to theeconomy, annualgrowth rateInflation rate
Real GDP,annual growthrate
Source: Author’s calculations based on data from the IMF and SBV.
VN Monetary Policy – Tu Packard: page 29
From 2000 on, the composition of total liquidity changed due largely to changes in
the balance sheets of deposit money banks (DMBs). The growth of net domestic assets
(mainly domestic credit) significantly outpaced the growth of net foreign assets. A
breakdown of the composition of net foreign assets indicates that the SBV’s net foreign
assets have continued to increase sharply, but this has been offset by steep declines in net
foreign assets held by the DMBs. The reason for this shift: the DMBs have repatriated
foreign currency assets previously held in offshore financial institutions in response to the
positive spread between the rate offered by the SBV and international interest rates which
currently offer very low yields (IMF 2004).
The decomposition of liquidity is presented in Figure 9. It shows that both net
foreign assets and net domestic assets have been rising rapidly. The main contributors to
rising foreign assets are worker remittances, remittances from overseas Vietnamese35
(which eventually show up in the form of hard currency reserves held by commercial
banks), foreign direct investment (FDI), and ODA. These four categories of foreign
financial inflows are influenced in various ways by government policies and regulations
(including those issued by the SBV) and have strong effects on the real economy.
Similar to other developing countries, remittance inflows have become a primary
source of foreign currency earnings for Vietnam. According to a deputy governor of the
SBV36, remittances have risen dramatically, from USD 35 million in 1991 to USD 2.3
billion in 2003 (to put this amount in perspective, it is somewhat less than the 2003 trade
balance deficit of USD 2.5 billion, and represent about 11.5 percent of total merchandise
exports). He estimated that it jumped to USD 3.2 billion in 2004, with Ho Chi Minh City
receiving over half (nearly USD 1.85 billion). There are two different estimates for gross
FDI inflows in 2003: the MPI estimate is USD 2.667 billion, and the IMF estimate (based
on foreign equity inflows plus foreign borrowings by joint ventures reported by the SBV)
35 Remittances are sent by ethnic Vietnamese living abroad and by Vietnamese migrant workers whose foreign stay is mainly temporary. The number of migrant workers has increased because the government adopted policies to promote labor exports. It is estimated that about 50,000 workers were sent overseas to work in 2001 and worker remittances is estimated to exceed USD 1.25 billion, making labor one of Vietnam’s key exports. More research is needed to assess the gender breakdown of migrant workers and possible gender aspects of remittance inflows. 36 Deputy Governor Tran Minh Tuan’s estimates were reported in Vietnam News, January 21, 2005 (Source: http://www.vneconomy.com.vn/eng/article_to_print.php?id=050121141012.
VN Monetary Policy – Tu Packard: page 30
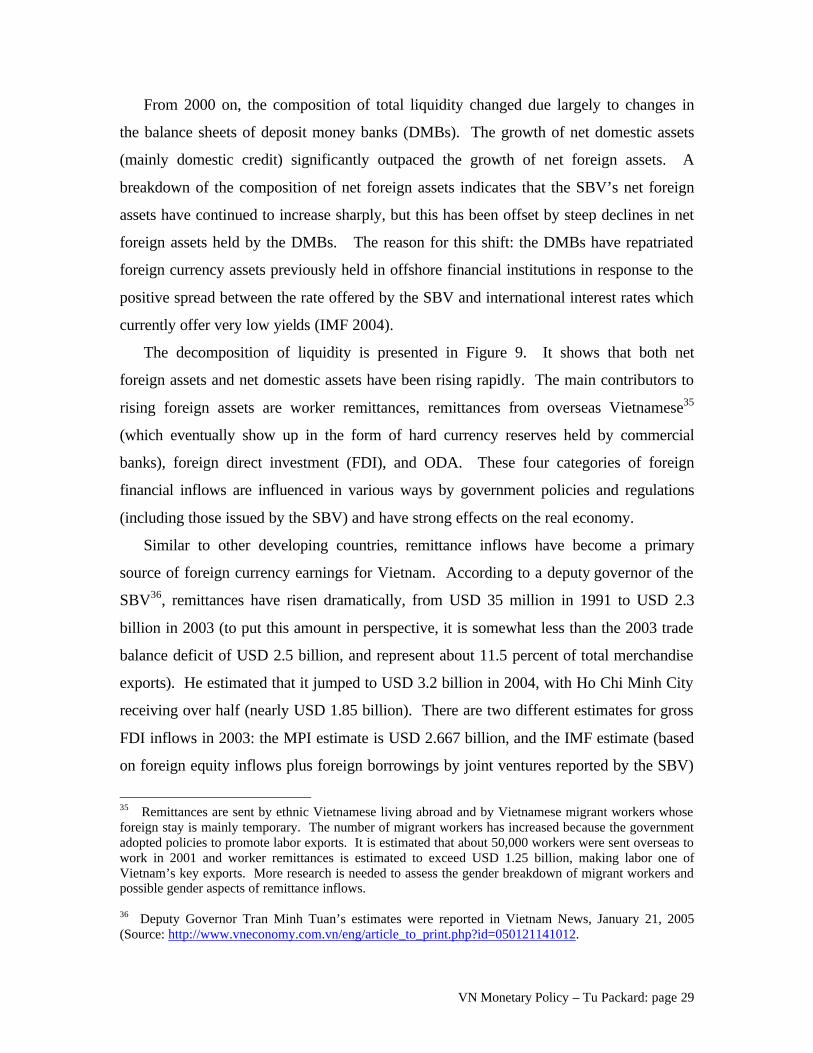
is USD 1.829 billion (IMF 2004a). Net official transfers in 2003 are estimated at USD
139 million and ODA loans at USD 1.258 billion.
Worker remittances depends on the number of migrant workers, which in turn is
determined by government policies, human capital development involving specific labor
skills, and economic conditions in host countries. Remittances by overseas Vietnamese
are influenced by international perceptions of political conditions in Vietnam, the number
of overseas Vietnamese visiting their homeland37, state policies on remittances from
overseas Vietnamese38 and their other economic activities in Vietnam, and regulations
governing money transfers from abroad39. How much of the remittance money is held in
37 It is widely assumed that there is a strong correlation between the number of overseas Vietnamese visitors to Vietnam and estimates of remittances from overseeas Vietnamese. Thus, the authorities estimated that some 203,660 overseas Vietnamese returned to their homeland during the first 6 months of 2004, representing a 43 percent increase over the previous year. Banking experts in Vietnam estimate that overseas remittances increased from USD 2.6 billion in 2003 to USD 3.8 billion in 2004 (note that these estimates are higher than the SBV’s estimates). 38 According to Pham Van Tan, Chairman of the East Asia Overseas Remittance Company Executive Board of the East Asia Commercial Joint Stock Bank, the government’s remittance-friendly policies created a competitive environment between banks on the provision of remittance-related services, and led to an increase in the transfer of funds via personal accounts. 39 Government policy affects the flow of remittances through the formal banking sector. This was seen in late 1996 when the government imposed a 5 percent withholding tax on remittances. The remittance inflow switched to informal channels and flows through the formal banking sector fell sharply. It only rose again after the government rescinded the tax in February 1997 (Haughton ).
Figure 10. Evolution of Net Foreign Assets and Net Domestic Assets: 1989-2003
0
100
200
300
400
500
1989
1991
1993
1995
1997
1999
2001
2003
VN
D t
rilli
on
s
Net Fo reign Assets Net D o m e s tic Asse ts
Source: IMF, SBV
VN Monetary Policy – Tu Packard: page 31
the formal banking system, and how much in the informal financial sector or under
mattresses, depends in part on expectations regarding the stability of the VND/USD
exchange rate and the spread between the bank forex and parallel market rate, and in part
on the state of financial sector development. The impact of the remittances on the real
economy flows through two channels: household spending on real estate, durables, and
non-durables, and enterprise spending on working capital and fixed assets. Thus,
remittances are believed to be an important source of financing that is helping to fuel the
growth of private investment. More research is needed to quantify this to gauge its
signficance as a driver of domestic private investment.
Figure 11. FDI Disbursments & Investment by Ownership Sector: 1995-2003
0.0%
2.0%
4.0%
6.0%
8.0%
10.0%
12.0%
14.0%
1995 1996 1997 1998 1999 2000 2001 2002 2003
0
500
1000
1500
2000
2500
3000
3500
US
D m
illio
n
SOE investment, % ofGDP
Non-state investment, %of GDP
FIE investment, % ofGDP
FDI disbursement - govtestimate
FDI disbursement - IMFestimate
Figure 12. SOE Investment and Growth of Credit to SOEs: 1995-2003
0.0%
2.0%
4.0%
6.0%
8.0%
10.0%
12.0%
14.0%
1995 1996 1997 1998 1999 2000 2001 2002 2003
0.0%
5.0%
10.0%
15.0%
20.0%
25.0%
30.0%
35.0%
40.0%
45.0%
SOEinvestm entas % ofGDP
Credit toSOEs,annualgrowth
Source: IMF, SBV
VN Monetary Policy – Tu Packard: page 32
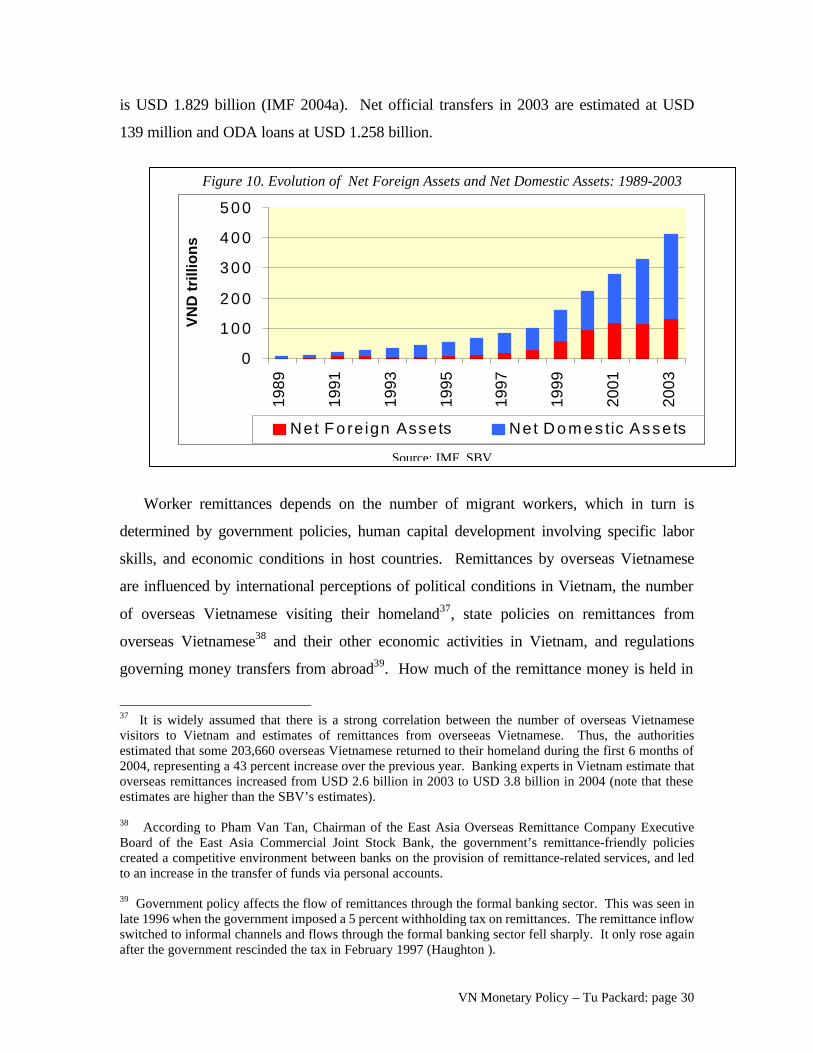
The impact of FDI flows on real variables is easier to track and quantify. Figure 11
compares government and IMF estimates of FDI disbursement from 1995 to 2003 and
changes in the composition of investment as a percent of GDP (current prices).
Noteworthy changes in the composition of investment by ownership sector: the FDI
sector’s investment share was greater than that of the SOE and domestic nonstate sector
in 1995. Since then, the share of investment by SOEs increased more rapidly and
represented 12.9 percent of GDP in 2003. However, there is no clear link with bank
credit allocated to SOEs (see Figure 12). More research is needed to determine the main
sources of finance for SOE investment in fixed capital, and the role of retained earnings
in SOE investment spending. Correlated with the estimated rise in remittance inflows,
the share of domestic nonstate investment also rose to 9.6 percent of GDP in 200340. In
contrast, the FDI sector’s share declined to 6.4 percent, weakly reflecting the pattern of
FDI disbursement during this period.
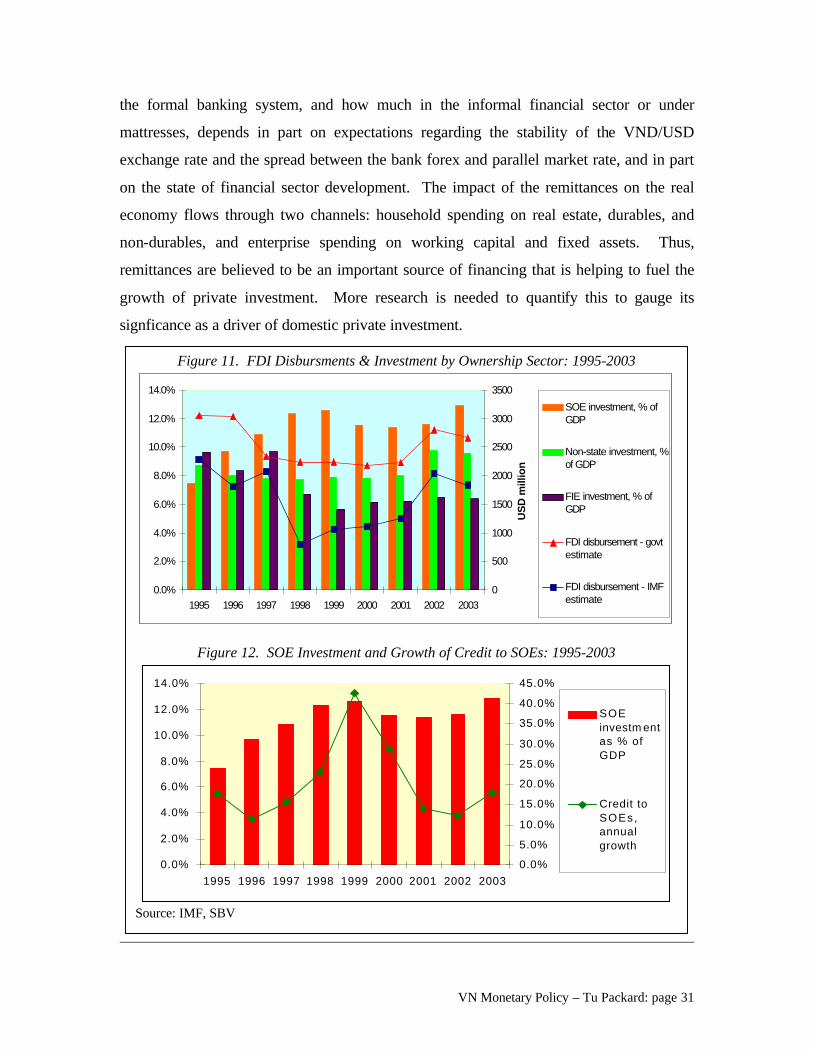
The disaggregation of industrial production by ownership sector is presented in
Figure 13. Although the FIE sector’s share of total investment was shrinking, its share of
total industrial production rose from 25.1 percent in 1995 to 36 percent in 2003,
reflecting the accumulation of past investment spending and experience operating in
Vietnam’s transition economy. The nonstate sector’s share has followed a broad U
40 Clearly, more research is needed to analyze and track the links between remittance inflows and domestic nonstate investment.
Figure 13. Industrial Production by Ownership Sector: 1995-2003
0.0
50000.0
100000.0
150000.0
200000.0
250000.0
300000.0
350000.0
1995 1996 1997 1998 1999 2000 2001 2002 2003
VN
D b
illio
n a
t co
nst
ant
1994
pri
ces
Other NonState
Household sector
Private & Mixed
FIE sector
State
Source: GSO, IMF
VN Monetary Policy – Tu Packard: page 33
curve: it declined from 24.6 percent in 1995 to 21.8 percent in 1999, and then rose again.
More favorable state policies towards the domestic private sector, particularly towards
private enterprises, is probably an important factor in the rise in its share of industrial
output, which reached 24.9 percent in 2003. The rising share of the private and mixed
enterprise sector from 6.4 percent of total industrial production in 1995 to 12.7 percent in
2003, and the declining share of the household sector from 17.6 percent to 11.6 percent
during the same period, reflects state policies that govern the business climate. In
contrast, the state sector’s share fell from 50.3 percent in 1995 to 39.1 percent in 2003,
which is somewhat surprising in light of the strength of SOE investment spending. More
research is needed to determine if this indicates the declining productivity of SOE
investment.
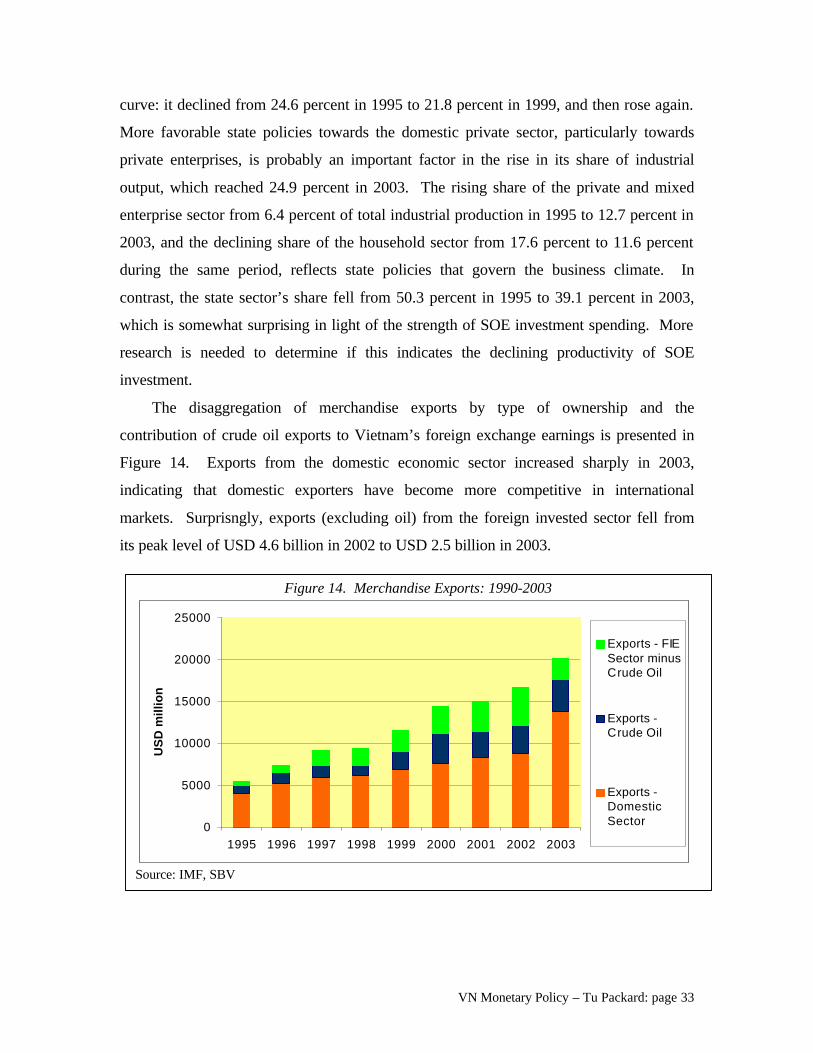
The disaggregation of merchandise exports by type of ownership and the
contribution of crude oil exports to Vietnam’s foreign exchange earnings is presented in
Figure 14. Exports from the domestic economic sector increased sharply in 2003,
indicating that domestic exporters have become more competitive in international
markets. Surprisngly, exports (excluding oil) from the foreign invested sector fell from
its peak level of USD 4.6 billion in 2002 to USD 2.5 billion in 2003.
Figure 14. Merchandise Exports: 1990-2003
0
5000
10000
15000
20000
25000
1995 1996 1997 1998 1999 2000 2001 2002 2003
US
D m
illi
on
Exports - FIESector minusCrude Oil
Exports -Crude Oil
Exports -DomesticSector
Source: IMF, SBV
VN Monetary Policy – Tu Packard: page 34
2.2 Employment and Labor Market Structure
Similar to other developing countries, the main segments of Vietnam’s labor market
are the agricultural and rural sector, the informal urban sector, and the formal urban
sector. The agricultural and/or rural workforce mainly consists of household enterprises,
self-employed and unpaid family workers. It is characterized by a seasonal pattern of
employment. The informal urban sector is largely made up of self-employed workers and
small enterprises. Its main outputs are services and other nontradables. Workers in this
sector have little bargaining power, and have no formal employment contract. The main
characteristics of the agricultural/rural and informal urban sectors are lack of job security
and flexible wages, because legal minimum wage laws are not enforced in these sectors.
In contrast, the formal urban sector is made up of medium and large enterprises including
state enterprises. Workers have formal contracts, and both workers and employers are
subject to labor market regulations including minimum wage laws.
At the present time there are no official estimates of the size of these main
components of the labor market. However it is generally assumed that there is
considerable overlap between the agricultural and/or rural workforce and workers in the
agricultural sector, and between the workforce in the formal urban sector and workers in
the industry and construction sector, and that large numbers of workers in the services
sector form part of the informal urban sector. According to estimates prepared by the
Vietnam Ministry of Labor, Invalids and Social Affairs (2004), as of 2003 about 23.1
million people worked in the agriculture, forestry and aquaculture sectors, 6.7 million
people worked in the industry and construction sectors, and 9.8 million people worked in
the services sector.
The rapid increase in Vietnam’s per capita GDP growth rate during the 1990s is
linked to the trend shift in the country’s employment structure away from the low
productivity/ low wage agriculture sector towards the higher productivity/higher wage
industry, construction and services sectors. In 1996 nearly 69 percent of the labor force
worked in agriculture, but the share has declined to 58.4 percent in 2003. At the same
time, the share of the labor force in the industry and construction sector has risen from
VN Monetary Policy – Tu Packard: page 35
10.9 percent in 1996 to nearly 17 percent in 2003. The share of labor in the services
sector also has risen from 20.2 percent to 24.7 percent during the same period. The
monetary authorities can encourage a continuation of this employment shift towards
labor-using higher productivity sectors of the economy by maintaining a mix of
macroeconomic relative prices consistent with a stable and competitive real exchange
rate (RER). This would strengthen profitability in these sectors which in turn would
stimulate further employment growth.
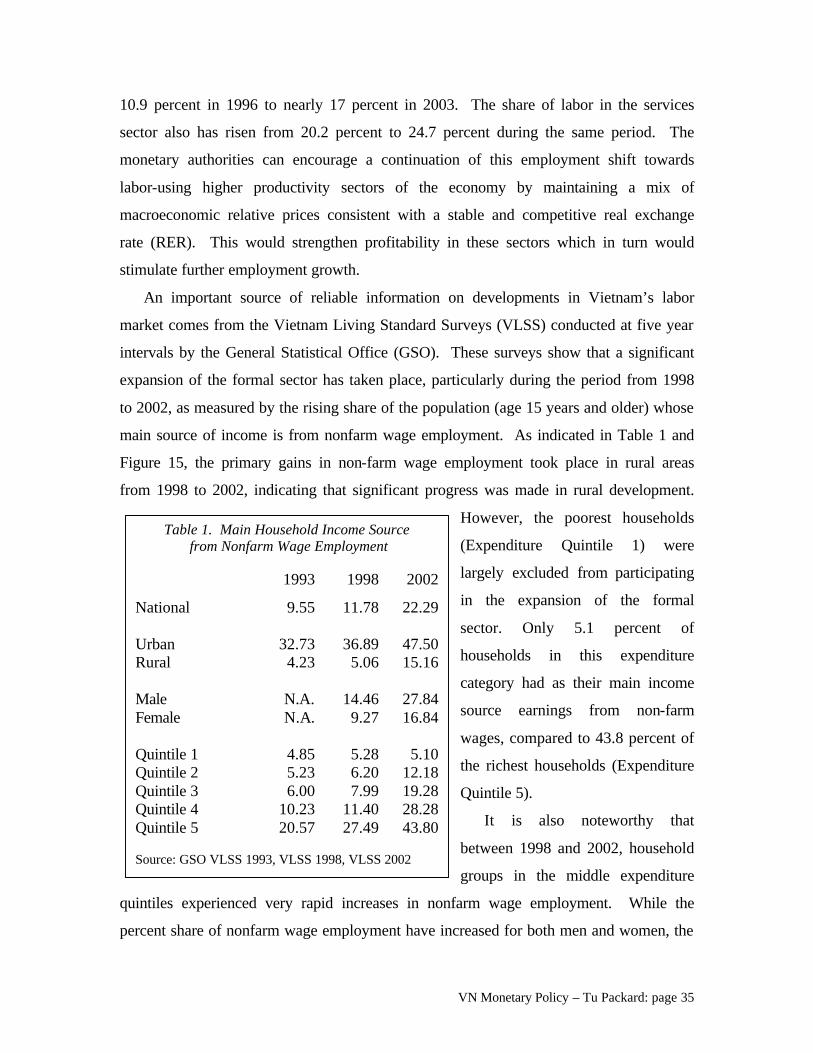
An important source of reliable information on developments in Vietnam’s labor
market comes from the Vietnam Living Standard Surveys (VLSS) conducted at five year
intervals by the General Statistical Office (GSO). These surveys show that a significant
expansion of the formal sector has taken place, particularly during the period from 1998
to 2002, as measured by the rising share of the population (age 15 years and older) whose
main source of income is from nonfarm wage employment. As indicated in Table 1 and
Figure 15, the primary gains in non-farm wage employment took place in rural areas
from 1998 to 2002, indicating that significant progress was made in rural development.
However, the poorest households
(Expenditure Quintile 1) were
largely excluded from participating
in the expansion of the formal
sector. Only 5.1 percent of
households in this expenditure
category had as their main income
source earnings from non-farm
wages, compared to 43.8 percent of
the richest households (Expenditure
Quintile 5).
It is also noteworthy that
between 1998 and 2002, household
groups in the middle expenditure
quintiles experienced very rapid increases in nonfarm wage employment. While the
percent share of nonfarm wage employment have increased for both men and women, the
Table 1. Main Household Income Source from Nonfarm Wage Employment
1993 1998 2002
National 9.55 11.78 22.29
Urban 32.73 36.89 47.50 Rural 4.23 5.06 15.16
Male N.A. 14.46 27.84 Female N.A. 9.27 16.84
Quintile 1 4.85 5.28 5.10 Quintile 2 5.23 6.20 12.18 Quintile 3 6.00 7.99 19.28 Quintile 4 10.23 11.40 28.28 Quintile 5 20.57 27.49 43.80 Source: GSO VLSS 1993, VLSS 1998, VLSS 2002
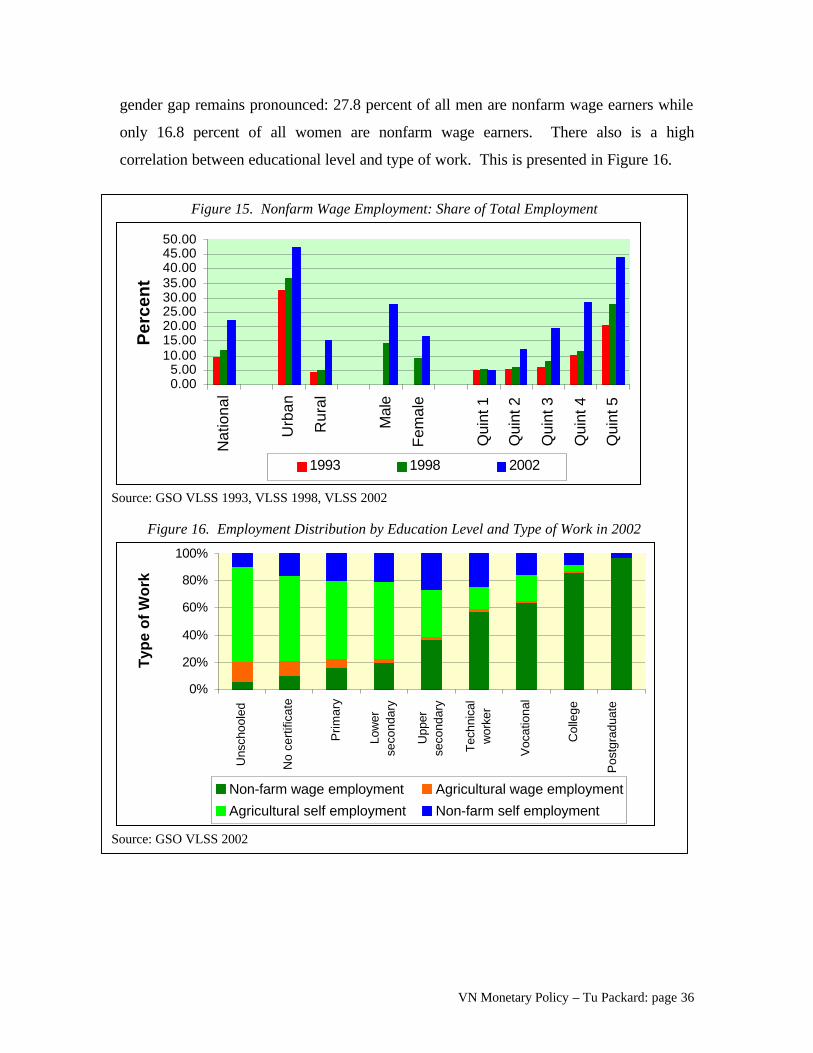
VN Monetary Policy – Tu Packard: page 36
gender gap remains pronounced: 27.8 percent of all men are nonfarm wage earners while
only 16.8 percent of all women are nonfarm wage earners. There also is a high
correlation between educational level and type of work. This is presented in Figure 16.
Figure 15. Nonfarm Wage Employment: Share of Total Employment
0.005.00
10.0015.0020.0025.0030.0035.0040.0045.0050.00
Nat
iona
l
Urb
an
Rur
al
Mal
e
Fem
ale
Qui
nt 1
Qui
nt 2
Qui
nt 3
Qui
nt 4
Qui
nt 5
Pe
rce
nt
1993 1998 2002
Source: GSO VLSS 1993, VLSS 1998, VLSS 2002
Figure 16. Employment Distribution by Education Level and Type of Work in 2002
0%
20%
40%
60%
80%
100%
Uns
choo
led
No
cert
ifica
te
Pri
mar
y
Low
erse
cond
ary
Upp
erse
cond
ary
Tec
hnic
alw
orke
r
Voc
atio
nal
Col
lege
Pos
tgra
duat
e
Ty
pe
of
Wo
rk
Non-farm wage employment Agricultural wage employment
Agricultural self employment Non-farm self employment
Source: GSO VLSS 2002
VN Monetary Policy – Tu Packard: page 37
3 Macroeconomics and Central Bank Institutional Framework
3.1 Issues Surrounding Scope for Inflation Targeting
Although there is interest in inflation targeting (IT) on the part of the SBV, and a
steady stream of international experts did come to Vietnam to conduct seminars on IT for
SBV senior management41, the consensus view holds that at present the conditions to
support a formal IT monetary framework are not met. The reasons are evident (see
Sections 1 and 2) when we consider the four main conditions outlined by the IMF that are
deemed necessary to support such a framework (Carare et al. 2002):
§ The central bank has a clear mandate to make IT the primary objective of
monetary policy and is publicly accountable for meeting this objective.
§ The inflation target will not be subordinated to other objectives and monetary
policy will not be dominated by fiscal priorities.
§ The financial system is developed and stable enough to implement the IT
framework.
§ The central bank has adequate policy instruments to be able to influence inflation.
According to the 1998 Law on the State Bank of Vietnam (SBV), the National
Assembly sets the inflation target, and it is the task of the SBV (and other government
agencies) to meet this target. However, the inflation target does not have priority over
other development objectives such as rapid and sustainable growth, and it is unlikely that
the government would be willing to commit to subordinating exchange rate or
employment objectives to the inflation target. At the same time, it is understood by the
political leadership that keeping inflation under control is a precondition for sustainable
growth. The lesson they have drawn from Vietnam’s experience over the past 20 years is
that the stability of key macro prices (inflation rate, exchange rate, and interest rates) was
necessary to support the very high economic growth rate that was achieved (see Figure
6). For this reason, the authorities consciously adopted prudent macroeconomic policies
to ensure the stability of key macro prices during the Doi Moi period.
41 Among them: Hans Genberg, Edwin Truman,
VN Monetary Policy – Tu Packard: page 38
In the view of various Vietnam specialists, the country’s present stage of
development makes it difficult for the authorities to cleave to the injunction against
allowing fiscal priorities to dominate monetary policy because the government has
limited means to raise revenues. Because financial markets are thin and not well
developed (the government securities market is segmented and illiquid), the SBV has
difficulty implementing monetary policy using market-based indirect instruments to
influence inflation, even though this has long been a declared SBV objective. In
addition, as explained in Sections 1.1 and 2.1, the government is only beginning to build
the necessary foundations (including timely access to a high frequency databank of key
economic and financial variables that are essential for policy analysis) for developing a
“reasonable understanding of the links between the stance of policy and inflation”. As
regards the adequacy of policy instruments, it is doubtful that the coordination of fiscal
and public debt management activities would have the primary goal of supporting the
inflation target above all other national development goals. It is also unlikely that the
government would be willing to subordinate fiscal policy to meet the inflation objective,
especially if the targeted inflation rate results in economic contraction.
[Subsection: organizing focus of SBV monetary policy] Reaction function of the SBV explored: Chart comparing actual interest rates in VN with nominal short-term interest rate it specified under original Taylor rule: it = ðt + r* + 0.5 (ðt - ð*) + 0.5(yt) where: r* is “natural” real interest rate that is consistent with Vietnam’s socio-economic targets. ðt - ð* is 4-quarter moving average of actual inflation in GDP deflator less a target rate. ð* is target rate set by National Assembly. yt is percent deviation of real GDP from an estimate of its potential level. Issues regarding GDP gap in VN problematic: notion of full employment or full capacity GDP may be feasible for formal sector (we can start with Cobb-Douglas type production function) but for informal sector Lewis type model with unlimited supplies of labor may be more appropriate.
VN Monetary Policy – Tu Packard: page 39
IMF estimate of potential GDP in VN relies on ad-hoc application of Hodrick-Prescott filter to annual GDP data in constant 1994 prices over period 1988-98. Estimated current growth rate of potential GDP is sensitive to endpoints of data series & hence is given as a range (IMF 1999 p. 7). Use of Hodrick-Prescott filter may not be appropriate for estimating VN’s potential GDP because of implicit assumption that the nonstationary time trend extracted from observed GDP is a good proxy for potential GDP. What is the right inflation measure to use and what components of inflation should be most closely watched? SBV formulation of monetary policy: Is there a case for lengthening the time horizon over which SBV tries to achieve its inflation target (because targeting inflation over too short a horizon may result in high output losses)? Does SBV target inflation over medium term? Is there a target band? Does SBV monetary policy give equal weight to inflation and output variability? Should weight also be given to issue of variability of the real exchange rate? Is there a tradeoff between inflation variability and output variability? Discussion of chart on variability of inflation rate, real interest rate, real exchange rate, industrial production, and other measures of real output. SBV exchange policy: how much importance is given to policies to lower risk of high exchange rate volatility? According to Calvo and Reinhart (2001), pass-through effect of high exchange rate volatility to domestic prices can destabilize financial sector. SBV plan to phase out dollarization: SBV understands risks of dollarization and in low- key fashion has been implementing plan to gradually phase it out. Formulation of SBV monetary policy to take into account external supply shocks and significant changes in international exchange rates and interest rates: impact of cross exchange rate movements on Vietnam’s tradables sector (including possible revaluation of Chinese yuan), long term movements in key US dollar cross rates, rising world interest rates, etc. Assessment of financial soundness indicators: non-performing loans, capital ratios, exposure to exchange rate or interest rate risks.
VN Monetary Policy – Tu Packard: page 40
3.2 Identification of Linkages Between Macro Prices IMF analysis of inflation dynamics in Vietnam § Food & foodstuffs account for 48 percent of CPI basket § Trajectory of food prices different from nonfood prices § Use of nonfood price as proxy for “core” inflation? § Oil prices affect CPI mainly through transportation, housing and construction
materials costs § Significant degree of persistence due to sluggish adjustment of inflationary
expectations § Seven-variable recursive VAR approach to enable identification of shocks from
external and policy developments; structural shocks recovered from VAR residuals using Cholesky decomposition of variance-covariance matrix. The seven variables are: international oil prices, international rice prices, industrial production, exchange rate, monetary or credit conditions, import prices, consumer prices.
§ 4 key sources of inflation identified (Loungani and Swagel 2001) o Underlying fiscal imbalances à excessive money creation or exchange
rate depreciation associated with balance of payments crisis o Macroeconomic overheating o Supply-side cost shocks o Inertial component due to sluggish adjustment of inflationary expectations
§ Data: monthly CPI; monthly industrial production index available from 1995 § VAR estimated from January 1995 to March 2003 in log differences with 3 lags;
variance decompositions computed next; assumption: causality runs from external shocks to output, exchange rate, to money and prices, with degree of endogeneity increasing. Recursive structure precludes feedback of prices to exchange rates and monetary policy within one time perid. Alternative measures of nominal exchange rate (bilateral versus nominal effective), monetary conditions (reserve money and broad money), and consumer prices (headline and core inflation).
§ Own innovations play large role in variation of import prices, but international oil prices and exchange rate changes account for nearly 30 percent of variation each; oil price and exchange rate shocks show a complete exchange rate pass-through to import prices within a few periods but have a modest exchange rate pass-through to consumer prices. A one percent shock to exchange rate à quarter percent change in headline inflation within a year with very little further pass-through in subsequent periods (this is in mid-to-lower range of previous studies for developing countries). This modest pass-through may be due to imperfect competition, low weight of importables in consumption basket and distribution costs which comprise large share of nontraded inputs; institutional factors such as administered prices and state trading companies also reduce impact of exchange rate changes.
§ More consumer-oriented retail price index less influenced by changes in exchange rate due to large weight on non-tradeables in CPI.
VN Monetary Policy – Tu Packard: page 41
§ Core inflation susceptible to oil price shocks and exchange rate changes; broad money growth has modest impact on both core inflation and headline inflation; own innovations to core inflation seem more persistent than headline inflation.
§ Role of monetary aggregates on CPI not robust or significant providing little guide to monetary policy. No cointegrating relationship was found between monetary aggregates and CPI over sample period.
VN Monetary Policy – Tu Packard: page 42
4 Investigating Alternatives to Inflation Targeting
4.1 Identifying Alternatives in Terms of “Real” Targets Monetary policy should be consistent with and support Vietnam’s national priorities in order to create good jobs for growing labor force (1.2 million new entrants per year). As noted in Section 1.1, the priorities are: rapid and sustainable growth, modernization, industrialization, and poverty reduction. Virtuous circle: strong economy characterized by balanced and sustainable growth creates the necessary conditions that strengthen the effectiveness of monetary policy instruments, which in turn supports further economic growth and development. Detailed articulation of national development strategy (more meat, less vagueness) need to be laid out in order to determine what should be the (realistic) contribution of monetary policy and to identify appropriate real targets. In other words, monetary policy should have firm roots in Vietnam’s development strategy and it should be formulated in rigorous fashion (this also is needed to anchor the national development strategy in reality). To support this process, it would be useful to employ several different models of the Vietnamese economy (structuralist, structural macroeconomic, CGE, single-index models of coincident economic indicators using cointegration techniques along the lines described by Stock and Watson). This would enable us to consider several versions of the Vietnamese economic story, the different assumptions underlying each version, and the different outcomes they produce. A well articulated economic system would help policymakers visualize how the growth process is made possible, what policy changes are needed to create conditions for sustained high growth rates, how this can be achieved, and the key indicators that should be monitored to gauge progress (Packard and Thurman 1996). This exercise includes identifying what should be the SBV’s real targets. Example of possible indicators to monitor progress in meeting development goals: § Proportion of wage earners in total employment (proxy to estimate size of modern
sector in Vietnam) § Share of medium-to-large enterprise sector in gross industrial output § Share of non-state sector formal employment in total employment § Growth rate of wage employment
Promising avenue to investigate: how can monetary policy be used to support non-inflationary strategies to accelerate economic development and increase incomes of poor households? Strategies and implications for monetary policy: § Strategy to address problem of the “missing middle” (UNIDO 2004): development of
medium-to-large enterprise sector is critical to jump-start industrialization process in Vietnam (this is an example of describing a specific development plan to help
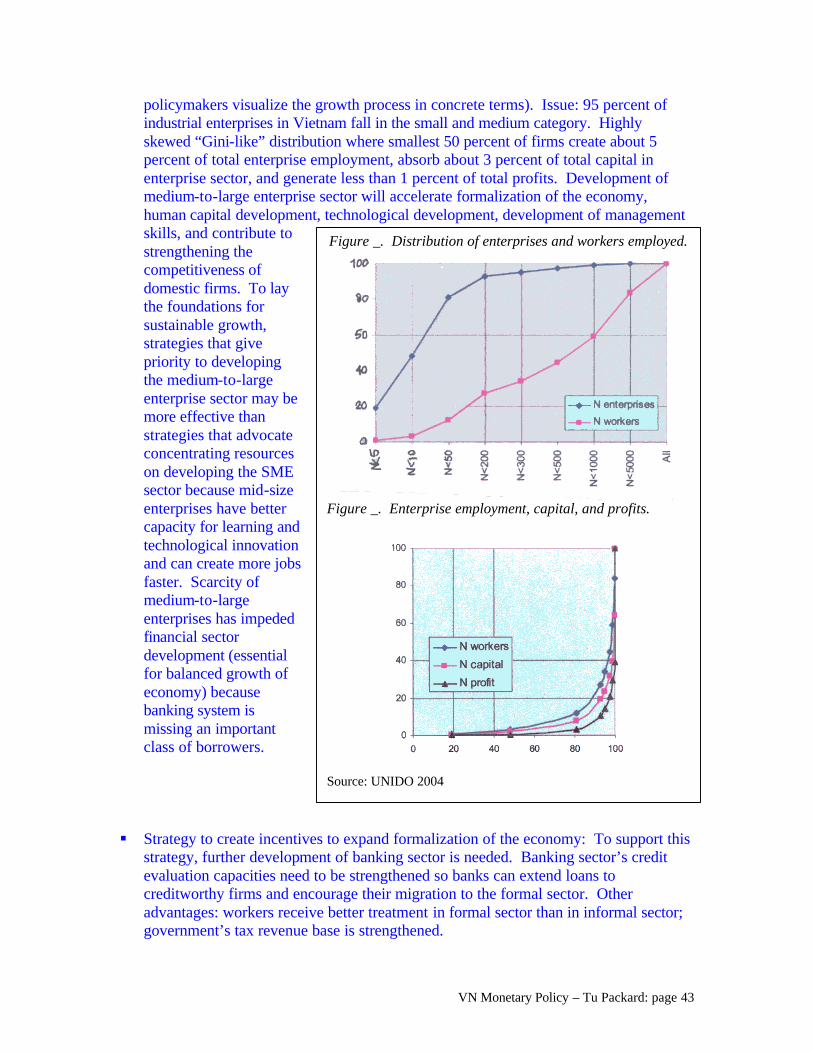
VN Monetary Policy – Tu Packard: page 43
policymakers visualize the growth process in concrete terms). Issue: 95 percent of industrial enterprises in Vietnam fall in the small and medium category. Highly skewed “Gini-like” distribution where smallest 50 percent of firms create about 5 percent of total enterprise employment, absorb about 3 percent of total capital in enterprise sector, and generate less than 1 percent of total profits. Development of medium-to-large enterprise sector will accelerate formalization of the economy, human capital development, technological development, development of management skills, and contribute to strengthening the competitiveness of domestic firms. To lay the foundations for sustainable growth, strategies that give priority to developing the medium-to-large enterprise sector may be more effective than strategies that advocate concentrating resources on developing the SME sector because mid-size enterprises have better capacity for learning and technological innovation and can create more jobs faster. Scarcity of medium-to-large enterprises has impeded financial sector development (essential for balanced growth of economy) because banking system is missing an important class of borrowers.
§ Strategy to create incentives to expand formalization of the economy: To support this
strategy, further development of banking sector is needed. Banking sector’s credit evaluation capacities need to be strengthened so banks can extend loans to creditworthy firms and encourage their migration to the formal sector. Other advantages: workers receive better treatment in formal sector than in informal sector; government’s tax revenue base is strengthened.
Figure _. Distribution of enterprises and workers employed.
Figure _. Enterprise employment, capital, and profits.
Source: UNIDO 2004
VN Monetary Policy – Tu Packard: page 44
§ Strategy to create conditions to support lowest possible domestic interest rates and
improve solvency of domestic financial institutions. § Strategy to help core industry sectors achieve critical mass: sectors where Vietnam
has existing or potential comparative advantages include rubber, light manufacturing, seafood, food processing, information technology, chip manufacturing (low-end). In these promising sectors, upstream and downstream linkages need to be developed
Review of existing instruments of monetary policy and transmission links. Additional instruments to consider and its transmission links: § Sustainable provision of banking services aimed at increasing income and output
in priority sectors. What should be stance of monetary policy in coming period of even more rapid international economic integration? Possible negative scenario: § Compliance with US-VN Bilateral Trade Agreement and WTO rules will increase
pressure on import substitution industries and financial sector firms. § Greater financial risk to banking sector from highly leveraged firms in import
substitution and financial industries that suffer losses due to intensified competition.
§ Sharp decline in tax payments by financially troubled SOEs increases risk that government’s fiscal position will be weakened. Fiscal uncertainty associated with larger fiscal deficit and possible monetization of debt would increase inflation pressure (pass-through from debt monetization to inflation during 1985-98 period still a vivid nightmare for many Vietnamese).
VN Monetary Policy – Tu Packard: page 45
5 References Carare, Alina, Andrea Schaechter, Mark Stone and Mark Zelmer. 2002. “Establishing Initial Conditions in Support of Inflation Targeting.” IMF Working Paper WP/02/102. June 2002. Collins, Sean and Pierre Siklos. 2001. “Optimal Reaction Functions, Taylor’s Rule and Inflation Targets: The Experiences of Dollar Bloc Countries.” Epstein, Gerald. 2003. “Alternative to Inflation Targeting Monetary Policy for Stable and Egalitarian Growth: A Brief Research Summary.” PERI Working Paper No. 62. Frenkel, Roberto and Lance Taylor. 2005. “Real Exchange Rate, Monetary Policy and Employment: Economic Development in a Garden of Forking Paths.” Paper prepared for a High-Level United Nations Development Conference. New York, 14-15 March 2005. Genberg, Hans. 2002. “Inflation Targeting – the Holy Grail of Monetary Policy?” Hong Kong Institute of Monetary Research Working Paper No. 2/2002. January 2002. Hauskrecht, Andreas and Nguyen Thanh Hai. 2004. “Dollarization in Viet Nam.” International Monetary Fund. 1998. “Vietnam: Selected Issues and Statistical Annex.” IMF Staff Country Report No. 98/30. April 1998. International Monetary Fund. 1999. “Vietnam: Selected Issues.” IMF Staff Country Report No. 99/55. July 1999. International Monetary Fund. 2003. Statement by Sean Nolan (Division Chief, IMF Asia and Pacific Department) at the Consultative Group Meeting for Vietnam. December 2003. International Monetary Fund. 2004a. “Staff Report for the 2004 Article IV Consultation.” November 2004. International Monetary Fund. 2004b. “China’s Growth and Integration into the World Economy. Prospects and Challenges.” IMF Occasional Paper 232. 2004. Kovsted, Jens, John Rand, Finn Tarp, Nguyen Dinh Tai, Nguyen Van Huong, and Ta Minh Thao. 2002. “Financial Sector Reforms in Vietnam: Selected Issues and Problems.” CIEM/NIAS Discussion Paper No. 0301. Hanoi, Vietnam. Le Xuan Nghia. 2005. “Orientations of the Banking Sector Development Strategy towards International Integration.” Paper presented at the January 18, 2005 Seminar on “Preparation for the 2006-2010 Five Year Social Economic Development Plan in the Banking Sector”.
VN Monetary Policy – Tu Packard: page 46
McCarty, Adam. 2001. “Microfinance in Vietnam: A Survey of Schemes and Issues.” DFID report prepared by Mekong Economics Ltd. April 2001. McMillan, John and Christopher Woodruff. 1999. “Interfirm Relationships and Informal Credit in Vietnam,” Quarterly Journal of Economics, 114, 1285-1320. Mohanty, M. S. and Marc Klau. 2004. “Monetary policy rules in emerging market economies: issues and evidence.” Bank for International Settlements (BIS) Working Papers No 149. Nguyen Duc Thao. 2004. “Strategy for the Development of Banking Services in Vietnam in the Context of International Economic Integration.” Project VIE/02/009 Banking Service Sector. Hanoi, Vietnam. August 2004. Phung Khac Ke. 2003. “WTO Accession and Banking Reform in Vietnam.” http://www.worldbank.org.vn/WTO/WTO%20Forum%20Hanoi.htm Rand, John. 2004. “Credit Constraints and Determinants of the Cost of Capital in Vietnamese Manufacturing.” December 2004. Sorge, Marco. 2004. “Stress-testing financial systems: an overview of current methodologies.” Bank for International Settlements (BIS) Working Papers No 165. December 2004. Tran Trong Do. 2005. “Rationale of and Direction for Amending the Law on State Bank of Vietnam and the Law on Credit Institutions in a Fundamental Fashion.” Paper presented at the January 18, 2005 Seminar on “Preparation for the 2006-2010 Five Year Social Economic Development Plan in the Banking Sector”. Tran Van Tho, Nguyen Ngoc Duc, Nguyen Van Chinh, and Nguyen Quan. 2000. Kinh Te Vietnam. 1955 – 2000. Tinh Toan Moi, Phan Tich Moi (Vietnam Economy. 1955 – 2000. New Estimates, New Analysis). Statistical Publishing House. Hanoi. December 2000. UNIDO. 2004. “Vietnam Agenda 21. National Conference and Forum on Sustainable Development in Vietnam. Forum on Sustainable Industry and Business.” Hanoi. December 2004. Document prepared by UNIDO Country Office in Vietnam. U.S. Vietnam Trade Council Education Forum. 2004. “The U.S.-Vietnam Bilateral Trade Agreement: A Survey of U.S. Companies on Implementation Issues.” May 10, 2004. Vietnam Ministry of Labor, Invalids and Social Affairs (MOLISA). 2004. Labour-Employment in Vietnam. 1996 – 2003. Hanoi: Labour-Social Publishing House.
VN Monetary Policy – Tu Packard: page 47
Vo Tri Thanh, Dinh Hien Minh, Do Xuan Trong, Hoang Van Thanh, and Pham Chi Quang. 2001. Exchange Rate in Vietnam: Arrangement, Information Content and Policy Options. Central Institute for Economic Management. Hanoi. February 2001. World Bank. 1991. Transforming a State Owned Financial System. A Financial Sector Study of Vietnam. Washington, D.C. Report No. 9223-VN. Washington, D.C. April 1991. World Bank. 1992. Vietnam:Restructuring Public Finance and Public Enterprises. Washington, D.C. Report No. 10134-VN. Washington, D.C. April 1992.
World Bank. 1993. Vietnam: Transition to the Market. Washington, D.C. September 1993.
World Bank. 1995. Vietnam: Economic Report on Industrialization and Industrial Policy. Report No. 14645-VN. Washington, D.C. October 1995.
World Bank. 1996. Vietnam: Fiscal Decentralization and the Delivery of Rural Services. Report No. 15745-VN. Washington, D.C. October 1996. World Bank. 2002. “Banking Sector Review. Vietnam.” Financial Sector. East Asia and Pacific Region.