Embed Size (px)
Citation preview

Money for MetroCards: How a New Card Fee MadeTransit Riders Invest More and Lose More
Meiping Sun *
March 27, 2021
Abstract
In 2013, the New York City Metropolitan Transportation Authority (MTA) imposed a $1
card fee (surcharge) on new purchases of prepaid transit cards (MetroCards). Using a novel
dataset with transaction-level card information, I show that the fee caused riders to put more
money on new MetroCard purchases, particularly those in low-income neighborhoods and
those who used cash or debit (rather than credit) cards. As a result, the net monthly outstanding
balance of card deposits increased dramatically, with riders lending an extra $150 million, on
an annual basis, to the MTA. Moreover, over $20 million of the annual increased balances were
never redeemed and escheated to the MTA when these cards expired. The leading explanation
highlights card carrying costs. I pose a structural model to calibrate the effect of a new card
fee. The importance of card carrying costs may explain the prevalence of required minimum
deposit amounts in the online or mobile prepaid services such as E-ZPass and Skype. These
findings have implications for public policy designs and fee structures of prepaid services.
(JEL D12, H41, R41, R42, R48)
*Assistant Professor, Department of Economics, Fordham University, Lowenstein 808B, 113 West 60th Street,New York City, NY 10023 (email: [email protected]). I thank Brendan O’Flaherty, Pietro Ortoleva, DouglasAlmond, and Suresh Naidu for invaluable guidance, assistance and advice. I thank Jushan Bai, Alessandra Casella,Donald Davis, Mark Dean, Francois Gerard, Wojciech Kopczuk, Jonah Rockoff, Miikka Rokkanen, Edward Glaeser,Linh To for discussions and comments that shaped the content of this paper. I thank Laxman Gurung, Sun Kyoung Lee,Xuan Li, Janis Priede, Tuo Chen, and Danyan Zha for their help. I also thank the participants of seminars at ASSAAnnual Meeting, Columbia University, Federal Reserve Bank of Kansas City, Federal Reserve Bank of Philadelphia,Fordham University, George Washington University, National University of Singapore, and NBER Summer Institute(Urban Economics) for their comments. I thank Tuo Chen for helping with Matlab Codes. I thank Sun Kyoung Lee forproviding subway-census-tract data. I am particularly indebted to the staff at Metropolitan Transportation Authority(MTA) who have provided data for my research. All errors are my own.
1
1 Introduction
Prepaid cards have become an increasingly prominent form of payment for many industries andpublic services providers. For instance, currently over 23 million US adults, mostly "unbanked"consumers from low-income households, use general purpose reloadable cards such as Green-DotCard every month (Urahn et al. 2014). Meanwhile, many developing countries promote the useof prepaid cards for public services as they face large numbers of tiny and dispersed consumers.Some controversy has emerged because merchants are critical of the card fees, challenging bothstructure and level, and heated debates among researchers, practitioners, and policymakers haveensued. While the academic literature has so far focused on fees that are proportional to thetransaction values or fixed per-transaction fees, the effect of a new card fee is not clear, especiallyin monopolistic markets.
In this paper, I show how a new card fee for prepaid transit cards induced riders to put moremoney on cards and lose more when these cards expired. I present a novel transaction-level dataset from the public transit system in New York City that allows me to analyze changes in depositamounts and forgone balance on expired cards. The data set contains detailed information on all thedeposits and card uses from January 2013 to May 2015, with more than 100 million observations.
In March 2013, the New York City Metropolitan Transportation Authority (MTA) imposed a$1 "green" card fee on new MetroCard purchases to motivate riders to refill and keep using theirexisting cards rather than purchasing new ones, thereby reducing litter. The Authority’s stated goalbehind the card fee was achieved as the number of new MetroCards sold dropped immediately andstayed low after the card fee was imposed. Before 2013, the Authority, on average, sold about 7million cards per month. After the card fee, this number dropped to about 2 million per month.Meanwhile, there was only a minor decrease in ridership since the imposition of the card fee.
Surprisingly, riders started to make much larger deposits on new MetroCard purchases after the$1 new card fee (surcharge); this translates into riders lending the transit authority $150 millionmore annually. The monthly outstanding balance that riders carry on their MetroCards (definedas the difference between the total amount loaded on the cards in that month and the reductionscaused by swipes at turnstiles in the same month1) jumped from less than $35 million to more than$45 million. Currently, the MTA is paying 0.37% interest on funds raised from short-term notes.This additional free lending potentially saved the MTA hundreds of thousands of dollars in interestpayments.
Moreover, over $20 million of the increased balances were never redeemed and escheated tothe MTA when these cards expired. Each MetroCard is valid for about 18 months after the initial
1Mathematically, the net outstanding balance for a specific month is calculated as Balance =∑
deposits ∗ (1 +bonus(%))−
∑rides ∗ basefare
2

purchase; inactive balances on cards become assets of MTA under the category "expired fare rev-enue" after the expiration date. The aggregate forgone balance (i.e., expired fare revenue) in 2015,from cards initially purchased in late 2013 and 2014, the first year after the MTA implemented thecard fee, increased to $75 million from $52 million, the aggregate forgone balance in 2014. Theincrease in forgone balances persisted as $80 million and $76 million stashed on MetroCards thatexpired in 2016 and 2017, respectively.
There are five main empirical findings regarding changes in deposit amounts and forgone bal-ances on expired cards. First, the changes largely came from new cards that would not have subse-quent refill activities, not from cards that showed subsequent refill activities. Second, the changesmainly came from cash or debit card payments rather than from credit card payments. Third,among cash payments, the changes were mostly from payments made at vending machines ratherthan from payments made at manned booths (tellers). Fourth, the response to the new card feewas larger in low-income neighborhoods than in high-income neighborhoods. Fifth, the responseto the new card fee was not primarily from tourists. Although part of the changes could havecome from tourists and short-term visitors, deposits and forgone balances increased dramaticallyin neighborhoods with few tourists such as South Bronx and Sunset Park in Brooklyn.
The increase in deposit amounts and leftover balances on expired cards was unanticipated: theMTA never said that the goal of this card fee was to attract more deposits; also, the card fee on anew MetroCard purchase is a one-time fee, which should have no impact on deposit amounts. Nowthe question is: why did riders make larger deposits to their MetroCards and lose more money afterthe new card fee was introduced? I explore potential explanations, including avoidance of coins,persuasion by vending machine messages, and commitment device.
In my view, these findings are consistent with a rational model that highlights the cost to carrythe same MetroCard for future rides, the cost to add money on Metrocard, and rider uncertaintyabout future rides. When MetroCards were free, riders with a low cost of making deposits toMetroCards deposited only a small amount of money on cards and purchased a new MetroCardeach period if needed. They chose not to incur the cost of effort to carry the same card for futuredays. After the new card fee was imposed, many riders switched to refilling existing cards sincetheir card carrying costs were smaller than the new card fee. They started making larger depositsto save on the cost of making deposits to cards. Because riders are uncertain about future rides,these riders on average had higher leftover balances after the card expiration dates.
To calibrate the effect of a new card fee, I develop and estimate a dynamic model of Metro-Card deposits and uses by utilizing detailed MetroCard data in the years 2013-2015. Given myparameter estimates, counterfactual simulations predict the effect of a $1 new card fee had it beenimplemented with all the default choices of deposit amounts giving exact numbers of rides. Hold-ing base fare for subway and bus rides fixed, my simulations predict an increase in expired fare
3

revenue of $21.76 million (41.84%) after the $1 card fee is imposed on new MetroCard purchases,as opposed to $25 million. I then simulate the amount of new card fee that maximizes the MTA’sprofit while holding the payment prompts on Touchscreen and base fare for subway rides fixed.The model predicts that a new card fee of $4.35 maximizes the MTA’s profit.
The importance of card carrying costs and costs to make deposits may explain the prevalenceof required minimum deposit amounts in the online or mobile prepaid services such as E-ZPassand Skype. When authorities or firms adopt online or mobile payments with an automatic deduc-tion from bank accounts or credit cards, consumers’ costs to make deposits converge to zero. As aresult, cash flow from prepaid services will drop significantly as consumers switch from prepayingfor future consumption to paying only for consumption this period (pay-as-you-go). To main-tain the benefits from unused account balances, most online or mobile prepaid services providershave required minimum deposit amounts and use suggested deposit amounts to attract even moredeposits.
The results of this study are likely to generalize to 8.3 million Americans who use public transitto go to work. In 2019, Americans took 9.9 billion trips on public transportation (American PublicTransportation Association 2020). Therefore, both in terms of monetary magnitude and in terms ofpopulation involved, the new card fee on transit card has a significant economic impact. Empiricalanalysis on optimal pricing for public transit system has been limited, with most studies focusingon the demand elasticity of rides in response to fare increases (Vickrey (1955); Vickrey 1963;Palma and Lindsey 2007; Small and Verhoef 2007; Tirachinia and Henshera 2012; Jong and Gunn2001; jia Wang et al. 2015; Chen et al. 2011; Graham et al. 2020; Davis 2021). This paper is thefirst to examine in detail the effects of a new transit card fee. I show that a new card fee inducedriders, especially low-income riders, to put more money on cards and lose more when these cardsexpire.
These findings also have implications for the fee structure of payment cards, especially reload-able prepaid debit cards. The academic literature has so far focused on fees that are proportionalto the transaction values or fixed per-transaction fees (Shy and Wang 2011; Schwartz and Vincent2006; Schmalensee 2002). Shy and Wang (2011) showed that, when card networks and merchantsboth have market power, card networks earn higher profits by charging proportional fees. Schwartzand Vincent (2006) showed that, when a card company faces local monopolist merchants, the NoSurcharge Rule which prohibits merchants from charging higher prices to consumers who pay bycard instead of other means (’cash’) raises card company profit and harms cash users and mer-chants. Complementing prior studies, I show that, when a prepaid card issuer has market power, anew card fee (or card activation fee) could nudge consumers to prepay more for future consump-tion.
Furthermore, these findings have implications about regressive ways to raise money. Mainly
4

due to data limitations, studies on regressive fees focus on the portion of fee revenue collected fromlow-income people (Dorfman 1977; Gertler et al. 1987; Grainger and Kolstad 2010; Leape 2006;McMillen and Singh 2020; and Oates and Fischel 2016). Here I provide evidence that whether ornot the card fee itself is regressive, it may push low-income consumers to behave in ways that costthem money, especially in monopolistic market. The authorities should take into consideration thepossible additional responses from low-income people when imposing a fee.
The remainder of the paper is organized as follows. Section 2 gives a brief introduction toMetroCards and the new card fee. Section 3 describes main features of MetroCard data sets usedin the empirical analysis. Section 4 presents the main findings about MetroCard sales, depositpatterns, and leftover balances on expired cards. Section 5 describes my model and identificationin a simplified setting. Section 6 discusses estimation and counterfactual analysis. Section 7considers other potential mechanisms that might explain the results. Section 8 performs robustnesstests. Section 9 concludes the paper.
2 Background
2.1 MetroCard
The MetroCard is a stored ride fare card for the New York City public transit system. It is a thinplastic card on which a rider electronically loads fares. Various types of MetroCards are availablefor purchase. There are two types of value-based cards: pay-per-ride MetroCards and single-ridetickets. Also, there are two types of time-based cards: 7-day-unlimited MetroCards and 30-day-unlimited MetroCards. The minimum purchase on a new pay-per-ride MetroCard is the fare of around trip (currently $5.50). No minimum purchase is required for refill transactions. Riders canput as much money on the card as they want.
A rider can purchase new or refill existing MetroCards at a subway station MetroCard vendingmachine (MVM) (Figure 1a) or at a station’s manned booth (teller) (Figure 1b) 2. Upon the impo-sition of the card fee in March 2013, there was no major change in the user interface of vendingmachine screens, except for the added message about the card fee (Figure 2). More information isavailable on MTA’s website: www.mta.info.
2MetroCards can also be purchased out-of-system through the MTA extended sales network (including merchantsand tax-benefit providers), which now accounts for the majority of MetroCards sold. Approximately 2.8 millionMetroCards are sold out-of-system each month, and this level has not changed noticeably since the introduction of the$1 new card fee (out-of-system sales are not subject to the $1 fee).
5
Bonus Free Ride for Pay-per-ride Purchases
Since January 1, 1998, the MTA has given a "bonus" for pay-per-ride purchases that are at or abovea certain threshold amount. For instance, from June 28, 2009, to December 29, 2010, the bonusvalue for pay-per-ride purchases was 15% of the purchase amount for purchases of $8 or more.For example, when a rider made a deposit of $10 to a pay-per-ride MetroCard, the card balanceincreased by $11.50 ($10 + $1.50).
This is not a typical bonus since it is always a certain percent of the purchase amount (i.e.,linear) while a usual bonus is an increasing percent of the purchase amount (i.e., non-linear). Thebonus value for pay-per-ride MetroCards was 11% of the purchase amount for purchases of $5.50or more (Table 1 row 6) from March 22, 2015 to March 18, 2017.
2.2 Policy Changes
Table 1 shows the recent history of MTA policy changes. Column 1 presents the fare hike in 2009.On June 28, 2009, the base subway and bus fare rose from $2 to $2.25. The monthly MetroCardrose from $81 to $89. The weekly MetroCard rose from $25 to $27. The pay-per-ride MetroCardbonus remained at 15%, but the threshold for the bonus increased from $7 to $8.
Column 2 lists the fare hike at the end of 2010. On December 30, 2010, the 30-day-unlimitedcard increased to $104 and the 7-day-unlimited card increased to $29. The bonus value for pay-per-ride cards decreased to 7% for every $10. There was no change in base subway and bus fares,but the cost of a single-ride ticket went from $2.25 to $2.50.
Column 3 shows the fare hike in 2013. On March 3, 2013, the base subway and bus fareincreased from $2.25 to $2.50. The cost of a 30-day-unlimited card increased to $112. The costof a 7-day-unlimited card increased to $30. The bonus for the pay-per-ride MetroCard decreasedfrom 7% to 5%, but the threshold for the bonus decreased from $10 to $5. The price of a single-rideticket increased from $2.50 to $2.75. The MTA also imposed a $1 fee on new card purchases, theimpact of which forms the basis of this study.
Column 4 depicts the fare hike in 2015. On March 22, 2015, the base fare of subway and busrides rose from $2.50 to $2.75. The cost of a 7-day-unlimited card rose from $30 to $31 and thecost of a 30-day-unlimited card increased from $112 to $116.50. Pay-per-ride bonuses increasedfrom 5% to 11% for purchases greater than or equal to $5.50.
2.2.1 Card Fee on New Purchases
The main policy change that concerns this paper is the imposition of a card fee on new MetroCardpurchases. A new MetroCard itself used to be cost-free. A $1 new card fee, tacked on when
6

someone buys a new MetroCard, went into effect with the fare hikes on March 3, 2013. Thefee applies to each new MetroCard purchased at a MetroCard Vending Machine, station booth,or commuter rail station. Riders can avoid this fee by refilling their MetroCards. The MTA willissue a new MetroCard at no charge if a card is expired or damaged. The new $1 charge did notapply to single-ride tickets or to MetroCards bought by reduced fare riders (seniors and riders withdisabilities)3.
2.3 Environmental Impact
The transportation authority justified the $1 card fee on new MetroCards purchases in environmen-tal terms, arguing that the policy would lead to cleaner subway stations by discouraging peoplefrom littering subway stations with their discarded, empty MetroCards. MTA officials mentionedthis fee as an environmentally friendly initiative in numerous news reports 4. On average, it coststhe agency $20 million a year to print and clean up discarded cards from subway stations. Accord-ing to the MTA, after the imposition of the new card fee, printing fewer MetoCards and trimmingcleanup costs was expected to save about $2 million a year 5.
3 Data
In this section, I present the main features of the data sets used in this study. This paper documentschanges in deposit amounts on MetroCard purchases and increases in forgone balances on expiredMetroCards using three data sets: MetroCard deposit data, swipe data, and trade-in and trade-outdata.
3Also, the card fee does not apply to MetroCards purchased out-of-system through MTA extended sales merchants,users of EasyPayXpress cards, transit benefit organization riders who get their MetroCards directly from employersor their benefit providers, or riders who purchase a combination railroad/MetroCard ticket. Out-of-system MetroCardsales now account for the majority of MetroCards sold. Approximately 2.8 million MetroCards are sold out-of-systemeach month, and this level has not changed noticeably when comparing MetroCard numbers sold before and after thecard fee went into effect.
4Some news reports where MTA talked about the $1 new card fee: NY Times, NY Daily News, NBC News5Some news reports where MTA mentioned the potential savings from the imposition of the new care fee: NY
Daily News-1, NY Daily News-2, NBC New York
7

3.1 MetroCard Deposit Data
Monthly-Aggregate Deposit Data
The MetroCard monthly revenue data from January 2009 to June 2015 include information onthe number of deposit transactions (new sales versus refills) as well as total in-system MetroCardpurchase amounts, broken out for various types of MetroCards 6.
Transaction-level Deposit Data
The transaction-level MetroCard deposit data7 cover all deposit transactions for the following pe-riods: 1) May 1, 2009 - September 30, 2009; and 2) January 1, 2013 - May 31, 2015. Each ob-servation corresponds to a MetroCard deposit transaction and includes information on the amountof money added to the card, the station at which the card was purchased, the date and time ofpurchase, the type of deposit, the method of payment, and the balance of the card before the trans-action. This data also include information on whether the transaction took place at a booth stationor at a vending machine.
3.2 MetroCard Swipe Data
Transaction-level Swipe Data
The transaction-level swipe data8 cover all MetroCard swipe transactions from January 1, 2013to May 31, 2015. Each observation corresponds to a MetroCard swipe transaction and includesinformation on the amount of money deducted from the card, the station or bus route at which thecard was swiped, the date and time of card swipe, and the balance of the card before the transaction.
6Pay-per-ride, 7-day-unlimited, 30-day-unlimited, 7-day-unlimited Express, single-ride, reduced-fare seniors anddisabled, etc.
7This dataset includes deposit transactions from the New York City Subway rapid transit system; New YorkCity Transit buses, including routes operated by Atlantic Express under contract to the Metropolitan TransportationAuthority (MTA); MTA Bus, and Nassau Inter-County Express systems; the PATH subway system; the RooseveltIsland Tram; AirTrain JFK; and Westchester County’s Bee-Line Bus System
8This dataset includes MetroCard swipe transactions from the New York City Subway rapid transit system; NewYork City Transit buses, including routes operated by Atlantic Express under contract to the Metropolitan Transporta-tion Authority (MTA); MTA Bus, and Nassau Inter-County Express systems; the PATH subway system; the RooseveltIsland Tram; AirTrain JFK; and Westchester County’s Bee-Line Bus System
8
Weekly-Aggregate Swipe Data
This data set includes the total number of MetroCard swipes riders made each week as they enteredeach station of the New York City Subway, PATH, AirTrain JFK and Roosevelt Island Tram fromJanuary 2011 to December 27, 2019, broken out for various types of MetroCards.
3.3 MetroCard Trade-in and Trade-out Data
Riders can transfer money in (trade-in) and out (trade-out) across different MetroCards they own.Also, riders can trade in their old cards that expired within the past two years and transfer anyremaining money to a new card. This data set includes all trade-in and trade-out transactions fromJanuary 1, 2013 to May 31, 2015, which allows me to link multiple cards to the same rider. Ican then compare changes in deposit amounts and foregone balances on cards initially purchasedbefore and after the implementation of the new card fee by the same rider.
4 Main Findings
The main empirical findings are summarized in Table 2. In particular, riders purchase MetroCardswith much larger deposit amounts after the imposition of the new card fee. Consequently, themonthly outstanding balance of deposits and forgone balances on expired cards jump up signifi-cantly.
4.1 New MetroCard Sales Dropped After the New Card Fee was Introduced
Table 3 shows the monthly new MetroCard sales from January 2009 to June 2015. After theimplementation of the new card fee, the monthly new MetroCard sales dropped from over 7 millionto about 2 million and stayed low. This drop in sales is very robust across different subgroups: themonthly sales of new pay-per-ride cards decreased from 5.8 million to 1.8 million; the monthlysales of new 30-day-unlimited cards decreased by about 75% to 0.15 million; and the monthlysales of new 7-day-unlimited cards decreased by over 1.2 million to 0.34 million.
Figure 3 plots the monthly new MetroCard sales from January 2009 to June 2015. This fig-ure shows that new MetroCard sales dropped immediately and stayed low after the impositionof the new card fee, confirming the summary statistics in Table 3. I replicate this analysis usingtransaction-level deposit data in Figure 4. This figure plots the daily new MetroCard sales fromJanuary 1, 2013 to April 30, 2013. The MTA sold about 200 thousand new MetroCards each daybefore the new card fee was introduced. This estimate dropped immediately to about 130 thousand
9

on the first day the new card fee was implemented and further decreased gradually over the nexttwo months. Similar results are observed for all three MetroCard subgroups (Figure 5-7).
Regression-Discontinuity Approach
Since there was no significant sorting of MetroCard sales around the date when the MTA imple-mented the new card fee, I estimate the effect of the new card fee with a regression discontinuity(RD) design. Under some mild regularity conditions, the average causal effect of the new card feeon MetroCard sales just before and just after the new card fee could be identified. There was nodiscontinuity in ridership or other covariates around the implementation date of the new card fee.
Assuming a homogeneous effect of the new card fee on MetroCard sales with one cutoff date:
Yt = β + γ1{t ≥ t0}+ a(t) +Xt + ut, (1)
where t is the indexed date, Yt denotes the new MetroCard sales on day t, t0 was the distinctcutoff point (i.e., March 3, 2013), a(.) is a flexible function of date, X is a set of controls includingday-of-week and month-of-year fixed effects. The coefficient of interest is γ which measures theeffect of the new card fee on daily new MetroCard sales.
I present estimates using the analog of the Calonico et al. (2014) bandwidth selectors for sharpRD. Similar estimates are observed under alternative bandwidth selectors based on the Imbensand Kalyanaraman (2012). In the baseline specifications, I use local quadratic regression (a localpolynomial of order two) for a(.). Across specifications, the estimated effect of the new card feefrom both local linear and local quadratic regressions corroborate the visual evidence.
Table 4 presents the results for the effect of the new card fee on daily new MetroCard sales,using different control variables in each specification. The model in column 2 controls for day-of-week fixed effects. The results show that the implementation of the new card fee caused a decreaseof 125,000 (70%) in daily new MetroCard sales. To account for the possibility of variations inMetroCard sales across different months, my preferred specification in column 3 includes month-of-year fixed effects. As with the other controls, the addition of month-of-year fixed effects haslittle impact on the estimated effect of the new card fee.
Using this preferred specification, Table 5 includes measures of daily new card sales for 7-day-unlimited cards, 30-day-unlimited cards, and pay-per-ride cards in response to the implementationof the new card fee. The imposition of the new card fee led to a decrease of 120,000 (65%) indaily new pay-per-ride MetroCard sales, a decrease of 23,000 (73%) in daily new 7-day-unlimitedMetroCard sales, and a decrease of 24,000 (75%) in daily new 30-day-unlimited MetroCard sales.
10

4.2 Deposits to MetroCards Increased Significantly
After the MTA imposed the new card fee, riders who purchased new MetroCards, on average,made larger deposits. The imposition of the new card fee led to a decrease in the percentage ofriders who made deposits of approximately $5 by about 40% and an increase in the percentageof riders who made deposits of approximately $10 and $20 by about 35% (Figure 12a and Figure13a). I check the robustness of the findings by limiting my focus to deposit transactions within oneweek before and after the imposition of the new card fee. The same changes in deposit amountsare observable (Figure 12b and 13b). As a result, monthly revenue jumped up by 9.4%, fromaround $160 million to $175 million after the implementation of the new card fee (Figure 11a).This increase in monthly revenue becomes more noticeable when looking at year-on-year monthlyrevenue (Figure 11b).
I then use equation (1) to evaluate the effect of the new card fee on deposits. Table 6 presentsthe results for the effect of the new card fee on deposit amounts on new pay-per-ride purchasesfrom January 1, 2013, to April 30, 2013, using different control variables in each specification. Themodel in column 3 controls for day-of-week fixed effects. The results show that the implementationof the new card fee caused a increase of $1.64 in deposit amounts on new pay-per-ride purchases.Riders, on average, make larger deposits during morning and evening rush hours. To accountfor the possibility of variations in deposit amounts across different neighborhoods, my preferredspecification in column 4 includes station fixed effects. The addition of station fixed effects causesthe estimated effect of the new card fee to be smaller, which indicates that there is heterogeneity indeposit amounts across different neighborhoods.
4.3 Changes in the Outstanding Balance of Deposits
Because of the significant increases in deposit amounts, the monthly outstanding balance of de-posits made to pay-per-ride MetroCards unexpectedly jumped by about one-third, from around$35 million to over $45 million, after the imposition of the new card fee (Figure 8). The aggre-gate monthly outstanding balance that riders carry on their MetroCards is defined as the differencebetween the total amount loaded on the cards and the reductions caused by swipes at turnstiles9.
9Mathematically, the monthly outstanding balance of deposits is calculated as:
Balancemi =∑
deposits ∗ (1 + bonus(%))−∑
rides ∗ basefare (2)
where mi is month i. base fare is $2.0 for months before February 2008, $2.25 for months from March 2008 toFebruary 2013, and $2.5 for months from March 2013 to February 2015.
Theoretically, the monthly outstanding balance of deposits should be calculated as:
Balancemi =∑
deposits+∑
bonus−∑
rides ∗ basefare (3)
11

This additional outstanding balance translates to riders lending, on an annual basis, an extra$150 million to the MTA. The outstanding balance showed no significant increase after the farehikes in 2009 or 2010, nor after the fare hike in 2015. Hence, the observed changes in depositpatterns after the new card fee is not likely driven primarily by the $0.25 base fare increase.
4.4 Increases in Forgone Balances on Expired MetroCards
Over $20 million of the increased balances on MetroCards were never redeemed and escheated tothe MTA when these cards expired. Each MetroCard is valid for about 18 months after the initialpurchase date; inactive balances on cards become assets of the MTA under the category "expiredfare revenue" after the expiration date. The aggregate forgone balance (i.e., expired fare revenue)in 2015, from cards initially purchased in late 2013 and 2014, the first year after the new card feewas introduced, increased to $75 million from $52 million, the aggregate forgone balance in 2014.
Figure 9 plots the forgone balances on MetroCards initially purchased between January 1, 2013and April 30, 2013. This figure shows that the leftover balances on expired MetroCards jumpedby about 50%, from around $150,000 to over $250,000 after the imposition of the new card fee,confirming the observed increase in aggregate forgone balances on expired MetroCards.
4.5 Heterogeneity in Deposits to New Pay-per-ride Cards: Cards Held forDifferent Lengths of Time
To explore the heterogeneity in deposit amounts, I examine the deposit patterns on MetroCardsheld for different lengths of time. Deposits on new pay-per-ride purchases increased tremendouslyon MetroCards that had no subsequent refill activities. Before the new card fee, about 60% ofdeposits were $5 or less on pay-per-ride cards that had no subsequent refill activities. After thenew card fee, this percentage dropped by half to about 30%, while the percentage of $10 or $20deposits almost doubled. In contrast, there was only a minor change in deposit amounts on pay-per-ride cards that had subsequent refill activities (Figure 14b).
However, I only have aggregate monthly deposit data and cannot observe bonus amount for each deposit transaction.Hence, the outstanding balance calculated using equation (1) is the upper bound of the outstanding balance for eachmonth. Since the threshold for bonus free rides was much higher ($10) before the new card fee was imposed, the jumpin the outstanding balance after the imposition of the new card fee should be even larger.
12

4.6 Heterogeneity in Deposits to New Pay-per-ride Cards and Forgone Bal-ances on Expired Cards: By Payment Methods
With transaction-level MetroCard information, I then examine the heterogeneity in deposit amountsand forgone balances on cards purchased using different payment methods (cash, debit card, ver-sus credit card). The main changes come from cash or debit card payments rather than from creditcard payments. Consistent with changes in deposit patterns, forgone balances increased signifi-cantly on MetroCards initially purchased by cash or debit cards rather than by credit cards (Figure16b, 16d, and 16f). For credit card payments, there was only a slight increase in deposit amountsand forgone balances after riders are charged a fee for purchasing a new MetroCard (Figure 16eand 17c). In contrast, the percentage of riders who made cash deposits of approximately $10 or$20 increased significantly, from 33% to 63%. The percentage of riders who made cash depositsof approximately $5 dropped by about one-third (Figure 16a and 17a). For debit card payments,the percentage of riders who made deposits of approximately $10 or $20 increased significantlyfrom 46% to 63%. The percentage of riders who made deposits of approximately $5 dropped byabout half (Figure 16c and 17b).
4.6.1 Changes in Deposit Amounts Across Different Neighborhoods
The Survey of Consumer Finances (SCF) indicates that it is primarily the poor who use cash in theUS (Bricker et al. (2014); Kennickell and Kwast (1997)). To test whether this is true in the case ofMetroCards, I link deposit data in different subway stations to local census tract income data. Asshown in Figure 18, low-income neighborhoods have a much higher percentage of cash paymentscompared to high-income neighborhoods. This finding is in line with other studies on cash usageacross different socioeconomic groups (Klee (2006); Feudner (2011)).
Since the increase in deposit amounts and forgone balances mainly came from cash or debit-card payments, the new card fee may nudge low-income riders to load more money onto theircards. Controlling for station-level covariates, I use a regression framework to evaluate the effectof new card fee on deposit amounts across different neighborhoods. The empirical model takes thefollowing forms:
Y = θ0 + θ1Surcharge + θ2Income + θ3Surcharge*Income + λX + ε
where Y is the deposit amount for pay-per-ride cards, and Surcharge is an indicator for ob-servations after the implementation of the new card fee. Income represents log-income at thecensus-tract level. X is a set of controls such as day-of-week fixed effects. The coefficient of in-terest is θ3, the coefficient on the interaction of Surcharge and Income, which measures the effect
13

of local income level on changes in deposit amounts after the new card fee relative to changes indeposit amounts before the new card fee.
Table 7 presents the results for the effect of the new card fee on deposit amounts using Metro-Card transactions from January 1, 2013 to April 30, 2013. After the implementation of the newcard fee, change in deposit amounts is larger in poorer neighborhoods. Meanwhile, there are nosignificant changes in ridership across different neighborhoods before and after the new card fee(Table 8). These results indicate that the new card fee induces poor riders to make larger depositson new MetroCard purchases and lose more balances on expired cards. This is not surprising be-cause riders from richer neighborhoods already made large deposit amounts on their MetroCardsbefore the new card fee was imposed.
5 Model
I present a simple rational model that highlights card carrying costs and estimate this model usingmy observational data. A rider is assumed to take two rides (a round-trip) or no rides each day.The base fare for a ride is p. Each rider is assumed to live in New York City for the next n-daytime period (n ∈ (0, inf)). The card fee for purchasing a new MetroCard is T . The discount factoris ignored since the time horizon is small.
For rider i, the average cost of each deposit (e.g., the opportunity cost of waiting in line to addmoney to the card, the expected opportunity cost of missing a train in station, etc) is ci. I assumethat ci is independent of time. This is a reasonable approximation since the main policy changethat concerns this paper is the imposition of a card fee on new MetroCard purchases and riders canadd money to their cards during non-rush hours to avoid mammoth lines at MetroCard vendingmachines.
Among riders, latent ci is normally distributed censored at zero: Nc ∼ (µc, σc). Rider i incursa utility cost ei to remember to carry the same MetroCard to the next day (Homonoff 2018). Latentei is normally distributed censored at zero among riders: Ne ∼ (µe, σe). (Throughout the paper, Iuse the parameters of the pre-censoring distributions to describe the censored distributions.) Thecorrelation, ρc,e, between ei and ci is assumed to be zero since ci largely depends on rider i’sopportunity cost of time while ei depends on rider i’s mental cost to be well-organized (Andersonet al. 2017; Cohen and Gollwitzer 2008; Piauilino et al. 2010; Smith 2003).
We start observing riders on day 1 when they are about to take a round-trip. On each day butthe first, qi is the probability of taking a round-trip for rider i. Among riders, latent qi is normallydistributed censored at zero and one: Nq ∼ (µq, σq). Given that realization of qi, demand for tripsis inelastic. I assume that qi is independent of the price of a subway ride. This is a reasonable
14

approximation for the changes I study because the main policy change that concerns this paper isthe imposition of a card fee on new MetroCard purchases. Ni denotes the number of rides thatrider i actually takes. Hence, Ni is distributed binomially with parameters 2n and qi ∼ B(2n, qi).
On day t, rider i decides whether or not to incur cost Cit to make a deposit amount Dit ∈[0, 2np] to her MetroCard. Let Cit = 1 if she decides to do so (i.e., if Dit > 0) and Cit = 0
otherwise (i.e., if Dit = 0). The delivery of fares is immediate. Also, rider i decides whether ornot to exert effort Eit ∈ {0, 1} to remember to carry the same card to the next day. Rider i incursutility cost ei if she exerts effort (i.e., Eit = 1).
The marginal utility of a subway or bus ride for rider i on day t is rit. Assume riders are riskneutral and they have quasilinear utility. The marginal value of a dollar is normalized to one. Rideri’s money-metric utility from riding subways and buses on day t ≥ 2 is:
Uit = qi(rit −Dit − Eitei − Citci − T (1− Ei,t−1)) (4)
When purchasing a new MetroCard with card fee T and taking two rides in day 1, rider i’sobjective is to choose a fare deposit policy {Dit, Eit, Cit} that minimizes the expected total cost:
E[ min{Dit,Eit,Cit}
(Di,1 + Ei,1ei + Ci,1ci + T +n∑
t=2
qi(Dit + Eitei + Citci + T (1− Ei,t−1)))] (5)
5.1 Modeling Response of New MetroCard Purchases to the New Card Fee
When will riders choose to carry the same MetroCard to the next day when the card balance is zero(i.e., when will riders choose to refill the same card)? Table 9 below outlines the conditions underwhich a rider would choose to keep the MetroCard when card balance is zero. Without a new cardfee, a rider discards her MetroCard when card balance is zero if ei > 0 (i.e., if a rider has to incur autility cost to remember to carry the same card to the next day). With a new card fee, a rider keepsthe same card when card balance is zero if the loss in utility from paying the new card fee is largerthan the cost to remember to carry the same card to the next day.
5.2 Optimal Strategy: Prepay versus No Prepay
To begin the analysis, I look at the case of n = 2. When n = 2, a rider makes the decision whetherto prepay for rides in the second day or not. Table 10 outlines the conditions under which a riderwould prepay for rides in the second day. Without a new card fee, a rider would prepay for futurerides if the cost to make deposits is larger than the cost to remember to carry the same card to thesecond day and the risk of losing prepaid rides fare. With a new card fee, a rider would prepay for
15

future rides only if the cost to make deposits and the cost of the new card fee are larger than thecost to remember to carry the same card to the second day and the risk of losing prepaid rides fare.
Figure 19 shows the threshold of prepaying for rides in the second day when no card fee isimposed (Figure 19a) and when a card fee is imposed (Figure 19b), respectively. With no card fee,riders in region C only deposit the fare of the first day rides since the cost to make deposits in thesecond day is smaller than the cost to remember to carry the same card to the second day and therisk of losing prepaid rides fare. After the new card fee is imposed, these riders switch to prepayingfor the second day rides as the cost to make deposits and the cost of the new card fee are largerthan the cost to carry the same card to the second day and the risk of losing prepaid rides fare. Asa result, they lose 2p on expired MetroCards if they do not actually take rides in the second day(Table 11).
5.2.1 Tourists versus Local Residents
The model developed above supports the observation that major changes in deposit amounts andforgone balances came from MetroCards purchased by local residents rather than from MetroCardspurchased by tourists. Visitors are likely to have low probability of taking rides in the second day(i.e., small qi). Also, visitors may have low costs to make deposits to their MetroCards (i.e., smallci) since they may not realize they are missing a train or they are on vacation so their time is notvery valuable. To these visitors, the cost to make deposits and the cost of the new card fee aresmaller than the cost to carry the same card to the next day and the risk of losing prepaid rides fareif they do not actually take rides in the second day. Therefore, visitors are not likely to increasetheir deposits after the new card fee is imposed.
Local residents, in contrast, have high probability of taking rides in the second day (i.e., largeqi). Also, their costs to make deposits to their MetroCards are likely to be high (i.e., high ci) sincetheir opportunity cost of missing a train and being late for work is high. To local residents, the costto make deposits and the cost of the new card fee are larger than the cost to carry the same card tothe next day and the risk of losing prepaid rides fare if they do not actually take rides in the secondday. As a result, local residents are more likely to increase their deposits after the new card fee isimposed.
5.2.2 n=3 Case
In line with the n = 2 case, when n = 3, riders in region D switch from only depositing the fare ofthe first day rides to prepaying for rides in the second day after the new card fee T is introduced.Riders in region E switch from prepaying for rides in the second day to prepaying for rides in the
16

second and third day after the new card fee is imposed (Figure 20b). Forgone balances on expiredcards will increase accordingly.
5.3 n=30 Case
Since frequent riders would purchase 30-day passes instead of pay-per-ride cards, I focus on then = 30 case in the following analysis. When n = 30, according to the model, there should be thirtyregions ranging from no prepay for future rides to prepay for rides in the next 29 days (Figure 21).In reality, riders either choose the "other amount" option and manually enter $4.5 (or $5) as thedesired deposit amount, or choose one of the payment prompts (i.e., suggested deposit amounts)on Touchscreen (Figure 22a and 22c). Therefore, there should be four regions as in Figure 23aand Figure 23b, corresponding to the "other amount" choice, "the first default choice", "the seconddefault choice", and "the third default choice", respectively.
Therefore, instead ofDit ∈ [0, 2np], rider imakes choice of deposit amountDit ∈ {5, 10, 20, 40}to her new MetroCard. When purchasing a new MetroCard with card fee T and taking two ridesin day 1, rider i’s objective is to choose a fare deposit policy {Dit, Eit, Cit} that minimizes theexpected total cost:
E[ minDit∈{5,10,20,40},Eit,Cit
(Di,1+Ei,1ei+Ci,1ci+T+n∑
t=2
qi(Dit+Eitei+Citci+T (1−Ei,t−1)))] (6)
When riders are charged a fee for purchasing a new MetroCard, riders in region A′ switchfrom choosing "other amount" choice to the first suggested deposit amount ($10); riders in regionB′ switch from the first suggested deposit amount to the second suggested deposit amount ($20);riders in region C ′ switch from the second suggested deposit amount ($20) to the third suggesteddeposit amount ($40) (Figure 23c). Consistent with the predictions of the model, the number ofdeposits in suggested amounts jump up significantly after the new card fee is imposed (Figure 24)
5.4 Parameter Estimates
I use equation (6) to calculate the thresholds of the four regions in Figure 23a and Figure 23b,corresponding to the "other amount" choice, "the first default choice", "the second default choice",and "the third default choice", respectively. I then use changes of deposits in suggested amounts(table 12) to calibrate the values of three groups of unobservables that must be integrated out:individual specific unobserved heterogeneity, including ei, ci, and qi. Computational difficultiesin estimation mainly come from the model’s high dimensional unobserved heterogeneity which
17

requires many evaluations of the likelihood function.As shown in Table 12, our model does a good job of fitting shares of deposit choices before and
after the card fee went into effect. Before the new card fee was imposed, for the share of the firstsuggested deposit amount ($10) on cards with no subsequent refill activities, we predict to be 21.63percent and is observed to be 22.91 percent. For the share of the second suggested deposit amount($20) on cards with no subsequent refill activities, we predict to be 13.07 percent and is observedto be 9.46 percent. After the new card fee was imposed, for the share of the first suggested depositamount ($10) on cards with no subsequent refill activities, we predict to be 39.64 percent and isobserved to be 37.71 percent.
The estimates for the six parameters discussed in the main text are shown in Table 13. Recallthat the parameters of the pre-censoring distributions are used to describe the censored distribu-tions. The six parameters characterize the normal distribution of riders’ riding probability qi, costto make deposits to MetroCards ci, and card carrying cost ei. The average riders’ riding probabilityqi is estimated to be 0.62. The average riders’ cost ci is estimated to be $1.45, while the averageriders’ card carrying cost ei is $0.83. The population standard deviations of qi, ci, and ei (σq, σc,and σe) are 0.34, $0.56, and $0.53, respectively.
5.5 Counterfactual Analysis
5.5.1 Fixed Price Counterfactual: Impact of Default Choices
The MTA has been criticized for the payment prompts (i.e., default choices of deposit amounts)on TouchScreen of MetroCard vending machines. The payment prompts do not give exact numberof rides: If a rider chooses one of the payment prompts on Touchscreen, she will end up with acard that has leftover amount because none of the suggested amounts (a $9.00 MetroCard with a$.45 bonus, a $19.00 card with a $.95 bonus, or a $39.00 card with a $1.95 bonus) are divisible by$2.50, the base fare for subway rides.
Some people have proposed a software change as shown in Figure 27. Now all the paymentprompts on Touchscreen give exact number of rides: a $9.55 MetroCard with a $.48 bonus givesexactly 4 rides, a $19.05 card with a $.95 bonus gives 8 rides, while a $38.10 card with a $1.91bonus gives 16 rides.
I simulate the change in expired fare revenue that results from the introduction of the $1 newcard fee with these new payment prompts while holding base fare constant. I construct this coun-terfactual simulation in the sense that I hold fixed the number of riders and their riding patterns.The model predicts that, even with all the payment prompts giving exact number of rides, expiredfare revenue would still increase by 41.84% ($21.76 million)
18

5.5.2 Optimal New Card Fee
I simulate the optimal amount of new card fee that maximizes the MTA’s profit while holding thepayment prompts on Touchscreen and base fare for subway and bus rides constant. I constructthis counterfactual simulation in the sense that I hold fixed the number of riders and their ridingpatterns. The model predicts that the optimal amount of new card fee is $4.35.
6 Alternative Mechanisms
This paper provides evidence of the impacts of the new card fee that is consistent with a rationalmodel highlighting the cost of effort to carry the same MetroCard for future rides, the cost to addmoney to MetroCards, and rider uncertainty about future rides. However, cost of carry is not theonly possible explanation for the observed increases in deposit amounts and forgone balances onexpired cards. This section investigates other potential theories or mechanisms that might explainthe results described above.
6.1 Persuasion
The screens of vending machines show three suggested deposit amounts ($10, $20, $40), alongwith bonuses. This could potentially nudge riders to make higher deposit amounts. However, thescreen displays the same $10 and $20 suggested amounts before and after the card fee went intoeffect; only the third suggested amount changed from $50 to $40 (Figure 22a and 22c). Since themain changes in deposit amounts were from $5 to $10 and $20, persuasion, solely, is not likely toaccount for the observed changes in new purchases.
6.2 Avoidance of Coins
When riders add money to MetroCards using cash at vending machines, they may receive as manyas 20 quarters (i.e., $4) as change if they purchase new cards with a $10 bill and only make adeposit of round-trip fare to the card (i.e. $10 - $5 fare cost - $1 new card fee). If some ridersprefer not to have a lot of coins as change, they may start adding $10 or $20 cash deposits to newpay-per-ride cards at vending machines.
However, this explanation, solely, cannot explain the changes observed in debit card payments.Before the new card fee, more than 30% of riders made only $5 deposits (round-trip fare) whenthey purchased new pay-per-ride MetroCards (Figure 16c). Since $5 has never been one of thesuggested deposit amounts on the screen, this means that many riders used to hit the "other amount"
19

option and manually enter $5 as the desired deposit amount. These riders can still choose the "otheramount" option and manually enter $6 ($5 fare + $1 new card fee) after the new card fee. But thepercentage of $5 deposits dropped to below 20% after the new card fee (Figure 16c).
6.3 Quick Fix
Some riders may want to make larger deposits when purchasing new cards because larger depositscould minimize (or alleviate) the perceived cost of the new card fee. For instance, riders maywant to compensate for the absolute monetary cost of the new card fee by bonuses on pay-per-ride deposits. The existence of a quick fix can largely explain why larger increases on new cardpurchases were mainly on cards that had no subsequent refill activities: Before the new card fee,more than 60% of the deposits on new cards that had no subsequent refill activities were $4.50(the fare of a round-trip) while more than 70% of the deposits on new cards with subsequent refillactivities were already at least $10 or $20.
However, this mechanism is not likely to explain the persistent increase in deposit amounts onnew cards and forgone balances on expired cards. If riders only increased their deposit amountsto alleviate the perceived cost of the new card fee but did not incur utility cost to keep the samecard, their forgone balances on lost or expired cards would increase. Over time, they shall decreasetheir deposit amounts back to the pre-fee level. However, I did not observe significant decrease indeposit amounts or forgone balances in the several years after the introduction of the new card fee.
6.4 Commitment Device
Many riders may use larger deposits as a means to push themselves to remember to carry the samecard and avoid paying the new card fee. As the forgone balances on expired cards increased by50%, the larger deposits is clearly a failed commitment device. Literature shows that people stopusing a commitment device that does not work (Brocas and Carrillo 2001; Carrillo and Mariotti2000; Vigna and Malmendier 2006). If this explanation is the primary one, we should see de-posits bounce back to lower level. However, no significant decrease in deposit amounts or forgonebalances was observed in the several years after the introduction of the new card fee.
7 Robustness tests
In this section, I perform several robustness tests to further validate the explanations for the find-ings.
20

Sample
The same results remain no matter I use the whole sample or sub-samples (e.g., one week beforeand after the implementation of the new card fee, or randomly picked stations).
Minor Decrease in Ridership
There was only a minor decrease in ridership after the introduction of the new card fee (Figure 10).
Cross-type switches in MetroCard purchases
One concern with interpreting changes in deposit patterns as a response to the new card fee is thatthere may be cross-type switches from pay-per-ride cards to unlimited-ride cards or single-ridetickets due to the variations in fare hikes across different types of MetroCards.
Table 16 lists monthly revenue before and after the new card fee. There was no significantchange in the percentage of revenue from pay-per-ride cards versus that from time-based cards.Table 14 and Table 15 show that the threshold of switching from pay-per-ride cards to unlimited-ride cards barely changed after the fare hikes in March 2013. This suggests that differences in farehikes across different types of MetroCards are unlikely to be driving these results. These findingsconfirm that there is minimal cross-type switching.
Cross-type Switch from Pay-per-ride cards to Single-ride Tickets
A seemingly reasonable implication from the imposition of the new card fee is that the sales ofsingle-ride tickets are likely to rise since some riders may switch from pay-per-ride cards to single-ride tickets, especially when they forget their regular MetroCards but need to take a round trip.However, monthly sales of single-ride tickets actually decreased after the new card fee went intoeffect (Figure 28).
Cross-type Switch from Pay-per-ride Cards to Time-based Cards
Table 14 compares costs of trips using pay-per-ride cards versus 7-day-unlimited cards. The redoval circles mark the threshold number of trips needed to switch from pay-per-ride to 7-day-unlimited before versus after the new card fee implementation. Before the new card fee, a riderwould only save more money buying a 7-day-unlimited card than buying a pay-per-ride card if she
21

takes more than 14 trips within one week. After the new card fee, this threshold became 13, onlydecreasing by one trip.
Table 15 compares costs of trips using pay-per-ride versus 30-day-unlimited cards. The redoval circles mark the threshold number of trips needed to switch from pay-per-ride to 30-day-unlimited before versus after the new card fee implementation. Again, the threshold of switchingfrom pay-per-ride to 30-day-unlimited cards only slightly changed after the fare hikes in March2013.
No Significant Increases in Deposit Amounts Before versus After the FareHikes in 2009 or 2015
There may be some concern that changes in deposit patterns are solely due to the fare hike in2013. Figure 31 and 32 plots the histogram for deposits on pay-per-ride cards before and after thefare hike in 2009 and 2015, respectively. For both new and refill purchases, there were barely anychanges in deposit amounts. Hence, the observed changes in deposit patterns after the new cardfee was not likely driven primarily by the $0.25 base fare increase.
8 Implications of the Findings
In this section, I discuss implications of the findings developed above. My evaluation of newcard fee on MetroCard purchases could be insightful in other contexts, such as mobile and onlineprepaid services as well as general purpose reloadable prepaid cards.
8.1 Mobile and Online Prepaid Services
The cost of effort to carry the same card (ei) and the cost to add money to cards (ci) highlightedin this model may explain the prevalence of required minimum deposit amounts in the online ormobile prepaid services such as E-ZPass and Skype. When authorities or firms adopt online or mo-bile payments with an automatic deduction from bank accounts or credit cards, riders’ cost to addmoney ci and cost of carry ci converge to zero. As a result, consumers switch from prepaying forfuture consumption to paying only for consumption in current period (pay-as-you-go). To maintainthe benefit from unused account balances, most online or mobile prepaid services providers haverequired minimum deposit amounts and use suggested deposit amounts to attract even more funds.For skype credit, the minimum purchase amount is $10 (Figure 33a) and consumers can only selectfrom $10 or $25 to buy.
22

8.2 General Purpose Reloadable Cards
Findings in this model are consistent with findings in the prepaid card industry. Currently, over23 million U.S. adults use general purpose reloadable cards such as green dot cards each month.Consumers loaded $672 billion on these cards in 2013. Since most general purpose reloadable cardusers are low-income and excluded from the financial mainstream, they do not have other bankingoptions (Urahn et al. 2014). Most card companies charge a new card fee (or card activation fee)as high as $9.95. When a prepaid card issuer has market power, a new card fee (or card activationfee) could push consumers to prepay more for future consumption.
9 Discussions and Conclusions
How do consumers respond to the imposition of a new card fee? In this paper, I show how a newcard fee for prepaid transit cards induced riders to put more money on cards and lose more whenthese cards expired. I present a novel transaction-level data set from the public transit system inNew York City that allows me to analyze changes in deposit amounts and forgone balances onexpired cards. After the introduction of a $1 new card fee, the net monthly outstanding balance oftransit card deposits increased dramatically, with riders lending an extra $150 million, on an annualbasis, to the MTA. Moreover, over $20 million of the increased balances were never redeemed andescheated to the MTA when these cards expired.
There are five main empirical findings regarding changes in deposit amounts and forgone bal-ances on expired cards. First, the changes largely came from new card purchases, not from refills.Second, the changes were mainly from new cards with no subsequent refill activities, not fromcards that showed subsequent refill activities. Third, the changes mainly came from cash or debitcard payments rather than from credit card payments. Fourth, among cash payments, the changeswere mostly from payments made at vending machines rather than from payments made at mannedbooths (tellers). Fifth, the response to the new card fee was larger in low-income neighborhoodsthan in high-income neighborhoods.
One leading explanation highlights the cost of effort to carry the same MetroCard for futurerides, the cost to add money to MetroCards, and rider uncertainty about future rides. When Metro-Cards were free, riders with a low cost of making deposits to MetroCards deposited only a smallamount of money on cards and purchased a new MetroCard each period if needed. They chose notto incur the cost of effort to carry the same card for future days. After the new card fee was im-posed, many riders switched to refilling existing cards since their card carrying costs were smallerthan the new card fee. They started making larger deposits to save on the cost of making deposits tocards. Because riders are uncertain about future rides, these riders on average had higher forgone
23

balances after the card expiration dates.The results of this study are likely to generalize to 8.3 million Americans who use public transit
to go to work. 10.65 billion passenger trips were taken on transit systems in 2013 (American PublicTransportation Association 2014). Therefore, both in terms of monetary magnitude and in termsof population involved, the new card fee on transit card has a significant economic impact. Thesefindings are also consistent with findings in the prepaid card industry. Since most general purposereloadable card users are low-income and excluded from the financial mainstream, they do nothave other banking options (Urahn et al. 2014).
These findings also have implication about regressive ways to raise money. Mainly due todata limitations, studies on regressive fees focus on the portion of fee revenue collected from low-income people. Here I provide evidence that whether or not the card fee itself is regressive, it maypush low-income consumers to behave in ways that cost them money, especially in monopolisticmarket. The authorities should take into consideration the possible additional responses from low-income people when imposing a fee.
Findings in this paper predict that riders’ cost to add money to cards and cost of carry convergeto zero with mobile payments and automatic deductions from bank accounts or credit cards. Asa result, riders will switch from prepaying for future rides to paying only for rides in this period(pay-as-you-go). A natural follow-up works is to track changes in expired fare revenue after theNew York MTA completes contactless payments rollout in 2021 and phase Out MetroCard in 2023.
Declaration of Competing Interest
None.
Funding
This research did not receive any specific grant from funding agencies in the public, commercial,or not-for-profit sectors.
24
References
Anderson, Francis T, Mark A McDaniel, and Gilles O Einstein, “Remembering to remem-ber: An examination of the cognitive processes underlying prospective memory,” Learning and
memory: A comprehensive reference E, 2017, 2, 451–463.
Bricker, Jesse, Lisa J. Dettling, Alice Henriques, Joanne W. Hsu, Kevin B. Moore, John Sabel-haus, Jeffrey Thompson, and Richard A. Windle, “Changes in U.S. Family Finances from2010 to 2013: Evidence from the Survey of Consumer Finances,” Federal Reserve Bulletin,2014, 10.
Brocas, Isabelle and Juan D Carrillo, “Rush and procrastination under hyperbolic discountingand interdependent activities,” Journal of Risk and Uncertainty, 2001, 22 (2), 141–164.
Calonico, Sebastian, Matias Cattaneo, and Rocio Titiunik, “Robust Nonparametric ConfidenceIntervals for Regression-Discontinuity Designs,” Econometrica, 6 2014, 82, 2295–2326.
Carrillo, Juan D and Thomas Mariotti, “Strategic ignorance as a self-disciplining device,” The
Review of Economic Studies, 2000, 67 (3), 529–544.
Chen, Cynthia, Don Varley, and Jason Chen, “What Affects Transit Ridership? A DynamicAnalysis Involving Multiple Factors, Lags and Asymmetric Behavior,” Urban Studies, 7 2011,48, 1893–1908.
Cohen, Anna-Lisa and Peter M Gollwitzer, The cost of remembering to remember: Cognitive
load and implementation intentions influence ongoing task performance 2008.
Davis, Lucas W, “Estimating the price elasticity of demand for subways: Evidence from Mexico,”Regional Science and Urban Economics, 2021, 87, 103651.
Dorfman, Robert, “Incidence of the Benefits and Costs of Environmental Programs,” The Ameri-
can Economic Review, 1977, 67, 333–340.
Feudner, Luke E. G., “The Poverty of Wealth and Income in the United States,” College of Pro-
fessional Studies Professional Projects, 2011.
Gertler, Paul, Luis Locay, and Warren Sanderson, “Are user fees regressive?: The welfareimplications of health care financing proposals in Peru,” Journal of Econometrics, 1987, 36,67–88.
25

Graham, Daniel J, Daniel Hörcher, Richard J Anderson, and Prateek Bansal, “Quantifyingthe ex-post causal impact of differential pricing on commuter trip scheduling in Hong Kong,”Transportation Research Part A: Policy and Practice, 2020, 141, 16–34.
Grainger, Corbett A. and Charles D. Kolstad, “Who Pays a Price on Carbon?,” Environmental
and Resource Economics, 2010, 46, 359–376.
Homonoff, Tatiana A, “Can small incentives have large effects? The impact of taxes versusbonuses on disposable bag use,” American Economic Journal: Economic Policy, 2018, 10 (4),177–210.
Imbens, Guido and Karthik Kalyanaraman, “Optimal Bandwidth Choice for the RegressionDiscontinuity Estimator,” Review of Economic Studies, 2012, 20, 1–27.
jia Wang, Zi, Xiao hong Li, and Feng Chen, “Impact evaluation of a mass transit fare changeon demand and revenue utilizing smart card data,” Transportation Research Part A: Policy and
Practice, 2015, 77, 213–224.
Jong, Gerard De and Hugh Gunn, “Recent Evidence on Car Cost and Time Elasticities of TravelDemand in Europe,” Journal of Transport Economics and Policy, 5 2001, 35, 137–160.
Kennickell, Arthur B and Myron L Kwast, Who Uses Electronic Banking?: Results from the
1995 Survey of Consumer Finances, Division of Research and Statistics, Division of MonetaryAffairs, Federal Reserve Board, 1997.
Klee, Elizabeth, “Paper or plastic? The effect of time on the use of check and debit cards atgrocery stores,” 2006.
Leape, Jonathan, “The London Congestion Charge,” Journal of Economic Perspectives, 2006,20, 157–176.
McMillen, Daniel and Ruchi Singh, “Assessment Regressivity and Property Taxation,” The Jour-
nal of Real Estate Finance and Economics, 2020, 60 (1), 155–169.
Oates, Wallace E and William A Fischel, “Are local property taxes regressive, progressive, orwhat?,” National Tax Journal, 2016, 69 (2), 415.
Palma, André De and Robin Lindsey, “Transport User Charges and Cost Recovery,” Research
in Transportation Economics, 2007, 19, 29–57.
26
Piauilino, DC, OFA Bueno, S Tufik, LR Bittencourt, R Santos-Silva, H Hachul, C Gorenstein,and S Pompéia, “The Prospective and Retrospective Memory Questionnaire: A population-based random sampling study,” Memory, 2010, 18 (4), 413–426.
Schmalensee, Richard, “Payment Systems and Interchange Fees,” The Journal of Industrial Eco-
nomics, 2002, 50 (2), 103–122.
Schwartz, Marius and Daniel R. Vincent, “The No Surcharge Rule and Card User Rebates:Vertical Control by a Payment Network,” Review of Network Economics, 2006, 5, 1446–9022.
Shy, Oz and Zhu Wang, “Why do payment card networks charge proportional fees?,” The Amer-
ican Economic Review, 2011, 101, 1575–1590.
Small, Kenneth A. and Erik T. Verhoef, The Economics of Urban Transportation, Routledge,2007.
Smith, Rebekah E, “The cost of remembering to remember in event-based prospective memory:investigating the capacity demands of delayed intention performance.,” Journal of Experimental
Psychology: Learning, Memory, and Cognition, 2003, 29 (3), 347.
Tirachinia, Alejandro and David Henshera, “Multimodal Transport Pricing: First Best, SecondBest and Extensions to Non-motorized Transport,” Transport Review, 2 2012, 32, 181–202.
Urahn, Susan K., Travis Plunkett, Nick Bourke, Alex Horowitz, and Walter Lake, “WhyAmericans Use Prepaid Cards: A Survey of Cardholders’ Motivations and Views,” The Pew
Charitable Trusts, 2014.
Vickrey, William, “A Proposal for Revising New York’s Subway Fare Structure,” Operations
Research, 2 1955, 3(1), 38–68.
, “Pricing in Urban and Suburban Transport,” American Economic Review, 1963, 53, 452–465.
Vigna, Stefano Della and Ulrike Malmendier, “Paying not to go to the gym,” The American
Economic Review, 2006, 96 (3), 694–719.
27

Table 1: Recent History of MTA Policy Changes
Date Jun 28, 2009 - Dec 30, 2010 - Mar 3, 2013 - Mar 22, 2015 -Dec 29, 2010 Mar 2, 2013 Mar 21, 2015 Mar 18, 2017
Base fare ($) 2.25 2.25 2.50 2.757-day-unlimited ($) 27 29 30 3130-day-unlimited ($) 89 104 112 116.50Single-ride 2.25 2.50 2.75 3.00
tickets ($)$1 Card Fee on new No No Yes* YesMetroCard purchase
Bonus for Pay-Per-Ride, 15%($8) 7%($10) 5%($5) 11%($5.50)%(threshold)
* The main policy change that concerns this paper is the imposition of $1 card fee on new MetroCard purchases.
28
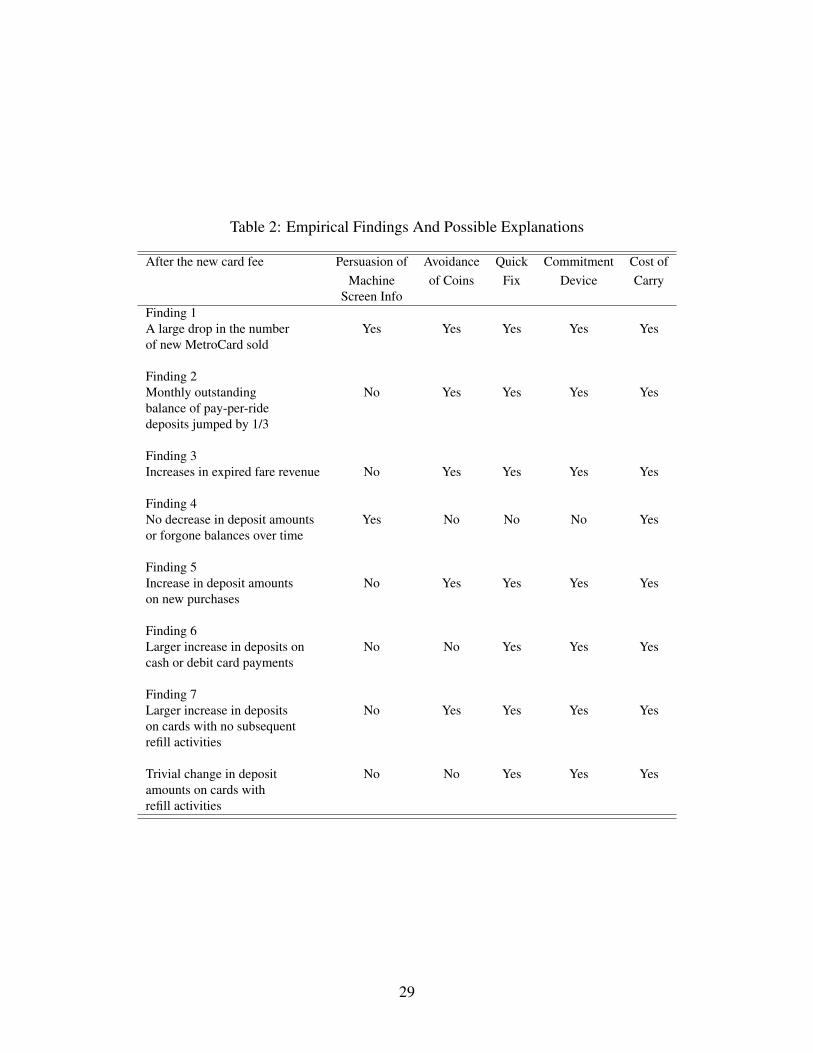
Table 2: Empirical Findings And Possible Explanations
After the new card fee Persuasion of Avoidance Quick Commitment Cost ofMachine of Coins Fix Device Carry
Screen InfoFinding 1A large drop in the number Yes Yes Yes Yes Yesof new MetroCard sold
Finding 2Monthly outstanding No Yes Yes Yes Yesbalance of pay-per-ridedeposits jumped by 1/3
Finding 3Increases in expired fare revenue No Yes Yes Yes Yes
Finding 4No decrease in deposit amounts Yes No No No Yesor forgone balances over time
Finding 5Increase in deposit amounts No Yes Yes Yes Yeson new purchases
Finding 6Larger increase in deposits on No No Yes Yes Yescash or debit card payments
Finding 7Larger increase in deposits No Yes Yes Yes Yeson cards with no subsequentrefill activities
Trivial change in deposit No No Yes Yes Yesamounts on cards withrefill activities
29

Table 3: Monthly New Card Sales Before And After the New Card Fee (In millions)
Before After(Jan 2009 to Feb 2013) (Mar 2013 to Jun 2015)
Number Percent Number Percent p-value(1) (2) (3) (4) (5)
Total 7.70 1 2.32 1(0.55) (0.39)
Pay-per-ride 5.84 0.758 1.826 0.791 <0.0001*(0.47) (0.011) (0.28) (0.01)
30-day-unlimited 0.58 0.076 0.15 0.063 <0.0001*(0.055) (0.01) (0.042) (0.01)
7-day-unlimited 1.26 0.163 0.339 0.144 <0.0001*(0.079) (0.005) (0.076) (0.01)
N 104 104 112 112
Standard deviations in parenthesesTable reports mean values of each variable∗ p-value of mean difference in percent sales before and after the new card fee was imple-mented.
Table 4: Effect of New Card Fee on Daily Total New MetroCard Sales
(1) (2) (3)Sales Sales Sales
Card Fee -125286*** -124822*** -163102***(6634) (4975) (19695)
Day of Week FE No Yes Yes
Month Fixed Effects (FE) No No Yes
Observations 120 120 120R2 0.751 0.868 0.879
Outcome variable: total new card sales on daily basis from January 1, 2013 toApril 30, 2013
Note: Robust standard errors in parentheses.+ p < 0.1 * p < 0.05, ** p < 0.01, *** p < 0.001
30

Table 5: Effect of New Card Fee on Daily New MetroCard Sales By Different Types of Cards
(1) (2) (3)Pay-per-ride 7-day-unlimited 30-day-unlimited
Card Fee -120825*** -22733*** -24305***(13076) (4325) (4886)
Day of Week FE Yes Yes Yes
Month Fixed Effects (FE) Yes Yes Yes
Observations 120 120 120R2 0.906 0.854 0.554
Outcome variable: new card sales on daily basis from January 1, 2013 to April 30,2013
Note: Robust standard errors in parentheses.+ p < 0.1 * p < 0.05, ** p < 0.01, *** p < 0.001
31

Table 6: Effect of New Card Fee on Deposit Amounts: RD Regressions ($)
(1) (2) (3)
Card Fee 1.614*** 1.644*** 0.933***(0.062 ) (0.058 ) (0.011 )
AM Early Hrs –0.697*** –0.755*** –0.235***(0:01-6:29am) (0.120 ) (0.118 ) (0.014 )
AM Rush Hrs 0.736*** 0.574*** 1.078***(6:30-10:00am) (0.102 ) (0.095 ) (0.008 )
AM Late Hrs –0.147*** –0.170*** –0.051***(10:00-1:00pm) (0.031 ) (0.031 ) (0.009 )
PM Rush Hrs 1.174*** 1.149*** 0.741***(4:30-8:00pm) (0.060 ) (0.057 ) (0.009 )
PM Late Hrs –0.293*** –0.246*** –0.486***(8:00-11:59pm) (0.055 ) (0.054 ) (0.011 )
Card Fee * AM Early Hrs 0.494*** 0.491*** 0.661***(0.067 ) (0.068 ) (0.029 )
Card Fee * AM Rush Hrs 0.379*** 0.318*** 0.347***(0.034 ) (0.033 ) (0.015 )
Card Fee * AM Late Hrs 0.240*** 0.232*** 0.117***(0.024 ) (0.025 ) (0.016 )
Card Fee * PM Rush Hrs –0.310*** –0.333*** –0.265***(0.048 ) (0.049 ) (0.016 )
Card Fee * PM Late Hrs –0.058 –0.072* 0.107***(0.035 ) (0.035 ) (0.021 )
Day of Week FE No Yes Yes
Station Fixed Effects (FE) No No Yes
Observations 13260141 13260141 13260141R2 0.011 0.015 0.011
Dependent variable: deposit amounts at new pay-per-ride purchases.Standard Deviation in parentheses and clustered at station level. Thesample is limited to all deposit transactions made to new pay-per-ride MetroCards from January 1, 2013 to Aril 30, 2013. The co-efficients reported here are based on default bandwidth with localquadratic described in Calonico et. al(2014).
+ p < 0.1 * p < 0.05, ** p < 0.01, *** p < 0.001
32

Table 7: Median Neighborhood Income and Pay-per-ride Deposit Amounts ($)
Total New
(1) (2) (3) (4)
Income(log) 0.221*** 0.220*** 0.245*** 0.242***(0.001 ) (0.001 ) (0.001 ) (0.001 )
Card Fee 0.129*** 0.123*** 0.411*** 0.404***(0.012 ) (0.011 ) (0.014 ) (0.014 )
Card Fee*Income(log) –0.6*** –0.5*** –0.30*** –0.30***(0.001 ) (0.001 ) (0.001 ) (0.001 )
Day of Week FE No Yes No Yes
Observations 68632976 68632976 13659758 13659758R2 0.015 0.020 0.015 0.020
Dependent variable: transaction-level deposit amounts to pay-per-rideMetroCards. The sample is limited to all deposit transactions to pay-per-ride MetroCards from January 1, 2013 to Aril 30, 2013. StandardDeviation in parentheses and clustered at station level.
* p < 0.05, ** p < 0.01, *** p < 0.001
Table 8: Median Neighborhood Income and Ridership At Station-level
Pay-per-ride 7-day 30-day
(1) (2) (3) (4) (5) (6)
Income(log) 0.293* 0.293* –0.155 –0.155 0.663*** 0.663***(0.115 ) (0.115 ) (0.125 ) (0.125 ) (0.124 ) (0.124 )
Card Fee –0.184 –0.186 0.347 0.340 0.113 0.102(0.240 ) (0.239 ) (0.279 ) (0.279 ) (0.210 ) (0.210 )
Card Fee*Income(log) 0.014 0.014 –0.003 –0.003 –0.013 –0.013(0.024 ) (0.024 ) (0.029 ) (0.029 ) (0.021 ) (0.021 )
Month of year FE No Yes No Yes No Yes
Observations 34132 34132 34087 34087 34078 34078R2 0.040 0.041 0.051 0.054 0.144 0.150
Dependent variable: weekly rides from different types of MetroCards. The sample islimited to weekly MetroCard swipes from January 2010 to May 2015. Standard De-viation in parentheses and clustered at station level
* p < 0.05, ** p < 0.01, *** p < 0.001
33

Table 9: Conditions to Keep a Pay-per-ride MetroCard When Card Balance is Zero
Keep the same card for next day Condition to Carry the Same CardSave on card fee Loss on Carrying cost When Card Balance is Zero
No Card Fee 0 ei ei = 0
With Card Fee qiT ei ei < qiT
Table 10: Conditions to Prepay for Rides in the Second Day
Cost Function Decision VariablesCondition to Prepay
for Rides in theSecond Day
With Card Fee
4p+ ei + ciEi,1 = Ci,1 = 1 and Ci,2 = 1
ei + (1− qi)2p< qici
Di,1 = 4p and Di,2 = 0
(1 + qi)2p+ ei + (1 + qi)ciEi,1 = Ci,1 = Ci,2 = 1
Di,1 = Di,2 = 2p
(1 + qi)2p+ (1 + qi)ciEi,1 = 0 and Ci,1 = Ci,2 = 1
Di,1 = Di,2 = 2p
With Card Fee
4p+ ei + ci + TEi,1 = Ci,1 = 1 and Ci,2 = 1 If ei < qiT
(1− qi)2p < qiciDi,1 = 4p and Di,2 = 0
(1 + qi)2p+ ei + (1 + qi)ci + TEi,1 = Ci,1 = Ci,2 = 1
Di,1 = Di,2 = 2p If ei ≥ qiTei + (1− qi)2p
< qi(ci + T )(1 + qi)2p+ (1 + qi)ci + (1 + qi)TEi,1 = 0 and Ci,1 = Ci,2 = 1
Di,1 = Di,2 = 2p
Table 11: Welfare Analysis: Cost of Rides for n = 2 Case
No Card Fee With Card Fee Changes in UtilityA −(ci + 2p)− qi(ci + 2p) −(ci + 2p)− ei − qi(ci + 2p) −eiB −(ci + 2p)− qi(ci + 2p) −(ci + 2p)− qi(ci + 2p+ T ) −qiTC −(ci + 2p)− qi(ci + 2p) −(ci + 4p)− ei −ei − (1− qi)2p+ qiciD −(ci + 4p)− ei −(ci + 4p)− ei No change
34

Table 12: Shares of Deposit Choices (percent)
Deposit AmountNo Card Fee With Card Fee
Observed Predicted Observed PredictedOther Amount
66.19 64.87 39.14 31.49(˜ $5)
1st Default22.91 21.63 37.71 39.64
Cards With Choice (˜ $10)
No Refills 2nd Default9.46 13.07 20.15 27.88
Choice (˜ $20)
3rd Default1.44 0.43 3.00 0.98
ChoiceOther Amount
37.87 40.10 32.79 36.24(˜ $5)
1st Default38.75 41.85 43.33 46.65
Cards With Choice (˜ $10)
Refills 2nd Default18.83 13.05 20.51 17.02
Choice (˜ $20)
3rd Default4.55 5.00 3.37 0.09
Choice
Table 13: Parameter Estimates
Parameter EstimateE[qi] Mean of Probability 0.62σ[qi] Standard Error of Probability 0.34E[ci] Mean of Cost 1.45σ[ci] Standard Error of Cost 0.56E[ei] Mean of Carrying Cost 0.83σ[ei] Standard Error of Carrying Cost 0.53
35

Table 14: Comparison of Rides Costs Pay-per-ride versus 7-day-unlimited
Rides Dec 30, 2010 to Mar 2, 2013 Mar 3, 2013 to Mar 21, 20157% bonus for every $10 5% bonus for every $5
Pay-per-ride 7-day-unlimited Pay-per-ride 7-day-Unlimited1 2.25 29 2.5 302 4.5 29 5.0 30... ... ... ... ...12 25.23 29 28.57 3013 27.34 29 30.95 3014 29.44 29 33.33 30
Table 14 compares costs of trips using pay-per-ride versus 7-day-unlimitedcards. The red oval circles mark the threshold number of trips needed to switchfrom pay-per-ride to 7-day-unlimited before versus after the new card fee wasimplemented.
Table 15: Comparison of Rides Costs Pay-per-ride versus 30-day-unlimited
Rides Dec 30, 2010 to Mar 2, 2013 Mar 3, 2013 to Mar 21, 20157% bonus for every $10 5% bonus for every $5
Pay-per-ride 30-day-unlimited Pay-per-ride 30-day-Unlimited1 2.25 104 2.5 1122 4.5 104 5.0 112... ... ... ... ...47 98.83 104 111.90 11248 100.93 104 114.29 11249 103.04 104 116.67 11250 105.14 104 119.05 112
Table 15 compares costs of trips using pay-per-ride versus 30-day-unlimited cards.The red oval circles mark the threshold number of trips needed to switch frompay-per-ride to 30-day-unlimited before versus after the new card fee was imple-mented.
36
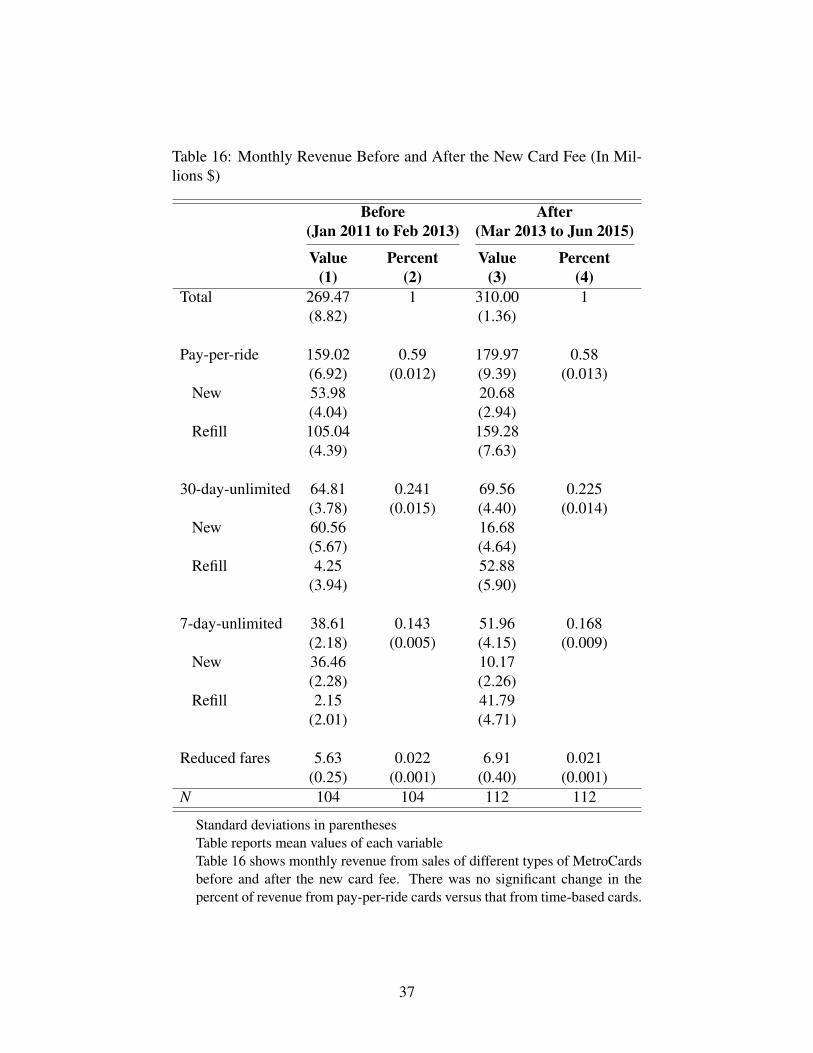
Table 16: Monthly Revenue Before and After the New Card Fee (In Mil-lions $)
Before After(Jan 2011 to Feb 2013) (Mar 2013 to Jun 2015)
Value Percent Value Percent(1) (2) (3) (4)
Total 269.47 1 310.00 1(8.82) (1.36)
Pay-per-ride 159.02 0.59 179.97 0.58(6.92) (0.012) (9.39) (0.013)
New 53.98 20.68(4.04) (2.94)
Refill 105.04 159.28(4.39) (7.63)
30-day-unlimited 64.81 0.241 69.56 0.225(3.78) (0.015) (4.40) (0.014)
New 60.56 16.68(5.67) (4.64)
Refill 4.25 52.88(3.94) (5.90)
7-day-unlimited 38.61 0.143 51.96 0.168(2.18) (0.005) (4.15) (0.009)
New 36.46 10.17(2.28) (2.26)
Refill 2.15 41.79(2.01) (4.71)
Reduced fares 5.63 0.022 6.91 0.021(0.25) (0.001) (0.40) (0.001)
N 104 104 112 112
Standard deviations in parenthesesTable reports mean values of each variableTable 16 shows monthly revenue from sales of different types of MetroCardsbefore and after the new card fee. There was no significant change in thepercent of revenue from pay-per-ride cards versus that from time-based cards.
37
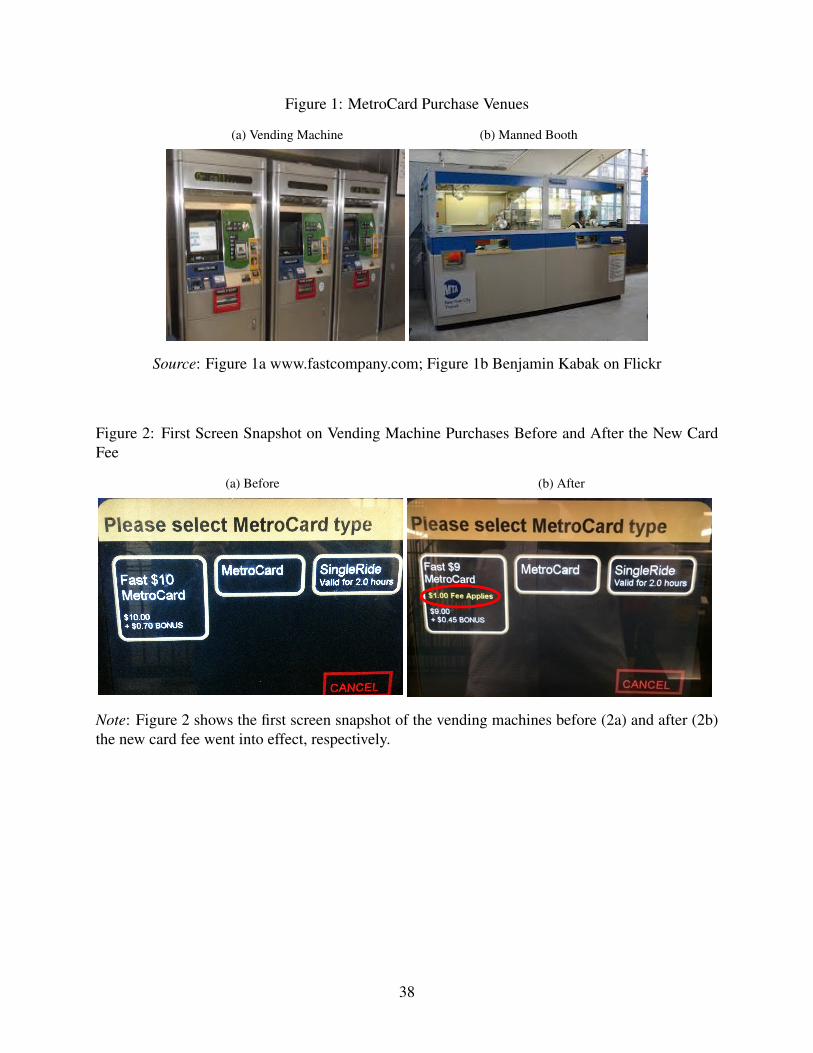
Figure 1: MetroCard Purchase Venues
(a) Vending Machine (b) Manned Booth
Source: Figure 1a www.fastcompany.com; Figure 1b Benjamin Kabak on Flickr
Figure 2: First Screen Snapshot on Vending Machine Purchases Before and After the New CardFee
(a) Before (b) After
Note: Figure 2 shows the first screen snapshot of the vending machines before (2a) and after (2b)the new card fee went into effect, respectively.
38

Figure 3: Monthly New MetroCard Sales From January 2009 to June 2015
(a) Total (b) Pay-per-ride
(c) 30-day-unlimited (d) 7-day-unlimited
Note: Figure 3 plots monthly new MetroCard sales from January 2009 to June 2015, broken outfor different types of MetroCards. The vertical line marks the month when the new card fee wasimplemented.
39

Figure 4: Daily New MetroCards Sales (All Types) from January 1, 2013 to April 30, 2013
(a) Raw (b) Adjusted
Figure 4a plots daily new MetroCard sales (all types) from January 1, 2013 to April 30, 2013.Figure 4b plots residual of daily sales from day of week fixed effects. The vertical line marks theday when the new card fee was implemented.
Figure 5: Daily Sales of New Pay-per-ride MetroCards from January 1, 2013 to April 30, 2013
(a) Raw (b) Adjusted
Note: Figure 5a plots daily sales of new pay-per-ride MetroCards from January 1, 2013 to April30, 2013. Figure 5b plots residual of daily sales from day of week fixed effect. The vertical linemarks the day when the new card fee was first imposed
40

Figure 6: Daily Sales of New 7-day-unlimited MetroCards from January 1, 2013 to April 30, 2013
(a) Raw (b) Adjusted
Note: Figure 6a plots daily sales of new 7-day-unlimited MetroCards from January 1, 2013 toApril 30, 2013. Figure 6b plots residual of daily sales from day of week fixed effects. The verticalline marks the day when the new card fee was first imposed
Figure 7: Daily Sales of New 30-day-unlimited MetroCards from January 1, 2013 to April 30,2013
(a) Raw (b) Adjusted
Note: Figure 7a plots daily sales of new 30-day-unlimited MetroCards from January 1, 2013 toApril 30, 2013. Figure 7b plots residual of daily sales from day of week fixed effects. The verticalline marks the day when the new card fee was first imposed
41

Figure 8: Monthly Outstanding Balance of Pay-per-ride Deposits from January 2008 to April 2015
Note: Figure 8 plots monthly outstanding balance of pay-per-ride deposits from January 2008 toApril 2015. The aggregate monthly outstanding balance that riders carry on their MetroCards isdefined as the difference between the total amount they loaded on the cards and reductions causedby swipes at turnstiles. The first vertical line (purple) marks the month when the 2009 fare hikewent into effect, the second vertical line (green) marks the month when the 2010 fare hike wentinto effect, and the third vertical line (red) marks the month when the new card fee was introduced(also the month when the 2013 fare hike went into effect). The fourth vertical line (purple) marksthe month when the 2015 fare hike went into effect. The lines plot fitted values of locally weightedregressions (using Stata’s lowess command) of outstanding balance on time.
42

Figure 9: Aggregate Forgone Balances on Pay-per-ride MetroCards Initially Purchased BetweenJanuary 1, 2013 and April 30, 2013
Note: Figure 9 plots the aggregate forgone balances on pay-per-ride MetroCards initially purchasedbetween January 1, 2013 and April 30, 2013. The forgone balances on pay-per-ride MetroCards isdefined as the unspent balances on expired MetroCards. The vertical line marks the day when thenew card fee was first imposed.
43

Figure 10: Weekly Total Number of MetroCard Swipes from January 2011 to May 2015
Note: Figure 10 plots weekly total number of MetroCard swipes from January 2011 to May 2015.The vertical line (red) marks the week when the new card fee went into effect.
Figure 11: Monthly Revenue from Pay-per-ride Deposits from January 1, 2011 to April 30, 2015
(a) (b)
Note: Figure 11a plots monthly revenue of pay-per-ride deposits from January 2011 to April 2015.The vertical line (red) marks the month when the new card fee went into effect. Figure 11b plotsyear-to-year monthly revenue of pay-per-ride deposits from January 2012 to December 2014.
44

Figure 12: Deposits on New Pay-per-ride MetroCard Purchases Before versus After the New CardFee (From January 1, 2013 To April 30, 2013): Cumulative Distribution Function
(a) Total
0
.2
.4
.6
.8
1
Cum
ulat
ive
Pro
babi
lity
0 5 10 15 20 25 30 35 40 45 50value($)
Before After
(b) One-week
Note: Figure 12 plots the cumulative distribution function (CDF) for deposit amounts on new pay-per-ride MetroCard purchases before versus after the new card fee. Figure 12a used all the deposittransactions from January 1, 2013 to April 30, 2013. Figure 12b plots deposits of purchases withinone week before and after the new card fee.
Figure 13: Deposits on New Pay-per-ride MetroCard Purchases Before and After the New CardFee (From January 1, 2013 To April 30, 2013): Histogram
(a) Total (b) One-week
Note: Figure 13 plots the histogram of deposit amounts on new pay-per-ride MetroCard purchasesbefore versus after the new card fee. Figure 13a used all the deposit transactions from January 1,2013 to April 30, 2013. Figure 13b plots deposits of purchases within one week before and afterthe new card fee.
45

Figure 14: Deposits on New Pay-per-ride MetroCard Purchases Before and After the New CardFee (From January 1, 2013 To April 30, 2013): Cumulative Distribution Function
(a) No Refills (b) With Refills
Note: Figure 14 plots the cumulative distribution function for deposits on new pay-per-ride pur-chases before and after the new card fee. Figure 14a plots the cumulative distribution function fordeposits on new pay-per-ride purchases without subsequent refill activities. Figure 14b plots thecumulative distribution function for deposits on new pay-per-ride purchases with subsequent refillactivities.
Figure 15: Deposits on New Pay-per-ride MetroCard Purchases Before and After the New CardFee (From January 1, 2013 To April 30, 2013): Histogram
(a) No Refills (b) With refills
Note: Figure 15 plots the histogram for deposits on new pay-per-ride purchases before and afterthe new card fee (from January 1, 2013 to April 30, 2013). Figure 15a plots the histogram fordeposits on new pay-per-ride purchases without subsequent refill activities. Figure 15b plots thehistogram for deposits on new pay-per-ride purchases with subsequent refill activities.
46

Figure 16: Changes in Deposits and Forgone Balances on New Pay-per-ride MetroCards By Dif-ferent Payment Methods (January 1, 2013 To April 30, 2013): Cumulative Distribution Function
(a) Deposits (Cash) (b) Forgone Balances (Cash)
(c) Deposits (Debit) (d) Forgone Balances (Debit)
(e) Deposits (Credit) (f) Forgone Balances (Credit)
Note: Figure 16 plots the cumulative distribution function for deposits and forgone balances onnew pay-per-ride MetroCards before and after the new card fee, broken out for different paymentmethods. Figure 16a-16b plot the charts for cash purchases. Figure 16c-16d plot the charts fordebit card purchases. Figure 16e-16f plot the charts for credit card purchases.47
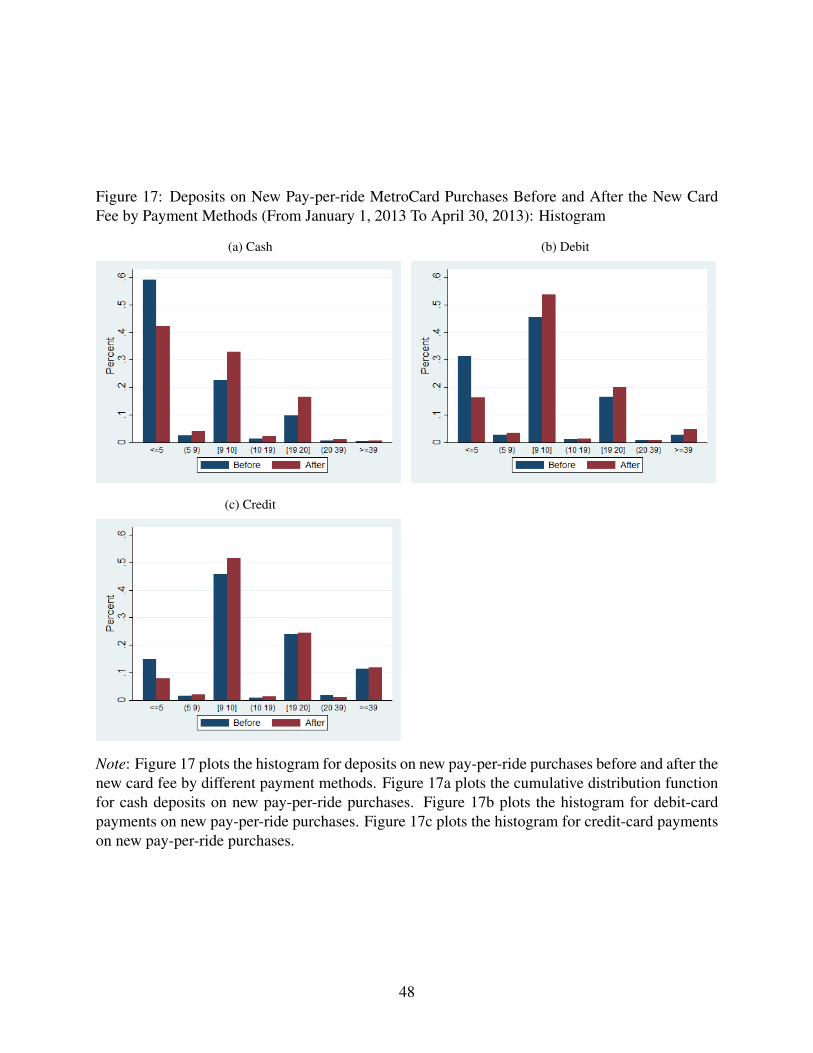
Figure 17: Deposits on New Pay-per-ride MetroCard Purchases Before and After the New CardFee by Payment Methods (From January 1, 2013 To April 30, 2013): Histogram
(a) Cash (b) Debit
(c) Credit
Note: Figure 17 plots the histogram for deposits on new pay-per-ride purchases before and after thenew card fee by different payment methods. Figure 17a plots the cumulative distribution functionfor cash deposits on new pay-per-ride purchases. Figure 17b plots the histogram for debit-cardpayments on new pay-per-ride purchases. Figure 17c plots the histogram for credit-card paymentson new pay-per-ride purchases.
48

Figure 18: Percent of Cash Payments Across Different Subway Stations From January 2013 ToApril 2013
Note: Figure 18 plots the spatial differences in percent of cash payments for MetroCard purchasesacross different census tracts. The census-tract level per-capita income data is from AmericanCommunity Survey (ACS) 2009–2013 (5-Year Estimates)
49

Figure 19: Threshold of Prepaying for Rides in the Second Day For n = 2 Case
(a) No Card Fee (b) With Card Fee
(c) With Card Fee (Changes)
Figure 19 shows the threshold of prepaying for rides in the second day for n = 2 case with no newcard fee (19a) and without a new card fee (19c), respectively. Before the new card fee was imposed,riders in region C only deposited fare of the first day’s rides since the cost to make deposits in thesecond day is smaller than the cost to remember to carry the same card to the second day and therisk of losing the prepaid deposit. After the new card fee was imposed, these riders switched toprepaying for rides in the second day as the cost to make deposits and the cost of the new card feeare larger than the cost to remember to carry the same card to the second day and the risk of losingthe prepaid deposit. As a result, they lose 2p on expired MetroCards if they do not actually takerides in the second day (Table 11).
50

Figure 20: Threshold of Prepaying for Rides in the Second and Third Day For n = 3 Case
(a) No Card Fee (b) With Card Fee
Figure 20 shows the threshold of prepaying for rides in the second and third day for n = 3 casewhen no card fee is imposed (20a) and when a card fee is imposed (20b), respectively. Beforethe new card fee was imposed, riders in region D only deposited the fare of the first day’s ridessince the cost to make deposits in the second day is smaller than the cost to remember to carrythe same card to the second day and the risk of losing the prepaid deposit. After the new card feewas imposed, these riders switched to prepaying for rides in the second day as the cost to makedeposits and the cost of the new card fee are larger than the cost to remember to carry the same cardto the next day and the risk of losing prepaid deposit. As a result, these riders lose 2p on expiredMetroCards if they do not actually take rides in the second day. Analogously, riders in region Eswitched from prepaying for rides in the second day to prepaying for rides in the second day andthe third day after the new card fee was imposed.
Figure 21: Threshold of Prepaying for Rides in Future Days For n = 30 Case (No Card Fee)
Note: For the n = 30 case, according to the model, there will be thirty regions ranging from noprepay for future rides (region A) to prepay for rides in the next 29 days (region H) when no cardfee is charged for new MetroCard purchases.
51

Figure 22: Default Choices of Deposit Amounts on Vending Machine Screen Before and After theNew Card Fee
(a) Screen Before (b) Cumulative Distribution Before
(c) Screen After (d) Cumulative Distribution After
Note: Figure 22a and 22c show the suggested deposit amounts on vending machine screen beforeand after the new card fee went into effect, respectively. Figure 22b and 22d plot the cumulativedistribution function (CDF) for deposit amounts on new pay-per-ride MetroCards before and afterthe new card fee was imposed, respectively.
52

Figure 23: Default Choices of Deposit Amounts For n = 30 Case
(a) No Card Fee
(b) With Card Fee
(c) With Card Fee (Changes)
Figure 23 shows the threshold of choosing different deposit amounts for n = 30 case when nocard fee is imposed (23a) and when a card fee is imposed (23b), respectively. Riders in regionA′ switched from choosing “Other Amounts” to choosing “1st default choice ($10)” after the newcard fee was imposed. Riders in region B′ switched from choosing “1st default choice ($10)”to choosing “2nd default choice ($20)” after the new card fee was imposed. Riders in region C ′
switched from choosing “2nd default choice ($20)” to choosing “3rd default choice ($40)” afterthe new card fee was imposed. 53

Figure 24: Daily Total Number of Pay-per-ride MetroCard Purchases From January 1, 2013 ToApril 30 2013 By Deposit Amounts
(a) ˜$5 (b) ˜$10
(c) ˜$20 (d) $40˜$50
Note: Figure 24a plots daily total number of MetroCard purchases (new and refills) from January1, 2013 to April 30, 2013. Figure 24b plots residual of daily total number of MetroCard purchases(new and refills) from day of week fixed effect. The vertical line marks the day when the new cardfee was implemented.
54

Figure 25: Changes in Average Deposit Amounts For Pay-per-ride MetroCards Linked to the SameRider Using MetroCard Trade-in and Trade-out Data (January 1, 2013 To December 31, 2013)
(a) ˜$5 Deposit Amounts Before the New Card Fee (b) ˜$10 Deposit Amounts Before the New Card Fee
Note: Figure 25a and 25b show average deposit amounts for pay-per-ride MetroCards linked to thesame rider using MetroCard trade-in and trade-out data, by ˜$5 and ˜$10 average deposit amountsbefore the new card fee was implemented, respectively. X-axis shows the order of MetroCardspurchased: the number 1 represents the first MetroCard purchased by a rider after the new card feewas introduced, the number -1 represents the last MetroCard purchased by the same rider beforethe new card fee was implemented, and so on.
Figure 26: Changes in Deposit Amounts After the New Card Fee For Pay-per-ride MetroCardsLinked to the Same Rider Using MetroCard Trade-in and Trade-out Data (January 1, 2013 ToDecember 31, 2013): Cumulative Distribution Function
(a) ˜$5 Deposit Amounts Before the New Card Fee (b) ˜$10 Deposit Amounts Before the New Card Fee
Note: Figure 26a and 26b show cumulative distribution function for deposit amounts after the newcard fee, by ˜$5 and ˜$10 average deposit amounts before the new card fee was implemented,respectively.
55

Figure 27: Proposed Default Choices of Deposit Amounts on Touchscreen
Figure 28: Monthly Sales of Single-ride Tickets From January 2011 To June 2015
56

Figure 29: Daily Total Number of MetroCard Purchases From January 1, 2013 To April 30, 2013:New and Refills
(a) 7-day-unlimited Raw (b) 7-day-unlimited Adjusted
(c) 30-day-unlimited Raw (d) 30-day-unlimited Adjusted
Note: Figure 29a plots daily total number of 7-day-unlimited MetroCard purchases (new and re-fills) from January 1, 2013 to April 30, 2013. Figure 29b plots residual of daily total number of7-day-unlimited MetroCard purchases (new and refills) from day of week fixed effect. Figure 29cplots daily total number of 30-day-unlimited MetroCard purchases (new and refills) from January1, 2013 to April 30, 2013. Figure 29d plots residual of daily total number of 30-day-unlimitedMetroCard purchases (new and refills) from day of week fixed effect. The vertical line marks theday when the new card fee was implemented
57

Figure 30: Deposits on Pay-per-ride MetroCard Purchases Before and After the 2009 Fare Hike(From May 1, 2009 To August 30, 2009): Cumulative Distribution Function
(a) New (b) Refill
Note: Figure 30 plots the cumulative distribution function for deposits on pay-per-ride MetroCardpurchases before and after the 2009 fare hike. Figure 30a plots cumulative distribution function fordeposits on new pay-per-ride MetroCard purchases from May 1, 2009 to August 30, 2009. Figure30b plots the cumulative distribution function for deposits on pay-per-ride refills from May 1, 2009to August 30, 2009.
Figure 31: Deposits on Pay-per-ride MetroCard Purchases Before and After the 2009 Fare Hike(From May 1, 2009 to August 30, 2009): Histogram
(a) New (b) Refill
Note: Figure 31 plots the histogram for deposits on pay-per-ride MetroCard purchases before andafter the 2009 fare hike. Figure 31a plots the histogram for deposits on new pay-per-ride purchasesfrom May 1, 2009 to August 30, 2009. Figure 31b plots the histogram for deposits on pay-per-riderefills from May 1, 2009 to August 30, 2009.
58

Figure 32: Deposits on Pay-per-ride MetroCard Purchases Before and After the 2015 Fare Hike(From January 1, 2015 To May 31, 2015): Cumulative Distribution Function
(a) New (b) Refill
Note: Figure 32 plots the cumulative distribution function for deposits on pay-per-ride MetroCardpurchases before and after the 2015 fare hike. Figure 32a plots cumulative distribution function fordeposits on new pay-per-ride MetroCard purchases from January 1, 2015 to May 31, 2015. Figure32b plots the cumulative distribution function for deposits on pay-per-ride refills from January 1,2015 to May 31, 2015.
Figure 33: Implication of the Models
(a) Skype (b) Reloadable Debit Card
59


![JICA - 国際協力機構 · 2012-09-18 · Transit cargo 3) 4) [insurance] Trucks:148,000 Kip, Passenger cars: 48,000 kip [transit fee] Trucks: 40,000Kip, Passenger cars: 20,000](https://img.pdfslide.net/doc/110x75/5f2645684473ea70a0158682/jica-e-2012-09-18-transit-cargo-3-4-insurance-trucks148000.jpg)