Embed Size (px)
Citation preview
Money-Market Rates and Retail InterestRegulation in China: The Disconnect between
Interbank and Retail Credit Conditions∗
Nathan Porter and TengTeng XuInternational Monetary Fund
Interest rates in China are composed of a mix of bothmarket-determined interest rates (interbank rates and bondyields) and regulated interest rates (retail lending and depositrates), reflecting China’s gradual process of interest rate liber-alization. This paper investigates the main drivers of China’sinterbank rates by developing a stylized theoretical model ofChina’s interbank market and estimating an EGARCH modelfor seven-day interbank repo rates. Our empirical findings sug-gest that movements in administered interest rates (part of thePeople’s Bank of China’s monetary policy toolkit) are impor-tant determinants of market-determined interbank rates, inboth levels and volatility. The announcement effects of reserverequirement changes also influence interbank rates, as wellas liquidity injections from open-market operations in recentyears. Our results indicate that the regulation of key retailinterest rates influences the behavior of market-determined
∗We thank, without implication, the People’s Bank of China, Shaghil Ahmed,Jason Allen, Ron Alquist, Huixin Bi, Nigel Chalk, Robert DeYoung, Kai Guo,Harrison Hong, David Miles, Naoaki Minamihashi, Laura Papi, M. HashemPesaran, Alessandro Prati, Alessandro Rebucci, Tatevik Sekhposyan, Ge Wu,and seminar participants at the 10th Econometric Society World Congress, theCanadian Economic Association Annual Meetings 2012, Cambridge University,the Hong Kong Monetary Authority, the Bank of Canada, and the Bank of Eng-land for their helpful comments. A previous version of this paper, “What DrivesChina’s Interbank Market?”, was issued as IMF Working Paper No. 09/189.The views expressed in this paper are those of the authors and do not neces-sarily represent those of the IMF. Author e-mails: Porter: [email protected]; Xu(corresponding author): [email protected].
143

144 International Journal of Central Banking March 2016
interbank rates, which may have limited their independence asprice signals. Further deposit rate liberalization should allowshort-term interbank rates to play a more effective role as theprimary indirect monetary policy tool.
JEL Codes: E43, E52, E58, and C22.
1. Introduction
Short-term interbank interest rates play an important role in theeconomy. They indicate the state of macroeconomic and liquidityconditions, and provide an important anchor for the pricing of finan-cial assets. In many economies, but not yet in China, they are alsocentral to the implementation of monetary policy. Consequently,large benefits are likely to follow—through the allocation of capi-tal and risk in the economy—from ensuring that short-term fundingrates provide independent market-based price signals. Recognizingthis, China has been gradually liberalizing interest rates for morethan a decade. However, while interbank interest rates and bondyields are now market determined, other key interest rates continueto remain regulated. In particular, there is an administrative cap onretail deposit rates and a floor on retail lending rates.
In this paper, we ask whether short-term interbank rates caneffectively reflect liquidity conditions and provide a basis for assetpricing in China. Our answer is that further reform is needed beforethey can fully play these roles. Although interbank rates are mar-ket determined, these rates are not independent of the regulation ofother key interest rates. Regulating the deposit rate influences thesupply of funds into the financial system and, consequently, affectsliquidity and the interbank rate. Similarly, regulating the lendingrate affects the volume of loans demanded and so should also alterthe interbank rate.
We build on the microeconomic model of the banking sector inFreixas and Rochet (2008) and develop a stylized theoretical modelof China’s banking sector that pins down the analytical relation-ship between regulated and market-determined interest rates. Themodel, although stylized, captures the key features of the interbankmarket and monetary policy in China, including the role of “infor-mal” bank-level credit restrictions and administered interest rates

Vol. 12 No. 1 Money-Market Rates and Retail Interest 145
in monetary policy, the regulated nature of retail interest rates,institutional demand in the interbank market, and a desire to holdexcess reserves. To our knowledge, our paper presents one of thefirst theoretical models of the interbank market in China, wheremarket-determined and regulated interest rates coexist. Our theo-retical model predicts that regulated rates influence interbank rates,and asset valuations made using interbank rates largely reflect theposition of the administered rates, which are adjusted by the Peo-ple’s Bank of China (PBC) on an irregular basis as monetary pol-icy tools. Similarly, interbank rates would less effectively indicatefluctuations in retail credit market conditions.
Our empirical strategy is related to several recent studies on thebehavior of interbank interest rates and the impact of monetarypolicy on the interbank market; see, for example, Hamilton (1996),Bartolini, Bertola, and Prati (2001), Prati, Bartolini, and Bertola(2003), and Bartolini and Prati (2006). Until now, the literature oninterbank markets has largely focused on the interbank rates in G7and euro-area economies, while little has been studied on emerging-market economies such as China. This paper aims to address thisgap and provides, to our knowledge, the first comprehensive analysison the determinants of interbank interest rates in China, taking intoaccount the extent of interest rate liberalization and the institutionalarrangements of key interest rate markets. This is particularly rele-vant for China and other developing countries that have experiencedpartial liberalization of their financial systems. Deregulating partic-ular portions of the financial system (in this case interbank rates)does not ensure that those key interest rates can act as independentprice signals.
As in the empirical studies of mature interbank markets men-tioned above, an EGARCH model (Nelson 1991) of China’s seven-day repo rate is estimated using daily data from April 2003 to April2012, which cover three distinct phases of macroeconomic environ-ments: (i) China’s pre-crisis expansion and period of growing surplusliquidity (reflecting rapid reserve accumulation); (ii) the massivepost-Lehman credit expansion (2008–10); and (iii) the subsequentmonetary tightening beginning in 2010. The results of the estimatedempirical model (presented in section 4) confirm the predictions fromthe theoretical model that China’s interbank rates are not trulyindependent of administered interest rates. In particular, parameter
146 International Journal of Central Banking March 2016
estimates suggest that the interbank rate increases with adminis-tered lending rates and falls with administered deposit rates, evenafter controlling for systematic variations in liquidity throughout theweek, during the month, or due to the timing of the Chinese NewYear. Liquidity injections from reserve requirements do not haveany significant influence on the level of the interbank rate, while theannouncement effect does have a significant impact. Open-marketoperations are found to be significant in driving interbank interestrates in the full sample (but not in a shorter subsample), in both lev-els and volatility. Finally, changes to administered interest rates alsoaffect interbank rate volatility, as do announced changes to reserverequirements and initial public offering (IPO) activities.
Our results indicate that the regulation of key retail interestrates influences the behavior of market-determined interbank inter-est rates and therefore limits their independence as price signals.In more advanced and liberalized money markets, past interest ratemovements and pure liquidity effects related to the reserve mainte-nance period and holidays explain a far larger share of money-marketrate behavior than in China. Further interest rate liberalizationshould work to strengthen the information conveyed by movementsin interbank rates and help to further advance the development ofChina’s financial market. Simultaneously removing the regulatorydistortions in the interbank rate and allowing retail deposit and loanmarkets to clear would help to reconnect wholesale and retail creditconditions. While interest rate volatility may increase after liberal-ization, as has happened elsewhere (Demirguc-Kunt and Detragiache2001), this volatility would be associated with the incorporation ofmacroeconomic and financial news into the pricing of risk and capi-tal. Ultimately, this should be associated with a better allocation ofscarce capital, and contribute to China’s rebalancing toward greaterreliance on domestic consumption and less reliance on exports andinvestment (see, for example, Aziz 2007).
Our paper is structured as follows. Section 2 describes the insti-tutional arrangements of monetary policy and key interest rate mar-kets. Section 3 presents a stylized model of China’s interbank market,reflecting the institutional features highlighted in section 2, includ-ing the regulated nature of retail interest rates, the role of win-dow guidance/quantitative credit controls, and the desire to holdexcess reserves. Section 4 estimates an EGARCH model of China’s

Vol. 12 No. 1 Money-Market Rates and Retail Interest 147
seven-day repo rate, controlling for key variables implied by the styl-ized model, and studies the behavior and drivers of interbank interestrates in China. Section 5 offers some concluding remarks.
2. Monetary Policy and Interest Rates
2.1 Monetary Policy
The PBC’s monetary policy relies on a variety of both direct andindirect instruments.1 While the use of indirect instruments such asopen-market operations has grown rapidly over time, the PBC alsofrequently uses reserve requirements to influence the volume of fundsbanks have available to lend. Moreover, “the government continuesto rely on (bank-specific) quantitative limits to slow credit growth”and uses official “window guidance” to influence the direction ofbank lending (International Monetary Fund 2010).2 The design ofreserve requirements in China is likely to increase the volatility ofmoney markets, since they must be strictly met on a daily basisrather than over a reserve-maintenance period (reserve averaging),as is common in many other countries.3 While banks may hold insuf-ficient reserves before closing, they are penalized for not holdingsufficient reserves at closing. If reserve requirements were met onlyover some reserve-maintenance period rather than on a daily basis,then the volatility of short-term interbank rates would likely belower. This is seen in countries with reserve averaging, where interestrate volatility rises systematically through the reserve-maintenanceperiod, increasing as settlement day approaches (see, for example,
1Direct instruments set prices or quantities through regulation and are aimedat the balance sheets of commercial banks, while indirect instruments operateby influencing underlying demand and supply conditions and are aimed at thebalance sheet of the central bank (Alexander, Enoch, and Balio 1995).
2“Window guidance” is one form of the quantity-based direct monetary pol-icy instruments used in China, which uses benevolent compulsion to persuade thebanking sector and other financial intermediaries to follow official guidelines. ThePBC has a major influence on the lending decisions for the four large state-ownedcommercial banks through the use of “window guidance” (Geiger 2006).
3The reserve-maintenance period refers to a time frame when banks arerequired to hold a certain amount of reserves on their balance sheets. The lengthof these periods varies from country to country: the U.S. averaging is done overa two-week period, while Japan and the euro area average over a month (see, forexample, Prati, Bartolini, and Bertola 2003).
148 International Journal of Central Banking March 2016
Hamilton 1996 and Prati, Bartolini, and Bertola 2003). The one-yearadministered (benchmark) lending and deposit rates are adjusted bythe PBC on an irregular basis, typically in conjunction with move-ments in other monetary policy indicators (i.e., administered ratesof other maturities), although the slope typically changes only at theshort end of the yield curve.4 The PBC also regulates retail interestrates by setting a ceiling on the deposit rates and a floor on lendingrates. Despite this array of instruments, Chinese monetary policyhas relied heavily on quantity-based instruments and administrativemeasures (reserve requirements and window guidance/credit ceil-ings). Indeed Mehrotra, Koivu, and Nuutilainen (2008) argue thatobserved Chinese monetary growth is consistent with a McCallummonetary growth rule (see McCallum 1988, 2003).5
2.2 Regulated and Market-Determined Interest Rates
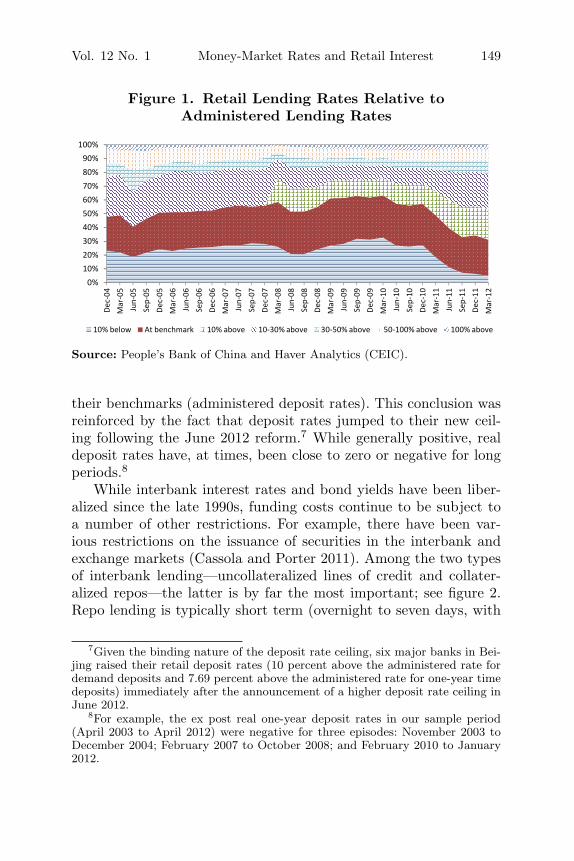
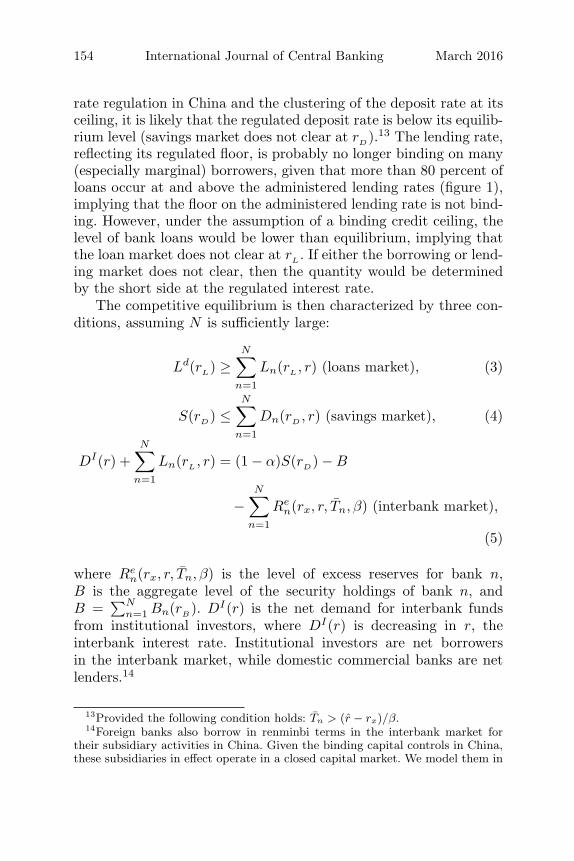
Interest rates in China reflect a mix of regulated and market-determined outcomes. Wholesale interest rates, including interbankrates and bond yields, are largely market determined, while thereremains a floor on retail lending rates and a ceiling on retail depositrates, which in effect protect the profit margins of commercial banks,which average around 3 percent.6 Retail lending rates can typicallybe no lower than 70 percent of the administered lending rate, andretail deposit rates could rise to 110 percent of the administereddeposit rate. As can be seen in figure 1, more than 80 percent ofloans occur at or above the administered lending rate, suggestingthat this rate is not effective. The ceiling on deposit rates is gen-erally considered binding, with deposit rates typically clustered at
4The proportion of adjustment in the administered deposit and lending ratesis typically greater at the front end of the yield curve than at the back end. Forexample, the administered deposit rates were adjusted in February 2011 from2.25 to 2.60 (three month), 2.50 to 2.80 (six month), 2.75 to 3.00 (one year), 3.55to 3.90 (two year), 4.15 to 4.50 (three year), and 4.55 to 5.00 (five year).
5Under the McCallum monetary growth rule, money growth is equal to tar-get (nominal) GDP growth less the velocity growth of money, and plus half theprevious deviation of nominal GDP from its target; see Mehrotra, Koivu, andNuutilainen (2008) for details.
6See a longer working paper version of this study, “What Drives China’s Inter-bank Market?” (Porter and Xu 2009), for a detailed history of China’s interestrate liberalization.
Vol. 12 No. 1 Money-Market Rates and Retail Interest 149
Figure 1. Retail Lending Rates Relative toAdministered Lending Rates
20%
30%
40%
50%
60%
70%
80%
90%
100%
0%
10%
De
c-0
4
Ma
r-0
5
Ju
n-0
5
Se
p-0
5
De
c-0
5
Ma
r-0
6
Ju
n-0
6
Se
p-0
6
De
c-0
6
Ma
r-0
7
Ju
n-0
7
Se
p-0
7
De
c-0
7
Ma
r-0
8
Ju
n-0
8
Se
p-0
8
De
c-0
8
Ma
r-0
9
Ju
n-0
9
Se
p-0
9
De
c-0
9
Ma
r-1
0
Ju
n-1
0
Se
p-1
0
De
c-1
0
Ma
r-1
1
Ju
n-1
1
Se
p-1
1
De
c-1
1
Ma
r-1
2
10% below At benchmark 10% above 10-30% above 30-50% above 50-100% above 100% above
Source: People’s Bank of China and Haver Analytics (CEIC).
their benchmarks (administered deposit rates). This conclusion wasreinforced by the fact that deposit rates jumped to their new ceil-ing following the June 2012 reform.7 While generally positive, realdeposit rates have, at times, been close to zero or negative for longperiods.8
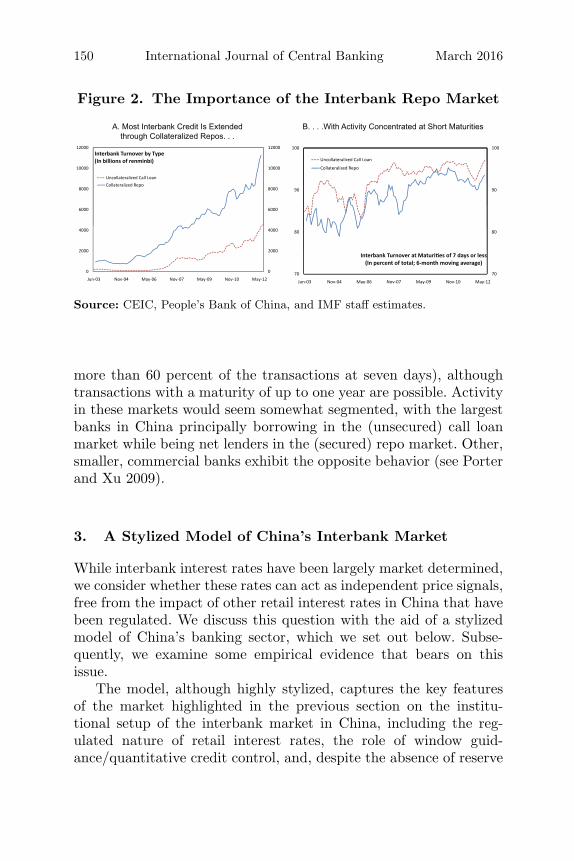
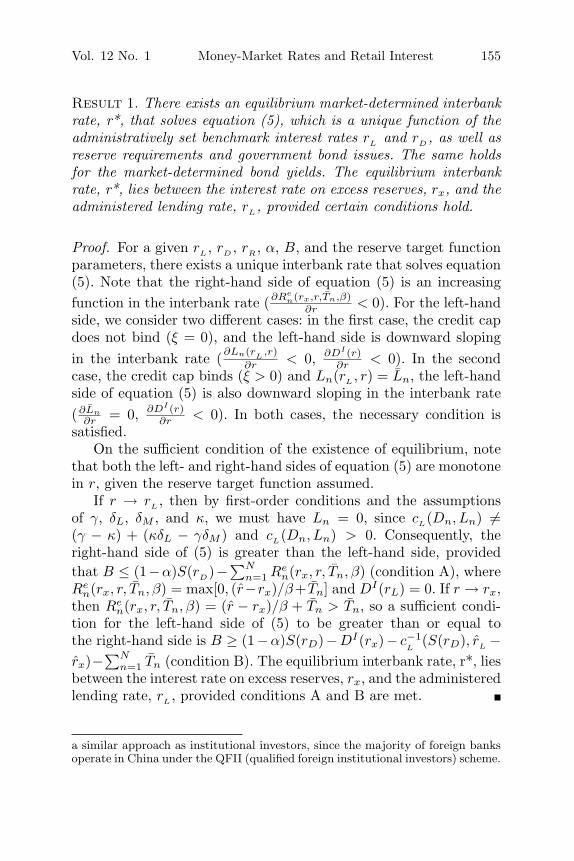
While interbank interest rates and bond yields have been liber-alized since the late 1990s, funding costs continue to be subject toa number of other restrictions. For example, there have been var-ious restrictions on the issuance of securities in the interbank andexchange markets (Cassola and Porter 2011). Among the two typesof interbank lending—uncollateralized lines of credit and collater-alized repos—the latter is by far the most important; see figure 2.Repo lending is typically short term (overnight to seven days, with
7Given the binding nature of the deposit rate ceiling, six major banks in Bei-jing raised their retail deposit rates (10 percent above the administered rate fordemand deposits and 7.69 percent above the administered rate for one-year timedeposits) immediately after the announcement of a higher deposit rate ceiling inJune 2012.
8For example, the ex post real one-year deposit rates in our sample period(April 2003 to April 2012) were negative for three episodes: November 2003 toDecember 2004; February 2007 to October 2008; and February 2010 to January2012.
150 International Journal of Central Banking March 2016
Figure 2. The Importance of the Interbank Repo Market
6000
8000
10000
12000
6000
8000
10000
12000
Interbank Turnover by Type(In billions of renminbi)
Uncollateralized Call Loan
Collateralized Repo
0
2000
4000
0
2000
4000
Jun-03 Nov-04 May-06 Nov-07 May-09 Nov-10 May-12
100100
Uncollateralized Call LoanU co ate a ed Ca oa
Collateralized Repo
9090
8080
Interbank Turnover at Maturi�es of 7 days or less(In percent of total; 6-month moving average)
7070
Jun-03 Nov-04 May-06 Nov-07 May-09 Nov-10 May-12
A. Most Interbank Credit Is Extendedthrough Collateralized Repos. . .
B. . . .With Activity Concentrated at Short Maturities
Source: CEIC, People’s Bank of China, and IMF staff estimates.
more than 60 percent of the transactions at seven days), althoughtransactions with a maturity of up to one year are possible. Activityin these markets would seem somewhat segmented, with the largestbanks in China principally borrowing in the (unsecured) call loanmarket while being net lenders in the (secured) repo market. Other,smaller, commercial banks exhibit the opposite behavior (see Porterand Xu 2009).
3. A Stylized Model of China’s Interbank Market
While interbank interest rates have been largely market determined,we consider whether these rates can act as independent price signals,free from the impact of other retail interest rates in China that havebeen regulated. We discuss this question with the aid of a stylizedmodel of China’s banking sector, which we set out below. Subse-quently, we examine some empirical evidence that bears on thisissue.
The model, although highly stylized, captures the key featuresof the market highlighted in the previous section on the institu-tional setup of the interbank market in China, including the reg-ulated nature of retail interest rates, the role of window guid-ance/quantitative credit control, and, despite the absence of reserve
Vol. 12 No. 1 Money-Market Rates and Retail Interest 151
averaging, a desire to hold excess reserves.9 Following Freixas andRochet (2008), we consider a competitive model of risk-neutral com-mercial banks, where there are N independent price-taking banks,and they optimize over the number of deposits to take and loans tomake in each period. The banks take as given the lending rate (r
L),
the deposit rate (rD), the bond yield (r
B), the reserve remuneration
rate (rR) for required reserves, the reserve remuneration rate (rx)
for excess reserves, and the interbank lending rate (r). The retaillending and deposit rates are regulated off the administered interestrates, which are set by the PBC. Banks are also assumed to faceadministratively set individual lending constraints on the volume ofloans (represented by L̄n).10 Taking into account the need to main-tain some operational excess reserves, management costs, and theneed to withstand deposit fluctuations, we assume that the typicalbank has some liquidity preference β (β > 0) and faces real costswhen their own reserve target, T̄n, is not met (see, for example,Bartolini, Bertola, and Prati 2001). Finally, banks face credit riskon both their retail and wholesale lending portfolios. We assumethat these banks have well-diversified loan portfolios, meaning thatexpected loan losses are the same as actual realized losses.
The profit-maximization problem of bank n is given below:
Πn = maxRe
n,Dn,Ln,Bn,Mn
[r̂
LLn + r̂Mn + r
RαDn + rxRe
n + rBBn
− rDDn − c(Dn, Ln) − β
2(Re
n − T̄n)2],
s.t. Ren ≥ 0, Ln ≤ L̄n,
where r̂L
≡ rL(1 − κ) + κδL; r̂ ≡ r(1 − γ) + γδM . (1)
9The stylized model focuses on the level of interbank rates, to study the ana-lytical relationship between interbank rates and other interest rates. For thepurposes of exposition, we model banks and the interbank market in a determin-istic framework to illustrate the potential spillover from regulated interest ratesto unregulated market-determined ones.
10We abstract from modeling the impact of window guidance on the direc-tion of lending (for example, directed lending to industries with environmen-tally friendly technology or directed lending away from the real estate sec-tor). Instead, we focus on the impact of window guidance and the quantitativecredit ceiling on the total loan target (the volume of loans), to keep the modeltractable.
152 International Journal of Central Banking March 2016
For simplicity, we define r̂L
and r̂ as the default-adjusted loan rateand the interbank interest rate, respectively. The probability κ isthe default rate of bank loans, and γ is the probability of defaultin the interbank market. δL and δM are the recovery rates of loans(one minus the loss-given-default rate) for bank and interbank loans,respectively. We assume that κ > γ and κδL < γδM .11 Mn is thenet position of the bank on the interbank market, Dn is the levelof deposits, and Bn is the security holdings of the bank (which areassumed to be supplied inelastically by the government). αDn is thelevel of required reserves, and Re
n is the level of excess reserves eachbank voluntarily decides to hold. The cost of managing deposits andloans is given by c(Dn, Ln), which we assume to be strictly convex,twice continuously differentiable, and separable in its arguments.
Since each bank’s balance sheet requires Mn = Dn − Bn −Ln − αDn − Re
n, the profit-maximization condition in (1) can beexpressed as
Πn = maxRe
n,Dn,Ln,Bn
[(r̂
L− r̂)Ln + (r
B− r̂)Bn + (r
R− r̂)αDn
+ (rx − r̂)Ren + (r̂ − r
D)Dn − c(Dn, Ln) − β
2(Re
n − T̄n)2],
s.t. Ren ≥ 0, Ln ≤ L̄n. (2)
First-order conditions with regard to Ren, Ln, Dn, and Bn are
∂Πn
∂Ren
= (rx − r̂) − β(Ren − T̄n) + λ = 0,
∂Πn
∂Ln= (r̂
L− r̂) − c
L(Dn, Ln) − ξ = 0,
∂Πn
∂Dn= α(r
R− r̂) + (r̂ − r
D) − c
D(Dn, Ln) = 0,
∂Πn
∂Bn= r
B− r̂ ≤ 0; Bn > 0, (rB − r̂)Bn = 0.
The first-order conditions have intuitive interpretations. The firstcondition determines the overall amount of excess reserves that a
11This condition is not necessary for an equilibrium, but it simplifies the exis-tence condition.

Vol. 12 No. 1 Money-Market Rates and Retail Interest 153
bank wishes to hold, suggesting that the amount is determined byequating the opportunity cost of holding excess reserves, (rx− r̂)+λ,with the marginal cost incurred by deviating from the reserve target,β(Re
n − T̄n). Notice that if target reserves exceed zero, reserves willtypically fall short of the bank’s own target, given the cost of hold-ing them (as typically rx < r̂). The second condition implies thatlending continues until the lending rate (accounting for the antici-pated default in the loans market) equals the cost of marginal funds(the interbank rate accounting for the possibility of default in theinterbank market) and the marginal administrative costs of lendingand the shadow cost of a binding credit ceiling. If the lending con-straint is binding (and ξ > 0), then r̂
L− r̂ > c
L(Dn, Ln). Given
that cL(Dn, Ln) is upward sloping in loans Ln, this condition sug-
gests that a binding credit ceiling holds the level of loans below itsequilibrium level. The third condition determines deposit holdingsby equating the marginal profits from additional deposits (in termsof interbank lending), r̂ − r
D, with the marginal costs from man-
aging deposits, cD(Dn, Ln), and the marginal cost of meeting the
reserve requirement α(r̂ − rR). Finally, in this simple framework, a
no-arbitrage condition requires that all liquid funds (for bonds orin the interbank market) attract the same yield, given that theserates are market determined. The first-order conditions characterizea unique solution to each bank’s profit-maximization problem. Thesolution to the first-order conditions implies the optimal demand fordeposits, the supply of loans, demand for (excess) reserves, and theoptimal demand for bonds that depend on the key interest rates andthe reserve requirement (as well as parameters governing the bank’scosts and liquidity preferences).12
We now turn to the competitive equilibrium in the interbankmarket. Indexing the banks by n = 1, 2, . . . , N , they each havea loan supply function Ln(r
L, r) and a deposit demand function
Dn(rD, r). Under binding lending restrictions, the loan supply func-
tion Ln(rL, r) = L̄n would be inelastic. Let Ld(r
L) be the demand
function for loans and S(rD) the supply function for deposits (sav-
ings). Typically, the loan and deposit markets would be cleared (andrelevant interest rates determined) by equating the demand and sup-ply in these markets. However, given the extent of retail interest
12The second derivatives of the system ensure that the solution leads to a globalmaximum.
154 International Journal of Central Banking March 2016
rate regulation in China and the clustering of the deposit rate at itsceiling, it is likely that the regulated deposit rate is below its equilib-rium level (savings market does not clear at r
D).13 The lending rate,
reflecting its regulated floor, is probably no longer binding on many(especially marginal) borrowers, given that more than 80 percent ofloans occur at and above the administered lending rates (figure 1),implying that the floor on the administered lending rate is not bind-ing. However, under the assumption of a binding credit ceiling, thelevel of bank loans would be lower than equilibrium, implying thatthe loan market does not clear at r
L. If either the borrowing or lend-
ing market does not clear, then the quantity would be determinedby the short side at the regulated interest rate.
The competitive equilibrium is then characterized by three con-ditions, assuming N is sufficiently large:
Ld(rL) ≥
N∑n=1
Ln(rL, r) (loans market), (3)
S(rD) ≤
N∑n=1
Dn(rD, r) (savings market), (4)
DI(r) +N∑
n=1
Ln(rL, r) = (1 − α)S(r
D) − B
−N∑
n=1
Ren(rx, r, T̄n, β) (interbank market),
(5)
where Ren(rx, r, T̄n, β) is the level of excess reserves for bank n,
B is the aggregate level of the security holdings of bank n, andB =
∑Nn=1 Bn(r
B). DI(r) is the net demand for interbank funds
from institutional investors, where DI(r) is decreasing in r, theinterbank interest rate. Institutional investors are net borrowersin the interbank market, while domestic commercial banks are netlenders.14
13Provided the following condition holds: T̄n > (r̂ − rx)/β.14Foreign banks also borrow in renminbi terms in the interbank market for
their subsidiary activities in China. Given the binding capital controls in China,these subsidiaries in effect operate in a closed capital market. We model them in
Vol. 12 No. 1 Money-Market Rates and Retail Interest 155
Result 1. There exists an equilibrium market-determined interbankrate, r*, that solves equation (5), which is a unique function of theadministratively set benchmark interest rates r
Land r
D, as well as
reserve requirements and government bond issues. The same holdsfor the market-determined bond yields. The equilibrium interbankrate, r*, lies between the interest rate on excess reserves, rx, and theadministered lending rate, r
L, provided certain conditions hold.
Proof. For a given rL, r
D, r
R, α, B, and the reserve target function
parameters, there exists a unique interbank rate that solves equation(5). Note that the right-hand side of equation (5) is an increasingfunction in the interbank rate (∂Re
n(rx,r,T̄n,β)∂r < 0). For the left-hand
side, we consider two different cases: in the first case, the credit capdoes not bind (ξ = 0), and the left-hand side is downward slopingin the interbank rate (∂Ln(r
L,r)
∂r < 0, ∂DI(r)∂r < 0). In the second
case, the credit cap binds (ξ > 0) and Ln(rL, r) = L̄n, the left-hand
side of equation (5) is also downward sloping in the interbank rate(∂L̄n
∂r = 0, ∂DI(r)∂r < 0). In both cases, the necessary condition is
satisfied.On the sufficient condition of the existence of equilibrium, note
that both the left- and right-hand sides of equation (5) are monotonein r, given the reserve target function assumed.
If r → rL, then by first-order conditions and the assumptions
of γ, δL, δM , and κ, we must have Ln = 0, since cL(Dn, Ln) �=
(γ − κ) + (κδL − γδM ) and cL(Dn, Ln) > 0. Consequently, the
right-hand side of (5) is greater than the left-hand side, providedthat B ≤ (1−α)S(r
D)−
∑Nn=1 Re
n(rx, r, T̄n, β) (condition A), whereRe
n(rx, r, T̄n, β) = max[0, (r̂−rx)/β+ T̄n] and DI(rL) = 0. If r → rx,then Re
n(rx, r, T̄n, β) = (r̂ − rx)/β + T̄n > T̄n, so a sufficient condi-tion for the left-hand side of (5) to be greater than or equal tothe right-hand side is B ≥ (1−α)S(rD)−DI(rx)− c−1
L(S(rD), r̂
L−
r̂x)−∑N
n=1 T̄n (condition B). The equilibrium interbank rate, r*, liesbetween the interest rate on excess reserves, rx, and the administeredlending rate, r
L, provided conditions A and B are met.
a similar approach as institutional investors, since the majority of foreign banksoperate in China under the QFII (qualified foreign institutional investors) scheme.

156 International Journal of Central Banking March 2016
The direct implication of result 1 is that the market-determinedinterbank and bond rates cannot be independent of the administra-tively determined interest rates.15 Some key properties of the result-ing equilibrium interbank interest rate are summarized in results 2and 3.
Result 2. Provided the lending rate does not exceed its equilibrium,the equilibrium interbank rate, r*, that solves (5) is increasing or flatin the lending rate, decreasing in the deposit rate, and increasing incentral bank bond issuance and the loan target under credit control.An increase in the required reserve ratio has an ambiguous impacton the interbank rate. If the lending rate exceeds its equilibrium, thenthe interbank rate is decreasing in the lending rate.
Proof. We consider two different cases here:
(i) Case 1: The lending rate does not exceed equilibrium: rL ≤ r∗L,
where r∗L is the equilibrium lending rate.
• Subcase 1.1: Credit control does not bind for any banks(ξ = 0): L∗
n < L̄n, ∀n, where L∗n is the equilibrium level of
loans determined by market forces. The following comparativestatics follow from equation (5), where
Δ ≡ ∂DI(r)∂r
+∑
n
[∂Ln(r
L, r)
∂r+
∂Ren(rx, r, T̄n, β)
∂r
]< 0,
(6)
dr
drL
= −∑
n
∂Ln(rL
,r)∂r
L
Δ= −(+)
(−)> 0,
dr
drD
=(1 − α)∂S(r
D)
∂rD
Δ=
(+)(−)
< 0,
dr
dα= −S(r
D)
Δ= −(+)
(−)> 0,
15Note that we abstract from frictions in the interbank market and assumethat, at the unique interbank rate, the interbank market clears without any cost.For models that consider financial frictions faced by the banking sector, see,for example, Christiano, Motto, and Rostagno (2010) and Gertler and Kiyotaki(2010).

Vol. 12 No. 1 Money-Market Rates and Retail Interest 157
dr
dB= − 1
Δ> 0.
• Subcase 1.2: Credit control binds for all banks (ξ > 0):L̄n < L∗
n, ∀n and Ln(rL, r) = L̄n. In this case,
Δ ≡ ∂DI(r)∂r
+∑
n
[0 +
∂Ren(rx, r, T̄n, β)
∂r
]< 0. (7)
The comparative statics for drdr
D, dr
dα , and drdB hold as in sub-
case 1.1. We have the following new conditions:
dr
drL
= −∑
n∂L̄n
∂rL
Δ= − 0
(−)= 0,
dr
dL̄n= −
∑n
∂L̄n
∂L̄n
Δ= − 1
(−)> 0.
Since the above conditions hold for the two extreme cases,they also hold for the intermediate case where credit controlis binding for some banks but not all banks.
(ii) Case 2: The lending rate exceeds its equilibrium: rL > r∗L.
In this case, Ld(rL) ≤
∑Nn=1 Ln(r
L, r), and Δ is same as in
subcase 1.2. Hence, we have
dr
drL
= −∂Ld(r
L)
∂rL
Δ= −(−)
(−)< 0.
The result that a rise in the deposit rate reduces the interbankrate follows from the fact that interest rate regulation holds thedeposit rates below their equilibrium level. With rates below theirequilibrium level, a rise in the deposit rate increases deposits in thesystem, resulting in additional liquidity in the banking system andlower overall interest rates. If, however, such regulation was not bind-ing, then an exogenous rise in the deposit rate (due to developmentsin that market) would result in higher costs for the bank, therebylimiting their demand for deposits and resulting in higher interbankrates because of a reduction in the liquidity in the system. This isresult 3.
158 International Journal of Central Banking March 2016
Result 3. If the deposit (savings) market were allowed to clear
S(rD) =
N∑n=1
Dn(rD, r),
then an increase in the deposit rate would increase the interbank rate.All other comparative static results from result 2 would continue tohold.
Proof. We present the case where credit control is not binding. Inthis case, equation (5) would become
DI(r) +N∑
n=1
Ln(rL, r) = (1 − α)
N∑n=1
Dn(rD, r)
− B −N∑
n=1
Ren(rx, r, T̄n, β),
and
Δ ≡ ∂DI(r)∂r
+∑
n
[∂Ln(r
L, r)
∂r+
∂Ren(rx, r, T̄n, β)
∂r
− (1 − α)∂Dn(r
D, r)
∂r
]< 0,
where ∂Dn(rD
,r)∂r > 0, as the demand for deposits is upward sloping
in the interbank rate. Then
dr
drD
=(1 − α)
∑n
∂Dn(rD
,r)∂r
D
Δ=
(−)(−)
> 0.
All other comparative static expressions remain as in the proof ofresult 2. The case where the credit cap is binding can be obtainedby putting ∂Ln(r
L,r)
∂r = 0.
The results from the stylized theoretical model have severalimplications: first, market-determined interbank interest rates can-not be independent of administratively determined interest rates,
Vol. 12 No. 1 Money-Market Rates and Retail Interest 159
such as regulated deposit and lending rates. Second, the modelimplies that interbank interest rates are influenced by changes inthe reserve requirement ratio, an important monetary policy toolemployed by the PBC. The model also yields some predictions onthe direction of the responses in the interbank rate. In particular,the interbank rate is increasing in the lending rate (providing thelending rate has not already exceeded its equilibrium) and decreas-ing in the deposit rate (as interest rate regulation holds the depositrate below the equilibrium level).
4. Empirical Analysis
In this section, we estimate an empirical model of the interbankinterest rate in China and examine the extent to which adminis-tered interest rates influence interbank rates, as predicted by thestylized theoretical model. We note that short-term exogenous fac-tors that affect liquidity, such as open-market operations (OMOs)and IPO activities, should influence interbank rates in the same wayas the exogenous changes in bond holdings (as seen in the stylizedmodel), increasing the interbank rate when liquidity falls and reduc-ing the interbank rate when liquidity rises. As a result, we includeadministered interest rates, net liquidity injections from OMOs andreserve requirements, and IPO funds as exogenous (independent)factors in the empirical model of the interbank rate.16 We also con-trol for the predictable (seasonal) factors that tend to affect liquid-ity in money markets in advanced economies, such as within-week,within-month, and end-of-year effects. Finally, we undertake somerobustness checks, which show that, despite changes in the extent ofliquidity and policy stance over the sample, the conclusion regardingthe impact of administered interest rates (and hence retail interestrate regulation) on market-determined rates holds.
4.1 Properties of Interbank Interest Rates in China
As can be seen from figure 3, the two main market-determined ratesfor short-term interbank funds (the call loan and the repo rates) have
16Other exogenous variables, such as exchange rate intervention, or capitalinflows could also influence the interbank interest rates. However, the analysis oftheir impact is beyond the scope of the current version of the paper.

160 International Journal of Central Banking March 2016
Figure 3. Seven-Day Interbank Rates in China(Observation Dates: April 2003 to April 2012)
0
2
4
6
8
10
12
0
2
4
6
8
10
12
03 04 05 06 07 08 09 10 11
Call LoanRepo
China 7-Day Interbank Rates (% pa)
Source: People’s Bank of China and Haver Analytics (CEIC).
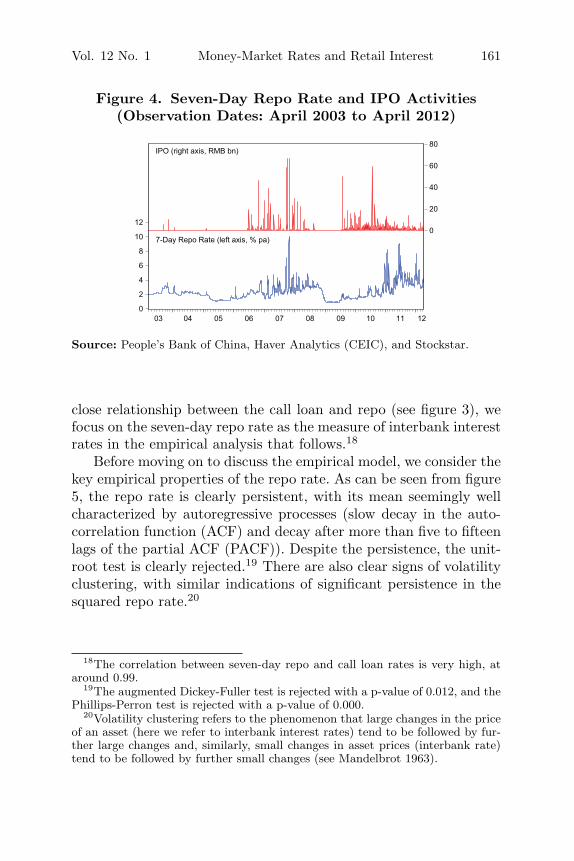
followed each other very closely over the past few years, with volatil-ity having increased substantially since late 2005.17 The rise involatility reflects the growing depth of these markets (see, for exam-ple, Xu 2006) and is also coincident with the development of otherparts of the financial market, especially the foreign exchange marketand the equity market (as seen by IPO activity, figure 4).
While the extent of the volatility is likely driven by severalother institutional and policy factors, it is also probably affectedby the institutional arrangements governing reserve requirements(for example, the period of reserve averaging). Given the greaterliquidity in the repo market (with the turnover in the repo marketfar exceeding that in the uncollateralized call loan market), and the
17In addition to the call loan (CHIBOR: China Interbank Offered Rate) andrepo rates, SHIBOR (Shanghai Interbank Offered Rate) is the other key referenceinterest rate in the interbank market. SHIBOR is not determined in a fundingmarket, but is set in a similar way to LIBOR, with the rate calculated as anarithmetic average of renminbi offered rates by participating banks (currentlysixteen).
Vol. 12 No. 1 Money-Market Rates and Retail Interest 161
Figure 4. Seven-Day Repo Rate and IPO Activities(Observation Dates: April 2003 to April 2012)
0
2
4
6
8
10
120
20
40
60
80
03 04 05 06 07 08 09 10 11 12
IPO (right axis, RMB bn)
7-Day Repo Rate (left axis, % pa)
Source: People’s Bank of China, Haver Analytics (CEIC), and Stockstar.
close relationship between the call loan and repo (see figure 3), wefocus on the seven-day repo rate as the measure of interbank interestrates in the empirical analysis that follows.18
Before moving on to discuss the empirical model, we consider thekey empirical properties of the repo rate. As can be seen from figure5, the repo rate is clearly persistent, with its mean seemingly wellcharacterized by autoregressive processes (slow decay in the auto-correlation function (ACF) and decay after more than five to fifteenlags of the partial ACF (PACF)). Despite the persistence, the unit-root test is clearly rejected.19 There are also clear signs of volatilityclustering, with similar indications of significant persistence in thesquared repo rate.20
18The correlation between seven-day repo and call loan rates is very high, ataround 0.99.
19The augmented Dickey-Fuller test is rejected with a p-value of 0.012, and thePhillips-Perron test is rejected with a p-value of 0.000.
20Volatility clustering refers to the phenomenon that large changes in the priceof an asset (here we refer to interbank interest rates) tend to be followed by fur-ther large changes and, similarly, small changes in asset prices (interbank rate)tend to be followed by further small changes (see Mandelbrot 1963).

162 International Journal of Central Banking March 2016
Figure 5. Interbank Rate Persistence
0.4
0.6
0.8
1
0.4
0.6
0.8
1
Repo Rate: Partial Autocorrelation Function(With +/- 3 standard error bands)
-0.2
0
0.2
-0.2
0
0.2
1 10 19 28 37 46 55
0.5
0.7
0.9
0.5
0.7
0.9
Repo Rate: Autocorrelation Function(With +/- 3 standard error bands)
-0.1
0.1
0.3
-0.1
0.1
0.3
1 10 19 28 37 46 55
0.5
0.7
0.9
0.5
0.7
0.9
Squared Repo Rate: Autocorrelation Function(With +/- 3 standard error bands)
-0.1
0.1
0.3
-0.1
0.1
0.3
1 10 19 28 37 46 55
0.4
0.6
0.8
1
0.4
0.6
0.8
1
Squared Repo Rate: Partial Autocorrelation Function(With +/- 3 standard error bands)
-0.2
0
0.2
-0.2
0
0.2
1 10 19 28 37 46 55
4.2 The Empirical Model
China’s interbank rates, like those in advanced economies, exhibithigh volatility as well as volatility clustering (figure 5). Conse-quently, we model the interbank rate using an exponential GARCH(EGARCH) model (Nelson 1991), which allows for rich specificationsfor both the time-varying mean and the time-varying volatility of theobserved interest rate.21 Given the apparent “fat tails” exhibited bythe Chinese interbank data, we assume that these innovations followStudent’s t-distribution, with degrees of freedom estimated to matchthe “fat tails” found in the data. Such a model has been applied tomany advanced-country interbank markets (see, for example, Prati,Bartolini, and Bertola 2003; Moschitz 2004; and Quiros and Mendiz-abal 2006). The focus of these studies differs from ours in that theyexamine the interbank markets in developed (G7) economies, where
21For a discussion of the properties of the EGARCH model and a comparisonwith standard GARCH, see, for example, Terasvirta (2009).
Vol. 12 No. 1 Money-Market Rates and Retail Interest 163
the central bank targets a short-term interbank rate for monetarypolicy purposes. Their primary concern is to identify the liquid-ity effects within the market, driven by the differences betweenreserve settlement and non-settlement days, as well as the impactof the parameters of the interest-rate-targeting regime on the inter-bank rate. We, however, are principally concerned with the impactof administered interest rates and other monetary policy instru-ments, such as open-market operations and reserve requirements,on interbank rates in a less-developed market with partial financialliberalization.
Our basic empirical model of the interbank interest rate rt isgiven by
rt = μt +√
htνt, (8)
where νt is a unit variance, serially uncorrelated, zero-mean, i.i.derror term, and μt and ht are the time-varying mean and variance,respectively, of the interbank interest rate. The mean μt is assumedto show persistence in the interbank interest rates, as well as inexogenous factors that affect the interbank interest rate, Xm
t ,
μt = c +s∑
i=1
φirt−i + β′mXm
t , (9)
where the autoregressive coefficient, φi, is aimed to capture the pos-sible persistence of the interbank interest rate, and β′
mXmt reflects
the impact of exogenous factors on the average interbank rate. Con-sistent with the volatility clustering observed in the interbank data,the variance of the interbank rate is specified as follows:
ln(ht) = ω +q∑
i=1
γiln(ht−i) +p∑
j=1
αj|νt−j |√
ht−j
+l∑
k=1
λkνt−k√ht−k
+ β′νX
νt , (10)
where ln(ht) is the logarithm of the conditional variance ht, the αj
terms are the “ARCH” effects (based on innovations in the absolutestandardized residual), the γi terms are the “GARCH” terms, andthe λk terms capture the asymmetric impact of positive or negative
164 International Journal of Central Banking March 2016
innovations to the standardized residuals.22 If λk = 0, then bothpositive and negative innovations have symmetric impacts on inter-est rate volatility. β′
νXνt measures the impact of exogenous factors
that drive volatility. The EGARCH specification implies that theforecasts of conditional variance are always non-negative.
4.3 Model Specification
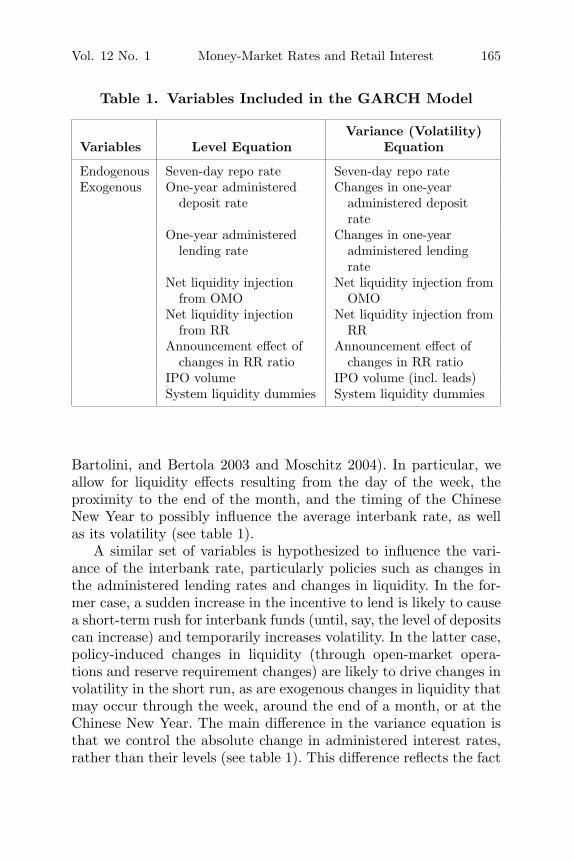
Based on our stylized model of China’s banking sector, the inter-bank rate should reflect the administered deposit and lending rates,and the extent of liquidity in the interbank system. We use the one-year administered deposit and lending rates to capture the impact ofinterest rate regulation on the mean of the interbank rates. To cap-ture the impact of monetary policy changes on liquidity in the bank-ing system, we use measures of open-market operations and reserverequirements. Specifically, the open-market operations variable isdefined as the level of net liquidity injection from the expirationof repos and PBC central bank bills (expiration less issuance), andthe issuance of reverse repos. For reserve requirements, the meas-ure reflects the liquidity injected from a fall in required reserves.The change in the liquidity condition is constructed as the changein the reserve requirement ratio times the deposit base. Given thatchanges in reserve requirements are usually announced one or twoweeks before the effective date, we also construct a dummy variableto capture the announcement effect of reserve requirement changes,where the dummy is equal to the change in the reserve requirementratio on the date of the announcement. IPOs are also posited asan important contributor to short-term fluctuations in the inter-est rate, as they lock up significant funds in the banking systemfor around one or two weeks ahead of the IPO, and so these areincluded as exogenous explanatory variables. Data on IPOs cover thetotal amount of funds raised (in billions of renminbi) on a particularday.23 Finally, we allow for interbank liquidity to vary systemati-cally through the year, as it does in other interbank markets (Prati,
22In the empirical analysis in the model, the lag orders p, l, and q are set at1, 1, and 1, respectively, to capture the volatility clustering as observed in theseven-day repo rate.
23The data sources for all series were the People’s Bank of China, HaverAnalytics (CEIC), and Stockstar. See the data appendix for more details.
Vol. 12 No. 1 Money-Market Rates and Retail Interest 165
Table 1. Variables Included in the GARCH Model
Variance (Volatility)Variables Level Equation Equation
Endogenous Seven-day repo rate Seven-day repo rateExogenous One-year administered
deposit rateChanges in one-year
administered depositrate
One-year administeredlending rate
Changes in one-yearadministered lendingrate
Net liquidity injectionfrom OMO
Net liquidity injection fromOMO
Net liquidity injectionfrom RR
Net liquidity injection fromRR
Announcement effect ofchanges in RR ratio
Announcement effect ofchanges in RR ratio
IPO volume IPO volume (incl. leads)System liquidity dummies System liquidity dummies
Bartolini, and Bertola 2003 and Moschitz 2004). In particular, weallow for liquidity effects resulting from the day of the week, theproximity to the end of the month, and the timing of the ChineseNew Year to possibly influence the average interbank rate, as wellas its volatility (see table 1).
A similar set of variables is hypothesized to influence the vari-ance of the interbank rate, particularly policies such as changes inthe administered lending rates and changes in liquidity. In the for-mer case, a sudden increase in the incentive to lend is likely to causea short-term rush for interbank funds (until, say, the level of depositscan increase) and temporarily increases volatility. In the latter case,policy-induced changes in liquidity (through open-market opera-tions and reserve requirement changes) are likely to drive changes involatility in the short run, as are exogenous changes in liquidity thatmay occur through the week, around the end of a month, or at theChinese New Year. The main difference in the variance equation isthat we control the absolute change in administered interest rates,rather than their levels (see table 1). This difference reflects the fact
166 International Journal of Central Banking March 2016
that changes in administered rates are likely the drivers of (short-term) volatility, and any impact is more likely to be symmetric toboth increases and reductions. With IPOs resulting in a significantamount of funds being locked up in the banking system (for abouta week or so), we included leads of five and ten days to capture theimpact of this “lock-up” ahead of the IPO in the variance equation.24
Given the persistence in the seven-day repo rate, we consider alag order of five (approximately one week) in the mean equation. All(exogenous) explanatory variables are restricted to have the samelag order, except for the IPO in the variance equation, where leadswere included to capture the lock-up effect of funds. The final equa-tion specification is obtained using the general-to-specific approachand captures the key relationships in the interbank market in aparsimonious manner.
4.4 Empirical Results
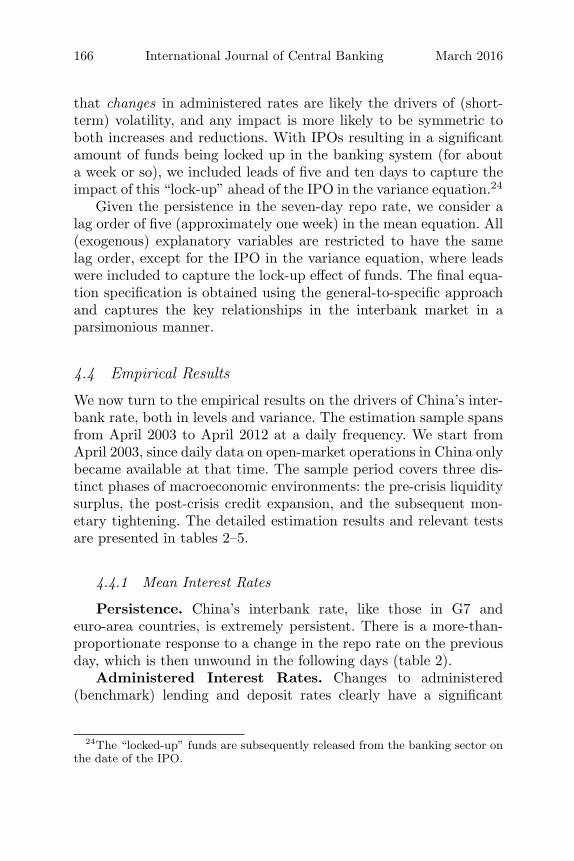
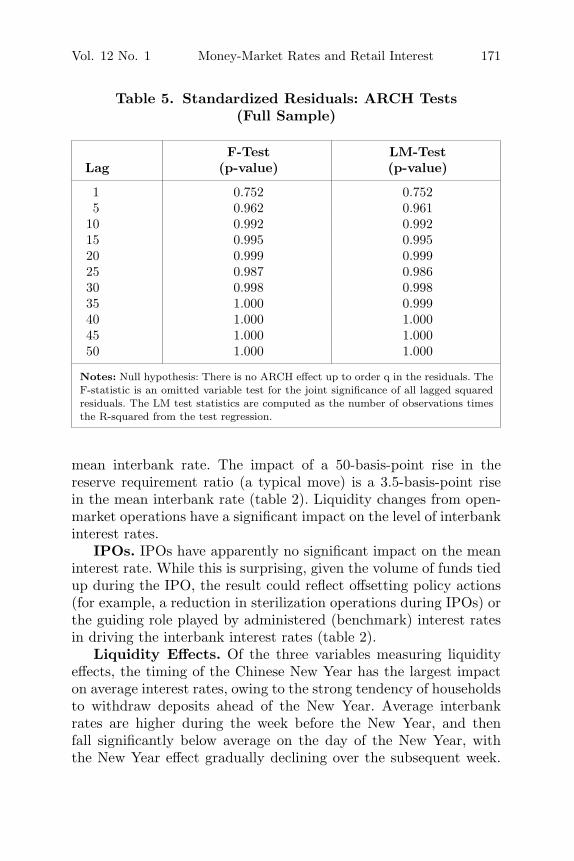
We now turn to the empirical results on the drivers of China’s inter-bank rate, both in levels and variance. The estimation sample spansfrom April 2003 to April 2012 at a daily frequency. We start fromApril 2003, since daily data on open-market operations in China onlybecame available at that time. The sample period covers three dis-tinct phases of macroeconomic environments: the pre-crisis liquiditysurplus, the post-crisis credit expansion, and the subsequent mon-etary tightening. The detailed estimation results and relevant testsare presented in tables 2–5.
4.4.1 Mean Interest Rates
Persistence. China’s interbank rate, like those in G7 andeuro-area countries, is extremely persistent. There is a more-than-proportionate response to a change in the repo rate on the previousday, which is then unwound in the following days (table 2).
Administered Interest Rates. Changes to administered(benchmark) lending and deposit rates clearly have a significant
24The “locked-up” funds are subsequently released from the banking sector onthe date of the IPO.
Vol. 12 No. 1 Money-Market Rates and Retail Interest 167
Table 2. Estimated GARCH Parameters(Full Sample: April 2003 to April 2012)
Coefficient Std. Error z-Statistic p-Value
Mean Equation
C −0.038∗ 0.014 −2.768 0.006Repo (–1) 1.169∗ 0.009 130.181 0.000Repo (–2) −0.076∗ 0.019 −3.934 0.000Repo (–3) −0.121∗ 0.024 −5.019 0.000Repo (–4) 0.053∗ 0.022 2.406 0.016Repo (–5) −0.028∗ 0.014 −2.014 0.044Administered
Lending Rate0.016∗ 0.004 3.929 0.000
AdministeredDeposit Rate
−0.021∗ 4.4E-03 −4.671 0.000
OMO 3.5E-05∗ 1.7E-05 2.037 0.042RR 1.7E-05 0.000 0.453 0.651RR Announce-
ment0.069∗ 2.4E-02 2.929 0.003
IPO 6.4E-04 4.0E-04 1.604 0.109
LiquidityEffects (SeeTable 3)
Variance Equation
C −0.100 0.095 −1.051 0.293ARCH Effect
(–1)1.735† 0.932 1.862 0.063
AsymmetricEffect (–1)
0.439† 0.250 1.758 0.079
GARCH Effect(–1)
0.969∗ 0.004 242.210 0.000
Δ inAdministeredLending Rate
9.025∗ 2.854 3.162 0.002
Δ inAdministeredDeposit Rate
−9.794∗ 2.853 −3.433 0.001
OMO 0.002∗ 6.9E-04 2.918 0.004(continued)

168 International Journal of Central Banking March 2016
Table 2. (Continued)
Coefficient Std. Error z-Statistic p-Value
Variance Equation
RR −0.001† 6.7E-04 −1.896 0.058RR Announce-
ment2.036† 0.378 5.381 0.000
IPO −0.008 0.008 −1.012 0.311IPO (+5) 2.6E-04 0.007 0.036 0.971IPO (+10) 0.030∗ 0.007 4.504 0.000Liquidity
Effects (SeeTable 3)
T-DIST. DOF 2.03∗ 0.0294 68.884 0.000
R-Squared 0.897 Adjusted R-Squared 0.895S.E. of
Regression0.372 Sum Squared Residual 298.359
Log-Likelihood 2609.018Akaike Info
Criterion−2.112 Schwarz Criterion −2.112
Hannan-QuinnCriterion
−2.236 Durbin-Watson Statistics 2.208
Notes: Dependent variable: Repo (seven-day repo rate); sample period: April 1, 2003to April 12, 2012. Included observations: 2,197 after adjustments. Method: ML-ARCH(Marquardt) – Student’s t-distribution. * indicates significance at the 5 percent level,and † indicates significance at the 10 percent level.
impact on the interbank rate.25 Increases in the administered lendingrate lead to higher average interbank rates, since the higher lendingrates translate into pressure for interbank funds. The impact of a100-basis-point rise in the one-year lending rate is to increase theinterbank rate by 1.6 basis points. A rise in the one-year depositrate has the opposite effect, reducing the interbank rate, possiblyreflecting a likely supply response on the part of depositors, given
25At a daily frequency, the null hypotheses that the administered deposit andlending rates do not Granger-cause the seven-day repo rate can be rejected, withp-values of 6E-07 and 5E-06, respectively.
Vol. 12 No. 1 Money-Market Rates and Retail Interest 169
Table 3. Estimated Liquidity Effects(Full Sample: April 2003 to April 2012)
Mean Equation Variance Equation
Lag Coefficient p-Value Coefficient p-Value
Day of Week:Monday −4.5E-04 0.561 −0.693∗ 0.000Wednesday −2.4E-05 0.974 −0.435∗ 0.018Friday 3.7E-04 0.684 0.072 0.660
End of Month:5 6.8E-04 0.581 0.004 0.9864 −7.9E-04 0.512 −0.427† 0.0703 0.001 0.470 −0.511∗ 0.0312 −2.2E-05 0.991 0.162 0.4851 0.001 0.434 −0.563∗ 0.0110 −0.003 0.192 −0.252 0.305
–1 0.005∗ 0.013 −0.196 0.473–2 0.002 0.439 0.556∗ 0.036–3 0.004∗ 0.017 −0.204 0.432–4 0.002 0.97 −0.099 0.704–5 0.003∗ 0.019 −0.059 0.782
Chinese New Year:5 −0.016∗ 0.026 −1.147† 0.0944 −2.6E-05 0.998 0.977 0.3943 0.003 0.792 −0.014 0.9912 0.037∗ 0.004 −2.155∗ 0.0361 0.062† 0.070 0.258 0.7920 −0.477∗ 0.000 −0.194 0.815
–1 0.005 0.952 0.074 0.928–2 0.341∗ 0.000 0.465 0.520–3 0.089 0.240 2.689∗ 0.000–4 0.060∗ 0.000 −0.953 0.184–5 0.004 0.423 0.003 0.996
Notes: Dependent variable: Repo (seven-day repo rate); sample period: April 1, 2003to April 12, 2012. Included observations: 2,197 after adjustments. Method: ML-ARCH(Marquardt) – Student’s t-distribution. * indicates significance at the 5 percent level,and † indicates significance at the 10 percent level.

170 International Journal of Central Banking March 2016
Table 4. Joint Significance Tests (Full Sample)
Total Impact LR Statistic p-Value
Mean Equation
Before and at End ofMonth
0.013 33.70 7.7E-06
After End of Month 0.002 12.49 3.4E-12Before Chinese New Year 0.499 45.46 1.2E-08At and After Chinese
New Year−0.392 65.14 4.0E-12
Weekdays (Monday,Wednesday, Friday)
−1.0E-04 135.73 3.1E-29
Variance Equation
Before and at End ofMonth
−0.255 35.462 3.5E-06
After End of Month −1.336 45.814 9.9E-09Before Chinese New Year 2.277 47.22 5.1E-09At and After Chinese
New Year−2.275 61.258 2.5E-11
Weekdays (Monday,Wednesday, Friday)
−1.056 35.486 9.6E-08
Notes: Dependent variable: Repo (seven-day repo rate); sample period: April 1,2003 to April 12, 2012. Included observations: 2,197 after adjustments. Method: ML-ARCH (Marquardt) – Student’s t-distribution. Null hypothesis: the coefficients ofthe selected subsets of variables are jointly zero.
the low level of the regulated deposit rate as suggested by our styl-ized model. The impact of a 100-basis-point rise in the deposit rateis a 2.1-basis-point fall in the mean interbank rate (table 2). Thisempirical finding is consistent with the prediction from the stylizedtheoretical model that the interbank rate is increasing in the lendingrate and decreasing in the deposit rate.
Open-Market Operations and Reserve Requirements.Conditional on the level of administered interest rates, liquiditychanges from reserve requirements do not have any significantimpact on the mean interbank rate. The announcement effect ofreserve requirements, however, does have a positive impact on the
Vol. 12 No. 1 Money-Market Rates and Retail Interest 171
Table 5. Standardized Residuals: ARCH Tests(Full Sample)
F-Test LM-TestLag (p-value) (p-value)
1 0.752 0.7525 0.962 0.961
10 0.992 0.99215 0.995 0.99520 0.999 0.99925 0.987 0.98630 0.998 0.99835 1.000 0.99940 1.000 1.00045 1.000 1.00050 1.000 1.000
Notes: Null hypothesis: There is no ARCH effect up to order q in the residuals. TheF-statistic is an omitted variable test for the joint significance of all lagged squaredresiduals. The LM test statistics are computed as the number of observations timesthe R-squared from the test regression.
mean interbank rate. The impact of a 50-basis-point rise in thereserve requirement ratio (a typical move) is a 3.5-basis-point risein the mean interbank rate (table 2). Liquidity changes from open-market operations have a significant impact on the level of interbankinterest rates.
IPOs. IPOs have apparently no significant impact on the meaninterest rate. While this is surprising, given the volume of funds tiedup during the IPO, the result could reflect offsetting policy actions(for example, a reduction in sterilization operations during IPOs) orthe guiding role played by administered (benchmark) interest ratesin driving the interbank interest rates (table 2).
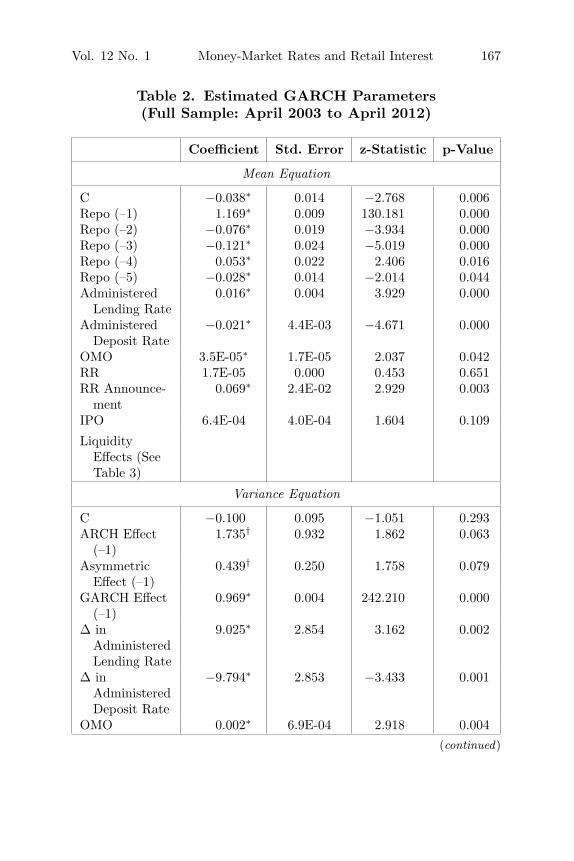
Liquidity Effects. Of the three variables measuring liquidityeffects, the timing of the Chinese New Year has the largest impacton average interest rates, owing to the strong tendency of householdsto withdraw deposits ahead of the New Year. Average interbankrates are higher during the week before the New Year, and thenfall significantly below average on the day of the New Year, withthe New Year effect gradually declining over the subsequent week.
172 International Journal of Central Banking March 2016
There are also liquidity effects associated with the end of the month,with the average interest rate notably higher before the end of themonth. Finally, the within-week liquidity effects do not seem to besignificant for the mean interbank rates; however, jointly, they aresignificantly negative (tables 3 and 4).
4.4.2 Interest Rate Volatility
Volatility clustering in the seven-day repo rate is confirmed with thesignificant GARCH effects found in our estimation (table 2). Thevariance is relatively persistent and is driven by similar factors asthe average interest rates. The first-order ARCH effect is margin-ally significant, as is the asymmetric term. Consequently, “negativeinnovations” (a reduction in interbank rates) have a smaller impacton interest rate volatility than news that increases the interest rate.Policy variables, IPOs, and liquidity effects affect interbank volatilityas follows.
Administered Interest Rates. Changes in administered inter-est rates have a significant impact on the variance of the interbankrate (table 2). Changes in the lending rate tend to increase volatility,as the incentive to raise funds for lending changes with the lendingrate. Changes in the deposit rate tend to reduce volatility, whichis somewhat surprising, but may be an artifact of the structuralliquidity surplus during the sample period.
Open-Market Operations and Reserve Requirements.Policy changes, at least those through reserve requirements, seemto have a more significant impact on interest rate volatility than onthe mean of the interbank rate. However, the impact of changingreserve requirements tends to anticipate the actual change in policy,commencing with a jump in volatility when the change is announced(table 2).26 The strength of this anticipatory effect probably reflectsthe daily nature of reserve requirements and the importance ofreserve requirements as a monetary policy tool in China (see discus-sions in section 2.1). An increase in net liquidity injections through
26Changes in reserve requirements are usually announced one to two weeksahead of the execution dates. For example, the PBC announced on March 18,2011 its decision to raise the renminbi (RMB) reserve requirement ratio for depos-itory financial institutions by 0.5 percentage points, effective from March 25, 2011;see the PBC website for details.
Vol. 12 No. 1 Money-Market Rates and Retail Interest 173
open-market operations has a small significant impact on volatility,as would be expected if open-market operations act as a sterilizationtool to adjust liquidity in the system and to stabilize interest ratesin the interbank market.
IPOs. While IPO activities did not change the behavior of aver-age interbank rates, they seem to increase the volatility of interbankrates marginally when they occur (table 2), which is consistent withthe observation in figure 4. In particular, volatility increases sig-nificantly ahead of the IPO (when funds are locked up), but thereis little sign of above-average volatility after that (including whensurplus funds are released).
Liquidity Effects. As with the level, the liquidity effect of theChinese New Year is the largest (tables 3 and 4). Volatility is typ-ically above average one week before the New Year, as householdswithdraw deposits ahead of the New Year, and then it declines grad-ually in the trading week after the holiday. Volatility is significantlylower at the beginning of the week (Monday and Wednesday) andincreases gradually toward the end of the week. There are also sig-nificant liquidity effects on interbank volatility through each month,with volatility typically higher than average as the end of the monthapproaches and then declining during the first week of the month.
As can be seen in figure 6, IPO activities, reserve requirements(including the announcement effect), and administered interest ratescontribute most to the volatility of interbank interest rates, if weextract from liquidity, GARCH, and ARCH effects. Monetary policyvariables such as open-market operations also contribute to inter-bank volatility, although their impact is smaller in comparison.
The resulting estimates also confirm the extent of extreme move-ments in China’s interbank rate. The estimated degrees of freedomfor the error term are only marginally above the lower limit oftwo (table 2), and far smaller than those estimated in models ofother interbank markets. For example, Prati, Bartolini, and Bertola(2003) present degrees-of-freedom estimates between 2.23 and 3.95for short-term G7 and euro-area interbank rates. With such a lowestimate for the degrees of freedom of the error terms, estimatedinnovation (news events) is far more fat tailed than implied by anormal distribution.
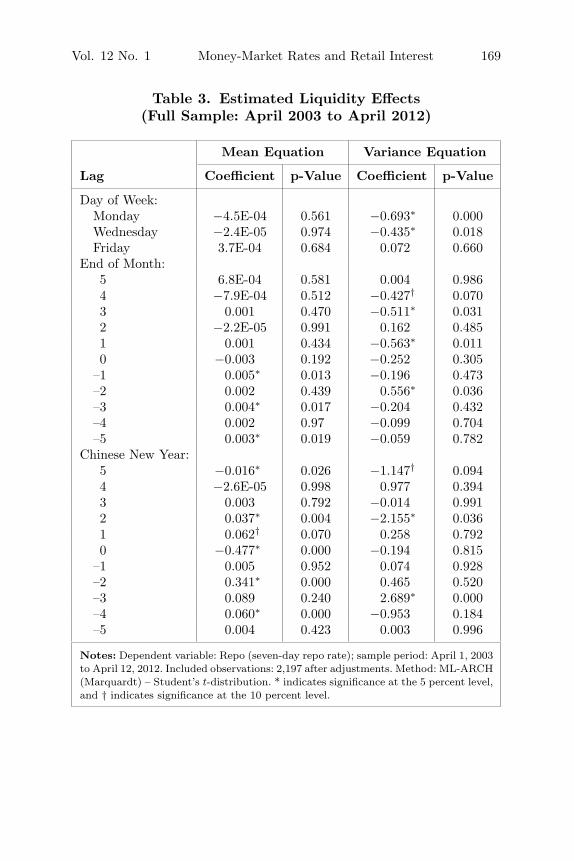
The model equation has well-behaved residuals, with no signs ofvolatility clustering in the standardized residuals. There are also no

174 International Journal of Central Banking March 2016
Figure 6. Contributions to Interbank Volatility
-1
-0.5
0
0.5
1
1.5
2
2.5
3
-3
-2.5
-2
-1.5
Apr-03 Nov-03 Jun-04 Jan-05 Aug-05 Mar-06 Oct-06 May-07 Dec-07 Jul-08 Feb-09 Sep-09 Apr-10 Nov-10 Jun-11 Jan-12
Adminstra�ve Interest Rates OMO RR IPOs
Notes: Contribution to the log of variance, which excludes constant, liquidity,ARCH, asymmetric, and GARCH effects. RR includes both the liquidity andannouncement effects.
signs of persistence in either the standardized residuals or squaredstandardized residuals, suggesting that there are no residual auto-correlation or ARCH effects (see table 5 and figure 7).
4.5 News and Information
The empirical analysis on the determinants of interbank interestrates confirms our expectation that administered rates are impor-tant drivers of the interbank market. We are interested in how theseinterventions (regulations) in lending and deposit rates may haveinfluenced the informativeness of interbank rates for news and mar-ket conditions. In particular, we try to address three additionalquestions. First, how informative are money-market rates in Chinacompared with other economies without interventions in the interestrate market? Second, how informative are interbank rates on mar-ket conditions like liquidity or other types of macro news? Third,what do event studies say about the impact of interventions on theinformativeness of rates for news?
To address the first question, we consider regressions for U.S.and UK interbank markets for the same sample period, following

Vol. 12 No. 1 Money-Market Rates and Retail Interest 175
Figure 7. Standardized Residuals (Full Sample)
-5
-4
-3
-2
-1
0
1
2
3
4
5
-5
-4
-3
-2
-1
0
1
2
3
4
5
Apr-03 Apr-04 Apr-05 Apr-06 Apr-07 Apr-08 Apr-09 Apr-10 Apr-11 Apr-12
Standardized Residuals
0
0.02
0.04
0.06
0.08
0
0.02
0.04
0.06
0.08
Standardized Residuals: Autocorrelation Function(With +/- 3 standard error bands)
-0.08
-0.06
-0.04
-0.02
-0.08
-0.06
-0.04
-0.02
1 10 19 28 37 46 55
0 02
0
0.02
0.04
0.06
0.08
0 02
0
0.02
0.04
0.06
0.08
Standardized Residuals: Partial Autocorrelation Function(With +/- 3 standard error bands)
-0.08
-0.06
-0.04
-0.02
-0.08
-0.06
-0.04
-0.02
1 10 19 28 37 46 55
0 10 1
Squared Standardized Residuals: Autocorrelation Function(With +/- 3 standard error bands)
0 05
0.1
0 05
0.1
0.050.05
00
-0.05-0.05
-0.1-0.11 10 19 28 37 46 55
Squared Standardized Residuals: Partial Autocorrelation Function(With +/- 3 standard error bands)
0.10.1
0.050.05
00
-0.05-0.05
-0.1-0.11 10 19 28 37 46 55
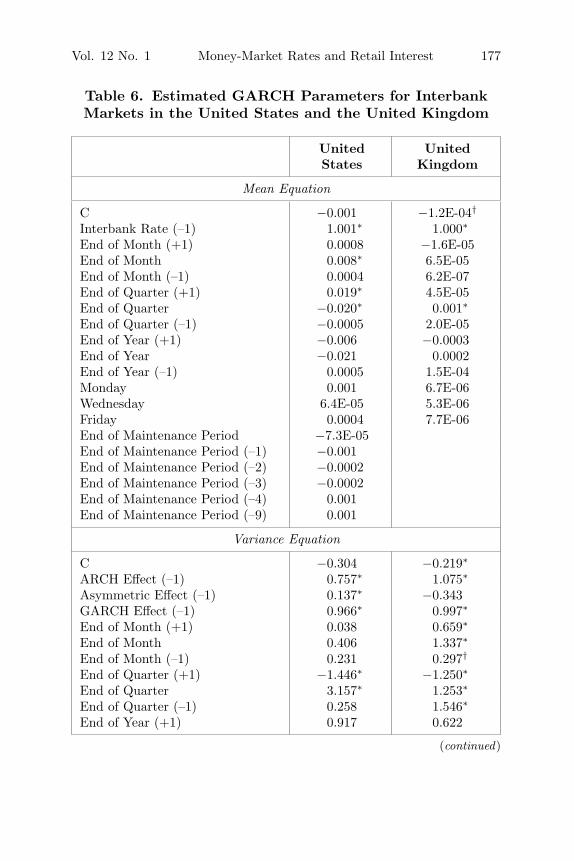
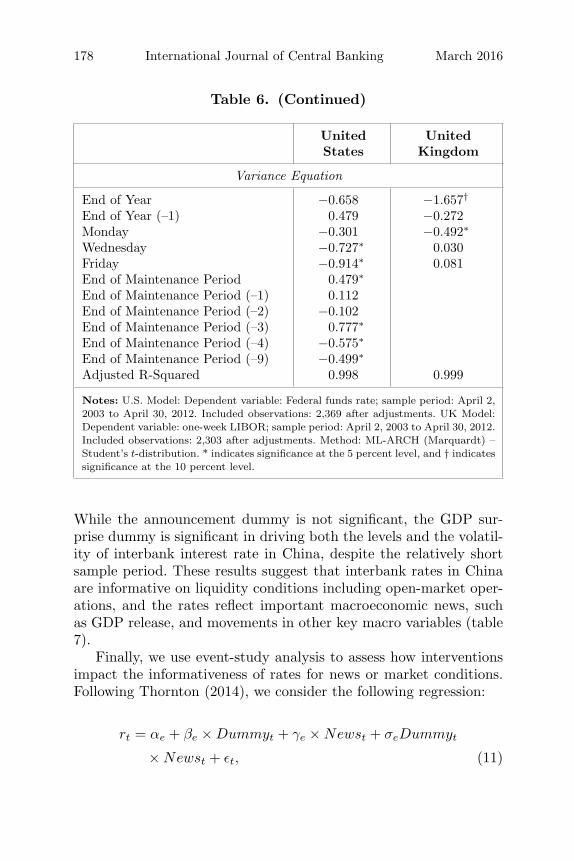
the specification in Prati, Bartolini, and Bertola (2003). Specifically,for both countries, we control for lagged interbank rate and dum-mies for weekdays, the end of month, the end of quarter, and theend of year. Given that the United States adopts reserve averag-ing, we also include dummies for the reserve maintenance period(ten days) to account for the liquidity effects toward the end of themaintenance period to capture exogenous (but systematic) changesin liquidity demand. We consider the share of variation explainedby these regressions (or R2) as a measure of the extent of infor-mation in the specification, which explains the money-market ratesolely through autoregressive terms and market liquidity effects. Theadjusted R2 is found to be 0.998 for the United States and 0.999 for
176 International Journal of Central Banking March 2016
the United Kingdom (table 6), both higher compared with adjustedR2 seen in the model for China’s interbank rate (0.895). The resultssuggest that interventions in the interest rate market in China mayhave led to reduced R2 (and therefore informativeness) of money-market rates, in comparison with those typically seen in marketswithout such interventions.
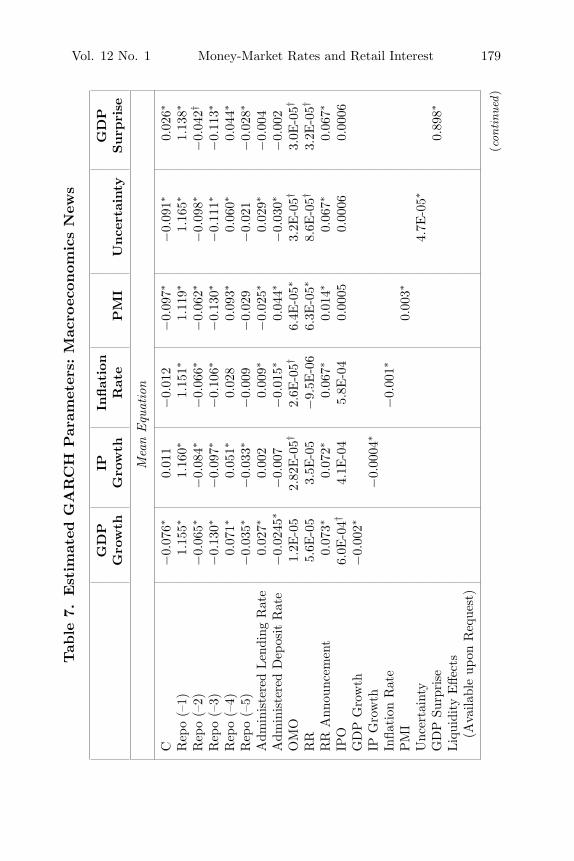
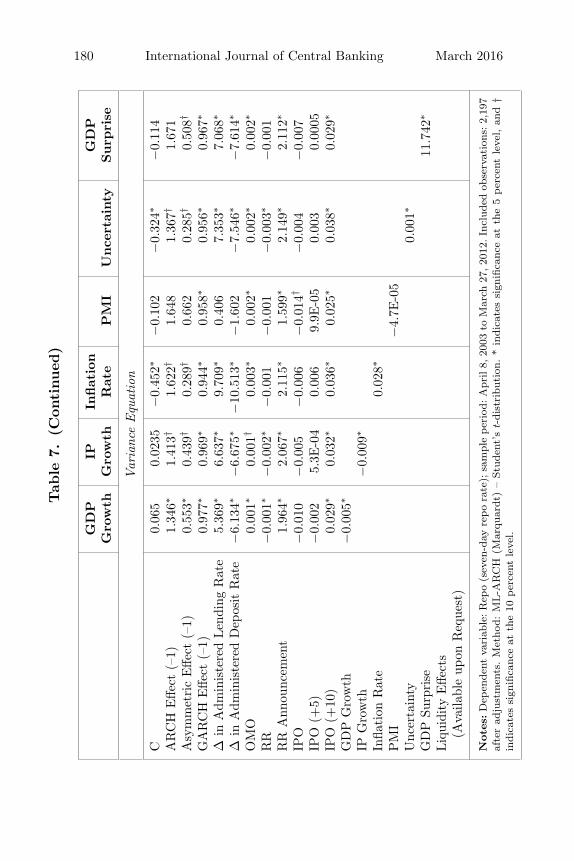
On the second question with regard to liquidity and macroeco-nomic news, recall that the baseline regression suggests that liquid-ity injections from reserve requirements do not have any significantinfluence on the level of the interbank rate, while the announcementeffect does have a significant impact. Liquidity injections from open-market operations are found to be significant drivers of interbankinterest rates in both levels and volatility, while IPO activities aresignificant in determining interbank volatility (table 2). In addition,as in other markets, there are substantial systematic liquidity effectsdue to particular dates on the calendar (table 4). To assess theimpact of macroeconomic news, we consider additional regressionsby controlling for the following macroeconomic variables in turn:GDP growth rate, inflation rate, industrial production (IP) growthrate, and PMI (headline as well as the new orders component). Allfive variables are found to be significant in driving the level of theseven-day repo rate, while inflation rate and IP growth rate are alsosignificant in driving the volatility of interbank rate.27 In addition,we control for the China policy uncertainty index constructed byBaker, Bloom, and Davis (2013).28 This news-based index of eco-nomic policy uncertainty is found to be significant in driving thelevel and volatility of interbank rates. Given that macro variablestend to be of lower frequency (monthly for all except GDP), weconstruct a daily dummy variable to capture the date when quar-terly GDP is announced in China. Using consensus forecast data, wealso construct a GDP surprise dummy, which captures the differencebetween the actual GDP release and the latest consensus forecast.
27The results are robust to different specifications, including when macro vari-ables enter in lagged terms.
28The variable is constructed based on counts of policy-related terms in Chi-nese newspaper and hence represents the occurrence or intensity of economicnews at the time. The detailed description of this variable is available athttp://www.policyuncertainty.com/china monthly.html.
Vol. 12 No. 1 Money-Market Rates and Retail Interest 177
Table 6. Estimated GARCH Parameters for InterbankMarkets in the United States and the United Kingdom
United UnitedStates Kingdom
Mean Equation
C −0.001 −1.2E-04†
Interbank Rate (–1) 1.001∗ 1.000∗
End of Month (+1) 0.0008 −1.6E-05End of Month 0.008∗ 6.5E-05End of Month (–1) 0.0004 6.2E-07End of Quarter (+1) 0.019∗ 4.5E-05End of Quarter −0.020∗ 0.001∗
End of Quarter (–1) −0.0005 2.0E-05End of Year (+1) −0.006 −0.0003End of Year −0.021 0.0002End of Year (–1) 0.0005 1.5E-04Monday 0.001 6.7E-06Wednesday 6.4E-05 5.3E-06Friday 0.0004 7.7E-06End of Maintenance Period −7.3E-05End of Maintenance Period (–1) −0.001End of Maintenance Period (–2) −0.0002End of Maintenance Period (–3) −0.0002End of Maintenance Period (–4) 0.001End of Maintenance Period (–9) 0.001
Variance Equation
C −0.304 −0.219∗
ARCH Effect (–1) 0.757∗ 1.075∗
Asymmetric Effect (–1) 0.137∗ −0.343GARCH Effect (–1) 0.966∗ 0.997∗
End of Month (+1) 0.038 0.659∗
End of Month 0.406 1.337∗
End of Month (–1) 0.231 0.297†
End of Quarter (+1) −1.446∗ −1.250∗
End of Quarter 3.157∗ 1.253∗
End of Quarter (–1) 0.258 1.546∗
End of Year (+1) 0.917 0.622
(continued)
178 International Journal of Central Banking March 2016
Table 6. (Continued)
United UnitedStates Kingdom
Variance Equation
End of Year −0.658 −1.657†
End of Year (–1) 0.479 −0.272Monday −0.301 −0.492∗
Wednesday −0.727∗ 0.030Friday −0.914∗ 0.081End of Maintenance Period 0.479∗
End of Maintenance Period (–1) 0.112End of Maintenance Period (–2) −0.102End of Maintenance Period (–3) 0.777∗
End of Maintenance Period (–4) −0.575∗
End of Maintenance Period (–9) −0.499∗
Adjusted R-Squared 0.998 0.999
Notes: U.S. Model: Dependent variable: Federal funds rate; sample period: April 2,2003 to April 30, 2012. Included observations: 2,369 after adjustments. UK Model:Dependent variable: one-week LIBOR; sample period: April 2, 2003 to April 30, 2012.Included observations: 2,303 after adjustments. Method: ML-ARCH (Marquardt) –Student’s t-distribution. * indicates significance at the 5 percent level, and † indicatessignificance at the 10 percent level.
While the announcement dummy is not significant, the GDP sur-prise dummy is significant in driving both the levels and the volatil-ity of interbank interest rate in China, despite the relatively shortsample period. These results suggest that interbank rates in Chinaare informative on liquidity conditions including open-market oper-ations, and the rates reflect important macroeconomic news, suchas GDP release, and movements in other key macro variables (table7).
Finally, we use event-study analysis to assess how interventionsimpact the informativeness of rates for news or market conditions.Following Thornton (2014), we consider the following regression:
rt = αe + βe × Dummyt + γe × Newst + σeDummyt
× Newst + εt, (11)
Vol. 12 No. 1 Money-Market Rates and Retail Interest 179Tab
le7.
Est
imat
edG
AR
CH
Par
amet
ers:
Mac
roec
onom
ics
New
s
GD
PIP
Inflat
ion
GD
PG
row
thG
row
thR
ate
PM
IU
nce
rtai
nty
Surp
rise
Mea
nEqu
atio
n
C−
0.07
6∗0.
011
−0.
012
−0.
097∗
−0.
091∗
0.02
6∗
Rep
o(–
1)1.
155∗
1.16
0∗1.
151∗
1.11
9∗1.
165∗
1.13
8∗
Rep
o(–
2)−
0.06
5∗−
0.08
4∗−
0.06
6∗−
0.06
2∗−
0.09
8∗−
0.04
2†
Rep
o(–
3)−
0.13
0∗−
0.09
7∗−
0.10
6∗−
0.13
0∗−
0.11
1∗−
0.11
3∗
Rep
o(–
4)0.
071∗
0.05
1∗0.
028
0.09
3∗0.
060∗
0.04
4∗
Rep
o(–
5)−
0.03
5∗−
0.03
3∗−
0.00
9−
0.02
9−
0.02
1−
0.02
8∗
Adm
inis
tere
dLen
ding
Rat
e0.
027∗
0.00
20.
009∗
−0.
025∗
0.02
9∗−
0.00
4A
dmin
iste
red
Dep
osit
Rat
e−
0.02
45∗
−0.
007
−0.
015∗
0.04
4∗−
0.03
0∗−
0.00
2O
MO
1.2E
-05
2.82
E-0
5†2.
6E-0
5†6.
4E-0
5∗3.
2E-0
5†3.
0E-0
5†
RR
5.6E
-05
3.5E
-05
−9.
5E-0
66.
3E-0
5∗8.
6E-0
5†3.
2E-0
5†
RR
Ann
ounc
emen
t0.
073∗
0.07
2∗0.
067∗
0.01
4∗0.
067∗
0.06
7∗
IPO
6.0E
-04†
4.1E
-04
5.8E
-04
0.00
050.
0006
0.00
06G
DP
Gro
wth
−0.
002∗
IPG
row
th−
0.00
04∗
Infla
tion
Rat
e−
0.00
1∗
PM
I0.
003∗
Unc
erta
inty
4.7E
-05∗
GD
PSu
rpri
se0.
898∗
Liq
uidi
tyE
ffect
s(A
vaila
ble
upon
Req
uest
)
(con
tinu
ed)
180 International Journal of Central Banking March 2016Tab
le7.
(Con
tinued
)
GD
PIP
Inflat
ion
GD
PG
row
thG
row
thR
ate
PM
IU
nce
rtai
nty
Surp
rise
Var
ianc
eEqu
atio
n
C0.
065
0.02
35−
0.45
2∗−
0.10
2−
0.32
4∗−
0.11
4A
RC
HE
ffect
(–1)
1.34
6∗1.
413†
1.62
2†1.
648
1.36
7†1.
671
Asy
mm
etri
cE
ffect
(–1)
0.55
3∗0.
439†
0.28
9†0.
662
0.28
5†0.
508†
GA
RC
HE
ffect
(–1)
0.97
7∗0.
969∗
0.94
4∗0.
958∗
0.95
6∗0.
967∗
Δin
Adm
inis
tere
dLen
ding
Rat
e5.
369∗
6.63
7∗9.
709∗
0.40
67.
353∗
7.06
8∗
Δin
Adm
inis
tere
dD
epos
itR
ate
−6.
134∗
−6.
675∗
−10
.513
∗−
1.60
2−
7.54
6∗−
7.61
4∗
OM
O0.
001∗
0.00
1†0.
003∗
0.00
2∗0.
002∗
0.00
2∗
RR
−0.
001∗
−0.
002∗
−0.
001
−0.
001
−0.
003∗
−0.
001
RR
Ann
ounc
emen
t1.
964∗
2.06
7∗2.
115∗
1.59
9∗2.
149∗
2.11
2∗
IPO
−0.
010
−0.
005
−0.
006
−0.
014†
−0.
004
−0.
007
IPO
(+5)
−0.
002
5.3E
-04
0.00
69.
9E-0
50.
003
0.00
05IP
O(+
10)
0.02
9∗0.
032∗
0.03
6∗0.
025∗
0.03
8∗0.
029∗
GD
PG
row
th−
0.00
5∗
IPG
row
th−
0.00
9∗
Infla
tion
Rat
e0.
028∗
PM
I−
4.7E
-05
Unc
erta
inty
0.00
1∗
GD
PSu
rpri
se11
.742
∗
Liq
uidi
tyE
ffect
s(A
vaila
ble
upon
Req
uest
)
Note
s:D
epen
dent
vari
able
:Rep
o(s
even
-day
repo
rate
);sa
mpl
eper
iod:
Apr
il8,
2003
toM
arch
27,2
012.
Incl
uded
obse
rvat
ions
:2,1
97af
ter
adju
stm
ents
.M
etho
d:M
L-A
RC
H(M
arqu
ardt
)–
Stud
ent’
st-
dist
ribu
tion
.*
indi
cate
ssi
gnifi
canc
eat
the
5per
cent
leve
l,an
d†
indi
cate
ssi
gnifi
canc
eat
the
10per
cent
leve
l.
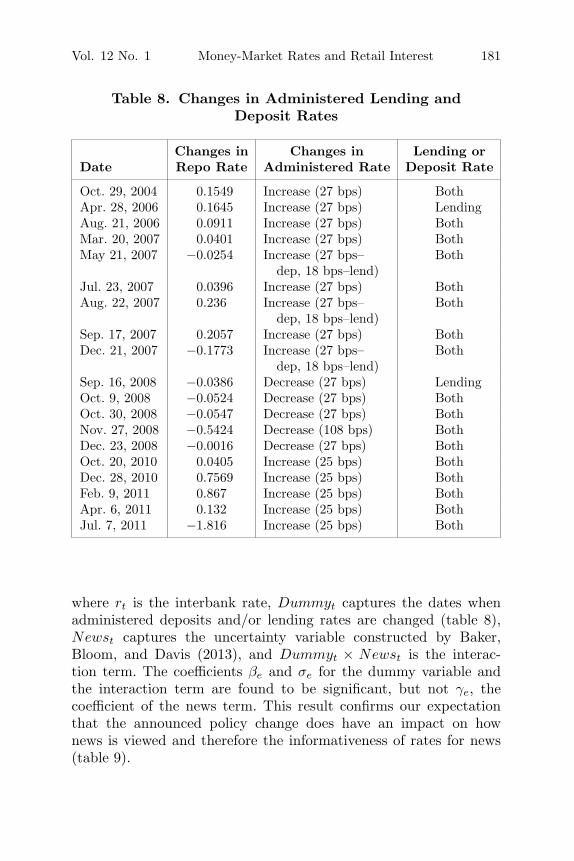
Vol. 12 No. 1 Money-Market Rates and Retail Interest 181
Table 8. Changes in Administered Lending andDeposit Rates
Changes in Changes in Lending orDate Repo Rate Administered Rate Deposit Rate
Oct. 29, 2004 0.1549 Increase (27 bps) BothApr. 28, 2006 0.1645 Increase (27 bps) LendingAug. 21, 2006 0.0911 Increase (27 bps) BothMar. 20, 2007 0.0401 Increase (27 bps) BothMay 21, 2007 −0.0254 Increase (27 bps– Both
dep, 18 bps–lend)Jul. 23, 2007 0.0396 Increase (27 bps) BothAug. 22, 2007 0.236 Increase (27 bps– Both
dep, 18 bps–lend)Sep. 17, 2007 0.2057 Increase (27 bps) BothDec. 21, 2007 −0.1773 Increase (27 bps– Both
dep, 18 bps–lend)Sep. 16, 2008 −0.0386 Decrease (27 bps) LendingOct. 9, 2008 −0.0524 Decrease (27 bps) BothOct. 30, 2008 −0.0547 Decrease (27 bps) BothNov. 27, 2008 −0.5424 Decrease (108 bps) BothDec. 23, 2008 −0.0016 Decrease (27 bps) BothOct. 20, 2010 0.0405 Increase (25 bps) BothDec. 28, 2010 0.7569 Increase (25 bps) BothFeb. 9, 2011 0.867 Increase (25 bps) BothApr. 6, 2011 0.132 Increase (25 bps) BothJul. 7, 2011 −1.816 Increase (25 bps) Both
where rt is the interbank rate, Dummyt captures the dates whenadministered deposits and/or lending rates are changed (table 8),Newst captures the uncertainty variable constructed by Baker,Bloom, and Davis (2013), and Dummyt × Newst is the interac-tion term. The coefficients βe and σe for the dummy variable andthe interaction term are found to be significant, but not γe, thecoefficient of the news term. This result confirms our expectationthat the announced policy change does have an impact on hownews is viewed and therefore the informativeness of rates for news(table 9).
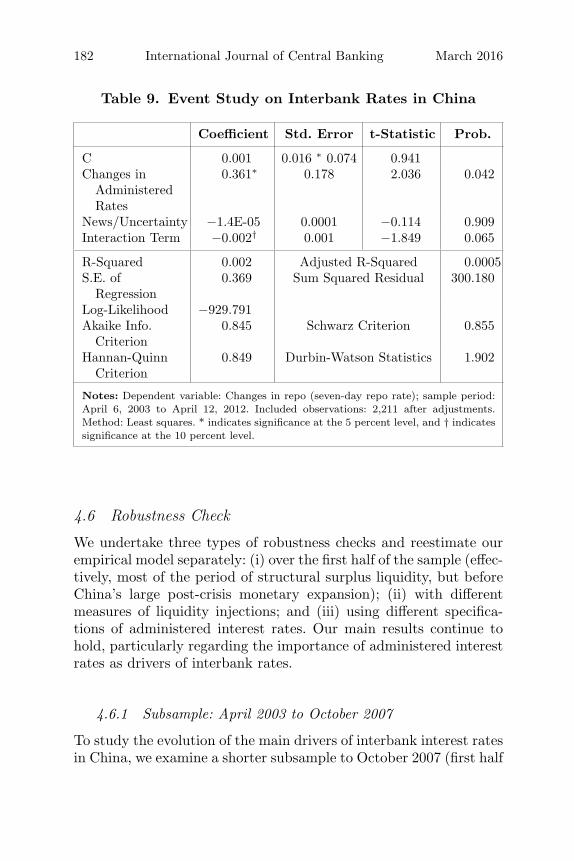
182 International Journal of Central Banking March 2016
Table 9. Event Study on Interbank Rates in China
Coefficient Std. Error t-Statistic Prob.
C 0.001 0.016 ∗ 0.074 0.941Changes in
AdministeredRates
0.361∗ 0.178 2.036 0.042
News/Uncertainty −1.4E-05 0.0001 −0.114 0.909Interaction Term −0.002† 0.001 −1.849 0.065
R-Squared 0.002 Adjusted R-Squared 0.0005S.E. of
Regression0.369 Sum Squared Residual 300.180
Log-Likelihood −929.791Akaike Info.
Criterion0.845 Schwarz Criterion 0.855
Hannan-QuinnCriterion
0.849 Durbin-Watson Statistics 1.902
Notes: Dependent variable: Changes in repo (seven-day repo rate); sample period:April 6, 2003 to April 12, 2012. Included observations: 2,211 after adjustments.Method: Least squares. * indicates significance at the 5 percent level, and † indicatessignificance at the 10 percent level.
4.6 Robustness Check
We undertake three types of robustness checks and reestimate ourempirical model separately: (i) over the first half of the sample (effec-tively, most of the period of structural surplus liquidity, but beforeChina’s large post-crisis monetary expansion); (ii) with differentmeasures of liquidity injections; and (iii) using different specifica-tions of administered interest rates. Our main results continue tohold, particularly regarding the importance of administered interestrates as drivers of interbank rates.
4.6.1 Subsample: April 2003 to October 2007
To study the evolution of the main drivers of interbank interest ratesin China, we examine a shorter subsample to October 2007 (first half

Vol. 12 No. 1 Money-Market Rates and Retail Interest 183
of the sample). We find that, with the shorter sample, administeredlending and deposit rates remain important drivers of China’s inter-bank interest rates, in both levels and variances, although the impor-tance of these interest rates has declined over time (as seen from theregression coefficients). While liquidity injection from open-marketoperations is found to be significant in the full sample to April 2012,it is not significant in the subsample to October 2007, neither inlevels nor in variances (tables 10 and 11). This finding suggests thatthe importance of open-market operations in influencing interbankinterest rates has increased over time, and interbank rates are start-ing to reflect changes in liquidity conditions, owing to open-marketoperations in recent years.
4.6.2 Liquidity Injection
In order to check the robustness of our results to different GARCHspecifications, we carry out several further experiments. First, weconsider a specification where changes in liquidity from open-marketoperations, reserve requirements, and IPOs are introduced in realterms, by accounting for inflation in the economy. The results arefound to be robust, particularly in both the impact coefficients andthe significance of key variables of interest—namely, administeredlending and deposit rates, liquidity injections from open-marketoperations, reserve requirements, and IPOs (tables 12 and 13).
In a second experiment, we sum up open-market operations andreserve requirements (real terms) into one quantitative monetarypolicy variable. We postulate that the earlier baseline result thatopen-market operations and changes in reserve requirements havea limited impact on the interbank rate in levels may be a resultof the shift in monetary policy instruments in China (Qin et al.2005). Reserve requirements played a prominent role between 2006and 2008, and then between 2010 and 2011 as part of monetarypolicy tools. As expected, the combined monetary policy variableis significant in influencing the level of the interbank interest rates.The impact of a 100-basis-point rise in liquidity conditions (injec-tion due to open-market operations and reserve requirements) is a0.4-basis-point rise in the mean interbank rate. However, the vari-able does not seem to be significant in explaining the volatility ofinterbank interest rates, which was driven mainly by changes in

184 International Journal of Central Banking March 2016
Table 10. Estimated GARCH Parameters(Subsample: April 2003 to October 2007)
Coefficient Std. Error z-Statistic p-Value
Mean Equation
C −0.130∗ 0.026 −5.014 0.000Repo (–1) 1.344∗ 0.022 62.484 0.000Repo (–2) −0.160∗ 0.038 −4.288 0.000Repo (–3) −0.315∗ 0.038 −8.304 0.000Repo (–4) 0.165∗ 0.033 5.057 0.000Repo (–5) −0.040∗ 0.018 −2.143 0.032Administered
Lending Rate0.050∗ 0.010 5.202 0.000
AdministeredDeposit Rate
−0.063∗ 0.013 −5.023 0.000
OMO 2.5E-05 1.8E-05 1.402 0.161RR 2.0E-04∗ 9.5E-05 2.068 0.039RR Announce-
ment0.056 0.039 1.428 0.153
IPO 2.1E-04 5.5E-04 0.388 0.698Liquidity Effects
(See Table 11)
Variance Equation
C −0.621∗ 0.166 −3.734 0.000ARCH Effect
(–1)1.578† 0.882 1.789 0.074
AsymmetricEffect (–1)
0.223 0.164 1.357 0.175
GARCH Effect(–1)
0.922∗ 0.010 92.007 0.000
Δ inAdministered
18.876∗ 4.707 4.010 0.000
Lending RateΔ in
Administered−17.889∗ 4.479 −3.994 0.000
Deposit RateOMO 0.002 0.002 1.401 0.161
(continued)
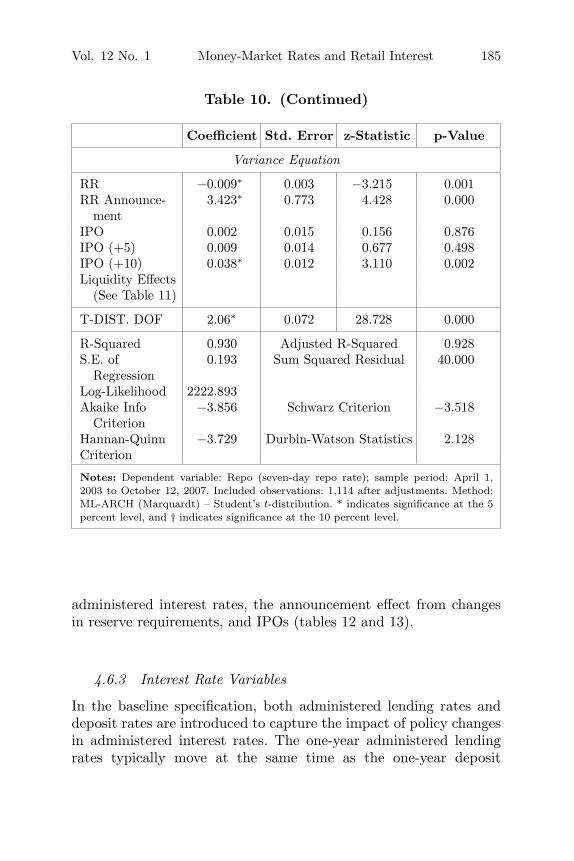
Vol. 12 No. 1 Money-Market Rates and Retail Interest 185
Table 10. (Continued)
Coefficient Std. Error z-Statistic p-Value
Variance Equation
RR −0.009∗ 0.003 −3.215 0.001RR Announce-
ment3.423∗ 0.773 4.428 0.000
IPO 0.002 0.015 0.156 0.876IPO (+5) 0.009 0.014 0.677 0.498IPO (+10) 0.038∗ 0.012 3.110 0.002Liquidity Effects
(See Table 11)
T-DIST. DOF 2.06∗ 0.072 28.728 0.000
R-Squared 0.930 Adjusted R-Squared 0.928S.E. of
Regression0.193 Sum Squared Residual 40.000
Log-Likelihood 2222.893Akaike Info
Criterion−3.856 Schwarz Criterion −3.518
Hannan-QuinnCriterion
−3.729 Durbin-Watson Statistics 2.128
Notes: Dependent variable: Repo (seven-day repo rate); sample period: April 1,2003 to October 12, 2007. Included observations: 1,114 after adjustments. Method:ML-ARCH (Marquardt) – Student’s t-distribution. * indicates significance at the 5percent level, and † indicates significance at the 10 percent level.
administered interest rates, the announcement effect from changesin reserve requirements, and IPOs (tables 12 and 13).
4.6.3 Interest Rate Variables
In the baseline specification, both administered lending rates anddeposit rates are introduced to capture the impact of policy changesin administered interest rates. The one-year administered lendingrates typically move at the same time as the one-year deposit
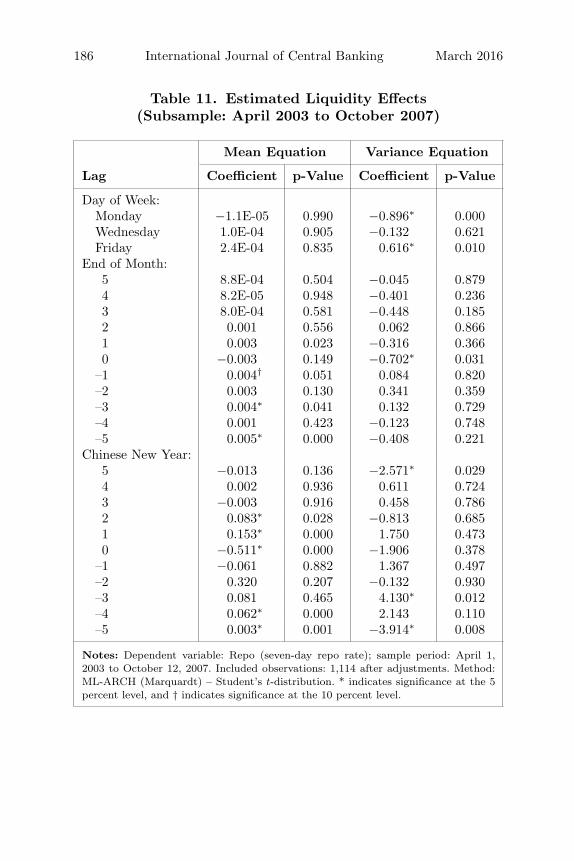
186 International Journal of Central Banking March 2016
Table 11. Estimated Liquidity Effects(Subsample: April 2003 to October 2007)
Mean Equation Variance Equation
Lag Coefficient p-Value Coefficient p-Value
Day of Week:Monday −1.1E-05 0.990 −0.896∗ 0.000Wednesday 1.0E-04 0.905 −0.132 0.621Friday 2.4E-04 0.835 0.616∗ 0.010
End of Month:5 8.8E-04 0.504 −0.045 0.8794 8.2E-05 0.948 −0.401 0.2363 8.0E-04 0.581 −0.448 0.1852 0.001 0.556 0.062 0.8661 0.003 0.023 −0.316 0.3660 −0.003 0.149 −0.702∗ 0.031
–1 0.004† 0.051 0.084 0.820–2 0.003 0.130 0.341 0.359–3 0.004∗ 0.041 0.132 0.729–4 0.001 0.423 −0.123 0.748–5 0.005∗ 0.000 −0.408 0.221
Chinese New Year:5 −0.013 0.136 −2.571∗ 0.0294 0.002 0.936 0.611 0.7243 −0.003 0.916 0.458 0.7862 0.083∗ 0.028 −0.813 0.6851 0.153∗ 0.000 1.750 0.4730 −0.511∗ 0.000 −1.906 0.378
–1 −0.061 0.882 1.367 0.497–2 0.320 0.207 −0.132 0.930–3 0.081 0.465 4.130∗ 0.012–4 0.062∗ 0.000 2.143 0.110–5 0.003∗ 0.001 −3.914∗ 0.008
Notes: Dependent variable: Repo (seven-day repo rate); sample period: April 1,2003 to October 12, 2007. Included observations: 1,114 after adjustments. Method:ML-ARCH (Marquardt) – Student’s t-distribution. * indicates significance at the 5percent level, and † indicates significance at the 10 percent level.

Vol. 12 No. 1 Money-Market Rates and Retail Interest 187
Table 12. Estimated GARCH Parameters:Robustness–Liquidity Injection
Real CombinedLiquidity MonetaryInjection Policy Variable
Mean Equation
C −0.040∗ −0.033∗
Repo (–1) 1.151∗ 1.141∗
Repo (–2) −0.065∗ −0.060Repo (–3) −0.143∗ −0.142∗
Repo (–4) 0.081∗ 0.072∗
Repo (–5) −0.027† −0.015Administered Lending Rate 0.015∗ 0.012∗
Administered Deposit Rate −0.019∗ −0.014∗
Real OMO 0.004∗
Real RR 0.002Real OMO + RR 0.004∗
RR Announcement 0.065∗ 0.061∗
Real IPO 0.047 0.037Liquidity Effects (See Table 13)
Variance Equation
C −0.093 −0.177†
ARCH Effect (–1) 1.569† 1.296∗
Asymmetric Effect (–1) 0.386† 0.347†
GARCH Effect (–1) 0.969∗ 0.969∗
Δ in Administered Lending Rate 7.910∗ 6.962∗
Δ in Administered Deposit Rate −8.597∗ −7.481∗
Real OMO 0.208∗
Real RR −0.121†
Real OMO + RR 0.049RR Announcement 2.110∗ 2.066∗
IPO −0.773 −0.725IPO (+5) −0.082 0.114IPO (+10) 3.256∗ 3.406∗
Liquidity Effects (See Table 13)
Notes: Dependent variable: Repo (seven-day repo rate); sample period: April 1, 2003to April 12, 2012. Included observations: 2,197 after adjustments. Method: ML-ARCH(Marquardt) – Student’s t-distribution. * indicates significance at the 5 percent level,and † indicates significance at the 10 percent level.

188 International Journal of Central Banking March 2016
Table 13. Estimated Liquidity Effects:Robustness–Liquidity Injection
Mean Equation Variance Equation
Combined CombinedReal Monetary Real Monetary
Liquidity Policy Liquidity PolicyLag Injection Variable Injection Variable
Day of Week:Monday −7.4E-04 −8.3E-04 −0.734∗ −0.667∗
Wednesday −2.8E-04 −2.9E-04 −0.484∗ −0.396Friday 1.7E-04 1.6E-04 0.073 0.221
End of Month:5 3.2E-04 1.1E-05 0.002 0.0394 −6.4E-04 −0.001 −0.418† −0.3623 9.0E-04 7.1E-04 −0.545∗ −0.595∗
2 −2.0E-04 −5.5E-04 0.161 0.1471 0.001 0.001 −0.545∗ −0.547∗
0 −0.003 −0.003 −0.255 −0.283–1 0.005∗ 0.005∗ −0.188 −0.170–2 0.002 0.002 0.564∗ 0.568∗
–3 0.004∗ 0.004∗ −0.251 −0.251–4 0.001 0.002 −0.107 −0.024–5 0.003∗ 0.003∗ −0.074 −0.120
Chinese NewYear:5 −0.015 −0.016 −1.097 −1.0534 −0.005 −0.011 1.197 1.3213 0.005 0.006 −0.141 −0.2752 0.036∗ 0.038∗ −2.029∗ −2.113∗
1 0.065∗ 0.064 −0.113 −0.1430 −0.470∗ −0.463∗ 0.022 0.067
–1 0.015 0.019 −0.002 0.033–2 0.343∗ 0.345∗ 0.920 0.955–3 0.090∗ 0.091∗ 2.566∗ 2.741∗
–4 0.061∗ 0.061∗ −1.273† −1.116†
–5 0.004 0.003 −0.110 −0.112
Notes: Dependent variable: Repo (seven-day repo rate); sample period: April 1, 2003to April 12, 2012. Included observations: 2,197 after adjustments. Method: ML-ARCH(Marquardt) – Student’s t-distribution. * indicates significance at the 5 percent level,and † indicates significance at the 10 percent level.
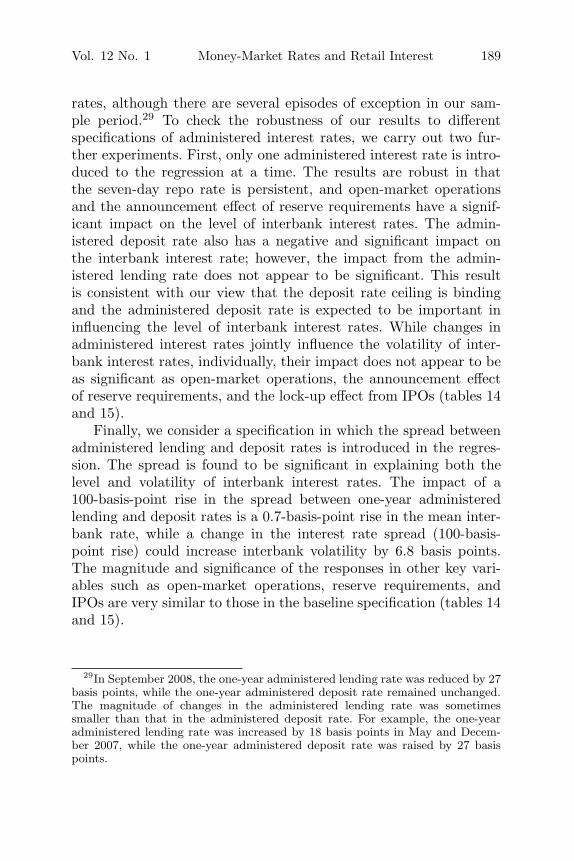
Vol. 12 No. 1 Money-Market Rates and Retail Interest 189
rates, although there are several episodes of exception in our sam-ple period.29 To check the robustness of our results to differentspecifications of administered interest rates, we carry out two fur-ther experiments. First, only one administered interest rate is intro-duced to the regression at a time. The results are robust in thatthe seven-day repo rate is persistent, and open-market operationsand the announcement effect of reserve requirements have a signif-icant impact on the level of interbank interest rates. The admin-istered deposit rate also has a negative and significant impact onthe interbank interest rate; however, the impact from the admin-istered lending rate does not appear to be significant. This resultis consistent with our view that the deposit rate ceiling is bindingand the administered deposit rate is expected to be important ininfluencing the level of interbank interest rates. While changes inadministered interest rates jointly influence the volatility of inter-bank interest rates, individually, their impact does not appear to beas significant as open-market operations, the announcement effectof reserve requirements, and the lock-up effect from IPOs (tables 14and 15).
Finally, we consider a specification in which the spread betweenadministered lending and deposit rates is introduced in the regres-sion. The spread is found to be significant in explaining both thelevel and volatility of interbank interest rates. The impact of a100-basis-point rise in the spread between one-year administeredlending and deposit rates is a 0.7-basis-point rise in the mean inter-bank rate, while a change in the interest rate spread (100-basis-point rise) could increase interbank volatility by 6.8 basis points.The magnitude and significance of the responses in other key vari-ables such as open-market operations, reserve requirements, andIPOs are very similar to those in the baseline specification (tables 14and 15).
29In September 2008, the one-year administered lending rate was reduced by 27basis points, while the one-year administered deposit rate remained unchanged.The magnitude of changes in the administered lending rate was sometimessmaller than that in the administered deposit rate. For example, the one-yearadministered lending rate was increased by 18 basis points in May and Decem-ber 2007, while the one-year administered deposit rate was raised by 27 basispoints.
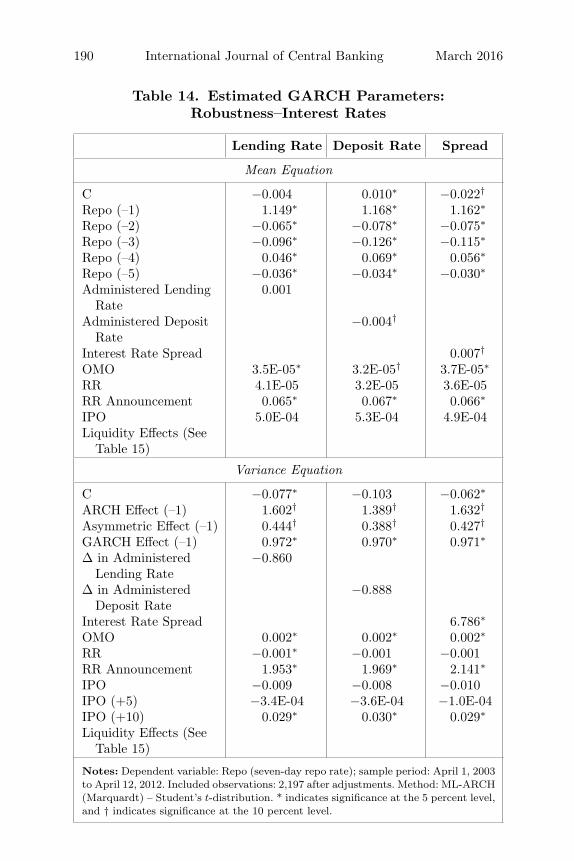
190 International Journal of Central Banking March 2016
Table 14. Estimated GARCH Parameters:Robustness–Interest Rates
Lending Rate Deposit Rate Spread
Mean Equation
C −0.004 0.010∗ −0.022†
Repo (–1) 1.149∗ 1.168∗ 1.162∗
Repo (–2) −0.065∗ −0.078∗ −0.075∗
Repo (–3) −0.096∗ −0.126∗ −0.115∗
Repo (–4) 0.046∗ 0.069∗ 0.056∗
Repo (–5) −0.036∗ −0.034∗ −0.030∗
Administered LendingRate
0.001
Administered DepositRate
−0.004†
Interest Rate Spread 0.007†
OMO 3.5E-05∗ 3.2E-05† 3.7E-05∗
RR 4.1E-05 3.2E-05 3.6E-05RR Announcement 0.065∗ 0.067∗ 0.066∗
IPO 5.0E-04 5.3E-04 4.9E-04Liquidity Effects (See
Table 15)
Variance Equation
C −0.077∗ −0.103 −0.062∗
ARCH Effect (–1) 1.602† 1.389† 1.632†
Asymmetric Effect (–1) 0.444† 0.388† 0.427†
GARCH Effect (–1) 0.972∗ 0.970∗ 0.971∗
Δ in AdministeredLending Rate
−0.860
Δ in AdministeredDeposit Rate
−0.888
Interest Rate Spread 6.786∗
OMO 0.002∗ 0.002∗ 0.002∗
RR −0.001∗ −0.001 −0.001RR Announcement 1.953∗ 1.969∗ 2.141∗
IPO −0.009 −0.008 −0.010IPO (+5) −3.4E-04 −3.6E-04 −1.0E-04IPO (+10) 0.029∗ 0.030∗ 0.029∗
Liquidity Effects (SeeTable 15)
Notes: Dependent variable: Repo (seven-day repo rate); sample period: April 1, 2003to April 12, 2012. Included observations: 2,197 after adjustments. Method: ML-ARCH(Marquardt) – Student’s t-distribution. * indicates significance at the 5 percent level,and † indicates significance at the 10 percent level.
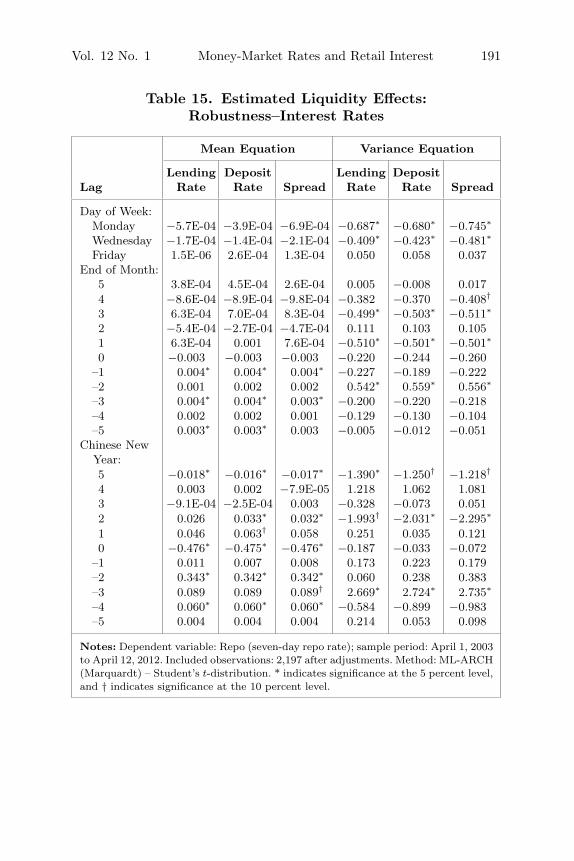
Vol. 12 No. 1 Money-Market Rates and Retail Interest 191
Table 15. Estimated Liquidity Effects:Robustness–Interest Rates
Mean Equation Variance Equation
Lending Deposit Lending DepositLag Rate Rate Spread Rate Rate Spread
Day of Week:Monday −5.7E-04 −3.9E-04 −6.9E-04 −0.687∗ −0.680∗ −0.745∗
Wednesday −1.7E-04 −1.4E-04 −2.1E-04 −0.409∗ −0.423∗ −0.481∗
Friday 1.5E-06 2.6E-04 1.3E-04 0.050 0.058 0.037End of Month:
5 3.8E-04 4.5E-04 2.6E-04 0.005 −0.008 0.0174 −8.6E-04 −8.9E-04 −9.8E-04 −0.382 −0.370 −0.408†
3 6.3E-04 7.0E-04 8.3E-04 −0.499∗ −0.503∗ −0.511∗
2 −5.4E-04 −2.7E-04 −4.7E-04 0.111 0.103 0.1051 6.3E-04 0.001 7.6E-04 −0.510∗ −0.501∗ −0.501∗
0 −0.003 −0.003 −0.003 −0.220 −0.244 −0.260–1 0.004∗ 0.004∗ 0.004∗ −0.227 −0.189 −0.222–2 0.001 0.002 0.002 0.542∗ 0.559∗ 0.556∗
–3 0.004∗ 0.004∗ 0.003∗ −0.200 −0.220 −0.218–4 0.002 0.002 0.001 −0.129 −0.130 −0.104–5 0.003∗ 0.003∗ 0.003 −0.005 −0.012 −0.051
Chinese NewYear:5 −0.018∗ −0.016∗ −0.017∗ −1.390∗ −1.250† −1.218†
4 0.003 0.002 −7.9E-05 1.218 1.062 1.0813 −9.1E-04 −2.5E-04 0.003 −0.328 −0.073 0.0512 0.026 0.033∗ 0.032∗ −1.993† −2.031∗ −2.295∗
1 0.046 0.063† 0.058 0.251 0.035 0.1210 −0.476∗ −0.475∗ −0.476∗ −0.187 −0.033 −0.072
–1 0.011 0.007 0.008 0.173 0.223 0.179–2 0.343∗ 0.342∗ 0.342∗ 0.060 0.238 0.383–3 0.089 0.089 0.089† 2.669∗ 2.724∗ 2.735∗
–4 0.060∗ 0.060∗ 0.060∗ −0.584 −0.899 −0.983–5 0.004 0.004 0.004 0.214 0.053 0.098
Notes: Dependent variable: Repo (seven-day repo rate); sample period: April 1, 2003to April 12, 2012. Included observations: 2,197 after adjustments. Method: ML-ARCH(Marquardt) – Student’s t-distribution. * indicates significance at the 5 percent level,and † indicates significance at the 10 percent level.
192 International Journal of Central Banking March 2016
5. Conclusion
This paper investigates the main drivers of China’s interbank ratesby developing a stylized theoretical model of China’s interbank mar-ket, and estimating an EGARCH model for the seven-day interbankrepo rate from April 2003 to April 2012, controlling for adminis-tered interest rates, monetary policy variables, IPO volumes, andliquidity effects. The stylized theoretical model pins down the analyt-ical relationship between regulated and market-determined interestrates and predicts that administratively determined deposit ratesand lending rates are likely to influence the movements of interbankrates. In particular, the interbank rate is increasing in the lendingrate (provided the lending rate has not already exceeded its equilib-rium) and decreasing in the deposit rate (as interest rate regulationholds the deposit rate below the equilibrium level).
Our empirical results confirm the predictions from the theoret-ical model that China’s interbank rates are not truly independent.Administered interest rates are found to be important determinantsof the interbank rates, in both levels and volatility. Interbank ratesare also influenced by the announcement effects of changes in reserverequirements, together with liquidity injections from open-marketoperations in recent years, and would generally seem less informa-tive than in more developed markets. IPO activities affect interbankvolatility, as well as systemic variations in liquidity throughout theweek, during the month, and due to the timing of the Chinese NewYear. Our results suggest that the regulation of key retail interestrates influences the behavior of market-determined interbank rates,which may have limited their ability to act as independent price sig-nals. While reflecting news, changes in administered interest ratesaffect the way news impacts rates.
These conclusions raise a number of interesting issues on theliberalization of financial prices in emerging markets. First, thetheoretical and empirical results suggest that partial liberaliza-tions may have limited effectiveness. That is, market-determinedrates, even longer-term bond yields, can reflect interest rate reg-ulation in other parts of the market. The “policy spillover” thusaffects private decisions that are directly determined by unregu-lated prices. This would include firms that seek to fund projectsthrough bonds, and banks participating in the interbank market,

Vol. 12 No. 1 Money-Market Rates and Retail Interest 193
as well as those seeking to protect themselves through derivativestransactions (since derivatives prices depend on interbank rates).Moreover, if the interest rate regulation is binding, the allocation ofcredit across potential projects is left to the banking sector, ratherthan independent financial markets. Although it may be imprudentto read these considerations as suggesting a “big-bang” approachto liberalization, or considering financial market liberalization as ageneral precondition for assistance, they nevertheless suggest mov-ing through the liberalization of domestic yields and asset pricessomewhat quickly.30
Regarding the conduct of monetary policy in the process of finan-cial and economic development, our results highlight the risks fromexcessive regulation on monetary policy implementation. The linkbetween market and regulated interest rates suggests limits to theeffectiveness of indirect monetary policy instruments. This can beseen in China’s experience. Despite a desire to move toward indirectmonetary policy instruments, the interest rate channel is still weakin China (see, for example, Maino and Laurens 2007 and Cassolaand Porter 2011), although this would apply equally to other emerg-ing and developing markets with partial financial liberalization. Forshort-term interest rates to become an effective operational target(influencing inflation and economic activity), the PBC has to be ableto influence this rate effectively through open-market operations. Inaddition, the impact of uneven financial developments and interestrate regulation is likely to erode the effectiveness of direct mone-tary policy tools. In particular, the incentive for disintermediationresulting from regulation (out of the banking sector and into trustcompanies as part of “shadow banking”) is likely to affect move-ments in the velocity of money and the money multiplier. Mainoand Laurens (2007) find that while the PBC is able to meet its basemoney target, it is less effective at achieving its broad money targetsand influencing economic growth.
Further interest rate liberalization should allow the interbankrate (and other interest rates) to provide better essential price sig-nals, to better allocate capital, and to strengthen the tools for
30The general precondition for assistance should be “macro-critical,” and lib-eralization may not meet the “macro-critical” criterion in all countries.

194 International Journal of Central Banking March 2016
macroeconomic management. In particular, further deposit rate lib-eralization would allow banks to charge higher retail deposit ratesto attract additional deposits, and potentially lead to a rise inretail loan rates for banks to maintain their profit margins andto meet capital requirements. This should then increase the costof capital and thereby help to discourage marginal investment andimprove the allocation of capital and the effectiveness of interme-diation (Feyzioglu, Porter, and Takats 2009). The liberalization ofthe deposit rate would also remove an important distortion in theinterbank rate, which would allow short-term interbank rates toplay a more effective role as the primary indirect monetary policytool.
China and other emerging-market economies may face twoimportant challenges in the process of further interest rate liber-alization and financial development. First, the volatility of inter-est rates may increase, depending on the post-liberalization con-duct of monetary policy.31 Even if volatility does increase, as hasbeen the experience in other money markets (Demirguc-Kunt andDetragiache 2001), this higher volatility will result from market-determined rates being more responsive to fundamental changesin liquidity in emerging-market economies and risk characteristicsrather than changes in regulated interest rates. This is part ofstrengthening the price signals conveyed by interest rates. In anycase, the volatility of Chinese money-market rates could be reducedthrough a change in the structure of reserve requirements from dailyreserve requirements to reserve averaging, irrespective of the extentof liberalization. Second, by creating new channels for banks toattract deposits and compete, liberalization could also lead to exces-sive lending (if banks choose to increase the quantity of loans insteadof retail loan rates in response to liberalization) and place pressureon credit quality and the profitability of banks. If, however, liberal-ization is accompanied by heightened supervision and strengthenedmonetary policy, further liberalization could improve the effective-ness of intermediation and monetary transmission with enhancedfinancial stability.
31If the short-term interbank rate becomes a target for monetary policy, thenvolatility may decline.
Vol. 12 No. 1 Money-Market Rates and Retail Interest 195
Data Appendix: Data Sources
• China Interbank Interest Rates: The seven-day call loanand repo (interbank repurchase bond) series are drawn fromHaver Analytics and the CEIC Premium China Database.The ticker identifiers for these three interbank interest ratesare CDOBC, CDODM, and CDODA, respectively. The threeseries are nominal and are measured in percent per annum.
• One-Year Administered (Benchmark) Deposit andLending Rates: The one-year administered deposit(CDDAD) and lending rates (CDLBA) are taken from HaverAnalytics and the CEIC Premium China Database. Theadministered interest rates are nominal and are measured inpercent per annum.
• Measure of Open-Market Operations: The measureof open-market operations captures the level of net liquid-ity injection from the expiration of repos and PBC cen-tral bank bills (expiration less issuance), and the issuanceof reverse repos. The data series on open-market operationsand reserve requirements are taken from Haver Analytics andthe CEIC Premium China Database. Repos are issued at7-day (CDOHBE), 14-day (CDOHBF), 21-day (CDOHBG),28-day (CDOHBH), 84-day (CDOHBI), 91-day (CDOHBJ),and 182-day (CDOHBK) maturities. Reverse repos are issuedat 14-day (CDOHBT) and 21-day (CDOHBU) maturities. Theissuance of PBC central bank bills is typically at three-month(CDOHAA), six-month (CDOHAB), one-year (CDOHAC),and three-year (CDOHAD) maturities. The data series aremeasured in millions of RMB.
• Measure of Reserve Requirements: The variable reserverequirement measures the liquidity injected from a fall inrequired reserves. We construct the variable using data onthe required reserve ratio (CMAAAA) and deposits in finan-cial institutions (local and foreign currency) (CKAHNC). Therequired reserve ratio is measured in percent per annum andthe deposit data are measured in billions of RMB. The changein the liquidity condition is then constructed as the change inthe reserve requirement ratio times the deposit base. Giventhat changes in reserve requirements are usually announced
196 International Journal of Central Banking March 2016
one or two weeks before the effective date, we also construct adummy to capture the announcement effect of reserve require-ment changes, where the dummy is equal to the change in thereserve requirement ratio on the date of the announcement.
• IPOs: The data source on IPO volumes in China is theStockstar website (http://resource.stockstar.com/DataCenter/StockData/IPODataList.aspx, in Chinese, last accessed May8, 2012). We construct two IPO series: for the first series(funds raised), we aggregate the total amount of fundsraised from IPO activities on a particular listing day toconstruct a daily time series for IPO volume; for the sec-ond series (funds frozen), we aggregate the total amountof funds frozen on the application date, ahead of the IPOdate. Note that the application date for an IPO is typi-cally one or two weeks ahead of the actual IPO date. Largeamounts of funds are frozen one day after the applicationdate, and the portion of funds that are unsuccessful in bid-ding are released four days after the application date. (Seehttp://www1.cfi.cn/bcA0A1A8A194A1792.html for details onIPO issuance in China, in Chinese).
References
Alexander, W. E., C. Enoch, and T. J. T. Balio. 1995. “The Adop-tion of Indirect Instruments of Monetary Policy.” IMF Occa-sional Paper No. 126.
Aziz, J. 2007. “Rebalancing China’s Economy: What Does GrowthTheory Tell Us?” IMF Working Paper No. 06/291.
Baker, S. R., N. Bloom, and S. J. Davis. 2013. “Measuring EconomicPolicy Uncertainty.” Discussion Paper.
Bartolini, L., G. Bertola, and A. Prati. 2001. “Banks’ Reserve Man-agement, Transaction Costs, and the Timing of Federal ReserveIntervention.” Journal of Banking and Finance 25 (7): 1287–1317.
Bartolini, L., and A. Prati. 2006. “Cross-Country Differences inMonetary Policy Execution and Money Market Rates’ Volatil-ity.” European Economic Review 50 (2): 349–76.
Vol. 12 No. 1 Money-Market Rates and Retail Interest 197
Cassola, N., and N. J. Porter. 2011. “Understanding Chinese BondYields and their Role in Monetary Policy.” IMF Working PaperNo. 11/225.
Christiano, L., R. Motto, and M. Rostagno. 2010. “Financial Factorsin Economic Fluctuations.” ECB Working Paper No. 1192.
Demirguc-Kunt, A., and E. Detragiache. 2001. “Financial Liberal-ization and Financial Fragility.” In Financial Liberalization: HowFar, How Fast?, ed. P. H. Gerard Caprio, P. Honohan, and J. E.Stiglitz. The World Bank.
Feyzioglu, T., N. J. Porter, and E. Takats. 2009. “Interest RateLiberalization in China.” IMF Working Paper No. 09/171.
Freixas, X., and J.-C. Rochet. 2008. Microeconomics of Banking, 2ndEdition. The MIT Press.
Geiger, M. 2006. “Monetary Policy in China (1994–2004): Targets,Instruments and Their Effectiveness.” Economic Working PaperNo. 68, University of Wurzburg.
Gertler, M., and N. Kiyotaki. 2010. “Financial Intermediation andCredit Policy in Business Cycle Analysis.” In Handbook of Mon-etary Economics, ed. B. M. Friedman and M. Woodford, 547–99(chapter 11). Elsevier.
Hamilton, J. D. 1996. “The Daily Market for Federal Funds.” Jour-nal of Political Economy 104 (1): 26–56.
International Monetary Fund. 2010. “People’s Republic of China:2010 Article IV Consultation-Staff Report.” IMF CountryReport No. 10/238.
Maino, R., and B. Laurens. 2007. “China: Strengthening MonetaryPolicy Implementation.” IMF Working Paper No. 07/14.
Mandelbrot, B. 1963. “The Variation of Certain Speculative Prices.”Journal of Business 36 (4): 394–419.
McCallum, B. T. 1988. “Robustness Properties of a Rule for Mon-etary Policy.” Carnegie-Rochester Conference Series on PublicPolicy 29 (1): 173–203.
———. 2003. “Japanese Monetary Policy, 1991–2001.” EconomicQuarterly (Federal Reserve Bank of Richmond) (Win): 1–31.
Mehrotra, A., T. Koivu, and R. Nuutilainen. 2008. “McCallum Ruleand Chinese Monetary Policy.” Discussion Paper No. 15/2008,Bank of Finland, Institute for Economies in Transition.
Moschitz, J. 2004. “The Determinants of the Overnight Interest Ratein the Euro Area.” ECB Working Paper No. 393.

198 International Journal of Central Banking March 2016
Nelson, D. B. 1991. “Conditional Heteroskedasticity in AssetReturns: A New Approach.” Econometrica 59 (2): 347–70.
Porter, N. J., and T. Xu. 2009. “What Drives China’s InterbankMarket?” IMF Working Paper No. 09/189.
Prati, A., L. Bartolini, and G. Bertola. 2003. “The Overnight Inter-bank Market: Evidence from the G-7 and the Euro Zone.” Jour-nal of Banking and Finance 27 (10): 2045–83.
Qin, D., P. Quising, X. He, and S. Liu. 2005. “Modeling MonetaryTransmission and Policy in China.”Journal of Policy Modeling27 (2): 157–75.
Quiros, G. P., and H. R. Mendizabal. 2006. “The Daily Market forFunds in Europe: What Has Changed with the EMU?” Journalof Money, Credit and Banking 38 (1): 91–118.
Terasvirta, T. 2009. “An Introduction to Univariate GARCH Mod-els.” In Handbook of Financial Time Series, ed. T. G. Andersen,R. A. Davis, J.-P. Kreiß, and T. Mikosch, 17–42. Springer.
Thornton, D. L. 2014. “An Evaluation of Event-Study Evidenceon the Effectiveness of the FOMC’s LSAP Program: Are theAnnouncement Effects Identified?” Working Paper No. 2013-033,Federal Reserve Bank of St. Louis.
Xu, Z. 2006. “China’s Money Markets: Policies and the Banks.”In China’s Financial Markets: An Insider’s Guide to How theMarkets Work, ed. S. N. Neftci and M. Y. Menager-Xu, 41–86(chapter 2). New York: Academic Press.