Embed Size (px)
Citation preview

IOSR Journal Of Humanities And Social Science (IOSR-JHSS)
Volume 20, Issue 10, Ver. IV (Oct. 2015), PP 52-71
e-ISSN: 2279-0837, p-ISSN: 2279-0845.
www.iosrjournals.org
DOI: 10.9790/0837-201045271 www.iosrjournals.org 52 | Page
Money Supply and Agriculture (A Special Study of Indian
Agriculture)
Rusha Sarkar Research Scholar Regional and Economic Planning Barkatullah University Bhopal, (M.P.) India
Abstract: The paper deals with Agriculture of India and Money Supply in the Indian Economy after Reforms
period. The paper also explains the relationship between them and the impact of Money Supply on Agriculture.
The various measures of Money Supply, the concept of Narrow Money and Broad Money are also explains here.
The Trend, Composition and Patterns of Narrow Money and Broad Money are analyzed here in this paper. The
importance of Agriculture for National Income, Foreign Trade, Capital Formation, and Employment are
described here. The production scenario of both the Kharif and Rabi crops are analyzed here also, The paper
analyzed the impact of Money Supply on Agriculture with the statistical tools Correlation and Regression
analysis which tells it has a positive relationship.
Keywords: Agriculture, Employment, Foreign Trade, Money Supply, National Income etc.
I. Introduction Agriculture which has always been the backbone of the Indian economy is studied and analyzed in this
paper. Agricultural progress which is normally regarded as a prerequisite of economic development is the entire
superstructure of the growth of industrial and other sectors of the economy in modern times also. Kuznets, the
great economist identifies four possible types of contribution of the agriculture sector which makes the overall
economic development. These are ---
1 -Product contribution making available food and raw materials.
2-Market contribution providing the market for producer goods and consumer goods
3- Factor contribution making available labour and capital to the non-agricultural sector.
4-Foreign exchange contribution
On the other hand, the supply of money is a stock at a particular point of time, though it conveys the
idea of a flow over time. The term 'the supply of money' is synonymous with such terms as 'money stock',
'stock of money', 'money supply' and 'quantity of money'. The supply of money at any moment is the total
amount of money in the economy.
1.1-REVIEW OF LITERATURE-Various books and research papers related to this study I already studied .I
give the names in references.
1.2-OBJECTIVES- I have certain objectives to write this paper which I give bellow-
To study about the measures of Money Supply
To analyze about the trend and patterns of Narrow Money after reforms period.
To analyze about the trend and patterns of Broad Money after reforms period
To study about Indian Agriculture and its importance
To study the production scenario of Agriculture
To analyze the impact of Money Supply on Agriculture
1.3- DATA COLLECTION& METHODOLOGY- . These All the data are collected from secondary sources.
The methodology which I use for analyzing the data is KARL PEARSON”S CORRELATION
®RESSION.
II. Measures Of Money Supply: There are four measures of money supply in India which are denoted by M1, M2, M3 and M4. This
classification was introduced by the Reserve Bank of India (RBI) in April 1977. Prior to this till March 1968,
the RBI published only one measure in keeping with the traditional and Keynesian views of a narrow measure
of the money supply.
M1 : A measure of the money supply that includes all physical money, such as coins and currency, as well as
demand deposits, checking accounts and Negotiable Order of Withdrawal (NOW) accounts. M1 measures the
most liquid components of the money supply.
Money Supply and Agriculture (A Special Study of Indian Agriculture)
DOI: 10.9790/0837-201045271 www.iosrjournals.org 53 | Page
M1 = C + DD + OD (equation-1)
Where C = currency deposits with the public,
DD = Demand deposits with the public in the commercial and cooperative banks,
OD = other deposits held by the public with RBI.
M2 : M2 is a broader concept of money supply in India than M1. In addition to the three items of M1, the concept
of money supply M2 includes savings deposits with the post office saving banks. Thus,
M2 = M1 + saving deposits with the post-office saving banks (equqtion-2)
M3 : M3 is a broad concept of money supply. In addition to the items of money supply included in measure M1,
in money supply M3 time deposits with the banks are also included. Thus,
M3 = M1 + Time deposits with the banks (equation-3)
M4 : The measure M4 of money supply includes not only all the items of M3 described above but also the total
deposits with the Post-Office Savings Organization. However, this excludes contributions made by the public to
the national saving certificates. Thus,
M4 = M3+Total deposits with Post-Office Savings Organization (equation-4)
Of the four inter-related measures of money supply for which the RBI publishes data, it is M3 which is
of special significance. It is M3 which is taken into account in formulating macroeconomic objectives of the
economy every year. For some reasons RBI does not attach any importance to these measures (M2 and M4) and
that’s why it has not updated figures of Post Office savings accounts and Total deposits of Post Office savings
organization from time to time.
So, the whole study is about two measures of money supply i.e. M1 (Narrow Money) and M3 (Broad
Money).
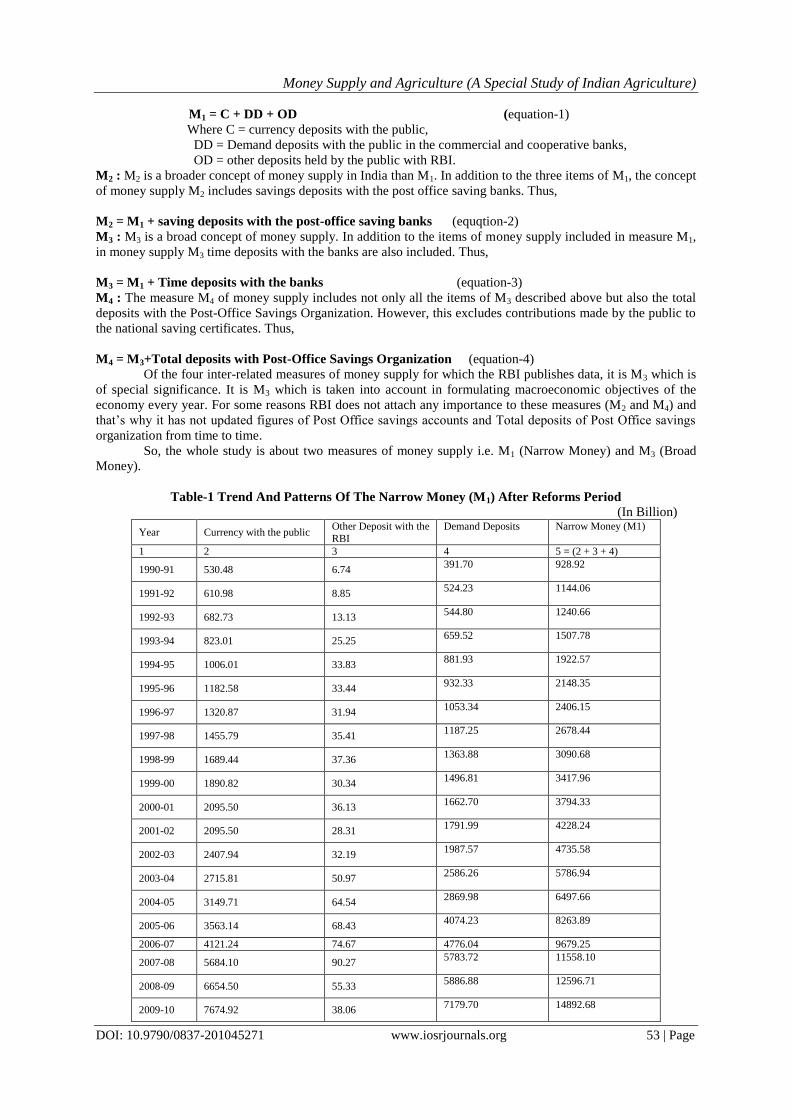
Table-1 Trend And Patterns Of The Narrow Money (M1) After Reforms Period
(In Billion)
Year Currency with the public Other Deposit with the
RBI
Demand Deposits Narrow Money (M1)
1 2 3 4 5 = (2 + 3 + 4)
1990-91 530.48 6.74 391.70 928.92
1991-92 610.98 8.85 524.23 1144.06
1992-93 682.73 13.13 544.80 1240.66
1993-94 823.01 25.25 659.52 1507.78
1994-95 1006.01 33.83 881.93 1922.57
1995-96 1182.58 33.44 932.33 2148.35
1996-97 1320.87 31.94 1053.34 2406.15
1997-98 1455.79 35.41 1187.25 2678.44
1998-99 1689.44 37.36 1363.88 3090.68
1999-00 1890.82 30.34 1496.81 3417.96
2000-01 2095.50 36.13 1662.70 3794.33
2001-02 2095.50 28.31 1791.99 4228.24
2002-03 2407.94 32.19 1987.57 4735.58
2003-04 2715.81 50.97 2586.26 5786.94
2004-05 3149.71 64.54 2869.98 6497.66
2005-06 3563.14 68.43 4074.23 8263.89
2006-07 4121.24 74.67 4776.04 9679.25
2007-08 5684.10 90.27 5783.72 11558.10
2008-09 6654.50 55.33 5886.88 12596.71
2009-10 7674.92 38.06 7179.70 14892.68
Money Supply and Agriculture (A Special Study of Indian Agriculture)
DOI: 10.9790/0837-201045271 www.iosrjournals.org 54 | Page
Year Currency with the public Other Deposit with the RBI
Demand Deposits Narrow Money (M1)
1 2 3 4 5 = (2 + 3 + 4)
2010-11 9118.36 36.53 7228.56 16383.45
2011-12 10236.70 28.22 7109.02 17373.94
2012-13 11410.61 32.40 7532.25 18975.26
2013-14 12483.44 19.65 8043.86 20546.95
Source : Handbook of Statistics on Indian Economy
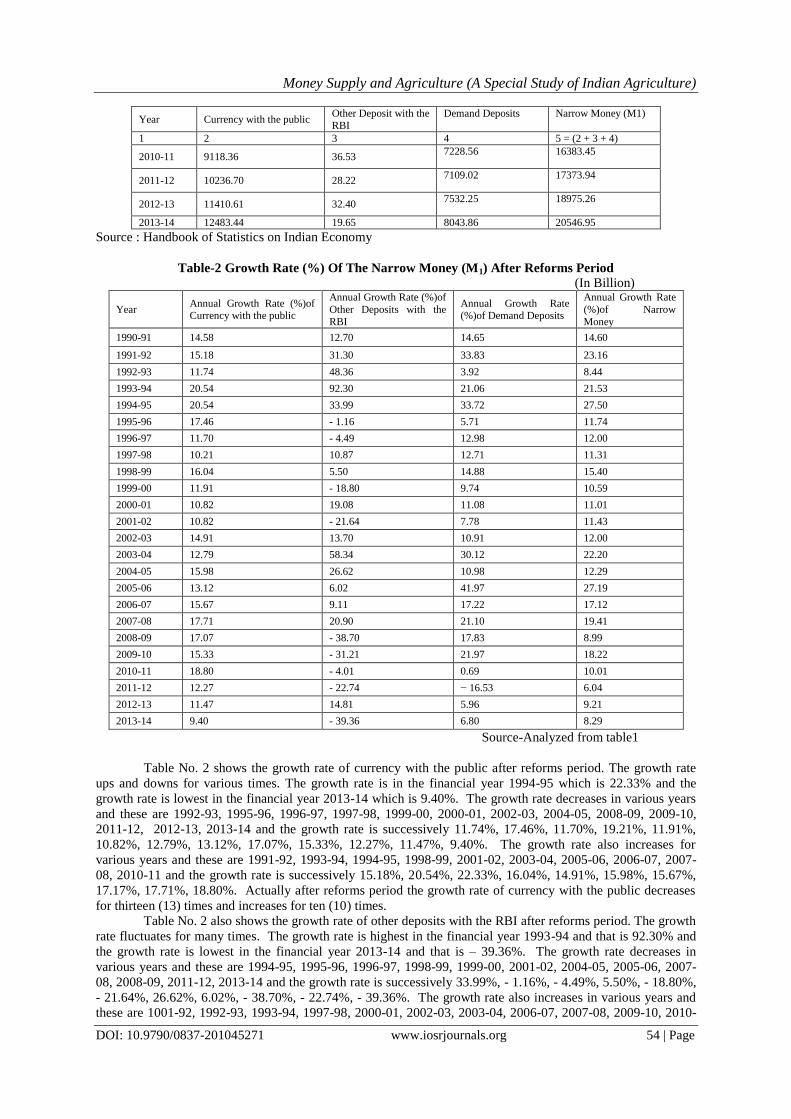
Table-2 Growth Rate (%) Of The Narrow Money (M1) After Reforms Period
(In Billion)
Year Annual Growth Rate (%)of Currency with the public
Annual Growth Rate (%)of
Other Deposits with the
RBI
Annual Growth Rate (%)of Demand Deposits
Annual Growth Rate
(%)of Narrow
Money
1990-91 14.58 12.70 14.65 14.60
1991-92 15.18 31.30 33.83 23.16
1992-93 11.74 48.36 3.92 8.44
1993-94 20.54 92.30 21.06 21.53
1994-95 20.54 33.99 33.72 27.50
1995-96 17.46 - 1.16 5.71 11.74
1996-97 11.70 - 4.49 12.98 12.00
1997-98 10.21 10.87 12.71 11.31
1998-99 16.04 5.50 14.88 15.40
1999-00 11.91 - 18.80 9.74 10.59
2000-01 10.82 19.08 11.08 11.01
2001-02 10.82 - 21.64 7.78 11.43
2002-03 14.91 13.70 10.91 12.00
2003-04 12.79 58.34 30.12 22.20
2004-05 15.98 26.62 10.98 12.29
2005-06 13.12 6.02 41.97 27.19
2006-07 15.67 9.11 17.22 17.12
2007-08 17.71 20.90 21.10 19.41
2008-09 17.07 - 38.70 17.83 8.99
2009-10 15.33 - 31.21 21.97 18.22
2010-11 18.80 - 4.01 0.69 10.01
2011-12 12.27 - 22.74 − 16.53 6.04
2012-13 11.47 14.81 5.96 9.21
2013-14 9.40 - 39.36 6.80 8.29
Source-Analyzed from table1
Table No. 2 shows the growth rate of currency with the public after reforms period. The growth rate
ups and downs for various times. The growth rate is in the financial year 1994-95 which is 22.33% and the
growth rate is lowest in the financial year 2013-14 which is 9.40%. The growth rate decreases in various years
and these are 1992-93, 1995-96, 1996-97, 1997-98, 1999-00, 2000-01, 2002-03, 2004-05, 2008-09, 2009-10,
2011-12, 2012-13, 2013-14 and the growth rate is successively 11.74%, 17.46%, 11.70%, 19.21%, 11.91%,
10.82%, 12.79%, 13.12%, 17.07%, 15.33%, 12.27%, 11.47%, 9.40%. The growth rate also increases for
various years and these are 1991-92, 1993-94, 1994-95, 1998-99, 2001-02, 2003-04, 2005-06, 2006-07, 2007-
08, 2010-11 and the growth rate is successively 15.18%, 20.54%, 22.33%, 16.04%, 14.91%, 15.98%, 15.67%,
17.17%, 17.71%, 18.80%. Actually after reforms period the growth rate of currency with the public decreases
for thirteen (13) times and increases for ten (10) times.
Table No. 2 also shows the growth rate of other deposits with the RBI after reforms period. The growth
rate fluctuates for many times. The growth rate is highest in the financial year 1993-94 and that is 92.30% and
the growth rate is lowest in the financial year 2013-14 and that is – 39.36%. The growth rate decreases in
various years and these are 1994-95, 1995-96, 1996-97, 1998-99, 1999-00, 2001-02, 2004-05, 2005-06, 2007-
08, 2008-09, 2011-12, 2013-14 and the growth rate is successively 33.99%, - 1.16%, - 4.49%, 5.50%, - 18.80%,
- 21.64%, 26.62%, 6.02%, - 38.70%, - 22.74%, - 39.36%. The growth rate also increases in various years and
these are 1001-92, 1992-93, 1993-94, 1997-98, 2000-01, 2002-03, 2003-04, 2006-07, 2007-08, 2009-10, 2010-

Money Supply and Agriculture (A Special Study of Indian Agriculture)
DOI: 10.9790/0837-201045271 www.iosrjournals.org 55 | Page
11, 2012-13 and the growth rate is successively 31.30%, 48.26%, 92.30%, 10.87%, 19.08%, 13.70%, 58.34%,
9.11%, 20.90%, - 31.21%, -4.01%, 14.81%. Actually after reforms period the growth rate of other deposits with
the RBI increases for twelve (12) times and decreases for eleven (11) times.
Table no. 2 shows also the growth rate of demand deposits after reforms period. The growth rate ups
and downs for many times. The growth rate is highest in the financial year 2005-06 and that is 41.97% and the
growth rate is lowest in the financial year 2011-12 and that is – 16.52%. The growth rate decreases for various
times and these are 1992-93, 1995-96, 1997098, 1999-00, 2001-12, 2004-05, 2006-07, 2008-09, 2010-11, 2011-
12 and the growth rate is successively --- 3.92%, 5.71%, 12.71%, 9.74%, 7.78%, 10.98%, 17.22%, 17.83%,
0.69%, - 16.53%. The growth rate also increases for various years and these are 1991-92, 1993-94, 1994-95,
1996-97, 1998-99, 2000-01, 2002-03, 2003-04, 2005-06, 2007-08, 2009-10, 2012-13, 2013-14 and the growth
rate is successively --- 33.83%, 21.06%, 33.72%, 12.98%, 14.88%, 5.96%, 10.91%, 30.12%, 41.97%, 21.10%,
21.97%, 5.96%, 6.80%. Actually the growth rate of Demand Deposits after reforms period increases for thirteen
(13) times and decreases for ten (10) times.
Table No. 2 also shows the growth rate of Narrow money (M1) after reforms period. The growth rate
fluctuates for many times. The growth rate is highest in the financial year 1994-95 and that is 27.59% and the
growth rate is lowest in the financial year 2001-12 and that is 6.04%. The growth rate decreases for various
times and these are 1992-93, 1995-96, 1997-98, 1999-00, 2004-05, 2006-07, 2008-09, 2010-11, 2011-12, 2011-
12, 2013-14 and the growth rate is successively 8.44%, 11.74%, 11.31%, 10.59% 12.29%, 17.12%, 8.99%. The
growth rate also increases for various times and these are 1991-92, 1993-94, 1994-95, 1996-97, 1998-99, 2000-
01, 2001-02, 2002-03, 2003-04, 2005-06, 2007-08, 2009-10, 2012-13 and the growth rate is successively
23.16%, 21.53%, 27.50%, 12.00%, 15.40%, 15.40%, 11.01%, 11.43%, 12.00%, 22.20%, 27.19%, 19.41%,
18.22%, 9.21%. Actually the growth rate of narrow money (M1) after reforms period increases for thirteen (13)
times and decreases for ten times.
Table-3trend And Patterns Of The Broad Money (M3) After Reforms Period
(Billion) Year Time Deposits Narrow Money (M1) Broad Money (M3)
1 2 3 4
1990-91 1729.36 928.92 2658.28
1991-92 2026.43 1144.06 31.70.49
1992-93 2399.50 1240.66 3640.16
1993-94 2803.06 1507.78 4310.84
1994-95 3353.38 1922.57 5275.96
1995-96 3843.56 2148.35 5991.91
1996-97 4553.97 2406.15 6969.12
1997-98 5534.88 2678.44 8213.32
1998-99 6718.92 3090.68 9809.60
1999-00 7823.78 3417.96 11241.74
2000-01 9337.71 3794.33 13132.04
2001-02 10755.12 4228.24 14983.36
2002-03 12443.79 4735.58 17179.36
2003-04 14269.60 5786.94 20056.54
2004-05 15958.87 6497.66 22456.53
2005-06 18931.04 8263.89 27194.93
2006-07 23421.13 9679.25 33100.38
2007-08 28620.46 11558.10 40178.55
2008-09 35351.05 12596.71 47947.75
2009-10 41134.30 14892.68 56026.98
2010-11 48657.71 16383.45 65041.16
2011-12 56474.37 17373.94 73848.31
2012-13 64922.93 18975.26 83898.19
2013-14 74426.30 20546.95 94973.26
Source : Handbook of Statics on Indian Economy

Money Supply and Agriculture (A Special Study of Indian Agriculture)
DOI: 10.9790/0837-201045271 www.iosrjournals.org 56 | Page
Table-4 Growth Rate Of The Broad Money (M3) After Reforms Period
(Billion)
Year Annual Growth Rate
(%)of Time Deposits
Annual Growth Rate
(%)of Narrow Money
Annual Growth Rate
(%)of Broad Money
1990-91 15.38 14.60 15.10
1991-92 17.18 23.16 19.27
1992-93 18.41 8.44 14.81
1993-94 16.81 21.53 18.42
1994-95 19.63 27.50 22.39
1995-96 14.61 11.74 13.58
1996-97 18.49 12.00 16.16
1997-98 21.53 11.31 18.00
1998-99 21.39 15.40 19.43
1999-00 16.44 10.59 14.60
2000-01 19.36 11.01 16.81
2001-02 15.18 11.43 14.10
2002-03 15.70 12.00 14.66
2003-04 14.68 22.20 16.74
2004-05 11.83 12.29 11.97
2005-06 18.62 27.19 21.10
2006-07 23.71 17.12 21.71
2007-08 22.20 19.41 21.39
2008-09 23.51 8.99 19.33
2009-10 16.36 18.22 16.86
2010-11 18.29 10.01 16.09
2011-12 16.06 6.04 13.54
2012-13 14.96 9.21 13.60
2013-14 14.63 8.29 13.20
Source-Analyzed from table no 3
Table No. 4 shows the growth rate of Time Deposits after reforms Period. The growth rate fluctuates
various times. The growth rate is highest in the financial year 2006-07 and that is 23.71% and the growth rate is
lowest in the financial year 2004-05 and that is 11.83%. The growth rate decreases for various times and these
are 1993-94, 1995-96, 1998-99, 1999-00, 2001-02, 2003-04, 2004-05, 2007-08, 2009-10, 2011-12, 2012-13,
2013-14 and the growth rate is successively 16.81%, 14.61%, 21.39%, 16.44%, 15.18%, 14.68%, 11.83%,
22.20%, 16.36%, 16.06%, 14.96%, 14.63%. The growth rate also increases for various times and these are
1991-92, 1992-93, 1994-95, 1996-97, 1997-98, 2000-01, 2002-03, 2005-06, 2006-07, 2008-09, 2010-11 the
growth rate is successively 17.18%, 18.41%, 19.63%, 18.49%, 21.53%, 19.36%, 15.70%, 18.62%, 23.71%,
23.51%, 18.29%. Actually, according to table No. 17 the growth rate of time deposits after reforms period
increases for eleven times and decreases for twelve times.
Table No.4 also shows the growth rate of Broad Money (M3) after the reforms period. The growth
Rate of Broad Money fluctuates various times. The growth rate is highest in the financial year 1994-95 and that
is 22.39% and the growth rate is lowest in the financial year 2004-05 and that is 11.97%. The growth rate
decreases for various times and these are 1992-93, 1995-96, 1999-00, 2001-02, 2004-05, 2007-08, 2008-09,
2009-10, 2010-11, 2011-12, 2013-14 and the growth rate is successively 14.81%, 13.58%, 14.60%, 14.10%,
11.97%, 21.39%, 19.33%, 16.86%, 16.09%, 13.54%, 13.20%. The growth rate also increases for various times
and these are 1991-92, 1993-94, 1994-95, 1996-97, 1997-98, 1998-99, 2000-01, 2002-03, 2003-04, 2005-06,
2006-07, 2012-13 and the growth rate is successively 19.27%, 18.42%, 22.39%, 16.16%, 18.00%, 19.43%,
16.81%, 14.66%, 16.74%, 21.10%, 21.71%, 13.60%. Actually according to table No. 18 the growth rate of
Broad Money (M3) after reforms period increases for twelve (12) times and decreases for eleven (11) times.
III. Importance Of Agriculture In Indian Economy- Actually Indian Economy is one of the world’s oldest agrarian economics even when our ancestors
were growing rice and barley at a time then the Europeans were hunting boars and huddling around peat fires.
Basically, Agriculture is the primary sector and has a crucial role to play in the country’s economic
development. Agriculture provides food (more than fifty percent of income is spent on food by eighty percent

Money Supply and Agriculture (A Special Study of Indian Agriculture)
DOI: 10.9790/0837-201045271 www.iosrjournals.org 57 | Page
of population in urban areas and ninety-five percent in rural areas) and raw materials, employment, national
income, capital for its own development.
3.1-Role For National Income
Agricultural Sector contributes a significant share to the national income in India. The role of
agriculture for GDP (at factor cost) is shown through the table No. 23. The table shows the GDP from 1990-91
to 2013-14 because the study includes only post-reforms Period --- We can easily understand the share of
agriculture through this…
Table-5 Components Of Gross Domestic Product (At Factor Cost) ( ` Billion)
Year
Agriculture & Allied Activities
Agriculture
At Constant
Prices
At Current
Prices
At Constant
Prices
At Current
Prices
1 2 3 4 5
Base Year : 2004-05
1990-91 3979.71 1543.50 3361.76 1311.08
1991-92 3902.01 1803.13 3284.07 1543.77
1992-93 4161.53 2022.19 3515.84 1728.14
1993-94 4299.81 2345.66 3627.64 2001.14
1994-95 4502.58 2701.07 3799.59 2300.30
1995-96 4471.27 2937.01 3762.43 2504.26
1996-97 4914.84 3531.42 4153.77 3026.74
1997-98 4789.33 3747.44 4030.30 3181.71
1998-99 5092.03 4303.84 4317.19 3677.99
1999-00 5227.95 4553.02 4421.13 3894.14
2000-01 5227.55 4606.08 4394.32 3887.22
2001-02 5541.57 4986.20 4678.15 4205.96
2002-03 5175.59 4850.80 4297.52 4044.91
2003-04 5643.91 5446.67 4763.24 4591.58
2004-05 5654.26 5654.26 4766.34 4766.34
2005-06 5944.87 6377.72 5029.96 5368.22
2006-07 6191.90 7229.84 5237.45 6046.72
2007-08 6550.80 8365.18 5569.56 7162.76
2008-09 6556.88 9432.05 5554.42 8066.46
2009-10 6609.87 10835.14 5577.15 9285.86
2010-11 7178.14 13196.86 6109.05 11435.17
2011-12 7538.31 14990.98 6435.43 13005.69
2012-13 7645.09 16449.26 6494.24 14174.68
2013-14 8005.48 19063.48 . .
Notes : 1. Data for 2013-14 are Provisional. Source : Central Statistics Office (CSO).
2. Data for 2012-13 are First Revised Estimates
.3.Datafor2011-12areSecondRevisedEstimates.

Money Supply and Agriculture (A Special Study of Indian Agriculture)
DOI: 10.9790/0837-201045271 www.iosrjournals.org 58 | Page
Bar Diagram – 1
Gdp Of Agriculture & Allied Activities
At Constant Prices
Bar Diagram – 2
Gdp Of Agriculture & Allied Activities
At Current Prices
Money Supply and Agriculture (A Special Study of Indian Agriculture)
DOI: 10.9790/0837-201045271 www.iosrjournals.org 59 | Page
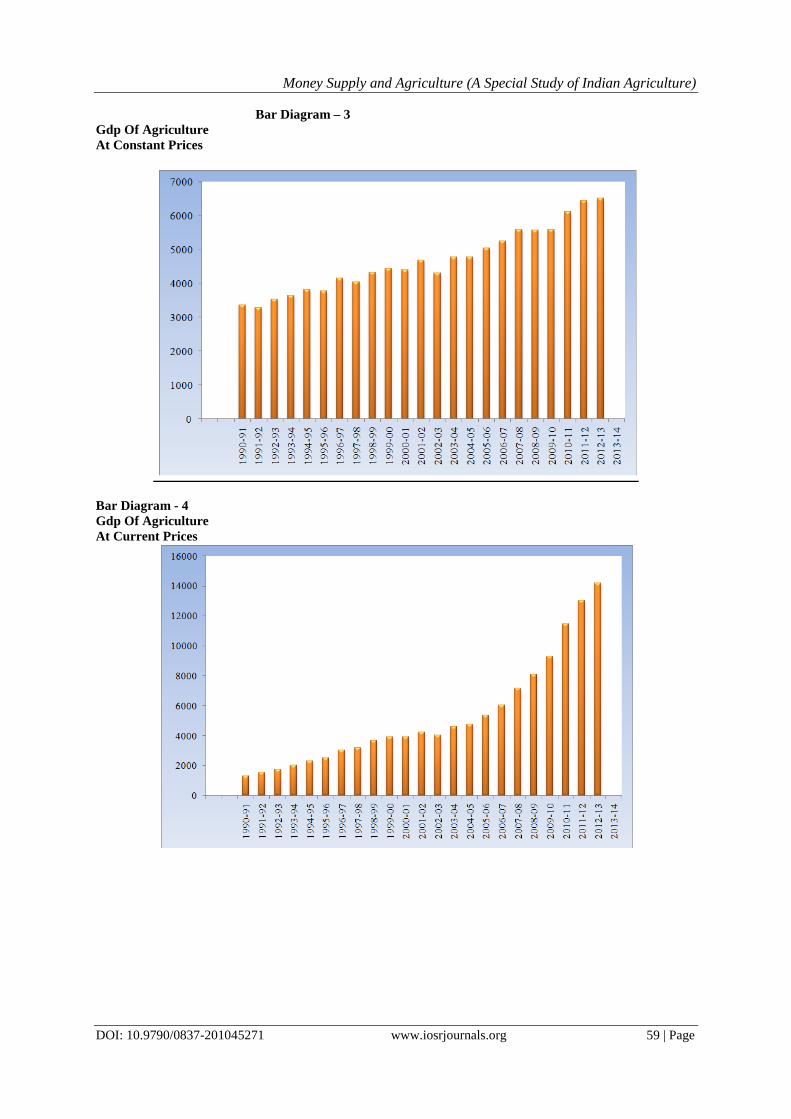
Bar Diagram – 3
Gdp Of Agriculture
At Constant Prices
Bar Diagram - 4
Gdp Of Agriculture
At Current Prices

Money Supply and Agriculture (A Special Study of Indian Agriculture)
DOI: 10.9790/0837-201045271 www.iosrjournals.org 60 | Page
3.2-Role For Employment – As we know that India is one of the oldest agrarian economics, maximum rural
population depends on it for livelihood. Above 50 percent of Indian population are employed in this sector as a
cultivators or as an agricultural workers. The scenario of agricultural employment is shown through the tables –
TABLE-6- Population and Agricultural Workers
Year
Total
Populatio
n
Average Annual
Exponentia
l Growth Rate (%)
Rural Population
% of Total Population
Agricultural Workers
Cultivator
s
% of total
Agricultural workers
Agricultur
al laborers
% of
total Agricul
tural
workers
Total Agricultu
ral
workers
1 2 3 4 5 6 7 8 9 10
1951 361.1 1.25 298.6 82.7 69.9 71.9 27.3 28.1 97.2
1961 439.2 1.96 360.3 82.0 99.6 76.0 31.5 24.0 131.1
1971 548.2 2.20 439.0 80.1 78.2 62.2 47.5 37.8 125.7
1981 683.3 2.22 525.6 76.9 92.5 62.5 55.5 37.5 148.0
1991 846.4 2.16 630.6 74.5 110.7 59.7 74.6 40.3 185.3
2001 1028.7 1.97 742.6 72.2 127.3 54.4 106.8 45.6 234.1
2011 1210.8 1.50 833.7 68.9 118.7 45.1 144.3 54.9 263.0
Source: The Ministry of Agriculture
3.3-ROLE FOR FOREIGN TRADE- Indian agriculture has a role in the country’s foreign trade. The main
products which are exported are tea, fruits, vegetables, spices, tobacco, cotton, coffee, sugar and sugar products,
hides and skins, raw wool and other varieties of animals hair, vegetable oils, cotton and jute textiles etc. The
major imported products are rubber, wool, agricultural machinery and technology etc. The role of agriculture in
foreign trade is shown through the following table ---
Table-7 India’s Imports And Exports Of Agricultural Commodities
Year Agriculture
Imports
Total National
Imports
% of
Agriculture Imports of
Total
National Imports
Agriculture
Exports
Total National
Exports
% of
Agriculture
Exports of Total National
Exports
1 2 3 4 5 6 7
1990-91 1205.86 43170.82 2.79 6012.76 32527.28 18.49
1991-92 1478.27 47850.84 3.09 7838.04 44041.81 17.80
1992-93 2876.25 63374.52 4.54 9040.30 53688.26 16.84
1993-94 2327.33 73101.01 3.18 12586.55 69748.85 18.05
1994-95 5937.21 89970.70 6.60 13222.76 82673.40 15.99
1995-96 5890.10 122678.14 4.80 20397.74 106353.35 19.18
1996-97 6612.60 138919.88 4.76 24161.29 118817.32 20.33
1997-98 8784.19 154176.29 5.70 24832.45 130100.64 19.09
1998-99 14566.48 178331.69 8.17 25510.64 139751.77 18.25
1999-00 16066.73 215528.53 7.45 25313.66 159095.20 15.91
2000-01 12086.23 228306.64 5.29 28657.37 201356.45 14.23
2001-02 16256.61 245199.72 6.63 29728.61 209017.97 14.22
2002-03 17608.83 297205.87 5.92 34653.94 255137.28 13.58
2003-04 21972.68 359107.66 6.12 36415.48 293366.75 12.41
2004-05 22811.84 501064.54 4.55 41602.65 375339.53 11.08
2005-06 21499.22 660408.90 3.26 49216.96 456417.86 10.78
2006-07 29637.85 840506.31 3.53 62411.42 571779.28 10.92
2007-08 29906.23 1012311.70 2.95 79039.52 655863.52 12.05
2008-09 37183.04 1374435.55 2.71 85551.67 840755.06 10.18
2009-10 59528.37 1363735.55 4.37 89341.50 845533.64 10.57
2010-11 57334.32 1683466.96 3.41 117483.61 1142921.92 10.28
2011-12 82819.15 2345463.24 3.53 187609.33 1465959.39 12.80
2012-13 109610.68 2669161.96 4.11 232041.11 1634318.84 14.20
2013-14 105149.00 2714181.50 3.87 268469.05 1894181.95 14.17
Source : The Ministry of Agriculture

Money Supply and Agriculture (A Special Study of Indian Agriculture)
DOI: 10.9790/0837-201045271 www.iosrjournals.org 61 | Page
Bar Diagram – 5
Total Agricultural Imports
Bar Diagram – 6
Total Agricultural Exports

Money Supply and Agriculture (A Special Study of Indian Agriculture)
DOI: 10.9790/0837-201045271 www.iosrjournals.org 62 | Page
3.4-ROLE FOR CAPITAL FORMATION - Actually, agriculture which plays an important role in National
Income, Employment and Foreign Trade is also a source of capital formation for the Indian Economy. The
development of an economy depends on the rate of capital formation. After independence both public and
private investment has been made in Agriculture. In areas where Agricultural practices are traditional,
investment has also been traditional like land developments, carts, livestock, etc. and in progressive areas
modern technology has been adopted. The scenario of capital formation is shown through Table 8 ---
TABLE-8 GROSS CAPITAL FORMATION IN AGRICULTURE AND ALLIED SECTOR (AT
CURRENT PRICES) (Rs. Crore)
Year GCF in Agriculture & Allied Sector GCF of Economy
(by industry of use)
Share of Agriculture & Allied
Sector in Total GCF (%)
Public Sector
Private Sector
Total Public Sector
Private Sector
Total Public Sector
Private Sector
Total
1 2 3 4 5 6 7 8 9 10
2004-05 16187 59909 76096 240580 770598 1011178 6.7 7.8 7.5
2005-06 20739 69204 89943 293350 931331 1224681 7.1 7.4 7.3
2006-07 25606 75496 101102 356556 1134319 1490875 7.2 6.7 6.8
2007-08 27638 95679 123317 441923 1401285 1843208 6.3 6.8 6.7
2008-09 26692 133655 160347 531730 1396160 1927890 5.0 9.6 8.3
2009-10 33201 151325 184526 592788 1642155 2234943 5.6 9.2 8.3
2010-11 31968 165396 197364 656448 2024131 2680579 4.9 8.2 7.4
2011-12 36887 214818 251705 695835 2335823 3031658 5.3 9.2 8.3
2012-13 45511 232328 277839 821966 2420761 3242727 5.5 9.6 8.6
Source: Central Statistics Office, New Delhi
4-The Production Scenario Of Indian Agriculture-
As we know the science, art or occupation which is related with cultivating land, raising crops, and
feeding, breeding and raising livestock; farming is called Agriculture. According to Wendell Berry “Eating is an
agricultural act.”
Actually the written history of Agriculture in India dates back to the Rig-Veda, written about 1100BC
and today, India ranks 2nd
worldwide in farm output.
According to 2010 FAO world agriculture statistics, India is the world’s largest producer of many fresh
fruits’ and vegetables, milk, major spices, select fibrous crops such as jute, several, staples such as millets and
castor oil seed. In fact, India is the second largest producer of wheat and rice.
The various agricultural crops is divided into two major groups food grains and non-food grains.
Food grains include all the food items cereals and pulses like rice, pulses, wheat, barley, maize, bajra etc. On
the other hand, non-food grains include cash crops like jute, cotton, oil seeds, sugarcane etc.
But season wise the crops are divided between Kharif crops and Rabi crops. Actually the Kharif crops
are usually which are known as monsoon crops are cultivated and harvested in the rainy season in India.
Actually, in India, the Kharif season varies by state and crop, starting at the earliest in May and ending at the
latest in January but is popularly considered to start in June and to end in October. Kharif crops are depend
upon the rainy season. Most common Kharif crops are Rice, Millets, Maize, Moog Bean. Urad Bean, Cotton,
Soya-bean etc.
On the other hand, Rabi crops refer to agricultural crops sown in winter and harvested in the Spring.
These crops are sown around mid-November, after the monsoon rains, are over and harvesting begins in
April/May. Rabi crops’ main source of water is rainwater that has percolated into the ground. These crops need
irrigation facility. In fact, a good rain in winter spoils these crops. In fact, many crops are cultivated in both
Kharif and Rabi seasons. The example of Rabi crops are wheat, gram, pea, Mustard, linseed, barley etc. The
production scenario of Indian Agriculture is shown through table No. 9---
Money Supply and Agriculture (A Special Study of Indian Agriculture)
DOI: 10.9790/0837-201045271 www.iosrjournals.org 63 | Page
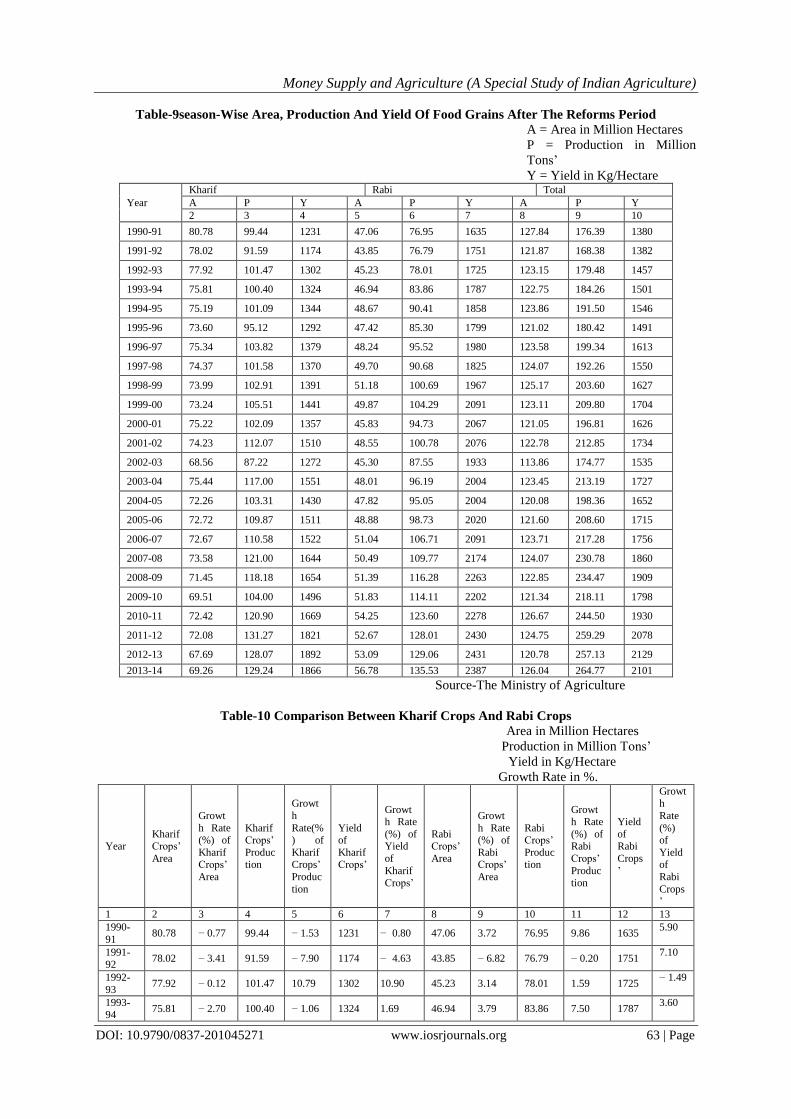
Table-9season-Wise Area, Production And Yield Of Food Grains After The Reforms Period
A = Area in Million Hectares
P = Production in Million
Tons’
Y = Yield in Kg/Hectare
Year
Kharif Rabi Total
A P Y A P Y A P Y
2 3 4 5 6 7 8 9 10
1990-91 80.78 99.44 1231 47.06 76.95 1635 127.84 176.39 1380
1991-92 78.02 91.59 1174 43.85 76.79 1751 121.87 168.38 1382
1992-93 77.92 101.47 1302 45.23 78.01 1725 123.15 179.48 1457
1993-94 75.81 100.40 1324 46.94 83.86 1787 122.75 184.26 1501
1994-95 75.19 101.09 1344 48.67 90.41 1858 123.86 191.50 1546
1995-96 73.60 95.12 1292 47.42 85.30 1799 121.02 180.42 1491
1996-97 75.34 103.82 1379 48.24 95.52 1980 123.58 199.34 1613
1997-98 74.37 101.58 1370 49.70 90.68 1825 124.07 192.26 1550
1998-99 73.99 102.91 1391 51.18 100.69 1967 125.17 203.60 1627
1999-00 73.24 105.51 1441 49.87 104.29 2091 123.11 209.80 1704
2000-01 75.22 102.09 1357 45.83 94.73 2067 121.05 196.81 1626
2001-02 74.23 112.07 1510 48.55 100.78 2076 122.78 212.85 1734
2002-03 68.56 87.22 1272 45.30 87.55 1933 113.86 174.77 1535
2003-04 75.44 117.00 1551 48.01 96.19 2004 123.45 213.19 1727
2004-05 72.26 103.31 1430 47.82 95.05 2004 120.08 198.36 1652
2005-06 72.72 109.87 1511 48.88 98.73 2020 121.60 208.60 1715
2006-07 72.67 110.58 1522 51.04 106.71 2091 123.71 217.28 1756
2007-08 73.58 121.00 1644 50.49 109.77 2174 124.07 230.78 1860
2008-09 71.45 118.18 1654 51.39 116.28 2263 122.85 234.47 1909
2009-10 69.51 104.00 1496 51.83 114.11 2202 121.34 218.11 1798
2010-11 72.42 120.90 1669 54.25 123.60 2278 126.67 244.50 1930
2011-12 72.08 131.27 1821 52.67 128.01 2430 124.75 259.29 2078
2012-13 67.69 128.07 1892 53.09 129.06 2431 120.78 257.13 2129
2013-14 69.26 129.24 1866 56.78 135.53 2387 126.04 264.77 2101
Source-The Ministry of Agriculture
Table-10 Comparison Between Kharif Crops And Rabi Crops
Area in Million Hectares
Production in Million Tons’
Yield in Kg/Hectare
Growth Rate in %.
Year Kharif Crops’
Area
Growt
h Rate (%) of
Kharif Crops’
Area
Kharif Crops’
Production
Growt
h
Rate(%) of
Kharif Crops’
Produc
tion
Yield of
Kharif Crops’
Growth Rate
(%) of Yield
of
Kharif Crops’
Rabi Crops’
Area
Growt
h Rate (%) of
Rabi Crops’
Area
Rabi Crops’
Production
Growth Rate
(%) of Rabi
Crops’
Production
Yield
of Rabi
Crops
’
Growth
Rate
(%) of
Yield of
Rabi
Crops’
1 2 3 4 5 6 7 8 9 10 11 12 13
1990-
91 80.78 − 0.77 99.44 − 1.53 1231 − 0.80 47.06 3.72 76.95 9.86 1635
5.90
1991-92
78.02 − 3.41 91.59 − 7.90 1174 − 4.63 43.85 − 6.82 76.79 − 0.20 1751 7.10
1992-
93 77.92 − 0.12 101.47 10.79 1302 10.90 45.23 3.14 78.01 1.59 1725
− 1.49
1993-94
75.81 − 2.70 100.40 − 1.06 1324 1.69 46.94 3.79 83.86 7.50 1787 3.60

Money Supply and Agriculture (A Special Study of Indian Agriculture)
DOI: 10.9790/0837-201045271 www.iosrjournals.org 64 | Page
1994-95
75.19 − 0.81 101.09 0.69 1344 1.51 48.67 3.69 90.41 7.81 1858 3.98
1995-
96 73.60 − 2.11 95.12 − 5.90 1292 − 3.87 47.42 − 2.57 85.30 − 5.66 1799
− 3.18
1996-97
75.34 2.37 103.82 9.14 1379 6.73 48.24 1.72 95.52 11.99 1980 10.07
1997-
98 74.37 − 1.29 101.58 − 2.16 1370 − 0.66 49.70 3.02 90.68 − 5.07 1825
− 7.82
1998-99
73.99 − 0.51 102.91 1.30 1391 1.53 51.18 2.97 100.69 11.03 1967 7.79
1999-
00 73.24 − 1.01 105.51 2.52 1441 3.60 49.87 − 2.56 104.29 3.58 2091
6.30
2000-
01 75.22 2.70 102.09 − 3.24 1357 − 5.82 45.83 − 8.10 94.73 − 9.17 2067
−1.14
2001-
02 74.23 − 1.31 112.07 9.78 1510 11.28 48.55 5.93 100.78 6.39 2076
0.43
2002-
03 68.56 − 7.63 87.22
−
22.18 1272 − 15.77 45.30 − 6.70 87.55
−
13.12 1933
−6.89
2003-
04 75.44 10.03 117.00 34.14 1551 21.93 48.01 5.99 96.19 9.87 2004
3.68
2004-
05 72.26 − 4.21 103.31
−
11.70 1430 − 7.80 47.82 − 0.40 95.05 − 1.19 2004
0
2005-
06 72.72 0.63 109.87 6.34 1511 5.67 48.88 2.21 98.73 3.88 2020
0.80
2006-
07 72.67 − 0.06 110.58 0.64 1522 0.72 51.04 4.41 106.71 8.09 2091
3.51
2007-
08 73.58 1.25 121.00 9.42 1644 8.01 50.49 − 1.08 109.77 2.87 2174
3.97
2008-
09 71.45 − 2.90 118.18 − 2.33 1654 0.60 51.39 1.79 116.28 5.93 2263
4.10
2009-
10 69.51 − 2.71 104.00
−
12.00 1496 − 9.56 51.83 0.86 114.11 − 1.87 2202
−2.70
2010-
11 72.42 4.18 120.90 16.26 1669 11.57 54.25 4.67 123.60 8.31 2278
3.46
2011-
12 72.08 − 0.47 131.27 8.58 1821 9.10 52.67 − 2.91 128.01 3.57 2430
6.68
2012-
13 67.69 − 6.10 128.07 − 2.43 1892 3.90 53.09 0.80 129.06 0.82 2431
0.04
2013-14
69.26 2.31 129.24 0.91 1866 − 1.38 56.78 6.96 135.53 5.01 2387 −1.80
Source: Analyzed from Table No. 9
Bar Diagram – 7
Comparison Between Kharif Crops’ Area And Rabi Crops’ Area
Money Supply and Agriculture (A Special Study of Indian Agriculture)
DOI: 10.9790/0837-201045271 www.iosrjournals.org 65 | Page
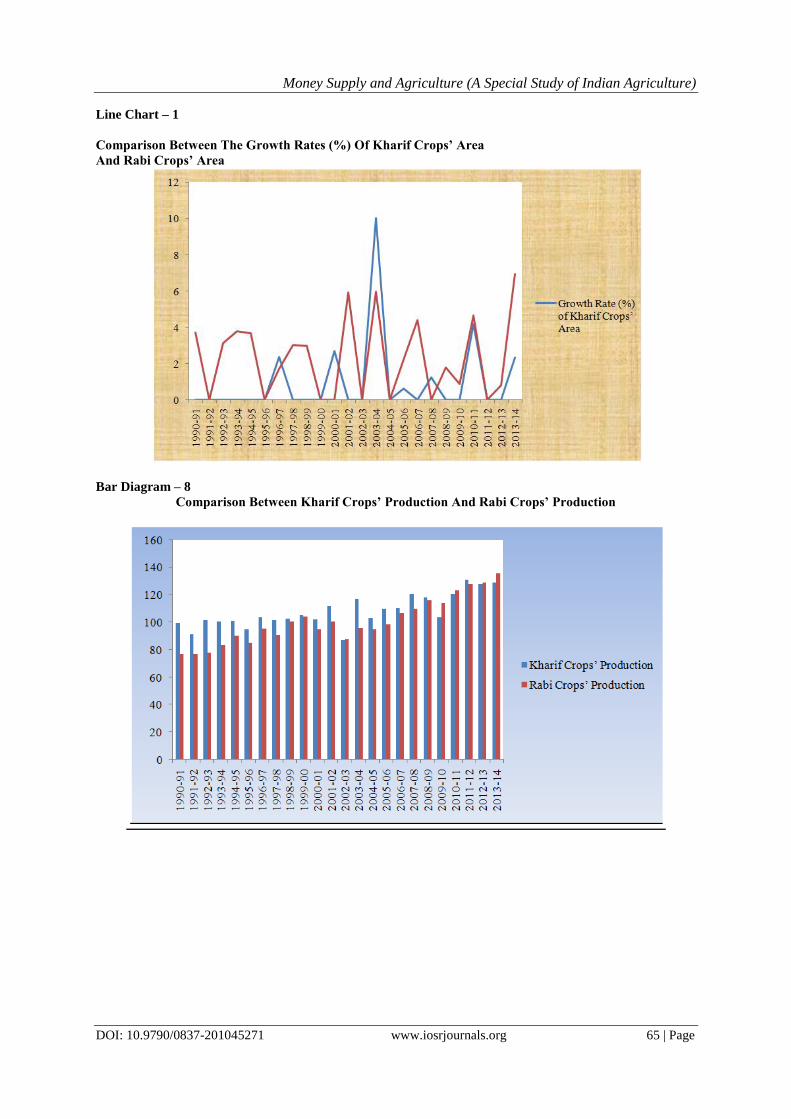
Line Chart – 1
Comparison Between The Growth Rates (%) Of Kharif Crops’ Area
And Rabi Crops’ Area
Bar Diagram – 8
Comparison Between Kharif Crops’ Production And Rabi Crops’ Production

Money Supply and Agriculture (A Special Study of Indian Agriculture)
DOI: 10.9790/0837-201045271 www.iosrjournals.org 66 | Page
Line Chart – 2
Comparison Between The Growth Rates (%) Of Kharif Crops’ Production And Rabi Crops’ Production
Bar Diagram – 9
Comparison Between The Yield Of Kharif Crops’ And Rabi Crops’

Money Supply and Agriculture (A Special Study of Indian Agriculture)
DOI: 10.9790/0837-201045271 www.iosrjournals.org 67 | Page
Line Chart – 3
Comparison Between The Growth Rates (%) Of Kharif Crops’ Yield And
Rabi Crops’ Yield
Table-11 Growth Rate (%) Of Both Kharif And Rabi Crops’ After Reforms Period
Year Annual Growth Rate (%)of Total Area
Annual Growth Rate (%)of Total Production
Annual Growth Rate (%)of Total Yield
1990-91 0.84 3.12 22.97
1991-92 − 4.67 − 4.54 0.14
1992-93 1.06 6.60 5.42
1993-94 − 0.32 2.67 3.01
1994-95 0.90 3.92 3.00
1995-96 − 2.30 − 5.79 −3.56
1996-97 2.11 10.49 8.19
1997-98 0.40 − 3.56 −3.90
1998-99 0.89 5.90 4.97
1999-00 − 1.64 3.04 4.73
2000-01 − 1.68 − 6.20 −4.58
2001-02 1.42 8.14 6.64
2002-03 − 7.27 − 17.90 −11.48
2003-04 8.42 21.99 12.50
2004-05 − 2.72 − 6.96 −4.34
2005-06 1.27 5.17 3.81
2006-07 1.73 4.17 2.40
2007-08 0.30 6.21 5.92
2008-09 − 0.99 1.60 2.63
2009-10 − 1.22 − 6.98 −5.81
2010-11 4.40 12.10 7.34
2011-12 − 1.51 6.04 7.67
2012-13 − 3.19 − 0.83 2.46
2013-14 4.36 2.98
−1.31
Source: Analyzed from Table No. 9

Money Supply and Agriculture (A Special Study of Indian Agriculture)
DOI: 10.9790/0837-201045271 www.iosrjournals.org 68 | Page
IV. Analyze The Impact Of Money Supply On Agriculture- This is one of the important objectives of my study. Before estimating anything about this I try to find
out the relationship between these variables. Actually, I had a doubt is there any relationship exists between
this. So, I study “CORRELATION”, a statistical tool which measuring the closeness of the relationship
between the variables. I use “KARL PEARSON’S COEFFICIENT OF CORELATION for this study and find
out the results.
The formula which I use for calculating Pearsonian Coefficient of Correlation is,
I calculate the relationship between Narrow Money (M1) and Production growth and also for Broad
Money(M3) and production growth separately. The same is shown bellow:-
Table-12 Narrow Money Growth Rate&Total Production Growth Rate
Year
X Y
Narrow Money (M1) Growth Rate
(%)
Total Production Growth
Rate (%)
1990-91 14.60 3.12
1991-92 23.16 − 4.54
1992-93 8.44 6.60
1993-94 21.53 2.67
1994-95 27.50 3.92
1995-96 11.74 − 5.79
1996-97 12.00 10.49
1997-98 11.31 − 3.56
1998-99 15.40 5.90
1999-00 10.59 3.04
2000-01 11.01 − 6.20
2001-02 11.43 8.14
2002-03 12.00 − 17.90
2003-04 22.20 21.99
2004-05 12.29 − 6.96
2005-06 27.19 5.17
2006-07 17.12 4.17
2007-08 19.41 6.21
2008-09 8.99 1.60
2009-10 18.22 − 6.98
2010-11 10.01 12.10
2011-12 6.04 6.04
2012-13 9.21 − 0.83
2013-14 8.29 2.98
Source : Table No. 2 and Table No. 11
After calculating these two variables with the equation No. (5) I get the value of
y2 = 1470.28, x
2 = 804.27, xy = 193.66
193.66
𝟖𝟎𝟒.𝟐𝟕 𝐱 𝟏𝟒𝟕𝟎.𝟐𝟖
193.66
𝟏𝟏𝟖𝟐𝟓𝟎𝟐.𝟎𝟗𝟔
193.66
1087.429122
So, r =
=
r =
r =
=>
=
=>
=

Money Supply and Agriculture (A Special Study of Indian Agriculture)
DOI: 10.9790/0837-201045271 www.iosrjournals.org 69 | Page
r = + 0.17
Table No. – 13 Broad Money Growth Rate&Total Production Growth Rate
Year
X Y
Broad Money Growth Rate (%) Total Production Growth Rate (%)
1990-91 15.10 3.12
1991-92 19.27 − 4.54
1992-93 14.81 6.60
1993-94 18.42 2.67
1994-95 22.39 3.92
1995-96 13.58 − 5.79
1996-97 16.16 10.49
1997-98 18.00 − 3.56
1998-99 19.43 5.90
1999-00 14.60 3.04
2000-01 16.81 − 6.20
2001-02 14.10 8.14
2002-03 14.66 − 17.90
2003-04 16.74 21.99
2004-05 11.97 − 6.96
2005-06 21.10 5.17
2006-07 21.71 4.17
2007-08 21.39 6.21
2008-09 19.33 1.60
2009-10 16.86 − 6.98
2010-11 16.09 12.10
2011-12 13.54 6.04
2012-13 13.60 − 0.83
2013-14 13.20 2.98
Source: Table No. 4and Table No. 11
After calculating these two variables with the equation No. (5) I get the value of
x2 = 210.43, y
2 = 1470.28 and xy = 100.87
100.87
𝟐𝟏𝟎.𝟒𝟑 𝐱 𝟏𝟒𝟕𝟎.𝟐𝟖
100.87
𝟑𝟎𝟗𝟑𝟗𝟏.𝟎𝟐𝟎𝟒
100.87
556.2292876
r = + 0.18
In Both cases coefficient are positive and it shows low degree of positive correlation. So, we can say
Money Supply M1 and M3 has low degree of Positive correlation with production growth.
Now, I know both Money supply i.e. Narrow Money (M1) and Broad Money (M3) are correlated with
the Agricultural Production. So, I can measure the impact of Money Supply on Agriculture with the help of
Regression Analysis. Because, the statistical tool with the help of which we are in a position to estimate the
unknown values of one variable from known values of another variable is called Regression. The formula
which I use here that is calculated by Arithmetic Mean --- Regression equation of Y on X is thus ----
YC = a + bx (6)
The two normal equation which help to determine the values of a and be are –
y = Na + bx (7)
xy = ax + bx2 (8)
=>
=
r =
r =
=>
=
=>
=
=>
=
So, r =
=

Money Supply and Agriculture (A Special Study of Indian Agriculture)
DOI: 10.9790/0837-201045271 www.iosrjournals.org 70 | Page
Since ∑x and ∑y = 0
Because x = (X – X)
and y = (Y – Y)
In this case,
Na = 0 from equation No. (7)
a = 0
So, if I put a in No. (8)
xy = bx2
So, b = xy
x2
So, in case of table no. 42,
b = xy
x2
b = 193.66
804.27
b = 0.24
Put a = 0 and b = 0.24 in equation No. (ii),
I get,
YC = 0 + 0.24x
YC = 0.24x
In case of table No. 43,
b = xy
x2
b = 100.87
210.43
b = 0.48
Put a = 0 and b = 0.48 in equation No. (ii)
I get,
YC = 0 + 0.48x
YC = 0.48x
The impact of Narrow Money(M1) on production growth rate -
YC = 0.24x [x = Narrow Money (M1)
y = Production]
and the impact of Broad Money (M3) on Production Growth rate –
YC = 0.48x [x = Broad Money (M3)
y = Production]
V. Findings 1-Trend of Narrow Money fluctuates after reforms period.
2- Trend of Broad Money fluctuates after reforms period.
3-Money Supply has a positive correlation with Agriculture.
4-Momey Supply has a positive impact on Agriculture.
=>
=
=>
=
=>
=
=>
=
=>
=
=>
=
=>
=
=>
=

Money Supply and Agriculture (A Special Study of Indian Agriculture)
DOI: 10.9790/0837-201045271 www.iosrjournals.org 71 | Page
VI. Suggestions 1-If we increase Money Supply Agricultural production will also increase.
2- We must increase Agricultural employment.
3-We must increase production as it increases National Income.
4-Agriculture also increases capital formation and foreign trade.
References [1]. Handbook of Statistics on Indian Economy.(RESERVE BANK OF INDIA)
[2]. Economic Survey 2014, 2015.
[3]. The Ministry of Agriculture [4]. Datt , Sundaram, Indian Economy
[5]. www.google.com
[6]. S.P.Gupta..Fundamentals of Statistics