Embed Size (px)
Citation preview

【Panel VI : Paper 13】
Mongolian Youth Outlook
Country Profile
Organized by the Institute of Political Science, Academia Sinica (IPSAS) Co-sponsored by Asian Barometer Survey
September 20-21, 2012 Taipei IPSAS Conference Room A
(5th floor, North, Building for Humanities and Social Sciences)


Mongolian Youth Outlook
Country Profile
Damba Ganbat Academy of Political Education, Mongolia
This is only a rough draft. Please do not quote without author’s permission. Paper prepared for delivery at the conference “Democratic Citizenship and Voices of Asia’s Youth”, organized by the Institute of Political Science, Academia Sinica, and co-sponsored by Asian Barometer Survey, National Taiwan University, September 20-21, 2012, Taipei, Taiwan.


1
Mongolian Youth Outlook
Country Profile
Damba Ganbat
Mongolia’s transition from communism began in 1990 and the country has undergone unprecedented political, economic, and social change. In the course of the simultaneous economic and political transformations begun in Mongolia, both the economy and the political system have been liberalized to a great extent. Today, democracy and a market economy constitute dominant characteristics. Per capita income is low in Mongolia, and broad sectors of the population became impoverished during the economic transformation. Only a narrow middle class exists today. As early as 1990, the first multi-party elections were held in Mongolia, and the first steps taken toward a market economy. In 1992, Mongolia passed a new, democratic constitution establishing a parliamentary system. Mongolia has experienced a rapid political, economic, and social transformation during the last two decades of transition from a Soviet client state to a democratic, independent, market economy. Establishing the conditions for sustainable and inclusive economic growth is now a major priority for Mongolia. Mongolia has now become one of the fastest growing countries in the world and finds itself on the threshold of prosperity. Thanks to vast mineral resources including copper, gold, and coal, the economy grew 17.3% in 2011 and is expected to maintain a fast pace in the years ahead, although vulnerabilities remain. Despite breakaway growth, Mongolia faces severe development challenges includingpersistent unemployment and growing inequality, rapid urbanization, and isolation from international markets. In 2011, 29.8 %1of the population was poor, with female-headed households and recent urban migrants most affected. Mining will generate revenues but not many jobs, and could reduce competitiveness of other exports. In this context, poverty reduction and inclusive growth remain formidable challenges. Rapid growth is also transforming the labor market, but a fundamental skills mismatch prevents many from participating in it. Official unemployment is about 10%2,with young people making up the bulk of the unemployed. Twenty four percent of the labor force is unable to find an appropriate job. Providing Mongolia’s youth with relevant knowledge and skills is imperative, based on internationally accepted standards.
1Mongolian Statistical Yearbook 2011. National Statistical Office, p. 301. 2Ibid, p. 112.

2
Mongolia: Development Indicators3 Population in millions 2.80 Annual population growth rate (%) 1.5 Adult literacy rate (%) 97.5 Population in urban areas 57.5 Per capita GNI 1,870 GDP growth (% change per year) 17.3 Mongolia is an educated, ethnically homogeneous culture of 2,8 million people. Ethnic Mongols comprise 94 percent of the population, with the remainder being 5 percent Kazakh, and 1 percent Russian, Chinese or other. The life expectancy is 67 years while the literacy rate is about 98. The per capita GDP is $ 25624. The country still ranks 115th out of 185 nations on the Human Development Index, which measures longevity and health, education, and relative standard of living. Today, 57 percent of Mongolians live permanently in urban centers and 40.6 percent of the population lives in Ulaanbaatar.5This transition—from nomadic herder culture to an urbanized center—is perhaps one of the most profound transitions Mongolia faces today.
Unique in a region characterized by authoritarian regimes, Mongolia has a strong democratic foundation grounded in its 1992 constitution and the basic institutional infrastructure of democratic governance is largely in place. One of the country’s ongoing challenges, however, is strengthening the ability of governing institutions to implement the existing body of legislation intended to promote transparency and accountability. There is increasing public concern that a lack of good governance may hinder the country’s potential for faster and more inclusive economic growth in the coming years. Public dissatisfaction with high levels of corruption is heightened by developing income gaps and rising inflation. Countering corruption holds a prominent place in the political debate and has driven some reform efforts.According to estimation of international organization TI, Mongolia’s corruption perception index ranked 120 out of 183 countries with score 2.7 out of 106.
3ADB. 2012. Basic Statistics 2012. Manila 4Mongolian Statistical Yearbook 2011. National Statistical Office, p. 130. 5Ibid, p. 80. 6http://www.transparency.org/country#MNG_DataResearch

3
General outlook of Mongolian youth
There is a distinct lack of research dataon Mongolian youth as well as no consensus on a standardized definition of youth. Mongolia Youth Federation (MYF) defines youth as between 16 and 40, JCI Mongolia between 18 and 40, and Association of youth organizations affiliated with political parties between 18 and 35.
Source: Mongoliin Zaluuchuudiin Niigmiin Dur Turkh. Ulaanbaatar, 2012, p. 16
As of December 2011, there are 1,069,800 young people between 20 and 40, which represents 38,04% out of total population of 2,811,6 thousand. Out of these 1069,8 thousand 51,61% are female7.
Source: Mongoliin Zaluuchuudiin Niigmiin Dur Turkh. Ulaanbaatar, 2012, p. 19
7Mongolian Statistical Yearbook 2011. National Statistical Office, p. 84.
647500 738200 759061 845481 1017158
1197595
1595006
2043954
2373493
2754685
0.1
0.77
0.3
0.9
2.6 2.76
2.91
2.51
1.4 1.46
0
500000
1000000
1500000
2000000
2500000
3000000
0
0.5
1
1.5
2
2.5
3
3.5 POPULATION OF MONGOLIA, GROWTH RATE BY YEAR OF CENSUS
(1918-2010)
1918 1935 1944 1956 1963 1969 1979 1989 2000 2010
33
34
35
36
37
38
39
40
41
0
0.5
1
1.5
2
2.5
3
PERCENTAGE OF YOUTH AMONG POPULATION (1989-2010)
Нийт хүн ам Залуучуудын тоо Залуучуудын хувийн жин

4
PERCENTAGE STRUCTURE OF YOUTH (1989-2010)8 AGE 15-19 20-24 25-29 30-34 TOTAL
1989 30,6% 26,5% 24,6% 18,3% 100% 2000 29,5% 26,6% 23,5% 20,4% 100% 2010 25,6% 28,4% 24,2% 21,8% 100%
Socio-economic condition
Based on data from ABS III, those who consider countries’ economic situation as “bad/very bad” are 4,4 times higher than those who think it is “good/very good”/41,3%-9,3%/. Half of respondents evaluated our economic condition as “so so”. There is no big difference among age groups in this regard. Those who evaluated their family economic condition as “bad/very bad” are 1,7 times higher than those who think its “good/very good”, and 62,1 responded to this question “so so”. Percentage of youth who say that their family economic condition is good a bit higher in compare with elders /17.5-11.3%/. And correlation is reversed, when youth answer that the condition is bad /17.5-27.3%/. In general, satisfaction with economic condition in Mongolia is lower than the Asian average.
Lack of basic necessities like housing is one of the most pressing problems facing Mongolian youth as 62,3% of them live in other people’s properties. There are many instances where newly married couples with children live with their parents. Based on data of ABS III, in 72 % of families questioned, live more than two generations. In the past 5 years there has been no noticeable improvement in living standards of young people and some even got worse. 35,5% earn below the minimum wage and third are fully supported by parents. Overall, 62,6% of young people have insufficient income to provide for themselves and meet their basic needs9. The problem of housing for youth becomes huge when earnings are deficient to even provide for day to day necessities.
8Mongolian Statistical Yearbook 1989, 2000, 2011.National Statistical Office. 9XXIzuun-MongoliinZaluuchuud.MYF.2011. p. 81

5
Education and workforce
Source: Main Data of the Census 2010.P. 55
Mongolian youth in general are not satisfied with education system and its quality, as well as seek opportunities to study in foreign universities. 75,3% of people who participated in survey voiced their desire to go abroad. Main factors behind their dissatisfaction with the education system lied with quality and general environment of education. Moreover, 74% of surveyed youth think that tuition rates are excessively high. According to study, 49,1% of young people in workforce are “satisfied” with their job, 40,6% are “somewhat dissatisfied”, and 10,2% are “dissatisfied”10. They cite low wages as the main reason for dissatisfaction with their jobs and blame themselves and government for unemployment.
Education level of youth by age group11
High Technical and vocational
High school
Middle school
Primary Uneducated
15-19 0,6% 2,8% 39,4% 41,0% 12,8% 3,4% 20-24 23,8% 5,5% 51,3% 9,7% 5,7% 4,0% 25-29 36% 3,7% 31,1% 13,0% 10,2% 6,0% 30-34 27,3% 4,5% 34,9% 19,6% 10,0% 3,7%
10XXI zuun-Mongoliin Zaluuchuud. MYF. 2011. p. 83 11Main Data of the Census 2010.P. 51.
18%
28% 21%
16,5% 14% 17,4% 18,5% 21%
24,5% 29%
44%
34% 27%
21,5% 22,5% 21,5% 17,5%
12%
0
10
20
30
40
50
20-24 25-29 30-34 35-39 40-44 45-49 50-54 55-59 60+
HIGHER EDUCATION ATTAINMENT BE AGE and SEX, 2010
male female
6
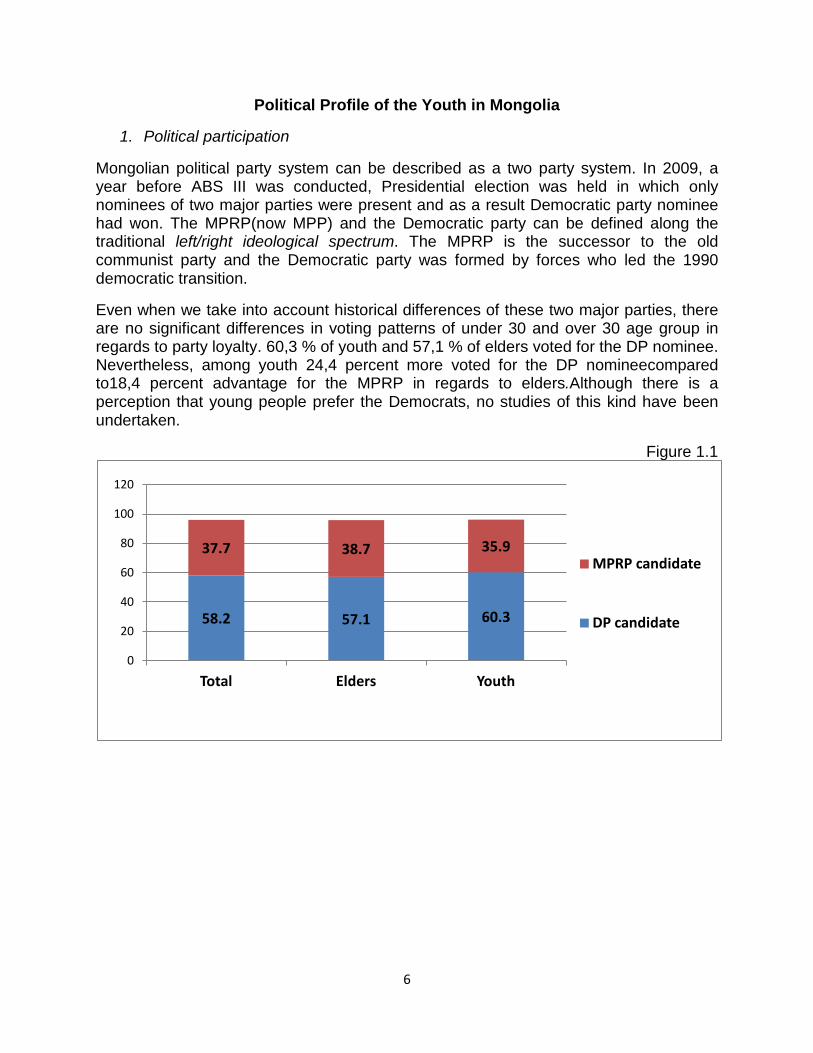
Political Profile of the Youth in Mongolia
1. Political participation
Mongolian political party system can be described as a two party system. In 2009, a year before ABS III was conducted, Presidential election was held in which only nominees of two major parties were present and as a result Democratic party nominee had won. The MPRP(now MPP) and the Democratic party can be defined along the traditional left/right ideological spectrum. The MPRP is the successor to the old communist party and the Democratic party was formed by forces who led the 1990 democratic transition.
Even when we take into account historical differences of these two major parties, there are no significant differences in voting patterns of under 30 and over 30 age group in regards to party loyalty. 60,3 % of youth and 57,1 % of elders voted for the DP nominee. Nevertheless, among youth 24,4 percent more voted for the DP nomineecompared to18,4 percent advantage for the MPRP in regards to elders.Although there is a perception that young people prefer the Democrats, no studies of this kind have been undertaken.
Figure 1.1
58.2 57.1 60.3
37.7 38.7 35.9
0
20
40
60
80
100
120
Total Elders Youth
MPRP candidate
DP candidate

7
Our study demonstrates that when it concerns political participation,young people areconversely less active and enthusiastic. During the Presidential election of 2009, 52% of total respondents took part in any type of campaign meeting or rally. Among elders 60%attended a campaign meetings compared with 40% who are young.
Figure 1.2
Between elections, only 1 out of 8 respondents contacted elected or legislative representativesbecause of personal or community problems. People over 30 are about 2 times more active than youth. This less active trend of youth continues in other studies as well.12
2. Psychological involvement in politics
Looking at this survey result one can see the political participation among Mongolian population, especially among youth is low in non-election times.
Level of interest and disinterest in politics is pretty much equal in generally (50,2-49,8 percent respectively). Percentage of young people who are interested in politics /45,2/ seems relatively high, however 41% of them answered “somewhat interested” in our survey. Among elders, 52,9% answered positively /44% are somewhat interested/. This phenomena is not surprising as most of these people over 30 lived through a time when Mongolia was a strict, ideologically driven society where people had to be more interested in social and political life.
12Mongoliin Zaluuchuudiin Niigmiin Dur Turkh. UB 2012, p. 78.
51.7 59.5 40.2
46.9 40.4 56.5
0
20
40
60
80
100
120
Total Elders Youth
No Yes

8
Figure 2.1
According to study, 73%of respondents follownews on politics and economics “everyday” and “several times a week”. It is over 80% among elder people and 54 % of them reported that they follow news “everyday”.As for young population there is a big contrast, as only 28,4% follow news “everyday”. Third of youth and 16,2% of elder respondents answered“once or twice a week” and “not even once a week”.
As for other Asian countries study, there are no significant differences to dwell on.
Respondents were asked how often they discuss politics with their family members or friends.69,6 % answered “occasionally” /8.8 % answered “frequently”/ which is higher than Asian countries average. What is interesting is that 72,6% of Mongolian youth answered “occasionally”, which is higher than national average and 14% higher than Asian average. As for elders, 67,6% is also higher than Asian average /52,6/.
Figure 2.3
9.3
43.6 41.9
5.3 4.5
40.7
48.7
6.1 0
10
20
30
40
50
60
Very interested Somewhat interested Not very interested Not at all
Elders
Youth
12.1 3.9 7.0
67.6 72.6 59.0
0
10
20
30
40
50
60
70
80
90
Elders Youth Asian youth
Occasionally
Frequently

9
3. Sense of citizen empowerment
Results of this survey show that level of political participation is slightly higher in Mongolia compared to other Asian countries average. In addition, understanding of participation (sense of their empowerment) is quite distinct from Asian average.For example, participants were asked whether they would agree or disagree with the statement “I think I have the ability to participate in politics”. Total 55,4% answered “strongly agree” or “somewhat agree” /20,9% answered “strongly agree”/. The fact that young people were more agreeable with the aforementioned statement than elder is worth mentioning. Mongolian youth’ perception regarding their own ability to participate in politics is higher than Asian average.
Figure 3.1
Nevertheless, 65,6% answered “strongly agree” or “somewhat agree” to the statement – “A person like me can’t really understand what is going on in politics.” People who agree with it outweigh those who disagree by a rate of nearly 2 to 1. Two-third of people who “strongly” or “somewhat” agree with the statement - “I have the ability to participate” answered affirmatively to this statement. In other words, even people who think that they have capacity to participate in politics don’t have adequate knowledge of government policies. Logically the other 1/3 thinks they have some understanding of politics. Among the youth level of understanding of government politics is higher than in elder group /37,2% to 30,9%/.
20.9 21.5 20.0 9.0
34.5 30.8 39.9
33.0
26 26.2 25.8
17.1 20.2 13.9
0
20
40
60
80
100
120
Total Elders Youth Asian youth
Strongly disagree
Somewhat disagree
Somewhat agree
Strongly agree

10
Figure 3.2
Perhaps because of the abovementioned reason, quarter of respondents strongly agree that it is “impossible to influence over what the government does”. If you add people who “somewhat agree” with the assertion, people with “pessimistic” view add up to nearly 55%. Nevertheless, this statistic fares better when compared to Japan, Taiwan, and Singapore. One detail to take into consideration is that nearly half /48,8%/ of Mongolian youth don’t agree with this statement /Asian average is 44%/. Half of people who think they have ability to participate in politics believe they can influence government policies.
Figure 3.3
21.5 24.9 16.5 14.0
44.1 42.8 46.1 52.0
25.0 22.1 29.4
8.3 8.8 7.8
0
20
40
60
80
100
120
Total Elders Youth Asian youth
Strongly disagree
Somewhat disagree
Somewhat agree
Strongly agree
24.0 27.2 19.2 14.0
30.4 30.0 30.9 41.0
26.1 23.8 29.4
18.1 17.2 19.4
0.0
20.0
40.0
60.0
80.0
100.0
120.0
Total Elders Youth Asian youth
Strongly disagree
Somewhat disagree
Somewhat agree
Strongly agree

11
4. Tolerance
Next assertion was whether it is“hard to talk to friends or co-workers whose opinion on politics differed from yours.” Two-thirds responded “not too hard, not hard at all”, which is fairly similar between age groups. Remaining third answered “very hard”. Among youth 29% responded “a bit hard”.
Figure 4.1
5. Support for democracy /Democratic Legitimacyand Preferencefor Democracy/
There is a series of questions about economic development, democracy and its legitimacy. Preference of democracy vis-à-vis authoritarianism is a question that needs attention in Mongolia as studies conducted since 2003 suggest that support for authoritarianism has been raising.
Figure 5.1
5.8 6.5 4.7
27.7 26.9 29.0
47.2 46.7 47.8
16.8 16.6 16.9
0
20
40
60
80
100
120
Total Elders Youth
Not at all
Not too hard
A bit hard
Very hard
55.3
27.5 15.9
39.7 40.7
16.1
48.4
32.1
17.1
0 10 20 30 40 50 60
Democracy is always preferable
Authoritarian government can be preferable
Does not matter
Democracy vs Authoritarism
2003 2006 2010
12
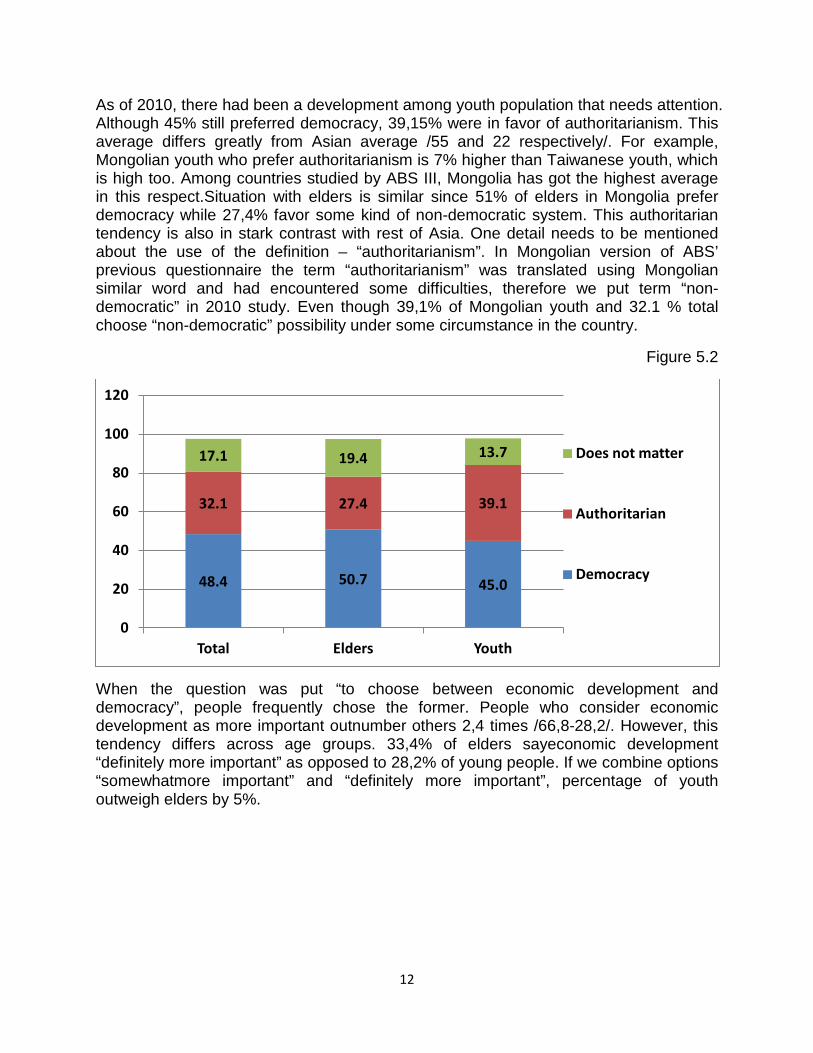
As of 2010, there had been a development among youth population that needs attention. Although 45% still preferred democracy, 39,15% were in favor of authoritarianism. This average differs greatly from Asian average /55 and 22 respectively/. For example, Mongolian youth who prefer authoritarianism is 7% higher than Taiwanese youth, which is high too. Among countries studied by ABS III, Mongolia has got the highest average in this respect.Situation with elders is similar since 51% of elders in Mongolia prefer democracy while 27,4% favor some kind of non-democratic system. This authoritarian tendency is also in stark contrast with rest of Asia. One detail needs to be mentioned about the use of the definition – “authoritarianism”. In Mongolian version of ABS’ previous questionnaire the term “authoritarianism” was translated using Mongolian similar word and had encountered some difficulties, therefore we put term “non-democratic” in 2010 study. Even though 39,1% of Mongolian youth and 32.1 % total choose “non-democratic” possibility under some circumstance in the country.
Figure 5.2
When the question was put “to choose between economic development and democracy”, people frequently chose the former. People who consider economic development as more important outnumber others 2,4 times /66,8-28,2/. However, this tendency differs across age groups. 33,4% of elders sayeconomic development “definitely more important” as opposed to 28,2% of young people. If we combine options “somewhatmore important” and “definitely more important”, percentage of youth outweigh elders by 5%.
48.4 50.7 45.0
32.1 27.4 39.1
17.1 19.4 13.7
0
20
40
60
80
100
120
Total Elders Youth
Does not matter
Authoritarian
Democracy

13
Figure 5.3
This tendency continued when other pair of statement were put - “reducing economic inequality (REI)” and“protecting political freedom (PPF)”- which is more important. People who preferred “reducing economic inequality” were 2,5 times higher than the other option. This relationship is slightly higher than the Asian average. There is very little/4%/ difference comparing youth and elders who opted for “reducing economic inequality”.
Figure 5.4
Those who agree with the assertion “democracy may have its problems, but it is still the best form of government” are 7 times higher than who don’t agree. Difference between those whose chose option “strongly agree” and “strongly disagree” is 26 times for youth and 20 times for elders.
31.3 33.4 28.2
35.5 34.2 37.3
22.6 20.5 25.7
5.6 5.7 5.5
0
20
40
60
80
100
120
Total Elders Youth
D definitely more important
D somewhat important
EC somewhat more important
EC definitely more important
29.6 31.1 27.5
35.4 32.2 40.1
20.4 19.6 21.6
5.8 6.5 4.7
0
10
20
30
40
50
60
70
80
90
100
Total Elders Youth
PPF definitely more important
PPF somewhat important
REI somewhat more important
REI definitely more important

14
Figure 5.5
When democracy is compared to other types of systems, the former gets majority of support which is reassuring. On the other hand, when democracy is opposed to economic development it starts to lose its advantage. This tendency stays identical through all age groups. Without doubt, because of Mongolia’s current economic situation, choice between democracy and growth tilts in favor of economic development.
For instance, those who consider countries’ economic situation as “bad” are 4,4 times higher than those who believe the situation is “good”/41,3%-9,3%/.Half of respondents evaluated our economic condition as “so so”. Those who evaluated their family economic condition as “bad” are 1,7 times higher than those who think it is “good”, plus 62,1 responded to this question “so so”. In general, satisfaction with economic condition in Mongolia is lower than the Asian average.
Figure 5.6 Countries’ Economic Condition
27.3 30.8 22.2
58 54.6 62.9
10.9 9.6 12.9 1.2 1.5 0.8
0.0
20.0
40.0
60.0
80.0
100.0
120.0
Total Elders Youth
Strongly disagree
Disagree
Agree
Strongly agree
0.7 1.0 0.4 6.0 7.9 8.3 7.1
29.0
50 48.1 52.9
36.7 36 37.8
4.4 6.1 1.8
0
20
40
60
80
100
120
Total Elders Youth Asian youth
Very bad
Bad
So so
Good
Very good

15
Figure 5.7 Family’s Economic Condition
6. Authoritarian vs. Liberal democracy value orientation
Five grouped questions were asked in this regard. For instance, one person out of ten disagreed with the assertion “people with little or no education should have as much say in politics as highly-educated people”. But 65,1% “strongly agreed”. And there is no difference across age groups.
Once other statements put - “government leaders are like the head of a family”, “government should allow discussions in a society” and “too many ways of thinking makes society chaotic”, the situation reversed. This fact illustrates that majority of the population have little or confused understanding of democracy without major difference across age groups. Slight variation occurs where half of youth respondents agree that “government leaders are like the head of a family”, compared to 60% of elders.
Figure 6.1
1.0 0.8 1.2 4.0 13.0 10.5 16.5
28.0
62.1 60.3 64.7
20.3 23.7 15.3
3.6 4.6 2.2
0.0
20.0
40.0
60.0
80.0
100.0
120.0
Total Elders Youth Asian youth
Very bad
Bad
So so
Good
Very good
20.5 34.5
13.9 31.0
35.4
39.8
27.1
32.5
29.4
17.4
21.8
21.3
13.4 6.4
32.9
13.6
0
20
40
60
80
100
120
Leaders are like family head
Government allows discussion
Judges accept view of executives
Different thikings make society chaotic
Strongly disagree
Smoewhat disagree
Somewhat agree
Strongly agree

16
Majority /54,7%/ disagreed with the statement “judges should accept the view of executive”, thus approving the concept of separation of powers (checks and balances). Nevertheless, 31% “strongly and somewhat agree” with dependence of judges from executive branch, and 43,1% of youth has the same position. In general, this study demonstrates slow pace of development of the public mind set in the democratic value system. Majority of Mongolians condemn variations of authoritarian systems like “one party”, “military” regimes - a tendency which stems from historical reasons /ABS 2003,2006/. However, many people favor more “civil” forms of authoritarianism, due to lack of appropriate civil education, knowledge, values and/or current transition socio-political situation. Further explanations include - inadequate civic education on democratic values, weak and inconsistent implementation of democratic principles by the government itself.
7. Perception of freedom, accountability, transparency and responsiveness
Freedom
It is perceived that respect and realization of political freedom in Mongolia is adequate, but there are several details worth bringing up in our study. According Freedom House evaluation, Mongolia rated as a Free (2.0) with score 2.0 for Civil liberties and Political rights respectively13. Despite the fact that majority /57,7%/ agree with the assertion “People are free to speak what they think without fear”, about 41% disagree in some sense. 45% of youth responded “somewhat” or “strongly disagree” which is slightly less than the Asian average. In other words, Mongolian youth are more apprehensive about this issue.
Figure 7.1
13 http://www.freedomhouse.org/report/freedom-world/2012/mongolia
29.1 29.3 29.0 21.0
28.6 30.8 25.3 42.0
26.3 22.7 31.6
14.5 15.4 13.3
0.0
20.0
40.0
60.0
80.0
100.0
120.0
Total Elders Youth Asian youth
Strongly disagree
Disagree
Agree
Strongly agree

17
3/4 of respondents agreed that “people can join any organization they like without fear”/40% “strongly agree”/. Here situation related with the freedom seems much better in comparison with the previous one. Among youth, two-thirds agree in some variation, but a quarter thinks otherwise, which is similar to Asian average.
Figure 7.2
Accountability
3/4 of the population agree with the statement - “People have the power to change a government they do not like” /45,2% - ‘strongly agree’/. As for youth, nearly a quarter of them disagree. However, a more practical question - “having elections makes the government pay attention to what the people think” yielded negative responses from 40% of respondents /not much and not at all/. Although many young people think along the same line, 60% still believe in usefulness of having elections. In this sense, youth is little more optimistic than elders/53,0/.
Figure 7.3
40.4 42.5 37.2 20.00
35.1 33.6 37.2 44.00
14.5 14.2 14.9 7.8 6.7 9.4
0.0
20.0
40.0
60.0
80.0
100.0
120.0
Total Elders Youth Asian youth
Strongly disagree
Disagree
Agree
Strongly agree
45.2 14.0
30.3
41.4
14.1 32.7
9.5 7.3
0
20
40
60
80
100
120
People have the power to change government
Having elections
Strongly disagree
Disagree
Agree
Strongly agree

18
Transparency
Corruption still remains a serious problem in Mongolia. According to estimation of international organization TI, Mongolia’s corruption perception index ranked 120 out of 183 countries with score 2.7 out of 1014.Government is undertaking drastic programs in order combat with corruption. Nonetheless, there is a widespread perception among the population that corruption has crawled into every level of local and national government agencies.
Figure 7.4
37.6 % of youth answered that “most officials”are corrupt and 17.0 % says “almost everyone” is corrupt in local government. Elders /47,3%/ think along the same line as youth. Perception of corruption in national government is even worse as 80% of the population think that “most officials + almost everyone corrupt”. 85,3% of youth agree with the assertion. There is no arguing that this negative perception leads to slow assimilation of democratic institutions and values by the masses. 14http://www.transparency.org/country#MNG_DataResearch
15.6 12.5 5.8
31.6 35 34.7
30.7 30.1 34.9
17.5 15.4 15.4
0
20
40
60
80
100
120
2003 2006 2010
Corruption /Local Government level/
Almost everyone is corrupt
Most officials are corrupt
Not a lot of officials are corrupt Hardly anyone is involved
3.6 2.6 1.2
29.5 19.5
14.4
39.5 40.6 47.3
21.9 30.4 32.4
0
20
40
60
80
100
120
2003 2006 2010
Corruption /National Government level/
Almost everyone is corrupt Most officials are corrupt
Not a lot of officials are corrupt Hardly anyone is involved
19
Responsiveness
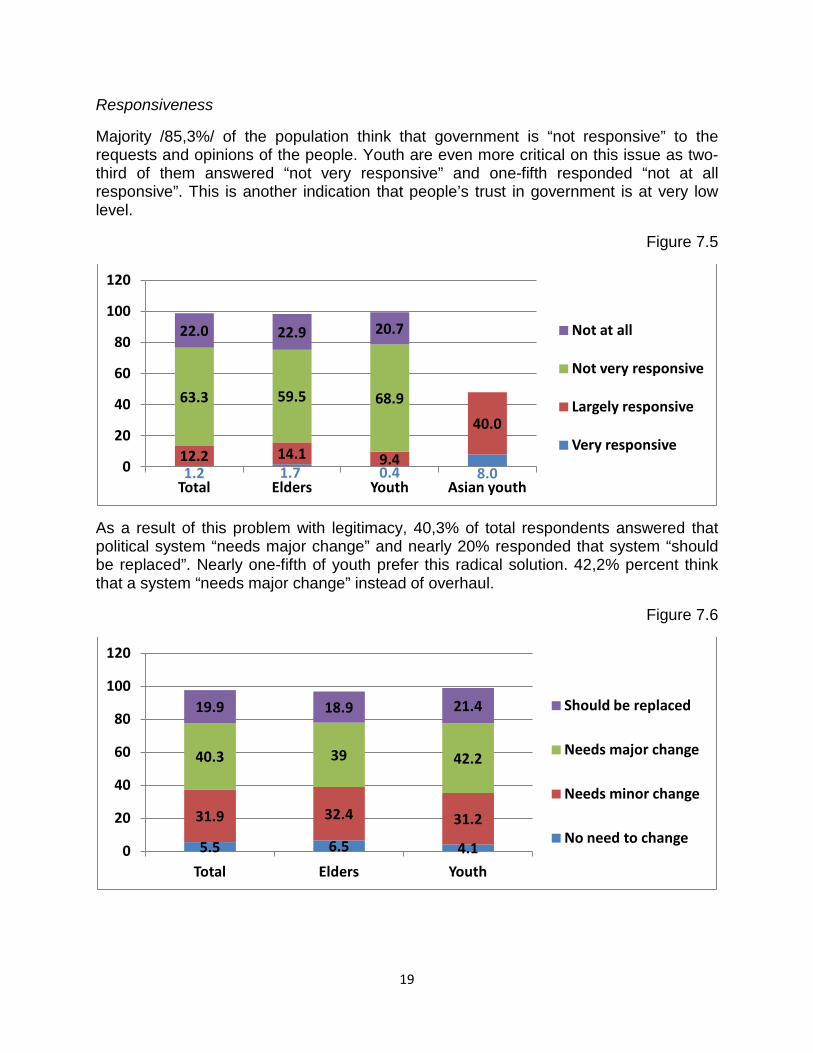
Majority /85,3%/ of the population think that government is “not responsive” to the requests and opinions of the people. Youth are even more critical on this issue as two-third of them answered “not very responsive” and one-fifth responded “not at all responsive”. This is another indication that people’s trust in government is at very low level.
Figure 7.5
As a result of this problem with legitimacy, 40,3% of total respondents answered that political system “needs major change” and nearly 20% responded that system “should be replaced”. Nearly one-fifth of youth prefer this radical solution. 42,2% percent think that a system “needs major change” instead of overhaul.
Figure 7.6
1.2 1.7 0.4 8.0 12.2 14.1 9.4
40.0
63.3 59.5 68.9
22.0 22.9 20.7
0
20
40
60
80
100
120
Total Elders Youth Asian youth
Not at all
Not very responsive
Largely responsive
Very responsive
5.5 6.5 4.1
31.9 32.4 31.2
40.3 39 42.2
19.9 18.9 21.4
0
20
40
60
80
100
120
Total Elders Youth
Should be replaced
Needs major change
Needs minor change
No need to change

20
Implications and Policy Recommendation
1. In the next 10 years young people between ages 15 to 34 will make up a significant majority of the Mongolian population. However, there is a tendency that proportion of teenagers will decrease in 15 years while youth will increase. Today’s teenagers (15 to 19) would be retiring in about 40 years; hence Mongolia would closely resemble present European countries in age composition of the populations. Due to population overload pension system will become one of the pressing problems. In other words, problems concerning Mongolian youth will be not only one social group problem; it will turn into nationwide concern in near future.
2. From 1979 to 1989 average growth rate of Mongolian population was 2,51% which decreased to 1,37% in the next decade(1989-2000). However, population growth increased to 1,46% in 2000-2010 compared to previous 10 years15.
3. There are widespread socio-economic problems and challenges affecting Mongolian youth. Many do not own property and lack of affordable housing exasperates the problem. General shortage of employment opportunities is aggravated by problems where those who have jobs earn minimum wage, those who have adequate education cannot find one. Moreover, youth are dissatisfied by education standard of Mongolia, which is below competitive level.
4. Majority of youth population trust in democracy and support it, yet they believe that system of government needs major changes, and about 1/5 of youth say that it should be replaced. From other side, it is difficult to keep citizens proactive, attentive, engaged and committed when they are deprived of trustworthy democratic institutions.Many young people are displeased with government policies and performance and trust in political institutions is rather low compared to trust in friends and family. Therefore, development of citizen-centered, civil society is halting. The citizen should participate in democratic deliberation and discuss politics with others, and ideally become capable of forming one’s own opinion.
5. Young people have great interest and potential for participation in politics, yet because of low influence of their choices on government policies, youth are becoming less active and enthusiastic. Picture looks bleak, when you consider that today’s youth will become majority age group in 10 years. Because of low level of participation in public life in times between elections there is a tendency that involvement in elections will decline too. Participation is a prime criterion for defining the democratic citizen and his/her role within the political process. The importance of participation is beyond voting.
6. Problem of civic education persists in present as well as development of democratic values in society is still not sufficient. Inadequate education, knowledge of democratic values is changing people’s commitment away from democracy and thus- towards authoritarianism. Deficient knowledge of democratic principles and insufficient attachment to the democratic values among Mongolian youth needs immediate attention. This youth generation will become main age group of the society in the near future.
15 Main Data of the Census 2010.p. 21

21
7. In general, consolidation of democracy, institutionalization, promotion of openness and transparency as well as studying quality of democracy have become one of the most pressing issues of Mongolia.
POPULATION PYRAMID 1989-2020 (AGE STRUCTURE DIAGRAM)
0-4 5-9
10-14 15-19 20-24 25-29 30-34 35-39 40-44 45-49 50-54 55-59 60-64 65-69
70+
1989
0-4 5-9
10-14 15-19 20-24 25-29 30-34 35-39 40-44 45-49 50-54 55-59 60-64 65-69
70+
2010
0-4 5-9
10-14 15-19 20-24 25-29 30-34 35-39 40-44 45-49 50-54 55-59 60-64 65-69
70+
2020
0-4 5-9
10-14 15-19 20-24 25-29 30-34 35-39 40-44 45-49 50-54 55-59 60-64 65-69
70+
2000