Embed Size (px)
Citation preview

© 2014 – Cerved Group Spa – Tutti i diritti riservati – Riproduzione vietata
September 2014
Monitor of Bankruptcies, Insolvency Proceedings and Business Closures
Second Quarter 2014
2 © 2014 – Cerved Group Spa – All rights reserved – Reproduction prohibited
Secondo gli archivi di Cerved, nel terzo trimestre del
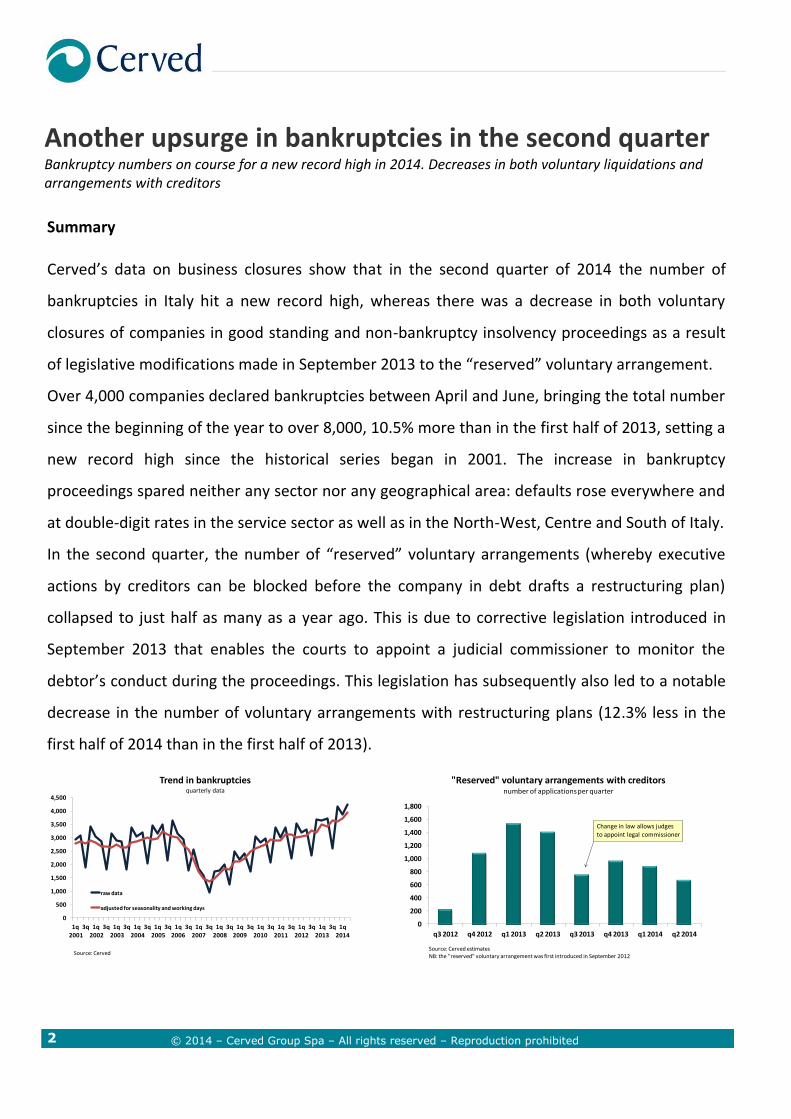
Summary Cerved’s data on business closures show that in the second quarter of 2014 the number of
bankruptcies in Italy hit a new record high, whereas there was a decrease in both voluntary
closures of companies in good standing and non-bankruptcy insolvency proceedings as a result
of legislative modifications made in September 2013 to the “reserved” voluntary arrangement.
Over 4,000 companies declared bankruptcies between April and June, bringing the total number
since the beginning of the year to over 8,000, 10.5% more than in the first half of 2013, setting a
new record high since the historical series began in 2001. The increase in bankruptcy
proceedings spared neither any sector nor any geographical area: defaults rose everywhere and
at double-digit rates in the service sector as well as in the North-West, Centre and South of Italy.
In the second quarter, the number of “reserved” voluntary arrangements (whereby executive
actions by creditors can be blocked before the company in debt drafts a restructuring plan)
collapsed to just half as many as a year ago. This is due to corrective legislation introduced in
September 2013 that enables the courts to appoint a judicial commissioner to monitor the
debtor’s conduct during the proceedings. This legislation has subsequently also led to a notable
decrease in the number of voluntary arrangements with restructuring plans (12.3% less in the
first half of 2014 than in the first half of 2013).
Another upsurge in bankruptcies in the second quarter
Bankruptcy numbers on course for a new record high in 2014. Decreases in both voluntary liquidations and arrangements with creditors
0
500
1,000
1,500
2,000
2,500
3,000
3,500
4,000
4,500
1q2001
3q 1q2002
3q 1q2003
3q 1q2004
3q 1q2005
3q 1q 2006
3q 1q 2007
3q 1q2008
3q 1q 2009
3q 1q 2010
3q 1q 2011
3q 1q 2012
3q 1q 2013
3q 1q 2014
Trend in bankruptciesquarterly data
raw data
adjusted for seasonality and working days
Source: Cerved
0
200
400
600
800
1,000
1,200
1,400
1,600
1,800
q3 2012 q4 2012 q1 2013 q2 2013 q3 2013 q4 2013 q1 2014 q2 2014
"Reserved" voluntary arrangements with creditorsnumber of applications per quarter
Source: Cerved estimatesNB: the "reserved" voluntary arrangement was first introduced in September 2012
Change in law allows judges to appoint legal commissioner
3 © 2014 – Cerved Group Spa – All rights reserved – Reproduction prohibited
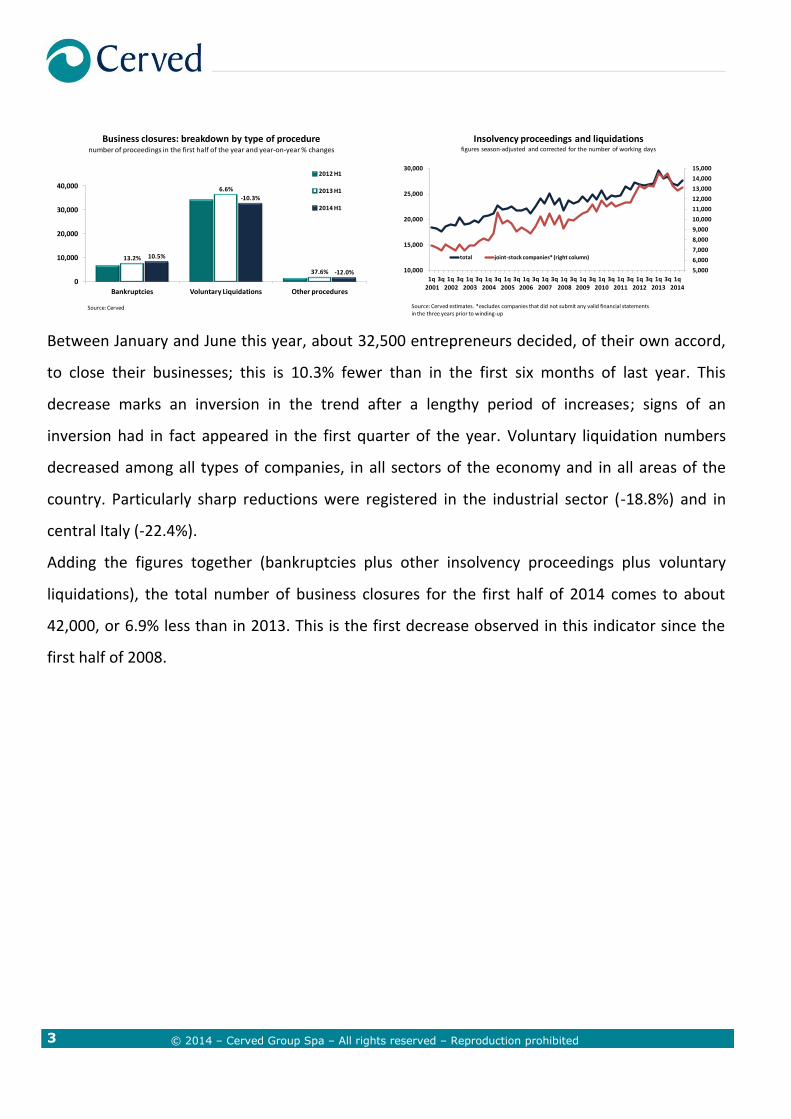
Between January and June this year, about 32,500 entrepreneurs decided, of their own accord,
to close their businesses; this is 10.3% fewer than in the first six months of last year. This
decrease marks an inversion in the trend after a lengthy period of increases; signs of an
inversion had in fact appeared in the first quarter of the year. Voluntary liquidation numbers
decreased among all types of companies, in all sectors of the economy and in all areas of the
country. Particularly sharp reductions were registered in the industrial sector (-18.8%) and in
central Italy (-22.4%).
Adding the figures together (bankruptcies plus other insolvency proceedings plus voluntary
liquidations), the total number of business closures for the first half of 2014 comes to about
42,000, or 6.9% less than in 2013. This is the first decrease observed in this indicator since the
first half of 2008.
13.2%
6.6%
37.6%
10.5%
-10.3%
-12.0%
0
10,000
20,000
30,000
40,000
Bankruptcies Voluntary Liquidations Other procedures
Business closures: breakdown by type of procedurenumber of proceedings in the first half of the year and year-on-year % changes
2012 H1
2013 H1
2014 H1
Source: Cerved
5,000
6,000
7,000
8,000
9,000
10,000
11,000
12,000
13,000
14,000
15,000
10,000
15,000
20,000
25,000
30,000
1q2001
3q 1q2002
3q 1q2003
3q 1q2004
3q 1q2005
3q 1q 2006
3q 1q 2007
3q 1q2008
3q 1q 2009
3q 1q 2010
3q 1q 2011
3q 1q 2012
3q 1q2013
3q 1q 2014
Insolvency proceedings and liquidationsfigures season-adjusted and corrected for the number of working days
total joint-stock companies* (right column)
Source: Cerved estimates. *excludes companies that did not submit any valid financial statementsin the three years prior to winding-up

4 © 2014 – Cerved Group Spa – All rights reserved – Reproduction prohibited
Bankruptcies
Bankruptcy numbers have not stopped
climbing: between April and June, over 4,000
Italian businesses began bankruptcy
proceedings. Having slowed down in the
previous quarter, bankruptcies resumed
double-digit growth (+14.3%), bringing the total
in the first six months of 2014 to over 8,000, up
10.5% from 2013 and the most ever since 2001.
The biggest increase in bankruptcies was
among joint-stock companies, which accounted
for three-fourths of the total. In the first half of
2014, there was a 12.9% increase in
bankruptcies among these companies to over
6,000. Increases were smaller among
partnerships (+5.9%) and businesses of other
legal status (+1.8%).
By macro-sector, the sharpest rise in
bankruptcies was in the service sector
(+15.7%), even faster than the 14.5% growth
seen in the first half of 2013. Bankruptcy
procedure numbers also continued to rise,
although at slower paces, in construction and in
manufacturing: there was an 8.2% increase
among building companies (vs. +12.8% in the
first half of 2013) and a 4.5% increase among
manufacturing companies (vs. +10.5%).
The January-June increase in bankruptcies was
also common to every part of the Boot, and at
double-digit rates everywhere except in the
0
500
1,000
1,500
2,000
2,500
3,000
3,500
4,000
4,500
1q2001
3q 1q2002
3q 1q2003
3q 1q2004
3q 1q2005
3q 1q 2006
3q 1q 2007
3q 1q2008
3q 1q 2009
3q 1q 2010
3q 1q 2011
3q 1q 2012
3q 1q 2013
3q 1q 2014
Trend in bankruptciesquarterly data
raw data
adjusted for seasonality and working days
Source: Cerved
12.9%
12.8%
10.5%
14.5%
1.2%
8.2%
4.5%
15.7%
0
500
1,000
1,500
2,000
2,500
3,000
3,500
4,000
4,500
others construction industrial service
Bankruptcies by macro-sector in the first halfnumber of proceedings and year-on-year percent changes
2012 H1
2013 H1
2014 H1
Source: Cerved
14.9%
12.9%
13.5%1.8%
12.9%
5.9%
0
1,000
2,000
3,000
4,000
5,000
6,000
7,000
other forms joint-stock companies partnerships
Bankruptcies in 1H: breakdown by legal statusnumber of proceedings and year-on-year percent changes
2012 H1
2013 H1
2014 H1
Source: Cerved
5 © 2014 – Cerved Group Spa – All rights reserved – Reproduction prohibited
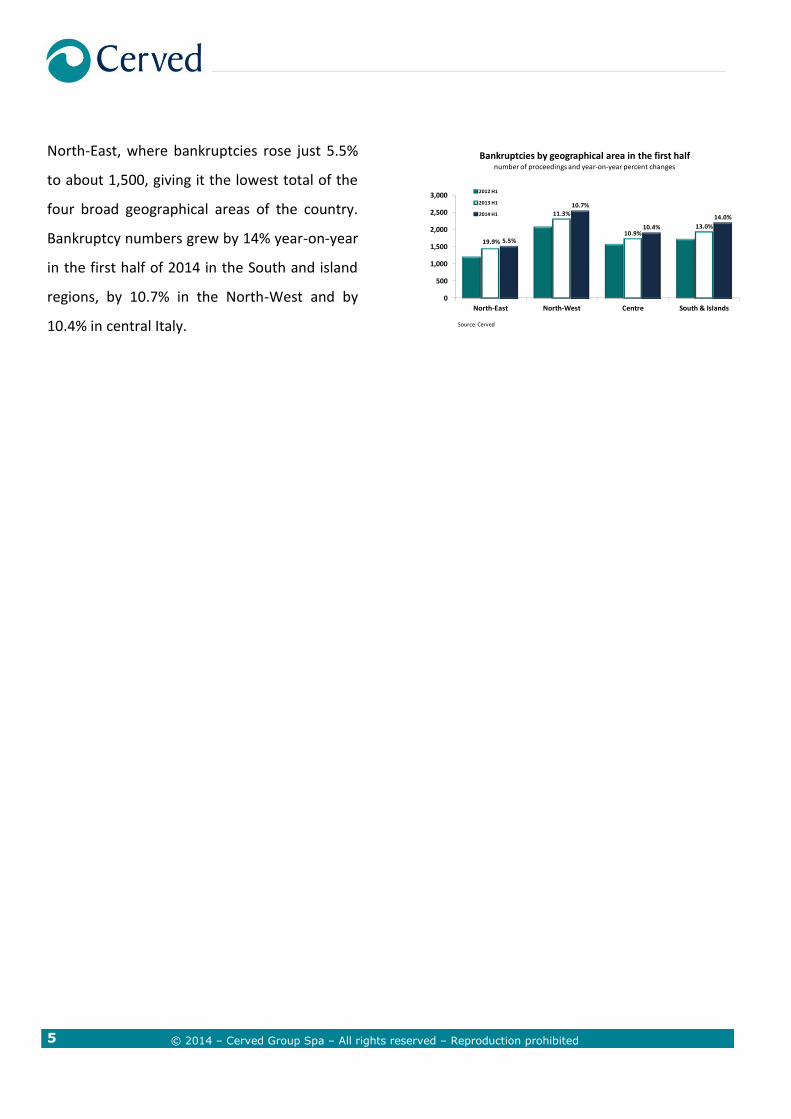
North-East, where bankruptcies rose just 5.5%
to about 1,500, giving it the lowest total of the
four broad geographical areas of the country.
Bankruptcy numbers grew by 14% year-on-year
in the first half of 2014 in the South and island
regions, by 10.7% in the North-West and by
10.4% in central Italy.
19.9%
11.3%
10.9%13.0%
5.5%
10.7%
10.4%
14.0%
0
500
1,000
1,500
2,000
2,500
3,000
North-East North-West Centre South & Islands
Bankruptcies by geographical area in the first halfnumber of proceedings and year-on-year percent changes
2012 H1
2013 H1
2014 H1
Source: Cerved
6 © 2013 – Cerved Group Spa – All rights reserved – Reproduction prohibited
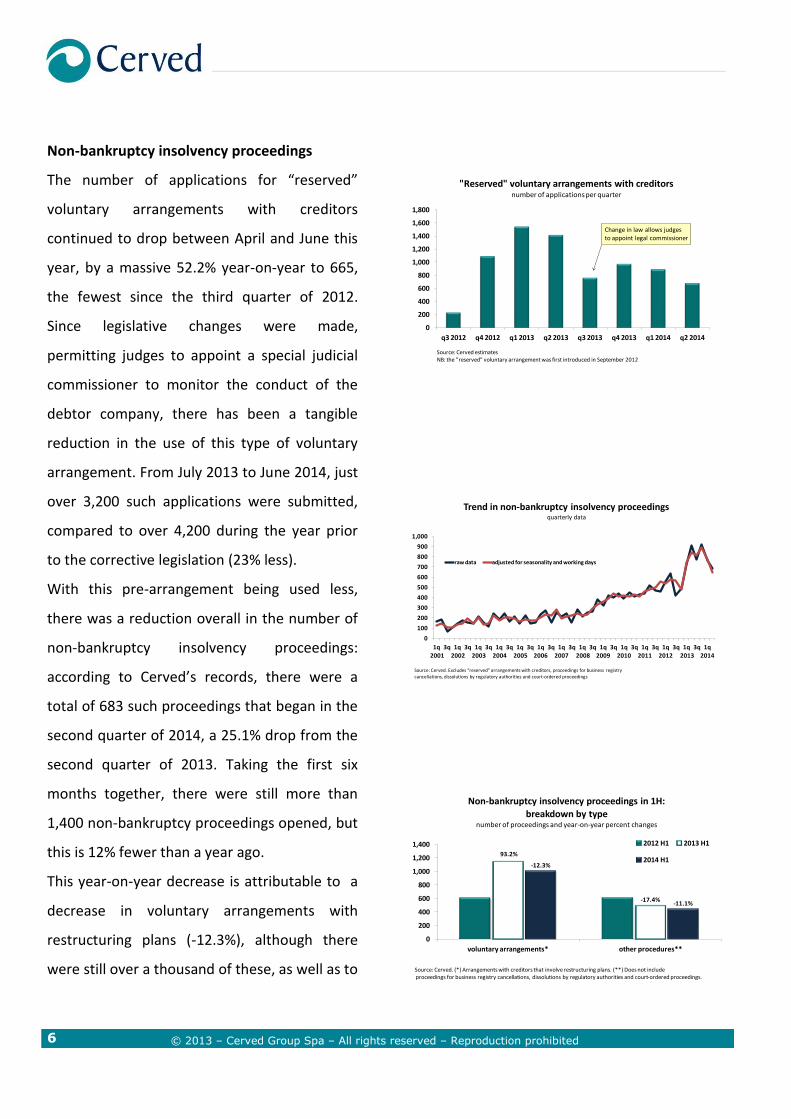
Non-bankruptcy insolvency proceedings
The number of applications for “reserved”
voluntary arrangements with creditors
continued to drop between April and June this
year, by a massive 52.2% year-on-year to 665,
the fewest since the third quarter of 2012.
Since legislative changes were made,
permitting judges to appoint a special judicial
commissioner to monitor the conduct of the
debtor company, there has been a tangible
reduction in the use of this type of voluntary
arrangement. From July 2013 to June 2014, just
over 3,200 such applications were submitted,
compared to over 4,200 during the year prior
to the corrective legislation (23% less).
With this pre-arrangement being used less,
there was a reduction overall in the number of
non-bankruptcy insolvency proceedings:
according to Cerved’s records, there were a
total of 683 such proceedings that began in the
second quarter of 2014, a 25.1% drop from the
second quarter of 2013. Taking the first six
months together, there were still more than
1,400 non-bankruptcy proceedings opened, but
this is 12% fewer than a year ago.
This year-on-year decrease is attributable to a
decrease in voluntary arrangements with
restructuring plans (-12.3%), although there
were still over a thousand of these, as well as to
0
200
400
600
800
1,000
1,200
1,400
1,600
1,800
q3 2012 q4 2012 q1 2013 q2 2013 q3 2013 q4 2013 q1 2014 q2 2014
"Reserved" voluntary arrangements with creditorsnumber of applications per quarter
Source: Cerved estimatesNB: the "reserved" voluntary arrangement was first introduced in September 2012
Change in law allows judges to appoint legal commissioner
0
100
200
300
400
500
600
700
800
900
1,000
1q2001
3q 1q2002
3q 1q2003
3q 1q2004
3q 1q2005
3q 1q 2006
3q 1q 2007
3q 1q2008
3q 1q 2009
3q 1q 2010
3q 1q 2011
3q 1q 2012
3q 1q2013
3q 1q 2014
Trend in non-bankruptcy insolvency proceedingsquarterly data
raw data adjusted for seasonality and working days
Source: Cerved. Excludes "reserved" arrangements with creditors, proceedings for business registrycancellations, dissolutions by regulatory authorities and court-ordered proceedings
93.2%
-17.4%
-12.3%
-11.1%
0
200
400
600
800
1,000
1,200
1,400
voluntary arrangements* other procedures**
Non-bankruptcy insolvency proceedings in 1H:
breakdown by typenumber of proceedings and year-on-year percent changes
2012 H1 2013 H1
2014 H1
Source: Cerved. (*) Arrangements with creditors that involve restructuring plans. (**) Does not includeproceedings for business registry cancellations, dissolutions by regulatory authorities and court-ordered proceedings.
7 © 2013 – Cerved Group Spa – All rights reserved – Reproduction prohibited
an 11.1% decrease in other types of
proceedings.
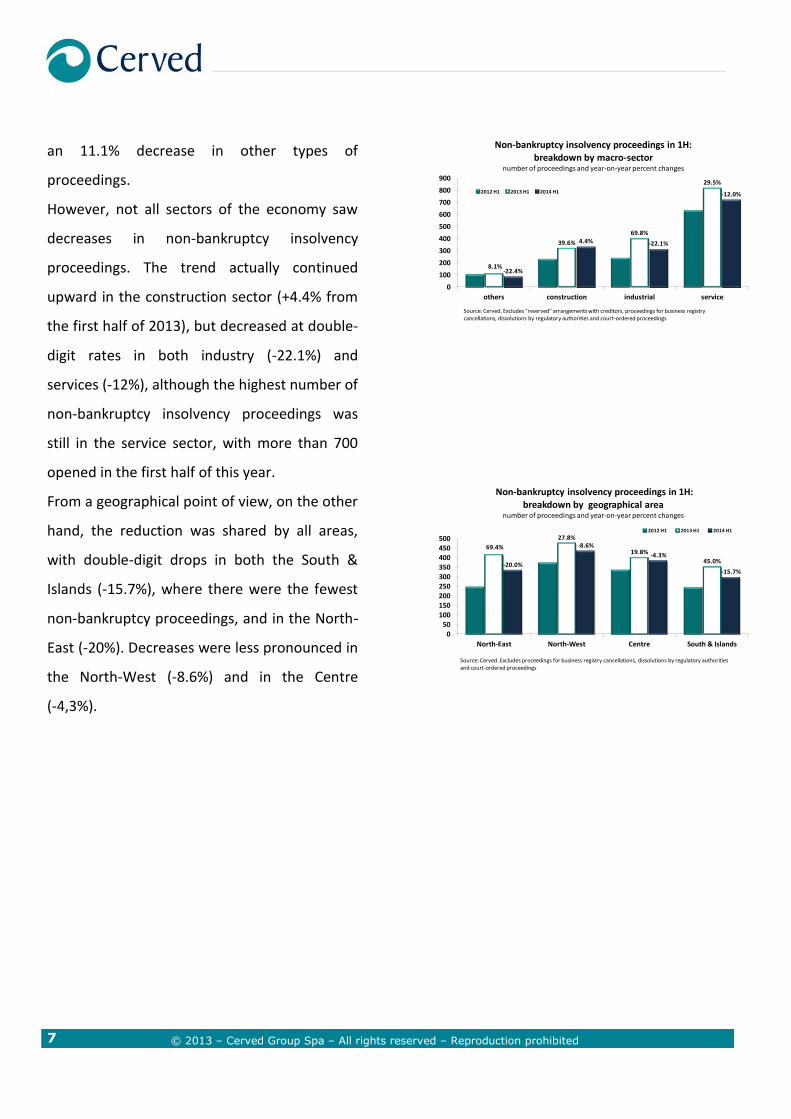
However, not all sectors of the economy saw
decreases in non-bankruptcy insolvency
proceedings. The trend actually continued
upward in the construction sector (+4.4% from
the first half of 2013), but decreased at double-
digit rates in both industry (-22.1%) and
services (-12%), although the highest number of
non-bankruptcy insolvency proceedings was
still in the service sector, with more than 700
opened in the first half of this year.
From a geographical point of view, on the other
hand, the reduction was shared by all areas,
with double-digit drops in both the South &
Islands (-15.7%), where there were the fewest
non-bankruptcy proceedings, and in the North-
East (-20%). Decreases were less pronounced in
the North-West (-8.6%) and in the Centre
(-4,3%).
8.1%
39.6%
69.8%
29.5%
-22.4%
4.4% -22.1%
-12.0%
0
100
200
300
400
500
600
700
800
900
others construction industrial service
Non-bankruptcy insolvency proceedings in 1H:
breakdown by macro-sectornumber of proceedings and year-on-year percent changes
2012 H1 2013 H1 2014 H1
Source: Cerved. Excludes "reserved" arrangements with creditors, proceedings for business registrycancellations, dissolutions by regulatory authorities and court-ordered proceedings
69.4%
27.8%
19.8%
45.0%-20.0%
-8.6%
-4.3%
-15.7%
050
100150200250300350400450500
North-East North-West Centre South & Islands
Non-bankruptcy insolvency proceedings in 1H:
breakdown by geographical areanumber of proceedings and year-on-year percent changes
2012 H1 2013 H1 2014 H1
Source: Cerved. Excludes proceedings for business registry cancellations, dissolutions by regulatory authoritiesand court-ordered proceedings

8 © 2013 – Cerved Group Spa – All rights reserved – Reproduction prohibited
Voluntary liquidations
It is estimated1 that about 16,000
entrepreneurs began liquidation proceedings of
their own accord between April and June 2014;
this figure is 3.3% less than in the same period
of 2013. This decrease marks an inversion in
the trend on a six-month basis: after rising for
several years, the number of voluntary
liquidations fell by 10.3% year-on-year in the
first six months of 2014 to about 32,500.
Liquidation numbers went down among all
types of companies: the biggest decrease was
among “truly active” joint-stock companies
(-14.1%), while there was a 7.8% drop in
voluntary liquidations of partnerships and a
2.2% drop among “dormant” companies, that
is, those that had not submitted financial
statements in any of the three years prior to
winding up.
Considering only non-dormant companies,
voluntary liquidations decreased across all
sectors and all geographical areas. The
reduction was in double-digit territory in the
industrial sector (-18.8%) and in the service
sector (-13.9%); the latter is still the macro-
1 Due to delays in Chamber of Commerce database updates,
liquidation figures are estimated for the most recent quarter and then corrected and updated to show the actual number in the subsequent Monitor report. The actual first quarter 2014 number of about 17,000 is lower than the estimate of 19,000 provided in the previous edition of this Monitor.
5,000
6,000
7,000
8,000
9,000
10,000
11,000
12,000
13,000
14,000
10,000
15,000
20,000
25,000
30,000
1q2001
3q 1q2002
3q 1q2003
3q 1q2004
3q 1q2005
3q 1q 2006
3q 1q 2007
3q 1q2008
3q 1q 2009
3q 1q 2010
3q 1q 2011
3q 1q 2012
3q 1q 2013
q3 1q2014
Trend in voluntary liquidationsfigures season-adjusted and corrected for the number of working days
all businesses joint-stock companies* (right column)
Source: Cerved estimates. *excludes companies that did not submit any valid financial statementsin the three years prior to winding-up
4.4%
73.5%
-0.2%-14.1%
-2.2%
-7.8%
0
2,000
4,000
6,000
8,000
10,000
12,000
14,000
16,000
18,000
20,000
joint-stock co.* dormant partnerships
Voluntary liquidations in 1H:
breakdown by business status number of proceedings and year-on-year percent changes
2012 H1 2013 H1 2014 H1
Source: Cerved estimates. *excludes companies that did not submit any valid financial statementsin the three years prior to winding-up
6.1%
1.6%0.8%
5.5%
-21.1%
-7.8%-18.8%
-13.9%
0
2,000
4,000
6,000
8,000
10,000
12,000
14,000
others construction industrial service
Voluntary liquidations of joint-stock companies* in 1H:
breakdown by macro-sectornumber of proceedings and year-on-year percent changes
2012 H1 2013 H1 2014 H1
Source: Cerved estimates. *excludes companies that did not submit any valid financial statementsin the three years prior to winding-up
9 © 2013 – Cerved Group Spa – All rights reserved – Reproduction prohibited
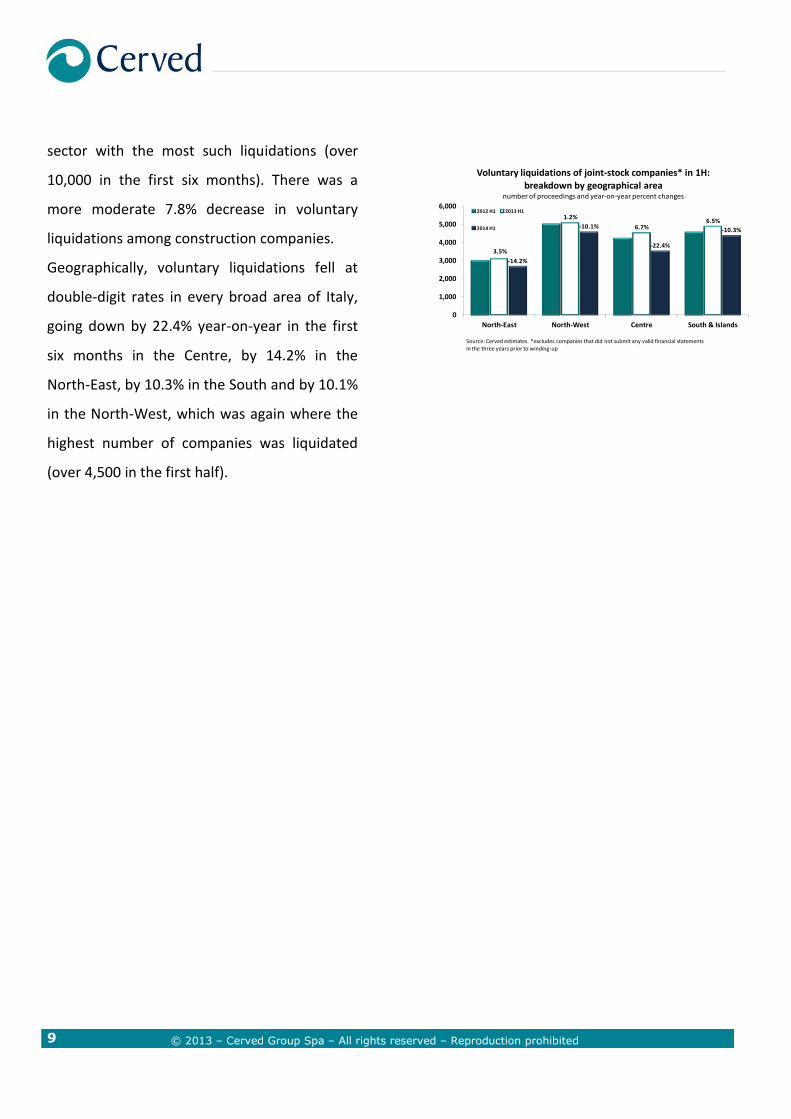
sector with the most such liquidations (over
10,000 in the first six months). There was a
more moderate 7.8% decrease in voluntary
liquidations among construction companies.
Geographically, voluntary liquidations fell at
double-digit rates in every broad area of Italy,
going down by 22.4% year-on-year in the first
six months in the Centre, by 14.2% in the
North-East, by 10.3% in the South and by 10.1%
in the North-West, which was again where the
highest number of companies was liquidated
(over 4,500 in the first half).
3.5%
1.2%
6.7%6.5%
-14.2%
-10.1%
-22.4%
-10.3%
0
1,000
2,000
3,000
4,000
5,000
6,000
North-East North-West Centre South & Islands
Voluntary liquidations of joint-stock companies* in 1H:
breakdown by geographical areanumber of proceedings and year-on-year percent changes
2012 H1 2013 H1
2014 H1
Source: Cerved estimates. *excludes companies that did not submit any valid financial statementsin the three years prior to winding-up