Embed Size (px)
Citation preview
Monitoring Access to Care in New Hampshire’s Medicaid Program
Review of Key Indicators – August 2012
A Report Prepared by the Office of Medicaid Business and Policy New Hampshire Department of Health and Human Services Nicholas A. Toumpas, Commissioner New Hampshire Department of Health and Human Services Kathleen A. Dunn, MPH Medicaid Director Marilee Nihan, M.B.A. Medicaid Finance Director Andrew Chalsma, Administrator Bureau of Healthcare Analytics and Data Systems
August 15, 2012
The Department of Health and Human Services’ Mission is to join communities and families in providing opportunities for citizens to achieve health and independence

MONITORING ACCESS TO CARE IN NEW HAMPSHIRE’S MEDICAID PROGRAM: REVIEW OF KEY INDICATORS, AUGUST 2012 New Hampshire Department of Health and Human Services Office of Medicaid Business and Policy
Acknowledgements
This report was written by the Office of Medicaid Business and Policy, New Hampshire Department of Health and Human Services. Contributors include the following:
• Farzana Alamgir, Senior Management Analyst
• Andrea Stewart, Business System Analyst
• Carolyn Richards, Business System Analyst
• Betsy Hippensteel, Administrator, Medicaid Client Services
• Mary Fields, Program Specialist IV, Medicaid Client Services
• Valerie Brown, Senior Medicaid Business System Analyst
• Robin Calley, Program Assistant
• Crystal Ingerson, Business Administrator
With assistance from:
• Jean Sullivan, Associate Vice Chancellor, University of Massachusetts, Center for Health Law and Economics

MONITORING ACCESS TO CARE IN NEW HAMPSHIRE’S MEDICAID PROGRAM: REVIEW OF KEY INDICATORS, AUGUST 2012 New Hampshire Department of Health and Human Services Office of Medicaid Business and Policy
Table of Contents
1. Introduction 1
2. Methodology 6
3. Data and Analysis 10
New Hampshire Medicaid Beneficiaries 10
Provider Availability 16
Utilization of Services 22
Beneficiary Assistance and Satisfaction 49
Conclusion 55
4. Beneficiary Engagement 56
New Hampshire Medicaid Client Services Unit 56
Medical Care Advisory Committee (MCAC) 58
Stakeholder Meetings 58
5. Plan for Monitoring Access 60
Updates to Monitoring 60
Investigation of Access Issues and Corrective Actions 60
Access Monitoring under Medicaid Managed Care 61
6. Summary and Conclusion 65
7. Appendices 67
Appendix A: New Hampshire Medicaid Community Health Center Access and Capacity 68
Appendix B: Tabular Version of Data in Trend Charts 70

MONITORING ACCESS TO CARE IN NEW HAMPSHIRE’S MEDICAID PROGRAM: REVIEW OF KEY INDICATORS, AUGUST 2012 New Hampshire Department of Health and Human Services Office of Medicaid Business and Policy
1
1. Introduction
This report describes the New Hampshire Medicaid program’s overall system of healthcare‐access measuring, monitoring, and intervention. It is the second edition of the report reflecting paid services data through March 2012.* The report provides data measuring the adequacy of the Medicaid provider network and level of provider availability, utilization of healthcare by Medicaid beneficiaries over a five year period, as well as consumer perceptions of their ability to access care. New Hampshire engages Medicaid beneficiaries through its consumer hotline as well as through its Medical Care Advisory Committee and stakeholder meetings. Taken together, this data and analysis show that New Hampshire Medicaid beneficiaries have access to healthcare that is similar to that of the general population in New Hampshire. The data and analysis also demonstrate that New Hampshire Medicaid beneficiaries have maintained similar levels of access since the implementation of the 2008 rate changes and the 2011 Disproportionate Share Hospital (DSH) payment changes.
This report focuses on beneficiaries’ access to hospital, physician, clinical care, and new in this report, behavioral health services, but not on the full range of New Hampshire Medicaid‐covered health care services. For example, data concerning New Hampshire Medicaid beneficiaries’ access to long term care services are not addressed in this report and will be the subject of future evaluations.
New Hampshire Medicaid provides coverage for low‐income children, pregnant women, parents with children, elders, and people with disabilities. The New Hampshire Department of Health and Human Services (DHHS) is the single State agency that administers the New Hampshire Medicaid program. New Hampshire Medicaid covered all or part of the health care costs of more than 171,000 people during State Fiscal Year 2011 (July 1, 2010 through June 30, 2011) for a total expenditure of $1.4 Billion.
New Hampshire measures and monitors indicators of healthcare access to ensure sufficient Medicaid beneficiary access to covered services. Pursuant to 42 U.S.C. 1396a(a)(30)(A), New Hampshire’s Medicaid program must provide for methods and procedures relative to the utilization of and payment for covered care and services as are necessary to safeguard against unnecessary utilization of care and services and assure that payments are consistent with efficiency, economy, and quality of care. New Hampshire must also ensure that payments are sufficient to enlist enough providers to provide care and services to Medicaid beneficiaries at least to the extent that such care and services are available to the general population in the geographic region. New Hampshire takes these obligations seriously and has developed several mechanisms to assess and monitor beneficiary access.
No common standards exist to demonstrate appropriate healthcare access for Medicaid beneficiaries. The Medicaid and Children’s Health Insurance Program Payment and Access Commission (MACPAC) does provide guidance, however, on the issue of access in its March 2011 Report to the Congress. MACPAC suggests a framework for examining healthcare access for Medicaid and CHIP beneficiaries.
* See: http://www.dhhs.nh.gov/ombp/documents/06222012medicaidaccessmonitoringjune.pdf
MNeOf
ONITORING ACCESSew Hampshire Depffice of Medicaid B
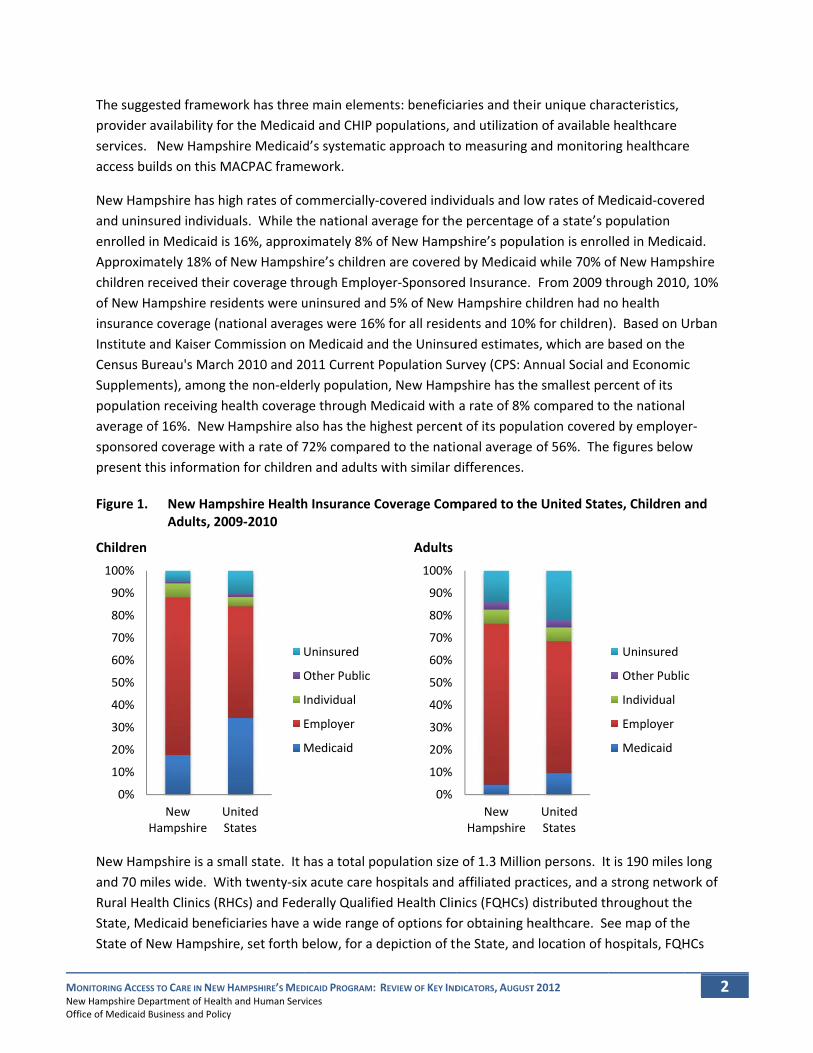
The suggeprovider aservices. access bu
New Hamand uninsenrolled iApproximchildren rof New HainsuranceInstitute aCensus BuSupplemepopulatioaverage osponsoredpresent th
Figure 1.
Children
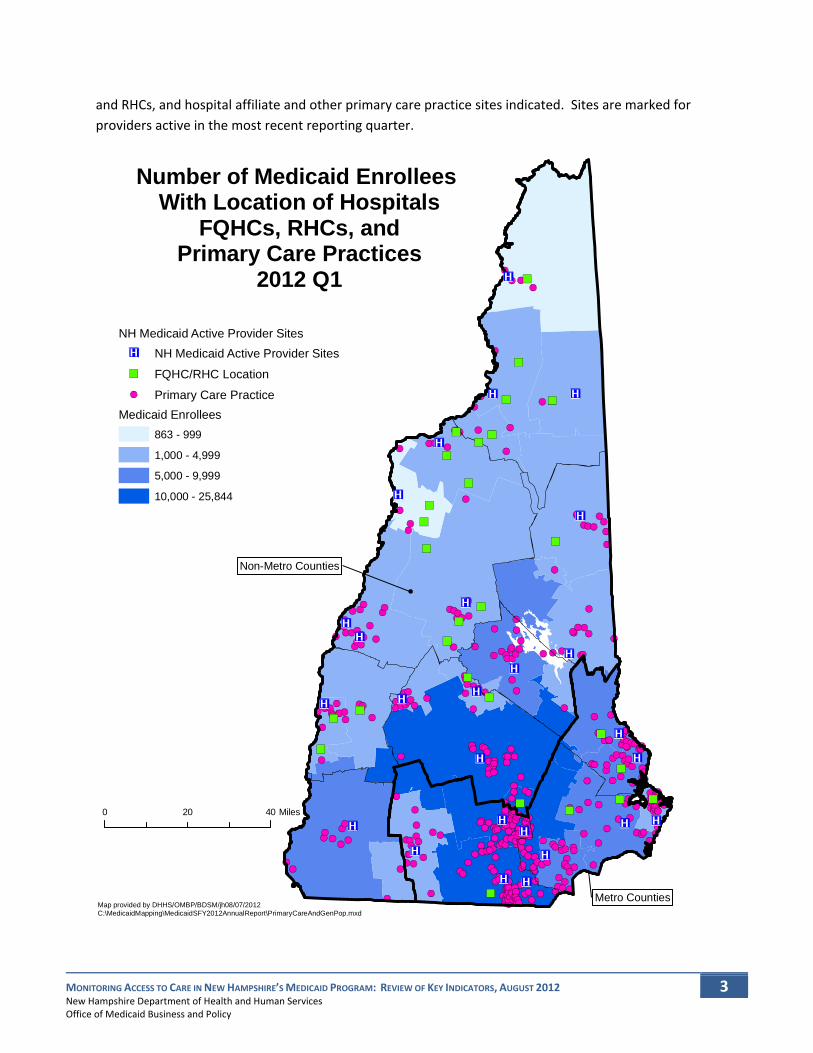
New Hamand 70 mRural HeaState, MeState of N
0%
10%
20%
30%
40%
50%
60%
70%
80%
90%
100%
H
S TO CARE IN NEW Hpartment of HealthBusiness and Policy
ested framewavailability fo New Hampsilds on this M
mpshire has hisured individun Medicaid is
mately 18% of received theirampshire rese coverage (naand Kaiser Coureau's Marchents), among on receiving hof 16%. New d coverage whis informatio
New HampAdults, 20
mpshire is a smiles wide. Wialth Clinics (RHedicaid benefiNew Hampshi
NewHampshire
US
HAMPSHIRE’S MEDh and Human Servy
work has threer the Medicahire Medicaid
MACPAC fram
gh rates of couals. While ths 16%, approxNew Hampshr coverage thridents were uational averagommission onh 2010 and 20the non‐eldeealth coveragHampshire al
with a rate of 7on for childre
pshire Health09‐2010
mall state. It ith twenty‐sixHCs) and Fedeiciaries have are, set forth b
UnitedStates
O
DICAID PROGRAM: vices
e main elemeid and CHIP pd’s systematiework.
ommercially‐che national avximately 8% ohire’s childrenrough Employuninsured andges were 16% Medicaid an011 Current Perly populatioge through Mlso has the hi72% comparen and adults
h Insurance C
has a total pox acute care herally Qualifiea wide rangebelow, for a d
Uninsured
Other Public
Individual
Employer
Medicaid
REVIEW OF KEY IND
ents: beneficiapopulations, ac approach to
covered indivverage for theof New Hampn are coveredyer‐Sponsored 5% of New % for all residend the UninsuPopulation Sun, New Hamp
Medicaid with ghest percened to the natiwith similar d
Coverage Com
Adults
opulation sizehospitals and ed Health Clinof options fodepiction of t
0%
10%
20%
30%
40%
50%
60%
70%
80%
90%
100%
DICATORS, AUGUST
aries and theand utilizationo measuring a
viduals and loe percentagepshire’s populd by Medicaided Insurance. Hampshire cents and 10%ured estimateurvey (CPS: Apshire has thea rate of 8%
nt of its populonal averagedifferences.
mpared to the
e of 1.3 Millioaffiliated pranics (FQHCs) or obtaining hhe State, and
NewHampshire
T 2012
ir unique chan of availableand monitori
ow rates of Me of a state’s plation is enrod while 70% o From 2009 thildren had n% for childrenes, which are nnual Social ae smallest pecompared toation covered of 56%. The
e United Stat
on persons. Itactices, and a distributed thhealthcare. Sed location of h
UnitedStates
aracteristics, e healthcare ng healthcare
Medicaid‐covepopulation lled in Medicof New Hampthrough 2010no health ). Based on Ubased on theand Economircent of its o the nationald by employee figures below
tes, Children
t is 190 miles strong netwohroughout thee map of thehospitals, FQH
Uninsured
Other Public
Individual
Employer
Medicaid
2
e
red
aid. pshire 0, 10%
Urban c
er‐ w
and
long ork of e e HCs
c
MONITORING ACCESS TO CARE IN NEW HAMPSHIRE’S MEDICAID PROGRAM: REVIEW OF KEY INDICATORS, AUGUST 2012 New Hampshire Department of Health and Human Services Office of Medicaid Business and Policy
3
and RHCs, and hospital affiliate and other primary care practice sites indicated. Sites are marked for providers active in the most recent reporting quarter.
Metro Counties
Number of Medicaid Enrollees With Location of Hospitals
FQHCs, RHCs, andPrimary Care Practices
2012 Q1
0 4020 Miles
Non-Metro Counties
Map provided by DHHS/OMBP/BDSM/jh08/07/2012C:\MedicaidMapping\MedicaidSFY2012AnnualReport\PrimaryCareAndGenPop.mxd
NH Medicaid Active Provider SitesNH Medicaid Active Provider Sites
FQHC/RHC Location
Primary Care PracticeMedicaid Enrollees
863 - 999
1,000 - 4,999
5,000 - 9,999
10,000 - 25,844

MONITORING ACCESS TO CARE IN NEW HAMPSHIRE’S MEDICAID PROGRAM: REVIEW OF KEY INDICATORS, AUGUST 2012 New Hampshire Department of Health and Human Services Office of Medicaid Business and Policy
4
For reference, the map below depicts the distribution of New Hampshire’s general population under age 65 (the predominant population where Medicaid is the primary payer for care). As can be seen, the general population (based on Claritas estimates) is distributed very similarly to the Medicaid population.
Map provided by DHHS/DCBCS/BBH/jh03/15/2012C:\MedicaidMapping\MedicaidSFY2011AnnualReport\PrimaryCare.mxd
General Population Age 0 to 642011
Metro and Non-Metro Counties
Health Analysis Area Population
4,393 - 24,999
25,000 - 49,999
50,000 - 99,999
100,000 - 193,510
Non-Metro Counties
Metro Counties
MONITORING ACCESS TO CARE IN NEW HAMPSHIRE’S MEDICAID PROGRAM: REVIEW OF KEY INDICATORS, AUGUST 2012 New Hampshire Department of Health and Human Services Office of Medicaid Business and Policy
5
In this report, New Hampshire Medicaid examines Medicaid beneficiary access to physician and clinic healthcare services by documenting data and trends in three distinct areas: 1) provider and clinic availability, and 2) utilization of healthcare services by Medicaid beneficiaries, and 3) beneficiary needs. The data and analysis set forth in Chapter Three of this report establish the historical and current access levels for these focal areas through analysis of trends from 2007 through 2011 and includes control charts and statistical tests. New Hampshire Medicaid uses this analysis to systematically evaluate and monitor New Hampshire Medicaid beneficiaries’ access to health care, as well as to provide for an early warning system for access disruptions. Evidence of ongoing beneficiary engagement is included and evaluated as well. Systematic, data‐driven access monitoring plans, based on key indicators chosen to evaluate access, as well as planned procedures for corrective action should access problems arise, form the basis of New Hampshire Medicaid’s access measuring and monitoring framework.

MONITORING ACCESS TO CARE IN NEW HAMPSHIRE’S MEDICAID PROGRAM: REVIEW OF KEY INDICATORS, AUGUST 2012 New Hampshire Department of Health and Human Services Office of Medicaid Business and Policy
6
2. Methodology
Information published by MACPAC was used as the primary source of material for developing New Hampshire Medicaid’s framework for evaluating healthcare access. New Hampshire Medicaid’s analysis of healthcare access follows MACPAC’s recommended three‐pronged approach: beneficiary characteristics, provider capacity, and service utilization rates. In addition, New Hampshire adds a forth prong: beneficiary assistance and satisfaction.
First, New Hampshire Medicaid evaluated the unique characteristics of New Hampshire Medicaid beneficiaries. Using retrospective data analysis, New Hampshire Medicaid documented the size of the Medicaid population, demographics, enrollment data, trends in enrollment, and geographic dispersion. This was performed to provide a clear picture of the population, their healthcare needs, and the context for evaluating New Hampshire Medicaid’s network of providers.
The second prong of New Hampshire Medicaid analysis focuses on evaluating the adequacy of the New Hampshire Medicaid provider network. Evaluating provider network capacity entails determining whether the number of providers, i.e. physicians, physician groups, clinics, and hospital emergency departments afford sufficient capacity for the Medicaid patient load in New Hampshire. New Hampshire Medicaid used provider enrollment and enrollment trends to evaluate physician and provider adequacy in New Hampshire.
The third prong of New Hampshire’s access evaluation framework is an analysis of healthcare service utilization data and trends. Service utilization by Medicaid beneficiaries represents realized access. Realized access refers to how New Hampshire Medicaid beneficiaries are actually using available healthcare services. New Hampshire focuses on utilization statistics by age, geography, and eligibility group. New Hampshire Medicaid examines how patterns of healthcare service use differs among eligibility groups, age groups, and geographic regions; how healthcare service venue has changed; and how healthcare service use trends have changed over time, particularly over the period of time before and after New Hampshire reduced reimbursement rates paid to non‐critical care hospitals and made other changes to hospital payment arrangements, including DSH. New Hampshire Medicaid extracted data for the period of 2007 through 2011. Data on healthcare service utilization was interpreted generally by comparing New Hampshire Medicaid utilization over time.
New Hampshire Medicaid compiled eligibility and administrative claims data for five years of FFS paid claims reflecting services used by Medicaid beneficiaries. New Hampshire Medicaid compiled service utilization statistics for physicians, for APRNs, for FQHCs and RHCs. These provider utilization rates were calculated per 1,000 Medicaid beneficiaries.
Data Sources Membership, utilization, and active provider reports are based on data extracted from the New Hampshire’s Medicaid Management Information System (MMIS), the state’s Medicaid claims processing

MONITORING ACCESS TO CARE IN NEW HAMPSHIRE’S MEDICAID PROGRAM: REVIEW OF KEY INDICATORS, AUGUST 2012 New Hampshire Department of Health and Human Services Office of Medicaid Business and Policy
7
system. Inherent in this data are differences in coding practices across providers, which potentially affect results and contribute to observed differences. Client Services Call Center data is based on data extracted from the Call Center’s call tracking database.
Population Included in Trend Data The populations included in the member and utilization trend data are those beneficiaries for whom New Hampshire Medicaid provides the only known sole source of general health care coverage. Beneficiaries with Medicare or other health coverage are excluded because for these groups New Hampshire Medicaid only plays a secondary role in providing general health coverage and as a result does not have complete claims data. Reports on an annual timespan (or in the case of the well‐baby visit measure, the first fifteen months of life) only include those beneficiaries continuously enrolled during the period, with no more than a one month gap to allow for consistency with national measure specification standards.
Service Date Periods and Claims Run-out All utilization reports are based on date of service for time periods, either calendar years or calendar year quarters. In order to provide a consistent basis for comparing reports over time, it was necessary to also provide consistent claims run‐out for each reporting period. Quarterly measures are based on three months of claims run‐out (e.g., where the service period being reported covers January to March 2012, the report will include all claims paid through June 30, 2012). While some additional claims will be paid after that service date, by keeping the restriction consistent from period‐to‐period the trend will not be impacted. Annual measures are based on a longer run‐out period of six months to make them more comparable to national benchmarks that are generally based on the same period (six months ensures greater than 99% of claims have been processed).
Geographic Grouping Beneficiaries are subdivided geographically based on their county of residence. New Hampshire is divided into those counties that are Metropolitan and those that are Non‐Metropolitan based on USDA rural/urban continuum codes. Metropolitan counties are Hillsborough, Rockingham, and Strafford and the Non‐Metropolitan counties are Belknap, Carroll, Cheshire, Coos, Grafton, Merrimack, and Sullivan. The counties in both groupings are contiguous, with the Metropolitan area counties located in the south‐eastern part of the state. As of 2012, the Metropolitan area includes 57% of beneficiaries that have an in‐state address. A small number of beneficiaries with out‐of‐state address are excluded from the geographic groupings, but included in other reporting. Outlines of the two areas are included in the map on page 3.
Age and Eligibility Grouping Beneficiaries are subdivided based on their age and aid category of assistance during each month of a quarter or for annual data, the last date of the reporting period. Data for most trends is reported using the following groupings (age and aid categories used in parenthesis):
• Children (age less than 19): - Blind and Disabled (Aid to Needy Blind and Home Care for Children with Severe Disabilities), - Families and Children (TANF and Poverty Level Children), and

MONITORING ACCESS TO CARE IN NEW HAMPSHIRE’S MEDICAID PROGRAM: REVIEW OF KEY INDICATORS, AUGUST 2012 New Hampshire Department of Health and Human Services Office of Medicaid Business and Policy
8
- Foster Care (Foster Care and Adoption Subsidy).
• Adults (age 19 and older): - Aged (Old Age Assistance), - Blind and Disabled (Aid to Needy Blind, Aid to Permanently and Totally Disabled, Medicaid
for Employed Adults with Disabilities), and - Families and Children (TANF and Poverty Level Pregnant Women).
Data for well‐child visit measures use the age groupings as specified by the National Committee for Quality Assurance (NCQA). Data for the measure that examines what percent of children during the year had a preventive or other ambulatory health service is designed to look at how this measure varies by refined age breakdowns of children (less than age 1, age 1, age 2, age 3 to 4, age 5 to 9, age 10 to 14, age 15 to 17, and age 18 to 20).
Control Limits Control limits are employed in quarterly trend charts to provide a consistent indication of a potential access problem as each new quarter of data is available. Control limits are set as three standard deviations (following conventional practice*) from the mean based on Quarter 1 2007 to Quarter 3 2011 data. The control limits are fixed using the prior period because the principal time period analyzed in this report are the final Quarter of 2011 and forward and including these more recent time periods in the control limit calculation could mask an adverse result. Future updates to this report will maintain the same control limits until such time that a rebasing is needed in response to shifts in health care delivery, the health of the population, or changes in available data.
Depending on the measure, a rate for a time period below the lower control limit or above the upper limit is the trigger indicating a potential access problem requiring further investigation. Additionally, a persistent trend above or below the mean line would warrant further research.
Confidence Intervals For charts based on annual data, control limits are not presented (annual data does not provide enough experience for meaningful limits). Instead, 95% confidence intervals are presented. The confidence interval takes into account random variability in the data to allow for comparison of rates over time. The 95% confidence interval is the range of values that, with 95% certainty includes the underlying rate for the entire population. As the number of beneficiaries represented in the rate increase, the confidence intervals become narrower.
The 95% confidence interval is computed using the following formulas:
Lower limit = p – [1.96 x (p*q/B)]
Upper limit = p + [1.96 x (p*q/B)]
Where b = denominator; p = percent divided by 100; and q = 1‐ p
* E.g., http://www.qualitydigest.com/aug/wheeler.html, http://www.isixsigma.com/dictionary/control‐limits/

MONITORING ACCESS TO CARE IN NEW HAMPSHIRE’S MEDICAID PROGRAM: REVIEW OF KEY INDICATORS, AUGUST 2012 New Hampshire Department of Health and Human Services Office of Medicaid Business and Policy
9
If the current period of data deviates to such a degree that its confidence interval does not overlap with the prior period’s confidence interval it will indicate a potential access problem requiring further investigation. Additionally, if a slowly declining trend is observed and the current period’s confidence interval does not overlap with any of the previous three confidence intervals it will indicate a potential access problem requiring further investigation.
Small Numbers Because New Hampshire is a small State, it is necessary to take into account the volume of data available for reporting. For some combinations of age and eligibility, the volume of data is too small to allow for meaningful reporting. Rates based on smaller numbers are more volatile due to random variation. To account for this volatility, control limits and confidence intervals must be wider, rendering them less meaningful.
Major Reimbursement Changes Four New Hampshire Legislative changes in Medicaid payment levels in recent years are relevant to this report’s access measures and trend analyses: inpatient and outpatient hospital services rate reductions and Disproportionate Share Hospital (DSH) methodology and payment restructuring. In December 2008, DHHS reduced Medicaid reimbursement rates paid to New Hampshire’s 13 non‐critical access hospitals for outpatient services by approximately 33%. New Hampshire reduced Medicaid inpatient reimbursement rates for non‐critical access hospitals by 10% effective December 1, 2008. New Hampshire Medicaid DSH program methodology was revised in December 2010 to pay higher rates of reimbursement for the uncompensated care costs of critical access hospitals, while still making a DSH payment to all but one psychiatric hospital in the State. In December 2011, DSH qualifying criteria were restructured to make payments available almost exclusively to critical access and “deemed DSH” hospitals, and the total amount of funding for DSH payments statewide was reduced. The potential impacts of these changes are considered in this report from the standpoint of healthcare access and access trend analysis by representing the changes on quarterly utilization trend charts.
Description of Change Implementation Date Outpatient Rate Reductions for 13 acute care non‐critical access hospitals
December 2008
Inpatient Rate Reductions for 13 acute care non‐critical access hospitals
December 2008
Revision of DSH Methodology December 2010Reduction in total DSH Funding December 2011

MONITORING ACCESS TO CARE IN NEW HAMPSHIRE’S MEDICAID PROGRAM: REVIEW OF KEY INDICATORS, AUGUST 2012 New Hampshire Department of Health and Human Services Office of Medicaid Business and Policy
10
3. Data and Analysis
The sections in this chapter present New Hampshire Medicaid trend information on areas related to access to health care services. The trend data is divided into the following sections:
• New Hampshire Medicaid Beneficiaries, • Availability of Provider Network, • Utilization of Services, and • Beneficiary Assistance and Satisfaction.
Data throughout is presented as five‐year trends. Depending on the measure, information is presented quarterly or annually. Annual measures are restricted to those where the national standard definition is annual, typically to account for services that are expected take place a certain number of times over an annual period (e.g., well child visits). To maintain the clarity of the charts, as new periods of data are available, the oldest period of history will be rolled off the reports.
Accompanying the data are indications of the major payment changes impacting the health system being analyzed.
Beyond presenting the data in a visual form, the charts also include analytic tools that provide a defined trigger indicating a potential access problem requiring further research. Quarterly data are presented along with control limits and annual data (where the data is insufficient to support control limits) with confidence intervals. Correlations between the payment changes and the trend data that appear to exist will help inform any further research needed. New to this report are two behavioral health measures based on HEDIS specifications.
The focus of the data presented is general medical physician/APRN/group/clinic, hospital, and behavioral health services.
New Hampshire Medicaid Beneficiaries
Overview of New Hampshire Medicaid Beneficiaries New Hampshire Medicaid program Beneficiaries are made up of the following mandatory and optional eligibility categories listed in below.

MONITORING ACCESS TO CARE IN NEW HAMPSHIRE’S MEDICAID PROGRAM: REVIEW OF KEY INDICATORS, AUGUST 2012 New Hampshire Department of Health and Human Services Office of Medicaid Business and Policy
11
Mandatory Eligibility Groups*
• Low‐income Medicare beneficiaries • Individuals who would qualify for Temporary Assistance to Needy Families (TANF) today under the
state’s 1996 AFDC eligibility requirements† • Children under age six and pregnant women with family income at or below 133% of federal
poverty level (FPL) guidelines • Children born after September 30, 1983, who are at least age five and live in families with income
up to the FPL • Infants born to Medicaid‐enrolled pregnant women • Children who receive adoption assistance or who live in foster care, under a federally‐sponsored
Title IV‐E program • Low‐income aged, blind, and disabled receiving State supplemental assistance Optional Eligibility Groups‡ • Children and pregnant women up to 185% of the FPL, and infants up to 300% of the FPL (in the
process of being expanded to 300% of the FPL for all children by conversion of New Hampshire’s separate CHIP program to a Medicaid expansion program).
• Individuals determined to be “medically needy” due to large medical expenses§ • Home Care for Children with Severe Disabilities (HC‐CSD), commonly known as “Katie Beckett”; for
severely disabled children up to age 19 whose medical disability qualifies them for institutional care but are cared for at home
• Medicaid for Employed Adults with Disabilities (MEAD) allows Medicaid‐eligible disabled individuals between the ages of 18 and 64 who want to save money or work to increase their earnings while maintaining Medicaid coverage (up to 450% FPL)
New Hampshire Medicaid beneficiaries tend to have a higher burden of illness than privately insured individuals. They are twice as likely to have asthma, coronary artery disease, hypertension, depression, and mental health disorders (particularly children); they are three to four times more likely to suffer from a stroke or Chronic Obstructive Pulmonary Disease or to use hospital emergency rooms; and five times as likely to have lung cancer or heart failure (New Hampshire Medicaid Annual Report, 2011).
The two figures below show the distribution of beneficiaries by age, eligibility group, and gender as of June 2011. * In 1974, New Hampshire, like over thirty other states at the time, elected for the “209(b)” status provided in the federal law that created the Supplemental Security Income (SSI) program (the federal income assistance program for disabled, blind, or aged individuals). When creating the SSI program, Congress hoped that SSI beneficiaries would also receive Medicaid. However, Congress was mindful of the increased expense for states to automatically cover all SSI beneficiaries. To provide states some financial flexibility, the 209(b) option was crafted which allowed a state to be more restrictive in its Medicaid eligibility than the SSI program eligibility guidelines, so long as those methodologies were no more restrictive than methodologies in place on January 1, 1972. Accordingly, New Hampshire does not automatically grant Medicaid to SSI beneficiaries. SSI beneficiaries who desire Medicaid must qualify for a state defined category of assistance. † In 1996, federal policymakers severed the tie between medical and cash assistance when the AFDC program was replaced. The AFDC standard was retained in Title XIX to prevent the states from using the more restrictive eligibility requirements and time limits of AFDC’s successor–Temporary Assistance for Needy Families or TANF–when providing Medicaid coverage to needy children and families. ‡ The ACA extended ARRA eligibility maintenance of effort (MOE) requirements for adults until 2014 and for children until 2019. § While Medically Needy is an optional category, as a 209(b) State, if New Hampshire does not elect to provide medically needy coverage, we must allow adult category individuals whose income exceeds the categorically needy income limit to spend down to the categorically needy income limit. Additionally, once a State opts to provide medically needy coverage, there are certain groups that must be covered as medically needy (e.g., pregnant women).
MNeOf
ONITORING ACCESSew Hampshire Depffice of Medicaid B
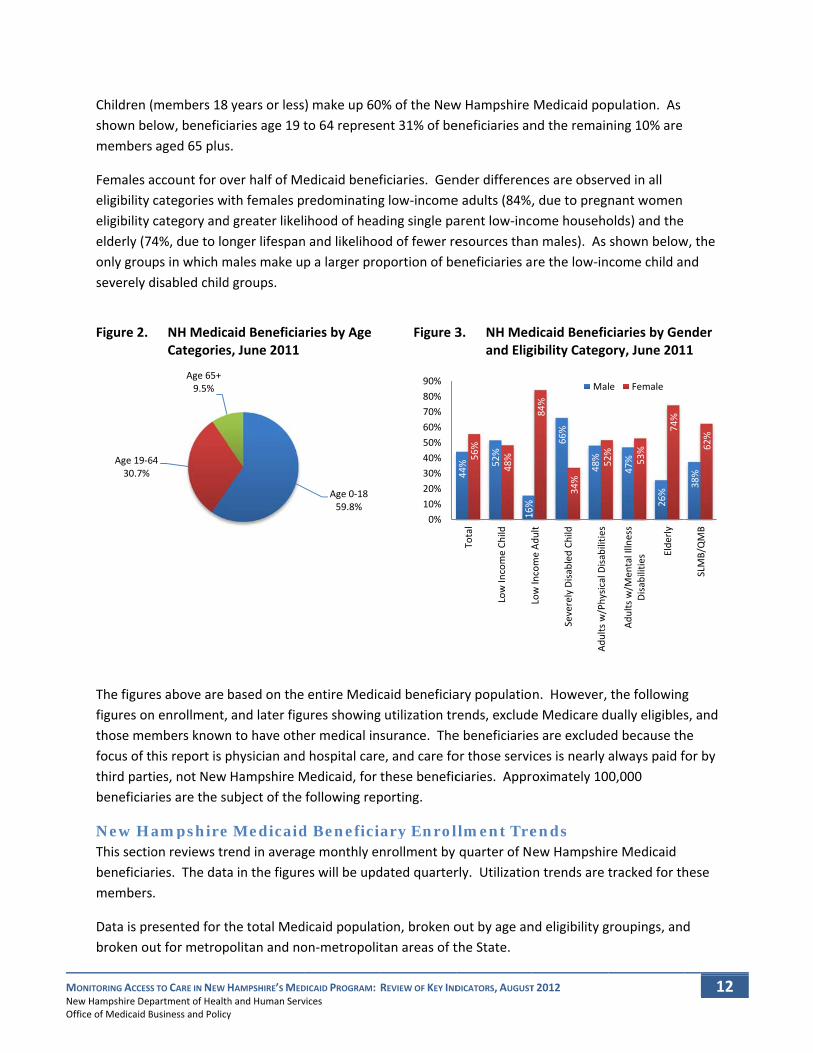
Children (shown bemembers
Females aeligibility eligibility elderly (74only grouseverely d
Figure 2.
The figurefigures onthose mefocus of tthird partbeneficiar
New HaThis sectiobeneficiarmembers
Data is prbroken ou
Age 19‐630.7%
S TO CARE IN NEW Hpartment of HealthBusiness and Policy
(members 18 elow, benefici aged 65 plus
account for ovcategories wcategory and4%, due to lops in which mdisabled child
NH MedicaCategories
es above are n enrollment, mbers knownhis report is pies, not New ries are the su
ampshireon reviews trries. The data.
esented for tut for metrop
64
Age 65+9.5%
HAMPSHIRE’S MEDh and Human Servy
years or lessaries age 19 ts.
ver half of Meith females pd greater likelonger lifespanmales make ud groups.
aid Beneficias, June 2011
based on theand later figun to have othephysician andHampshire Mubject of the
e Medicaidend in averaga in the figure
he total Medpolitan and no
DICAID PROGRAM: vices
) make up 60to 64 represe
edicaid benefredominatingihood of headn and likelihoop a larger pro
ries by Age
entire Medicures showinger medical ind hospital careMedicaid, for following rep
d Beneficige monthly enes will be upd
dicaid populaton‐metropolit
Age 0‐1859.8%
REVIEW OF KEY IND
0% of the Newent 31% of be
ficiaries. Geng low‐incomeding single paod of fewer reoportion of be
Figure 3
caid beneficiag utilization trsurance. Thee, and care fothese beneficporting.
ary Enrolnrollment by dated quarter
tion, broken otan areas of t
0%10%20%30%40%50%60%70%80%90%
DICATORS, AUGUST
w Hampshireeneficiaries an
nder difference adults (84%,arent low‐incesources thaneneficiaries a
3. NH Medand Elig
ary populatiorends, excludee beneficiarieor those serviciaries. Appr
llment Trequarter of Nrly. Utilizatio
out by age anthe State.
44% 52
%
16%
56%
48%
Total
Low Income Ch
ild
LI
Adlt
T 2012
Medicaid popnd the remain
ces are obser, due to pregnome househon males). As re the low‐in
dicaid Beneficgibility Catego
n. However, e Medicare des are excludeces is nearly oximately 10
ends ew Hampshirn trends are t
nd eligibility g
16%
66%
48%
84%
34%
52%
Low Income Ad
ult
Severely Disabled Ch
ild
Adults w/Physic
al Disa
bilities
Mal
pulation. As ning 10% are
rved in all nant women olds) and the shown belowcome child a
ciaries by Geory, June 201
the followingually eligiblesed because thalways paid f0,000
re Medicaid tracked for th
groupings, and
47%
26%
52%
53%
74%
Adults w/M
ental Illness
Disabilities Elde
rly
le Female
12
w, the nd
nder 11
g s, and he for by
hese
d
38%
62%
SLMB/QMB

MONITORING ACCESS TO CARE IN NEW HAMPSHIRE’S MEDICAID PROGRAM: REVIEW OF KEY INDICATORS, AUGUST 2012 New Hampshire Department of Health and Human Services Office of Medicaid Business and Policy
13
The figures show a very gradual rise in enrollment in 2007 and 2008, followed by more rapid increase in 2009 due to the recession, with a slight rise thereafter. In 2011, there was a less than 1% increase in total enrollment.
As the largest group by far, enrollment for the Families and Children eligibility groups was similar to the total. However, the adults in this group have seen a decrease in enrollment throughout 2011.
Figure 4. NH Medicaid Enrollment, CY 2007‐2012: Total Population Note: excludes Medicare dually eligibles and members with other medical insurance
83,462
100,426
0
20,000
40,000
60,000
80,000
100,000
120,000
2007QTR 2
2007QTR 3
2007QTR 4
2008QTR 1
2008QTR 2
2008QTR 3
2008QTR 4
2009QTR 1
2009QTR 2
2009QTR 3
2009QTR 4
2010QTR 1
2010QTR 2
2010QTR 3
2010QTR 4
2011QTR 1
2011QTR 2
2011QTR 3
2011QTR 4
2012QTR 1
Average Members

MONITORING ACCESS TO CARE IN NEW HAMPSHIRE’S MEDICAID PROGRAM: REVIEW OF KEY INDICATORS, AUGUST 2012 New Hampshire Department of Health and Human Services Office of Medicaid Business and Policy
14
Figure 5. NH Medicaid Enrollment, CY 2007‐2012: Child, Families and Children Eligibility Group Note: excludes Medicare dually eligibles and members with other medical insurance
Figure 6. NH Medicaid Enrollment, CY 2007‐2012: Child Foster Care and Blind and Disabled Population Note: excludes Medicare dually eligibles and members with other medical insurance
60,522
73,433
0
10,000
20,000
30,000
40,000
50,000
60,000
70,000
80,000
2007QTR 2
2007QTR 3
2007QTR 4
2008QTR 1
2008QTR 2
2008QTR 3
2008QTR 4
2009QTR 1
2009QTR 2
2009QTR 3
2009QTR 4
2010QTR 1
2010QTR 2
2010QTR 3
2010QTR 4
2011QTR 1
2011QTR 2
2011QTR 3
2011QTR 4
2012QTR 1
Families and Children
526612
1,981
1,679
0
500
1,000
1,500
2,000
2,500
2007QTR 2
2007QTR 3
2007QTR 4
2008QTR 1
2008QTR 2
2008QTR 3
2008QTR 4
2009QTR 1
2009QTR 2
2009QTR 3
2009QTR 4
2010QTR 1
2010QTR 2
2010QTR 3
2010QTR 4
2011QTR 1
2011QTR 2
2011QTR 3
2011QTR 4
2012QTR 1
Blind and Disabled Foster Care

MONITORING ACCESS TO CARE IN NEW HAMPSHIRE’S MEDICAID PROGRAM: REVIEW OF KEY INDICATORS, AUGUST 2012 New Hampshire Department of Health and Human Services Office of Medicaid Business and Policy
15
Figure 7. NH Medicaid Enrollment, CY 2007‐2012: Adult Population by Eligibility Group Note: excludes Medicare dually eligibles and members with other medical insurance
Figure 8. NH Medicaid Enrollment, CY 2007‐2012: Metropolitan and Non‐Metropolitan Counties Note: excludes Medicare dually eligibles and members with other medical insurance
668 910
7,238
9,918
12,528
13,873
0
2,000
4,000
6,000
8,000
10,000
12,000
14,000
16,000
2007QTR 2
2007QTR 3
2007QTR 4
2008QTR 1
2008QTR 2
2008QTR 3
2008QTR 4
2009QTR 1
2009QTR 2
2009QTR 3
2009QTR 4
2010QTR 1
2010QTR 2
2010QTR 3
2010QTR 4
2011QTR 1
2011QTR 2
2011QTR 3
2011QTR 4
2012QTR 1
Aged Blind and Disabled Families and Children
45,484
56,684
35,459
42,768
0
10,000
20,000
30,000
40,000
50,000
60,000
2007QTR 2
2007QTR 3
2007QTR 4
2008QTR 1
2008QTR 2
2008QTR 3
2008QTR 4
2009QTR 1
2009QTR 2
2009QTR 3
2009QTR 4
2010QTR 1
2010QTR 2
2010QTR 3
2010QTR 4
2011QTR 1
2011QTR 2
2011QTR 3
2011QTR 4
2012QTR 1
Metro Counties Non Metro Counties
MNeOf
ONITORING ACCESSew Hampshire Depffice of Medicaid B
ProvidThe provibeneficiarof benefic
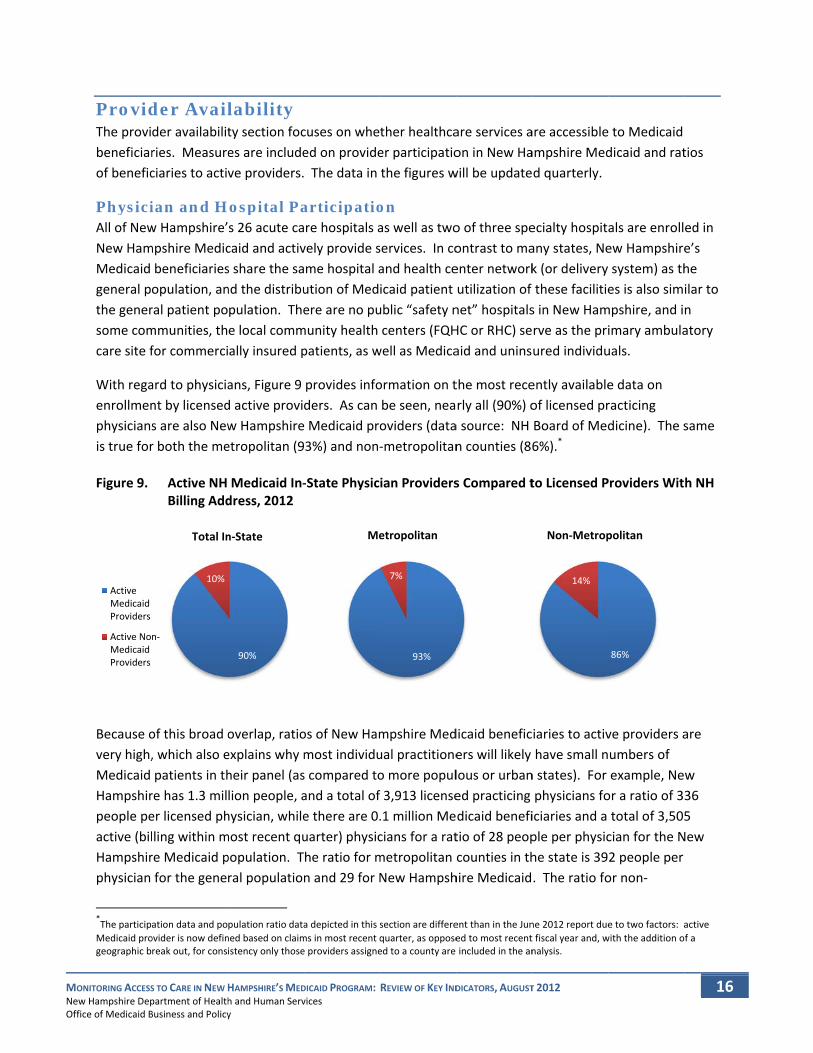
PhysiciAll of NewNew HamMedicaid general pthe genersome comcare site f
With regaenrollmenphysiciansis true for
Figure 9.
Because overy high,Medicaid Hampshirpeople peactive (bilHampshirphysician
*The participaMedicaid progeographic b
ActiveMedicaidProviders
Active NoMedicaidProviders
S TO CARE IN NEW Hpartment of HealthBusiness and Policy
der Availder availabilitries. Measureciaries to activ
ian and Hw Hampshire’mpshire Medicbeneficiariesopulation, anral patient pommunities, thfor commerci
ard to physiciant by licenseds are also Newr both the me
Active NH Billing Add
of this broad o, which also epatients in thre has 1.3 miler licensed phling within mre Medicaid pfor the gene
ation data and poovider is now definreak out, for cons
10%
Total In
n‐
HAMPSHIRE’S MEDh and Human Servy
lability ty section foces are includeve providers.
Hospital Pas 26 acute cacaid and activs share the sand the distribupulation. Thee local commally insured p
ans, Figure 9 d active providw Hampshireetropolitan (9
Medicaid In‐dress, 2012
overlap, ratioexplains why mheir panel (aslion people, ahysician, whilemost recent qupopulation. Tral population
pulation ratio dataned based on claimistency only those
90%
n‐State
DICAID PROGRAM: vices
cuses on wheted on provide The data in
articipatiore hospitals avely provide sme hospital aution of Medere are no pu
munity health patients, as w
provides infoders. As can Medicaid pro3%) and non‐
‐State Physic
os of New Hammost individus compared toand a total of e there are 0.uarter) physiche ratio for mn and 29 for N
a depicted in this sms in most recent qe providers assigne
Me
REVIEW OF KEY IND
ther healthcaer participatiothe figures w
on as well as twoservices. In coand health ceicaid patient ublic “safety ncenters (FQH
well as Medica
ormation on tbe seen, neaoviders (data‐metropolitan
ian Providers
mpshire Medual practitioneo more popul3,913 license.1 million Mecians for a ratmetropolitan New Hampsh
section are differequarter, as opposeed to a county are
93%
7%
etropolitan
DICATORS, AUGUST
are services aon in New Hawill be update
o of three speontrast to maenter networkutilization of net” hospitalsHC or RHC) seaid and unins
the most recerly all (90%) oa source: NH n counties (86
s Compared t
dicaid beneficers will likely lous or urbaned practicing dicaid benefitio of 28 peopcounties in thhire Medicaid
ent than in the Juned to most recentincluded in the an
T 2012
are accessibleampshire Medd quarterly.
ecialty hospitaany states, Nek (or delivery these facilities in New Hamrve as the priured individu
ently availableof licensed prBoard of Med6%).*
to Licensed P
iaries to activhave small n
n states). For physicians foiciaries and a ple per physiche state is 39. The ratio fo
ne 2012 report duet fiscal year and, wnalysis.
14%
Non‐Metrop
to Medicaid dicaid and rat
als are enrollew Hampshiresystem) as thes is also sim
mpshire, and iimary ambulauals.
e data on racticing dicine). The s
Providers Wit
ve providers aumbers of example, Neor a ratio of 3total of 3,505cian for the N2 people per or non‐
e to two factors: awith the addition o
86%
politan
16
tios
ed in e’s he ilar to n atory
same
h NH
are
w 36 5 New
active f a

MONITORING ACCESS TO CARE IN NEW HAMPSHIRE’S MEDICAID PROGRAM: REVIEW OF KEY INDICATORS, AUGUST 2012 New Hampshire Department of Health and Human Services Office of Medicaid Business and Policy
17
metropolitan counties in the state is 272 people per physician for the general population and 27 for New Hampshire Medicaid.
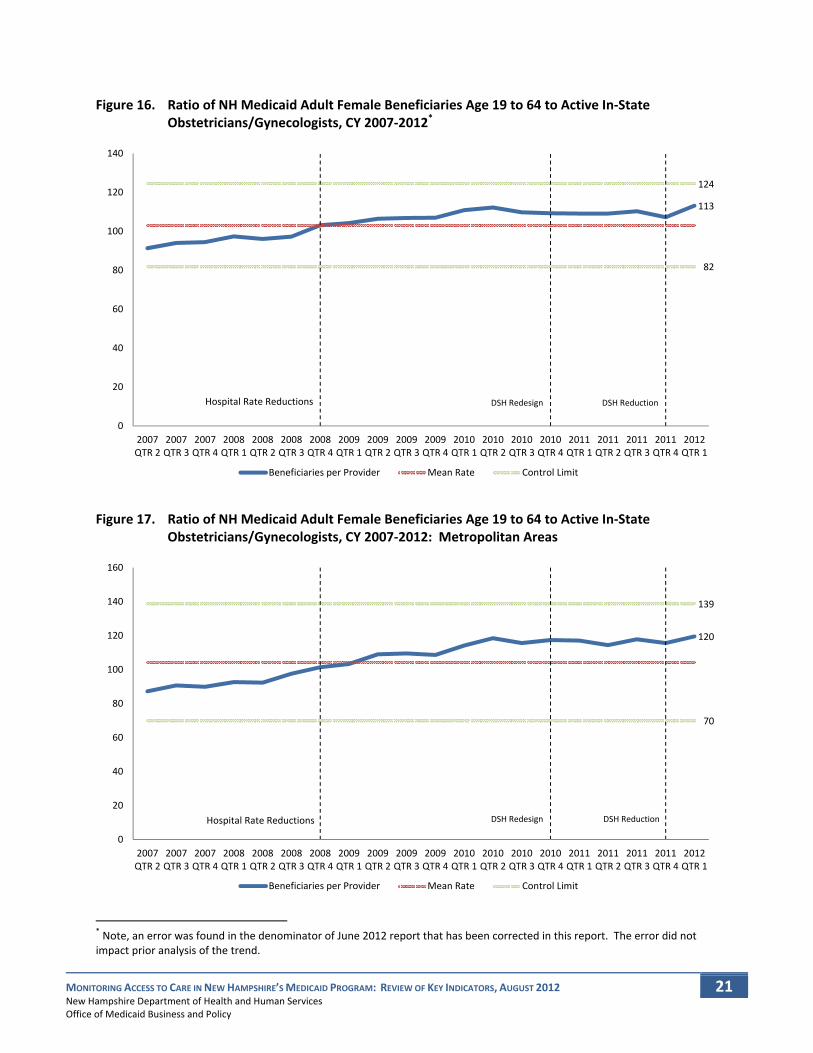
Active Primary Care Providers, Pediatricians, and Obstetricians/Gynecologists The following nine figures show the trend in the ratio of beneficiaries to active providers (those with one claim in the quarter). Three charts each are presented for Primary Care Providers, Pediatricians, and Obstetricians/Gynecologists. For each group of charts the statewide data is presented first followed by two charts subdividing the data by metropolitan and non‐metropolitan areas.
For all charts major New Hampshire Medicaid payment changes are indicated and control limits at the third standard deviation of the historical data are included to provide a trigger indicating a potential access problem requiring further investigation. For the ratios presented, exceeding the upper control limit would indicate a potential problem. Note: the ratios and limits on the charts differ slightly in degree, although not in form, from those presented in the June 2012 report which inadvertently included non‐New Hampshire residents in the denominator of the ratios. The error had no impact on prior analysis of the trends.
The rates shown in all figures do not cross the upper control limit, and therefore do not indicate a potential access problem at this time, nor is there evidence of an impending access problem based on current data. The primary care trend has shown consistent improvements during the past several quarters. The trend in ratios of beneficiaries to pediatricians and obstetricians/gynecologists while stable since 2008, are larger compared to 2007. This change was due entirely to growth in enrollment.
Metropolitan and non‐metropolitan areas when compared show similar trends, an outcome of the trends being driven by increases in member enrollment correlating to the NH unemployment rate. Ratios are similar between the two regions, with ratios slightly lower (better) for metropolitan areas for pediatricians and primary care and lower for obstetricians/gynecologists for non‐metropolitan areas.

MONITORING ACCESS TO CARE IN NEW HAMPSHIRE’S MEDICAID PROGRAM: REVIEW OF KEY INDICATORS, AUGUST 2012 New Hampshire Department of Health and Human Services Office of Medicaid Business and Policy
18
Figure 10. Ratio of NH Medicaid Beneficiaries to Active In‐State Primary Care Providers (Internal Medicine, Family Practice, General Practice, Pediatricians), CY 2007‐2012
Figure 11. Ratio of NH Medicaid Beneficiaries to Active In‐State Primary Care Providers, CY 2007‐2012: Metropolitan Areas
3937
47
Hospital Rate Reductions DSH ReductionDSH Redesign
0
5
10
15
20
25
30
35
40
45
50
2007QTR 2
2007QTR 3
2007QTR 4
2008QTR 1
2008QTR 2
2008QTR 3
2008QTR 4
2009QTR 1
2009QTR 2
2009QTR 3
2009QTR 4
2010QTR 1
2010QTR 2
2010QTR 3
2010QTR 4
2011QTR 1
2011QTR 2
2011QTR 3
2011QTR 4
2012QTR 1
Beneficiaries per Provider Mean Rate Control Limit
3937
43
Hospital Rate Reductions DSH ReductionDSH Redesign
0
5
10
15
20
25
30
35
40
45
2007QTR 2
2007QTR 3
2007QTR 4
2008QTR 1
2008QTR 2
2008QTR 3
2008QTR 4
2009QTR 1
2009QTR 2
2009QTR 3
2009QTR 4
2010QTR 1
2010QTR 2
2010QTR 3
2010QTR 4
2011QTR 1
2011QTR 2
2011QTR 3
2011QTR 4
2012QTR 1
Beneficiaries per Provider Mean Rate Control Limit

MONITORING ACCESS TO CARE IN NEW HAMPSHIRE’S MEDICAID PROGRAM: REVIEW OF KEY INDICATORS, AUGUST 2012 New Hampshire Department of Health and Human Services Office of Medicaid Business and Policy
19
Figure 12. Ratio of NH Medicaid Beneficiaries to Active In‐State Primary Care Providers, CY 2007‐2012: Non‐Metropolitan Areas
Figure 13. Ratio of NH Medicaid Child Beneficiaries to Active In‐State Pediatricians, CY 2007‐2012
41
33
56
Hospital Rate Reductions DSH ReductionDSH Redesign
0
10
20
30
40
50
60
2007QTR 2
2007QTR 3
2007QTR 4
2008QTR 1
2008QTR 2
2008QTR 3
2008QTR 4
2009QTR 1
2009QTR 2
2009QTR 3
2009QTR 4
2010QTR 1
2010QTR 2
2010QTR 3
2010QTR 4
2011QTR 1
2011QTR 2
2011QTR 3
2011QTR 4
2012QTR 1
Beneficiaries per Provider Mean Rate Control Limit
309
277
316
Hospital Rate Reductions DSH ReductionDSH Redesign
0
50
100
150
200
250
300
350
2007QTR 2
2007QTR 3
2007QTR 4
2008QTR 1
2008QTR 2
2008QTR 3
2008QTR 4
2009QTR 1
2009QTR 2
2009QTR 3
2009QTR 4
2010QTR 1
2010QTR 2
2010QTR 3
2010QTR 4
2011QTR 1
2011QTR 2
2011QTR 3
2011QTR 4
2012QTR 1
Beneficiaries per Provider Mean Rate Control Limit

MONITORING ACCESS TO CARE IN NEW HAMPSHIRE’S MEDICAID PROGRAM: REVIEW OF KEY INDICATORS, AUGUST 2012 New Hampshire Department of Health and Human Services Office of Medicaid Business and Policy
20
Figure 14. Ratio of NH Medicaid Child Beneficiaries to Active In‐State Pediatricians, CY 2007‐2012: Metropolitan Areas
Figure 15. Ratio of NH Medicaid Child Beneficiaries to Active In‐State Pediatricians, CY 2007‐2012: Non‐Metropolitan Areas
292
233
312
Hospital Rate Reductions DSH ReductionDSH Redesign
0
50
100
150
200
250
300
350
2007QTR 2
2007QTR 3
2007QTR 4
2008QTR 1
2008QTR 2
2008QTR 3
2008QTR 4
2009QTR 1
2009QTR 2
2009QTR 3
2009QTR 4
2010QTR 1
2010QTR 2
2010QTR 3
2010QTR 4
2011QTR 1
2011QTR 2
2011QTR 3
2011QTR 4
2012QTR 1
Beneficiaries per Provider Mean Rate Control Limit
334
293
378
Hospital Rate Reductions DSH ReductionDSH Redesign
0
50
100
150
200
250
300
350
400
2007QTR 2
2007QTR 3
2007QTR 4
2008QTR 1
2008QTR 2
2008QTR 3
2008QTR 4
2009QTR 1
2009QTR 2
2009QTR 3
2009QTR 4
2010QTR 1
2010QTR 2
2010QTR 3
2010QTR 4
2011QTR 1
2011QTR 2
2011QTR 3
2011QTR 4
2012QTR 1
Beneficiaries per Provider Mean Rate Control Limit
MONITORING ACCESS TO CARE IN NEW HAMPSHIRE’S MEDICAID PROGRAM: REVIEW OF KEY INDICATORS, AUGUST 2012 New Hampshire Department of Health and Human Services Office of Medicaid Business and Policy
21
Figure 16. Ratio of NH Medicaid Adult Female Beneficiaries Age 19 to 64 to Active In‐State Obstetricians/Gynecologists, CY 2007‐2012*
Figure 17. Ratio of NH Medicaid Adult Female Beneficiaries Age 19 to 64 to Active In‐State Obstetricians/Gynecologists, CY 2007‐2012: Metropolitan Areas
* Note, an error was found in the denominator of June 2012 report that has been corrected in this report. The error did not impact prior analysis of the trend.
113
82
124
Hospital Rate Reductions DSH ReductionDSH Redesign
0
20
40
60
80
100
120
140
2007QTR 2
2007QTR 3
2007QTR 4
2008QTR 1
2008QTR 2
2008QTR 3
2008QTR 4
2009QTR 1
2009QTR 2
2009QTR 3
2009QTR 4
2010QTR 1
2010QTR 2
2010QTR 3
2010QTR 4
2011QTR 1
2011QTR 2
2011QTR 3
2011QTR 4
2012QTR 1
Beneficiaries per Provider Mean Rate Control Limit
120
70
139
Hospital Rate Reductions DSH ReductionDSH Redesign
0
20
40
60
80
100
120
140
160
2007QTR 2
2007QTR 3
2007QTR 4
2008QTR 1
2008QTR 2
2008QTR 3
2008QTR 4
2009QTR 1
2009QTR 2
2009QTR 3
2009QTR 4
2010QTR 1
2010QTR 2
2010QTR 3
2010QTR 4
2011QTR 1
2011QTR 2
2011QTR 3
2011QTR 4
2012QTR 1
Beneficiaries per Provider Mean Rate Control Limit
MONITORING ACCESS TO CARE IN NEW HAMPSHIRE’S MEDICAID PROGRAM: REVIEW OF KEY INDICATORS, AUGUST 2012 New Hampshire Department of Health and Human Services Office of Medicaid Business and Policy
22
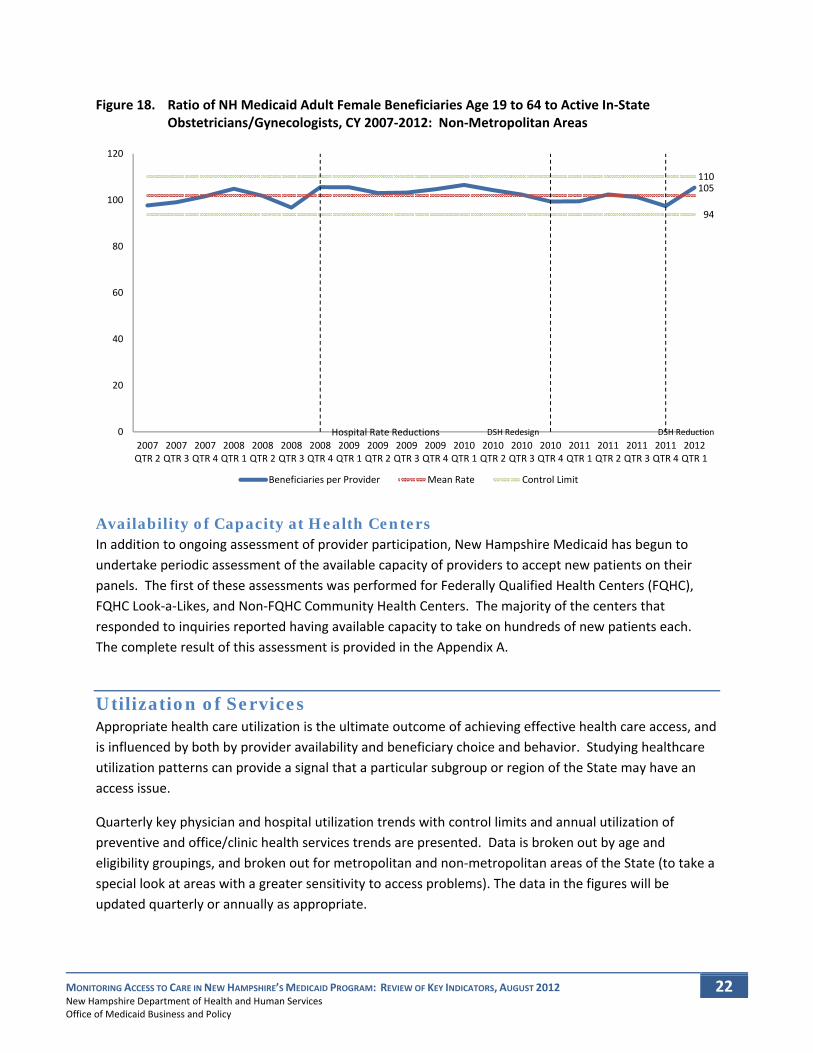
Figure 18. Ratio of NH Medicaid Adult Female Beneficiaries Age 19 to 64 to Active In‐State Obstetricians/Gynecologists, CY 2007‐2012: Non‐Metropolitan Areas
Availability of Capacity at Health Centers In addition to ongoing assessment of provider participation, New Hampshire Medicaid has begun to undertake periodic assessment of the available capacity of providers to accept new patients on their panels. The first of these assessments was performed for Federally Qualified Health Centers (FQHC), FQHC Look‐a‐Likes, and Non‐FQHC Community Health Centers. The majority of the centers that responded to inquiries reported having available capacity to take on hundreds of new patients each. The complete result of this assessment is provided in the Appendix A.
Utilization of Services Appropriate health care utilization is the ultimate outcome of achieving effective health care access, and is influenced by both by provider availability and beneficiary choice and behavior. Studying healthcare utilization patterns can provide a signal that a particular subgroup or region of the State may have an access issue.
Quarterly key physician and hospital utilization trends with control limits and annual utilization of preventive and office/clinic health services trends are presented. Data is broken out by age and eligibility groupings, and broken out for metropolitan and non‐metropolitan areas of the State (to take a special look at areas with a greater sensitivity to access problems). The data in the figures will be updated quarterly or annually as appropriate.
105
94
110
Hospital Rate Reductions DSH ReductionDSH Redesign0
20
40
60
80
100
120
2007QTR 2
2007QTR 3
2007QTR 4
2008QTR 1
2008QTR 2
2008QTR 3
2008QTR 4
2009QTR 1
2009QTR 2
2009QTR 3
2009QTR 4
2010QTR 1
2010QTR 2
2010QTR 3
2010QTR 4
2011QTR 1
2011QTR 2
2011QTR 3
2011QTR 4
2012QTR 1
Beneficiaries per Provider Mean Rate Control Limit
MONITORING ACCESS TO CARE IN NEW HAMPSHIRE’S MEDICAID PROGRAM: REVIEW OF KEY INDICATORS, AUGUST 2012 New Hampshire Department of Health and Human Services Office of Medicaid Business and Policy
23
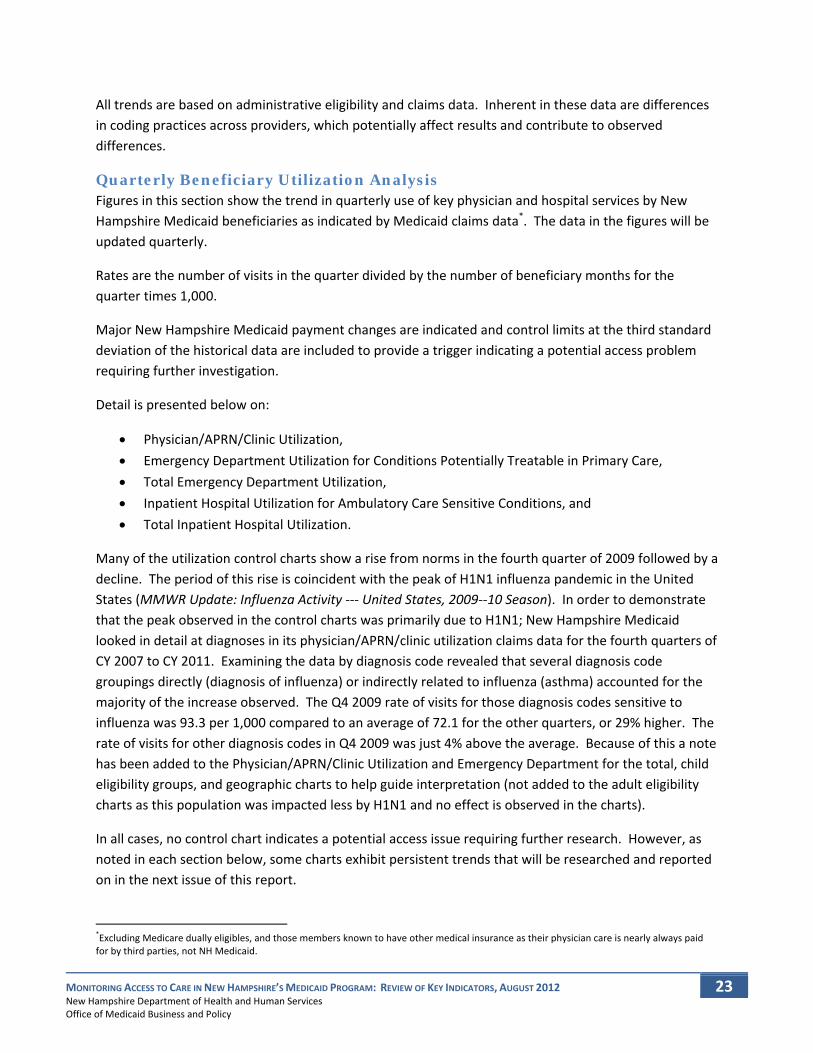
All trends are based on administrative eligibility and claims data. Inherent in these data are differences in coding practices across providers, which potentially affect results and contribute to observed differences.
Quarterly Beneficiary Utilization Analysis Figures in this section show the trend in quarterly use of key physician and hospital services by New Hampshire Medicaid beneficiaries as indicated by Medicaid claims data*. The data in the figures will be updated quarterly.
Rates are the number of visits in the quarter divided by the number of beneficiary months for the quarter times 1,000.
Major New Hampshire Medicaid payment changes are indicated and control limits at the third standard deviation of the historical data are included to provide a trigger indicating a potential access problem requiring further investigation.
Detail is presented below on:
• Physician/APRN/Clinic Utilization, • Emergency Department Utilization for Conditions Potentially Treatable in Primary Care, • Total Emergency Department Utilization, • Inpatient Hospital Utilization for Ambulatory Care Sensitive Conditions, and • Total Inpatient Hospital Utilization.
Many of the utilization control charts show a rise from norms in the fourth quarter of 2009 followed by a decline. The period of this rise is coincident with the peak of H1N1 influenza pandemic in the United States (MMWR Update: Influenza Activity ‐‐‐ United States, 2009‐‐10 Season). In order to demonstrate that the peak observed in the control charts was primarily due to H1N1; New Hampshire Medicaid looked in detail at diagnoses in its physician/APRN/clinic utilization claims data for the fourth quarters of CY 2007 to CY 2011. Examining the data by diagnosis code revealed that several diagnosis code groupings directly (diagnosis of influenza) or indirectly related to influenza (asthma) accounted for the majority of the increase observed. The Q4 2009 rate of visits for those diagnosis codes sensitive to influenza was 93.3 per 1,000 compared to an average of 72.1 for the other quarters, or 29% higher. The rate of visits for other diagnosis codes in Q4 2009 was just 4% above the average. Because of this a note has been added to the Physician/APRN/Clinic Utilization and Emergency Department for the total, child eligibility groups, and geographic charts to help guide interpretation (not added to the adult eligibility charts as this population was impacted less by H1N1 and no effect is observed in the charts).
In all cases, no control chart indicates a potential access issue requiring further research. However, as noted in each section below, some charts exhibit persistent trends that will be researched and reported on in the next issue of this report.
*Excluding Medicare dually eligibles, and those members known to have other medical insurance as their physician care is nearly always paid for by third parties, not NH Medicaid.
MONITORING ACCESS TO CARE IN NEW HAMPSHIRE’S MEDICAID PROGRAM: REVIEW OF KEY INDICATORS, AUGUST 2012 New Hampshire Department of Health and Human Services Office of Medicaid Business and Policy
24
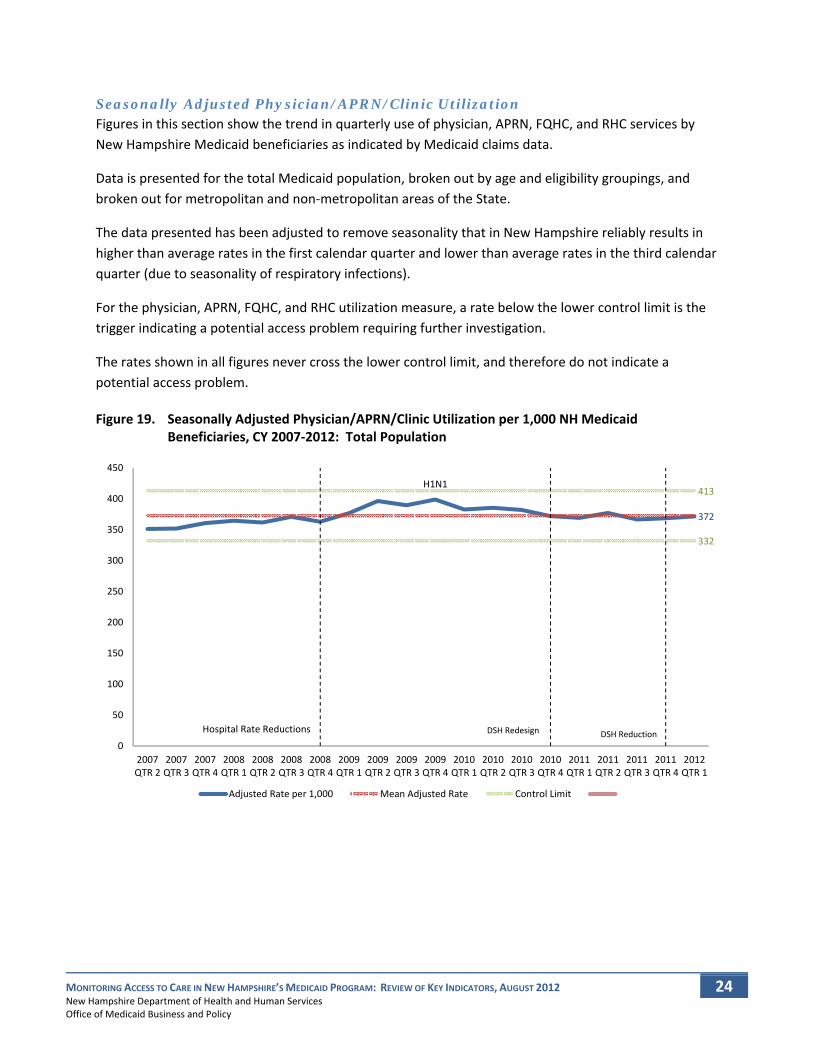
Seasonally Adjusted Physician/APRN/Clinic Utilization Figures in this section show the trend in quarterly use of physician, APRN, FQHC, and RHC services by New Hampshire Medicaid beneficiaries as indicated by Medicaid claims data.
Data is presented for the total Medicaid population, broken out by age and eligibility groupings, and broken out for metropolitan and non‐metropolitan areas of the State.
The data presented has been adjusted to remove seasonality that in New Hampshire reliably results in higher than average rates in the first calendar quarter and lower than average rates in the third calendar quarter (due to seasonality of respiratory infections).
For the physician, APRN, FQHC, and RHC utilization measure, a rate below the lower control limit is the trigger indicating a potential access problem requiring further investigation.
The rates shown in all figures never cross the lower control limit, and therefore do not indicate a potential access problem.
Figure 19. Seasonally Adjusted Physician/APRN/Clinic Utilization per 1,000 NH Medicaid Beneficiaries, CY 2007‐2012: Total Population
H1N1
372
332
413
Hospital Rate Reductions DSH ReductionDSH Redesign
0
50
100
150
200
250
300
350
400
450
2007QTR 2
2007QTR 3
2007QTR 4
2008QTR 1
2008QTR 2
2008QTR 3
2008QTR 4
2009QTR 1
2009QTR 2
2009QTR 3
2009QTR 4
2010QTR 1
2010QTR 2
2010QTR 3
2010QTR 4
2011QTR 1
2011QTR 2
2011QTR 3
2011QTR 4
2012QTR 1
Adjusted Rate per 1,000 Mean Adjusted Rate Control Limit

MONITORING ACCESS TO CARE IN NEW HAMPSHIRE’S MEDICAID PROGRAM: REVIEW OF KEY INDICATORS, AUGUST 2012 New Hampshire Department of Health and Human Services Office of Medicaid Business and Policy
25
Figure 20. Seasonally Adjusted Physician/APRN/Clinic Utilization per 1,000 NH Medicaid Beneficiaries, CY 2007‐2012: Children, Blind and Disabled Aid Categories
Figure 21. Seasonally Adjusted Physician/APRN/Clinic Utilization per 1,000 NH Medicaid Beneficiaries, CY 2007‐2012: Children, Children and Families Aid Categories
H1N1
411
336
530
Hospital Rate Reductions DSH ReductionDSH Redesign
0
100
200
300
400
500
600
2007QTR 2
2007QTR 3
2007QTR 4
2008QTR 1
2008QTR 2
2008QTR 3
2008QTR 4
2009QTR 1
2009QTR 2
2009QTR 3
2009QTR 4
2010QTR 1
2010QTR 2
2010QTR 3
2010QTR 4
2011QTR 1
2011QTR 2
2011QTR 3
2011QTR 4
2012QTR 1
Adjusted Rate per 1,000 Mean Adjusted Rate Control Limit
H1N1
314
286
346
Hospital Rate Reductions DSH ReductionDSH Redesign0
50
100
150
200
250
300
350
400
2007QTR 2
2007QTR 3
2007QTR 4
2008QTR 1
2008QTR 2
2008QTR 3
2008QTR 4
2009QTR 1
2009QTR 2
2009QTR 3
2009QTR 4
2010QTR 1
2010QTR 2
2010QTR 3
2010QTR 4
2011QTR 1
2011QTR 2
2011QTR 3
2011QTR 4
2012QTR 1
Adjusted Rate per 1,000 Mean Adjusted Rate Control Limit

MONITORING ACCESS TO CARE IN NEW HAMPSHIRE’S MEDICAID PROGRAM: REVIEW OF KEY INDICATORS, AUGUST 2012 New Hampshire Department of Health and Human Services Office of Medicaid Business and Policy
26
Figure 22. Seasonally Adjusted Physician/APRN/Clinic Utilization per 1,000 NH Medicaid Beneficiaries, CY 2007‐2012: Children, Foster Care Aid Categories
Figure 23. Seasonally Adjusted Physician/APRN/Clinic Utilization per 1,000 NH Medicaid Beneficiaries, CY 2007‐2012: Adults, Aged Aid Categories
H1N1
324
276
381
Hospital Rate Reductions DSH ReductionDSH Redesign
0
50
100
150
200
250
300
350
400
450
2007QTR 2
2007QTR 3
2007QTR 4
2008QTR 1
2008QTR 2
2008QTR 3
2008QTR 4
2009QTR 1
2009QTR 2
2009QTR 3
2009QTR 4
2010QTR 1
2010QTR 2
2010QTR 3
2010QTR 4
2011QTR 1
2011QTR 2
2011QTR 3
2011QTR 4
2012QTR 1
Adjusted Rate per 1,000 Mean Adjusted Rate Control Limit
587
433
674
Hospital Rate Reductions DSH ReductionDSH Redesign0
100
200
300
400
500
600
700
800
2007QTR 2
2007QTR 3
2007QTR 4
2008QTR 1
2008QTR 2
2008QTR 3
2008QTR 4
2009QTR 1
2009QTR 2
2009QTR 3
2009QTR 4
2010QTR 1
2010QTR 2
2010QTR 3
2010QTR 4
2011QTR 1
2011QTR 2
2011QTR 3
2011QTR 4
2012QTR 1
Adjusted Rate per 1,000 Mean Adjusted Rate Control Limit

MONITORING ACCESS TO CARE IN NEW HAMPSHIRE’S MEDICAID PROGRAM: REVIEW OF KEY INDICATORS, AUGUST 2012 New Hampshire Department of Health and Human Services Office of Medicaid Business and Policy
27
Figure 24. Seasonally Adjusted Physician/APRN/Clinic Utilization per 1,000 NH Medicaid Beneficiaries, CY 2007‐2012: Adults, Blind and Disabled Aid Categories
Figure 25. Seasonally Adjusted Physician/APRN/Clinic Utilization per 1,000 NH Medicaid Beneficiaries, CY 2007‐2012: Adults, Families and Children
604
473
676
Hospital Rate ReductionsDSH ReductionDSH Redesign
0
100
200
300
400
500
600
700
800
2007QTR 2
2007QTR 3
2007QTR 4
2008QTR 1
2008QTR 2
2008QTR 3
2008QTR 4
2009QTR 1
2009QTR 2
2009QTR 3
2009QTR 4
2010QTR 1
2010QTR 2
2010QTR 3
2010QTR 4
2011QTR 1
2011QTR 2
2011QTR 3
2011QTR 4
2012QTR 1
Adjusted Rate per 1,000 Mean Adjusted Rate Control Limit
501
449
576
Hospital Rate Reductions DSH ReductionDSH Redesign
0
100
200
300
400
500
600
700
2007QTR 2
2007QTR 3
2007QTR 4
2008QTR 1
2008QTR 2
2008QTR 3
2008QTR 4
2009QTR 1
2009QTR 2
2009QTR 3
2009QTR 4
2010QTR 1
2010QTR 2
2010QTR 3
2010QTR 4
2011QTR 1
2011QTR 2
2011QTR 3
2011QTR 4
2012QTR 1
Adjusted Rate per 1,000 Mean Adjusted Rate Control Limit

MONITORING ACCESS TO CARE IN NEW HAMPSHIRE’S MEDICAID PROGRAM: REVIEW OF KEY INDICATORS, AUGUST 2012 New Hampshire Department of Health and Human Services Office of Medicaid Business and Policy
28
Figure 26. Seasonally Adjusted Physician/APRN/Clinic Utilization per 1,000 NH Medicaid Beneficiaries, CY 2007‐2012: Metropolitan Areas
Figure 27. Seasonally Adjusted Physician/APRN/Clinic Utilization per 1,000 NH Medicaid Beneficiaries, CY 2007‐2012: Non‐Metropolitan Areas
H1N1
393
354
443
Hospital Rate ReductionsDSH ReductionDSH Redesign
0
50
100
150
200
250
300
350
400
450
500
2007QTR 2
2007QTR 3
2007QTR 4
2008QTR 1
2008QTR 2
2008QTR 3
2008QTR 4
2009QTR 1
2009QTR 2
2009QTR 3
2009QTR 4
2010QTR 1
2010QTR 2
2010QTR 3
2010QTR 4
2011QTR 1
2011QTR 2
2011QTR 3
2011QTR 4
2012QTR 1
Adjusted Rate per 1,000 Mean Adjusted Rate Control Limit
H1N1
351
322
402
Hospital Rate Reductions DSH ReductionDSH Redesign
0
50
100
150
200
250
300
350
400
450
2007QTR 2
2007QTR 3
2007QTR 4
2008QTR 1
2008QTR 2
2008QTR 3
2008QTR 4
2009QTR 1
2009QTR 2
2009QTR 3
2009QTR 4
2010QTR 1
2010QTR 2
2010QTR 3
2010QTR 4
2011QTR 1
2011QTR 2
2011QTR 3
2011QTR 4
2012QTR 1
Adjusted Rate per 1,000 Mean Adjusted Rate Control Limit

MONITORING ACCESS TO CARE IN NEW HAMPSHIRE’S MEDICAID PROGRAM: REVIEW OF KEY INDICATORS, AUGUST 2012 New Hampshire Department of Health and Human Services Office of Medicaid Business and Policy
29
Seasonally Adjusted Emergency Department Utilization for Conditions Potentially Treatable in Primary Care Figures in this section show the trend in quarterly use of hospital emergency departments for conditions that might have been more appropriately treated in primary care (e.g., upper respiratory infections) as indicated by Medicaid claims data.
Data is presented for the total Medicaid population, broken out by age and eligibility groupings, and broken out for metropolitan and non‐metropolitan areas of the State where supported sufficient data needed for reliable results.
The data presented has been adjusted to remove seasonality that in New Hampshire reliably results in higher than average rates in the first calendar quarter and lower than average rates in the third calendar quarter (due to seasonality of respiratory infections).
For this measure, a rate above the control limits is the trigger indicating a potential access problem requiring further investigation. Higher rates, in conjunction with lower use of primary care could indicate an access problem.
The rates shown in all figures never cross the control limits, and therefore do not indicate a potential access problem.
Figure 28. Seasonally Adjusted Emergency Department Utilization for Conditions Potentially Treatable in Primary Care per 1,000 NH Medicaid Beneficiaries, CY 2007‐2012: Total Population
H1N1
1615
22
Hospital Rate ReductionsDSH ReductionDSH Redesign
0
5
10
15
20
25
2007QTR 2
2007QTR 3
2007QTR 4
2008QTR 1
2008QTR 2
2008QTR 3
2008QTR 4
2009QTR 1
2009QTR 2
2009QTR 3
2009QTR 4
2010QTR 1
2010QTR 2
2010QTR 3
2010QTR 4
2011QTR 1
2011QTR 2
2011QTR 3
2011QTR 4
2012QTR 1
Adjusted Rate per 1,000 Mean Adjusted Rate Control Limit

MONITORING ACCESS TO CARE IN NEW HAMPSHIRE’S MEDICAID PROGRAM: REVIEW OF KEY INDICATORS, AUGUST 2012 New Hampshire Department of Health and Human Services Office of Medicaid Business and Policy
30
Figure 29. Seasonally Adjusted Emergency Department Utilization for Conditions Potentially Treatable in Primary Care per 1,000 NH Medicaid Beneficiaries, CY 2007‐2012: Children, Children and Families Aid Categories
Figure 30. Seasonally Adjusted Emergency Department Utilization for Conditions Potentially Treatable in Primary Care per 1,000 NH Medicaid Beneficiaries, CY 2007‐2012: Adults, Blind and Disabled Aid Categories
H1N1
14
12
21
Hospital Rate Reductions DSH ReductionDSH Redesign0
5
10
15
20
25
2007QTR 2
2007QTR 3
2007QTR 4
2008QTR 1
2008QTR 2
2008QTR 3
2008QTR 4
2009QTR 1
2009QTR 2
2009QTR 3
2009QTR 4
2010QTR 1
2010QTR 2
2010QTR 3
2010QTR 4
2011QTR 1
2011QTR 2
2011QTR 3
2011QTR 4
2012QTR 1
Adjusted Rate per 1,000 Mean Adjusted Rate Control Limit
23
20
32
Hospital Rate Reductions DSH ReductionDSH Redesign0
5
10
15
20
25
30
35
2007QTR 2
2007QTR 3
2007QTR 4
2008QTR 1
2008QTR 2
2008QTR 3
2008QTR 4
2009QTR 1
2009QTR 2
2009QTR 3
2009QTR 4
2010QTR 1
2010QTR 2
2010QTR 3
2010QTR 4
2011QTR 1
2011QTR 2
2011QTR 3
2011QTR 4
2012QTR 1
Adjusted Rate per 1,000 Mean Adjusted Rate Control Limit

MONITORING ACCESS TO CARE IN NEW HAMPSHIRE’S MEDICAID PROGRAM: REVIEW OF KEY INDICATORS, AUGUST 2012 New Hampshire Department of Health and Human Services Office of Medicaid Business and Policy
31
Figure 31. Seasonally Adjusted Emergency Department Utilization for Conditions Potentially Treatable in Primary Care per 1,000 NH Medicaid Beneficiaries, CY 2007‐2012: Adults, Children and Families Aid Categories
Figure 32. Seasonally Adjusted Emergency Department Utilization for Conditions Potentially Treatable in Primary Care per 1,000 NH Medicaid Beneficiaries, CY 2007‐2012: Metropolitan Areas
2322
31
Hospital Rate Reductions DSH ReductionDSH Redesign
0
5
10
15
20
25
30
35
2007QTR 2
2007QTR 3
2007QTR 4
2008QTR 1
2008QTR 2
2008QTR 3
2008QTR 4
2009QTR 1
2009QTR 2
2009QTR 3
2009QTR 4
2010QTR 1
2010QTR 2
2010QTR 3
2010QTR 4
2011QTR 1
2011QTR 2
2011QTR 3
2011QTR 4
2012QTR 1
Adjusted Rate per 1,000 Mean Adjusted Rate Control Limit
H1N1
17
13
22
Hospital Rate Reductions DSH ReductionDSH Redesign
0
5
10
15
20
25
2007QTR 2
2007QTR 3
2007QTR 4
2008QTR 1
2008QTR 2
2008QTR 3
2008QTR 4
2009QTR 1
2009QTR 2
2009QTR 3
2009QTR 4
2010QTR 1
2010QTR 2
2010QTR 3
2010QTR 4
2011QTR 1
2011QTR 2
2011QTR 3
2011QTR 4
2012QTR 1
Adjusted Rate per 1,000 Mean Adjusted Rate Control Limit

MONITORING ACCESS TO CARE IN NEW HAMPSHIRE’S MEDICAID PROGRAM: REVIEW OF KEY INDICATORS, AUGUST 2012 New Hampshire Department of Health and Human Services Office of Medicaid Business and Policy
32
Figure 33. Seasonally Adjusted Emergency Department Utilization for Conditions Potentially Treatable in Primary Care per 1,000 NH Medicaid Beneficiaries, CY 2007‐2012: Non‐Metropolitan Areas
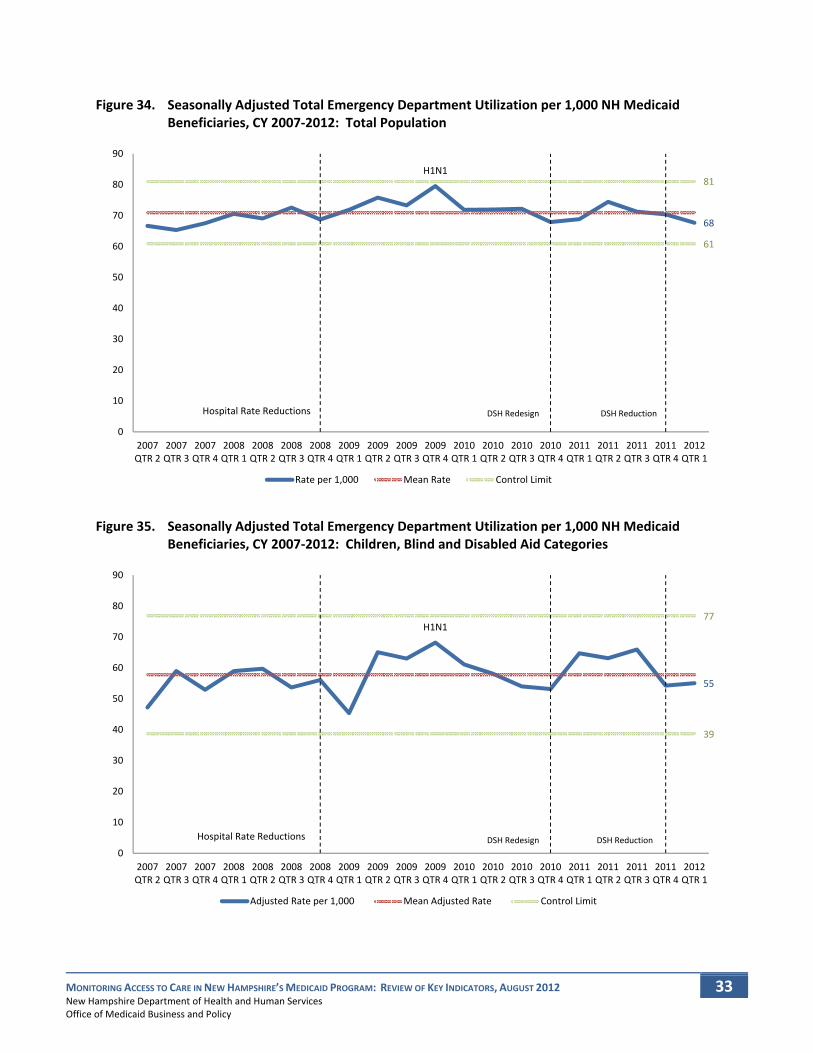
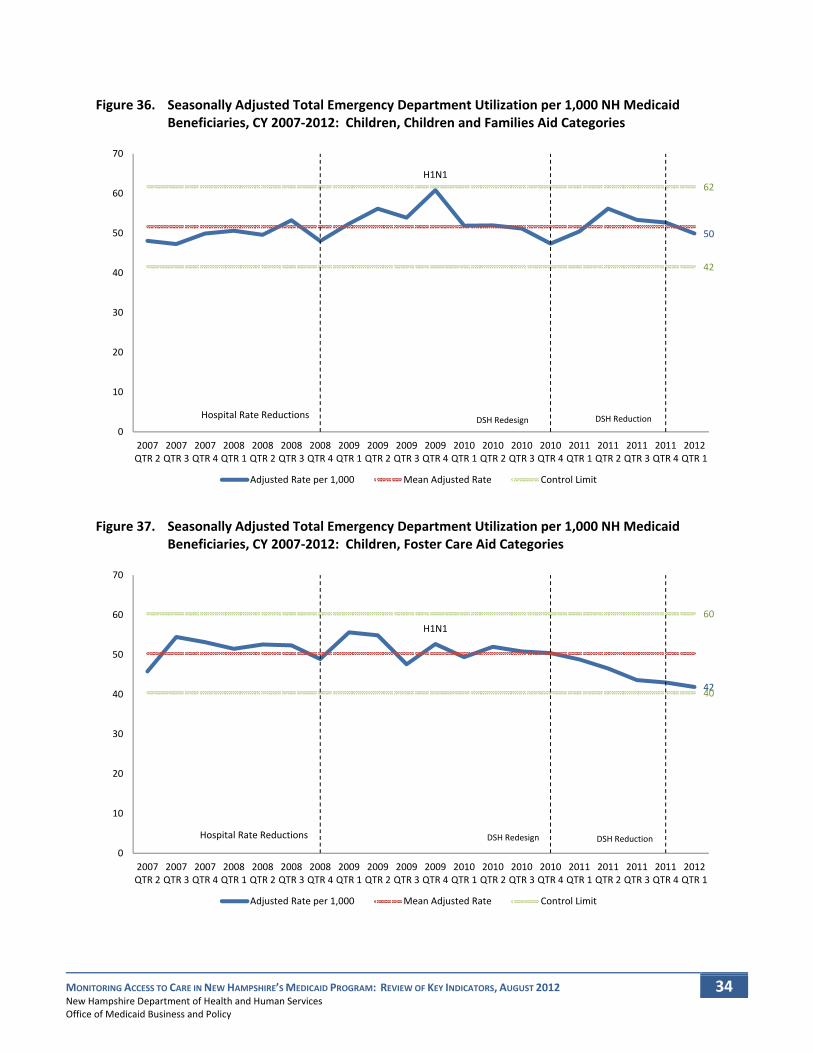
Seasonally Adjusted Total Emergency Department Utilization Figures in this section show the trend in quarterly use of hospital emergency departments by New Hampshire Medicaid beneficiaries as indicated by Medicaid claims data.
Data is presented for the total Medicaid population, broken out by age and eligibility groupings, and broken out for metropolitan and non‐metropolitan areas of the State.
The data presented has been adjusted to remove seasonality that in New Hampshire reliably results in higher than average rates in the first calendar quarter and lower than average rates in the third calendar quarter (due to seasonality of respiratory infections).
For the total emergency department utilization measure, a rate either above or below the control limits is the trigger indicating a potential access problem requiring further investigation. Higher rates, in conjunction with lower use of primary care could indicate an access problem. Rates below the control limit could indicate more appropriate use of care (a goal of the program), but would still be investigated if provider enrollment data indicates the potential for reduced emergency department access.
As shown below, the data indicates that emergency utilization has not crossed the control limits and supports the conclusion that Medicaid beneficiaries in New Hampshire do not have a problem accessing healthcare services.
H1N1
15.2716
26
Hospital Rate Reductions DSH ReductionDSH Redesign
0.00
5.00
10.00
15.00
20.00
25.00
30.00
2007QTR 2
2007QTR 3
2007QTR 4
2008QTR 1
2008QTR 2
2008QTR 3
2008QTR 4
2009QTR 1
2009QTR 2
2009QTR 3
2009QTR 4
2010QTR 1
2010QTR 2
2010QTR 3
2010QTR 4
2011QTR 1
2011QTR 2
2011QTR 3
2011QTR 4
2012QTR 1
Adjusted Rate per 1,000 Mean Adjusted Rate Control Limit
MONITORING ACCESS TO CARE IN NEW HAMPSHIRE’S MEDICAID PROGRAM: REVIEW OF KEY INDICATORS, AUGUST 2012 New Hampshire Department of Health and Human Services Office of Medicaid Business and Policy
33
Figure 34. Seasonally Adjusted Total Emergency Department Utilization per 1,000 NH Medicaid Beneficiaries, CY 2007‐2012: Total Population
Figure 35. Seasonally Adjusted Total Emergency Department Utilization per 1,000 NH Medicaid Beneficiaries, CY 2007‐2012: Children, Blind and Disabled Aid Categories
H1N1
68
61
81
Hospital Rate Reductions DSH ReductionDSH Redesign
0
10
20
30
40
50
60
70
80
90
2007QTR 2
2007QTR 3
2007QTR 4
2008QTR 1
2008QTR 2
2008QTR 3
2008QTR 4
2009QTR 1
2009QTR 2
2009QTR 3
2009QTR 4
2010QTR 1
2010QTR 2
2010QTR 3
2010QTR 4
2011QTR 1
2011QTR 2
2011QTR 3
2011QTR 4
2012QTR 1
Rate per 1,000 Mean Rate Control Limit
H1N1
55
39
77
Hospital Rate Reductions DSH ReductionDSH Redesign0
10
20
30
40
50
60
70
80
90
2007QTR 2
2007QTR 3
2007QTR 4
2008QTR 1
2008QTR 2
2008QTR 3
2008QTR 4
2009QTR 1
2009QTR 2
2009QTR 3
2009QTR 4
2010QTR 1
2010QTR 2
2010QTR 3
2010QTR 4
2011QTR 1
2011QTR 2
2011QTR 3
2011QTR 4
2012QTR 1
Adjusted Rate per 1,000 Mean Adjusted Rate Control Limit
MONITORING ACCESS TO CARE IN NEW HAMPSHIRE’S MEDICAID PROGRAM: REVIEW OF KEY INDICATORS, AUGUST 2012 New Hampshire Department of Health and Human Services Office of Medicaid Business and Policy
34
Figure 36. Seasonally Adjusted Total Emergency Department Utilization per 1,000 NH Medicaid Beneficiaries, CY 2007‐2012: Children, Children and Families Aid Categories
Figure 37. Seasonally Adjusted Total Emergency Department Utilization per 1,000 NH Medicaid Beneficiaries, CY 2007‐2012: Children, Foster Care Aid Categories
H1N1
50
42
62
Hospital Rate Reductions DSH ReductionDSH Redesign0
10
20
30
40
50
60
70
2007QTR 2
2007QTR 3
2007QTR 4
2008QTR 1
2008QTR 2
2008QTR 3
2008QTR 4
2009QTR 1
2009QTR 2
2009QTR 3
2009QTR 4
2010QTR 1
2010QTR 2
2010QTR 3
2010QTR 4
2011QTR 1
2011QTR 2
2011QTR 3
2011QTR 4
2012QTR 1
Adjusted Rate per 1,000 Mean Adjusted Rate Control Limit
H1N1
4240
60
Hospital Rate Reductions DSH ReductionDSH Redesign
0
10
20
30
40
50
60
70
2007QTR 2
2007QTR 3
2007QTR 4
2008QTR 1
2008QTR 2
2008QTR 3
2008QTR 4
2009QTR 1
2009QTR 2
2009QTR 3
2009QTR 4
2010QTR 1
2010QTR 2
2010QTR 3
2010QTR 4
2011QTR 1
2011QTR 2
2011QTR 3
2011QTR 4
2012QTR 1
Adjusted Rate per 1,000 Mean Adjusted Rate Control Limit

MONITORING ACCESS TO CARE IN NEW HAMPSHIRE’S MEDICAID PROGRAM: REVIEW OF KEY INDICATORS, AUGUST 2012 New Hampshire Department of Health and Human Services Office of Medicaid Business and Policy
35
Figure 38. Seasonally Adjusted Total Emergency Department Utilization per 1,000 NH Medicaid Beneficiaries, CY 2007‐2012: Adult, Aged Aid Categories
Figure 39. Seasonally Adjusted Total Emergency Department Utilization per 1,000 NH Medicaid Beneficiaries, CY 2007‐2012: Adult, Blind and Disabled Aid Categories
51
35
66
Hospital Rate Reductions DSH ReductionDSH Redesign
0
10
20
30
40
50
60
70
2007QTR 2
2007QTR 3
2007QTR 4
2008QTR 1
2008QTR 2
2008QTR 3
2008QTR 4
2009QTR 1
2009QTR 2
2009QTR 3
2009QTR 4
2010QTR 1
2010QTR 2
2010QTR 3
2010QTR 4
2011QTR 1
2011QTR 2
2011QTR 3
2011QTR 4
2012QTR 1
Adjusted Rate per 1,000 Mean Adjusted Rate Control Limit
136
114
161
Hospital Rate ReductionsDSH ReductionDSH Redesign
0
20
40
60
80
100
120
140
160
180
2007QTR 2
2007QTR 3
2007QTR 4
2008QTR 1
2008QTR 2
2008QTR 3
2008QTR 4
2009QTR 1
2009QTR 2
2009QTR 3
2009QTR 4
2010QTR 1
2010QTR 2
2010QTR 3
2010QTR 4
2011QTR 1
2011QTR 2
2011QTR 3
2011QTR 4
2012QTR 1
Adjusted Rate per 1,000 Mean Adjusted Rate Control Limit

MONITORING ACCESS TO CARE IN NEW HAMPSHIRE’S MEDICAID PROGRAM: REVIEW OF KEY INDICATORS, AUGUST 2012 New Hampshire Department of Health and Human Services Office of Medicaid Business and Policy
36
Figure 40. Seasonally Adjusted Total Emergency Department Utilization per 1,000 NH Medicaid Beneficiaries, CY 2007‐2012: Adult, Families and Children Aid Categories
Figure 41. Seasonally Adjusted Total Emergency Department Utilization per 1,000 NH Medicaid Beneficiaries, CY 2007‐2012: Metropolitan Counties
117113
141
Hospital Rate ReductionsDSH Reduction
DSH Redesign
0
20
40
60
80
100
120
140
160
2007QTR 2
2007QTR 3
2007QTR 4
2008QTR 1
2008QTR 2
2008QTR 3
2008QTR 4
2009QTR 1
2009QTR 2
2009QTR 3
2009QTR 4
2010QTR 1
2010QTR 2
2010QTR 3
2010QTR 4
2011QTR 1
2011QTR 2
2011QTR 3
2011QTR 4
2012QTR 1
Adjusted Rate per 1,000 Mean Adjusted Rate Control Limit
H1N1
71
57
85
Hospital Rate Reductions DSH ReductionDSH Redesign
0
10
20
30
40
50
60
70
80
90
2007QTR 2
2007QTR 3
2007QTR 4
2008QTR 1
2008QTR 2
2008QTR 3
2008QTR 4
2009QTR 1
2009QTR 2
2009QTR 3
2009QTR 4
2010QTR 1
2010QTR 2
2010QTR 3
2010QTR 4
2011QTR 1
2011QTR 2
2011QTR 3
2011QTR 4
2012QTR 1
Adjusted Rate per 1,000 Mean Adjusted Rate Control Limit

MONITORING ACCESS TO CARE IN NEW HAMPSHIRE’S MEDICAID PROGRAM: REVIEW OF KEY INDICATORS, AUGUST 2012 New Hampshire Department of Health and Human Services Office of Medicaid Business and Policy
37
Figure 42. Seasonally Adjusted Total Emergency Department Utilization per 1,000 NH Medicaid Beneficiaries, CY 2007‐2012: Non‐Metropolitan Counties
Seasonally Adjusted Inpatient Hospital Utilization for Ambulatory Care Sensitive Conditions Figures in this section show the trend in quarterly use of inpatient hospitals for ambulatory care sensitive conditions (ACSC) by New Hampshire Medicaid beneficiaries as indicated by Medicaid claims data. Rates of hospitalization for an ACSC are considered to be a measure of appropriate primary healthcare delivery. While not all admissions for these conditions are avoidable, appropriate ambulatory care can help prevent, or control, acute episodes, and improve the management of these illnesses or conditions. A disproportionately high rate of ACSC admissions may reflect underutilization of appropriate primary care. The ambulatory care sensitive conditions included in this measure are: asthma, dehydration, bacterial pneumonia, urinary tract infection, and gastroenteritis, which are commonly grouped together as ACSC’s.
Data is only presented for the total Medicaid population due to the small number of cases that occur each quarter, broken out by age and eligibility groupings, and broken out for metropolitan and non‐metropolitan areas of the State.
The data has been adjusted to remove seasonality that in New Hampshire reliably results in higher than average rates in the first calendar quarter and lower than average rates in the third calendar quarter (due to seasonality of respiratory infections).
H1N1
6564
85
Hospital Rate ReductionsDSH ReductionDSH Redesign
0
10
20
30
40
50
60
70
80
90
2007QTR 2
2007QTR 3
2007QTR 4
2008QTR 1
2008QTR 2
2008QTR 3
2008QTR 4
2009QTR 1
2009QTR 2
2009QTR 3
2009QTR 4
2010QTR 1
2010QTR 2
2010QTR 3
2010QTR 4
2011QTR 1
2011QTR 2
2011QTR 3
2011QTR 4
2012QTR 1
Adjusted Rate per 1,000 Mean Adjusted Rate Control Limit
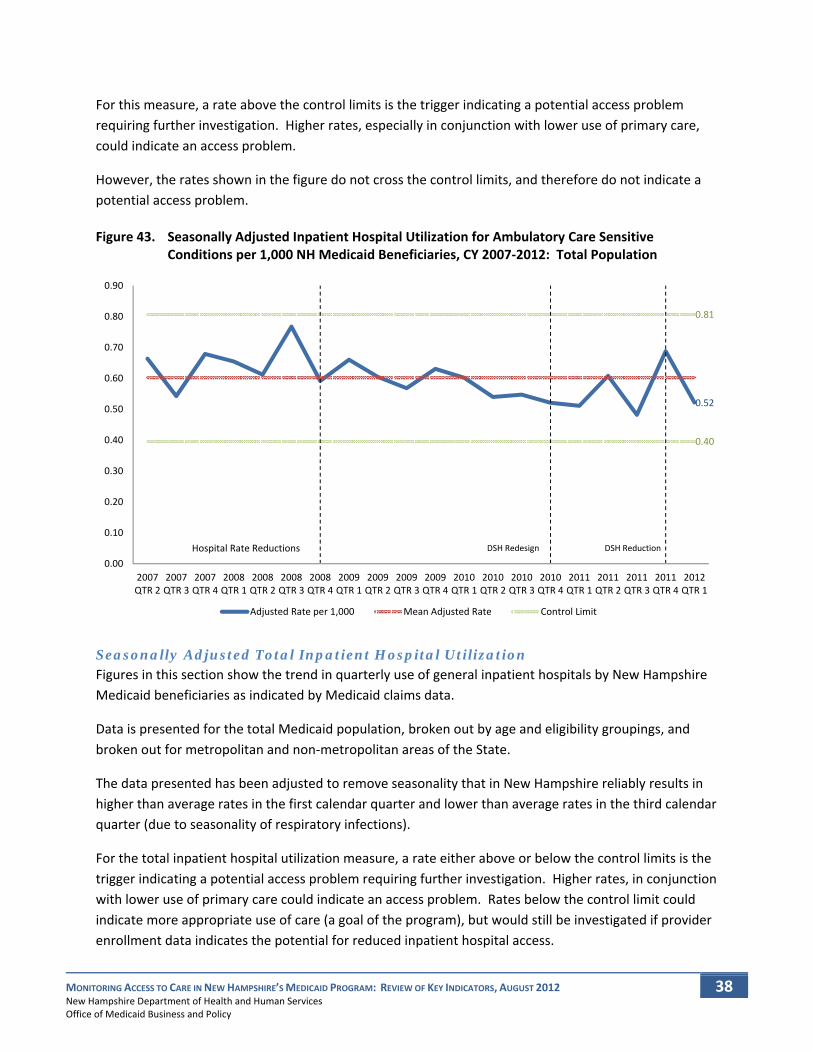
MONITORING ACCESS TO CARE IN NEW HAMPSHIRE’S MEDICAID PROGRAM: REVIEW OF KEY INDICATORS, AUGUST 2012 New Hampshire Department of Health and Human Services Office of Medicaid Business and Policy
38
For this measure, a rate above the control limits is the trigger indicating a potential access problem requiring further investigation. Higher rates, especially in conjunction with lower use of primary care, could indicate an access problem.
However, the rates shown in the figure do not cross the control limits, and therefore do not indicate a potential access problem.
Figure 43. Seasonally Adjusted Inpatient Hospital Utilization for Ambulatory Care Sensitive Conditions per 1,000 NH Medicaid Beneficiaries, CY 2007‐2012: Total Population
Seasonally Adjusted Total Inpatient Hospital Utilization Figures in this section show the trend in quarterly use of general inpatient hospitals by New Hampshire Medicaid beneficiaries as indicated by Medicaid claims data.
Data is presented for the total Medicaid population, broken out by age and eligibility groupings, and broken out for metropolitan and non‐metropolitan areas of the State.
The data presented has been adjusted to remove seasonality that in New Hampshire reliably results in higher than average rates in the first calendar quarter and lower than average rates in the third calendar quarter (due to seasonality of respiratory infections).
For the total inpatient hospital utilization measure, a rate either above or below the control limits is the trigger indicating a potential access problem requiring further investigation. Higher rates, in conjunction with lower use of primary care could indicate an access problem. Rates below the control limit could indicate more appropriate use of care (a goal of the program), but would still be investigated if provider enrollment data indicates the potential for reduced inpatient hospital access.
0.52
0.40
0.81
Hospital Rate Reductions DSH ReductionDSH Redesign
0.00
0.10
0.20
0.30
0.40
0.50
0.60
0.70
0.80
0.90
2007QTR 2
2007QTR 3
2007QTR 4
2008QTR 1
2008QTR 2
2008QTR 3
2008QTR 4
2009QTR 1
2009QTR 2
2009QTR 3
2009QTR 4
2010QTR 1
2010QTR 2
2010QTR 3
2010QTR 4
2011QTR 1
2011QTR 2
2011QTR 3
2011QTR 4
2012QTR 1
Adjusted Rate per 1,000 Mean Adjusted Rate Control Limit

MONITORING ACCESS TO CARE IN NEW HAMPSHIRE’S MEDICAID PROGRAM: REVIEW OF KEY INDICATORS, AUGUST 2012 New Hampshire Department of Health and Human Services Office of Medicaid Business and Policy
39
The rates shown in all figures never cross the control limits, and therefore do not indicate a potential access problem.
Figure 44. Seasonally Adjusted Inpatient Hospital Utilization per 1,000 NH Medicaid Beneficiaries, CY 2007‐2012: Total Population
Annual Utilization of Preventive and Office/Clinic Health Services Figures in this section show the trend in the percent of continuously enrolled New Hampshire Medicaid beneficiaries who made use of at least one expected service as indicated by Medicaid claims data. Measure definitions follow those specified by the National Committee on Quality Assurance (NCQA). These measures are calculated using annual data because expected service use is based on an annual (or greater) period. Only continuously enrolled beneficiaries (with no more than a one month gap in coverage) are included to ensure adequate time for the expected service use to occur. Where available, national NCQA averages for Medicaid are reported on the charts.
Measures presented include:
• Six or More Well‐Child Visits in the First 15 Months of Life, • Well‐Child Visits in the Third Through Sixth Years of Life, • Adolescent Well‐Care Visits, • Child Access to Preventive/Ambulatory Health Services by Age, • Adult Access to Preventive/Ambulatory Health Services by Age, and
99
12
Hospital Rate Reductions DSH ReductionDSH Redesign
0
2
4
6
8
10
12
14
2007QTR 2
2007QTR 3
2007QTR 4
2008QTR 1
2008QTR 2
2008QTR 3
2008QTR 4
2009QTR 1
2009QTR 2
2009QTR 3
2009QTR 4
2010QTR 1
2010QTR 2
2010QTR 3
2010QTR 4
2011QTR 1
2011QTR 2
2011QTR 3
2011QTR 4
2012QTR 1
Rate per 1,000 Mean Rate Control Limit
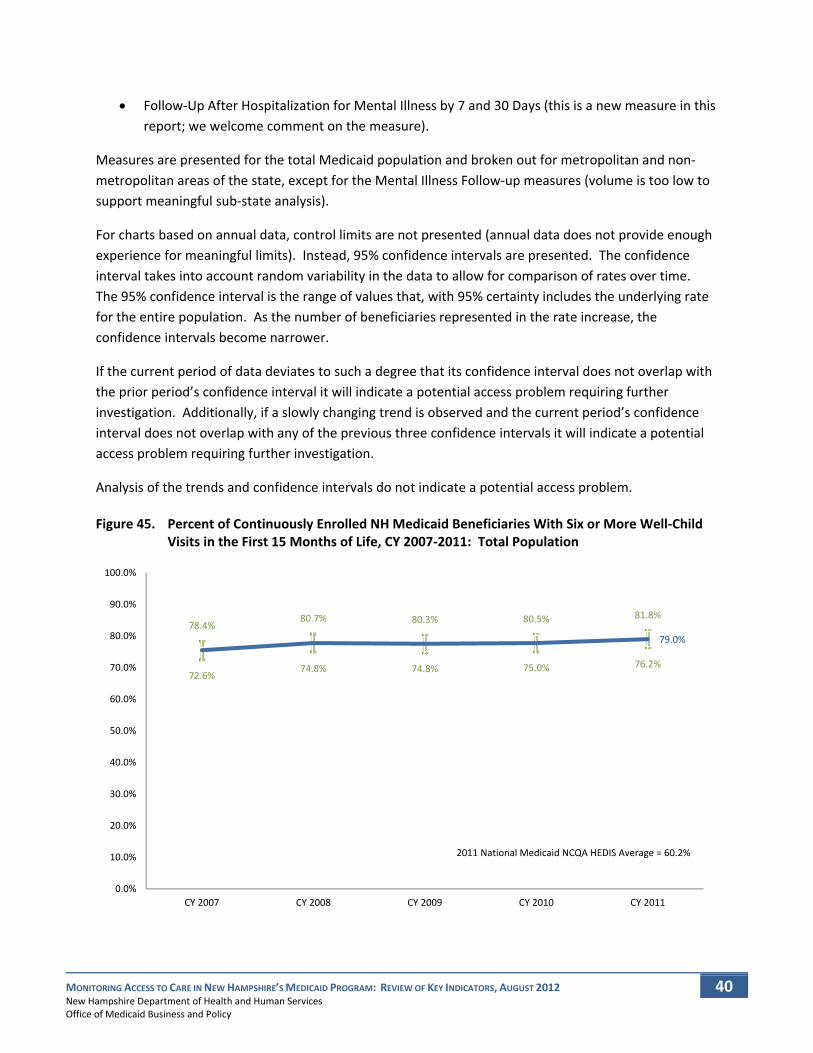
MONITORING ACCESS TO CARE IN NEW HAMPSHIRE’S MEDICAID PROGRAM: REVIEW OF KEY INDICATORS, AUGUST 2012 New Hampshire Department of Health and Human Services Office of Medicaid Business and Policy
40
• Follow‐Up After Hospitalization for Mental Illness by 7 and 30 Days (this is a new measure in this report; we welcome comment on the measure).
Measures are presented for the total Medicaid population and broken out for metropolitan and non‐metropolitan areas of the state, except for the Mental Illness Follow‐up measures (volume is too low to support meaningful sub‐state analysis).
For charts based on annual data, control limits are not presented (annual data does not provide enough experience for meaningful limits). Instead, 95% confidence intervals are presented. The confidence interval takes into account random variability in the data to allow for comparison of rates over time. The 95% confidence interval is the range of values that, with 95% certainty includes the underlying rate for the entire population. As the number of beneficiaries represented in the rate increase, the confidence intervals become narrower.
If the current period of data deviates to such a degree that its confidence interval does not overlap with the prior period’s confidence interval it will indicate a potential access problem requiring further investigation. Additionally, if a slowly changing trend is observed and the current period’s confidence interval does not overlap with any of the previous three confidence intervals it will indicate a potential access problem requiring further investigation.
Analysis of the trends and confidence intervals do not indicate a potential access problem.
Figure 45. Percent of Continuously Enrolled NH Medicaid Beneficiaries With Six or More Well‐Child Visits in the First 15 Months of Life, CY 2007‐2011: Total Population
79.0%
72.6%74.8% 74.8% 75.0% 76.2%
78.4%80.7% 80.3% 80.5% 81.8%
0.0%
10.0%
20.0%
30.0%
40.0%
50.0%
60.0%
70.0%
80.0%
90.0%
100.0%
CY 2007 CY 2008 CY 2009 CY 2010 CY 2011
2011 National Medicaid NCQA HEDIS Average = 60.2%
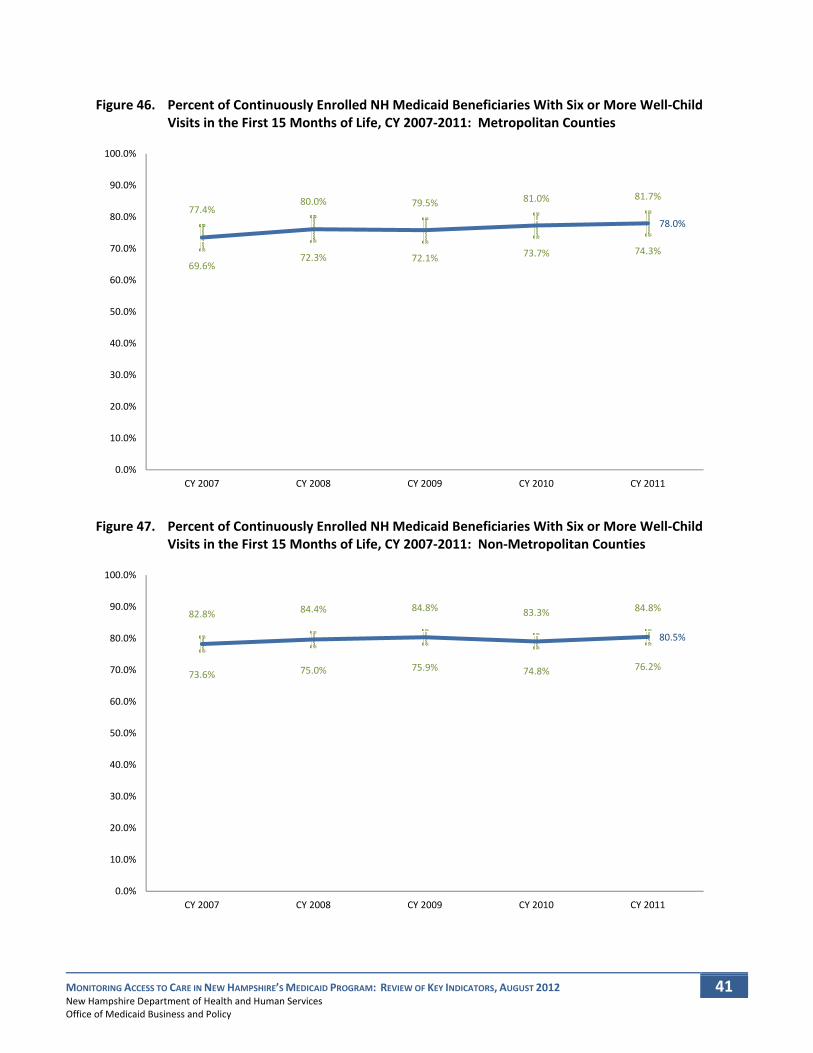
MONITORING ACCESS TO CARE IN NEW HAMPSHIRE’S MEDICAID PROGRAM: REVIEW OF KEY INDICATORS, AUGUST 2012 New Hampshire Department of Health and Human Services Office of Medicaid Business and Policy
41
Figure 46. Percent of Continuously Enrolled NH Medicaid Beneficiaries With Six or More Well‐Child Visits in the First 15 Months of Life, CY 2007‐2011: Metropolitan Counties
Figure 47. Percent of Continuously Enrolled NH Medicaid Beneficiaries With Six or More Well‐Child Visits in the First 15 Months of Life, CY 2007‐2011: Non‐Metropolitan Counties
78.0%
69.6%72.3% 72.1% 73.7% 74.3%
77.4%80.0% 79.5% 81.0% 81.7%
0.0%
10.0%
20.0%
30.0%
40.0%
50.0%
60.0%
70.0%
80.0%
90.0%
100.0%
CY 2007 CY 2008 CY 2009 CY 2010 CY 2011
80.5%
73.6% 75.0% 75.9% 74.8% 76.2%
82.8% 84.4% 84.8% 83.3% 84.8%
0.0%
10.0%
20.0%
30.0%
40.0%
50.0%
60.0%
70.0%
80.0%
90.0%
100.0%
CY 2007 CY 2008 CY 2009 CY 2010 CY 2011

MONITORING ACCESS TO CARE IN NEW HAMPSHIRE’S MEDICAID PROGRAM: REVIEW OF KEY INDICATORS, AUGUST 2012 New Hampshire Department of Health and Human Services Office of Medicaid Business and Policy
42
Figure 48. Percent of Continuously Enrolled NH Medicaid Beneficiaries in the Third Through Sixth Years of Life With a Well‐Child Visit, CY 2007‐2011: Total Population
Figure 49. Percent of Continuously Enrolled NH Medicaid Beneficiaries in the Third Through Sixth Years of Life With a Well‐Child Visit, CY 2007‐2011: Metropolitan Counties
77.3%
71.9% 72.3%75.4% 75.6% 75.9%
75.0% 75.3%78.3% 78.4% 78.6%
0.0%
10.0%
20.0%
30.0%
40.0%
50.0%
60.0%
70.0%
80.0%
90.0%
100.0%
CY 2007 CY 2008 CY 2009 CY 2010 CY 2011
2011 National Medicaid NCQA HEDIS Average = 71.9%
78.9%
72.6% 73.2%76.9% 77.0% 77.0%
76.8% 77.3%80.8% 80.8% 80.7%
0.0%
10.0%
20.0%
30.0%
40.0%
50.0%
60.0%
70.0%
80.0%
90.0%
100.0%
CY 2007 CY 2008 CY 2009 CY 2010 CY 2011
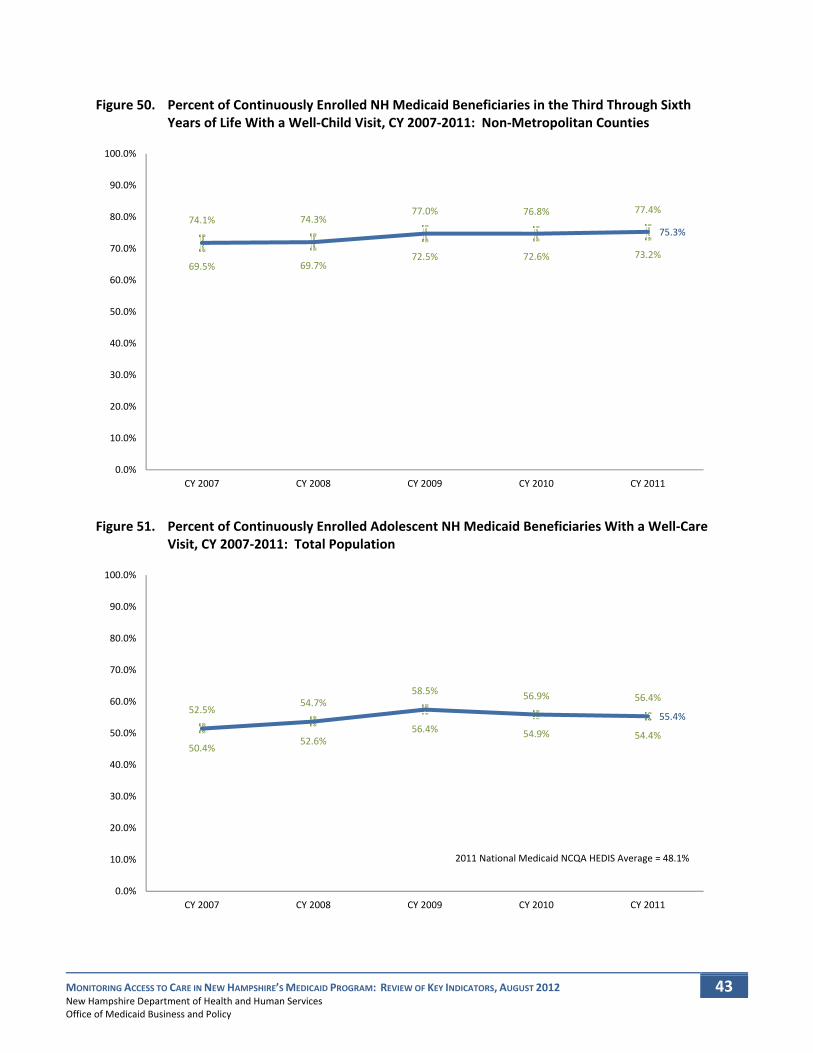
MONITORING ACCESS TO CARE IN NEW HAMPSHIRE’S MEDICAID PROGRAM: REVIEW OF KEY INDICATORS, AUGUST 2012 New Hampshire Department of Health and Human Services Office of Medicaid Business and Policy
43
Figure 50. Percent of Continuously Enrolled NH Medicaid Beneficiaries in the Third Through Sixth Years of Life With a Well‐Child Visit, CY 2007‐2011: Non‐Metropolitan Counties
Figure 51. Percent of Continuously Enrolled Adolescent NH Medicaid Beneficiaries With a Well‐Care Visit, CY 2007‐2011: Total Population
75.3%
69.5% 69.7%72.5% 72.6% 73.2%
74.1% 74.3%77.0% 76.8% 77.4%
0.0%
10.0%
20.0%
30.0%
40.0%
50.0%
60.0%
70.0%
80.0%
90.0%
100.0%
CY 2007 CY 2008 CY 2009 CY 2010 CY 2011
55.4%
50.4%52.6%
56.4% 54.9% 54.4%
52.5%54.7%
58.5% 56.9% 56.4%
0.0%
10.0%
20.0%
30.0%
40.0%
50.0%
60.0%
70.0%
80.0%
90.0%
100.0%
CY 2007 CY 2008 CY 2009 CY 2010 CY 2011
2011 National Medicaid NCQA HEDIS Average = 48.1%

MONITORING ACCESS TO CARE IN NEW HAMPSHIRE’S MEDICAID PROGRAM: REVIEW OF KEY INDICATORS, AUGUST 2012 New Hampshire Department of Health and Human Services Office of Medicaid Business and Policy
44
Figure 52. Percent of Continuously Enrolled Adolescent NH Medicaid Beneficiaries With a Well‐Care Visit, CY 2007‐2011: Metropolitan Counties
Figure 53. Percent of Continuously Enrolled Adolescent NH Medicaid Beneficiaries With a Well‐Care Visit, CY 2007‐2011: Non‐Metropolitan Counties
56.5%
51.0%53.6%
57.7% 56.6% 55.1%
53.9%56.6%
60.5% 59.3% 57.8%
0.0%
10.0%
20.0%
30.0%
40.0%
50.0%
60.0%
70.0%
80.0%
90.0%
100.0%
CY 2007 CY 2008 CY 2009 CY 2010 CY 2011
54.1%
48.9% 50.7%54.2% 52.1% 52.7%
52.0% 53.8%57.3%
55.1% 55.6%
0.0%
10.0%
20.0%
30.0%
40.0%
50.0%
60.0%
70.0%
80.0%
90.0%
100.0%
CY 2007 CY 2008 CY 2009 CY 2010 CY 2011

MONITORING ACCESS TO CARE IN NEW HAMPSHIRE’S MEDICAID PROGRAM: REVIEW OF KEY INDICATORS, AUGUST 2012 New Hampshire Department of Health and Human Services Office of Medicaid Business and Policy
45
Figure 54. Percent of Continuously Enrolled NH Medicaid Child Beneficiaries With a Preventive or Other Ambulatory Service, CY 2007‐2011 by Age: 0 to 11 Months
Figure 55. Percent of Continuously Enrolled NH Medicaid Child Beneficiaries With a Preventive or Other Ambulatory Service, CY 2007‐2011 by Age: 12 to 24 Months
99.5%
90.8% 91.3% 91.0% 91.2% 92.3%
100.0% 100.0% 100.0% 100.0% 100.0%
0.0%
10.0%
20.0%
30.0%
40.0%
50.0%
60.0%
70.0%
80.0%
90.0%
100.0%
CY 2007 CY 2008 CY 2009 CY 2010 CY 2011
98.5%
95.7% 95.6% 95.8% 95.6% 95.4%
100.0% 100.0% 100.0% 100.0% 100.0%
0.0%
10.0%
20.0%
30.0%
40.0%
50.0%
60.0%
70.0%
80.0%
90.0%
100.0%
CY 2007 CY 2008 CY 2009 CY 2010 CY 2011
2011 National Medicaid NCQA HEDIS Average = 96.1%

MONITORING ACCESS TO CARE IN NEW HAMPSHIRE’S MEDICAID PROGRAM: REVIEW OF KEY INDICATORS, AUGUST 2012 New Hampshire Department of Health and Human Services Office of Medicaid Business and Policy
46
Figure 56. Percent of Continuously Enrolled NH Medicaid Child Beneficiaries With a Preventive or Other Ambulatory Service, SFY 2007‐2011 by Age: 25 Months to 6 Years
Figure 57. Percent of Continuously Enrolled NH Medicaid Child Beneficiaries With a Preventive or Other Ambulatory Service, SFY 2007‐2011 by Age: 7 to 11 Years
92.3%
89.7% 89.9% 91.5% 91.4% 90.8%
93.2% 93.3% 94.7% 94.5% 93.9%
0.0%
10.0%
20.0%
30.0%
40.0%
50.0%
60.0%
70.0%
80.0%
90.0%
100.0%
CY 2007 CY 2008 CY 2009 CY 2010 CY 2011
2011 National Medicaid NCQA HEDIS Average = 88.3%
87.2%
82.5% 83.6%87.0% 86.3% 85.8%
85.7% 86.7%90.1% 89.2% 88.6%
0.0%
10.0%
20.0%
30.0%
40.0%
50.0%
60.0%
70.0%
80.0%
90.0%
100.0%
CY 2007 CY 2008 CY 2009 CY 2010 CY 2011
2011 National Medicaid NCQA HEDIS Average = 90.2%

MONITORING ACCESS TO CARE IN NEW HAMPSHIRE’S MEDICAID PROGRAM: REVIEW OF KEY INDICATORS, AUGUST 2012 New Hampshire Department of Health and Human Services Office of Medicaid Business and Policy
47
Figure 58. Percent of Continuously Enrolled NH Medicaid Child Beneficiaries With a Preventive or Other Ambulatory Service, SFY 2007‐2011 by Age: 12 to 18 Years
Figure 59. Percent of Continuously Enrolled NH Medicaid Child Beneficiaries With a Preventive or Other Ambulatory Service, CY 2007‐2011: Metropolitan Counties
93.2%
90.7% 90.4% 91.5% 92.8% 92.8%
91.6% 91.4% 92.4% 93.6% 93.6%
0.0%
10.0%
20.0%
30.0%
40.0%
50.0%
60.0%
70.0%
80.0%
90.0%
100.0%
SFY 2007 SFY 2008 SFY 2009 SFY 2010 SFY 2011
2011 National Medicaid NCQA HEDIS Average (12‐19 years) = 88.2%
Note: will be updated to calendar year in next report
89.9%
87.3% 88.0%90.2% 89.2% 88.9%
89.6% 90.2%92.4% 91.2% 91.0%
0.0%
10.0%
20.0%
30.0%
40.0%
50.0%
60.0%
70.0%
80.0%
90.0%
100.0%
CY 2007 CY 2008 CY 2009 CY 2010 CY 2011

MONITORING ACCESS TO CARE IN NEW HAMPSHIRE’S MEDICAID PROGRAM: REVIEW OF KEY INDICATORS, AUGUST 2012 New Hampshire Department of Health and Human Services Office of Medicaid Business and Policy
48
Figure 60. Percent of Continuously Enrolled NH Medicaid Child Beneficiaries With a Preventive or Other Ambulatory Service, CY 2007‐2011: Non‐Metropolitan Counties
Figure 61. Percent of Continuously Enrolled NH Medicaid Adult Beneficiaries With a Preventive or Other Ambulatory Service, CY 2007‐2011 by Age: 20 to 44 Years
88.7%
85.7% 86.6%89.3% 88.5% 87.6%
88.3% 89.1%91.7% 90.8% 89.9%
0.0%
10.0%
20.0%
30.0%
40.0%
50.0%
60.0%
70.0%
80.0%
90.0%
100.0%
CY 2007 CY 2008 CY 2009 CY 2010 CY 2011
87.4%
85% 86% 88% 87% 86%
89% 90% 91% 90% 89%
0.0%
10.0%
20.0%
30.0%
40.0%
50.0%
60.0%
70.0%
80.0%
90.0%
100.0%
CY 2007 CY 2008 CY 2009 CY 2010 CY 2011
2011 National Medicaid NCQA HEDIS Average = 81.2%

MONITORING ACCESS TO CARE IN NEW HAMPSHIRE’S MEDICAID PROGRAM: REVIEW OF KEY INDICATORS, AUGUST 2012 New Hampshire Department of Health and Human Services Office of Medicaid Business and Policy
49
Figure 62. Percent of Continuously Enrolled NH Medicaid Adult Beneficiaries With a Preventive or Other Ambulatory Service, CY 2007‐2011 by Age: 45 to 64 Years
Figure 63. Percent of Continuously Enrolled NH Medicaid Adult Beneficiaries With a Preventive or Other Ambulatory Service, CY 2007‐2011: Metropolitan Counties
90.7%
87% 87% 89% 89% 88%
93% 93% 95% 94% 93%
0.0%
10.0%
20.0%
30.0%
40.0%
50.0%
60.0%
70.0%
80.0%
90.0%
100.0%
CY 2007 CY 2008 CY 2009 CY 2010 CY 2011
2011 National Medicaid NCQA HEDIS Average = 86.1%
88.7%
85.7% 85.6% 87.6% 87.0% 86.8%
90.1% 89.9% 91.7% 90.9% 90.7%
0.0%
10.0%
20.0%
30.0%
40.0%
50.0%
60.0%
70.0%
80.0%
90.0%
100.0%
CY 2007 CY 2008 CY 2009 CY 2010 CY 2011

MONITORING ACCESS TO CARE IN NEW HAMPSHIRE’S MEDICAID PROGRAM: REVIEW OF KEY INDICATORS, AUGUST 2012 New Hampshire Department of Health and Human Services Office of Medicaid Business and Policy
50
Figure 64. Percent of Continuously Enrolled NH Medicaid Adult Beneficiaries With a Preventive or Other Ambulatory Service, CY 2007‐2011: Non‐Metropolitan Counties
Figure 65. Percent of Discharges for Hospitalization for Mental Health Disorder Treatment Where the Member Had a Follow‐Up Visit Seven 7 Days, CY 2007‐2011 by Age: 7 to 18 Years
88.2%
84.3%86.6% 88.1% 87.6% 85.9%
89.4%91.7% 93.0% 92.3% 90.4%
0.0%
10.0%
20.0%
30.0%
40.0%
50.0%
60.0%
70.0%
80.0%
90.0%
100.0%
CY 2007 CY 2008 CY 2009 CY 2010 CY 2011
59.1%
50.9%
44.1%47.3% 49.1% 50.0%
69.9%
63.8% 65.2% 66.7% 68.1%
0.0%
10.0%
20.0%
30.0%
40.0%
50.0%
60.0%
70.0%
80.0%
90.0%
100.0%
CY 2007 CY 2008 CY 2009 CY 2010 CY 2011

MONITORING ACCESS TO CARE IN NEW HAMPSHIRE’S MEDICAID PROGRAM: REVIEW OF KEY INDICATORS, AUGUST 2012 New Hampshire Department of Health and Human Services Office of Medicaid Business and Policy
51
Figure 66. Percent of Discharges for Hospitalization for Mental Health Disorder Treatment Where the Member Had a Follow‐Up Visit Within 7 Days, CY 2007‐2011 by Age: 19 and Older
Figure 67. Percent of Discharges for Hospitalization for Mental Health Disorder Treatment Where the Member Had a Follow‐Up Visit Within 30 Days, CY 2007‐2011 by Age: 7 to 18 Years
59.4%
52.2%47.3% 45.5%
50.5% 52.1%
66.5%
61.2%59.1%
64.6% 66.7%
0.0%
10.0%
20.0%
30.0%
40.0%
50.0%
60.0%
70.0%
80.0%
90.0%
100.0%
CY 2007 CY 2008 CY 2009 CY 2010 CY 2011
Note: Measure does not included discharges by adults age 22 to 64 from the state psychiatric facility because these claims are not reimbursed by NH Medicaid. A method will be developed for inclusion of those discharges in a
81.2%
66.8% 66.3% 66.8% 68.0%70.5%
88.5% 90.0%87.6% 88.5%
91.8%
0.0%
10.0%
20.0%
30.0%
40.0%
50.0%
60.0%
70.0%
80.0%
90.0%
100.0%
CY 2007 CY 2008 CY 2009 CY 2010 CY 2011

MONITORING ACCESS TO CARE IN NEW HAMPSHIRE’S MEDICAID PROGRAM: REVIEW OF KEY INDICATORS, AUGUST 2012 New Hampshire Department of Health and Human Services Office of Medicaid Business and Policy
52
Figure 68. Percent of Discharges for Hospitalization for Mental Health Disorder Treatment Where the Member Had a Follow‐Up Visit Within 30 Days, CY 2007‐2011 by Age: 19 and Older
Beneficiary Assistance and Satisfaction
Beneficiary Requests for Assistance Accessing Providers As detailed further in the Beneficiary Engagement chapter of this report, New Hampshire Medicaid maintains a Client Services unit with a toll free number that responds to beneficiary requests for assistance in finding providers. Client Services systematically tracks information about these requests in a database. An increasing trend in requests for assistance finding a provider could be an indication that there is an emerging access problem triggering the need for further research. Client Services also often receives information from beneficiaries regarding the reason they need help finding a provider. While this information is anecdotal, it too may lead to further research.
The information from Client Services is available on a timelier basis than utilization data that requires a lag period to allow for claims to be submitted and processed. In this report, and in future reporting, Client Services data will be one quarter more current than information based on claims data. Because of this, Client Services information provides the best early warning indicator of potential access problem.
The figure below shows the trend in beneficiary requests for assistance finding a provider. Major New Hampshire Medicaid payment changes are indicated and control limits at the third standard deviation of the historical data are included to provide a trigger indicating a potential access problem requiring further investigation. The overall trend is presented, followed by detail on the trends by metropolitan and non‐metropolitan areas of the State.
74.0%
69.2% 67.4%62.4%
65.2% 65.9%
85.6% 83.8%
78.2%81.1% 82.1%
0.0%
10.0%
20.0%
30.0%
40.0%
50.0%
60.0%
70.0%
80.0%
90.0%
100.0%
CY 2007 CY 2008 CY 2009 CY 2010 CY 2011
Note: Measure does not included discharges by adults age 22 to 64 from the state psychiatric facility because these claims are not reimbursed by NH Medicaid. A method will be developed for inclusion of those discharges in a

MONITORING ACCESS TO CARE IN NEW HAMPSHIRE’S MEDICAID PROGRAM: REVIEW OF KEY INDICATORS, AUGUST 2012 New Hampshire Department of Health and Human Services Office of Medicaid Business and Policy
53
For overall call data and data from members living in metropolitan counties at no point during the time period does the control chart indicate a potential access issue requiring further research. However, the data for non‐metropolitan counties in the fourth quarter of CY 2011 did cross the control limit, which resulted in further research and action.
Research determined that the spike in calls asking for provider assistance was because of the Lakes Region General Hospital's decision to close some of their practices to adult Medicaid beneficiaries. In late October, 2011, Client Services had 32 calls from adult Medicaid beneficiaries in the Lakes Region needing new primary care physicians. After Client Services performed telephone outreach to the same population, we had an additional 79 calls to find or discuss providers in the Lakes Region. The above calls, totaling 111, were 35% of the calls from non‐metropolitan areas requiring assistance with providers.
Since that time, after the assistance was provided, these types of calls have returned to the normal volume within the control limits.
Figure 69. Beneficiary Requests for Assistance Accessing Providers per 1,000 NH Medicaid Beneficiaries, CY 2007‐2012: Total Population
2.7
1.2
3.1
Hospital Rate Reductions DSH ReductionDSH Redesign
0.0
0.5
1.0
1.5
2.0
2.5
3.0
3.5
2007QTR 3
2007QTR 4
2008QTR 1
2008QTR 2
2008QTR 3
2008QTR 4
2009QTR 1
2009QTR 2
2009QTR 3
2009QTR 4
2010QTR 1
2010QTR 2
2010QTR 3
2010QTR 4
2011QTR 1
2011QTR 2
2011QTR 3
2011QTR 4
2012QTR 1
2012QTR 2
Rate per 1,000 Mean Rate Control Limit

MNeOf
ONITORING ACCESSew Hampshire Depffice of Medicaid B
Figure 70
Figure 71
0.0
0.5
1.0
1.5
2.0
2.5
3.0
3.5
4.0
4.5
200QTR
0.0
0.5
1.0
1.5
2.0
2.5
3.0
200QTR
S TO CARE IN NEW Hpartment of HealthBusiness and Policy
. BeneficiarBeneficiar
. BeneficiarBeneficiar
Hospital Rate
07R 3
2007QTR 4
2008QTR 1
2QT
Hospital Rat
07R 3
2007QTR 4
2008QTR 1
2QT
HAMPSHIRE’S MEDh and Human Servy
ry Requests fories, CY 2007‐
ry Requests fories, CY 2007‐
Reductions
008TR 2
2008QTR 3
2008QTR 4
Ra
te Reductions
008TR 2
2008QTR 3
2008QTR 4
Ra
DICAID PROGRAM: vices
or Assistance‐2012: Metro
or Assistance‐2012: Non‐M
2009QTR 1
2009QTR 2
200QTR
ate per 1,000
2009QTR 1
2009QTR 2
200QTR
ate per 1,000
REVIEW OF KEY IND
e Accessing Propolitan Coun
e Accessing PrMetropolitan
09R 3
2009QTR 4
2010QTR 1
2Q
Mean Rate
09R 3
2009QTR 4
2010QTR 1
2Q
Mean Rate
DICATORS, AUGUST
roviders per nties
roviders per Counties
DSH Redesign
2010QTR 2
2010QTR 3
2010QTR 4
Control L
DSH Redesign
2010QTR 2
2010QTR 3
2010QTR 4
Control L
T 2012
1,000 NH Me
1,000 NH Me
DSH Reduc
042011QTR 1
2011QTR 2
20QT
Limit
DSH Red
042011QTR 1
2011QTR 2
20QT
Limit
edicaid
edicaid
ction
11R 3
2011QTR 4
2012QTR 1 Q
uction
11R 3
2011QTR 4
2012QTR 1 Q
54
3.2
1.6
3.8
2012QTR 2
1.9
0.6
2.4
2012QTR 2
MONITORING ACCESS TO CARE IN NEW HAMPSHIRE’S MEDICAID PROGRAM: REVIEW OF KEY INDICATORS, AUGUST 2012 New Hampshire Department of Health and Human Services Office of Medicaid Business and Policy
55
Beneficiary Satisfaction Survey New Hampshire Medicaid has recently contracted with a vendor to administer and report the results from the core Adult and Child versions of the Agency for Healthcare Research and Quality’s (AHRQ) Consumer Assessment of Healthcare Providers and Systems (CAHPS) Survey for Medicaid populations. The survey is being administered in July and August 2012 with data to be presented in the next update to this report, along with national benchmarks, on the following measures:
• Rating of Doctors ‐ Children • Rating of Doctors ‐ Adults • Getting Needed Care ‐ Children • Getting Needed Care ‐ Adults • Getting Care Quickly ‐ Children • Getting Care Quickly ‐ Adults
Measures that show results less than the fiftieth percentile as defined by the most recent year available of NCQA Quality Compass for Medicaid Managed Care Organizations will prompt further investigation, beginning with deeper analysis of the data to see if demographic or regional differences are driving the lower than expected performance.
Conclusion At this time, all measures are within normal limits, with no detectable negative trends. This report includes measures of beneficiary enrollment trends, provider availability, utilization of hospital, primary care and behavioral health services, and beneficiary engagement trends over the most recent five‐year period. With the exception of one data point, all measures are within normal limits. One data point in Figure 71, Beneficiary Request for Assistance, in the fourth quarter of 2011 exceeds the control limit. This situation was related to Lakes Region General Healthcare redirecting its adult patients to other local practices. Corrective action was taken as described in the introduction to that measure. As a result, call volume returned to a normal level in the following quarter, indicating resolution of the LRGH event.
In some cases, trends are improving. The ratio of beneficiaries to active in‐state primary care providers in Figure 10 indicates that an increasing number of providers are offering primary care services to Medicaid beneficiaries. Emergency room utilization for conditions potentially treatable in a primary care setting in Figure 28 through Figure 33 is improving, most notably in Figure 30, blind and disabled adult categories, Figure 31, adults in the children and family aid categories, and Figure 33, the non‐metropolitan areas. The trends in total emergency room use in Figure 34 through Figure 42 are also improving in some categories, most notably in Figure 37, foster children, and Figure 42, non‐metropolitan areas. Nine of the eleven well child measures in Figure 45 through Figure 53 show upward improvements over the past five years, with the remaining two measures above national average.
Figure 19 through Figure 27, Seasonally Adjusted Physician/APRN/Clinic Utilization per 1,000, indicate a spike in utilization during the 2009 time period and a steady leveling off since that time. The spike relates to the H1N1 pandemic that occurred then, with the leveling off of utilization demonstrating a return to non‐pandemic utilization levels. At all times, the data points did not exceed the control limits.
MONITORING ACCESS TO CARE IN NEW HAMPSHIRE’S MEDICAID PROGRAM: REVIEW OF KEY INDICATORS, AUGUST 2012 New Hampshire Department of Health and Human Services Office of Medicaid Business and Policy
56
4. Beneficiary Engagement
New Hampshire Medicaid engages beneficiaries in a variety of ways to keep abreast of medical needs, population characteristics, and beneficiary satisfaction with provider availability and quality of services. The Medical Care Advisory Committee and the New Hampshire Medicaid Client Services Unit help New Hampshire Medicaid understand the needs of Medicaid beneficiaries, monitor beneficiary trends, and respond with corrective action as needed.
New Hampshire Medicaid Client Services Unit For the past twenty years, New Hampshire Medicaid has operated a client services call center as a service to beneficiaries, and also as a means of engaging with beneficiaries to determine and assist with beneficiary needs. It has also been used as a real‐time surveillance tool to monitor access problems as phone calls from beneficiaries alert staff to disruptions to access and provider availability. The New Hampshire Medicaid Client Services Unit engages with Medicaid beneficiaries on a daily basis. They manage beneficiaries’ concerns, requests for information, provider access and availability difficulties, and as a result, are on the forefront of New Hampshire Medicaid’s efforts to understand beneficiaries’ needs, and monitor, identify and respond to provider access difficulties. In addition to anecdotal evidence of access concerns, the Client Services Unit systematically provides New Hampshire Medicaid with a weekly beneficiary call report in order to monitor beneficiary concerns.
New Hampshire Medicaid’s Client Services Unit engages Medicaid beneficiaries by phone and in writing regarding services available to them. All beneficiaries are informed from the outset that assistance is available from the Client Services Unit should they have any difficulty with provider access and availability or with scheduling appointments. Beneficiaries’ membership cards are sent to them in a card carrier that contains the toll‐free telephone number of the Client Services Unit, as well as information concerning the availability of assistance finding doctors and dentists. The mailing also informs beneficiaries of the availability of assistance with transportation options and costs and professional interpretation services so that these common difficulties do not become barriers to healthcare access. Additionally, the Medicaid Client Services Unit sends any family where the new enrollee is a child a welcome packet with an informational flyer. This flyer provides basic information concerning Medicaid services and providers. New Hampshire Medicaid contact information is provided on the back of this flyer.
The Client Services Unit calls all new enrollees to determine if the clients’ current health care providers are enrolled in the Medicaid program. If any clients need help accessing new or additional providers, that need will be determined during this initial phone call. If help is needed, Client Services will provide the clients with a list (via e‐mail, verbally, by regular mail, or fax) of currently enrolled Medicaid providers who are able to serve them.

MONITORING ACCESS TO CARE IN NEW HAMPSHIRE’S MEDICAID PROGRAM: REVIEW OF KEY INDICATORS, AUGUST 2012 New Hampshire Department of Health and Human Services Office of Medicaid Business and Policy
57
The Medicaid Client Services Unit’s weekly report is produced every Monday for the previous week. The key components of this report are the number of beneficiary call logs started and completed, the number of incoming beneficiary calls taken live or sent to voicemail, and the number of beneficiary from clients seeking assistance finding a provider.
There is a separate log for each call, detailing the issues presented, discussed, and resolved. Client Services strives to respond to all calls as they come in. For those beneficiary calls that go to voicemail, staff returns more than 98% of the calls the same day.
Beneficiary calls to the Client Services Unit asking for assistance to locate a provider are tracked by requested provider type. The number of calls is given, as well as the total number of Medicaid beneficiaries requesting providers. For example, one caller may ask for the name of a dentist for her 4 children. This request is logged in as one call and four beneficiaries.
From the period of 2007 – 2011, New Hampshire Medicaid has seen no significant spikes in beneficiary calls requesting assistance finding providers who accept Medicaid, with the exception of the time period when one of the state’s hospital systems, Lakes Region General Hospital (LRGH), notified beneficiaries in November 2011 that it would be closing its physician practices to some Medicaid beneficiaries. Medicaid beneficiaries were the first to alert New Hampshire Medicaid of this closure notification and potential disruption in beneficiaries’ access to care. Client Services Unit staff immediately informed the Medicaid Director, Medicaid Finance Director, and other Medicaid staff of the LRGH action. A corrective action plan was immediately developed and implemented. The Client Services Unit helped each beneficiary who needed help finding alternative providers. Engaging with beneficiaries through their phone calls and reviewing the beneficiary call center report helps New Hampshire Medicaid monitors access to care.
When a beneficiary calls New Hampshire Medicaid requesting assistance finding a provider, the Client Services Unit locates providers, through a search of its provider database by provider type, within a 25‐mile radius of the beneficiary’s home. Client Services provides the list of appropriate providers to the beneficiary over the phone, by postal mail, email, or fax, according to each beneficiary’s preference. The provider list includes providers’ names, street addresses, and phone numbers.
New Hampshire Medicaid, through its Client Services Unit, has found alternative providers for every beneficiary told by their providers that they no longer accept Medicaid. Client Services maintains a database of providers who accept new Medicaid patients, by regularly calling providers’ offices for updated information. All difficulties presented by beneficiaries concerning healthcare access issues have been successfully addressed and resolved by the Medicaid Client Services Unit.
New Hampshire Medicaid also engages beneficiaries and potential beneficiaries by providing brochures and other informational materials to approximately 1,900 locations statewide, including schools, hospitals, town/city welfare offices, courthouses, legal assistance programs and unemployment offices. Additional distribution points include childcare providers, soup kitchens/food pantries, homeless shelters, and health care providers (ob‐gyn, pediatric and primary care). Targeted outreach is currently being conducted for adolescents, culturally/racially diverse groups, and the recently unemployed. New

MONITORING ACCESS TO CARE IN NEW HAMPSHIRE’S MEDICAID PROGRAM: REVIEW OF KEY INDICATORS, AUGUST 2012 New Hampshire Department of Health and Human Services Office of Medicaid Business and Policy
58
Hampshire Medicaid also helps families access health care coverage at the community level through its Application Assistors program. Application assistors are stationed at nineteen hospitals, eleven Federally Qualified Health Centers (FQHC) and community health centers, and other primary care provider and referral organization sites.
Medical Care Advisory Committee (MCAC) New Hampshire Medicaid created the New Hampshire Medical Advisory Committee (MCAC), well over twenty years ago, to advise the Medicaid Director about New Hampshire Medicaid health policy, planning, and medical care services. The primary purpose of New Hampshire’s MCAC is to serve as a source of consumer and stakeholder involvement in the Medicaid program. The MCAC has also had an advisory role in the design and implementation of Medicaid Managed Care in New Hampshire. New Hampshire’s MCAC meets on a monthly basis and, among other things, reviews and recommends Medicaid policy and planning proposals; discusses various Medicaid provider and beneficiary issues; and ensures communication between MCAC members and the New Hampshire Medicaid leadership. It has been and will continue to be used to provide a forum for reviewing data and analysis that addresses issues related to Medicaid beneficiary access to care in New Hampshire and for planning Step Two of the transition to managed care.
The New Hampshire MCAC has 21 members, comprised of Medicaid beneficiaries [5], beneficiary/consumer advocacy groups members of the general public concerned about health service delivery to Medicaid Beneficiaries [4]; healthcare professionals who serve Medicaid beneficiaries [8], and other knowledgeable individuals with experience in healthcare, rural health, Medicaid law and policy, healthcare financing, quality assurance, patient's rights, health planning, pharmacy care [4], and those familiar with the healthcare needs of low‐income population groups and the Medicaid population.
These meetings are open to the public, and routinely, three representatives of the general public are in attendance. In addition, DHHS program staff members from all aspects of the New Hampshire Medicaid program are in attendance.
Stakeholder Meetings As a part of the process of determining and/or implementing major policy change at the Department of Health and Human Services, a stakeholder engagement process is used whereby community forums are held throughout the State to provide information to and solicit input from community partners, providers, institutions, and beneficiaries. The purpose of stakeholder meetings are to: 1. Begin the process of sustained dialogue leading to shared understanding; 2. Set principles and strategies to guide transformation; and 3. Outline the approach for moving forward.
Stakeholder meetings have occurred multiple times on a variety of subjects over the past several years. Most relevant to this reporting are the following: In 2008, stakeholders were brought together to engage in a Healthcare transformation project designed to examine business processes to streamline and drive out non‐value added activities that contribute to costs that could better be directed to the
MONITORING ACCESS TO CARE IN NEW HAMPSHIRE’S MEDICAID PROGRAM: REVIEW OF KEY INDICATORS, AUGUST 2012 New Hampshire Department of Health and Human Services Office of Medicaid Business and Policy
59
care of clients. The stakeholder council meetings were organized into three subject matter groups of public health/medical services, human services, and long term care services. The MCAC has representation on each council. Ultimately, the discussions led to the "Front Door" project, which streamlines how clients enter and access services in New Hampshire.
In 2009 and into 2010, chief executive and finance officers from New Hampshire’s 26 acute care hospitals and two rehabilitation hospitals were brought together in a series of meetings to explore alternative payment methods in the Disproportionate Share Program which ultimately resulted in a revised distribution methodology of available DSH dollars proportional to the amount of uncompensated care provided by hospitals.
The New Hampshire Department of Health and Human Services has just completed twelve information sessions throughout the State on the new Medicaid Care Management program. The meetings focused on those who rely on Medicaid services as well as family members and caregivers and for human service agency case managers or service coordinators who work with them. Information covered included the first step of the new Medicaid Care Management program scheduled to launch later this year. The first step encompasses those Medicaid services that address medical needs, such as doctor visits, inpatient and outpatient hospital visits, prescriptions, mental health services, home health services, speech therapy, and audiology services.
In summary,
• New Hampshire Medicaid regularly engages with Medicaid beneficiaries directly and indirectly, via beneficiary advocates and Medicaid providers, through its participation in the Medical Care Advisory Committee. The MCAC meets on a monthly basis.
• In addition to MCAC meetings, DHHS holds stakeholder meetings from time to time when considering or implementing major policy changes.
• New Hampshire Medicaid regularly engages with Medicaid beneficiaries who call the hotline managed by the Medicaid Client Services Unit. The Unit entertains about 800 calls per week to and from beneficiaries posing a variety of questions ranging from benefit verifications to assistance finding transportation or a doctor.

MONITORING ACCESS TO CARE IN NEW HAMPSHIRE’S MEDICAID PROGRAM: REVIEW OF KEY INDICATORS, AUGUST 2012 New Hampshire Department of Health and Human Services Office of Medicaid Business and Policy
60
5. Plan for Monitoring Access
Updates to Monitoring As part of its access monitoring strategy, New Hampshire Medicaid will conduct these periodic reviews of access compliance. Data analysis and reporting will be conducted quarterly and within forty‐five days after the close of the quarter. New Hampshire Medicaid will continue to review and revise the Monitoring Plan itself to ensure the continued relevance of the selected indicators, and to expand it over time to include other Medicaid benefits, including additional behavioral health, long‐term care services, and managed care. The MCAC will be invited to participate in these quarterly reviews.
Investigation of Access Issues and Corrective Actions New Hampshire Medicaid has a two‐tier detection system in place. The first detection method is based on the systematic, ongoing monitoring as displayed in this report and best address access issues that are slow to develop over time. The second method is the real‐time and individualized detection and resolution that occurs by the Medicaid Client Services Unit. This method detects acute access issues that may require an immediate response from the State.
Should a systemic access issue be detected through New Hampshire’s quarterly access monitoring report, New Hampshire Medicaid would activate a Corrective Action Response Team to research the specific cause(s) of the problem and make recommendations for corrective action to the State Medicaid Director and the Department’s Medicaid Executive Team within 30 days of discovering the problem. The multidisciplinary response team shall consist of a member of each of the following units: the Medicaid Client Services Unit, the Financial Management and Reimbursement Unit, the Benefits Management Unit, the Provider Network Management Unit, and the Health Data and Analytics Unit. Its role would be to communicate with beneficiaries and providers, as necessary, to assess additional data to determine the cause of the access issue, propose corrective actions, and develop additional monitoring systems as necessary to monitor progress toward access compliance. The existing MCAC will also provide a readily available resource to engage stakeholders in this process. The timing and nature of any corrective actions taken will necessarily depend upon the particular nature and magnitude of the access problem identified and the beneficiary population affected.
Corrective actions shall set a target for compliance with access requirements as soon as possible, but no later than within one year of the corrective action plan approval, depending on the complexity and magnitude of the problem. Possible corrective actions include but are not limited to:
• Resolving provider administrative burdens, such as claims submission and payment issues; • Assisting beneficiaries in obtaining necessary primary or specialty care services through provider
referral, transportation assistance, or enrollment in Medicaid Managed Care;

MONITORING ACCESS TO CARE IN NEW HAMPSHIRE’S MEDICAID PROGRAM: REVIEW OF KEY INDICATORS, AUGUST 2012 New Hampshire Department of Health and Human Services Office of Medicaid Business and Policy
61
• Assessing and realigning covered benefits so that additional resources can be directed toward a resource‐challenged area.
• Incentivizing the expansion of healthcare providers in underserved areas in the State. • Restructuring rates and targeting them to address the particular underserved areas.
Surveillance by the Medicaid Clients Services Unit is a second method of detecting any acute issues to access of care and providing problem resolution/corrective action on a real time, case‐by case basis. New Hampshire has long had in place an 800‐telephone number that beneficiaries can call for assistance. The phone number appears on the Medicaid member card, in the Member welcome packet, and in all beneficiary communications and outreach materials. The Medicaid Client Services Unit manages a call center, providing ombudsman services to clients who need assistance, maintaining an up‐to‐date network reference guide, and offering referrals to providers upon request, and providing transportation assistance and transportation reimbursement. In addition to case‐by‐case problem resolution, the Medical Client Services unit maintains call logs and is alert for any accumulation of similar complaints that indicate a trend.
Should an acute access issue be detected (as in the case of LRGH), the State Medicaid Director will be notified immediately. The Medicaid Director will be responsible for alerting the Department's Executive Team and the CMS Regional Office. The Medicaid Director will activate a Corrective Action Response Team to research the specific causes including gathering facts directly from those providers implicated in the access issue, analyze to project potential client impact, confirm real time available alternative provider availability, and augment staffing to the Client Services Unit to include additional staff and extended hours of operations. Specific messaging to Medicaid beneficiaries potentially impacted will be issued via media outlets, community network partners, and social media including Facebook and Twitter. These response strategies will be implemented on the same day that New Hampshire Medicaid becomes aware of a potential acute access issue. For the first 3 days post an acute event, the Medicaid Director will conduct a conference call update with the Corrective Action Response Team members at 8:00 a.m. each day. In addition the Medicaid Director will provide status reports via email by 12:00 Noon and 4:30 p.m. each day. As the time goes on, the reporting schedule will be modified as appropriate. A written synopsis of the acute access issue and the New Hampshire Medicaid program's response will be made available to CMS and the general public 30 days after the Medicaid Director has deemed the acute incident to be resolved and included in the next published access monitoring report.
Access Monitoring under Medicaid Managed Care In 2011, the New Hampshire Legislature directed the Commissioner of the Department of Health and Human Services (DHHS) to develop a comprehensive, statewide managed care program for all Medicaid beneficiaries. Upon CMS approval and successful readiness reviews, DHHS will begin enrolling Medicaid beneficiaries into one of three Managed Care Organizations (MCOs) and support beneficiaries through the transition into a managed care program. Managed Care contractors are currently developing their networks in response to the State's desire for adequate access within the managed care program, and are required to demonstrate compliance prior to being approved to proceed with enrollment. The

MONITORING ACCESS TO CARE IN NEW HAMPSHIRE’S MEDICAID PROGRAM: REVIEW OF KEY INDICATORS, AUGUST 2012 New Hampshire Department of Health and Human Services Office of Medicaid Business and Policy
62
MCOs will provide a comprehensive risk‐based, capitated program for providing healthcare services to beneficiaries enrolled in the New Hampshire Medicaid Program and provide for all aspects of managing such program.
With this new Care Management program, DHHS has the opportunity to develop a comprehensive New Hampshire Medicaid Quality Strategy, building on New Hampshire legislative goals of value, quality assurance, and efficiency, and focused on the health of Medicaid beneficiaries. DHHS’ Quality Strategy, currently in the review and approval process, will serve to assure stakeholders that New Hampshire’s managed care organizations (MCOs) are in contract compliance, have committed adequate resources to perform internal monitoring and ongoing quality improvement, and actively contribute to healthcare improvement for the State’s most vulnerable citizens. New Hampshire is creating a comprehensive outreach and education plan to assure diverse methods of engaging clients. All New Hampshire Medicaid beneficiaries will be encouraged to enroll in managed care and will be given the opportunity to choose the managed care plan that best suits their needs. The Quality Strategy articulates the MCO reporting that will provide data driven analysis to New Hampshire Medicaid and CMS of MCO provider‐network adequacy. In addition, New Hampshire’s External Quality Review Organization (EQRO), for which the procurement process will be starting in September, through validation of MCO data and reporting, will serve as an additional level of provider network adequacy and access oversight.
Beginning in December 2012, access issues will be addressed by the MCOs in the first instance. New Hampshire Medicaid will monitor compliance with each MCO’s contractual responsibilities, including, responsibilities for assuring access and quality, and will continue to assure access to care for New Hampshire Medicaid beneficiaries.
To help ensure appropriate access to healthcare services for Medicaid beneficiaries in its managed care program and pursuant to DHHS’ Care Management Contract with the MCOs, the MCOs are required, inter alia, to:
• implement procedures that ensure that Medicaid beneficiaries have access to an ongoing source of primary care appropriate to their individual needs;
• provide non‐emergent medical transportation to ensure Medicaid beneficiaries receive medically necessary services and ensure that a beneficiary’s lack of transportation is not a barrier to accessing care;
• maintain a Member Services Department to assist Medicaid beneficiaries and their family members obtain services under the Care Management Program;
• operate a New Hampshire specific call center to handle member inquiries; • develop and facilitate a Medicaid member advisory board composed of members who
represent an MCO’s member population; • hold bi‐annual, in‐person regional member meetings to obtain feedback and take questions
from members; • conduct a member satisfaction survey (CAHPS) to gain a broader perspective of member
opinions;
MONITORING ACCESS TO CARE IN NEW HAMPSHIRE’S MEDICAID PROGRAM: REVIEW OF KEY INDICATORS, AUGUST 2012 New Hampshire Department of Health and Human Services Office of Medicaid Business and Policy
63
• ensure that services are provided in a culturally competent manner to all Medicaid members, including those with limited English proficiency;
• develop appropriate methods of communicating and working with its members who do not speak English as a first language, as well as members who are visually and hearing impaired, and accommodating members with physical and cognitive disabilities and different literacy levels, learning styles, and capabilities;
• develop, implement, and maintain a Grievance System under which Medicaid members, or providers acting on their behalf, may challenge the denial of coverage or payment for medical assistance and which includes a grievance process, an appeal process, and access to the State’s fair hearing system; and
• publish a Provider Directory that shall be approved by DHHS.
In addition to the member‐focused provisions in the managed care contracts, DHHS will require each MCO to ensure provider availability for its Medicaid beneficiaries and to:
• have provider networks with a sufficient number of providers with sufficient capacity,
expertise and geographic distribution, to provide for all Medicaid‐covered services, and with reasonable choice for beneficiaries to meet their needs;
• submit to annual, external, independent review of the timeliness of and access to services covered under each MCO contract with DHHS;
• develop and maintain a statewide provider network that adequately meets the physical and behavioral health needs of enrolled Medicaid beneficiaries;
• report significant changes to the provider network to DHHS, with a transition plan to address member access to needed services, within seven days of any significant change;
• develop an active provider advisory board composed of a broad spectrum of provider types; • develop a provider satisfaction survey, which is required to be approved by DHHS and
administered by third party semi‐annually; • provide the results of the provider satisfaction survey to DHHS and post on the MCOs’
website; • meet contractual geographic access standards for all Medicaid beneficiaries in additions to
maintaining a provider network sufficient to provide all services to all of its Medicaid members;
• make services available for beneficiaries twenty‐four hours a day, seven days a week, when medically necessary; and
• develop and maintain a statewide provider network that adequately meets all covered physical and behavioral health needs of the covered population that provides for coordination and collaboration among providers and disciplines. See full text of Access and Network Management managed care contract provisions attached as Appendix B.
New Hampshire Medicaid will manage and monitor MCO performance and compliance with all contract provisions, including those addressing access, provider availability and delivery of quality care. With a primary goal of quality care, New Hampshire Medicaid requires the MCOs to:

MONITORING ACCESS TO CARE IN NEW HAMPSHIRE’S MEDICAID PROGRAM: REVIEW OF KEY INDICATORS, AUGUST 2012 New Hampshire Department of Health and Human Services Office of Medicaid Business and Policy
64
• provide for the delivery of quality care to improve the health status of beneficiaries, or if a beneficiary’s health condition is such that it cannot be improved then to maintain the beneficiary’s health;
• comply with the Quality Strategy for the New Hampshire Medicaid Care Management Program;
• have an ongoing quality assessment and performance improvement program for the services it provides beneficiaries;
• approach all clinical and non‐clinical aspects of quality assessment and performance improvement based on Continuous Quality Improvement (CQI)/Total Quality Management (TQM);
• have mechanisms in place that detect both under‐ and over‐utilization of services; • develop and operate a Quality Assessment and Performance Improvement (QAPI) Program
and to submit a QAPI Program Annual Summary as specified by DHHS; • maintain a QAPI structure that includes a planned systematic approach to improving clinical
and non‐clinical processes and outcomes; • adopt evidence‐based clinical practice guidelines built upon high quality data and strong
evidence considering the needs of Medicaid beneficiaries; • collaborate with DHHS’s External Quality Review Organization (EQRO) to develop studies,
surveys, and other analytic activities to assess the quality of care and services provided to beneficiaries, and shall supply data to the EQRO.

MONITORING ACCESS TO CARE IN NEW HAMPSHIRE’S MEDICAID PROGRAM: REVIEW OF KEY INDICATORS, AUGUST 2012 New Hampshire Department of Health and Human Services Office of Medicaid Business and Policy
65
6. Summary and Conclusion
Ensuring access to care is a priority of the New Hampshire Medicaid program. The foregoing report provides specific data and analysis that establish historical and current access levels for physician services, inpatient and outpatient services, rate structures, and the impact of DSH payments, all of which establish the following:
• The data showing historical and current access levels for physician services, inpatient and outpatient services, set forth in report Chapter 3, are within normal limits, with no detectable negative trends.
• The data showing the historical access to care based on participating provider network size and capacity, service utilization trends, and rate levels, set forth in report Chapter 3, are within normal limits, with no detectable negative trends.
• The trend analysis on data elements demonstrate that rate changes which occurred in 2008 and Disproportionate Share Program changes (described in Chapter 2) have not changed access levels.
• New Hampshire Medicaid presented evidence, set forth in Chapter 5 of the report, that indicates that it has regular, ongoing engagement with Medicaid beneficiaries in order to assess the unique characteristics and needs of beneficiaries, to monitor access to healthcare and other issues of concern to beneficiaries and to intervene on the behalf of any beneficiary requesting assistance with provider availability and access, or with any other issue creating a barrier to access.
• Provider access monitoring plans and procedures, set forth in Chapter 5, indicate that New Hampshire is well positioned to systematically monitor beneficiary needs, the strength and availability of the provider network, and beneficiary utilization of healthcare services.
• New Hampshire Medicaid’s systematic monitoring of access indicators help identify access problems for beneficiaries. Should access issues arise, New Hampshire Medicaid will take corrective actions, as set forth in Chapter 5, to resolve access issues for New Hampshire Medicaid beneficiaries.
In conclusion, New Hampshire Medicaid data indicates that Medicaid beneficiaries have similar access to healthcare as the general population in New Hampshire. All data collected and analyzed falls within control chart parameters. All data collected and analyzed falls within control chart parameters. Nothing has been detected in those control charts that would indicate a negative healthcare access trend. To the extent potential provider‐access issues have been identified at any point during the time period examined, i.e. 2007‐2011, New Hampshire Medicaid has intervened and resolved them.
New Hampshire Medicaid routinely monitors access indicators, i.e. beneficiary enrollment and demographics, provider enrollment and availability, and beneficiary utilization of health care services and will produce a quarterly data report similar to the report set forth above to measure and monitor
MONITORING ACCESS TO CARE IN NEW HAMPSHIRE’S MEDICAID PROGRAM: REVIEW OF KEY INDICATORS, AUGUST 2012 New Hampshire Department of Health and Human Services Office of Medicaid Business and Policy
66
beneficiary access to healthcare in New Hampshire. With the ability to identify access issues as they arise comes the concomitant ability of New Hampshire Medicaid to respond effectively to correct those issues. Although the data indicate no existing or projected access problems, should an access issue be identified through these monitoring systems, DHHS is ready to take corrective action measures on both a localized and system‐wide basis through the processes set forth in this report.
Furthermore, NH Medicaid will continue to review and refine its monitoring and response plans to assure that the report continues to add meaningful information and value to policy discussions and to the administration of the Medicaid Program.
By increasing New Hampshire Medicaid’s monitoring of the strength of provider network activity; surveying network capacity; conducting client surveys to assess their experiences with providers and their needs relative to access; increasing outreach to providers and beneficiaries; and transforming the New Hampshire Medicaid program from a fee‐for‐service plan to a managed care approach, New Hampshire will continue to ensure access for its Medicaid beneficiaries.

MONITORING ACCESS TO CARE IN NEW HAMPSHIRE’S MEDICAID PROGRAM: REVIEW OF KEY INDICATORS, AUGUST 2012 New Hampshire Department of Health and Human Services Office of Medicaid Business and Policy
67
7. Appendices

MONITORING ACCESS TO CARE IN NEW HAMPSHIRE’S MEDICAID PROGRAM: REVIEW OF KEY INDICATORS, AUGUST 2012 New Hampshire Department of Health and Human Services Office of Medicaid Business and Policy
68
Appendix A: New Hampshire Medicaid Community Health Center Access and Capacity Data was collected in May 2012 with the assistance of Bi‐State Primary Care Association.
Facility
Current Medicaid Patient Count
Capacity for additional patients
Wait time for routine appointments
Wait time for urgent appointments Notes
Lamprey Newmarket Metro 847 250 10 days
Same day or within 24 hours: Sick or acute patients
Could add provider capacity and take 1,300 in existing space
Lamprey Raymond Metro 932 300 15 days
Same day or within 24 hours: Sick or acute patients
Additional staff ‐Could accommodate another 800
Manchester Community Health Center Metro
3,553 500
New : Prenatal ‐ 1‐2 days Pediatrics 1‐2 weeks Adults 6‐8 weeks Established: Routine 1 week Physical Exams 4‐6weeks
Walk ins: Not available Urgent care:1‐2 days based on the urgency; if the situation warrants it, urgent needs are triaged to local ER
1,500 Pediatric patients currently enrolled in NHHK will transition from Dartmouth to MCHC. Will probably have room for another 500 Medicaid patients given current provider capacity
Harbor Care Clinic Harbor Homes ‐ Nashua Metro
88
Open availability for additional clients Same day Immediate
Families First in Portsmouth Metro
1,500
100 patients/300 in Oct. w/new physician
Same day: Children and adults 2 mornings a week: Pregnant women seen for routine visits
2 mornings a week: Walk‐ in's Same day slots: Every day for anyone who calls in the morning
White Mountain CHC in Conway NonMetro
1,334 134 2 weeks Same day
Goodwin Community Health in Somersworth Metro
3,099
2,500 3‐5 days Same day
Slots kept open daily for acutes and will be starting walk‐in times
Lamprey Health Care Nashua Metro
2,628
2,000 and could add provider capacity to take 3,000 more if necessary
Within 48 hours: new mother/child 10 days: Adults, non‐urgent enroll visit or regular check‐up
Within 24 hours: acute visit Same day: When possible
Family Health Center (Concord Hospital) NonMetro
3,708 10 per week
Same day to within 90 days ‐ complete physical for all patients Within 2 weeks: OB intake appt Same day
Family Health Center (Hillsborough) NonMetro
686 1 per week
Same day to within 90 days ‐ complete physical for all patients Within 2 weeks: OB intake appt Same day

MONITORING ACCESS TO CARE IN NEW HAMPSHIRE’S MEDICAID PROGRAM: REVIEW OF KEY INDICATORS, AUGUST 2012 New Hampshire Department of Health and Human Services Office of Medicaid Business and Policy
69
Facility
Current Medicaid Patient Count
Capacity for additional patients
Wait time for routine appointments
Wait time for urgent appointments Notes
Mid‐state Health Center ‐ Plymouth NonMetro
900
Significant or good capacity to see more patients
Same day or a few days. Some clinicians could be a month
Same day or next day
Coos County Family Health Services NonMetro
1,742 1,000
Child.&preg.women: Same day Adults: 0‐7 days
Urgent: Same day; 4 hrs a week July: Every afternoon opened for same day and for walk‐ ins (with a Family Nurse Practitioner that has just been hired) Right now, 4 hours/wk of open slots for walk‐ins/same days.
Ammonoosuc Comm. Health Srvs ‐ Littleton NonMetro
924 < age 19; 393 > age 20
Depending on the site, the access is variable, however when sent there, will work towards accommodating.
Same day visit per need basis:ACHS & non‐ACHS patients. Medical records need to be received & reviewed prior to establishing the patient as a health home patient. Each provider however based on a panel size may have variable capacity to accept more patients.
Same day/maybe at alternative site
Health First in Franklin NonMetro 1,391 600
3 wks: Routine follow up & non acute appt 4 wks: Full entry visits new patients 5 wks: Full physicals
Same day or next day. During peak days, Mon. & Fri. may be two days. New NP on staff for acute patients.
499 out of 1,391 new clients that came after LRGH stopped seeing Medicaid adults in regular outpatient practices and had 302 new uninsured clients

MONITORING ACCESS TO CARE IN NEW HAMPSHIRE’S MEDICAID PROGRAM: REVIEW OF KEY INDICATORS, AUGUST 2012 New Hampshire Department of Health and Human Services Office of Medicaid Business and Policy
70
Appendix B: Tabular Version of Data in Trend Charts
Figure 4. NH Medicaid Enrollment, CY 2007‐2012: Total Population Time Period Average Members 2007 QTR 1 82,880 2007 QTR 2 83,462 2007 QTR 3 83,444 2007 QTR 4 83,391 2008 QTR 1 84,380 2008 QTR 2 85,632 2008 QTR 3 86,783 2008 QTR 4 88,024 2009 QTR 1 90,866 2009 QTR 2 94,059 2009 QTR 3 96,178 2009 QTR 4 97,444 2010 QTR 1 98,287 2010 QTR 2 99,162 2010 QTR 3 99,813 2010 QTR 4 99,974 2011 QTR 1 100,362 2011 QTR 2 100,922 2011 QTR 3 100,952 2011 QTR 4 100,675 2012 QTR 1 100,426
Figure 5. NH Medicaid Enrollment, CY 2007‐2012: Child, Families and Children Eligibility Group
and
Figure 6. NH Medicaid Enrollment, CY 2007‐2012: Child Foster Care and Blind and Disabled Population
Time Period Blind and Disabled Families and Children Foster Care2007 QTR 1 522 60,041 1,9352007 QTR 2 526 60,522 1,9812007 QTR 3 515 60,448 1,9442007 QTR 4 525 60,383 1,9402008 QTR 1 536 60,962 1,9532008 QTR 2 564 61,879 1,9662008 QTR 3 580 62,672 1,9082008 QTR 4 599 63,478 1,8902009 QTR 1 604 65,423 1,8672009 QTR 2 618 67,856 1,8782009 QTR 3 619 69,560 1,8052009 QTR 4 628 70,597 1,8142010 QTR 1 605 71,192 1,7932010 QTR 2 596 71,756 1,7812010 QTR 3 597 72,260 1,7172010 QTR 4 613 72,450 1,7392011 QTR 1 598 72,788 1,7202011 QTR 2 611 73,199 1,7452011 QTR 3 597 73,450 1,6632011 QTR 4 606 73,447 1,6682012 QTR 1 612 73,433 1,679
Figure 7. NH Medicaid Enrollment, CY 2007‐2012: Adult Population by Eligibility Group Time Period Aged Blind and Disabled Families and Children2007 QTR 1 672 7,080 12,6302007 QTR 2 668 7,238 12,5282007 QTR 3 681 7,351 12,506
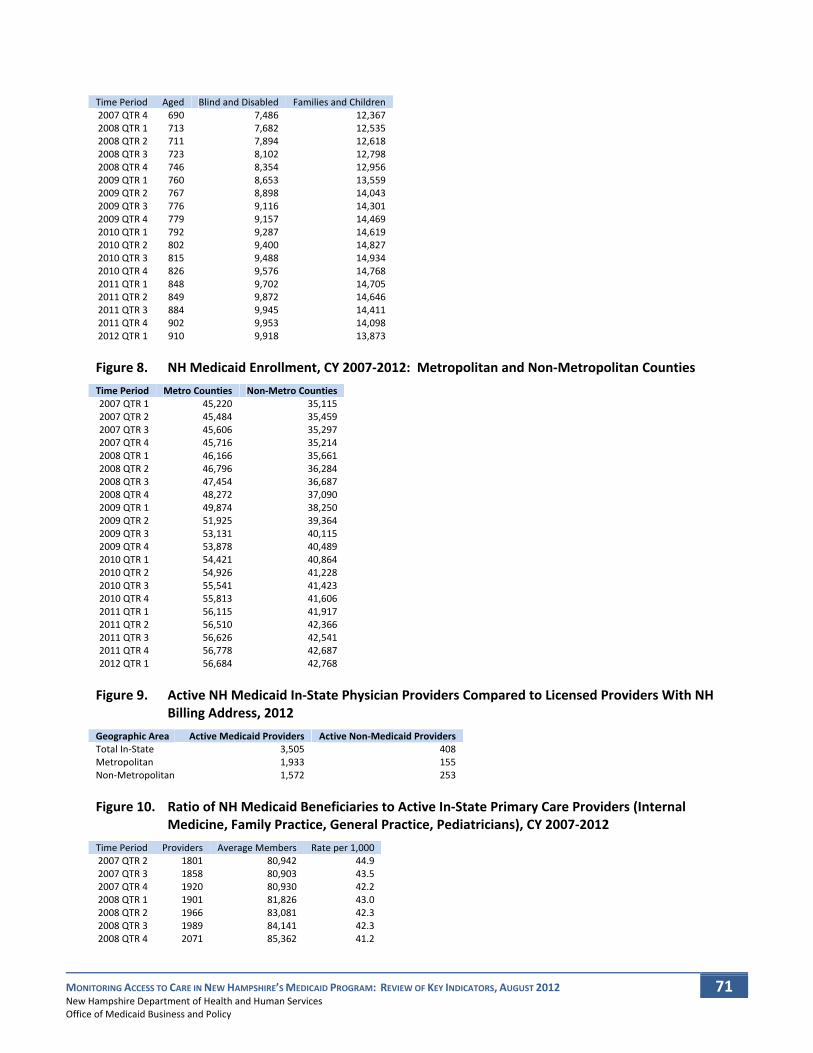
MONITORING ACCESS TO CARE IN NEW HAMPSHIRE’S MEDICAID PROGRAM: REVIEW OF KEY INDICATORS, AUGUST 2012 New Hampshire Department of Health and Human Services Office of Medicaid Business and Policy
71
Time Period Aged Blind and Disabled Families and Children2007 QTR 4 690 7,486 12,3672008 QTR 1 713 7,682 12,5352008 QTR 2 711 7,894 12,6182008 QTR 3 723 8,102 12,7982008 QTR 4 746 8,354 12,9562009 QTR 1 760 8,653 13,5592009 QTR 2 767 8,898 14,0432009 QTR 3 776 9,116 14,3012009 QTR 4 779 9,157 14,4692010 QTR 1 792 9,287 14,6192010 QTR 2 802 9,400 14,8272010 QTR 3 815 9,488 14,9342010 QTR 4 826 9,576 14,7682011 QTR 1 848 9,702 14,7052011 QTR 2 849 9,872 14,6462011 QTR 3 884 9,945 14,4112011 QTR 4 902 9,953 14,0982012 QTR 1 910 9,918 13,873
Figure 8. NH Medicaid Enrollment, CY 2007‐2012: Metropolitan and Non‐Metropolitan Counties Time Period Metro Counties Non‐Metro Counties2007 QTR 1 45,220 35,1152007 QTR 2 45,484 35,4592007 QTR 3 45,606 35,2972007 QTR 4 45,716 35,2142008 QTR 1 46,166 35,6612008 QTR 2 46,796 36,2842008 QTR 3 47,454 36,6872008 QTR 4 48,272 37,0902009 QTR 1 49,874 38,2502009 QTR 2 51,925 39,3642009 QTR 3 53,131 40,1152009 QTR 4 53,878 40,4892010 QTR 1 54,421 40,8642010 QTR 2 54,926 41,2282010 QTR 3 55,541 41,4232010 QTR 4 55,813 41,6062011 QTR 1 56,115 41,9172011 QTR 2 56,510 42,3662011 QTR 3 56,626 42,5412011 QTR 4 56,778 42,6872012 QTR 1 56,684 42,768
Figure 9. Active NH Medicaid In‐State Physician Providers Compared to Licensed Providers With NH Billing Address, 2012
Geographic Area Active Medicaid Providers Active Non‐Medicaid ProvidersTotal In‐State 3,505 408Metropolitan 1,933 155Non‐Metropolitan 1,572 253
Figure 10. Ratio of NH Medicaid Beneficiaries to Active In‐State Primary Care Providers (Internal Medicine, Family Practice, General Practice, Pediatricians), CY 2007‐2012
Time Period Providers Average Members Rate per 1,0002007 QTR 2 1801 80,942 44.92007 QTR 3 1858 80,903 43.52007 QTR 4 1920 80,930 42.22008 QTR 1 1901 81,826 43.02008 QTR 2 1966 83,081 42.32008 QTR 3 1989 84,141 42.32008 QTR 4 2071 85,362 41.2

MONITORING ACCESS TO CARE IN NEW HAMPSHIRE’S MEDICAID PROGRAM: REVIEW OF KEY INDICATORS, AUGUST 2012 New Hampshire Department of Health and Human Services Office of Medicaid Business and Policy
72
Time Period Providers Average Members Rate per 1,0002009 QTR 1 2082 88,124 42.32009 QTR 2 2145 91,289 42.62009 QTR 3 2247 93,246 41.52009 QTR 4 2308 94,367 40.92010 QTR 1 2348 95,285 40.62010 QTR 2 2367 96,155 40.62010 QTR 3 2441 96,964 39.72010 QTR 4 2442 97,419 39.92011 QTR 1 2467 98,032 39.72011 QTR 2 2472 98,876 40.02011 QTR 3 2525 99,167 39.32011 QTR 4 2496 99,465 39.82012 QTR 1 2519 99,452 39.5
Figure 11. Ratio of NH Medicaid Beneficiaries to Active In‐State Primary Care Providers, CY 2007‐2012: Metropolitan Areas
Time Period Providers Average Members Rate per 1,0002007 QTR 2 1,108 45,484 41.12007 QTR 3 1,140 45,606 40.02007 QTR 4 1,152 45,716 39.72008 QTR 1 1,155 46,166 40.02008 QTR 2 1,193 46,796 39.22008 QTR 3 1,212 47,454 39.22008 QTR 4 1,229 48,272 39.32009 QTR 1 1,248 49,874 40.02009 QTR 2 1,246 51,925 41.72009 QTR 3 1,289 53,131 41.22009 QTR 4 1,322 53,878 40.82010 QTR 1 1,352 54,421 40.32010 QTR 2 1,355 54,926 40.52010 QTR 3 1,416 55,541 39.22010 QTR 4 1,407 55,813 39.72011 QTR 1 1,427 56,115 39.32011 QTR 2 1,424 56,510 39.72011 QTR 3 1,459 56,626 38.82011 QTR 4 1,443 56,778 39.32012 QTR 1 1,467 56,684 38.6
Figure 12. Ratio of NH Medicaid Beneficiaries to Active In‐State Primary Care Providers, CY 2007‐2012: Non‐Metropolitan Areas
Time Period Providers Average Members Rate per 1,0002007 QTR 2 693 35,459 51.22007 QTR 3 718 35,297 49.22007 QTR 4 768 35,214 45.92008 QTR 1 746 35,661 47.82008 QTR 2 773 36,284 46.92008 QTR 3 777 36,687 47.22008 QTR 4 842 37,090 44.12009 QTR 1 834 38,250 45.92009 QTR 2 899 39,364 43.82009 QTR 3 958 40,115 41.92009 QTR 4 986 40,489 41.12010 QTR 1 996 40,864 41.02010 QTR 2 1,012 41,228 40.72010 QTR 3 1,025 41,423 40.42010 QTR 4 1,035 41,606 40.22011 QTR 1 1,040 41,917 40.32011 QTR 2 1,048 42,366 40.42011 QTR 3 1,066 42,541 39.92011 QTR 4 1,053 42,687 40.52012 QTR 1 1,052 42,768 40.7

MONITORING ACCESS TO CARE IN NEW HAMPSHIRE’S MEDICAID PROGRAM: REVIEW OF KEY INDICATORS, AUGUST 2012 New Hampshire Department of Health and Human Services Office of Medicaid Business and Policy
73
Figure 13. Ratio of NH Medicaid Child Beneficiaries to Active In‐State Pediatricians, CY 2007‐2011 Time Period Providers 0 to 18 members Rate per 1,0002007 QTR 2 206 61,215 297.22007 QTR 3 213 61,061 286.72007 QTR 4 214 61,059 285.32008 QTR 1 210 61,593 293.32008 QTR 2 206 62,553 303.72008 QTR 3 217 63,220 291.32008 QTR 4 222 64,023 288.42009 QTR 1 223 65,898 295.52009 QTR 2 224 68,342 305.12009 QTR 3 237 69,855 294.72009 QTR 4 236 70,831 300.12010 QTR 1 238 71,465 300.32010 QTR 2 237 71,992 303.82010 QTR 3 246 72,535 294.92010 QTR 4 244 72,969 299.12011 QTR 1 243 73,441 302.22011 QTR 2 244 74,088 303.62011 QTR 3 245 74,416 303.72011 QTR 4 243 74,840 308.02012 QTR 1 243 74,997 308.6
Figure 14. Ratio of NH Medicaid Child Beneficiaries to Active In‐State Pediatricians, CY 2007‐2012: Metropolitan Areas
Time Period Providers Average Members Rate per 1,0002007 QTR 2 132 34,112 258.42007 QTR 3 136 34,126 250.92007 QTR 4 134 34,182 255.12008 QTR 1 132 34,425 260.82008 QTR 2 129 34,906 270.62008 QTR 3 137 35,330 257.92008 QTR 4 137 35,873 261.82009 QTR 1 137 36,981 269.92009 QTR 2 138 38,564 279.52009 QTR 3 141 39,507 280.22009 QTR 4 140 40,177 287.02010 QTR 1 143 40,566 283.72010 QTR 2 140 40,831 291.62010 QTR 3 147 41,261 280.72010 QTR 4 146 41,525 284.42011 QTR 1 146 41,765 286.12011 QTR 2 147 42,121 286.52011 QTR 3 150 42,303 282.02011 QTR 4 149 42,573 285.72012 QTR 1 146 42,564 291.5
Figure 15. Ratio of NH Medicaid Child Beneficiaries to Active In‐State Pediatricians, CY 2007‐2012: Non‐Metropolitan Areas
Time Period Providers Average Members Rate per 1,0002007 QTR 2 74 27,102 366.22007 QTR 3 77 26,934 349.82007 QTR 4 80 26,877 336.02008 QTR 1 78 27,168 348.32008 QTR 2 77 27,646 359.02008 QTR 3 80 27,890 348.62008 QTR 4 85 28,150 331.22009 QTR 1 86 28,918 336.32009 QTR 2 86 29,778 346.32009 QTR 3 96 30,348 316.12009 QTR 4 96 30,655 319.32010 QTR 1 95 30,899 325.2
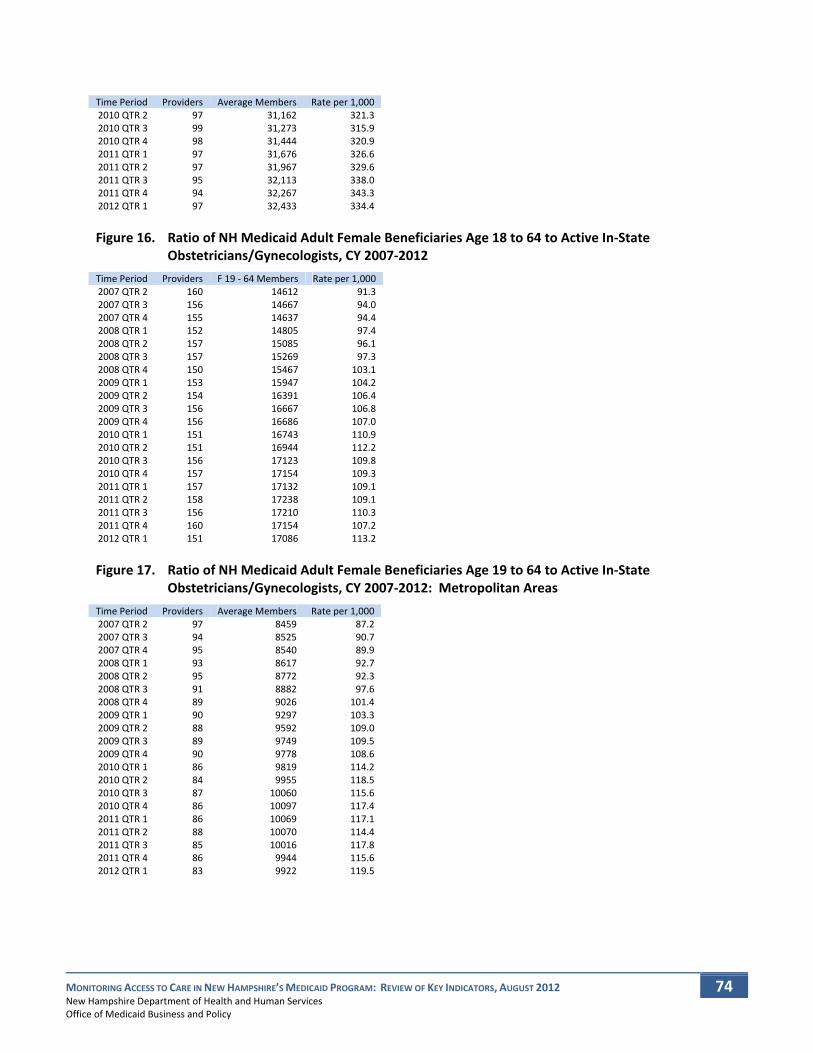
MONITORING ACCESS TO CARE IN NEW HAMPSHIRE’S MEDICAID PROGRAM: REVIEW OF KEY INDICATORS, AUGUST 2012 New Hampshire Department of Health and Human Services Office of Medicaid Business and Policy
74
Time Period Providers Average Members Rate per 1,0002010 QTR 2 97 31,162 321.32010 QTR 3 99 31,273 315.92010 QTR 4 98 31,444 320.92011 QTR 1 97 31,676 326.62011 QTR 2 97 31,967 329.62011 QTR 3 95 32,113 338.02011 QTR 4 94 32,267 343.32012 QTR 1 97 32,433 334.4
Figure 16. Ratio of NH Medicaid Adult Female Beneficiaries Age 18 to 64 to Active In‐State Obstetricians/Gynecologists, CY 2007‐2012
Time Period Providers F 19 ‐ 64 Members Rate per 1,0002007 QTR 2 160 14612 91.32007 QTR 3 156 14667 94.02007 QTR 4 155 14637 94.42008 QTR 1 152 14805 97.42008 QTR 2 157 15085 96.12008 QTR 3 157 15269 97.32008 QTR 4 150 15467 103.12009 QTR 1 153 15947 104.22009 QTR 2 154 16391 106.42009 QTR 3 156 16667 106.82009 QTR 4 156 16686 107.02010 QTR 1 151 16743 110.92010 QTR 2 151 16944 112.22010 QTR 3 156 17123 109.82010 QTR 4 157 17154 109.32011 QTR 1 157 17132 109.12011 QTR 2 158 17238 109.12011 QTR 3 156 17210 110.32011 QTR 4 160 17154 107.22012 QTR 1 151 17086 113.2
Figure 17. Ratio of NH Medicaid Adult Female Beneficiaries Age 19 to 64 to Active In‐State Obstetricians/Gynecologists, CY 2007‐2012: Metropolitan Areas
Time Period Providers Average Members Rate per 1,0002007 QTR 2 97 8459 87.22007 QTR 3 94 8525 90.72007 QTR 4 95 8540 89.92008 QTR 1 93 8617 92.72008 QTR 2 95 8772 92.32008 QTR 3 91 8882 97.62008 QTR 4 89 9026 101.42009 QTR 1 90 9297 103.32009 QTR 2 88 9592 109.02009 QTR 3 89 9749 109.52009 QTR 4 90 9778 108.62010 QTR 1 86 9819 114.22010 QTR 2 84 9955 118.52010 QTR 3 87 10060 115.62010 QTR 4 86 10097 117.42011 QTR 1 86 10069 117.12011 QTR 2 88 10070 114.42011 QTR 3 85 10016 117.82011 QTR 4 86 9944 115.62012 QTR 1 83 9922 119.5

MONITORING ACCESS TO CARE IN NEW HAMPSHIRE’S MEDICAID PROGRAM: REVIEW OF KEY INDICATORS, AUGUST 2012 New Hampshire Department of Health and Human Services Office of Medicaid Business and Policy
75
Figure 18. Ratio of NH Medicaid Adult Female Beneficiaries Age 19 to 64 to Active In‐State Obstetricians/Gynecologists, CY 2007‐2012: Non‐Metropolitan Areas
Time Period Providers Average Members Rate per 1,0002007 QTR 2 63 6154 97.72007 QTR 3 62 6142 99.12007 QTR 4 60 6097 101.62008 QTR 1 59 6188 104.92008 QTR 2 62 6313 101.82008 QTR 3 66 6387 96.82008 QTR 4 61 6441 105.62009 QTR 1 63 6650 105.62009 QTR 2 66 6800 103.02009 QTR 3 67 6918 103.32009 QTR 4 66 6909 104.72010 QTR 1 65 6924 106.52010 QTR 2 67 6989 104.32010 QTR 3 69 7063 102.42010 QTR 4 71 7057 99.42011 QTR 1 71 7063 99.52011 QTR 2 70 7168 102.42011 QTR 3 71 7194 101.32011 QTR 4 74 7210 97.42012 QTR 1 68 7164 105.4
Figure 19. Seasonally Adjusted Physician/APRN/Clinic Utilization per 1,000 NH Medicaid Beneficiaries, CY 2007‐2012: Total Population
Time Period Visits Member Months Rate per 1,000 Adjusted Rate per 1,0002007 QTR 1 95006 248641 382 3612007 QTR 2 86942 250387 347 3502007 QTR 3 82644 250333 330 3512007 QTR 4 90983 250172 364 3602008 QTR 1 98124 253141 388 3662008 QTR 2 91854 256897 358 3612008 QTR 3 90591 260349 348 3702008 QTR 4 96665 264072 366 3622009 QTR 1 109231 272598 401 3782009 QTR 2 110575 282178 392 3952009 QTR 3 105470 288533 366 3892009 QTR 4 117563 292332 402 3982010 QTR 1 119994 294860 407 3842010 QTR 2 113349 297486 381 3852010 QTR 3 107316 299440 358 3812010 QTR 4 112532 299922 375 3712011 QTR 1 118182 301086 393 3712011 QTR 2 112857 302767 373 3762011 QTR 3 104176 302856 344 3662011 QTR 4 112266 302025 372 3682012 QTR 1 119015 301277 395 372
Figure 20. Seasonally Adjusted Physician/APRN/Clinic Utilization per 1,000 NH Medicaid Beneficiaries, CY 2007‐2011: Children, Blind and Disabled Aid Categories
Time Period Visits Member Months Rate per 1,000 Adjusted Rate per 1,0002007 QTR 1 793 1565 507 4722007 QTR 2 766 1579 485 4302007 QTR 3 611 1545 395 4572007 QTR 4 709 1574 450 4592008 QTR 1 762 1607 474 4312008 QTR 2 775 1691 458 4262008 QTR 3 681 1739 392 3512008 QTR 4 621 1797 346 402

MONITORING ACCESS TO CARE IN NEW HAMPSHIRE’S MEDICAID PROGRAM: REVIEW OF KEY INDICATORS, AUGUST 2012 New Hampshire Department of Health and Human Services Office of Medicaid Business and Policy
76
Time Period Visits Member Months Rate per 1,000 Adjusted Rate per 1,0002009 QTR 1 752 1813 415 4332009 QTR 2 853 1853 460 4402009 QTR 3 750 1856 404 4952009 QTR 4 920 1885 488 4692010 QTR 1 878 1814 484 4072010 QTR 2 775 1788 433 4302010 QTR 3 707 1791 395 4332010 QTR 4 784 1838 427 4012011 QTR 1 743 1795 414 4152011 QTR 2 809 1832 442 4082011 QTR 3 671 1791 375 4702011 QTR 4 843 1819 463 4112012 QTR 1 778 1835 424 430
Figure 21. Seasonally Adjusted Physician/APRN/Clinic Utilization per 1,000 NH Medicaid Beneficiaries, CY 2007‐2012: Children, Children and Families Aid Categories
Time Period Visits Member Months Rate per 1,000 Adjusted Rate per 1,0002007 QTR 1 60965 180123 338 3092007 QTR 2 53953 181565 297 3012007 QTR 3 48844 181344 269 3002007 QTR 4 57054 181148 315 3092008 QTR 1 62666 182886 343 3132008 QTR 2 56420 185637 304 3082008 QTR 3 53514 188016 285 3172008 QTR 4 59431 190435 312 3062009 QTR 1 69033 196269 352 3212009 QTR 2 67568 203568 332 3362009 QTR 3 60991 208680 292 3262009 QTR 4 72941 211791 344 3382010 QTR 1 74682 213575 350 3192010 QTR 2 68549 215267 318 3222010 QTR 3 62693 216779 289 3232010 QTR 4 69305 217350 319 3132011 QTR 1 74702 218364 342 3122011 QTR 2 70082 219597 319 3232011 QTR 3 62464 220350 283 3162011 QTR 4 71122 220342 323 3172012 QTR 1 75763 220300 344 314
Figure 22. Seasonally Adjusted Physician/APRN/Clinic Utilization per 1,000 NH Medicaid Beneficiaries, CY 2007‐2012: Children, Foster Care Aid Categories
Time Period Visits Member Months Rate per 1,000 Adjusted Rate per 1,0002007 QTR 2 1853 5942 312 3102007 QTR 3 1575 5831 270 2902007 QTR 4 1825 5821 314 3112008 QTR 1 1947 5859 332 3152008 QTR 2 1964 5899 333 3312008 QTR 3 1724 5723 301 3232008 QTR 4 1725 5670 304 3022009 QTR 1 1955 5600 349 3312009 QTR 2 1934 5633 343 3422009 QTR 3 1738 5414 321 3442009 QTR 4 1925 5441 354 3512010 QTR 1 1841 5378 342 3252010 QTR 2 1735 5344 325 3232010 QTR 3 1689 5152 328 3522010 QTR 4 1810 5216 347 3442011 QTR 1 1813 5160 351 3342011 QTR 2 1891 5235 361 3592011 QTR 3 1568 4990 314 3372011 QTR 4 1664 5004 333 3302012 QTR 1 1721 5036 342 324
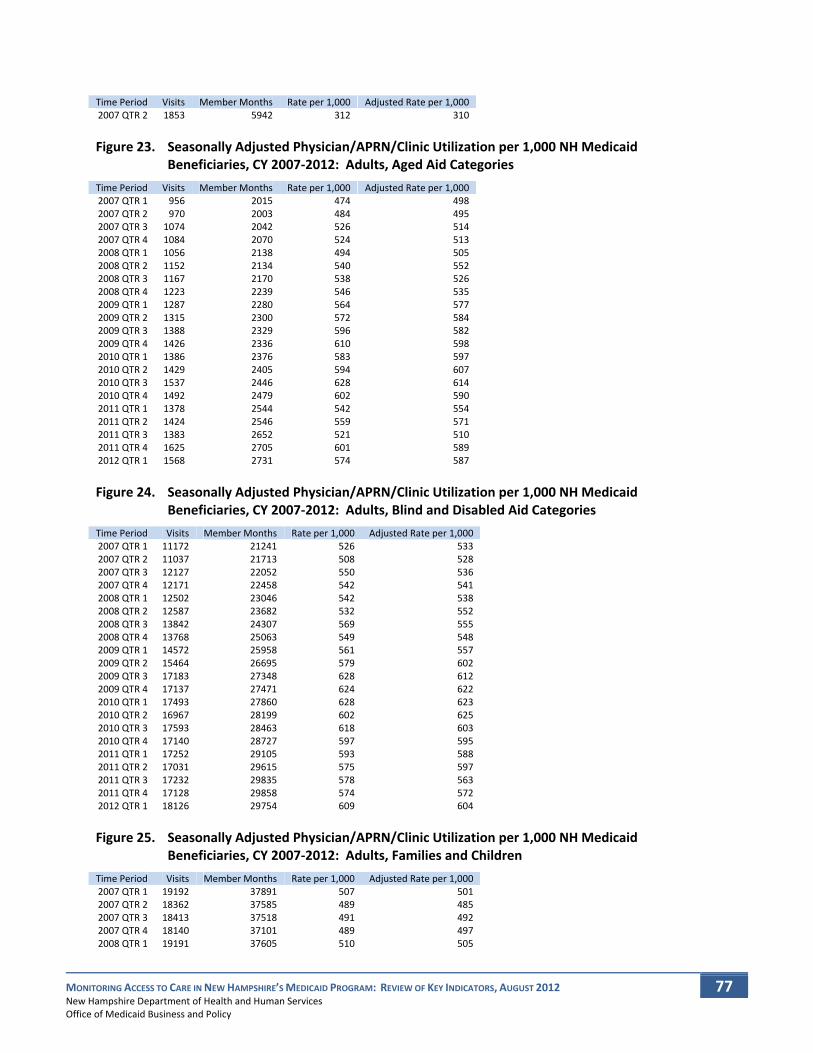
MONITORING ACCESS TO CARE IN NEW HAMPSHIRE’S MEDICAID PROGRAM: REVIEW OF KEY INDICATORS, AUGUST 2012 New Hampshire Department of Health and Human Services Office of Medicaid Business and Policy
77
Time Period Visits Member Months Rate per 1,000 Adjusted Rate per 1,0002007 QTR 2 1853 5942 312 310
Figure 23. Seasonally Adjusted Physician/APRN/Clinic Utilization per 1,000 NH Medicaid Beneficiaries, CY 2007‐2012: Adults, Aged Aid Categories
Time Period Visits Member Months Rate per 1,000 Adjusted Rate per 1,0002007 QTR 1 956 2015 474 4982007 QTR 2 970 2003 484 4952007 QTR 3 1074 2042 526 5142007 QTR 4 1084 2070 524 5132008 QTR 1 1056 2138 494 5052008 QTR 2 1152 2134 540 5522008 QTR 3 1167 2170 538 5262008 QTR 4 1223 2239 546 5352009 QTR 1 1287 2280 564 5772009 QTR 2 1315 2300 572 5842009 QTR 3 1388 2329 596 5822009 QTR 4 1426 2336 610 5982010 QTR 1 1386 2376 583 5972010 QTR 2 1429 2405 594 6072010 QTR 3 1537 2446 628 6142010 QTR 4 1492 2479 602 5902011 QTR 1 1378 2544 542 5542011 QTR 2 1424 2546 559 5712011 QTR 3 1383 2652 521 5102011 QTR 4 1625 2705 601 5892012 QTR 1 1568 2731 574 587
Figure 24. Seasonally Adjusted Physician/APRN/Clinic Utilization per 1,000 NH Medicaid Beneficiaries, CY 2007‐2012: Adults, Blind and Disabled Aid Categories
Time Period Visits Member Months Rate per 1,000 Adjusted Rate per 1,0002007 QTR 1 11172 21241 526 5332007 QTR 2 11037 21713 508 5282007 QTR 3 12127 22052 550 5362007 QTR 4 12171 22458 542 5412008 QTR 1 12502 23046 542 5382008 QTR 2 12587 23682 532 5522008 QTR 3 13842 24307 569 5552008 QTR 4 13768 25063 549 5482009 QTR 1 14572 25958 561 5572009 QTR 2 15464 26695 579 6022009 QTR 3 17183 27348 628 6122009 QTR 4 17137 27471 624 6222010 QTR 1 17493 27860 628 6232010 QTR 2 16967 28199 602 6252010 QTR 3 17593 28463 618 6032010 QTR 4 17140 28727 597 5952011 QTR 1 17252 29105 593 5882011 QTR 2 17031 29615 575 5972011 QTR 3 17232 29835 578 5632011 QTR 4 17128 29858 574 5722012 QTR 1 18126 29754 609 604
Figure 25. Seasonally Adjusted Physician/APRN/Clinic Utilization per 1,000 NH Medicaid Beneficiaries, CY 2007‐2012: Adults, Families and Children
Time Period Visits Member Months Rate per 1,000 Adjusted Rate per 1,0002007 QTR 1 19192 37891 507 5012007 QTR 2 18362 37585 489 4852007 QTR 3 18413 37518 491 4922007 QTR 4 18140 37101 489 4972008 QTR 1 19191 37605 510 505
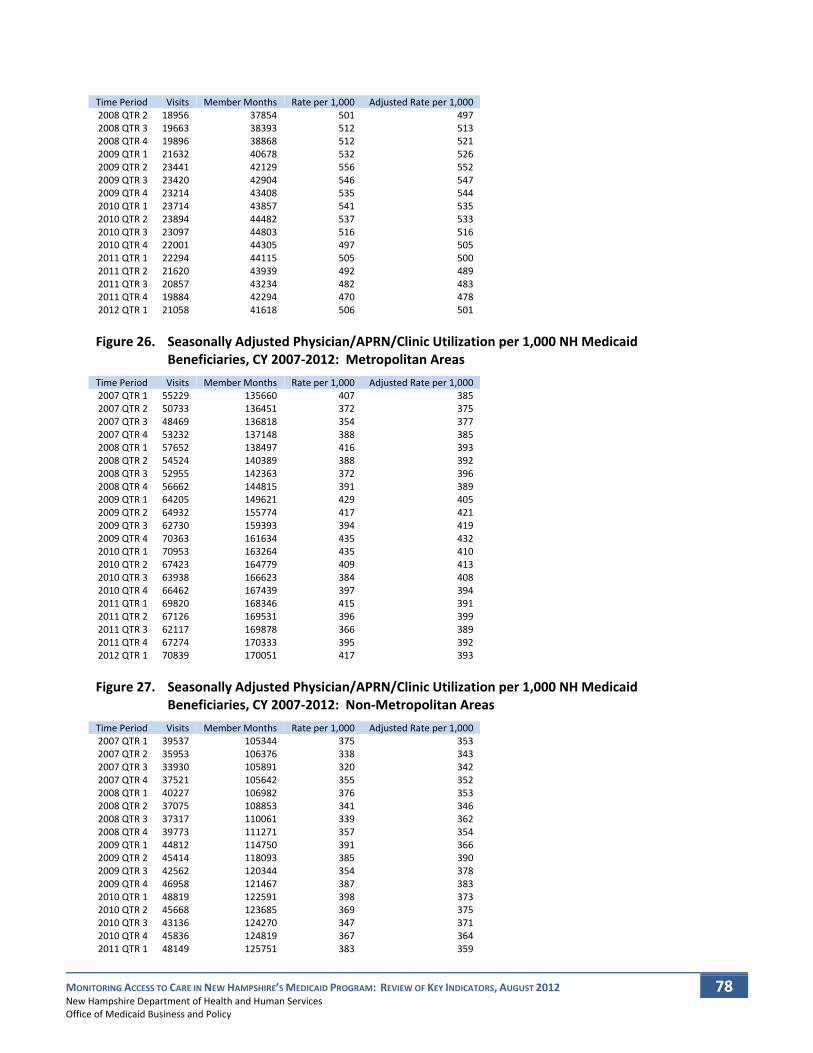
MONITORING ACCESS TO CARE IN NEW HAMPSHIRE’S MEDICAID PROGRAM: REVIEW OF KEY INDICATORS, AUGUST 2012 New Hampshire Department of Health and Human Services Office of Medicaid Business and Policy
78
Time Period Visits Member Months Rate per 1,000 Adjusted Rate per 1,0002008 QTR 2 18956 37854 501 4972008 QTR 3 19663 38393 512 5132008 QTR 4 19896 38868 512 5212009 QTR 1 21632 40678 532 5262009 QTR 2 23441 42129 556 5522009 QTR 3 23420 42904 546 5472009 QTR 4 23214 43408 535 5442010 QTR 1 23714 43857 541 5352010 QTR 2 23894 44482 537 5332010 QTR 3 23097 44803 516 5162010 QTR 4 22001 44305 497 5052011 QTR 1 22294 44115 505 5002011 QTR 2 21620 43939 492 4892011 QTR 3 20857 43234 482 4832011 QTR 4 19884 42294 470 4782012 QTR 1 21058 41618 506 501
Figure 26. Seasonally Adjusted Physician/APRN/Clinic Utilization per 1,000 NH Medicaid Beneficiaries, CY 2007‐2012: Metropolitan Areas
Time Period Visits Member Months Rate per 1,000 Adjusted Rate per 1,0002007 QTR 1 55229 135660 407 3852007 QTR 2 50733 136451 372 3752007 QTR 3 48469 136818 354 3772007 QTR 4 53232 137148 388 3852008 QTR 1 57652 138497 416 3932008 QTR 2 54524 140389 388 3922008 QTR 3 52955 142363 372 3962008 QTR 4 56662 144815 391 3892009 QTR 1 64205 149621 429 4052009 QTR 2 64932 155774 417 4212009 QTR 3 62730 159393 394 4192009 QTR 4 70363 161634 435 4322010 QTR 1 70953 163264 435 4102010 QTR 2 67423 164779 409 4132010 QTR 3 63938 166623 384 4082010 QTR 4 66462 167439 397 3942011 QTR 1 69820 168346 415 3912011 QTR 2 67126 169531 396 3992011 QTR 3 62117 169878 366 3892011 QTR 4 67274 170333 395 3922012 QTR 1 70839 170051 417 393
Figure 27. Seasonally Adjusted Physician/APRN/Clinic Utilization per 1,000 NH Medicaid Beneficiaries, CY 2007‐2012: Non‐Metropolitan Areas
Time Period Visits Member Months Rate per 1,000 Adjusted Rate per 1,0002007 QTR 1 39537 105344 375 3532007 QTR 2 35953 106376 338 3432007 QTR 3 33930 105891 320 3422007 QTR 4 37521 105642 355 3522008 QTR 1 40227 106982 376 3532008 QTR 2 37075 108853 341 3462008 QTR 3 37317 110061 339 3622008 QTR 4 39773 111271 357 3542009 QTR 1 44812 114750 391 3662009 QTR 2 45414 118093 385 3902009 QTR 3 42562 120344 354 3782009 QTR 4 46958 121467 387 3832010 QTR 1 48819 122591 398 3732010 QTR 2 45668 123685 369 3752010 QTR 3 43136 124270 347 3712010 QTR 4 45836 124819 367 3642011 QTR 1 48149 125751 383 359
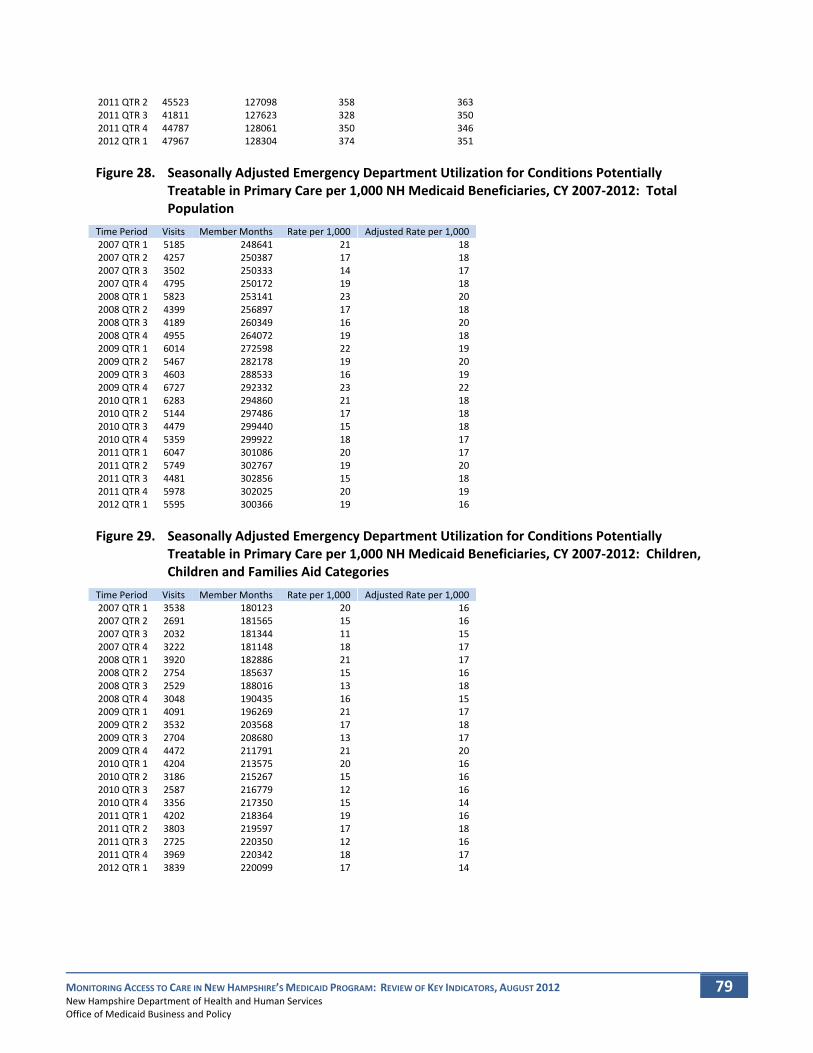
MONITORING ACCESS TO CARE IN NEW HAMPSHIRE’S MEDICAID PROGRAM: REVIEW OF KEY INDICATORS, AUGUST 2012 New Hampshire Department of Health and Human Services Office of Medicaid Business and Policy
79
2011 QTR 2 45523 127098 358 3632011 QTR 3 41811 127623 328 3502011 QTR 4 44787 128061 350 3462012 QTR 1 47967 128304 374 351
Figure 28. Seasonally Adjusted Emergency Department Utilization for Conditions Potentially Treatable in Primary Care per 1,000 NH Medicaid Beneficiaries, CY 2007‐2012: Total Population
Time Period Visits Member Months Rate per 1,000 Adjusted Rate per 1,0002007 QTR 1 5185 248641 21 182007 QTR 2 4257 250387 17 182007 QTR 3 3502 250333 14 172007 QTR 4 4795 250172 19 182008 QTR 1 5823 253141 23 202008 QTR 2 4399 256897 17 182008 QTR 3 4189 260349 16 202008 QTR 4 4955 264072 19 182009 QTR 1 6014 272598 22 192009 QTR 2 5467 282178 19 202009 QTR 3 4603 288533 16 192009 QTR 4 6727 292332 23 222010 QTR 1 6283 294860 21 182010 QTR 2 5144 297486 17 182010 QTR 3 4479 299440 15 182010 QTR 4 5359 299922 18 172011 QTR 1 6047 301086 20 172011 QTR 2 5749 302767 19 202011 QTR 3 4481 302856 15 182011 QTR 4 5978 302025 20 192012 QTR 1 5595 300366 19 16
Figure 29. Seasonally Adjusted Emergency Department Utilization for Conditions Potentially Treatable in Primary Care per 1,000 NH Medicaid Beneficiaries, CY 2007‐2012: Children, Children and Families Aid Categories
Time Period Visits Member Months Rate per 1,000 Adjusted Rate per 1,0002007 QTR 1 3538 180123 20 162007 QTR 2 2691 181565 15 162007 QTR 3 2032 181344 11 152007 QTR 4 3222 181148 18 172008 QTR 1 3920 182886 21 172008 QTR 2 2754 185637 15 162008 QTR 3 2529 188016 13 182008 QTR 4 3048 190435 16 152009 QTR 1 4091 196269 21 172009 QTR 2 3532 203568 17 182009 QTR 3 2704 208680 13 172009 QTR 4 4472 211791 21 202010 QTR 1 4204 213575 20 162010 QTR 2 3186 215267 15 162010 QTR 3 2587 216779 12 162010 QTR 4 3356 217350 15 142011 QTR 1 4202 218364 19 162011 QTR 2 3803 219597 17 182011 QTR 3 2725 220350 12 162011 QTR 4 3969 220342 18 172012 QTR 1 3839 220099 17 14
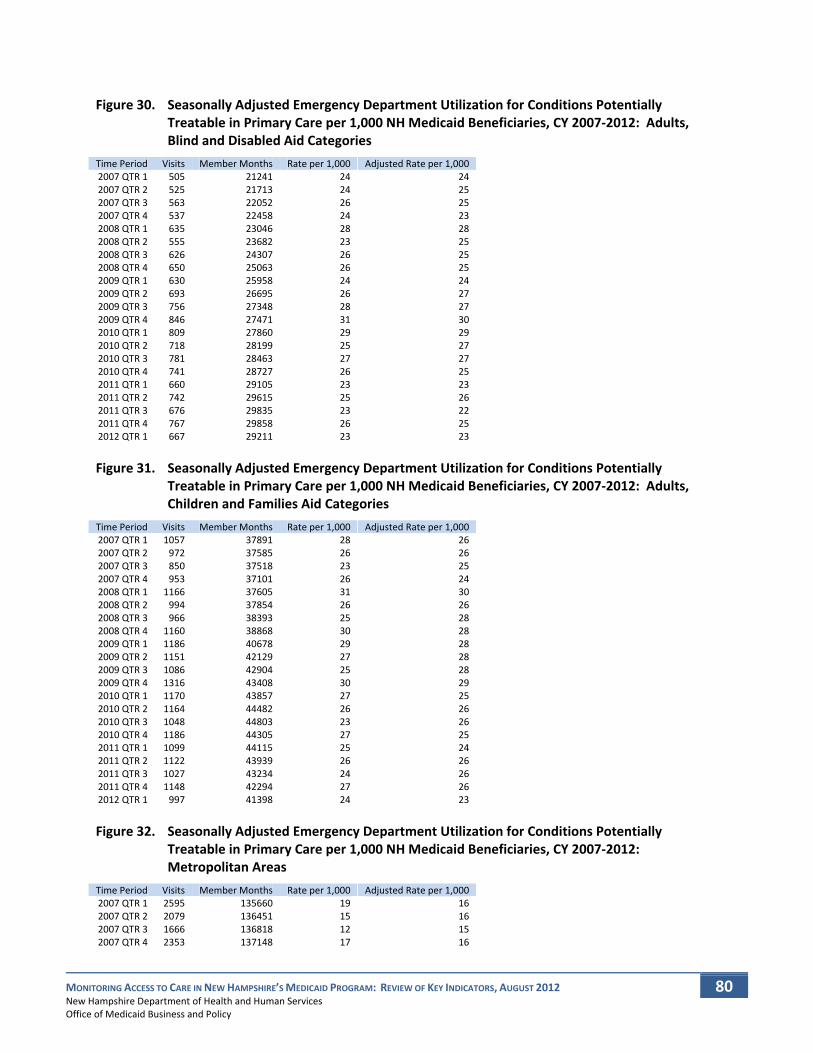
MONITORING ACCESS TO CARE IN NEW HAMPSHIRE’S MEDICAID PROGRAM: REVIEW OF KEY INDICATORS, AUGUST 2012 New Hampshire Department of Health and Human Services Office of Medicaid Business and Policy
80
Figure 30. Seasonally Adjusted Emergency Department Utilization for Conditions Potentially Treatable in Primary Care per 1,000 NH Medicaid Beneficiaries, CY 2007‐2012: Adults, Blind and Disabled Aid Categories
Time Period Visits Member Months Rate per 1,000 Adjusted Rate per 1,0002007 QTR 1 505 21241 24 242007 QTR 2 525 21713 24 252007 QTR 3 563 22052 26 252007 QTR 4 537 22458 24 232008 QTR 1 635 23046 28 282008 QTR 2 555 23682 23 252008 QTR 3 626 24307 26 252008 QTR 4 650 25063 26 252009 QTR 1 630 25958 24 242009 QTR 2 693 26695 26 272009 QTR 3 756 27348 28 272009 QTR 4 846 27471 31 302010 QTR 1 809 27860 29 292010 QTR 2 718 28199 25 272010 QTR 3 781 28463 27 272010 QTR 4 741 28727 26 252011 QTR 1 660 29105 23 232011 QTR 2 742 29615 25 262011 QTR 3 676 29835 23 222011 QTR 4 767 29858 26 252012 QTR 1 667 29211 23 23
Figure 31. Seasonally Adjusted Emergency Department Utilization for Conditions Potentially Treatable in Primary Care per 1,000 NH Medicaid Beneficiaries, CY 2007‐2012: Adults, Children and Families Aid Categories
Time Period Visits Member Months Rate per 1,000 Adjusted Rate per 1,0002007 QTR 1 1057 37891 28 262007 QTR 2 972 37585 26 262007 QTR 3 850 37518 23 252007 QTR 4 953 37101 26 242008 QTR 1 1166 37605 31 302008 QTR 2 994 37854 26 262008 QTR 3 966 38393 25 282008 QTR 4 1160 38868 30 282009 QTR 1 1186 40678 29 282009 QTR 2 1151 42129 27 282009 QTR 3 1086 42904 25 282009 QTR 4 1316 43408 30 292010 QTR 1 1170 43857 27 252010 QTR 2 1164 44482 26 262010 QTR 3 1048 44803 23 262010 QTR 4 1186 44305 27 252011 QTR 1 1099 44115 25 242011 QTR 2 1122 43939 26 262011 QTR 3 1027 43234 24 262011 QTR 4 1148 42294 27 262012 QTR 1 997 41398 24 23
Figure 32. Seasonally Adjusted Emergency Department Utilization for Conditions Potentially Treatable in Primary Care per 1,000 NH Medicaid Beneficiaries, CY 2007‐2012: Metropolitan Areas
Time Period Visits Member Months Rate per 1,000 Adjusted Rate per 1,0002007 QTR 1 2595 135660 19 162007 QTR 2 2079 136451 15 162007 QTR 3 1666 136818 12 152007 QTR 4 2353 137148 17 16

MONITORING ACCESS TO CARE IN NEW HAMPSHIRE’S MEDICAID PROGRAM: REVIEW OF KEY INDICATORS, AUGUST 2012 New Hampshire Department of Health and Human Services Office of Medicaid Business and Policy
81
2008 QTR 1 3027 138497 22 182008 QTR 2 2214 140389 16 172008 QTR 3 2109 142363 15 182008 QTR 4 2443 144815 17 162009 QTR 1 3130 149621 21 182009 QTR 2 2832 155774 18 192009 QTR 3 2401 159393 15 192009 QTR 4 3585 161634 22 212010 QTR 1 3342 163264 20 172010 QTR 2 2702 164779 16 182010 QTR 3 2424 166623 15 182010 QTR 4 2988 167439 18 172011 QTR 1 3371 168346 20 172011 QTR 2 3349 169531 20 212011 QTR 3 2621 169878 15 192011 QTR 4 3514 170333 21 202012 QTR 1 3364 170261 20 17
Figure 33. Seasonally Adjusted Emergency Department Utilization for Conditions Potentially Treatable in Primary Care per 1,000 NH Medicaid Beneficiaries, CY 2007‐2012: Non‐Metropolitan Areas
Time Period Visits Member Months Rate per 1,000 Adjusted Rate per 1,0002007 QTR 1 2575 105344 24 212007 QTR 2 2162 106376 20 212007 QTR 3 1817 105891 17 212007 QTR 4 2420 105642 23 222008 QTR 1 2781 106982 26 232008 QTR 2 2169 108853 20 212008 QTR 3 2057 110061 19 222008 QTR 4 2491 111271 22 212009 QTR 1 2874 114750 25 222009 QTR 2 2618 118093 22 232009 QTR 3 2189 120344 18 222009 QTR 4 3122 121467 26 242010 QTR 1 2920 122591 24 212010 QTR 2 2425 123685 20 202010 QTR 3 2039 124270 16 202010 QTR 4 2358 124819 19 182011 QTR 1 2658 125751 21 192011 QTR 2 2385 127098 19 192011 QTR 3 1844 127623 14 172011 QTR 4 2441 128061 19 182012 QTR 1 2216 128001 17 15
Figure 34. Seasonally Adjusted Total Emergency Department Utilization per 1,000 NH Medicaid Beneficiaries, CY 2007‐2012: Total Population
Time Period Visits Member Months Rate per 1,000 Adjusted Rate per 1,0002007 QTR 1 17222 248641 69 682007 QTR 2 16748 250387 67 672007 QTR 3 15941 250333 64 652007 QTR 4 16757 250172 67 682008 QTR 1 18374 253141 73 712008 QTR 2 17808 256897 69 692008 QTR 3 18419 260349 71 732008 QTR 4 18006 264072 68 692009 QTR 1 20153 272598 74 722009 QTR 2 21464 282178 76 762009 QTR 3 20619 288533 71 732009 QTR 4 23071 292332 79 802010 QTR 1 21792 294860 74 722010 QTR 2 21481 297486 72 722010 QTR 3 21069 299440 70 72

MONITORING ACCESS TO CARE IN NEW HAMPSHIRE’S MEDICAID PROGRAM: REVIEW OF KEY INDICATORS, AUGUST 2012 New Hampshire Department of Health and Human Services Office of Medicaid Business and Policy
82
2010 QTR 4 20200 299922 67 682011 QTR 1 21318 301086 71 692011 QTR 2 22616 302767 75 742011 QTR 3 21039 302856 69 712011 QTR 4 21087 302025 70 702012 QTR 1 20977 301277 70 68
Figure 35. Seasonally Adjusted Total Emergency Department Utilization per 1,000 NH Medicaid Beneficiaries, CY 2007‐2012: Children, Blind and Disabled Aid Categories
Time Period Visits Member Months Rate per 1,000 Adjusted Rate per 1,0002007 QTR 1 85 1565 54 512007 QTR 2 76 1579 48 472007 QTR 3 81 1545 52 592007 QTR 4 81 1574 51 532008 QTR 1 106 1607 66 592008 QTR 2 103 1691 61 602008 QTR 3 83 1739 48 542008 QTR 4 98 1797 55 562009 QTR 1 92 1813 51 452009 QTR 2 123 1853 66 652009 QTR 3 104 1856 56 632009 QTR 4 125 1885 66 682010 QTR 1 124 1814 68 612010 QTR 2 106 1788 59 582010 QTR 3 86 1791 48 542010 QTR 4 95 1838 52 532011 QTR 1 130 1795 72 652011 QTR 2 118 1832 64 632011 QTR 3 105 1791 59 662011 QTR 4 96 1819 53 542012 QTR 1 113 1835 62 55
Figure 36. Seasonally Adjusted Total Emergency Department Utilization per 1,000 NH Medicaid Beneficiaries, CY 2007‐2012: Children, Children and Families Aid Categories
Time Period Visits Member Months Rate per 1,000 Adjusted Rate per 1,0002007 QTR 1 9445 180123 52 492007 QTR 2 8798 181565 48 482007 QTR 3 7888 181344 43 472007 QTR 4 9037 181148 50 502008 QTR 1 9914 182886 54 512008 QTR 2 9282 185637 50 502008 QTR 3 9212 188016 49 532008 QTR 4 9140 190435 48 482009 QTR 1 11013 196269 56 522009 QTR 2 11527 203568 57 562009 QTR 3 10353 208680 50 542009 QTR 4 12879 211791 61 612010 QTR 1 11870 213575 56 522010 QTR 2 11277 215267 52 522010 QTR 3 10210 216779 47 512010 QTR 4 10290 217350 47 472011 QTR 1 11796 218364 54 502011 QTR 2 12438 219597 57 562011 QTR 3 10815 220350 49 532011 QTR 4 11601 220342 53 532012 QTR 1 11780 220300 53 50
Figure 37. Seasonally Adjusted Total Emergency Department Utilization per 1,000 NH Medicaid Beneficiaries, CY 2007‐2012: Children, Foster Care Aid Categories
Time Period Visits Member Months Rate per 1,000 Adjusted Rate per 1,0002007 QTR 1 271 5806 47 46
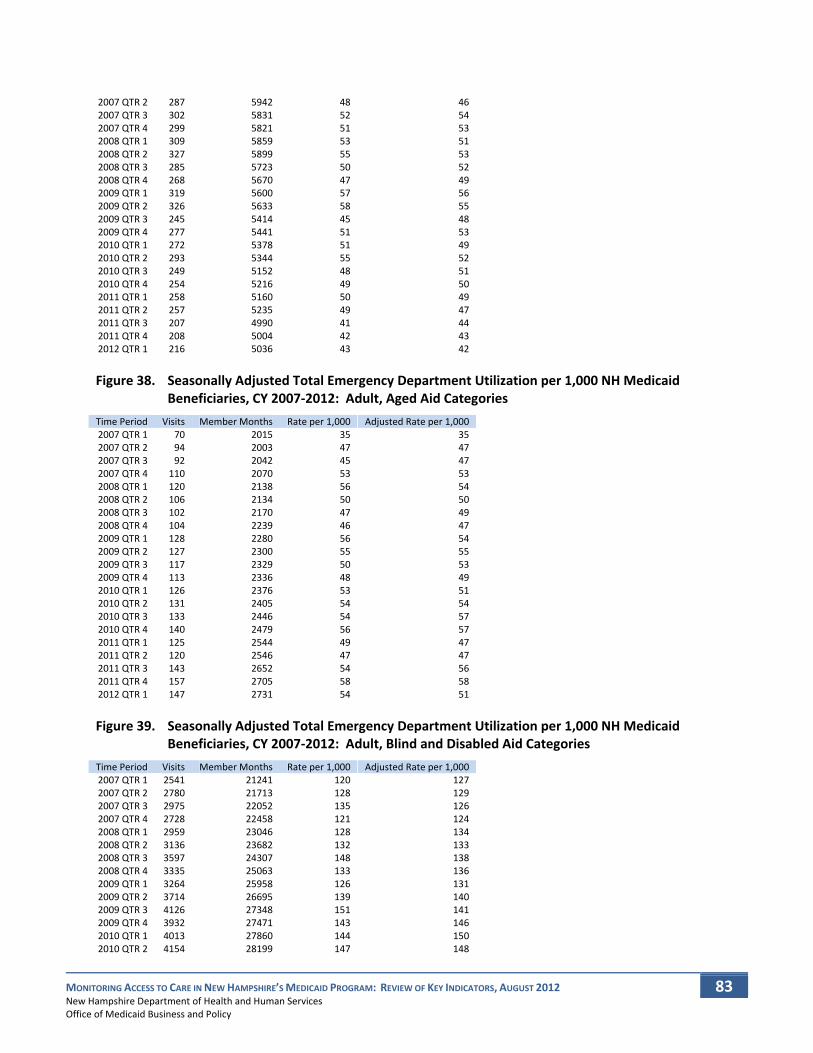
MONITORING ACCESS TO CARE IN NEW HAMPSHIRE’S MEDICAID PROGRAM: REVIEW OF KEY INDICATORS, AUGUST 2012 New Hampshire Department of Health and Human Services Office of Medicaid Business and Policy
83
2007 QTR 2 287 5942 48 462007 QTR 3 302 5831 52 542007 QTR 4 299 5821 51 532008 QTR 1 309 5859 53 512008 QTR 2 327 5899 55 532008 QTR 3 285 5723 50 522008 QTR 4 268 5670 47 492009 QTR 1 319 5600 57 562009 QTR 2 326 5633 58 552009 QTR 3 245 5414 45 482009 QTR 4 277 5441 51 532010 QTR 1 272 5378 51 492010 QTR 2 293 5344 55 522010 QTR 3 249 5152 48 512010 QTR 4 254 5216 49 502011 QTR 1 258 5160 50 492011 QTR 2 257 5235 49 472011 QTR 3 207 4990 41 442011 QTR 4 208 5004 42 432012 QTR 1 216 5036 43 42
Figure 38. Seasonally Adjusted Total Emergency Department Utilization per 1,000 NH Medicaid Beneficiaries, CY 2007‐2012: Adult, Aged Aid Categories
Time Period Visits Member Months Rate per 1,000 Adjusted Rate per 1,0002007 QTR 1 70 2015 35 352007 QTR 2 94 2003 47 472007 QTR 3 92 2042 45 472007 QTR 4 110 2070 53 532008 QTR 1 120 2138 56 542008 QTR 2 106 2134 50 502008 QTR 3 102 2170 47 492008 QTR 4 104 2239 46 472009 QTR 1 128 2280 56 542009 QTR 2 127 2300 55 552009 QTR 3 117 2329 50 532009 QTR 4 113 2336 48 492010 QTR 1 126 2376 53 512010 QTR 2 131 2405 54 542010 QTR 3 133 2446 54 572010 QTR 4 140 2479 56 572011 QTR 1 125 2544 49 472011 QTR 2 120 2546 47 472011 QTR 3 143 2652 54 562011 QTR 4 157 2705 58 582012 QTR 1 147 2731 54 51
Figure 39. Seasonally Adjusted Total Emergency Department Utilization per 1,000 NH Medicaid Beneficiaries, CY 2007‐2012: Adult, Blind and Disabled Aid Categories
Time Period Visits Member Months Rate per 1,000 Adjusted Rate per 1,0002007 QTR 1 2541 21241 120 1272007 QTR 2 2780 21713 128 1292007 QTR 3 2975 22052 135 1262007 QTR 4 2728 22458 121 1242008 QTR 1 2959 23046 128 1342008 QTR 2 3136 23682 132 1332008 QTR 3 3597 24307 148 1382008 QTR 4 3335 25063 133 1362009 QTR 1 3264 25958 126 1312009 QTR 2 3714 26695 139 1402009 QTR 3 4126 27348 151 1412009 QTR 4 3932 27471 143 1462010 QTR 1 4013 27860 144 1502010 QTR 2 4154 28199 147 148
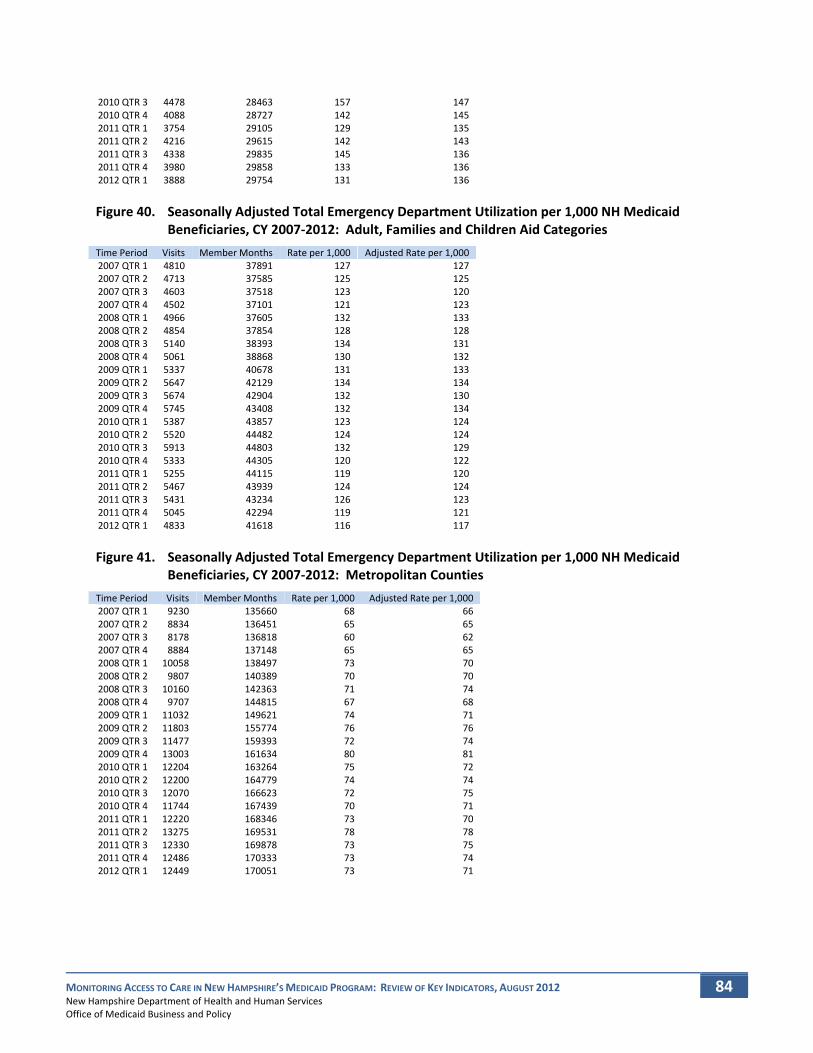
MONITORING ACCESS TO CARE IN NEW HAMPSHIRE’S MEDICAID PROGRAM: REVIEW OF KEY INDICATORS, AUGUST 2012 New Hampshire Department of Health and Human Services Office of Medicaid Business and Policy
84
2010 QTR 3 4478 28463 157 1472010 QTR 4 4088 28727 142 1452011 QTR 1 3754 29105 129 1352011 QTR 2 4216 29615 142 1432011 QTR 3 4338 29835 145 1362011 QTR 4 3980 29858 133 1362012 QTR 1 3888 29754 131 136
Figure 40. Seasonally Adjusted Total Emergency Department Utilization per 1,000 NH Medicaid Beneficiaries, CY 2007‐2012: Adult, Families and Children Aid Categories
Time Period Visits Member Months Rate per 1,000 Adjusted Rate per 1,0002007 QTR 1 4810 37891 127 1272007 QTR 2 4713 37585 125 1252007 QTR 3 4603 37518 123 1202007 QTR 4 4502 37101 121 1232008 QTR 1 4966 37605 132 1332008 QTR 2 4854 37854 128 1282008 QTR 3 5140 38393 134 1312008 QTR 4 5061 38868 130 1322009 QTR 1 5337 40678 131 1332009 QTR 2 5647 42129 134 1342009 QTR 3 5674 42904 132 1302009 QTR 4 5745 43408 132 1342010 QTR 1 5387 43857 123 1242010 QTR 2 5520 44482 124 1242010 QTR 3 5913 44803 132 1292010 QTR 4 5333 44305 120 1222011 QTR 1 5255 44115 119 1202011 QTR 2 5467 43939 124 1242011 QTR 3 5431 43234 126 1232011 QTR 4 5045 42294 119 1212012 QTR 1 4833 41618 116 117
Figure 41. Seasonally Adjusted Total Emergency Department Utilization per 1,000 NH Medicaid Beneficiaries, CY 2007‐2012: Metropolitan Counties
Time Period Visits Member Months Rate per 1,000 Adjusted Rate per 1,0002007 QTR 1 9230 135660 68 662007 QTR 2 8834 136451 65 652007 QTR 3 8178 136818 60 622007 QTR 4 8884 137148 65 652008 QTR 1 10058 138497 73 702008 QTR 2 9807 140389 70 702008 QTR 3 10160 142363 71 742008 QTR 4 9707 144815 67 682009 QTR 1 11032 149621 74 712009 QTR 2 11803 155774 76 762009 QTR 3 11477 159393 72 742009 QTR 4 13003 161634 80 812010 QTR 1 12204 163264 75 722010 QTR 2 12200 164779 74 742010 QTR 3 12070 166623 72 752010 QTR 4 11744 167439 70 712011 QTR 1 12220 168346 73 702011 QTR 2 13275 169531 78 782011 QTR 3 12330 169878 73 752011 QTR 4 12486 170333 73 742012 QTR 1 12449 170051 73 71

MONITORING ACCESS TO CARE IN NEW HAMPSHIRE’S MEDICAID PROGRAM: REVIEW OF KEY INDICATORS, AUGUST 2012 New Hampshire Department of Health and Human Services Office of Medicaid Business and Policy
85
Figure 42. Seasonally Adjusted Total Emergency Department Utilization per 1,000 NH Medicaid Beneficiaries, CY 2007‐2012: Non‐Metropolitan Counties
Time Period Visits Member Months Rate per 1,000 Adjusted Rate per 1,0002007 QTR 1 7929 105344 75 732007 QTR 2 7847 106376 74 732007 QTR 3 7680 105891 73 742007 QTR 4 7810 105642 74 752008 QTR 1 8262 106982 77 762008 QTR 2 7932 108853 73 722008 QTR 3 8193 110061 74 762008 QTR 4 8228 111271 74 752009 QTR 1 9070 114750 79 782009 QTR 2 9600 118093 81 812009 QTR 3 9094 120344 76 772009 QTR 4 10012 121467 82 832010 QTR 1 9519 122591 78 762010 QTR 2 9198 123685 74 742010 QTR 3 8914 124270 72 732010 QTR 4 8401 124819 67 682011 QTR 1 9026 125751 72 702011 QTR 2 9289 127098 73 732011 QTR 3 8636 127623 68 692011 QTR 4 8541 128061 67 672012 QTR 1 8453 128304 66 65
Figure 43. Seasonally Adjusted Inpatient Hospital Utilization for Ambulatory Care Sensitive Conditions per 1,000 NH Medicaid Beneficiaries, CY 2007‐2012: Total Population
Time Period Visits Member Months Rate per 1,000 Adjusted Rate per 1,0002007 QTR 1 194 248641 0.78 0.632007 QTR 2 148 250387 0.59 0.662007 QTR 3 121 250333 0.48 0.542007 QTR 4 175 250172 0.70 0.682008 QTR 1 196 253141 0.77 0.652008 QTR 2 140 256897 0.54 0.612008 QTR 3 178 260349 0.68 0.772008 QTR 4 161 264072 0.61 0.592009 QTR 1 213 272598 0.78 0.662009 QTR 2 152 282178 0.54 0.602009 QTR 3 146 288533 0.51 0.572009 QTR 4 190 292332 0.65 0.632010 QTR 1 210 294860 0.71 0.602010 QTR 2 143 297486 0.48 0.542010 QTR 3 146 299440 0.49 0.552010 QTR 4 161 299922 0.54 0.522011 QTR 1 182 301086 0.60 0.512011 QTR 2 164 302767 0.54 0.612011 QTR 3 130 302856 0.43 0.482011 QTR 4 214 302025 0.71 0.692012 QTR 1 186 301277 0.62 0.52
Figure 44. Seasonally Adjusted Inpatient Hospital Utilization per 1,000 NH Medicaid Beneficiaries, CY 2007‐2012: Total Population
Time Period Visits Member Months Rate per 1,000 Adjusted Rate per 1,0002007 QTR 1 2682 248641 11 102007 QTR 2 2905 250387 12 122007 QTR 3 2756 250333 11 112007 QTR 4 2571 250172 10 112008 QTR 1 2795 253141 11 11
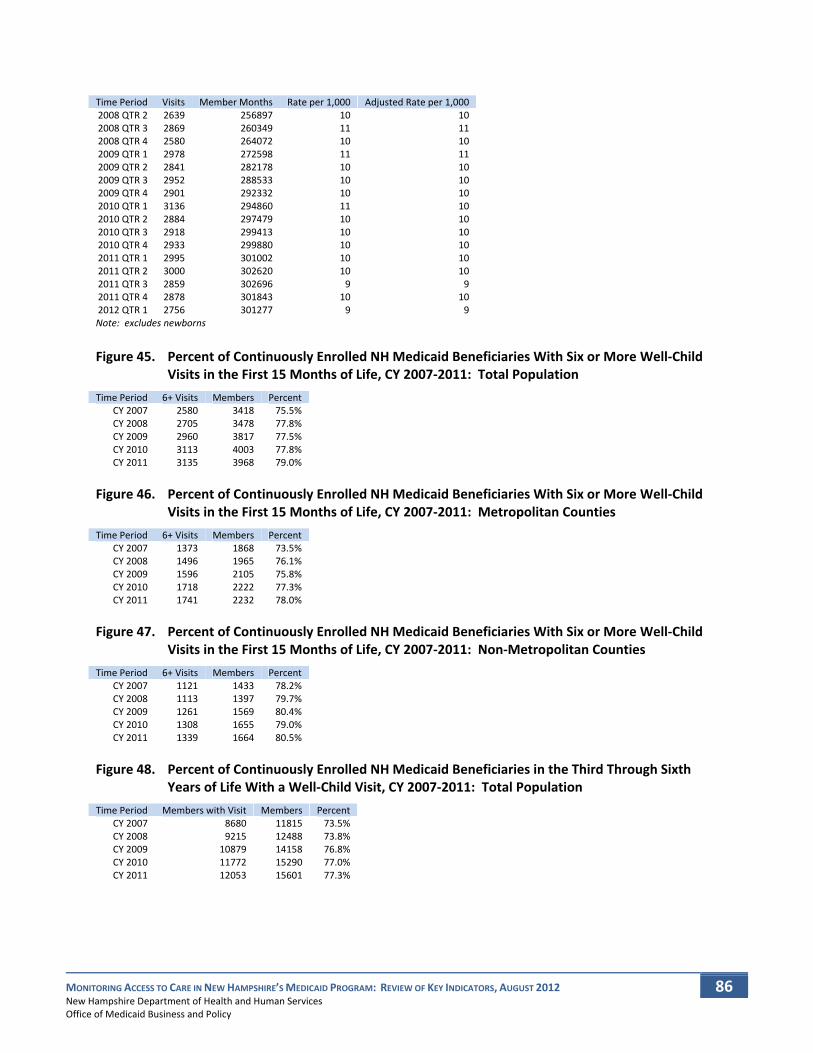
MONITORING ACCESS TO CARE IN NEW HAMPSHIRE’S MEDICAID PROGRAM: REVIEW OF KEY INDICATORS, AUGUST 2012 New Hampshire Department of Health and Human Services Office of Medicaid Business and Policy
86
Time Period Visits Member Months Rate per 1,000 Adjusted Rate per 1,0002008 QTR 2 2639 256897 10 102008 QTR 3 2869 260349 11 112008 QTR 4 2580 264072 10 102009 QTR 1 2978 272598 11 112009 QTR 2 2841 282178 10 102009 QTR 3 2952 288533 10 102009 QTR 4 2901 292332 10 102010 QTR 1 3136 294860 11 102010 QTR 2 2884 297479 10 102010 QTR 3 2918 299413 10 102010 QTR 4 2933 299880 10 102011 QTR 1 2995 301002 10 102011 QTR 2 3000 302620 10 102011 QTR 3 2859 302696 9 92011 QTR 4 2878 301843 10 102012 QTR 1 2756 301277 9 9Note: excludes newborns
Figure 45. Percent of Continuously Enrolled NH Medicaid Beneficiaries With Six or More Well‐Child Visits in the First 15 Months of Life, CY 2007‐2011: Total Population
Time Period 6+ Visits Members Percent CY 2007 2580 3418 75.5% CY 2008 2705 3478 77.8% CY 2009 2960 3817 77.5% CY 2010 3113 4003 77.8% CY 2011 3135 3968 79.0%
Figure 46. Percent of Continuously Enrolled NH Medicaid Beneficiaries With Six or More Well‐Child Visits in the First 15 Months of Life, CY 2007‐2011: Metropolitan Counties
Time Period 6+ Visits Members Percent CY 2007 1373 1868 73.5% CY 2008 1496 1965 76.1% CY 2009 1596 2105 75.8% CY 2010 1718 2222 77.3% CY 2011 1741 2232 78.0%
Figure 47. Percent of Continuously Enrolled NH Medicaid Beneficiaries With Six or More Well‐Child Visits in the First 15 Months of Life, CY 2007‐2011: Non‐Metropolitan Counties
Time Period 6+ Visits Members Percent CY 2007 1121 1433 78.2% CY 2008 1113 1397 79.7% CY 2009 1261 1569 80.4% CY 2010 1308 1655 79.0% CY 2011 1339 1664 80.5%
Figure 48. Percent of Continuously Enrolled NH Medicaid Beneficiaries in the Third Through Sixth Years of Life With a Well‐Child Visit, CY 2007‐2011: Total Population
Time Period Members with Visit Members PercentCY 2007 8680 11815 73.5%CY 2008 9215 12488 73.8%CY 2009 10879 14158 76.8%CY 2010 11772 15290 77.0%CY 2011 12053 15601 77.3%
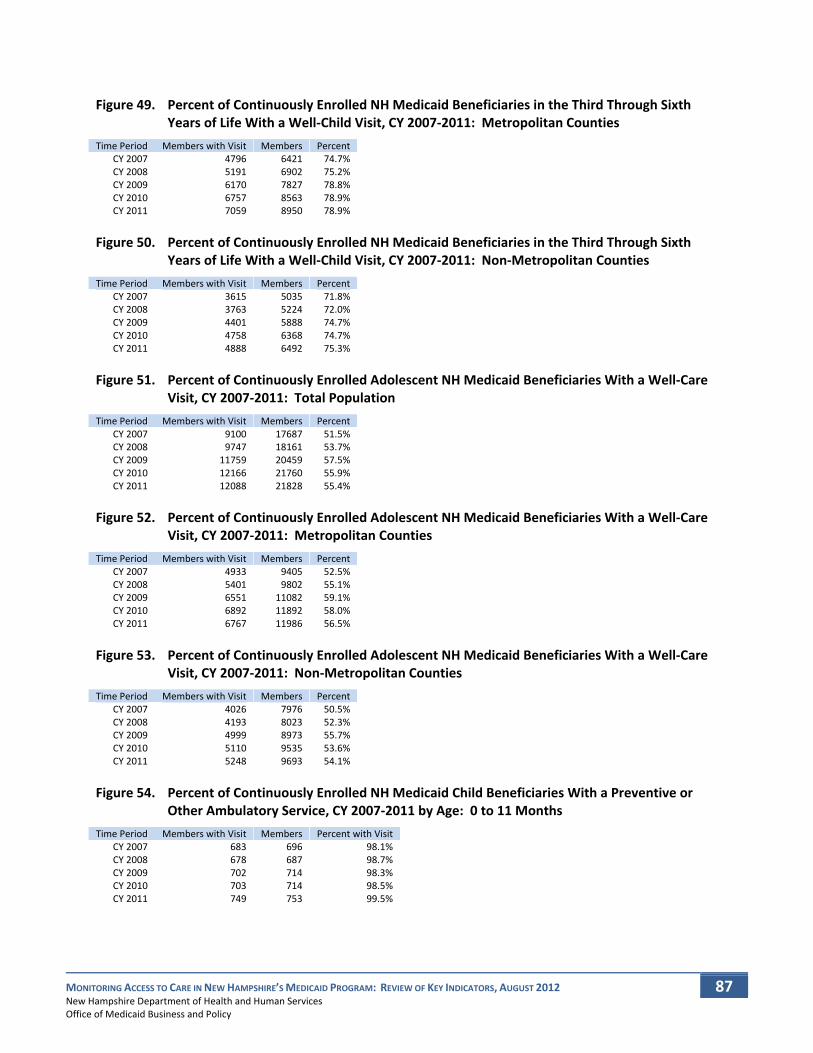
MONITORING ACCESS TO CARE IN NEW HAMPSHIRE’S MEDICAID PROGRAM: REVIEW OF KEY INDICATORS, AUGUST 2012 New Hampshire Department of Health and Human Services Office of Medicaid Business and Policy
87
Figure 49. Percent of Continuously Enrolled NH Medicaid Beneficiaries in the Third Through Sixth Years of Life With a Well‐Child Visit, CY 2007‐2011: Metropolitan Counties
Time Period Members with Visit Members PercentCY 2007 4796 6421 74.7%CY 2008 5191 6902 75.2%CY 2009 6170 7827 78.8%CY 2010 6757 8563 78.9%CY 2011 7059 8950 78.9%
Figure 50. Percent of Continuously Enrolled NH Medicaid Beneficiaries in the Third Through Sixth Years of Life With a Well‐Child Visit, CY 2007‐2011: Non‐Metropolitan Counties
Time Period Members with Visit Members PercentCY 2007 3615 5035 71.8%CY 2008 3763 5224 72.0%CY 2009 4401 5888 74.7%CY 2010 4758 6368 74.7%CY 2011 4888 6492 75.3%
Figure 51. Percent of Continuously Enrolled Adolescent NH Medicaid Beneficiaries With a Well‐Care Visit, CY 2007‐2011: Total Population
Time Period Members with Visit Members PercentCY 2007 9100 17687 51.5%CY 2008 9747 18161 53.7%CY 2009 11759 20459 57.5%CY 2010 12166 21760 55.9%CY 2011 12088 21828 55.4%
Figure 52. Percent of Continuously Enrolled Adolescent NH Medicaid Beneficiaries With a Well‐Care Visit, CY 2007‐2011: Metropolitan Counties
Time Period Members with Visit Members PercentCY 2007 4933 9405 52.5%CY 2008 5401 9802 55.1%CY 2009 6551 11082 59.1%CY 2010 6892 11892 58.0%CY 2011 6767 11986 56.5%
Figure 53. Percent of Continuously Enrolled Adolescent NH Medicaid Beneficiaries With a Well‐Care Visit, CY 2007‐2011: Non‐Metropolitan Counties
Time Period Members with Visit Members PercentCY 2007 4026 7976 50.5%CY 2008 4193 8023 52.3%CY 2009 4999 8973 55.7%CY 2010 5110 9535 53.6%CY 2011 5248 9693 54.1%
Figure 54. Percent of Continuously Enrolled NH Medicaid Child Beneficiaries With a Preventive or Other Ambulatory Service, CY 2007‐2011 by Age: 0 to 11 Months
Time Period Members with Visit Members Percent with VisitCY 2007 683 696 98.1%CY 2008 678 687 98.7%CY 2009 702 714 98.3%CY 2010 703 714 98.5%CY 2011 749 753 99.5%

MONITORING ACCESS TO CARE IN NEW HAMPSHIRE’S MEDICAID PROGRAM: REVIEW OF KEY INDICATORS, AUGUST 2012 New Hampshire Department of Health and Human Services Office of Medicaid Business and Policy
88
Figure 55. Percent of Continuously Enrolled NH Medicaid Child Beneficiaries With a Preventive or Other Ambulatory Service, CY 2007‐2011 by Age: 12 to 24 Months
Time Period Members with Visit Members Percent with VisitCY 2007 3422 3456 99.0%CY 2008 3614 3657 98.8%CY 2009 3964 4010 98.9%CY 2010 4004 4057 98.7%CY 2011 3915 3975 98.5%
Figure 56. Percent of Continuously Enrolled NH Medicaid Child Beneficiaries With a Preventive or Other Ambulatory Service, CY 2007‐2011 by Age: 25 Months to 6 Years
Time Period Members with Visit Members Percent with VisitCY 2007 10067 11007 91.5%CY 2008 10728 11713 91.6%CY 2009 12305 13217 93.1%CY 2010 13475 14500 92.9%CY 2011 13708 14850 92.3%
Figure 57. Percent of Continuously Enrolled NH Medicaid Child Beneficiaries With a Preventive or Other Ambulatory Service, CY 2007‐2011 by Age: 7 to 11 Years
Time Period Members with Visit Members Percent with VisitCY 2007 10722 12753 84.1%CY 2008 11464 13469 85.1%CY 2009 13342 15067 88.6%CY 2010 14145 16118 87.8%CY 2011 14296 16393 87.2%
Figure 58. Percent of Continuously Enrolled NH Medicaid Child Beneficiaries With a Preventive or Other Ambulatory Service, SFY 2007‐2011 by Age: 12 to 18 Years
Time Period Percent with Visit SFY 2007 91.2% SFY 2008 90.9% SFY 2009 92.0% SFY 2010 93.2% SFY 2011 93.2%
Note: chart will be updated to calendar year in next version of report
Figure 59. Percent of Continuously Enrolled NH Medicaid Child Beneficiaries With a Preventive or Other Ambulatory Service, CY 2007‐2011: Metropolitan Counties
Time Period Members with Visit Members Percent with VisitCY 2007 22458 25383 88.5%CY 2008 23927 26854 89.1%CY 2009 27593 30219 91.3%CY 2010 29517 32719 90.2%CY 2011 30125 33492 89.9%
Figure 60. Percent of Continuously Enrolled NH Medicaid Child Beneficiaries With a Preventive or Other Ambulatory Service, CY 2007‐2011: Non‐Metropolitan Counties
Time Period Members with Visit Members Percent with VisitCY 2007 17761 20416 87.0%CY 2008 18620 21197 87.8%CY 2009 21231 23467 90.5%CY 2010 22482 25073 89.7%CY 2011 22799 25691 88.7%

MONITORING ACCESS TO CARE IN NEW HAMPSHIRE’S MEDICAID PROGRAM: REVIEW OF KEY INDICATORS, AUGUST 2012 New Hampshire Department of Health and Human Services Office of Medicaid Business and Policy
89
Figure 61. Percent of Continuously Enrolled NH Medicaid Adult Beneficiaries With a Preventive or Other Ambulatory Service, CY 2007‐2011 by Age: 20 to 44 Years
Time Period Members with Visit Members PercentCY 2007 7102 8207 87%CY 2008 7377 8428 88%CY 2009 8519 9528 89%CY 2010 9188 10389 88%CY 2011 9022 10326 87%
Figure 62. Percent of Continuously Enrolled NH Medicaid Adult Beneficiaries With a Preventive or Other Ambulatory Service, CY 2007‐2011 by Age: 45 to 64 Years
Time Period Members with Visit Members PercentCY 2007 3267 3627 90%CY 2008 3536 3911 90%CY 2009 3956 4311 92%CY 2010 4216 4614 91%CY 2011 4387 4836 91%
Figure 63. Percent of Continuously Enrolled NH Medicaid Adult Beneficiaries With a Preventive or Other Ambulatory Service, CY 2007‐2011: Metropolitan Counties
Time Period Members with Visit Members PercentCY 2007 6201 7054 87.9%CY 2008 6485 7389 87.8%CY 2009 7381 8234 89.6%CY 2010 7999 8991 89.0%CY 2011 8088 9114 88.7%
Figure 64. Percent of Continuously Enrolled NH Medicaid Adult Beneficiaries With a Preventive or Other Ambulatory Service, CY 2007‐2011: Non‐Metropolitan Counties
Time Period Members with Visit Members PercentCY 2007 4396 5062 86.8%CY 2008 4672 5241 89.1%CY 2009 5282 5831 90.6%CY 2010 5704 6342 89.9%CY 2011 5842 6625 88.2%
Figure 65. Percent of Discharges for Hospitalization for Mental Health Disorder Treatment Where the Member Had a Follow‐Up Visit Seven 7 Days, CY 2007‐2011 by Age: 7 to 18 Years
Time Period Timely Follow‐Up Discharges PercentCY 2007 154 255 60.4%CY 2008 116 215 54.0%CY 2009 153 272 56.3%CY 2010 165 285 57.9%CY 2011 163 276 59.1%
Figure 66. Percent of Discharges for Hospitalization for Mental Health Disorder Treatment Where the Member Had a Follow‐Up Visit Within 7 Days, CY 2007‐2011 by Age: 19 and Older
Time Period Timely Follow‐Up Discharges PercentCY 2007 263 443 59.4%CY 2008 234 431 54.3%CY 2009 227 434 52.3%CY 2010 255 443 57.6%CY 2011 256 431 59.4%
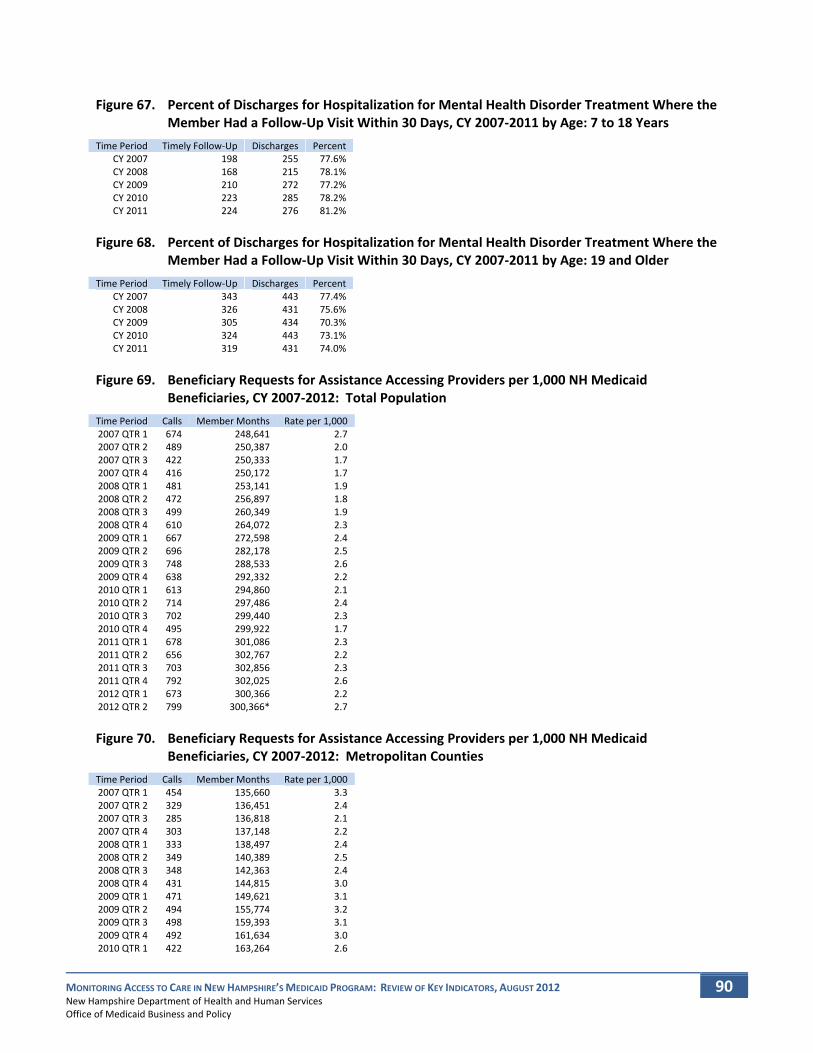
MONITORING ACCESS TO CARE IN NEW HAMPSHIRE’S MEDICAID PROGRAM: REVIEW OF KEY INDICATORS, AUGUST 2012 New Hampshire Department of Health and Human Services Office of Medicaid Business and Policy
90
Figure 67. Percent of Discharges for Hospitalization for Mental Health Disorder Treatment Where the Member Had a Follow‐Up Visit Within 30 Days, CY 2007‐2011 by Age: 7 to 18 Years
Time Period Timely Follow‐Up Discharges PercentCY 2007 198 255 77.6%CY 2008 168 215 78.1%CY 2009 210 272 77.2%CY 2010 223 285 78.2%CY 2011 224 276 81.2%
Figure 68. Percent of Discharges for Hospitalization for Mental Health Disorder Treatment Where the Member Had a Follow‐Up Visit Within 30 Days, CY 2007‐2011 by Age: 19 and Older
Time Period Timely Follow‐Up Discharges PercentCY 2007 343 443 77.4%CY 2008 326 431 75.6%CY 2009 305 434 70.3%CY 2010 324 443 73.1%CY 2011 319 431 74.0%
Figure 69. Beneficiary Requests for Assistance Accessing Providers per 1,000 NH Medicaid Beneficiaries, CY 2007‐2012: Total Population
Time Period Calls Member Months Rate per 1,0002007 QTR 1 674 248,641 2.72007 QTR 2 489 250,387 2.02007 QTR 3 422 250,333 1.72007 QTR 4 416 250,172 1.72008 QTR 1 481 253,141 1.92008 QTR 2 472 256,897 1.82008 QTR 3 499 260,349 1.92008 QTR 4 610 264,072 2.32009 QTR 1 667 272,598 2.42009 QTR 2 696 282,178 2.52009 QTR 3 748 288,533 2.62009 QTR 4 638 292,332 2.22010 QTR 1 613 294,860 2.12010 QTR 2 714 297,486 2.42010 QTR 3 702 299,440 2.32010 QTR 4 495 299,922 1.72011 QTR 1 678 301,086 2.32011 QTR 2 656 302,767 2.22011 QTR 3 703 302,856 2.32011 QTR 4 792 302,025 2.62012 QTR 1 673 300,366 2.22012 QTR 2 799 300,366* 2.7
Figure 70. Beneficiary Requests for Assistance Accessing Providers per 1,000 NH Medicaid Beneficiaries, CY 2007‐2012: Metropolitan Counties
Time Period Calls Member Months Rate per 1,0002007 QTR 1 454 135,660 3.32007 QTR 2 329 136,451 2.42007 QTR 3 285 136,818 2.12007 QTR 4 303 137,148 2.22008 QTR 1 333 138,497 2.42008 QTR 2 349 140,389 2.52008 QTR 3 348 142,363 2.42008 QTR 4 431 144,815 3.02009 QTR 1 471 149,621 3.12009 QTR 2 494 155,774 3.22009 QTR 3 498 159,393 3.12009 QTR 4 492 161,634 3.02010 QTR 1 422 163,264 2.6
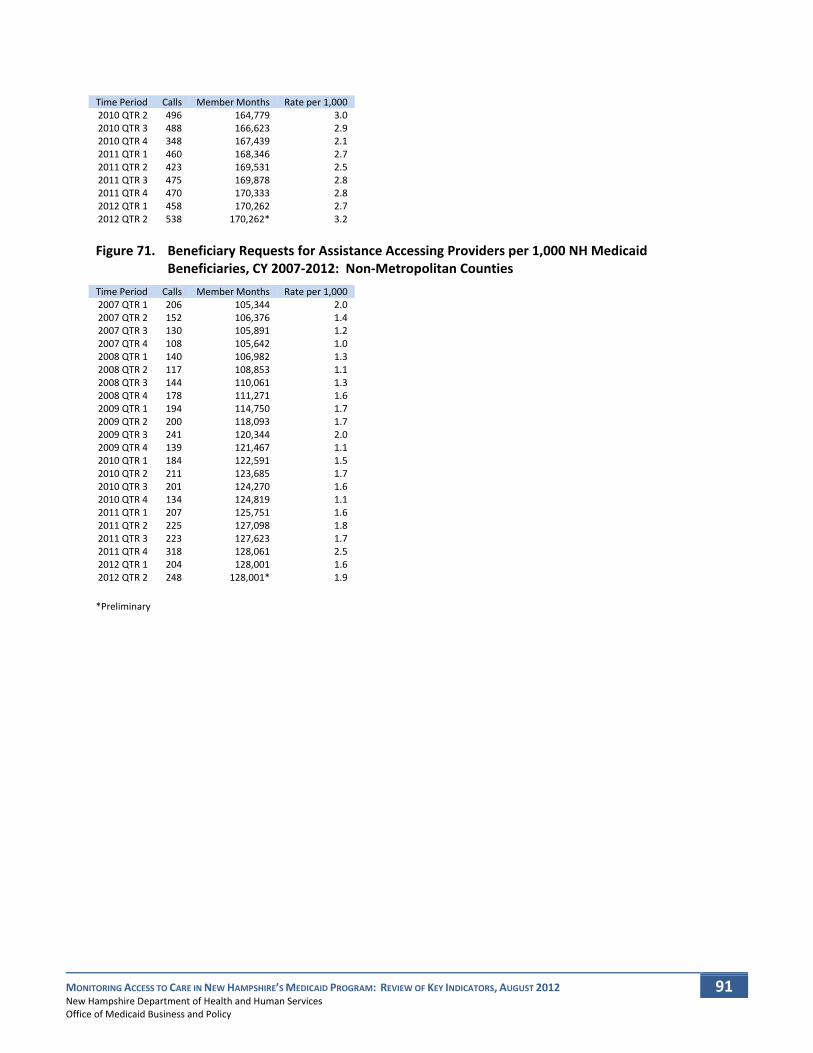
MONITORING ACCESS TO CARE IN NEW HAMPSHIRE’S MEDICAID PROGRAM: REVIEW OF KEY INDICATORS, AUGUST 2012 New Hampshire Department of Health and Human Services Office of Medicaid Business and Policy
91
Time Period Calls Member Months Rate per 1,0002010 QTR 2 496 164,779 3.02010 QTR 3 488 166,623 2.92010 QTR 4 348 167,439 2.12011 QTR 1 460 168,346 2.72011 QTR 2 423 169,531 2.52011 QTR 3 475 169,878 2.82011 QTR 4 470 170,333 2.82012 QTR 1 458 170,262 2.72012 QTR 2 538 170,262* 3.2
Figure 71. Beneficiary Requests for Assistance Accessing Providers per 1,000 NH Medicaid Beneficiaries, CY 2007‐2012: Non‐Metropolitan Counties
Time Period Calls Member Months Rate per 1,0002007 QTR 1 206 105,344 2.02007 QTR 2 152 106,376 1.42007 QTR 3 130 105,891 1.22007 QTR 4 108 105,642 1.02008 QTR 1 140 106,982 1.32008 QTR 2 117 108,853 1.12008 QTR 3 144 110,061 1.32008 QTR 4 178 111,271 1.62009 QTR 1 194 114,750 1.72009 QTR 2 200 118,093 1.72009 QTR 3 241 120,344 2.02009 QTR 4 139 121,467 1.12010 QTR 1 184 122,591 1.52010 QTR 2 211 123,685 1.72010 QTR 3 201 124,270 1.62010 QTR 4 134 124,819 1.12011 QTR 1 207 125,751 1.62011 QTR 2 225 127,098 1.82011 QTR 3 223 127,623 1.72011 QTR 4 318 128,061 2.52012 QTR 1 204 128,001 1.62012 QTR 2 248 128,001* 1.9
*Preliminary