Embed Size (px)
Citation preview

1
Monitoring and assessment programme on
plastic litter in Viet Nam shoreline
Report 2019
Greenhub, IUCN Viet Nam
INTERNATIONAL UNION FOR CONSERVATION OF NATURE
2
About IUCN
IUCN is a membership Union uniquely composed of both government and civil society
organisations. It provides public, private and non-governmental organisations with the
knowledge and tools that enable human progress, economic development and nature
conservation to take place together.
Created in 1948, IUCN is now the world`s largest and most diverse environmental network,
harnessing the knowledge, resources and reach of more than 1,300 Member organisations and
some 10,000 experts. It is a leading provider of conservation data, assessments and analysis.
Its broad membership enables IUCN to fill the role of incubator and trusted repository of best
practices, tools and international standards.
IUCN provides a neutral space in which diverse stakeholders including governments, NGOs,
scientists, businesses, local communities, indigenous peoples organisations and others can
work together to forge and implement solutions to environmental challenges and achieve
sustainable development.
Working with many partners and supporters, IUCN implements a large and diverse portfolio of
conservation projects worldwide. Combining the latest science with the traditional knowledge of
local communities, these projects work to reverse habitat loss, restore ecosystems and improve
people`s well-being.
www.iucn.org
https://twitter.com

3
Monitoring and assessment programme on
plastic litter in Viet Nam shoreline
Report 2019
Greenhub, IUCN Viet Nam

4
The designation of geographical entities in this report,
and the presentation of the materials, do not imply the
expression of any opinion whatsoever on the part of
The International Union for Conservation of Nature
(IUCN), Center for Supporting Green Development
(Greenhub), World Wild Fund for Nature (WWF), The
Swedish International Development Cooperation
Agency (Sida) and the U.S. Fish and Wildlife Service
(U.S. FWS) concerning the legal status of any country,
territory, or area, or of its authorities, or concerning the
delimitation of its frontiers or boundaries.
The views expressed in this publication do not
necessarily reflect those of IUCN, Greenhub, WWF,
Sida or U.S. FWS or any other participating
organizations.
This report has been made possible by funding from
Sida and U.S.FWS.
The work has not been submitted to any other
organization or journal for publication.
Published by: IUCN Viet Nam Country Office
Copyright: © 2021 IUCN, International Union for
Conservation of Nature and Natural Resources
Reproduction of this report for educational or other
non-commercial purposes is authorized without prior
written permission from the copyright holder provided
the source is fully acknowledged.
Reproduction of this report for resale or other
commercial purposes is prohibited without prior written
permission of the copyright holder.
Citation: IUCN Viet Nam & Greenhub (2021).
Monitoring and Assessment programme on
plastic litter in Viet Nam shoreline – Report 2019.
Hanoi, Viet Nam. IUCN: Viet Nam Country Office.
13pp.
Cover photo: Volunteers are classifying waste
categories in Phu Quoc MPA © IUCN Viet Nam
Back Cover: Waste audit in Bai Tu Long National
Park © IUCN Viet Nam
Layout by: Nguyen Thuy Anh Produced by: IUCN Viet Nam Country Office
Available from:
IUCN Viet Nam Country Office 1st Floor, 2A Building, Van Phuc Diplomatic Compound 298 Kim Ma Street, Ba Dinh District Ha Noi city, Viet Nam www.iucn.org/vietnam IUCN Asia Regional Office 63 Soi Prompong, Sukhumvit 39, Wattana 10110 Bangkok, Thailand Tel: +66 2 662 4029 www.iucn.org/asia http://www.iucn.org/resources/publications

5
TABLE OF CONTENTS
ABOUT IUCN .............................................................................................................................. 2
1. INTRODUCTION ....................................................................................................................... 6
2. METHODS AND STUDY SITES ................................................................................................... 7
3. RESULTS AND DISCUSSION ...................................................................................................... 8
1.1 Waste overview in Coastal .................................................................................................. 8
1.2 Composition of waste at the beach .................................................................................. 10
1.3 Assess the pollution level of surveyed beaches ............................................................... 12
4. CONCLUSION: ........................................................................................................................ 14

6
1. Introduction
Plastic waste in the oceans is now one of the most serious environmental problems, and Vietnam is one
of the countries with the highest amounts of plastic waste discharged into the sea. Among the 20
countries studied, the amount of plastic waste from Vietnam to the sea ranged from 0.28 to 0.73 million
tons / year, equivalent to 6% of the total plastic waste to the sea and ranked 4th in the top 20 countries.
Recognizing the serious risk of plastic waste to the environment, many initiatives, plans and regulatory
documents have been issued. Many coastal provinces and cities also integrate pollution and disposal of
marine plastic waste into local socio-economic development plans. However, in reality Vietnam does not
have adequate national data characterizing plastic sources in the mainland or the sea and minimal
quantitative research or statistics on the amount of plastic waste in coastal areas, including its sensitive
Marine Protected Areas, which can be seriously affected by waste pollution.
Plastic marine debris is a global problem, but due to its widespread and patchy distribution, gathering
sufficient samples for scientific research is challenging with limited time and human resources. Taking
advantage of public interest in the impact of plastic on the marine environment, the Citizen Science (CS)
initiative incorporates members of the public to provide public involvement in data collection in Vietnam.
Citizen science is regarded as the practice of engaging the public in a scientific project or research which
produces reliable data and information usable by scientists, decision makers, or other stakeholders. The
public can also contribute to science through crowd sourcing, a practice that typically involves large
numbers of people in processing and analyzing data. The value of citizen science is discussed in relation
to a range of projects of different types. For simplicity, ‘value’ is divided into scientific, educational, social
and policy aspects.
Start in 2019, GreenHub and IUCN developed “Guidelines for Plastic pollution shoreline survey and
monitoring and coastal plastic pollution” based on the guidelines of the National Oceanic and
Atmospheric Administration (NOAA) and “Guidance on Survey and Monitoring of Marine Litter” of United
Nations Environment Programme (UNEP), with adjustments to the concrete conditions in Vietnam.
This guide is used as a generic method document, applicable to all study sites to identify the results of
plastic waste monitoring and assessment in the coastal for the Monitoring and Assessment programme
on plastic litter in the coastal areas of Viet Nam. Objectives of this study were to a) Determining the
composition and quantities of plastic waste and its origin; b) Recommending waste pollution hotspots
for local authorities, and safe waste collection method in order to minimize adverse impacts on
ecosystems and biodiversity during the cleanup event; c) Contributing to national policy
recommendation based on scientifically based data collection; d) Using effectively the human and
financial resources to minimize and prevent the impacts of marine waste; plastic pollution; e) Fundraising
for conservation management activities which are associated with minimizing plastic pollution.
In Vietnam, we trained and supervision at 33 beaches in 11 Marine Protected Areas (MPAs), National
Parks along the Vietnam coast. The program is expected to be implemented two time a year of over
many years to create a reliable dataset of marine plastic waste in Vietnam.
7
2. Methods and study sites
The selection of survey beaches followed the criteria defined in “Guidelines for Plastic pollution shoreline
survey and monitoring and coastal plastic pollution”. The beaches had to be composed of sand or gravel
and exposed to the open sea; accessible to surveyors all year round; have a minimum length of at least
several 100m; be free of buildings all year round and not subject to any other litter collection activities
(beach cleaning or cleaning at least 3 months from the survey time); the beaches having fauna
preservations like turtles, corals, bird migratory, marine animals, etc.
The survey methodology followed guidelines. Each marine protected area or national park will have 12
participants surveyed on the 100m beach stretches. At each selected beach, it will be divided equally into
20 equal parts, each with a width of 5m and perpendicular to the shore, numbered from 1 to 20 according
to the length of the beach. Randomly select any 04 numbers to eliminate subjective and biased factors
from the review. These four numbers correspond to four sections, each with a width of 5m and will
collect plastic waste samples. The location of the four selected sections remained unchanged during all
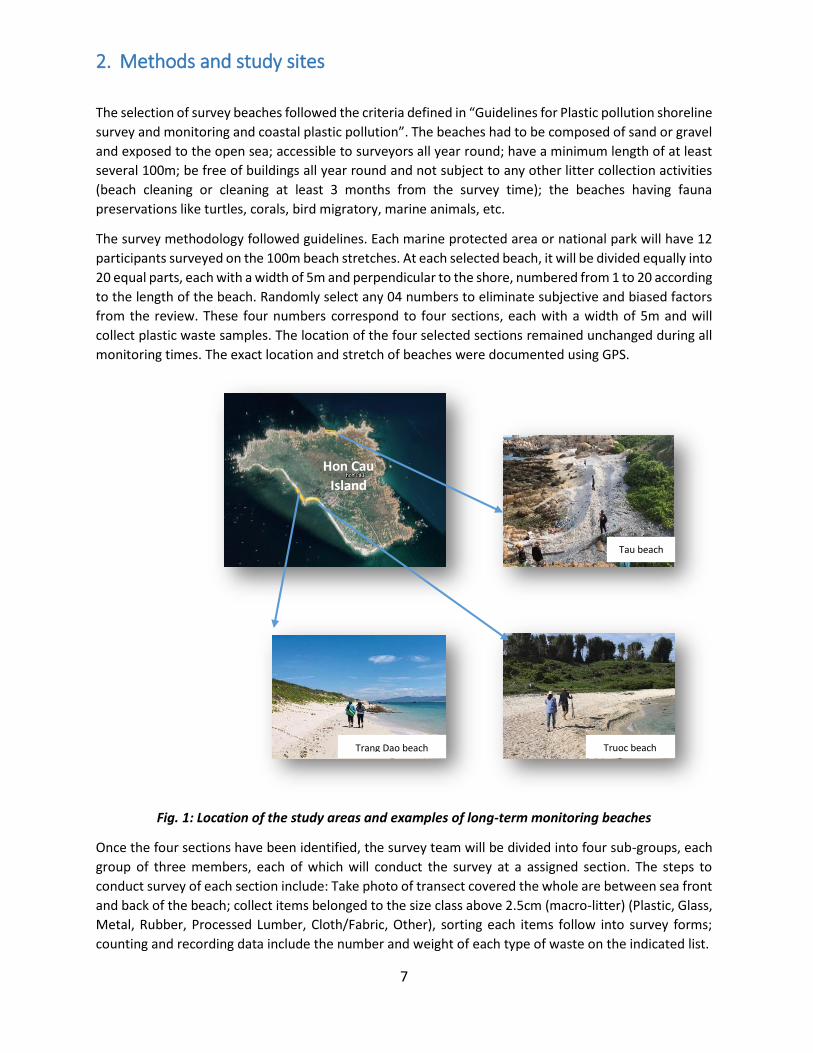
monitoring times. The exact location and stretch of beaches were documented using GPS.
Fig. 1: Location of the study areas and examples of long-term monitoring beaches
Once the four sections have been identified, the survey team will be divided into four sub-groups, each
group of three members, each of which will conduct the survey at a assigned section. The steps to
conduct survey of each section include: Take photo of transect covered the whole are between sea front
and back of the beach; collect items belonged to the size class above 2.5cm (macro-litter) (Plastic, Glass,
Metal, Rubber, Processed Lumber, Cloth/Fabric, Other), sorting each items follow into survey forms;
counting and recording data include the number and weight of each type of waste on the indicated list.
Hon Cau
Island
Tau beach
Truoc beach Trang Dao beach

8
Fig. 2: Randomly select any 04 numbers for the 20 sections of 100m beach stretches
Fig. 3: Collecting waste in each section (4 Transect)
Fig.4: Sorting, counting and recording data
The data is admitted on excel file and statistical analysis to determine the composition, sources, weight
and trend of change over time to serve the local waste management.
3. Results and Discussion
1.1 Waste overview in Coastal
A total of 86,092 pieces in debris categories were collected from 10 locations in two season in 2019.
Average amounts of debris on the survey beaches in number were 368,7 pieces/5m (± 475,7 SD, ranges
from 13 to 3168). 1135,046 kg debris were collected, Average amounts in weight were 4.729kg/transect
(± 6,371 SD, ranges from 0 to 56,99kg). On average, more than on the 100m beach stretches will have a
waste of 7374 pieces and 94.58 kg.

9
Fig. 5: The average number and weight of debris on each transect follow by season.
Follow the survey results in 2019, the amount and weight of waste varies follow by season, from north
to south of Vietnam and from offshore and coastal islands, beach of inland. Specifically:
Number of pieces there is a large difference between season 1(June 2019) and season 2 (December
2019), of which season 1 has a large number almost twice as much as season 2. However, the weight is
similar in both seasons.
Vietnam's northern beaches such as Cat Ba, Bai Tu Long and Bach Long Vy have lower number and weight
of waste than beaches and islands in the central region of Vietnam (Quang Tri, Cu Lao Cham, Ly Son, Nha
Trang, ...). However, only the difference in number is statistically significant (Mann Whisley test, p =
0.003). In terms of location, coastal islands have lower number and weight than offshore islands and
inland areas.
Fig. 6: Compare the average amount of waste in number
and weight between seasons
Fig.7: Compare the average amount of waste in
number and weight between sites.
440.17
277.27
4.71 4.75
-
1.00
2.00
3.00
4.00
5.00
-
100.00
200.00
300.00
400.00
500.00
Mùa 1 Mùa 2
Số lượng (mảnh/5m) Khối lượng (kg/5m)

10
Fig. 8: Compare the average amount of waste in
number and weight between sites in offshore islands
(D), coastal islands (V) và inland areas (L)
1.2 Composition of waste at the beach
Fig. 9: Rate of types of waste at the beach by number and weight
The relative share of different item categories (Fig.9), shows that with 92,2% number and 64,8% weight
of plastic, average of 6.612 pieces/100m. Number of other items: metals, glass, rubber, wood
(machined), cloth and other waste is less but weight is high, especial is other waste only 1.6% of number
but 10.4% of weight.
The number and weight of plastic waste also varies by geographic region and season. While the weight
of plastic waste in season 1 in 2019 (June) and season 2 in 2019 (December) is similar, the number of
plastic waste in season 1 is higher than that in season 2. About geographical, The Central region has a
larger number of plastic waste than the North, especially in terms of location, the beaches on the Coastal
Islands have lower number and weight of plastic waste than the beaches on the offshore islands and
inland. This is statistically significant (Mann Whisley Test, p = 0.003 and 0.007).
79349
735.16
1349
117.53
0% 10% 20% 30% 40% 50% 60% 70% 80% 90% 100%
Số lượng (mảnh)
Khối lượng (kg)
Nhựa Kim loại Thuỷ tinh Cao su Gỗ, giấy Vải Rác khác

11
Fig. 10: Comparison of rate of plastic waste at survey locations by number.
Fig. 11: Comparison of rate of plastic waste at survey locations by weight.
In plastic waste (18 items in catalog), most abundant are polystyrene (24.2% of number and 11.7% of
weight) and rope/net plastic (17.25% of number and 17.59% of weight). In particular, the total number
items originating from aquaculture or related to aquaculture (floats, small ropes, small plastic nets,
plastic buoys and fishing lines) accounts for 47% of the number and 46% of the weight. Base on the
results show that profession related to fishing, aquaculture and trading are the most polluting sources
of waste, both in number and weight. However, current policies focus mainly on domestic waste sources
(such as nylon bags, plastic bottles ...). Therefore, in-depth studies and larger spaces (on the water, in
reefs, coral reefs, mangroves, etc.) are needed to more accurately identify the risks of this profession to
the environment, especially waste pollution.

12
Fig.1: Number, weight and rate of items of plastic waste to total number and weight of debris on beaches
1.3 Assess the pollution level of surveyed beaches
After 2 times survey in 2019 at 30 beaches and 10 site of Vietnam, we use the Coastal Clean Index (CCI)
to show that most off the beaches are extremely polluted with plastic debris. In the season 1, we assess
77% of the beaches are extremely polluted (CCI >20, 70%), polluted level (10 <CCI<20, 7%) and only 10%
are clean and very clean. In the season 2, rate of pollution beaches has decreased but still reaches 70%
(53% extremely polluted, 17% polluted), 23% beaches of clean and very clean. (Fig.13)
0.01%
0.09%
0.13%
0.22%
0.27%
0.37%
0.39%
0.75%
0.77%
1.07%
1.18%
1.65%
2.06%
3.09%
3.59%
5.16%
7.14%
7.54%
11.70%
17.59%
0 0.2 0.4 0.6 0.8 1
Bóng bay
Ống hút
Đầu lọc thuốc lá
Nhựa mỏng
Dây câu
Nhựa mềm
Bật lửa
Sản phẩm chăm sóc cá nhân
Hộp xốp đựng thức ăn
Đồ nhựa dùng một lần
Nắp chai/HDPE
Bao gói thực phẩm
Chai nhựa khác
Phao nhựa
Nhựa cứng
Túi nylon
Chai đựng đồ uống
Nhựa khác
Phao xốp
Dây thừng/lưới nhỏ
Khối lượng (kg/5m)
0.02%
0.51%
0.54%
0.65%
0.80%
0.86%
1.33%
1.60%
1.97%
2.36%
2.98%
3.31%
3.69%
3.95%
4.64%
5.05%
5.33%
11.12%
17.25%
24.20%
0 10 20 30 40 50 60 70 80 90100
Bóng bay
Nhựa mỏng
Bật lửa
Sản phẩm chăm sóc cá nhân
Chai nhựa khác
Dây câu
Phao nhựa
Ống hút
Nhựa mềm
Đồ nhựa dùng một lần
Bao gói thực phẩm
Chai đựng đồ uống
Đầu lọc thuốc lá
Nhựa khác
Nắp chai/HDPE
Nhựa cứng
Túi nylon
Hộp xốp đựng thức ăn
Dây thừng/lưới nhỏ
Phao xốp
Số lượng (mảnh/5m)
Rất sạch7% Sạch
3%Trung bình13%
Ô nhiễm7%
Rất ô nhiễm70%
Mùa 1Rất sạch
7%
Sạch16%
Trung bình7%
Ô nhiễm17%
Rất ô nhiễm53%
Mùa 2

13
Fig.13: The rate of quality of the surveyed beaches according to the CCI index
Some beaches have plastic pollution are high level such as: Ly Son, Nha Trang with CCI > 120. Other
beaches in site such as: Con Dao , Cu Lao Cham, Cat Ba, Hon Cau, Bai Tu Long, Bach Long Vy are polluted.
Fig.14: Pollution levels of the surveyed beaches in season 2 (December, 2019)
Ly Son
Nha Trang

14
Fig.15. Compare the quality of the survey sites with the CCI index.
4. Conclusion: - Number and weight of debris on survey beaches are very high, Average 7374 pieces/100m and
94.58kg/100m - Number of debris in season 1 (June 2019) is higher than number of debris in season 2 but weight
of debris is similar.
- Number and weight of debris in the central region beaches (Including Con Dao) is higher than
debris in the North region.
- Number of debris in the coastal islands on is lower than that in the offshore islands and on the
inland. However, in terms of weight only the beaches of inland are the highest and have
statistical significance.
- Plastic waste accounts for a large rate (92% of the number and 64.5% of the weight. In the
composition of plastic waste, almost kinds of plastic waste related to fishery activities (Culturing,
exploiting, trading, etc.), follow by single use plastic and other domestic waste.
- Number and weight of debris in beaches in Ly Son and Nha Trang are higher than that other sites.
- Assessment of the beach cleanliness index (Coastal Clean Index) shows that most of the beaches
in the study areas are extremely polluted with plastic waste, with more than 70% of the beaches
at extremely polluted level, clean and very clean beaches account for only 10% in season 1 and
23% in season 2.
0.0
20.0
40.0
60.0
80.0
100.0
120.0
140.0
160.0
180.0
200.0
220.0
240.0
260.0
BLV
B1
BLV
B2
BLV
B3
BTL
B1
BTL
B2
BTL
B3
CB
B1
CB
B2
CB
B3
CC
B1
CC
B2
CC
B3
CD
B1
CD
B2
CD
B3
CLC
B1
CLC
B2
CLC
B3
HC
B1
HC
B2
HC
B3
LSB
1
LSB
2
LSB
3
NC
B1
NC
B2
NC
B3
NTB
1
NTB
2
NTB
3
CCI CCI Rất ô nhiễm

15
-
IUCN Viet Nam Country Office
1st Floor, 2A Building,
Van Phuc Diplomatic Compound
298 Kim Ma Street, Ba Dinh District,
Hanoi city, Viet Nam
Tel: ++(844) 37261575/6
www.iucn.org/asia
www.iucn.org/vietnam