Embed Size (px)
Citation preview
Caring for the Land and Serving People
United States Department of Agriculture
Forest Service
Eastern Region
August 2012
Ottawa National Forest Monitoring and
Evaluation Report
Fiscal Year 2011
Citation:
USDA Forest Service. 2012. Ottawa National Forest Fiscal Year 2011 Monitoring &
Evaluation Report. Ironwood, MI.
Short name for citations in documents produced on the Forest – FY11 M&E Report
Responsible Official:
Chuck Meyers, Regional Forester
USDA Forest Service
Eastern Region
626 E. Wisconsin Avenue
Milwaukee, WI 53202
For further information contact:
Christine Handler – Forest Planner
Ottawa National Forest
1209 Rockland Road
Ontonagon, MI 49953
Phone: 906-884-2085 x 12
The U.S. Department of Agriculture (USDA) prohibits discrimination in all its
programs and activities on the basis of race, color, national origin, sex, religion,
age, disability, sexual orientation, marital status, family status, status as a parent
(in education and training programs and activities), because all or part of an
individual’s income is derived from any public assistance program, or
retaliation. (Not all prohibited bases apply to all programs or activities.)
If you require this information in alternative format (Braille, large print,
audiotape, etc.), contact the USDA’s TARGET Center at (202) 720-2600 (Voice
or TDD).
If you require information about this program, activity, or facility in a language
other than English, contact the agency office responsible for the program or
activity, or any USDA office.
To file a complaint alleging discrimination, write USDA, Director, Office of
Civil Rights, 1400 Independence Avenue, S.W., Washington, D.C. 20250-9410,
or call Toll free, (866) 632-9992 (Voice). TDD users can contact USDA through
local relay or the Federal relay at (800) 877-8339 (TDD) or (866) 377-8642
(relay voice users). USDA is an equal opportunity provider and employer.
FY11 Ottawa NF Monitoring and Evaluation Report Page i
TABLE OF CONTENTS ..................................................................................................................................................................... i
Introduction and Forest Plan Overview ............................................................................................................................ 1
Purpose and Scope of the Report......................................................................................................................................... 2
Monitoring Program................................................................................................................................................................. 2
Monitoring Activities for FY 2011 ....................................................................................................................................... 3
1: How do actual outputs and services compare to those outputs and services projected in the Forest Plan? ... 6
2: How close are actual costs compared to projected costs? .................................................................................................... 8
4: Are insect and disease population levels compatible with objectives for restoring or maintaining healthy forest conditions? ..................................................................................................................................................................................... 13
6: Are harvested lands adequately restocked after 5 years? ................................................................................................... 16
18: To what extent is wilderness management contributing to improvement or preservation of wilderness character and values? ............................................................................................................................................................................. 16
23: To what extent are aspen forest type acres being maintained through regeneration activities to meet Forestwide and management area objectives? ............................................................................................................................ 18
29: To what extent is forest management affecting soil quality? ........................................................................................ 21
32: To what extent are the key terrestrial habitat components (e.g., soft mast, hard mast, snags, down woody material, low dense conifer regeneration) being provided? ................................................................................................... 23
33: To what extent is forest management providing ecological conditions to maintain viable populations of native and desired non-native species? ........................................................................................................................................... 25
33a: Plants – To what extent is forest management providing ecological conditions to maintain viable populations of native and desired non-native species? ................................................................................................... 25
33b: Birds - To what extent is forest management providing ecological conditions to maintain viable populations of native and desired non-native species? ................................................................................................... 29
33d: Bobcat - To what extent is forest management providing ecological conditions to maintain viable populations of native and desired non-native species? ................................................................................................... 35
34b: Black-backed Woodpecker and spruce grouse – To what extent is forest management contributing or responding to the conservation of species of viability concern (such as Regional Forester’s Sensitive Species) and moving toward desired habitat conditions for these species? ....................................................................................... 40
34d: Common loon – To what extent is forest management contributing or responding to the conservation of species of viability concern (such as Regional Forester’s Sensitive Species) and moving toward desired habitat conditions? .................................................................................................................................................................................................. 44
36: To what extent is forest management affecting the density of open roads within the Remote Habitat Area, and moving toward the Forest density objective of < 1.0 miles/square mile? ................................................................. 48
FY11 Ottawa NF Monitoring and Evaluation Report Page ii
37: To what extent is forest management contributing to the development and maintenance of foraging and denning habitat, and connectivity of habitats for Canada lynx? ........................................................................................... 49
40: To what extent has land ownership adjustment facilitated forest management activities? .............................. 50
44a: To what extent are unneeded roads being decommissioned? ...................................................................................... 51
Additional Monitoring Information................................................................................................................................. 52
Regional Forester’s Sensitive Species (RFSS) List Update ........................................................................................................ 52
Monitoring of Forest Roads and Off-Highway Vehicle Use (OHV)......................................................................................... 52
Future Monitoring Needs .................................................................................................................................................... 53
Preparers................................................................................................................................................................................... 53
Appendix 1 – Schedule for Forest Plan Monitoring and Evaluation ....................................................................... 1
FY11 Ottawa NF Monitoring and Evaluation Report Page iii
LIST OF TABLES
Table 1. Monitoring Items addressed in FY 2011 Monitoring and Evaluation Report ............. 3
Table 2: Wood Volume Sold by Product Type 2006-2011 .................................................................... 6
Table 3: Wood Volume Harvested by Product Type 2006-2011 ....................................................... 7
Table 4: Actual Harvest Acres 2006-2011 Compared to the Forest Plan’s Annual Estimate. . 8
Table 5: Unit Costs for Timber Management Projected in the Forest Plan ................................... 9
Table 6: Timber Costs, Volume Sold, and Average Dollars Spent per CCF Sold for 2006-2012. .............................................................................................................................................................. 10
Table 7: Reforestation and TSI Costs Projected in the Forest Plan ................................................ 11
Table 8: Planting Costs for 2006-2012 Compared to Forest Plan Estimated Costs ................ 11
Table 9: Site Preparation Costs for 2006-2012 Compared to Forest Plan Estimated Costs 12
Table 10: Natural Regeneration Survey Costs for 2006-2012 Compared to Forest Plan Estimated Costs ......................................................................................................................................... 12
Table 11: TSI Costs for 2006-2012 Compared to Forest Plan Estimated Costs ....................... 12
Table 12: 10-Year Wilderness Stewardship Challenge scores for Ottawa National Forest Wilderness areas from 2007 through 2011. .................................................................................. 17
Table 13: Aspen Volume Sold and Harvested 2006-2011 ................................................................ 19
Table 14: Aspen Acres Harvested Compared to Total Acres Harvested 2006-2011 ............... 20
Table 15: Key Habitat Components ............................................................................................................ 24
Table 16: Floristic Quality Indices Calculated for Hardwood Forest Types on the Ottawa National Forest (unmanaged stands) ............................................................................................... 26
Table 17: Floristic Quality Indices Calculated for Hardwood Forest Types on the Ottawa National Forest (Managed Stands pre-timber sale) .................................................................... 26
Table 18: Floristic Quality Indices Calculated for Jack Pine Forest Types on the Ottawa National Forest (Managed Stands pre-timber sale) .................................................................... 27
Table 19: Floristic Quality Indices Calculated for Aspen Forest Types on the Ottawa National Forest (Managed Stands pre-timber sale) .................................................................... 27
FY11 Ottawa NF Monitoring and Evaluation Report Page iv
Table 20: Floristic Quality Indices Calculated for Wetland Forest Types on the Ottawa National Forest (unmanaged) ............................................................................................................. 28
Table 21: Predicted suitable habitat for Black-backed woodpecker and Spruce grouse in the ONF, MI. ........................................................................................................................................................ 42
Table 22: Road Density in Remote Habitat Area by Year. ...... Error! Bookmark not defined.
Table 23: Canada Lynx Habitat Guidelines, Objectives, and Actual Outputs. ............................. 50
Table 24: Changes to RFSS List since Forest Plan Revision (2006) ...... Error! Bookmark not defined.
LIST OF FIGURES
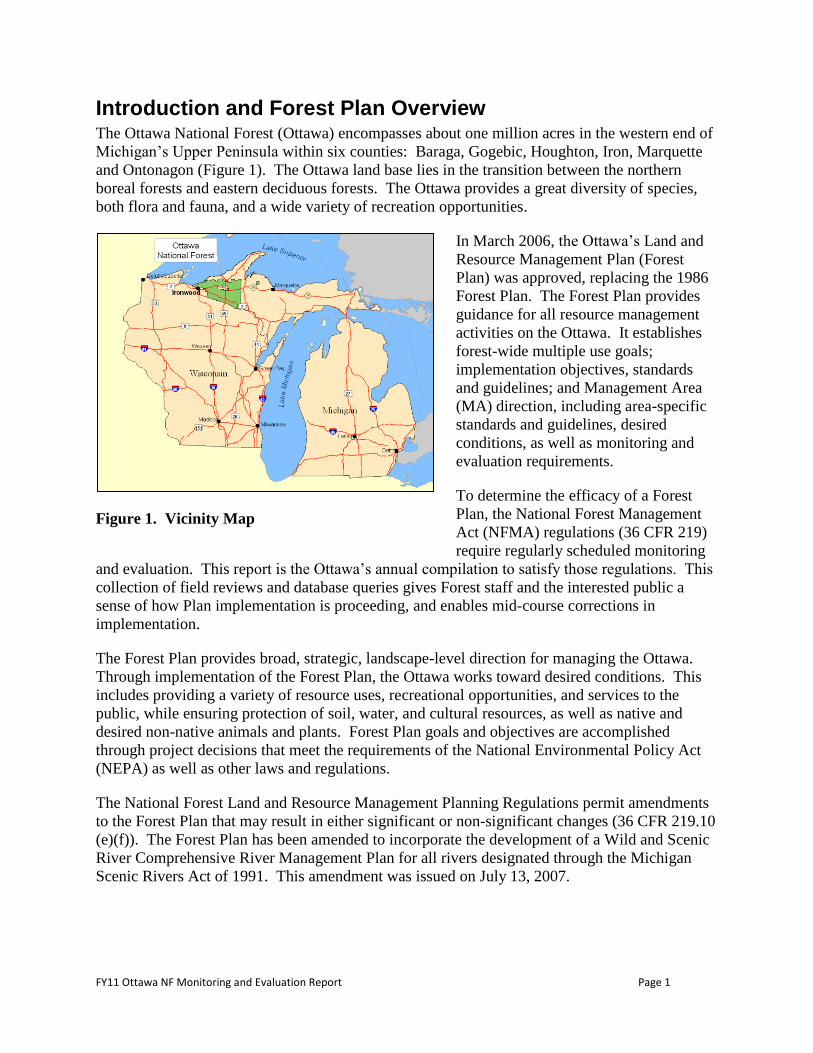
Figure 1. Vicinity Map......................................................................................................................................... 1
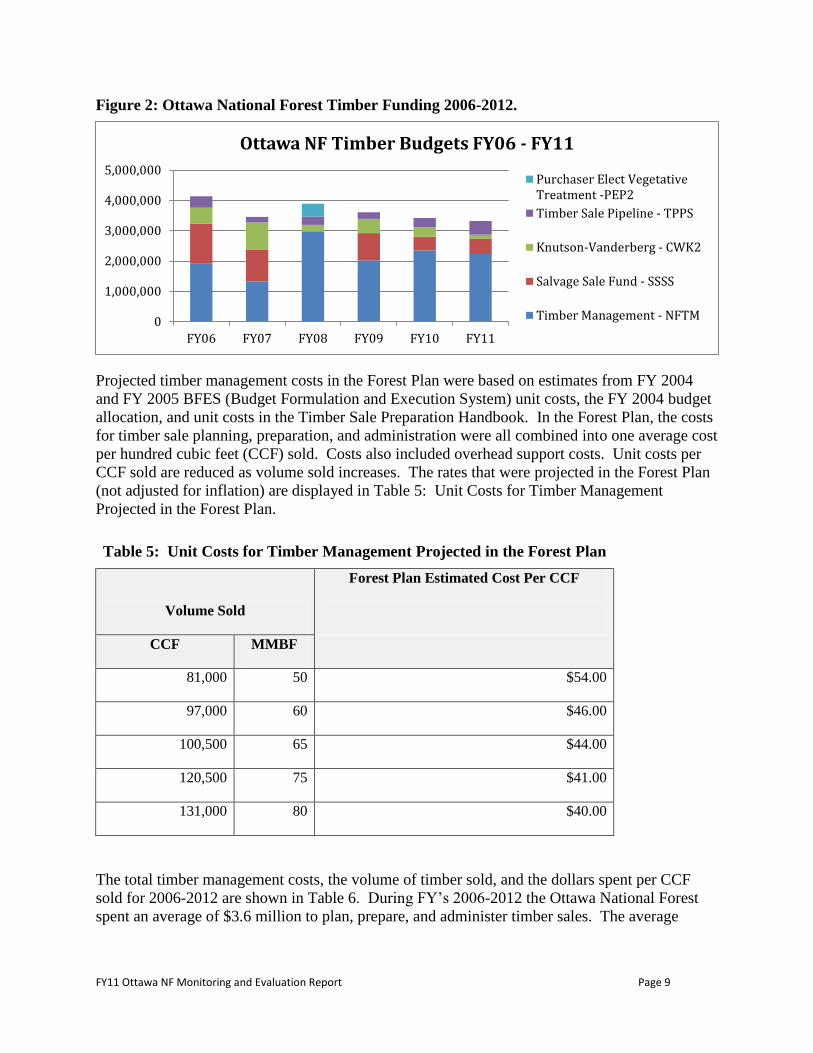
Figure 2: Ottawa National Forest Timber Funding 2006-2012. ......................................................... 9
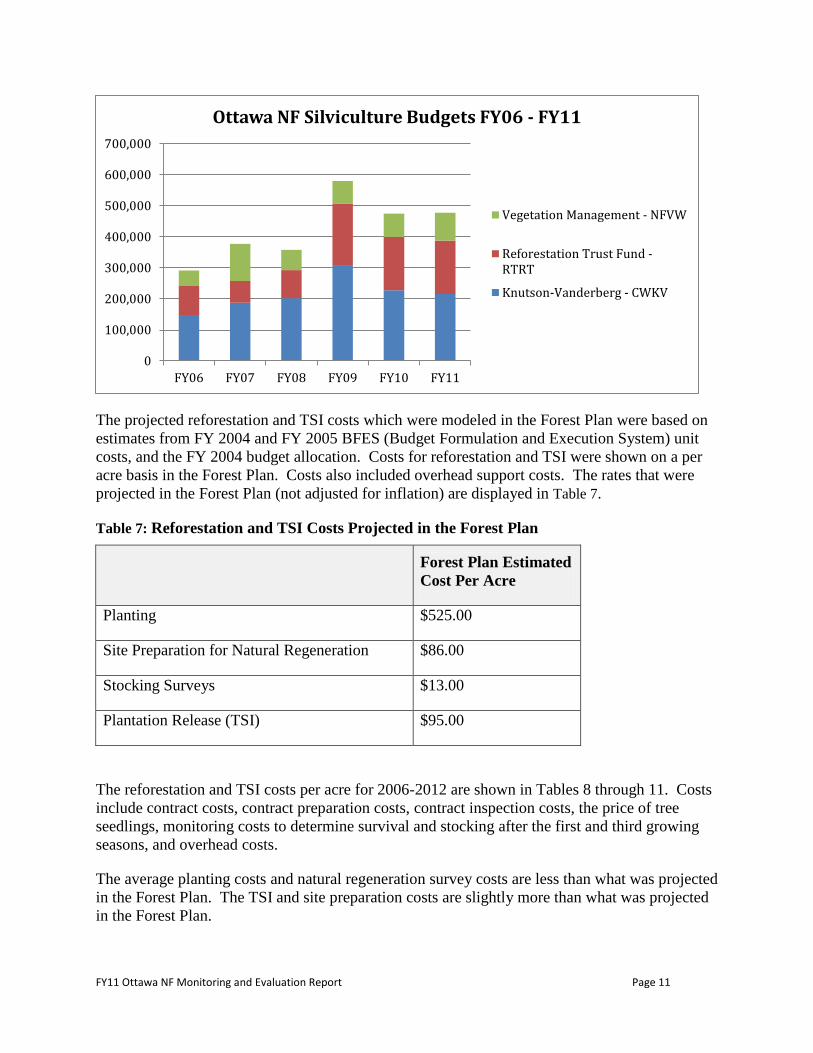
Figure 3: Ottawa National Forest Silviculture Funding for Reforestation and TSI Work 2006-2012. .................................................................................................................................................. 10
Figure 4: Aspen and Total Acres Harvested between 2006-20011 Compared to Forest Plan Estimates ..................................................................................................................................................... 21
Figure 5: Ottawa National Forest’s BBC plots (in light blue) and BBS routes (in red) that overlay the Ottawa National Forest (dark blue boundary). ..................................................... 30
Figure 6: Nashville warbler detections over the analysis period, BBC compared to BBS. Note the contradicting trends displayed by the 2 monitoring protocols. See Johnson (2012) for details. ..................................................................................................................................... 32
Figure 7: Evening grosbeak detections over the analysis period, BBC compared to BSS. .... 33
Figure 8: Annual Numbers of Bobcats Harvested Inside and Outside the Ottawa National Forest. ........................................................................................................................................................... 37
Figure 9: Bobcat harvest locations and potential habitat on the Ottawa National Forest. .. 39
Figure 10: Black-backed woodpecker ........................................................................................................ 40
Figure 11: Spruce grouse. ............................................................................................................................... 41
Figure 12: Ottawa NF long-term fledged-aged juvenile loon abundance (solid line, blue squares) and survey effort (dotted line) [from the annual monitoring report, Tischler 2012]. Years lacking sufficient data are excluded. ...................................................................... 46

FY11 Ottawa NF Monitoring and Evaluation Report Page v
Figure 13: Ottawa National Forest loon productivity measured by no. fledged-aged chicks per lake surveyed (dotted line) and chicks per core lake (solid line). New calculation shown in red for 2010 and 2011 as chicks per territory [from the annual monitoring report, Tischler 2012] Years lacking sufficient data are excluded. ....................................... 46
FY11 Ottawa NF Monitoring and Evaluation Report Page 1
Introduction and Forest Plan Overview The Ottawa National Forest (Ottawa) encompasses about one million acres in the western end of
Michigan’s Upper Peninsula within six counties: Baraga, Gogebic, Houghton, Iron, Marquette
and Ontonagon (Figure 1). The Ottawa land base lies in the transition between the northern
boreal forests and eastern deciduous forests. The Ottawa provides a great diversity of species,
both flora and fauna, and a wide variety of recreation opportunities.
In March 2006, the Ottawa’s Land and
Resource Management Plan (Forest
Plan) was approved, replacing the 1986
Forest Plan. The Forest Plan provides
guidance for all resource management
activities on the Ottawa. It establishes
forest-wide multiple use goals;
implementation objectives, standards
and guidelines; and Management Area
(MA) direction, including area-specific
standards and guidelines, desired
conditions, as well as monitoring and
evaluation requirements.
To determine the efficacy of a Forest
Plan, the National Forest Management
Act (NFMA) regulations (36 CFR 219)
require regularly scheduled monitoring
and evaluation. This report is the Ottawa’s annual compilation to satisfy those regulations. This
collection of field reviews and database queries gives Forest staff and the interested public a
sense of how Plan implementation is proceeding, and enables mid-course corrections in
implementation.
The Forest Plan provides broad, strategic, landscape-level direction for managing the Ottawa.
Through implementation of the Forest Plan, the Ottawa works toward desired conditions. This
includes providing a variety of resource uses, recreational opportunities, and services to the
public, while ensuring protection of soil, water, and cultural resources, as well as native and
desired non-native animals and plants. Forest Plan goals and objectives are accomplished
through project decisions that meet the requirements of the National Environmental Policy Act
(NEPA) as well as other laws and regulations.
The National Forest Land and Resource Management Planning Regulations permit amendments
to the Forest Plan that may result in either significant or non-significant changes (36 CFR 219.10
(e)(f)). The Forest Plan has been amended to incorporate the development of a Wild and Scenic
River Comprehensive River Management Plan for all rivers designated through the Michigan
Scenic Rivers Act of 1991. This amendment was issued on July 13, 2007.
Figure 1. Vicinity Map

FY11 Ottawa NF Monitoring and Evaluation Report Page 2
Purpose and Scope of the Report The purpose of this Monitoring and Evaluation (M&E) Report is to determine and disclose
whether resource management activities conducted on the Ottawa are meeting management
direction and multiple use objectives described in the Forest Plan. Monitoring tasks are scaled to
the Forest Plan, program or project. Monitoring is not performed on every single activity, nor is
it expected to meet the statistical rigor of formal research. If budget levels limit the Ottawa’s
ability to perform all monitoring tasks, then those specifically required by law are given highest
priority.
The Ottawa is in early stages of implementing the Forest Plan. Therefore, some types of
monitoring reported in this document are primarily implementation monitoring. It is important
to first ensure that the Ottawa is properly following the objectives, standards and guidelines
established in the Forest Plan. Other types of monitoring will play a larger role in following
years when the effectiveness of Forest Plan implementation will be more apparent. For example,
on-the-ground changes to forest type composition, age structure, and other attributes within
management areas are limited during the early stages of Forest Plan implementation. Changes in
these parameters will be reviewed for effectiveness in subsequent years.
Chapter 4 of the Forest Plan provides direction for monitoring and evaluation, which are separate
activities. Monitoring is the process of collecting data and information. Evaluation is the
analysis and interpretation of the information and data collected. Monitoring has occurred each
year since the completion of the 2006 Forest Plan and monitoring guide, however, evaluation of
trends has been limited so far, since the number of years of data were insufficient to make
comprehensive statements about most topics. The next annual report for FY12 (to be published
in early 2013) will be the 5-year evaluation report. This will include more analysis of trends and
recommendations for future actions, as well as any need to change or adjust the monitoring
program to meet current and future needs.
Monitoring Program There are three primary goals of monitoring: having the ability to respond to changing
conditions; making appropriate changes based on new information or technology; and testing
the effectiveness of the direction in the Forest Plan. Monitoring determines the effects of
different resource management activities and the degree to which desired conditions and
objectives are being achieved through on-the-ground management. Through this process, the
quality of project implementation is assessed; addressing physical, biological, social, and cultural
elements along with any emerging issues. Ultimately, this process allows for appropriate
adjustments to the Forest Plan, or the way the Forest Plan is implemented, so that unanticipated
changes in conditions can be addressed.
The Ottawa has developed a Monitoring Guide from the monitoring questions described in
Chapter 4 of the Forest Plan. This Guide outlines the monitoring questions or tasks; the type of
monitoring category; which staff members are responsible for each question; and the monitoring
methods, protocols and requirements that are used to measure the monitoring items. The
Monitoring Guide is available on the Ottawa’s internet site at
http://www.fs.usda.gov/Internet/FSE_DOCUMENTS/stelprdb5192637.pdf.

FY11 Ottawa NF Monitoring and Evaluation Report Page 3
Using the Monitoring Guide, the FY 2011 Monitoring Work Plan was developed through an
interdisciplinary review of the monitoring questions and guidance from Chapter 4 of the Forest
Plan. The review included a prioritization of monitoring items using criteria, such as
requirement by law or regulation, ecological importance, management importance or response to
a key issue. From this review, a subset of the entire Monitoring Guide was chosen for
monitoring work to be completed in 2011; therefore the identification numbers for monitoring
items shown in Table 1 are not continuous, but they are sequential.
Monitoring Activities for FY 2011 Table 1 displays the monitoring activities that were completed for FY 2011. Appendix 1 –
Schedule for Forest Plan Monitoring and Evaluationof this document contains a schedule, by
year, of all the monitoring items that are scheduled for reporting. Appendix 1 is intended to be a
useful guide to determine when a monitoring item was last discussed in an M&E Report, and
similarly, when a monitoring item is scheduled for future reporting.
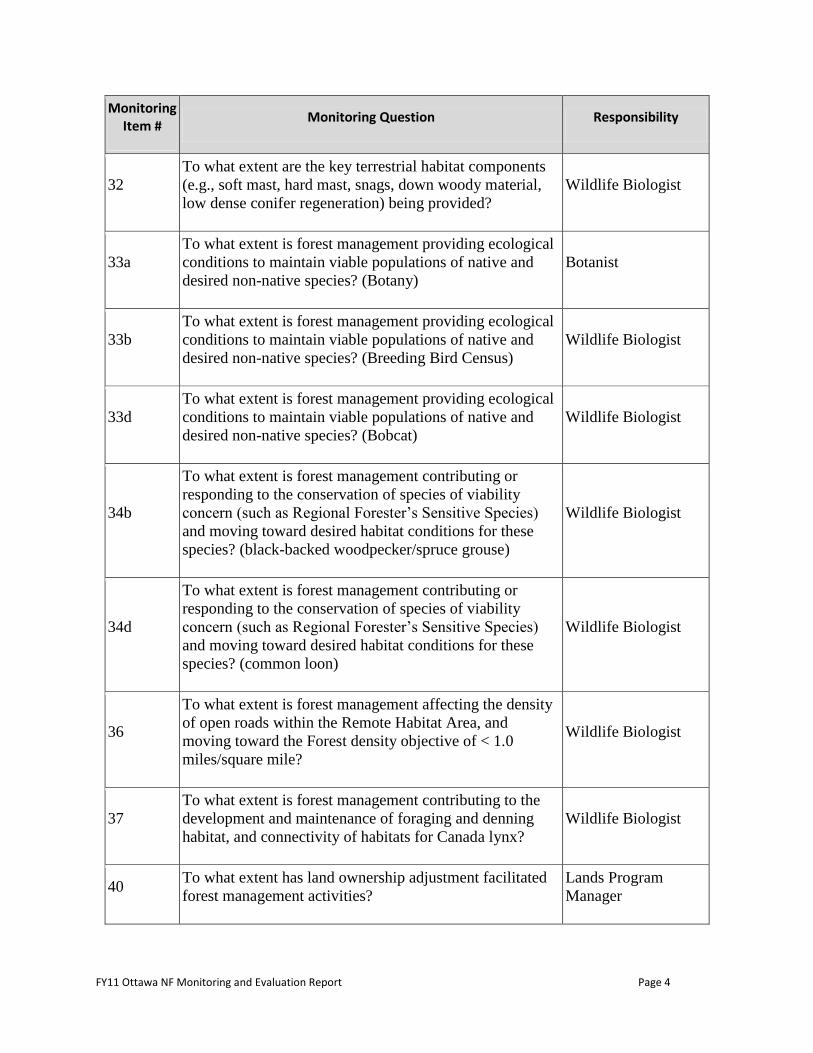
Table 1. Monitoring Items addressed in FY 2011 Monitoring and Evaluation Report
Monitoring Item #
Monitoring Question Responsibility
01 How do actual outputs and services compare to those
outputs and services projected in the Forest Plan?
Timber/Silviculture
Program Manager
02 How close are actual costs compared to projected costs? Timber/Silviculture
Program Manager
04
Are insect and disease population levels compatible with
objectives for restoring or maintaining healthy forest
conditions?
Timber/Silviculture
Program Manager
06 Are harvested lands adequately restocked after 5 years? Timber/Silviculture
Program Manager
18
To what extent is wilderness management contributing to
improvement or preservation of wilderness character and
values?
Recreation Program
Manager
23
To what extent are aspen forest type acres being
maintained through regeneration activities to meet
Forestwide and management area objectives?
Timber/Silviculture
Program Manager
29 To what extent is forest management affecting soil
quality? Soils Scientist
FY11 Ottawa NF Monitoring and Evaluation Report Page 4
Monitoring Item #
Monitoring Question Responsibility
32
To what extent are the key terrestrial habitat components
(e.g., soft mast, hard mast, snags, down woody material,
low dense conifer regeneration) being provided?
Wildlife Biologist
33a
To what extent is forest management providing ecological
conditions to maintain viable populations of native and
desired non-native species? (Botany)
Botanist
33b
To what extent is forest management providing ecological
conditions to maintain viable populations of native and
desired non-native species? (Breeding Bird Census)
Wildlife Biologist
33d
To what extent is forest management providing ecological
conditions to maintain viable populations of native and
desired non-native species? (Bobcat)
Wildlife Biologist
34b
To what extent is forest management contributing or
responding to the conservation of species of viability
concern (such as Regional Forester’s Sensitive Species)
and moving toward desired habitat conditions for these
species? (black-backed woodpecker/spruce grouse)
Wildlife Biologist
34d
To what extent is forest management contributing or
responding to the conservation of species of viability
concern (such as Regional Forester’s Sensitive Species)
and moving toward desired habitat conditions for these
species? (common loon)
Wildlife Biologist
36
To what extent is forest management affecting the density
of open roads within the Remote Habitat Area, and
moving toward the Forest density objective of < 1.0
miles/square mile?
Wildlife Biologist
37
To what extent is forest management contributing to the
development and maintenance of foraging and denning
habitat, and connectivity of habitats for Canada lynx?
Wildlife Biologist
40 To what extent has land ownership adjustment facilitated
forest management activities?
Lands Program
Manager

FY11 Ottawa NF Monitoring and Evaluation Report Page 5
Monitoring Item #
Monitoring Question Responsibility
44a
To what extent are unneeded roads being
decommissioned?
Recreation Program
Manager and Forest
Engineer
FY11 Ottawa NF Monitoring and Evaluation Report Page 6
1: How do actual outputs and services compare to those outputs and services projected in the Forest Plan?
The 2006 Forest Plan determined that 488,100 acres of land are suitable for timber production,
which is about half of the nearly 1 million acres that comprise the Ottawa. The Forest Plan also
set the allowable sale quantity (ASQ) of wood products at 14.6 million cubic feet (MMCF) per
year or 90.1 million board feet (MMBF) per year for the first decade (2006 Forest Plan,
Appendix E, p. E-1). The ASQ is the quantity of timber that may be sold from the area of
suitable land covered by the Forest Plan for a specified time period, usually expressed as the
average annual allowable sale quantity. The amount of timber that may be sold in a single year
may exceed the average annual ASQ as long as the decadal total ASQ is not exceeded each
decade.
The volume sold and harvested was obtained from the Timber Cut and Sold Report, which is
developed from information tracked in the Automated Timber Sale Accounting (ATSA) and
Timber Information Management (TIM) data bases.
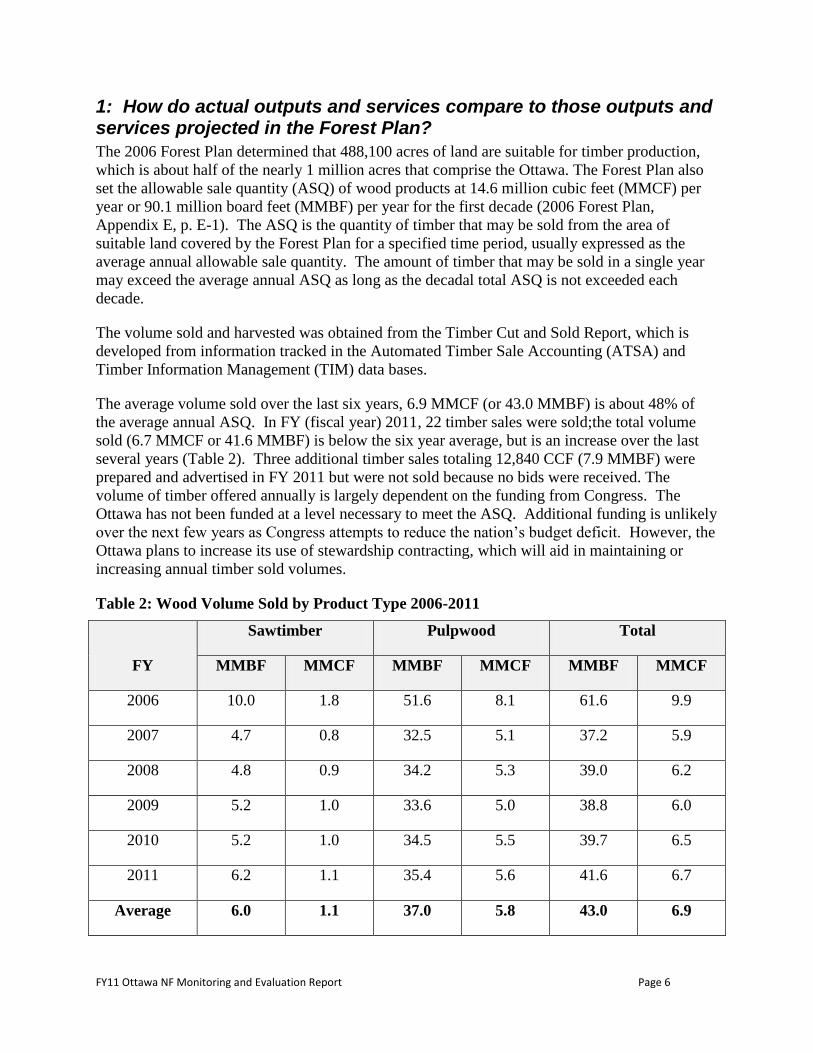
The average volume sold over the last six years, 6.9 MMCF (or 43.0 MMBF) is about 48% of
the average annual ASQ. In FY (fiscal year) 2011, 22 timber sales were sold;the total volume
sold (6.7 MMCF or 41.6 MMBF) is below the six year average, but is an increase over the last
several years (Table 2). Three additional timber sales totaling 12,840 CCF (7.9 MMBF) were
prepared and advertised in FY 2011 but were not sold because no bids were received. The
volume of timber offered annually is largely dependent on the funding from Congress. The
Ottawa has not been funded at a level necessary to meet the ASQ. Additional funding is unlikely
over the next few years as Congress attempts to reduce the nation’s budget deficit. However, the
Ottawa plans to increase its use of stewardship contracting, which will aid in maintaining or
increasing annual timber sold volumes.
Table 2: Wood Volume Sold by Product Type 2006-2011
FY
Sawtimber Pulpwood Total
MMBF MMCF MMBF MMCF MMBF MMCF
2006 10.0 1.8 51.6 8.1 61.6 9.9
2007 4.7 0.8 32.5 5.1 37.2 5.9
2008 4.8 0.9 34.2 5.3 39.0 6.2
2009 5.2 1.0 33.6 5.0 38.8 6.0
2010 5.2 1.0 34.5 5.5 39.7 6.5
2011 6.2 1.1 35.4 5.6 41.6 6.7
Average 6.0 1.1 37.0 5.8 43.0 6.9
FY11 Ottawa NF Monitoring and Evaluation Report Page 7
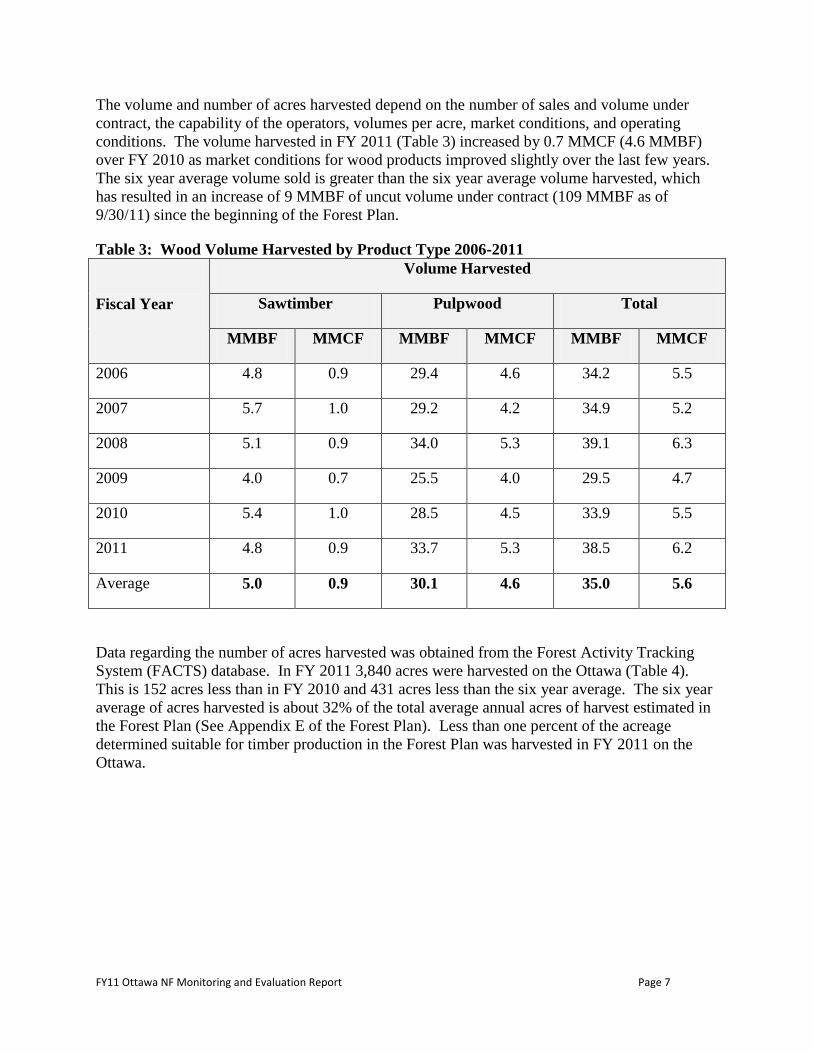
The volume and number of acres harvested depend on the number of sales and volume under
contract, the capability of the operators, volumes per acre, market conditions, and operating
conditions. The volume harvested in FY 2011 (Table 3) increased by 0.7 MMCF (4.6 MMBF)
over FY 2010 as market conditions for wood products improved slightly over the last few years.
The six year average volume sold is greater than the six year average volume harvested, which
has resulted in an increase of 9 MMBF of uncut volume under contract (109 MMBF as of
9/30/11) since the beginning of the Forest Plan.
Table 3: Wood Volume Harvested by Product Type 2006-2011
Fiscal Year
Volume Harvested
Sawtimber Pulpwood Total
MMBF MMCF MMBF MMCF MMBF MMCF
2006 4.8 0.9 29.4 4.6 34.2 5.5
2007 5.7 1.0 29.2 4.2 34.9 5.2
2008 5.1 0.9 34.0 5.3 39.1 6.3
2009 4.0 0.7 25.5 4.0 29.5 4.7
2010 5.4 1.0 28.5 4.5 33.9 5.5
2011 4.8 0.9 33.7 5.3 38.5 6.2
Average 5.0 0.9 30.1 4.6 35.0 5.6
Data regarding the number of acres harvested was obtained from the Forest Activity Tracking
System (FACTS) database. In FY 2011 3,840 acres were harvested on the Ottawa (Table 4).
This is 152 acres less than in FY 2010 and 431 acres less than the six year average. The six year
average of acres harvested is about 32% of the total average annual acres of harvest estimated in
the Forest Plan (See Appendix E of the Forest Plan). Less than one percent of the acreage
determined suitable for timber production in the Forest Plan was harvested in FY 2011 on the
Ottawa.
FY11 Ottawa NF Monitoring and Evaluation Report Page 8
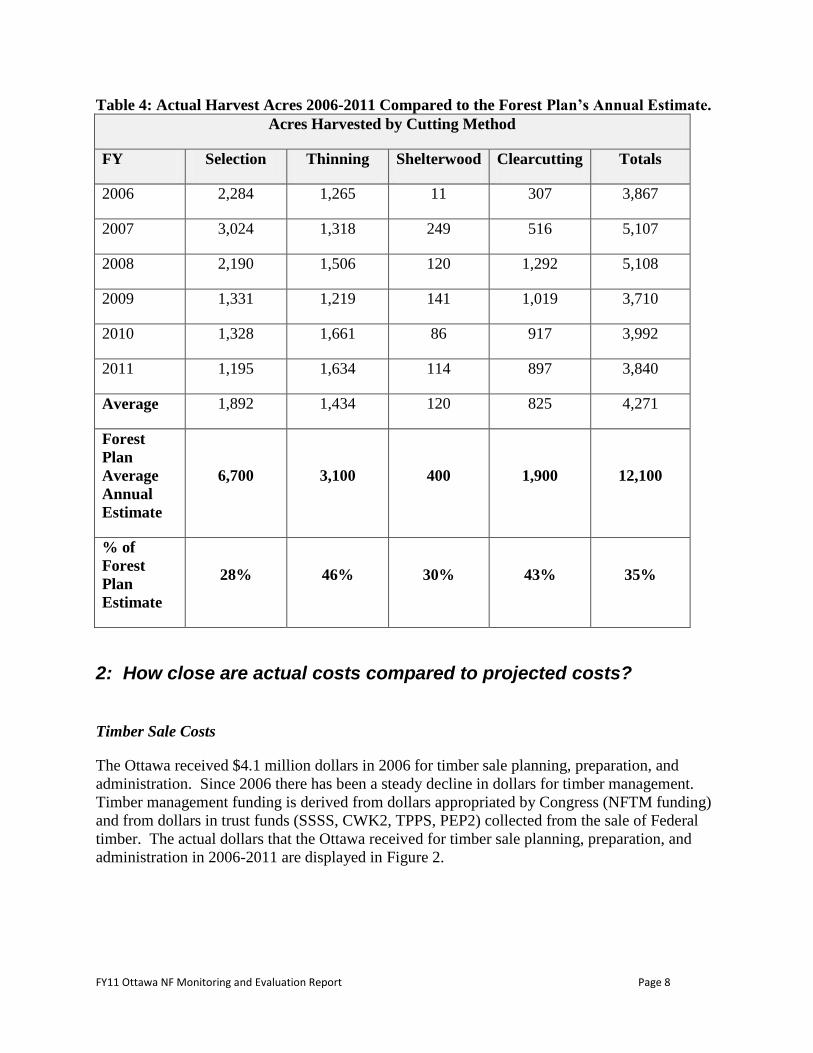
Table 4: Actual Harvest Acres 2006-2011 Compared to the Forest Plan’s Annual Estimate.
Acres Harvested by Cutting Method
FY Selection Thinning Shelterwood Clearcutting Totals
2006 2,284 1,265 11 307 3,867
2007 3,024 1,318 249 516 5,107
2008 2,190 1,506 120 1,292 5,108
2009 1,331 1,219 141 1,019 3,710
2010 1,328 1,661 86 917 3,992
2011 1,195 1,634 114 897 3,840
Average 1,892 1,434 120 825 4,271
Forest
Plan
Average
Annual
Estimate
6,700 3,100 400 1,900 12,100
% of
Forest
Plan
Estimate
28% 46% 30% 43% 35%
2: How close are actual costs compared to projected costs?
Timber Sale Costs
The Ottawa received $4.1 million dollars in 2006 for timber sale planning, preparation, and
administration. Since 2006 there has been a steady decline in dollars for timber management.
Timber management funding is derived from dollars appropriated by Congress (NFTM funding)
and from dollars in trust funds (SSSS, CWK2, TPPS, PEP2) collected from the sale of Federal
timber. The actual dollars that the Ottawa received for timber sale planning, preparation, and
administration in 2006-2011 are displayed in Figure 2.
FY11 Ottawa NF Monitoring and Evaluation Report Page 9
Figure 2: Ottawa National Forest Timber Funding 2006-2012.
Projected timber management costs in the Forest Plan were based on estimates from FY 2004
and FY 2005 BFES (Budget Formulation and Execution System) unit costs, the FY 2004 budget
allocation, and unit costs in the Timber Sale Preparation Handbook. In the Forest Plan, the costs
for timber sale planning, preparation, and administration were all combined into one average cost
per hundred cubic feet (CCF) sold. Costs also included overhead support costs. Unit costs per
CCF sold are reduced as volume sold increases. The rates that were projected in the Forest Plan
(not adjusted for inflation) are displayed in Table 5: Unit Costs for Timber Management
Projected in the Forest Plan.
Table 5: Unit Costs for Timber Management Projected in the Forest Plan
Volume Sold
Forest Plan Estimated Cost Per CCF
CCF MMBF
81,000 50 $54.00
97,000 60 $46.00
100,500 65 $44.00
120,500 75 $41.00
131,000 80 $40.00
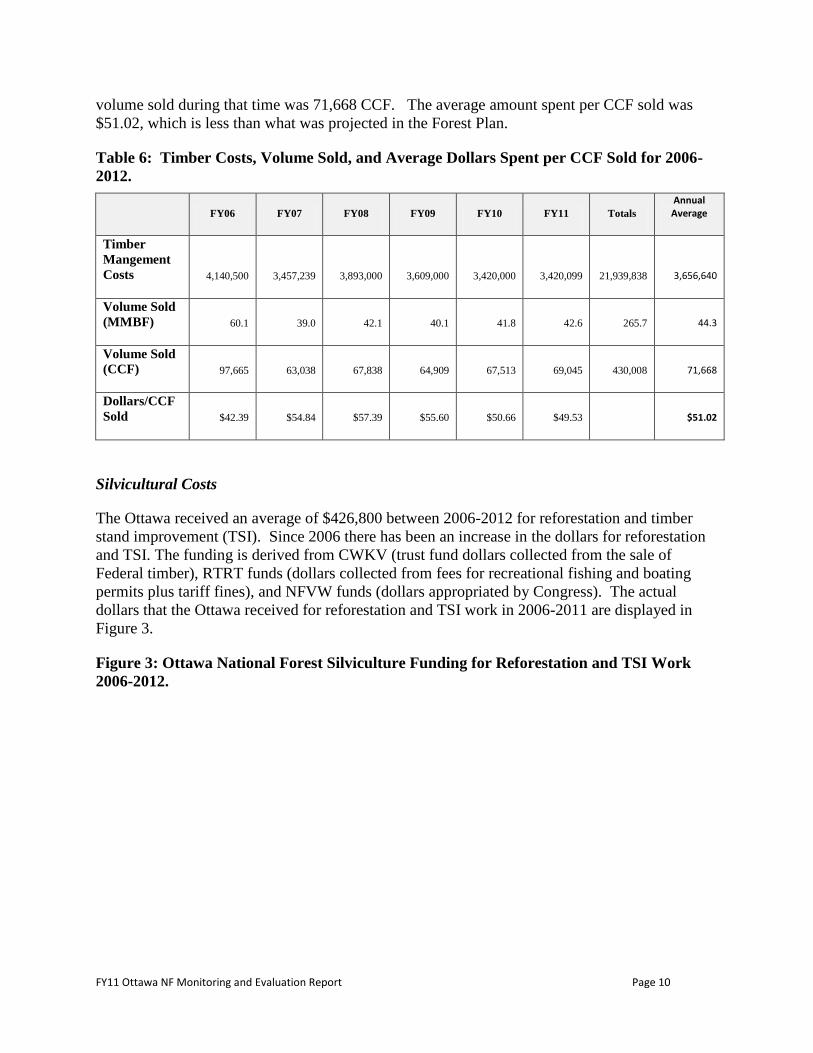
The total timber management costs, the volume of timber sold, and the dollars spent per CCF
sold for 2006-2012 are shown in Table 6. During FY’s 2006-2012 the Ottawa National Forest
spent an average of $3.6 million to plan, prepare, and administer timber sales. The average
0
1,000,000
2,000,000
3,000,000
4,000,000
5,000,000
FY06 FY07 FY08 FY09 FY10 FY11
Ottawa NF Timber Budgets FY06 - FY11
Purchaser Elect VegetativeTreatment -PEP2
Timber Sale Pipeline - TPPS
Knutson-Vanderberg - CWK2
Salvage Sale Fund - SSSS
Timber Management - NFTM
FY11 Ottawa NF Monitoring and Evaluation Report Page 10
volume sold during that time was 71,668 CCF. The average amount spent per CCF sold was
$51.02, which is less than what was projected in the Forest Plan.
Table 6: Timber Costs, Volume Sold, and Average Dollars Spent per CCF Sold for 2006-
2012.
FY06 FY07 FY08 FY09 FY10 FY11 Totals
Annual Average
Timber
Mangement
Costs 4,140,500 3,457,239 3,893,000 3,609,000 3,420,000 3,420,099 21,939,838 3,656,640
Volume Sold
(MMBF) 60.1 39.0 42.1 40.1 41.8 42.6 265.7 44.3
Volume Sold
(CCF) 97,665 63,038 67,838 64,909 67,513 69,045 430,008 71,668
Dollars/CCF
Sold $42.39 $54.84 $57.39 $55.60 $50.66 $49.53 $51.02
Silvicultural Costs
The Ottawa received an average of $426,800 between 2006-2012 for reforestation and timber
stand improvement (TSI). Since 2006 there has been an increase in the dollars for reforestation
and TSI. The funding is derived from CWKV (trust fund dollars collected from the sale of
Federal timber), RTRT funds (dollars collected from fees for recreational fishing and boating
permits plus tariff fines), and NFVW funds (dollars appropriated by Congress). The actual
dollars that the Ottawa received for reforestation and TSI work in 2006-2011 are displayed in
Figure 3.
Figure 3: Ottawa National Forest Silviculture Funding for Reforestation and TSI Work
2006-2012.
FY11 Ottawa NF Monitoring and Evaluation Report Page 11
The projected reforestation and TSI costs which were modeled in the Forest Plan were based on
estimates from FY 2004 and FY 2005 BFES (Budget Formulation and Execution System) unit
costs, and the FY 2004 budget allocation. Costs for reforestation and TSI were shown on a per
acre basis in the Forest Plan. Costs also included overhead support costs. The rates that were
projected in the Forest Plan (not adjusted for inflation) are displayed in Table 7.
Table 7: Reforestation and TSI Costs Projected in the Forest Plan
Forest Plan Estimated
Cost Per Acre
Planting $525.00
Site Preparation for Natural Regeneration $86.00
Stocking Surveys $13.00
Plantation Release (TSI) $95.00
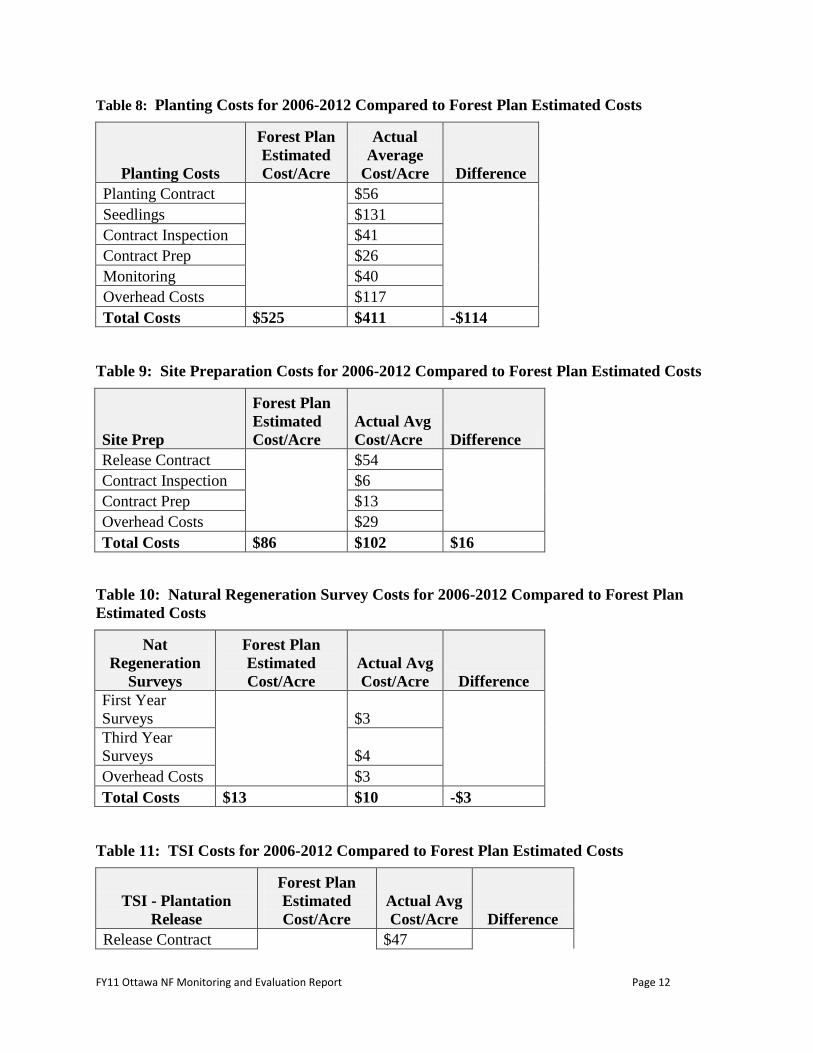
The reforestation and TSI costs per acre for 2006-2012 are shown in Tables 8 through 11. Costs
include contract costs, contract preparation costs, contract inspection costs, the price of tree
seedlings, monitoring costs to determine survival and stocking after the first and third growing
seasons, and overhead costs.
The average planting costs and natural regeneration survey costs are less than what was projected
in the Forest Plan. The TSI and site preparation costs are slightly more than what was projected
in the Forest Plan.
0
100,000
200,000
300,000
400,000
500,000
600,000
700,000
FY06 FY07 FY08 FY09 FY10 FY11
Ottawa NF Silviculture Budgets FY06 - FY11
Vegetation Management - NFVW
Reforestation Trust Fund -RTRT
Knutson-Vanderberg - CWKV
FY11 Ottawa NF Monitoring and Evaluation Report Page 12
Table 8: Planting Costs for 2006-2012 Compared to Forest Plan Estimated Costs
Planting Costs
Forest Plan
Estimated
Cost/Acre
Actual
Average
Cost/Acre Difference
Planting Contract
$56
Seedlings $131
Contract Inspection $41
Contract Prep $26
Monitoring $40
Overhead Costs $117
Total Costs $525 $411 -$114
Table 9: Site Preparation Costs for 2006-2012 Compared to Forest Plan Estimated Costs
Site Prep
Forest Plan
Estimated
Cost/Acre
Actual Avg
Cost/Acre Difference
Release Contract
$54
Contract Inspection $6
Contract Prep $13
Overhead Costs $29
Total Costs $86 $102 $16
Table 10: Natural Regeneration Survey Costs for 2006-2012 Compared to Forest Plan
Estimated Costs
Nat
Regeneration
Surveys
Forest Plan
Estimated
Cost/Acre
Actual Avg
Cost/Acre Difference
First Year
Surveys
$3
Third Year
Surveys $4
Overhead Costs $3
Total Costs $13 $10 -$3
Table 11: TSI Costs for 2006-2012 Compared to Forest Plan Estimated Costs
TSI - Plantation
Release
Forest Plan
Estimated
Cost/Acre
Actual Avg
Cost/Acre Difference
Release Contract $47

FY11 Ottawa NF Monitoring and Evaluation Report Page 13
Contract Inspection
$11
Contract Prep $13
Overhead Costs $28
Total Costs $95 $99 $4
FY11 Ottawa NF Monitoring and Evaluation Report Page 14
4: Are insect and disease population levels compatible with objectives for restoring or maintaining healthy forest conditions?
The Ottawa annually monitors the location and severity of insect and disease population levels
on the Forest to ensure that insect and disease populations are compatible with objectives for
restoring or maintaining healthy forest conditions. One of the biggest threats to forest health
currently is exotic pests. Additionally, several years of drought have stressed trees, thereby
making them more susceptible to other, secondary stressors like insects and disease outbreaks.
Current Infestations
The Northern Research Station conducts annual aerial pest detection flights over the Eastern
Region of the U.S. Forest Service to determine the extent of the insect and disease population
levels. A trained observer views the forest from the air and documents any patterns of mortality
or defoliation and delineates these areas onto a map. Attributes, such as host, damage agent,
symptom, and an estimate of intensity or number of trees affected may also be recorded. The
areas are then ground-truthed to ensure that the information is reliable. The Ottawa then monitors
these areas and takes appropriate control actions if necessary.
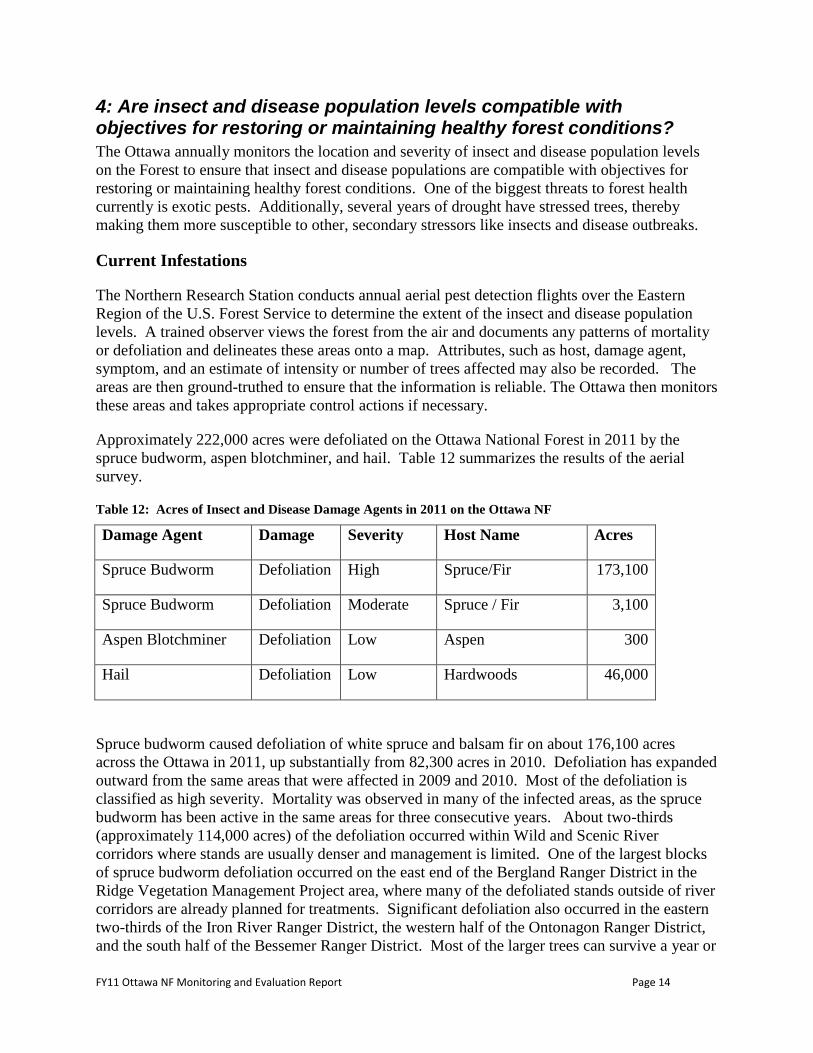
Approximately 222,000 acres were defoliated on the Ottawa National Forest in 2011 by the
spruce budworm, aspen blotchminer, and hail. Table 12 summarizes the results of the aerial
survey.
Table 12: Acres of Insect and Disease Damage Agents in 2011 on the Ottawa NF
Damage Agent Damage Severity Host Name Acres
Spruce Budworm Defoliation High Spruce/Fir 173,100
Spruce Budworm Defoliation Moderate Spruce / Fir 3,100
Aspen Blotchminer Defoliation Low Aspen 300
Hail Defoliation Low Hardwoods 46,000
Spruce budworm caused defoliation of white spruce and balsam fir on about 176,100 acres
across the Ottawa in 2011, up substantially from 82,300 acres in 2010. Defoliation has expanded
outward from the same areas that were affected in 2009 and 2010. Most of the defoliation is
classified as high severity. Mortality was observed in many of the infected areas, as the spruce
budworm has been active in the same areas for three consecutive years. About two-thirds
(approximately 114,000 acres) of the defoliation occurred within Wild and Scenic River
corridors where stands are usually denser and management is limited. One of the largest blocks
of spruce budworm defoliation occurred on the east end of the Bergland Ranger District in the
Ridge Vegetation Management Project area, where many of the defoliated stands outside of river
corridors are already planned for treatments. Significant defoliation also occurred in the eastern
two-thirds of the Iron River Ranger District, the western half of the Ontonagon Ranger District,
and the south half of the Bessemer Ranger District. Most of the larger trees can survive a year or
FY11 Ottawa NF Monitoring and Evaluation Report Page 15
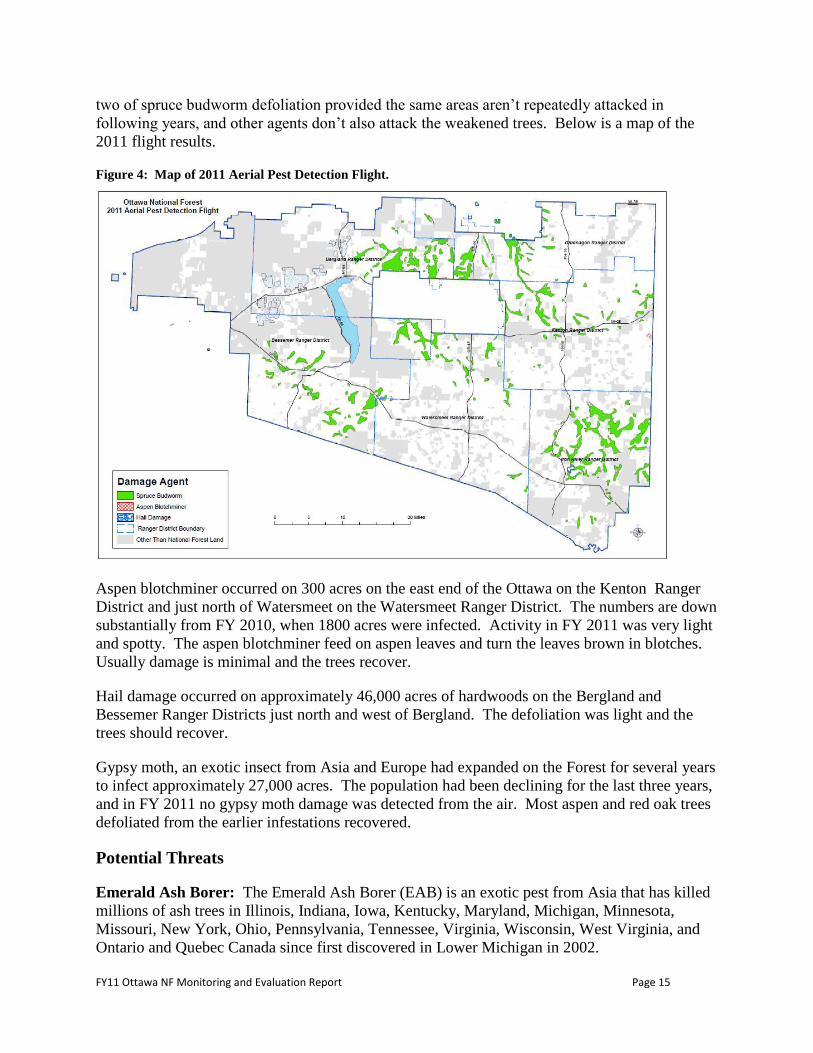
two of spruce budworm defoliation provided the same areas aren’t repeatedly attacked in
following years, and other agents don’t also attack the weakened trees. Below is a map of the
2011 flight results.
Figure 4: Map of 2011 Aerial Pest Detection Flight.
Aspen blotchminer occurred on 300 acres on the east end of the Ottawa on the Kenton Ranger
District and just north of Watersmeet on the Watersmeet Ranger District. The numbers are down
substantially from FY 2010, when 1800 acres were infected. Activity in FY 2011 was very light
and spotty. The aspen blotchminer feed on aspen leaves and turn the leaves brown in blotches.
Usually damage is minimal and the trees recover.
Hail damage occurred on approximately 46,000 acres of hardwoods on the Bergland and
Bessemer Ranger Districts just north and west of Bergland. The defoliation was light and the
trees should recover.
Gypsy moth, an exotic insect from Asia and Europe had expanded on the Forest for several years
to infect approximately 27,000 acres. The population had been declining for the last three years,
and in FY 2011 no gypsy moth damage was detected from the air. Most aspen and red oak trees
defoliated from the earlier infestations recovered.
Potential Threats
Emerald Ash Borer: The Emerald Ash Borer (EAB) is an exotic pest from Asia that has killed
millions of ash trees in Illinois, Indiana, Iowa, Kentucky, Maryland, Michigan, Minnesota,
Missouri, New York, Ohio, Pennsylvania, Tennessee, Virginia, Wisconsin, West Virginia, and
Ontario and Quebec Canada since first discovered in Lower Michigan in 2002.
FY11 Ottawa NF Monitoring and Evaluation Report Page 16
The EAB is commonly spread through the movement of infected firewood. The state of
Michigan has a quarantine which restricts the movement of firewood from EAB infected areas
within the state to uninfected areas. Because of the EAB infection near Laurium in Houghton
County, all of Houghton County (which includes a portion of the Ottawa) has been designated as
a quarantined area. The quarantine prohibits the movement of firewood within Houghton
County to anywhere outside the county. The movement of ash trees, ash logs, and hardwood
chips out of Houghton County also has restrictions. These materials can only be moved with a
compliance agreement from September 1 - April 30 (when the beetle isn’t active).
Since 2004 a closure order has been in effect on the Ottawa, which restricts the movement of
firewood from all EAB infected areas. In efforts to further reduce the chance of EAB spread, the
Ottawa Forest Supervisor placed an order on October 2007 to restrict the movement of firewood
onto the Ottawa from anywhere outside the Upper Peninsula of Michigan (U.P.).
The Forest Service has cooperative agreements with the Michigan Department of Agriculture
and Michigan Technological University to monitor for the EAB insect in Michigan. Traps are
located strategically across the state to attract and trap the insects to determine if they are
present, so that control measures can be started before populations increase to uncontrollable
levels. No EAB have been found on the Ottawa since the surveys began in 2004.
Crews established purple paper traps across the Ottawa in 2011. The traps were baited with
natural oils that contain compounds produced by ash trees when they are stressed. The traps
were placed in areas where the spread would most likely occur, such as adjacent to
campgrounds, picnic areas, and other recreation sites. Traps were also placed randomly across
the Ottawa, mainly along roads. No EAB were detected in any of the traps.
Although the EAB has not yet been found on the Ottawa, most experts believe the beetle will
eventually become established here, despite all of the monitoring and control efforts in place.
Sirex Woodwasp: This exotic insect from Europe, Asia, and North Africa was first detected in
New York in 2004. The woodwasp has also been found in northern Pennsylvania, southern
Ontario, and in the Lower Peninsula of Michigan. The woodwasp larvae kill jack pine, red pine,
and scotch pine trees.
Michigan Technological University, in a cooperative agreement with Animal and Plant Health
Inspection Service (APHIS), the Michigan Department of Agriculture, the Michigan Department
of Natural Resources, and the Forest Service placed funnel traps on the Ottawa since 2007 to
detect the presence of the sirex woodwasp. No woodwasps have been detected on the Ottawa or
anywhere in the Upper Peninsula of Michigan.
Hemlock Woolly Adelgid: The hemlock woolly adelgid (HWA) is responsible for extensive
mortality and decline of hemlock trees in the eastern U.S. HWA is an exotic pest from Asia that
occurs in 15 states in the east from Georgia to Maine. The potential ecological impacts of this
exotic pest are comparable to that of Dutch elm disease and chestnut blight. HWA was
confirmed on 5 sites in Lower Michigan in 2010. The pest is believed to have been transported
to Michigan from infected nursery stock. Eradication treatments and surveys are being done in
FY11 Ottawa NF Monitoring and Evaluation Report Page 17
an attempt to keep the insect from spreading to native hemlock stands. To date no HWA has
been found on the Ottawa or anywhere in the U.P.
Drought: All of the U.P., the northern part of the Lower Peninsula of Michigan, and northern
Wisconsin has all been in a drought condition for much of the last five years. Precipitation in
2010 was near normal. But the drought pattern continued again in 2011. The National Oceanic
and Atmospheric Administration (NOAA) classified the western half of the U.P. as “severely
dry” for January through December 2011. Drought not only kills trees outright, but also stresses
them making them more susceptible to insect and disease attacks.
Summary: Current insect and disease levels on the Ottawa are compatible with restoring and
maintaining healthy forest conditions. The Ottawa strives to maintain healthy forest conditions
through the use of silvicultural practices and integrated pest management techniques as described
in the Forest Plan (p. 2-35).
6: Are harvested lands adequately restocked after 5 years?
To ensure compliance with the National Forest Management Act and the Ottawa Forest Plan, the
Ottawa regularly monitors final timber harvests (shelterwood cuts, selection cuts, and clearcuts)
on National Forest lands to determine if those stands have been adequately restocked with
regenerating trees. Stands are considered adequately stocked when they meet the requirements
for the minimum average number of trees per acre by forest type in the Forest Service
Silvicultural Practices Handbbook.
The Ottawa performs stocking surveys to monitor the success of natural and artificial
regeneration on all final timber harvests. Stands that are adequately stocked with suitable tree
species are usually certified by the fifth year after final harvest. Oftentimes additional treatments
are needed to improve stocking levels. These treatments are planned following the timber
harvest, or after the first or third year stocking surveys if the surveys indicate a need. The
treatments would include such activities as site preparation to prepare an adequate seed bed,
seeding, or planting. Final harvests, site prepartion, stocking surveys, and regeneration
certification information are all stored in the Forest Service Activity Tracking System (FACTS)
data base.
In FY 2006 a total of 2,764 acres received final timber harvests. To determine whether the FY
2006 final timber harvests were adequately stocked after five years (FY 2011), stocking surveys
were performed on all stands that were not already certified to determine if they could be
certified as adequately stocked. All 2,764 acres (100%) of final timber harvest acres were
certified as adequately stocked.
18: To what extent is wilderness management contributing to improvement or preservation of wilderness character and values?
In 2005 the Forest Service launched the “10-Year Wilderness Stewardship Challenge”. The goal
of the “Challenge” is to have wilderness areas managed to at least a minimum stewardship level
(6 of 10 items) by 2014. There are ten comprehensive elements of wilderness management that
are used to measure stewardship levels. The elements are as follows:
FY11 Ottawa NF Monitoring and Evaluation Report Page 18
1. Direction exists in either the Forest Plan or subsequent planning documents that updated
or amended the Forest Plan that addresses the natural role of fire in wilderness and
considers the full range of management responses.
2. The wilderness was successfully treated for non-native, invasive plants.
3. Monitoring of wilderness air quality values is conducted and a baseline is established for
the wilderness.
4. Priority actions identified in a wilderness education plan are implemented.
5. The wilderness has adequate direction, monitoring, and management programs to protect
opportunities for solitude or primitive and unconfined recreation.
6. The wilderness has a completed recreation site inventory.
7. Existing outfitter & guide operating plans for the wilderness direct outfitters to model
appropriate wilderness practices and incorporate appreciation for wilderness values in
their interaction with clients and others. Needs assessments are completed for new
operations or for major changes to existing outfitter programs.
8. The wilderness has adequate direction in the Forest Plan to prevent degradation of the
wilderness resource.
9. The priority information needs for the wilderness have been addressed through field data
collection, storage and analysis.
10. The wilderness has a baseline workforce in place.
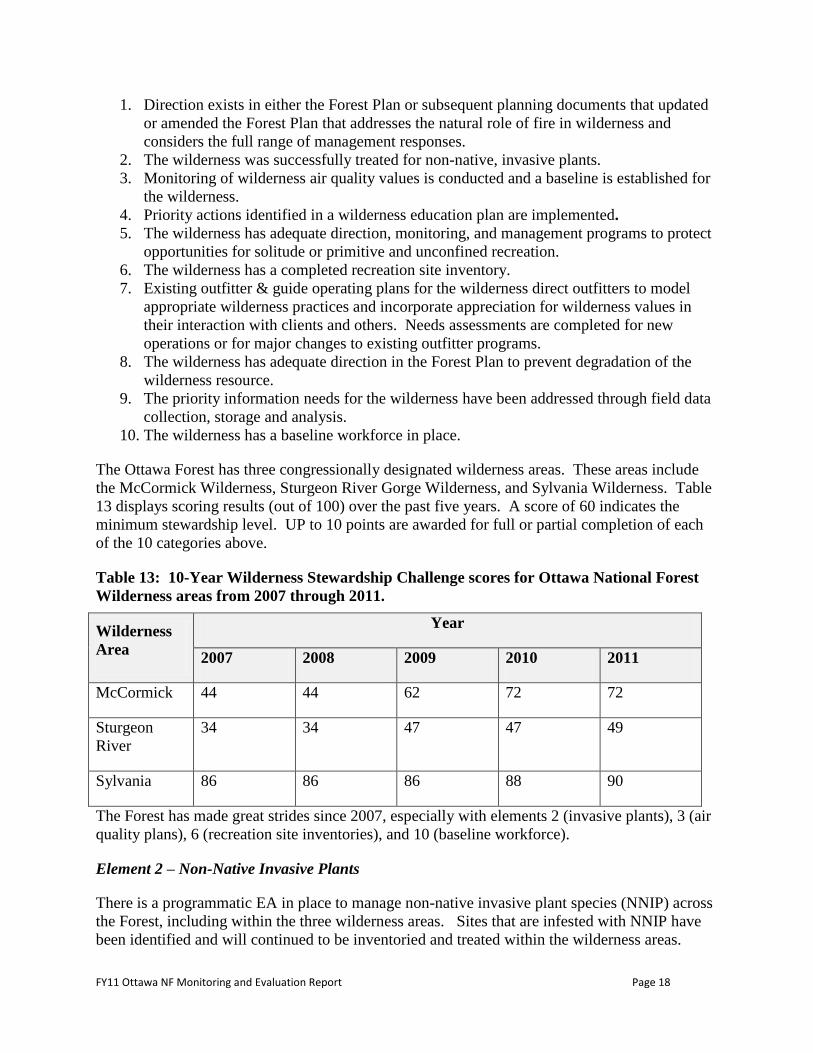
The Ottawa Forest has three congressionally designated wilderness areas. These areas include
the McCormick Wilderness, Sturgeon River Gorge Wilderness, and Sylvania Wilderness. Table
13 displays scoring results (out of 100) over the past five years. A score of 60 indicates the
minimum stewardship level. UP to 10 points are awarded for full or partial completion of each
of the 10 categories above.
Table 13: 10-Year Wilderness Stewardship Challenge scores for Ottawa National Forest
Wilderness areas from 2007 through 2011.
Wilderness
Area
Year
2007 2008 2009 2010 2011
McCormick 44 44 62 72 72
Sturgeon
River
34 34 47 47 49
Sylvania 86 86 86 88 90
The Forest has made great strides since 2007, especially with elements 2 (invasive plants), 3 (air
quality plans), 6 (recreation site inventories), and 10 (baseline workforce).
Element 2 – Non-Native Invasive Plants
There is a programmatic EA in place to manage non-native invasive plant species (NNIP) across
the Forest, including within the three wilderness areas. Sites that are infested with NNIP have
been identified and will continued to be inventoried and treated within the wilderness areas.
FY11 Ottawa NF Monitoring and Evaluation Report Page 19
Inventories and treatments will be conducted with volunteers and Forest crews. Boot brush
stations have been installed at many trailheads leading into the wilderness areas.
Element 3 – Air Quality Related Values
Acidity (pH) levels can be used to indicate air quality, and have been collected and determined
from water bodies within Sylvania. Data has been compiled over several decades and pH levels
will continue to be monitored. Air quality plans for Sylvania and McCormick where completed
in 2010. An air quality plan was completed for the Sturgeon River Gorge in 2011. Volunteer
groups such as the Friends of McCormick and the Superior Watershed Partnership continue to
monitor air quality.
Element 6 – Recreation Site Inventories
Sylvania volunteers have assisted the Forest with surveys and monitoring of sites within the
wilderness areas since at least 1994. In 2009 and 2010, the Friends of McCormick began
monitoring efforts in the McCormick Wilderness.
Element 10 – Baseline Workforce
Volunteers play an important role in managing the wilderness areas to standard. In 2009 and
2011, the Friends of McCormick received National Forest Foundation funding for inventorying
sites and developing an Air Quality Plan for the McCormick Wilderness.
In 2011 the Superior Watershed Partnership group developed and Air Quality Plan for the
Sturgeon River Gorge Wilderness with additional funds. The Superior Watershed Partnership
has submitted a 2012 grant proposal to the National Forest Foundation to implement the air
quality plan for the Sturgeon River Gorge.
Sylvania Wilderness has always had a strong core of volunteers to help clear trails, inventory and
monitor campsites, and NNIS infestations.
23: To what extent are aspen forest type acres being maintained through regeneration activities to meet Forestwide and management area objectives?
One of the goals in the Forest Plan is to provide for a mix of age classes within the aspen/paper
birch forest type to support conservation, economic, and social objectives associated with early
successional habitats.
According to the Ottawa’s FS Veg (Field Sampled Vegetation) database there are approximately
200,000 acres of aspen/paper birch on the Ottawa. About 42% of these acres are over 60 years
of age and are considered mature or over mature. Approximately 80,000 acres are classified as
unsuitable for timber production. These unsuited lands are largely located in riparian areas, steep
slopes, and within Wild and Scenic River corridors. Management will be limited in these areas
so, over time many of these acres are expected to convert to other forest types, except in those
FY11 Ottawa NF Monitoring and Evaluation Report Page 20
river segments where the outstandingly remarkable values may be enhanced by aspen
regeneration.
The Forest Plan FEIS projected that 109,000 acres of aspen/paper birch could be maintained over
the long-term, with an estimated average annual regeneration harvest of about 1,700 acres per
year.
Considerable attention has been given to the impacts and benefits of aspen management for
white-tailed deer and ruffed grouse. Aspen regeneration is an important early seral vegetative
condition in the forest landscape. It provides the bulk of the temporary openings and early
successional habitat on the Ottawa. Aspen is also an important commercial timber product.
Aspen regeneration provides niches for over 20 species of mammals, from the white-tailed deer
to the deer mouse. Aspen regeneration is used by over 30 species of birds from the ruffed grouse
to the chestnut-sided warbler. There are a few species of reptiles and amphibians that can be
found in regenerating aspen. Approximately 60 species represented by this ecosystem are an
important component of the total number of species on the forest. It is an important vegetative
component to be maintained on the Ottawa.
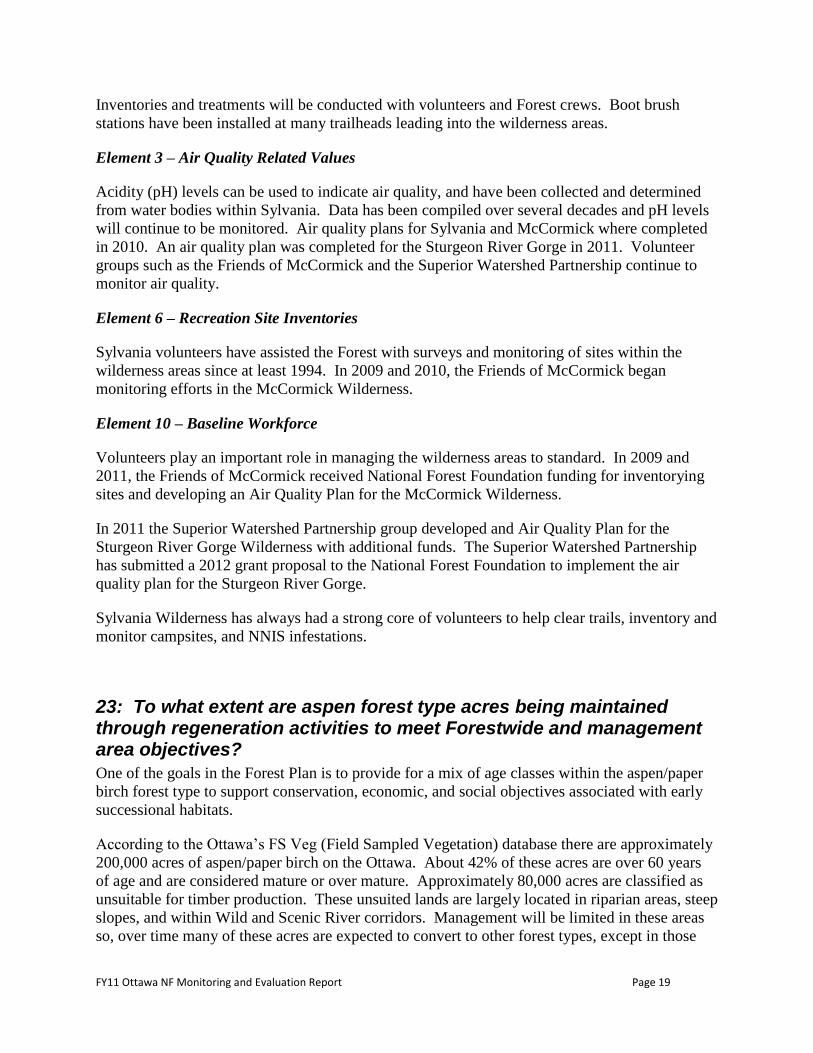
Table 14 compares the aspen volume sold and harvested from 2006-2011 with the average
annual projections per decade in the Forest Plan. The aspen volumes were obtained from the
Timber Sale Accounting System (TSA) Timber Cut and Sold Reports.
In FY 2011, 1.7 MMCF (10.7 MMBF) were sold, which is below the annual average aspen
volume sold between 2006-2011. In FY 2011, 1.8 MMCF (11.2 MMBF) were harvested, which
is above the annual average between 2006-2011. The six year average for aspen volume
harvested was 1.4 MMCF (8.8 MMBF), which was about 50% of the projected annual average
harvest in the Forest Plan.
Between FY 2006 and 2011, 2.7 MMCF (17.3 MMBF) more aspen volume was sold than was
harvested. This has resulted in an increase of aspen volume under contract over the last several
years. Poor winter logging conditions caused by some warmer than normal winters and a lack of
snowfall resulted in shorter logging seasons. Poorer markets for aspen over the last few years
have also been a factor. The closure of the mill in Ontonagon, which bought a large amount of
aspen wood, had an impact on the local demand for aspen wood. However, markets did improve
in FY 2011, as the amount of aspen volume harvested in FY 2011 increased substantially.
Table 14: Aspen Volume Sold and Harvested 2006-2011
FY
Aspen Volume Sold Aspen Volume Harvested
MMBF MMCF MMBF MMCF
2006 17.7 2.8 4.5 0.7
2007 9.5 1.5 7.4 1.2
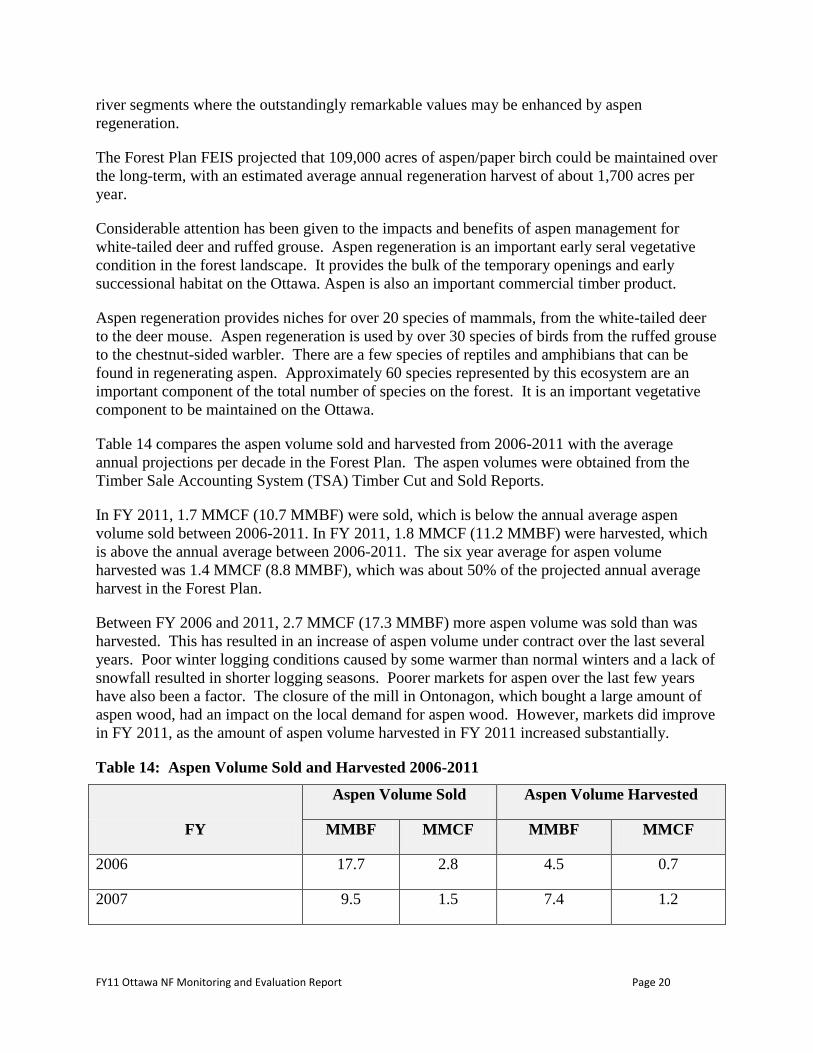
FY11 Ottawa NF Monitoring and Evaluation Report Page 21
2008 10.0 1.6 14.5 2.3
2009 8.0 1.3 7.3 1.2
20101 14.0 2.2 7.7 1.2
2011 10.7 1.7 11.2 1.8
Total 69.9 11.1 52.6 8.4
Average 11.7 1.9 8.8 1.4
Forest Plan Average Annual
Estimate
2.8
% of Forest Plan Estimate
50%
1Two sales that had defaulted (Thumper – sold in FY 2006 and Baltimore Album – sold in FY 2008) were resold in
FY 2010. So a total of 0.6 MMCF (3.8 MMBF) was sold twice.
Table 15 compares the acres of aspen that were harvested in 2006-2011 with the average annual
estimate in the Forest Plan. Aspen harvest acres were obtained from the FACTS (Forest Activity
Tracking System) data base.
Since 2006 a total of 4,143 acres of aspen regeneration harvests were completed. In FY 2011,
820 acres were harvested, which is an increase over the last two years. The six year average
annual harvest of 691 acres of aspen is about 41% of the Forest Plan estimate.
Table 15: Aspen Acres Harvested Compared to Total Acres Harvested 2006-2011
FY Aspen Acres Harvested
2006 246
2007 517
2008 1,265
2009 651
2010 644
2011 820
Total 4,143
Average 691
Forest Plan Average
Annual Estimate 1,700
% of Forest Plan
Estimate 41%
The Ottawa has not been funded at a level necessary to fully meet its vegetation management
objectives in the Forest Plan, including its aspen regeneration objectives. However the Ottawa
FY11 Ottawa NF Monitoring and Evaluation Report Page 22
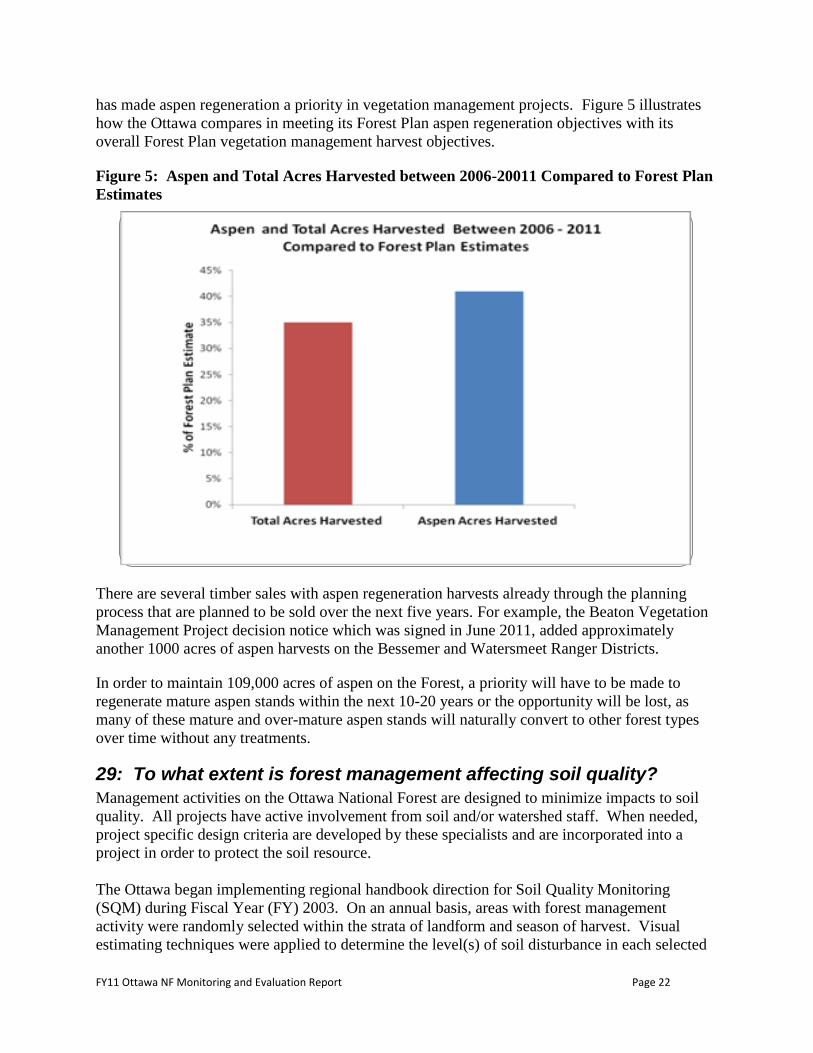
has made aspen regeneration a priority in vegetation management projects. Figure 5 illustrates
how the Ottawa compares in meeting its Forest Plan aspen regeneration objectives with its
overall Forest Plan vegetation management harvest objectives.
Figure 5: Aspen and Total Acres Harvested between 2006-20011 Compared to Forest Plan
Estimates
There are several timber sales with aspen regeneration harvests already through the planning
process that are planned to be sold over the next five years. For example, the Beaton Vegetation
Management Project decision notice which was signed in June 2011, added approximately
another 1000 acres of aspen harvests on the Bessemer and Watersmeet Ranger Districts.
In order to maintain 109,000 acres of aspen on the Forest, a priority will have to be made to
regenerate mature aspen stands within the next 10-20 years or the opportunity will be lost, as
many of these mature and over-mature aspen stands will naturally convert to other forest types
over time without any treatments.
29: To what extent is forest management affecting soil quality?
Management activities on the Ottawa National Forest are designed to minimize impacts to soil
quality. All projects have active involvement from soil and/or watershed staff. When needed,
project specific design criteria are developed by these specialists and are incorporated into a
project in order to protect the soil resource.
The Ottawa began implementing regional handbook direction for Soil Quality Monitoring
(SQM) during Fiscal Year (FY) 2003. On an annual basis, areas with forest management
activity were randomly selected within the strata of landform and season of harvest. Visual
estimating techniques were applied to determine the level(s) of soil disturbance in each selected
% o
f Fo
rest
Pla
n E
stim
ate
Aspen and Total Acres Harvested Between 2006 - 2011
Compared to Forest Plan Estimates
FY11 Ottawa NF Monitoring and Evaluation Report Page 23
payment unit. In order to ensure the validity of visual estimates, and to further analyze payment
units of higher concern, transect data may have also been collected and compared to visually
estimated values.
Between FY 2003 and FY 2009, approximately 1,185 payment units were operated Forest-wide.
Across all landforms and harvest types, approximately 180 of these units were monitored using a
visual estimation technique, representing a sample of roughly 15%. Of all the units that were
monitored, undisturbed ground ranged from approximately 60% to 100%, while potentially
detrimental disturbance generally ranged from 0% to 6%. Results of the monitoring indicate
that, on average, within payment units nearly 90% of the ground surface was considered to be
undisturbed while potentially detrimental disturbance averaged less than 2%, with small
percentages of low to moderate soil disturbance. Region 9 soil quality standards set a 15%
detrimental disturbance limit (USDA Forest Service, 2005).
As a way to further improve and build upon the soil quality monitoring program on the Ottawa,
the forest transitioned to a new monitoring program in FY 2010. The Forest Soil Disturbance
Monitoring Protocol (FSDMP) is a new protocol that is similar to the SQM in that it utilizes
visual indicators to determine soil disturbance. However, it provides a more consistent and
repeatable method to assess and report soil disturbance that occurs as a result of management
activity.
Using the FSDMP, areas with active forest management were again randomly selected within the
strata of landform and season of harvest. Payment units selected for monitoring were subject to
a rapid assessment, requiring that a minimum of 30 sample plots per unit be assessed for soil
disturbance. Since the forest has begun using the FSDMP, 19 payment units have been
monitored post-harvest to determine impacts to the soil resource. Within those payment units,
the amount of undisturbed ground averaged approximately 83%, while disturbance categorized
into the highest disturbance classes (Classes 2 & 3) generally averaged 5%. Averaged across all
monitored payment units, less than 2% of the soil resource was classified as detrimentally
disturbed.
Beginning in FY 2003, monitoring results from across the forest have shown that a sizeable
percent of the ground surface was classified as undisturbed, with a minor (less than 2%)
component falling into the detrimental disturbance category. Such results confirm the
effectiveness of the incorporation of project design criteria in protecting soil quality and soil
productivity on the Ottawa. Moving forward, the Ottawa will continue to utilize the FSDMP to
monitor land management activities and improve upon them, where possible, to ensure that the
soils on the Ottawa remain productive.
References:
Page-Dumroese, D. S., Abbott, A. M., & Rice, T. M. (2009). Forest soil disturbance monitoring
protocol. Volume II: Supplementary methods, statistics, and data collection. General Technical
Report WO-82b . USDA Forest Service.
USDA Forest Service. (2005). Soil Quality Monitoring. Soil Management Handbook, R9
Supplement, FSH R9RO 2509.18-2005-1 . Milwaukee, WI: USDA Forest Service.
FY11 Ottawa NF Monitoring and Evaluation Report Page 24
32: To what extent are the key terrestrial habitat components (e.g., soft mast, hard mast, snags, down woody material, low dense conifer regeneration) being provided?
The Ottawa Forest Plan includes several guidelines for providing key terrestrial habitat
components on the forested landscape. These components include soft mast, hard mast, snags,
downed woody material, and low-to-the-ground dense conifer. These key habitat components
provide forage, nesting, and security for numerous terrestrial wildlife species. The differing
dominant tree and shrub species in the Ottawa’s forested stands provide varying types and
amounts of these key habitat components. Also, forested stands of different ages and size
structure provide a diversity of habitat components.
The extent to which these key habitat components are provided by the Ottawa can be expressed
in the proportion of various types of forested stands provided and being maintained on the
national forest. These proportions can be tracked over time to show the trends in the amounts
and types of components provided. For this report, the first five years (2006 to 2011) under the
current Forest Plan will serve as the initial reporting period.
The Ottawa collects extensive data on the composition, size, and structure of its forested land
base. This data can be used to infer the types and relative amounts of the key habitat
components required by many wildlife species. For example, forested stands with predominately
large diameter trees can be expected to provide snags and downed woody material for nesting,
roosting, and foraging. Most hardwood and conifer stands can be expected to provide some form
of hard mast. Other forest types can be expected to provide low, dense conifer for hiding cover
(i.e. aspen/balsam fir mixed stands) whereas other forest types may provide soft mast (i.e. black
cherry).
For this analysis, stands comprised of forest types (dominant tree species) and structure (age and
average tree diameter) that would be expected to provide certain habitat components were
grouped together. For example, aspen, aspen/balsam fir mixed, young pine stands, and lowland
conifer forest types were considered as a group of stands that would be expected to provide the
low, dense conifer habitat component. Many forested stands may provide more than one key
habitat component.
Mast is the botanical name for the nuts, seeds, buds, or fruits of trees and shrubs that are eaten by
wildlife. There are two main types of mast:
Hard mast includes hard nuts and seeds such as acorns, hickory nuts, and walnuts.
Soft mast includes berries and fruits such as crabapples, blueberries, and serviceberries.
The definition of mast is sometimes expanded to include the winged seeds of trees such as maple
and elm, as well as pine seeds and nuts and even buds, hips, and catkins. This report uses the
expanded definition of hard mast. Both types of mast are important year-round food sources for
wildlife, but hard mast is often considered more important, especially as a winter food source,
due to its higher fat content.
Hard mast includes seeds from most tree species on the Ottawa in the form of pine cones, seed
pods, winged seeds (i.e. ash and maple) and oak acorns. Hard mast food sources are usually high
FY11 Ottawa NF Monitoring and Evaluation Report Page 25
in proteins and fats. These food sources are favored by wildlife in the colder months. Some
trees, like aspen, also produce hard mast in the form of fleshy buds that also serve as high-value
foods for wildlife (esp. ruffed grouse). Over the five year interval (2006 to 2011), the Ottawa
maintained a slight decrease (-0.4%) in acreage in forest stands providing hard mast. (See also
Table 15).
The predominant tree species on the Ottawa that provides for soft mast is black cherry. High-
value soft mast is also provided by woody perennials and shrubs such as apple, blackberry,
raspberry, and thimbleberry which are generally associated with upland forest openings. Over
the five year interval (2006 to 2011), the Ottawa experienced about a three and a half percent
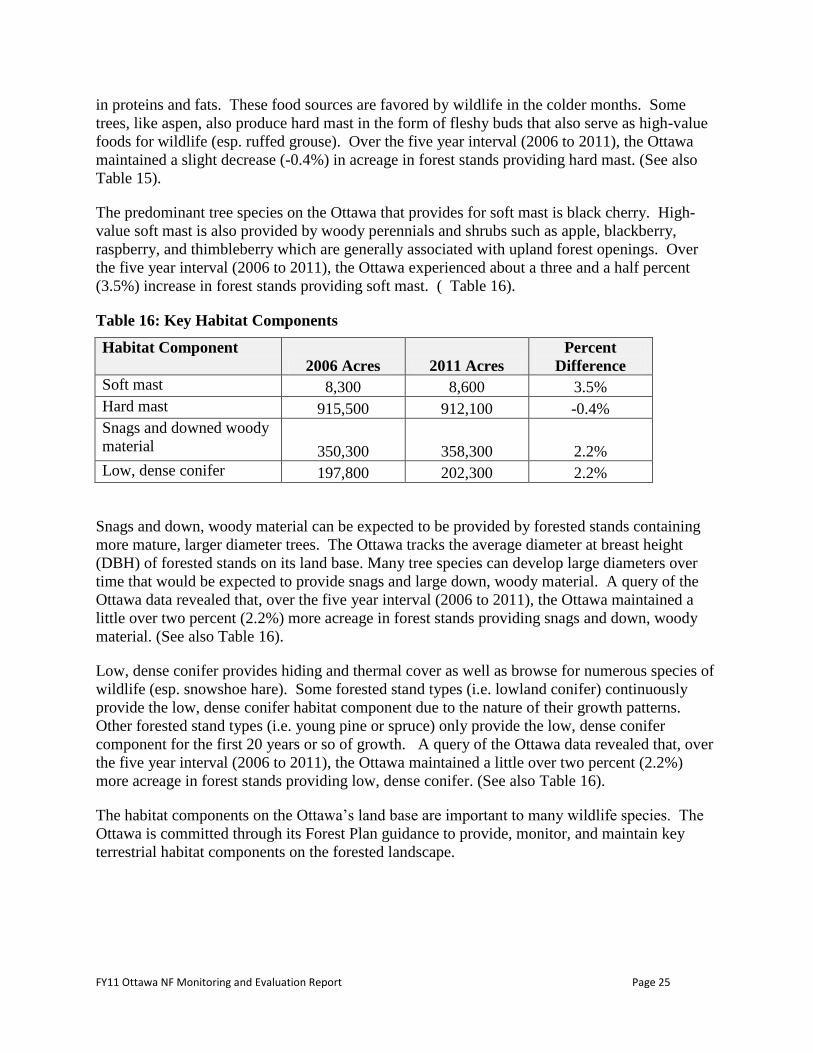
(3.5%) increase in forest stands providing soft mast. ( Table 16).
Table 16: Key Habitat Components
Habitat Component
2006 Acres 2011 Acres
Percent
Difference
Soft mast 8,300 8,600 3.5%
Hard mast 915,500 912,100 -0.4%
Snags and downed woody
material 350,300 358,300 2.2%
Low, dense conifer 197,800 202,300 2.2%
Snags and down, woody material can be expected to be provided by forested stands containing
more mature, larger diameter trees. The Ottawa tracks the average diameter at breast height
(DBH) of forested stands on its land base. Many tree species can develop large diameters over
time that would be expected to provide snags and large down, woody material. A query of the
Ottawa data revealed that, over the five year interval (2006 to 2011), the Ottawa maintained a
little over two percent (2.2%) more acreage in forest stands providing snags and down, woody
material. (See also Table 16).
Low, dense conifer provides hiding and thermal cover as well as browse for numerous species of
wildlife (esp. snowshoe hare). Some forested stand types (i.e. lowland conifer) continuously
provide the low, dense conifer habitat component due to the nature of their growth patterns.
Other forested stand types (i.e. young pine or spruce) only provide the low, dense conifer
component for the first 20 years or so of growth. A query of the Ottawa data revealed that, over
the five year interval (2006 to 2011), the Ottawa maintained a little over two percent (2.2%)
more acreage in forest stands providing low, dense conifer. (See also Table 16).
The habitat components on the Ottawa’s land base are important to many wildlife species. The
Ottawa is committed through its Forest Plan guidance to provide, monitor, and maintain key
terrestrial habitat components on the forested landscape.
FY11 Ottawa NF Monitoring and Evaluation Report Page 26
33: To what extent is forest management providing ecological
conditions to maintain viable populations of native and desired non-native species?
33a: Plants – To what extent is forest management providing ecological conditions to maintain viable populations of native and desired non-native species?
Several approaches could be used to evaluate this monitoring item. We selected the Floristic
Quality Assessment (FQA) as a simple approach that works with existing species lists for plant
communities on the Ottawa. The FQA was developed for the Chicago area in the early 1990s,
and the Michigan Department of Natural Resources modified it for use in Michigan (see Herman
et al. 2001). The FQA is based on the coefficient of conservatism, a number from 0 to 10,
assigned to each native species of vascular plant in Michigan. The coefficient represents the
plant’s fidelity to pristine natural communities, or landscapes that are little altered from the pre-
European settlement conditions. Plants restricted to high quality natural areas have coefficients
of 10. Plants that are found almost anywhere have low coefficients. Non-natives are assigned a
coefficient of 0. For a given community, based on species present, the coefficients are added up,
and an average coefficient calculated. The average is multiplied by the square root of the total
number of plants to give the floristic quality index (FQI) for the plant community (multiplying
by the square root helps to compare sites with many species against sites with few species).
The coefficients were assigned to Michigan plant species by a committee of experts, and are
listed in Herman et al. 2001. They are assigned for the state-wide habit of the plant species,
which in some cases may be different from where the plant occurs in the Upper Peninsula.
However, coefficients specific to the Upper Peninsula are not available.
Species lists developed for sites are dependent on the observer, size of sampling area, and level
of effort. Nonetheless, these lists allow a comparison based on data already collected and
available. Species lists were used from recent botany field surveys in authorized and on-going
vegetation management projects, combining the lists from several observers to yield the largest
sample size for a given cover type. Additionally, species data were used which were collected
from plots as part of a research project by the Forest Service’s Northern Research Station.
Floristic Quality Indices (FQI) were developed for three forest types managed by the Ottawa:
hardwoods, aspen mixes, and jack pine. For comparison, FQ indices from wilderness areas also
were calculated, as well as from two types of forested wetlands (not managed).
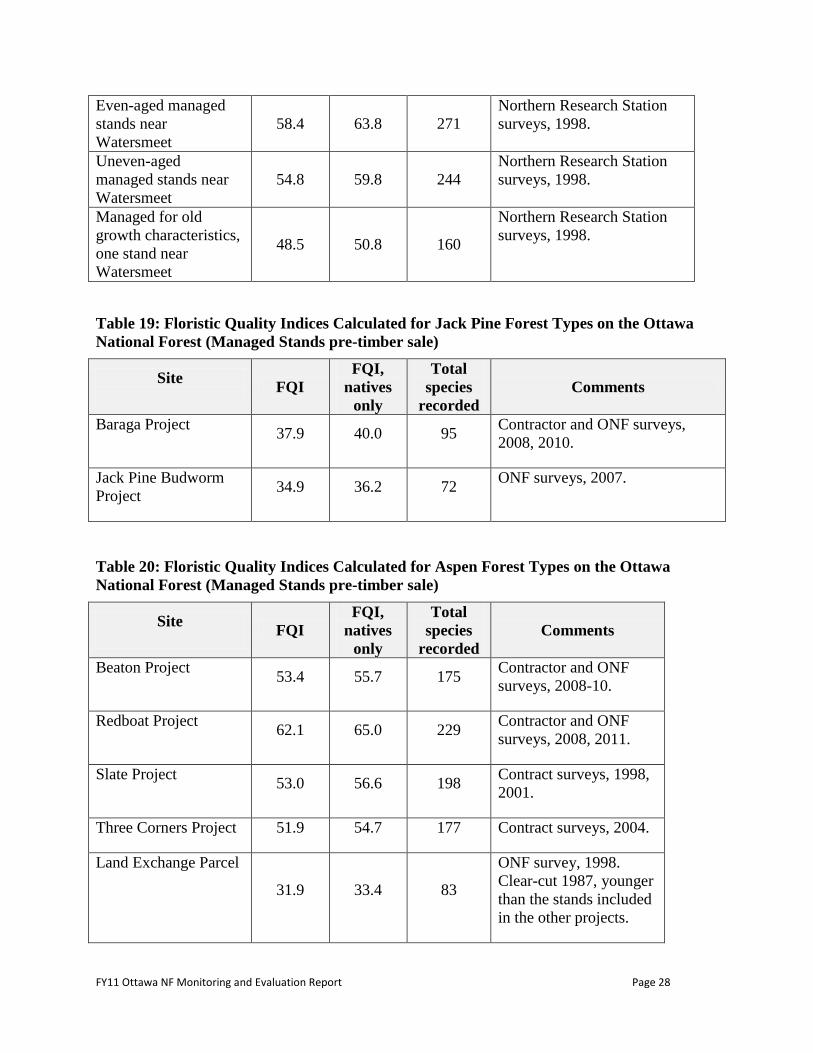
According to Herman et al. (2001), FQ indices higher than 35 represent rich natural areas with
statewide floristic importance; FQI higher than 50 are unusual in the state. However, comparing
these threshold numbers, likely calculated mainly for lower MI, to the Ottawa’s plant
communities is probably misleading. Comparing indices across Forest locations and against
wilderness is more valid. Tables 16 through 20 illustrate the FQI calculated for selected Ottawa
locations of the target forest types.
FY11 Ottawa NF Monitoring and Evaluation Report Page 27
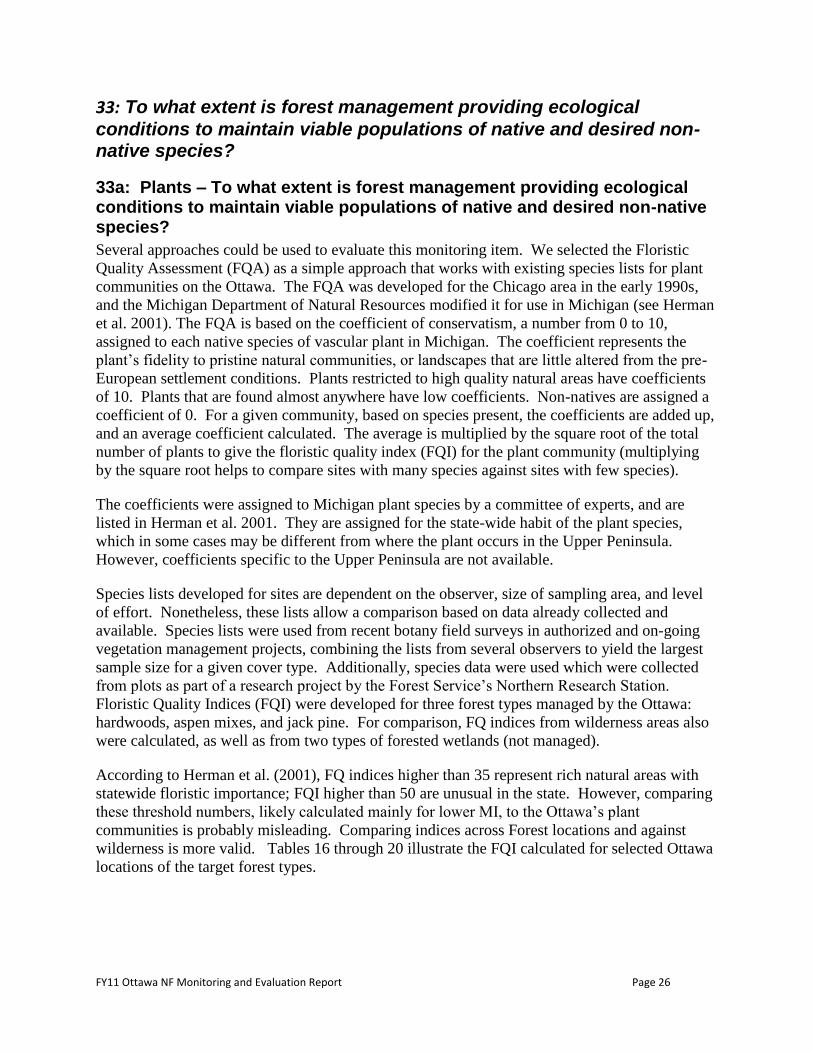
Table 17: Floristic Quality Indices Calculated for Hardwood Forest Types on the Ottawa
National Forest (unmanaged stands)
Site
FQI
FQI,
natives
only
Total
species
recorded
Comments
McCormick
Wilderness 81.4 85.1 326
Contractor surveys in
selected areas, 2000;
includes some rocky areas.
Sturgeon River Gorge
Wilderness candidate
Research Natural Area
(RNA)
53.4 54.1 132
FS survey for draft RNA
report, 1993.
Sylvania Wilderness
34.5 36.0 74
ONF surveys, 1994; for
research natural area study
plots and some campsites
(disturbed areas). Limited to
small area.
Sylvania Wilderness,
old growth stands 58.4 59.7 178
Northern Research Station
surveys, 1998.
Unmanaged second
growth stands near
Watersmeet
57.9 60.7 201
Northern Research Station
surveys, 1998.
Table 18: Floristic Quality Indices Calculated for Hardwood Forest Types on the Ottawa
National Forest (Managed Stands pre-timber sale)
Site
FQI
FQI,
natives
only
Total
species
recorded
Comments
Beaton Project 63.1 65.7 245
Contractor and ONF surveys,
2008-10.
Mud Lake Project 63.2 65.6 220
Contractor and ONF surveys,
1997-8, 2005-6.
Redboat Project 64.8 67.5 236
Contractor and ONF surveys,
2008, 2011.
Ridge Project
75.6 80.2 333
Contractor and ONF surveys,
1998, 2000, 2002, 2003,
2005, 2007.
Slate Project 68.5 73.3 295
Contractor surveys, 1996-98,
2001-2.
Three Corners Project 57.1 58.6 166 Contractor surveys, 2004.
Trap Hills (managed
and unmanaged stands
combined)
78.8 83.1 321
Contractor surveys, 1999.
Selected areas, includes
some rocky areas.
FY11 Ottawa NF Monitoring and Evaluation Report Page 28
Even-aged managed
stands near
Watersmeet
58.4 63.8 271
Northern Research Station
surveys, 1998.
Uneven-aged
managed stands near
Watersmeet
54.8 59.8 244
Northern Research Station
surveys, 1998.
Managed for old
growth characteristics,
one stand near
Watersmeet
48.5 50.8 160
Northern Research Station
surveys, 1998.
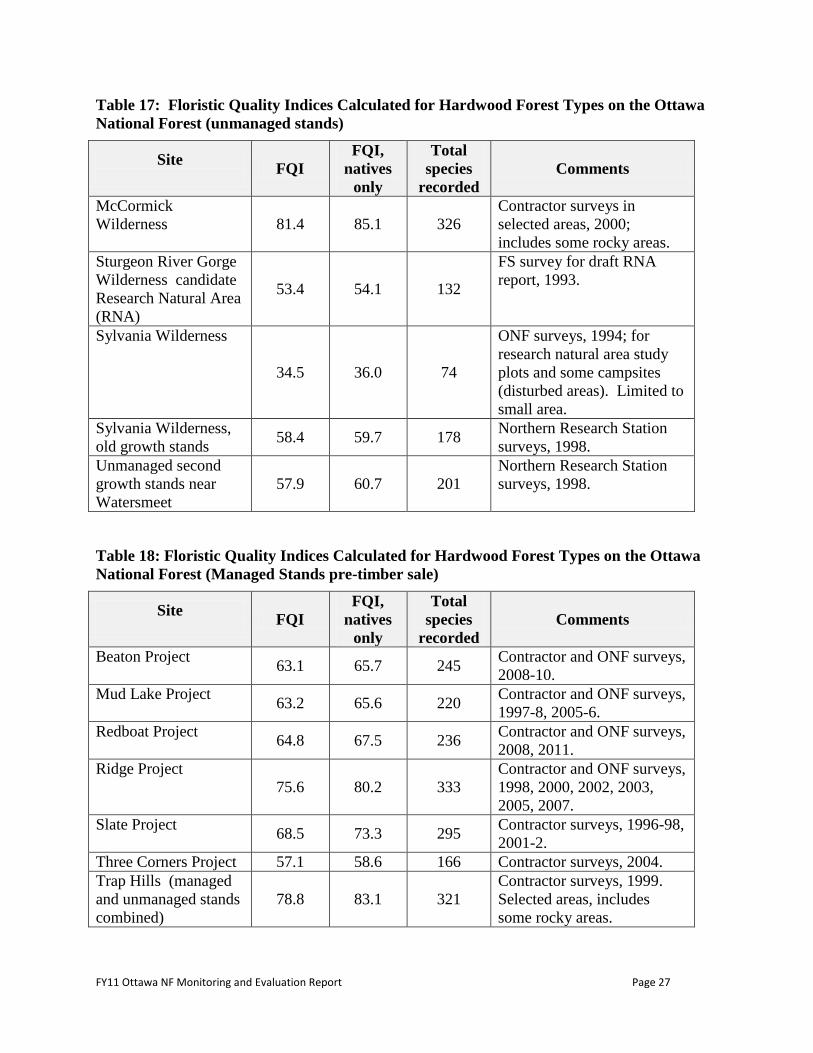
Table 19: Floristic Quality Indices Calculated for Jack Pine Forest Types on the Ottawa
National Forest (Managed Stands pre-timber sale)
Site
FQI
FQI,
natives
only
Total
species
recorded
Comments
Baraga Project 37.9 40.0 95
Contractor and ONF surveys,
2008, 2010.
Jack Pine Budworm
Project 34.9 36.2 72
ONF surveys, 2007.
Table 20: Floristic Quality Indices Calculated for Aspen Forest Types on the Ottawa
National Forest (Managed Stands pre-timber sale)
Site
FQI
FQI,
natives
only
Total
species
recorded
Comments
Beaton Project 53.4 55.7 175
Contractor and ONF
surveys, 2008-10.
Redboat Project 62.1 65.0 229
Contractor and ONF
surveys, 2008, 2011.
Slate Project 53.0 56.6 198
Contract surveys, 1998,
2001.
Three Corners Project 51.9 54.7 177 Contract surveys, 2004.
Land Exchange Parcel
31.9 33.4 83
ONF survey, 1998.
Clear-cut 1987, younger
than the stands included
in the other projects.
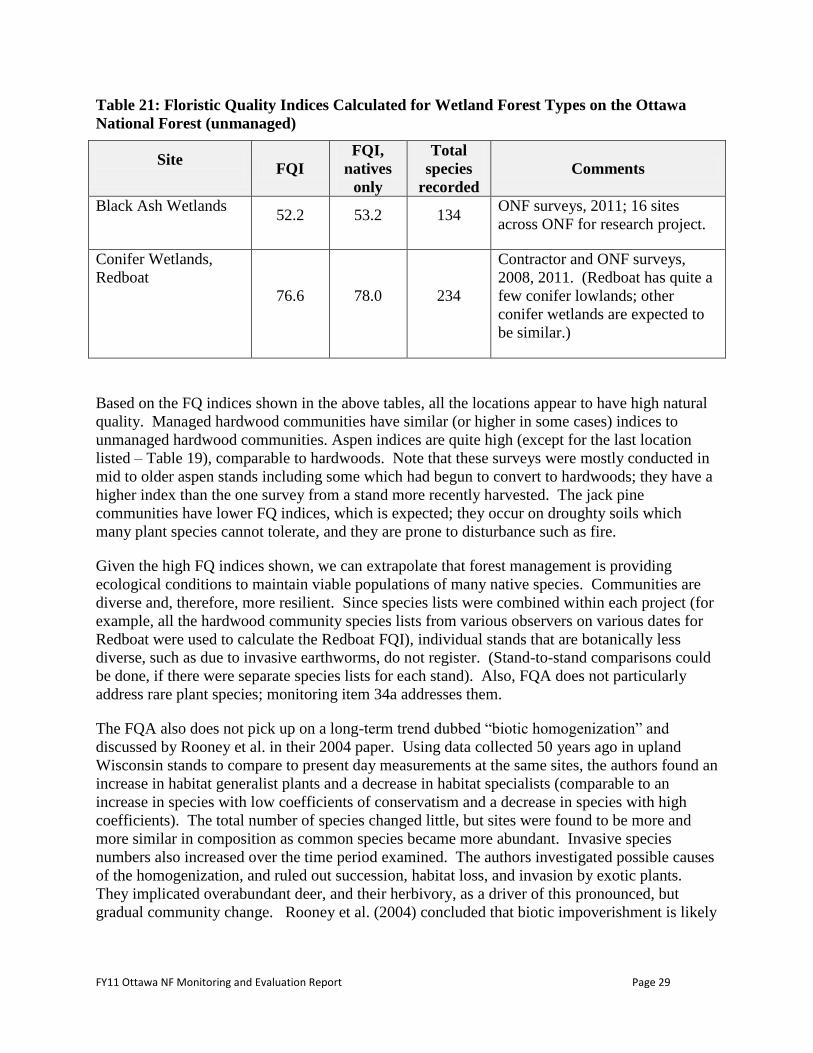
FY11 Ottawa NF Monitoring and Evaluation Report Page 29
Table 21: Floristic Quality Indices Calculated for Wetland Forest Types on the Ottawa
National Forest (unmanaged)
Site
FQI
FQI,
natives
only
Total
species
recorded
Comments
Black Ash Wetlands 52.2 53.2 134
ONF surveys, 2011; 16 sites
across ONF for research project.
Conifer Wetlands,
Redboat
76.6 78.0 234
Contractor and ONF surveys,
2008, 2011. (Redboat has quite a
few conifer lowlands; other
conifer wetlands are expected to
be similar.)
Based on the FQ indices shown in the above tables, all the locations appear to have high natural
quality. Managed hardwood communities have similar (or higher in some cases) indices to
unmanaged hardwood communities. Aspen indices are quite high (except for the last location
listed – Table 19), comparable to hardwoods. Note that these surveys were mostly conducted in
mid to older aspen stands including some which had begun to convert to hardwoods; they have a
higher index than the one survey from a stand more recently harvested. The jack pine
communities have lower FQ indices, which is expected; they occur on droughty soils which
many plant species cannot tolerate, and they are prone to disturbance such as fire.
Given the high FQ indices shown, we can extrapolate that forest management is providing
ecological conditions to maintain viable populations of many native species. Communities are
diverse and, therefore, more resilient. Since species lists were combined within each project (for
example, all the hardwood community species lists from various observers on various dates for
Redboat were used to calculate the Redboat FQI), individual stands that are botanically less
diverse, such as due to invasive earthworms, do not register. (Stand-to-stand comparisons could
be done, if there were separate species lists for each stand). Also, FQA does not particularly
address rare plant species; monitoring item 34a addresses them.
The FQA also does not pick up on a long-term trend dubbed “biotic homogenization” and
discussed by Rooney et al. in their 2004 paper. Using data collected 50 years ago in upland
Wisconsin stands to compare to present day measurements at the same sites, the authors found an
increase in habitat generalist plants and a decrease in habitat specialists (comparable to an
increase in species with low coefficients of conservatism and a decrease in species with high
coefficients). The total number of species changed little, but sites were found to be more and
more similar in composition as common species became more abundant. Invasive species
numbers also increased over the time period examined. The authors investigated possible causes
of the homogenization, and ruled out succession, habitat loss, and invasion by exotic plants.
They implicated overabundant deer, and their herbivory, as a driver of this pronounced, but
gradual community change. Rooney et al. (2004) concluded that biotic impoverishment is likely
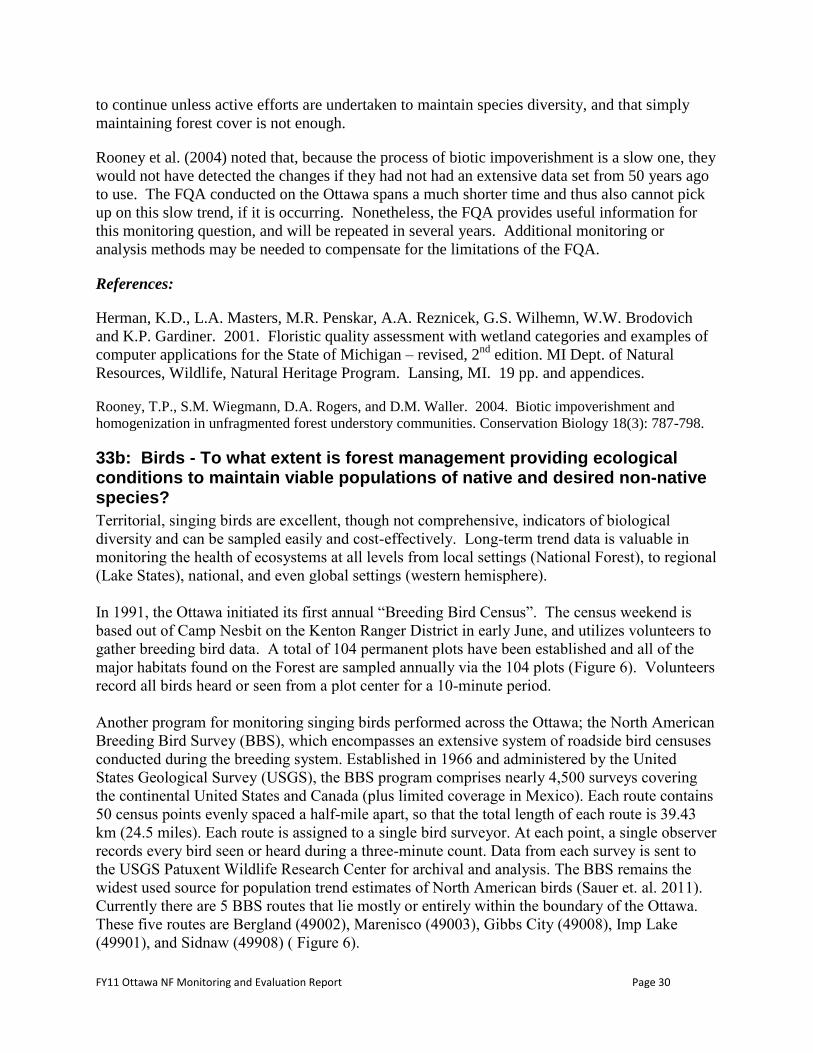
FY11 Ottawa NF Monitoring and Evaluation Report Page 30
to continue unless active efforts are undertaken to maintain species diversity, and that simply
maintaining forest cover is not enough.
Rooney et al. (2004) noted that, because the process of biotic impoverishment is a slow one, they
would not have detected the changes if they had not had an extensive data set from 50 years ago
to use. The FQA conducted on the Ottawa spans a much shorter time and thus also cannot pick
up on this slow trend, if it is occurring. Nonetheless, the FQA provides useful information for
this monitoring question, and will be repeated in several years. Additional monitoring or
analysis methods may be needed to compensate for the limitations of the FQA.
References:
Herman, K.D., L.A. Masters, M.R. Penskar, A.A. Reznicek, G.S. Wilhemn, W.W. Brodovich
and K.P. Gardiner. 2001. Floristic quality assessment with wetland categories and examples of
computer applications for the State of Michigan – revised, 2nd
edition. MI Dept. of Natural
Resources, Wildlife, Natural Heritage Program. Lansing, MI. 19 pp. and appendices.
Rooney, T.P., S.M. Wiegmann, D.A. Rogers, and D.M. Waller. 2004. Biotic impoverishment and
homogenization in unfragmented forest understory communities. Conservation Biology 18(3): 787-798.
33b: Birds - To what extent is forest management providing ecological conditions to maintain viable populations of native and desired non-native species?
Territorial, singing birds are excellent, though not comprehensive, indicators of biological
diversity and can be sampled easily and cost-effectively. Long-term trend data is valuable in
monitoring the health of ecosystems at all levels from local settings (National Forest), to regional
(Lake States), national, and even global settings (western hemisphere).
In 1991, the Ottawa initiated its first annual “Breeding Bird Census”. The census weekend is
based out of Camp Nesbit on the Kenton Ranger District in early June, and utilizes volunteers to
gather breeding bird data. A total of 104 permanent plots have been established and all of the
major habitats found on the Forest are sampled annually via the 104 plots (Figure 6). Volunteers
record all birds heard or seen from a plot center for a 10-minute period.
Another program for monitoring singing birds performed across the Ottawa; the North American
Breeding Bird Survey (BBS), which encompasses an extensive system of roadside bird censuses
conducted during the breeding system. Established in 1966 and administered by the United
States Geological Survey (USGS), the BBS program comprises nearly 4,500 surveys covering
the continental United States and Canada (plus limited coverage in Mexico). Each route contains
50 census points evenly spaced a half-mile apart, so that the total length of each route is 39.43
km (24.5 miles). Each route is assigned to a single bird surveyor. At each point, a single observer
records every bird seen or heard during a three-minute count. Data from each survey is sent to
the USGS Patuxent Wildlife Research Center for archival and analysis. The BBS remains the
widest used source for population trend estimates of North American birds (Sauer et. al. 2011).
Currently there are 5 BBS routes that lie mostly or entirely within the boundary of the Ottawa.
These five routes are Bergland (49002), Marenisco (49003), Gibbs City (49008), Imp Lake
(49901), and Sidnaw (49908) ( Figure 6).
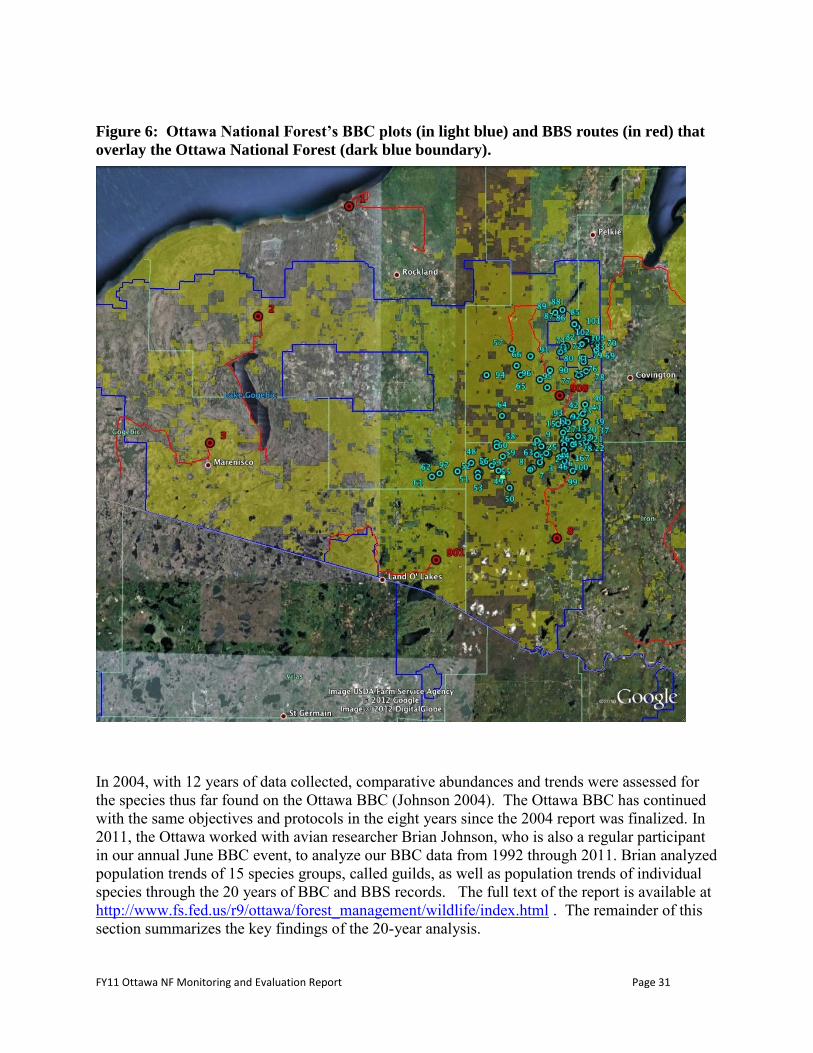
FY11 Ottawa NF Monitoring and Evaluation Report Page 31
Figure 6: Ottawa National Forest’s BBC plots (in light blue) and BBS routes (in red) that
overlay the Ottawa National Forest (dark blue boundary).
In 2004, with 12 years of data collected, comparative abundances and trends were assessed for
the species thus far found on the Ottawa BBC (Johnson 2004). The Ottawa BBC has continued
with the same objectives and protocols in the eight years since the 2004 report was finalized. In
2011, the Ottawa worked with avian researcher Brian Johnson, who is also a regular participant
in our annual June BBC event, to analyze our BBC data from 1992 through 2011. Brian analyzed
population trends of 15 species groups, called guilds, as well as population trends of individual
species through the 20 years of BBC and BBS records. The full text of the report is available at
http://www.fs.fed.us/r9/ottawa/forest_management/wildlife/index.html . The remainder of this
section summarizes the key findings of the 20-year analysis.

FY11 Ottawa NF Monitoring and Evaluation Report Page 32
Analysis Methods
To assess what factors may be influencing population changes of birds, BBC analyses were
conducted on groups of species with similar life history traits. When grouping different species
of birds into the 15 guilds, three general life history traits were considered: migration strategy,
habitat preference, and nest site selection. Lists of species in each guild and analysis
assumptions are contained in the full report by Johnson (see project file), and not repeated here.
Specifically, guilds were constructed for the following: 1. Long-distance migrants, 2. Medium-
distance migrants, 3. Short-distance migrants, 4. Open water, 5. Closed marsh, 6. Grasslands, 7.
Open forest, 8. Deciduous forest, 9. Mixed deciduous/coniferous forest, 10. Coniferous forest,
11. Cavity nesters, 12. Ground nesters, 13. Shrub nesters, 14. Mid-canopy nesters, and 15. Upper
canopy nesters.
Trends were created for two sets of point count data collected in Ottawa National Forest: the
Ottawa BBC and the five local BBS routes. Both sets of results were then compared to those
from the BBS program at two scales: the entire system and Bird Conservation Region 12 (BCR
12). Population and trend data from the entire datasets and for those portions of the datasets
comprising BCR12 was obtained from the BBS website.
Only material conforming to the same time frame as the Ottawa BBC was incorporated. Because
the number of points covered (ranging from 50 to 250 each year) did not match the same from
the Ottawa BBC, the results were mathematically adjusted to equal 104 points. Because of the
variability in local BBS coverage, adjustments were made in both directions depending on year.
Since our main interest was the Ottawa BBC, the species selected for analyses were derived from
that database. Those seen on fewer than 30 total points over the course of the 20-year census
were not considered due to insufficient samples.
Because geographic scope was relatively small and observer continuity and proficiency was
fairly consistent, simple linear regression was deemed sufficient for both data sets. This not only
allowed actual trajectories to be plotted on bar graphs, but it allowed Ottawa BBC data to be
plotted with coverage-adjusted BBS data from the five local routes.
Results
During the 20 years of the Ottawa BBC, 22,322 birds of 147 species have been recorded. Twelve
species exhibited cumulative totals greater than 500 birds, and together, they comprised 57% of
all the birds seen. Conversely, 78 species have been seen on 30 or fewer points (43 species have
been recorded on five or fewer). Several of these infrequent species almost certainly did not
breed in the Forest. Sixty-nine species were detected on 30 or more points during the 20-year
history of the Ottawa BBC. Of these, 36 were recorded every year of the study, and all but six
were recorded during 15 years or more.
Among the five local BBS routes, 60 individual surveys were conducted between 1992 and 2010.
This equates to a coverage rate of 77% and an average of three routes per year. Despite the
inconsistencies, the total number of points sampled was 3,000 (versus 1,976 during the Ottawa
BBC). The BBS efforts produced 27,346 birds of 144 species. Fifteen species exhibited
cumulative totals greater than 400 birds, and together they comprised 63% of all the birds seen.
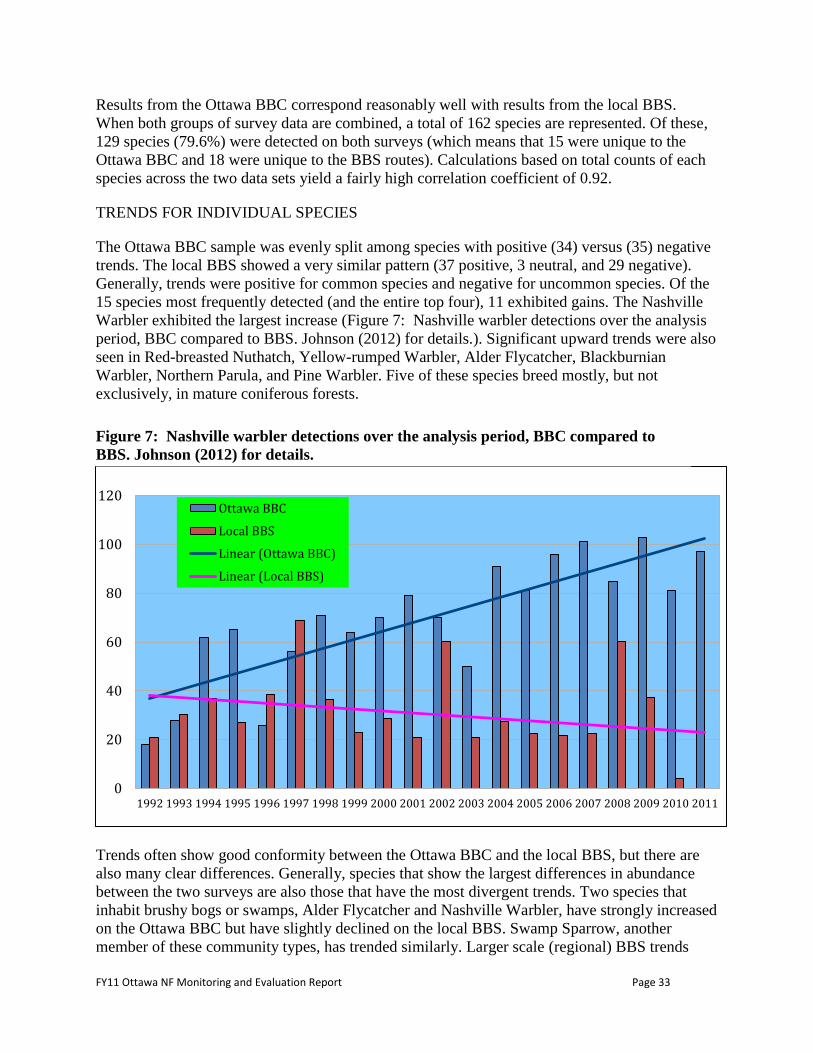
FY11 Ottawa NF Monitoring and Evaluation Report Page 33
Results from the Ottawa BBC correspond reasonably well with results from the local BBS.
When both groups of survey data are combined, a total of 162 species are represented. Of these,
129 species (79.6%) were detected on both surveys (which means that 15 were unique to the
Ottawa BBC and 18 were unique to the BBS routes). Calculations based on total counts of each
species across the two data sets yield a fairly high correlation coefficient of 0.92.
TRENDS FOR INDIVIDUAL SPECIES
The Ottawa BBC sample was evenly split among species with positive (34) versus (35) negative
trends. The local BBS showed a very similar pattern (37 positive, 3 neutral, and 29 negative).
Generally, trends were positive for common species and negative for uncommon species. Of the
15 species most frequently detected (and the entire top four), 11 exhibited gains. The Nashville
Warbler exhibited the largest increase (Figure 7: Nashville warbler detections over the analysis
period, BBC compared to BBS. Johnson (2012) for details.). Significant upward trends were also
seen in Red-breasted Nuthatch, Yellow-rumped Warbler, Alder Flycatcher, Blackburnian
Warbler, Northern Parula, and Pine Warbler. Five of these species breed mostly, but not
exclusively, in mature coniferous forests.
Trends often show good conformity between the Ottawa BBC and the local BBS, but there are
also many clear differences. Generally, species that show the largest differences in abundance
between the two surveys are also those that have the most divergent trends. Two species that
inhabit brushy bogs or swamps, Alder Flycatcher and Nashville Warbler, have strongly increased
on the Ottawa BBC but have slightly declined on the local BBS. Swamp Sparrow, another
member of these community types, has trended similarly. Larger scale (regional) BBS trends
1992 1993 1994 1995 1996 1997 1998 1999 2000 2001 2002 2003 2004 2005 2006 2007 2008 2009 2010 20110
20
40
60
80
100
120Ottawa BBC
Local BBS
Linear (Ottawa BBC)
Linear (Local BBS)
Figure 7: Nashville warbler detections over the analysis period, BBC compared to
BBS. Johnson (2012) for details.
FY11 Ottawa NF Monitoring and Evaluation Report Page 34
also run positive, butto a lesser extent for the Nashville Warbler and Swamp Sparrow. For the
Alder Flycatcher, the results are mixed; nationally, it is decreasing, but regionally it is increasing.
Evening Grosbeak demonstrated the steepest decrease (Figure 8), but given the well-
documented, strong, rapid, and widespread decline affecting this species, the pattern is not at all
surprising. Significant decreases were also noted for the American Crow, Chestnut-sided
Warbler, Ruby-crowned Kinglet, Hairy Woodpecker, and Gray Jay. The list of declining birds
contains six boreal species that reach the southern limits of their range in northern Michigan and
Wisconsin.
Figure 8: Evening grosbeak detections over the analysis period, BBC compared to BSS.
TRENDS OF GUILDS
The guild demonstrating the largest gain was the Coniferous Forest. Because the same guild
showed a small decline in the local BBS data set, management practices in the forest interior
seem to be producing quality habitat. Trends were fairly stable in the Mixed Forest guild (with
Ottawa BBC showing a small gain). Both surveys showed positive trends in the Deciduous
Forest guild. Both surveys showed declines in the Open Forest guild, which is not surprising
given habitat trends.
Among the Grassland guild, the changes definitely trend downward on both surveys. Sample
sizes are small, but the pattern is strong. Maturation and expansion of the Ottawa forestland
appears to be occurring at a considerable cost to grassland denizens. The Closed Marsh guild
(marshes, fens, bogs, or young swamps with little open water) moderately increased according to
the Ottawa BBC, but the local BBS indicated a moderate downward trend. Roadside disturbance
1992 1993 1994 1995 1996 1997 1998 1999 2000 2001 2002 2003 2004 2005 2006 2007 2008 2009 2010 2011
-10
0
10
20
30
40
50
60
Ottawa BBC
Local BBS
Linear (OttawaBBC)
FY11 Ottawa NF Monitoring and Evaluation Report Page 35
could be a factor. The Open Water guild declined moderately in both surveys, but in neither case
were samples large, and Ottawa totals tended to be particularly erratic. The Canopy Nester and
Cavity Nester guilds increased across the Ottawa for both BBC and BBS. This may reflect a
general maturation of the forests on the Ottawa. The Subcanopy Nester guild showed mixed but
non-significant results: positive on the Ottawa BBC, but negative on local BBS. The Shrub
Nester guild held steady on the Ottawa BBC, but showed a significant decline on the local BBS.
Finally, the Ground Nester guild trended in opposite directions, positive on the Ottawa BBC
while negative on the local BBS.
Discussion
There is fairly good conformity between the Ottawa BBC and local BBS. Alone, the Ottawa
BBC provides significant realistic quantitative information, but when used together, the
programs can increase representation further. Moreover, the two data sets validate each other.
Doubts concerning aspects of one data set may be verified or refuted by examining the other.
Perhaps more importantly, considering the two programs have been established and operated in
different manners, the similarities imply that the trends apparent from the Ottawa BBC are
indeed realistic of local population changes.
For the most common species, both survey programs yield similar results. The same also seems
to apply to most regionally scarce species. The differences mostly lie among those species that
are fairly common in the U. P. but have life history traits that preclude convenient enumeration.
Because of the greater visibility from roadsides (BBS) compared to interior forests (many BBC
points), visual detections are slightly higher with the former. Combined with the unlimited count
distance of BBS points, this promotes greater counts of large or silent birds, such as waterfowl
and raptors. Mallards, Common Loons, Turkey Vultures, Broad-winged Hawks, American
Crows, and Common Ravens are much more prevalent in the BBS data. The same holds true for
flocking species; Rock Pigeon, Chimney Swift, corvids, swallows, starling, and blackbirds figure
much more prominently in the local BBS. Also, the BBS, due to its greater inclusion of disturbed
and fragmented habitats has greater numbers of edge and residential species, such as some of
those just listed and also House Wren, American Robin, Gray Catbird, Cedar Waxwing, and
Song Sparrow. Finally, it appears that the BBS routes must incorporate more early successional
habitat, as Veery, Mourning Warbler, American Redstart, Chestnut-sided Warbler, Indigo
Bunting, and American Goldfinch are significantly more frequent.
Conifer specialists figure prominently in the Ottawa BBC data. The Forest Plan promotes the
restoration of mature coniferous woodlands; as a result, the Ottawa has a forest structure that
resembles the prehistoric land cover more closely than most other areas of the U P.
Consequently, birds that depend on pine and spruce forests exhibit high BBC counts. Counts of
the Red-breasted Nuthatch, Golden-crowned Kinglet, Northern Parula, Magnolia and Yellow-
rumped Warblers exceed those from the BBS. Also, boreal breeding species that are otherwise
scarce in northern Michigan appear fairly regularly on the BBC. These include Black-backed
Woodpecker, Olive-sided Flycatcher, Gray Jay, Ruby-crowned Kinglet, Swainson's Thrush,
Cape May Warbler, and Evening Grosbeak. While the ultimate consequences of climate change
on these and other boreal birds cannot be predicted with certainty, the recent trends have been
disturbing. Several species, notably Rusty Blackbird and Boreal Chickadee, have shown severe
population declines and range restrictions that have exceeded apparent habitat loss.
FY11 Ottawa NF Monitoring and Evaluation Report Page 36
Management practices have promoted early-successional conifer habitats on the Ottawa An
example of management practices that enhance wildlife habitat are prescribed burns. Prescribed
burns are an important management tool, benefitting vegetative communities and birds. High
numbers of the Black-backed Woodpecker (see discussion for 34b), Brown Thrasher, Hermit
Thrush, Vesper and Clay-colored Sparrows, and Dark-eyed Junco testify to the utility of clearcut
harvests and burns to maintain young jack pine barrens. Although the species occurs too
sporadically to have been detected on the Ottawa BBC, Kirtland's Warblers have been
documented in these same habitats. Older jack pine stands become more suitable for Spruce
Grouse, Hermit Thrush, American Robin, Ovenbird, Yellow-rumped Warbler, White-throated
Sparrow, and others.
Many of the changes to local bird populations are not caused by management of the National
Forest System Lands. Several factors beyond Forest Service control influence birds, especially
migratory species. On the Ottawa and across the western UP, succession is gradually changing
the landscape, and this is reflected in the changing abundances of different bird species. Also,
other factors, such as gradually milder winters and bird feeders, earlier onset of spring and earlier
nesting opportunities are enabling new species, such as mourning dove, to establish in the
western UP (Edde 2005). Fragmentation of large blocks of interior forests to the south are
resulting in the Ottawa being a haven for some birds that need large blocks of continuous forest.
Similarly, loss of wetlands further south has resulted in the Ottawa being a haven for wetlands
bird species, since wetlands are largely intact here, and wetland processes are generally operating
naturally.
Managing the Ottawa to maintain a variety of forest types in the full range of age classes, while
still maintaining the integrity of the large patches of closed canopy forest, would maximize
niches for birds and other native species on the Forest.
References
Edde, J. W. 2005. Bird population trends in managed and un-managed northern hardwood
forests: A comparison of long-term databases from National Forests in the Great Lakes and New
Hampshire. Michigan Birds and Natural History 12 (3): 98-117.
Johnson, B. 2004. The Ottawa National Forest Breeding Bird Census: An analysis of twelve
years of data. Report submitted to ONF July 29, 2004. 219p
Sauer, J. R., J. E. Hines, J. E. Fallon, K. L. Pardieck, D. J. Ziolkowski, Jr., and W. A. Link. 2011.
The North American Breeding Bird Survey, Results and Analysis 1966 - 2009. Version
3.23.2011 USGS Patuxent Wildlife Research Center, Laurel, MD
33d: Bobcat - To what extent is forest management providing ecological conditions to maintain viable populations of native and desired non-native species?
In Michigan, bobcats (Lynx rufus) are classified and managed as a game animal (furbearer), and
occur throughout the Upper Peninsula. Determining the number and distribution of bobcats for a
given area can be difficult since bobcats are usually solitary, and tend to inhabit areas with heavy
cover values. Bobcats are territorial, and range across areas from 7,400-15,000 acres. The large
FY11 Ottawa NF Monitoring and Evaluation Report Page 37
home ranges mean a variety of habitat types can be used annually. Males tend to have larger
ranges than females, but ranges expand for both sexes during winter when prey abundance drops.
Important food species are small mammals, including snowshoe hares, red squirrels, mice, as
well as avian species such as the ruffed grouse. Although bobcats use a variety of habitats, they
often use short-lived conifer (balsam fir, black spruce, northern white cedar, tamarack, mixed-
swamp conifer, and jack pine) and lowland deciduous (aspen, paper birch, and mixed-lowland
hardwood) forest types.
The Ottawa does not have a survey program specific to bobcats, and incidental sighting data is
limited. To assess what extent forest management provides ecological conditions necessary to
maintain bobcats on the Ottawa, other data sources were used. The best data available was
furbearer harvest registration data collected and maintained by the Michigan Department of
Natural Resources (MDNR). Furbearer data were available from 1989 through 2010, and
contained the date and location of harvest, accurate to the township, range, and section. Though
many variables can influence annual harvest rates, such as fur prices or weather, harvest data can
provide some indication to how a local population is fairing on a landscape. Harvest data can
help show distribution patterns and relative trends, especially if harvest effort is relatively stable
across time, which is considered the case on the Ottawa.
Although harvest data for the entire Upper Peninsula were available, only counties within the
Ottawa (Gogebic, Houghton, Baraga, Ontonagon, and Iron) were selected. These counties
represent the number of bobcats harvested on the Ottawa, and across the majority of the western
Upper Peninsula.
From 1989-2010, there were 1,493 bobcats reported harvested on or adjacent to the Ottawa. The
annual trend of bobcats harvested on the Ottawa appears similar to surrounding harvest rates
(Figure 9). Trend wise, bobcat numbers have increased, since 1989, with harvest peaking from
2001-2006. In 2007, harvests declined but then re-stabilized, suggesting bobcats within the
Ottawa and surrounding areas are a level that is reproductively viable and sustainable. The
harvest data also indicates the Ottawa supports a large percentage of the local bobcat population.
On average, about 68 bobcats, or 48% of bobcats harvested in the western Upper Peninsula,
come from the Ottawa.
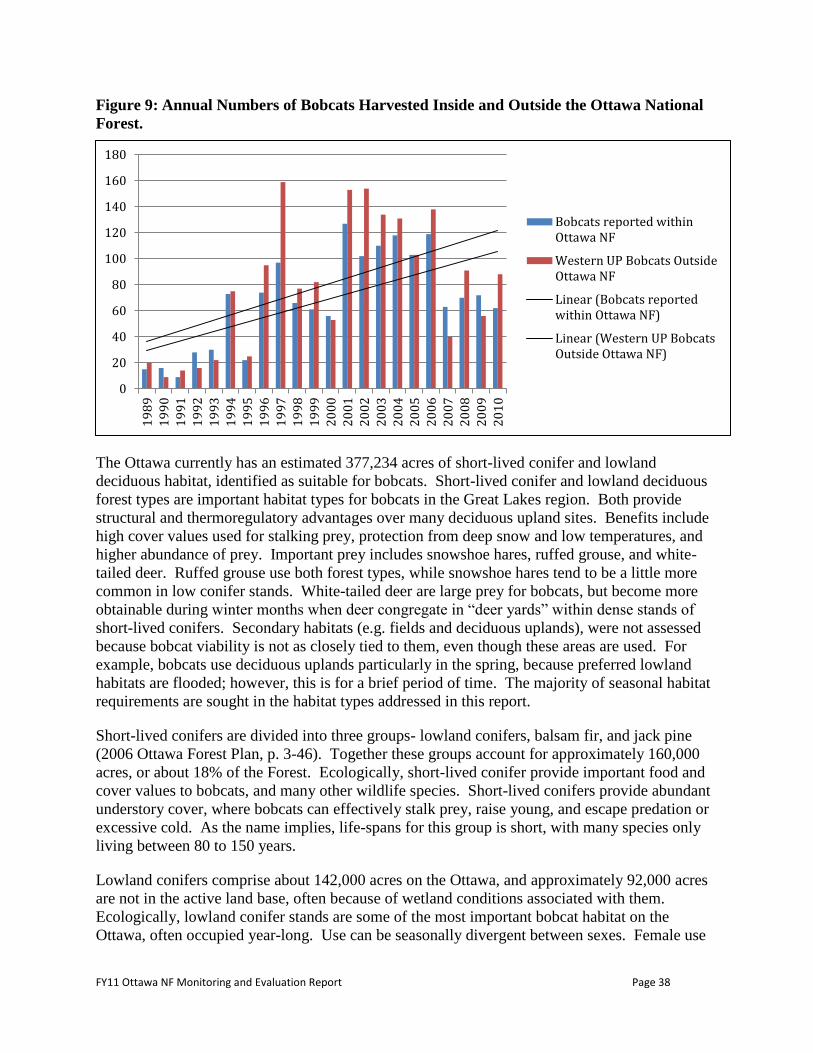
FY11 Ottawa NF Monitoring and Evaluation Report Page 38
Figure 9: Annual Numbers of Bobcats Harvested Inside and Outside the Ottawa National
Forest.
The Ottawa currently has an estimated 377,234 acres of short-lived conifer and lowland
deciduous habitat, identified as suitable for bobcats. Short-lived conifer and lowland deciduous
forest types are important habitat types for bobcats in the Great Lakes region. Both provide
structural and thermoregulatory advantages over many deciduous upland sites. Benefits include
high cover values used for stalking prey, protection from deep snow and low temperatures, and
higher abundance of prey. Important prey includes snowshoe hares, ruffed grouse, and white-
tailed deer. Ruffed grouse use both forest types, while snowshoe hares tend to be a little more
common in low conifer stands. White-tailed deer are large prey for bobcats, but become more
obtainable during winter months when deer congregate in “deer yards” within dense stands of
short-lived conifers. Secondary habitats (e.g. fields and deciduous uplands), were not assessed
because bobcat viability is not as closely tied to them, even though these areas are used. For
example, bobcats use deciduous uplands particularly in the spring, because preferred lowland
habitats are flooded; however, this is for a brief period of time. The majority of seasonal habitat
requirements are sought in the habitat types addressed in this report.
Short-lived conifers are divided into three groups- lowland conifers, balsam fir, and jack pine
(2006 Ottawa Forest Plan, p. 3-46). Together these groups account for approximately 160,000
acres, or about 18% of the Forest. Ecologically, short-lived conifer provide important food and
cover values to bobcats, and many other wildlife species. Short-lived conifers provide abundant
understory cover, where bobcats can effectively stalk prey, raise young, and escape predation or
excessive cold. As the name implies, life-spans for this group is short, with many species only
living between 80 to 150 years.
Lowland conifers comprise about 142,000 acres on the Ottawa, and approximately 92,000 acres
are not in the active land base, often because of wetland conditions associated with them.
Ecologically, lowland conifer stands are some of the most important bobcat habitat on the
Ottawa, often occupied year-long. Use can be seasonally divergent between sexes. Female use
0
20
40
60
80
100
120
140
160
1801
98
9
19
90
19
91
19
92
19
93
19
94
19
95
19
96
19
97
19
98
19
99
20
00
20
01
20
02
20
03
20
04
20
05
20
06
20
07
20
08
20
09
20
10
Bobcats reported withinOttawa NF
Western UP Bobcats OutsideOttawa NF
Linear (Bobcats reportedwithin Ottawa NF)
Linear (Western UP BobcatsOutside Ottawa NF)
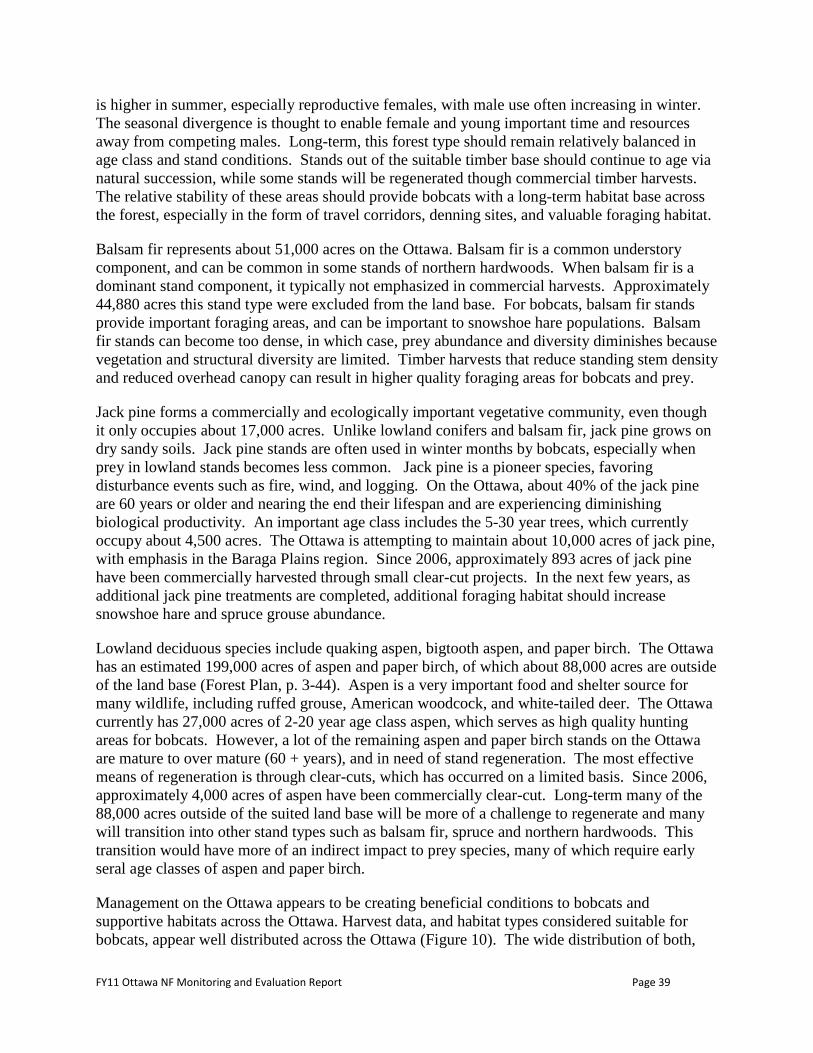
FY11 Ottawa NF Monitoring and Evaluation Report Page 39
is higher in summer, especially reproductive females, with male use often increasing in winter.
The seasonal divergence is thought to enable female and young important time and resources
away from competing males. Long-term, this forest type should remain relatively balanced in
age class and stand conditions. Stands out of the suitable timber base should continue to age via
natural succession, while some stands will be regenerated though commercial timber harvests.
The relative stability of these areas should provide bobcats with a long-term habitat base across
the forest, especially in the form of travel corridors, denning sites, and valuable foraging habitat.
Balsam fir represents about 51,000 acres on the Ottawa. Balsam fir is a common understory
component, and can be common in some stands of northern hardwoods. When balsam fir is a
dominant stand component, it typically not emphasized in commercial harvests. Approximately
44,880 acres this stand type were excluded from the land base. For bobcats, balsam fir stands
provide important foraging areas, and can be important to snowshoe hare populations. Balsam
fir stands can become too dense, in which case, prey abundance and diversity diminishes because
vegetation and structural diversity are limited. Timber harvests that reduce standing stem density
and reduced overhead canopy can result in higher quality foraging areas for bobcats and prey.
Jack pine forms a commercially and ecologically important vegetative community, even though
it only occupies about 17,000 acres. Unlike lowland conifers and balsam fir, jack pine grows on
dry sandy soils. Jack pine stands are often used in winter months by bobcats, especially when
prey in lowland stands becomes less common. Jack pine is a pioneer species, favoring
disturbance events such as fire, wind, and logging. On the Ottawa, about 40% of the jack pine
are 60 years or older and nearing the end their lifespan and are experiencing diminishing
biological productivity. An important age class includes the 5-30 year trees, which currently
occupy about 4,500 acres. The Ottawa is attempting to maintain about 10,000 acres of jack pine,
with emphasis in the Baraga Plains region. Since 2006, approximately 893 acres of jack pine
have been commercially harvested through small clear-cut projects. In the next few years, as
additional jack pine treatments are completed, additional foraging habitat should increase
snowshoe hare and spruce grouse abundance.
Lowland deciduous species include quaking aspen, bigtooth aspen, and paper birch. The Ottawa
has an estimated 199,000 acres of aspen and paper birch, of which about 88,000 acres are outside
of the land base (Forest Plan, p. 3-44). Aspen is a very important food and shelter source for
many wildlife, including ruffed grouse, American woodcock, and white-tailed deer. The Ottawa
currently has 27,000 acres of 2-20 year age class aspen, which serves as high quality hunting
areas for bobcats. However, a lot of the remaining aspen and paper birch stands on the Ottawa
are mature to over mature (60 + years), and in need of stand regeneration. The most effective
means of regeneration is through clear-cuts, which has occurred on a limited basis. Since 2006,
approximately 4,000 acres of aspen have been commercially clear-cut. Long-term many of the
88,000 acres outside of the suited land base will be more of a challenge to regenerate and many
will transition into other stand types such as balsam fir, spruce and northern hardwoods. This
transition would have more of an indirect impact to prey species, many of which require early
seral age classes of aspen and paper birch.
Management on the Ottawa appears to be creating beneficial conditions to bobcats and
supportive habitats across the Ottawa. Harvest data, and habitat types considered suitable for
bobcats, appear well distributed across the Ottawa (Figure 10). The wide distribution of both,
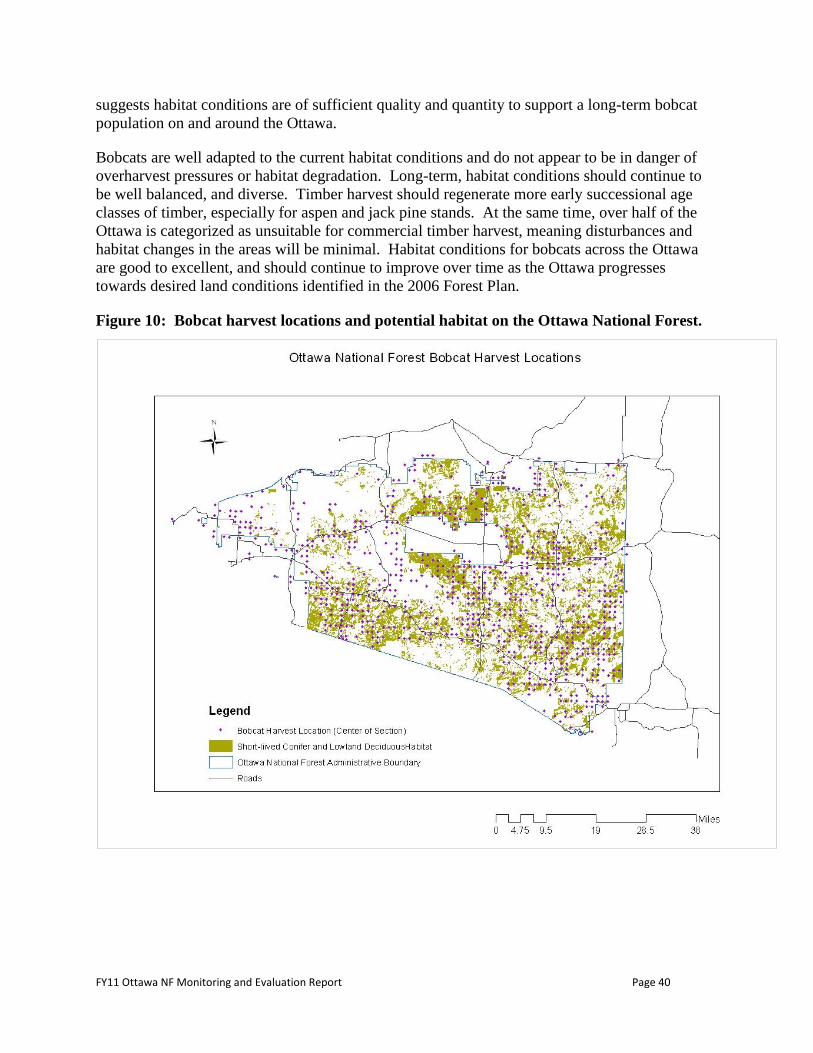
FY11 Ottawa NF Monitoring and Evaluation Report Page 40
suggests habitat conditions are of sufficient quality and quantity to support a long-term bobcat
population on and around the Ottawa.
Bobcats are well adapted to the current habitat conditions and do not appear to be in danger of
overharvest pressures or habitat degradation. Long-term, habitat conditions should continue to
be well balanced, and diverse. Timber harvest should regenerate more early successional age
classes of timber, especially for aspen and jack pine stands. At the same time, over half of the
Ottawa is categorized as unsuitable for commercial timber harvest, meaning disturbances and
habitat changes in the areas will be minimal. Habitat conditions for bobcats across the Ottawa
are good to excellent, and should continue to improve over time as the Ottawa progresses
towards desired land conditions identified in the 2006 Forest Plan.
Figure 10: Bobcat harvest locations and potential habitat on the Ottawa National Forest.
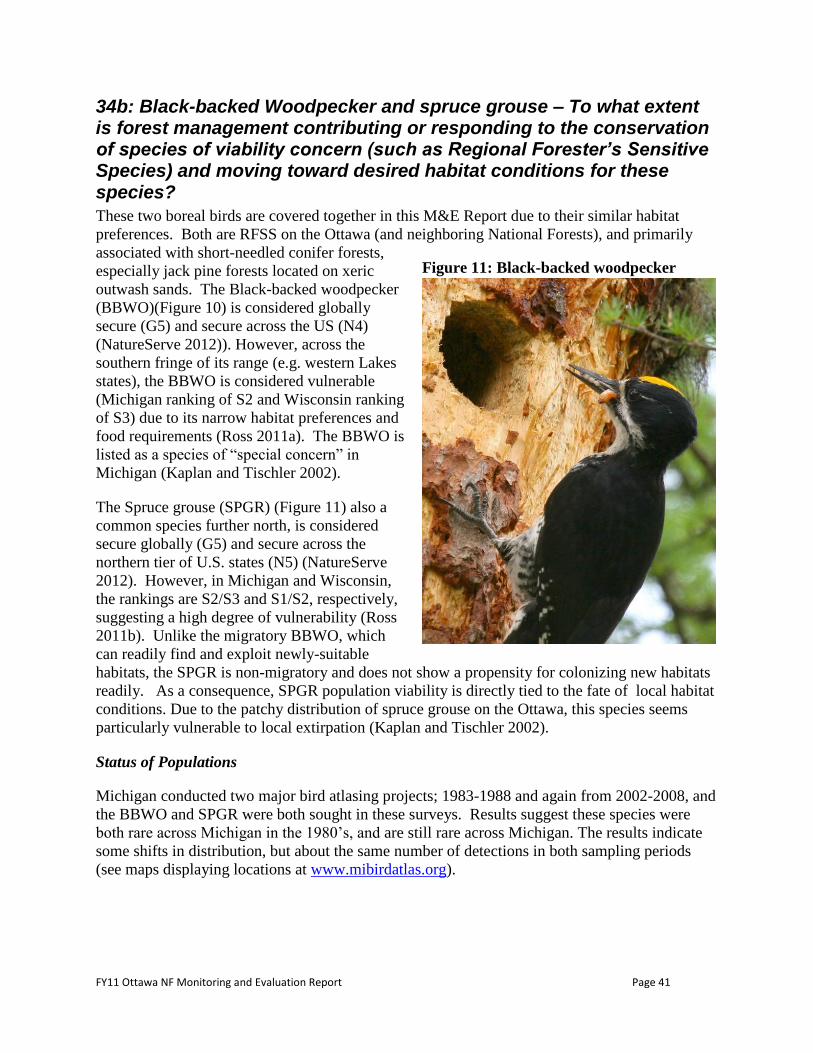
FY11 Ottawa NF Monitoring and Evaluation Report Page 41
34b: Black-backed Woodpecker and spruce grouse – To what extent is forest management contributing or responding to the conservation of species of viability concern (such as Regional Forester’s Sensitive Species) and moving toward desired habitat conditions for these species?
These two boreal birds are covered together in this M&E Report due to their similar habitat
preferences. Both are RFSS on the Ottawa (and neighboring National Forests), and primarily
associated with short-needled conifer forests,
especially jack pine forests located on xeric
outwash sands. The Black-backed woodpecker
(BBWO)(Figure 10) is considered globally
secure (G5) and secure across the US (N4)
(NatureServe 2012)). However, across the
southern fringe of its range (e.g. western Lakes
states), the BBWO is considered vulnerable
(Michigan ranking of S2 and Wisconsin ranking
of S3) due to its narrow habitat preferences and
food requirements (Ross 2011a). The BBWO is
listed as a species of “special concern” in
Michigan (Kaplan and Tischler 2002).
The Spruce grouse (SPGR) (Figure 11) also a
common species further north, is considered
secure globally (G5) and secure across the
northern tier of U.S. states (N5) (NatureServe
2012). However, in Michigan and Wisconsin,
the rankings are S2/S3 and S1/S2, respectively,
suggesting a high degree of vulnerability (Ross
2011b). Unlike the migratory BBWO, which
can readily find and exploit newly-suitable
habitats, the SPGR is non-migratory and does not show a propensity for colonizing new habitats
readily. As a consequence, SPGR population viability is directly tied to the fate of local habitat
conditions. Due to the patchy distribution of spruce grouse on the Ottawa, this species seems
particularly vulnerable to local extirpation (Kaplan and Tischler 2002).
Status of Populations
Michigan conducted two major bird atlasing projects; 1983-1988 and again from 2002-2008, and
the BBWO and SPGR were both sought in these surveys. Results suggest these species were
both rare across Michigan in the 1980’s, and are still rare across Michigan. The results indicate
some shifts in distribution, but about the same number of detections in both sampling periods
(see maps displaying locations at www.mibirdatlas.org).
Figure 11: Black-backed woodpecker
FY11 Ottawa NF Monitoring and Evaluation Report Page 42
Here on the Ottawa, incidental reports from the public and observations by our own staff
continue. Based on these reports we have a sense of where these species are most frequently
encountered. In 2002, the Ottawa hired expert birders to conduct a systematic survey for both
species targeting several areas where the Ottawa consistently received reports of these birds.
Their report (Kaplan and Tischler 2002) documented six individual Black-backed Woodpeckers
(all males) and two to three Spruce Grouse (1-2 males, 1 female). Three of the six Black-backed
Woodpeckers were found in adjacent territories. One woodpecker was re-observed in the same
location 35 days after the initial observation. Two Spruce Grouse (male and female) were found
in the same location and a male Spruce Grouse
(possibly the same individual) was observed eight
days later, only 0.25 miles from the location of the
first grouse. While breeding was not confirmed for
either species in the ONF, territorial males were
observed, qualifying both species as probable
breeders (see Brewer et al. 1991 for breeding
criteria).
In addition to these observations, a female Spruce
Grouse with young was found in a black spruce
bog on 30 June 2002, approximately 12 miles east
of the Ottawa boundary at Little King Lake
(Township 48N, Range 33W, Sec. 25) and a
second female with young was observed in a black
spruce bog on 21 July 2002, two and one-half
miles east of the Ottawa boundary at Honkers Pond
in the Baraga Plains (Township 49N, Range 34W,
Sec. 28). These finds suggest that black spruce
bog may be a particularly important habitat for
brooding females.
In 2011, the Ottawa contracted another structured
search for these species, which found a pair of BBWO in the Baraga Plains, northwest of the
Baraga Bump Fire, but could not confirm presence of SPGR, though circumstantial evidence of
their occurrence was found in several locations (Ross 2011a and Ross 20011b). Despite
following the same protocols and visiting the same areas, Ross could not find as many birds as
Kaplan and Tischler 2002.
The BBC data (see discussion for 33b), spanning a period from 1992-2012, reveals only 8
occurrences of BBWO, at 8 different plots across the years. Our BBC data reveals only 1 in-plot
detection of a spruce grouse (Plot 33) and that was in 2009, and was a hen with a brood; an
exciting find by any measure. Bottom line; these are rare species due to edge-of-range issues,
and have always been rare according to our records. Fortunately, these species’ habitat
requirements are well-understood, and they can benefit from targeted habitat management
practices. We have forest management direction in the Forest Plan that can directly benefit
them, via informed implementation of our timber management program
Figure 12: Spruce grouse.
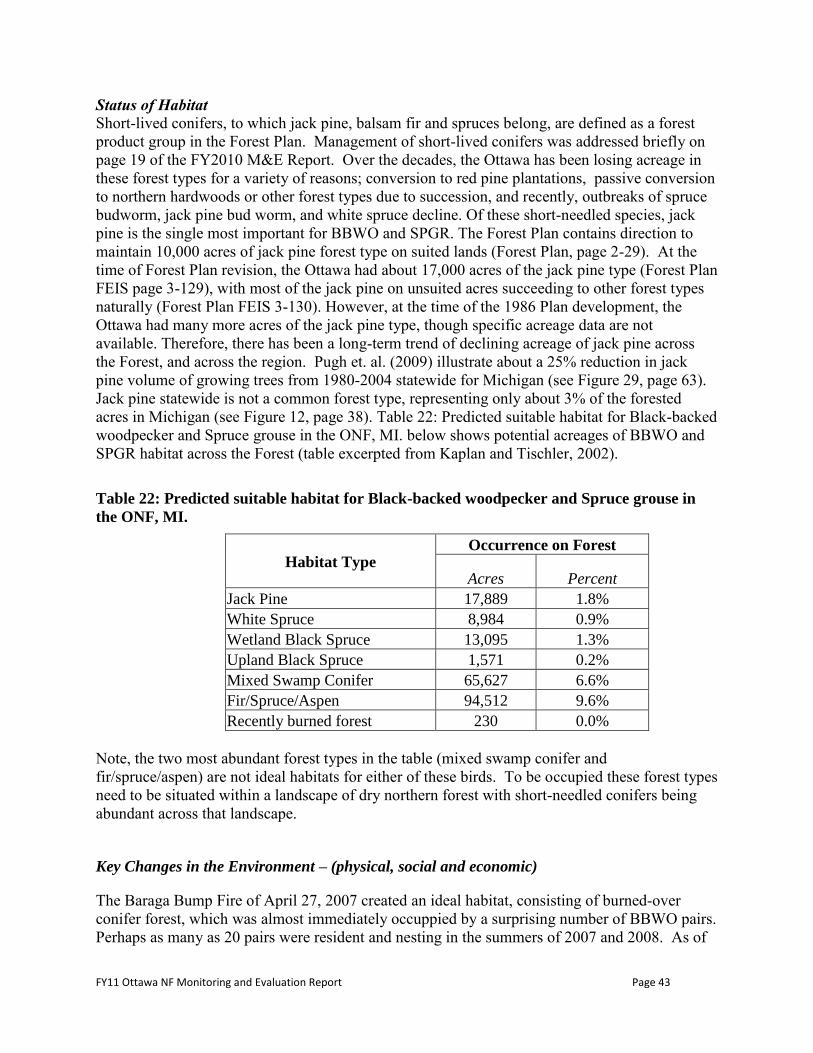
FY11 Ottawa NF Monitoring and Evaluation Report Page 43
Status of Habitat Short-lived conifers, to which jack pine, balsam fir and spruces belong, are defined as a forest
product group in the Forest Plan. Management of short-lived conifers was addressed briefly on
page 19 of the FY2010 M&E Report. Over the decades, the Ottawa has been losing acreage in
these forest types for a variety of reasons; conversion to red pine plantations, passive conversion
to northern hardwoods or other forest types due to succession, and recently, outbreaks of spruce
budworm, jack pine bud worm, and white spruce decline. Of these short-needled species, jack
pine is the single most important for BBWO and SPGR. The Forest Plan contains direction to
maintain 10,000 acres of jack pine forest type on suited lands (Forest Plan, page 2-29). At the
time of Forest Plan revision, the Ottawa had about 17,000 acres of the jack pine type (Forest Plan
FEIS page 3-129), with most of the jack pine on unsuited acres succeeding to other forest types
naturally (Forest Plan FEIS 3-130). However, at the time of the 1986 Plan development, the
Ottawa had many more acres of the jack pine type, though specific acreage data are not
available. Therefore, there has been a long-term trend of declining acreage of jack pine across
the Forest, and across the region. Pugh et. al. (2009) illustrate about a 25% reduction in jack
pine volume of growing trees from 1980-2004 statewide for Michigan (see Figure 29, page 63).
Jack pine statewide is not a common forest type, representing only about 3% of the forested
acres in Michigan (see Figure 12, page 38). Table 22: Predicted suitable habitat for Black-backed
woodpecker and Spruce grouse in the ONF, MI. below shows potential acreages of BBWO and
SPGR habitat across the Forest (table excerpted from Kaplan and Tischler, 2002).
Table 22: Predicted suitable habitat for Black-backed woodpecker and Spruce grouse in
the ONF, MI.
Habitat Type Occurrence on Forest
Acres Percent
Jack Pine 17,889 1.8%
White Spruce 8,984 0.9%
Wetland Black Spruce 13,095 1.3%
Upland Black Spruce 1,571 0.2%
Mixed Swamp Conifer 65,627 6.6%
Fir/Spruce/Aspen 94,512 9.6%
Recently burned forest 230 0.0%
Note, the two most abundant forest types in the table (mixed swamp conifer and
fir/spruce/aspen) are not ideal habitats for either of these birds. To be occupied these forest types
need to be situated within a landscape of dry northern forest with short-needled conifers being
abundant across that landscape.
Key Changes in the Environment – (physical, social and economic)
The Baraga Bump Fire of April 27, 2007 created an ideal habitat, consisting of burned-over
conifer forest, which was almost immediately occuppied by a surprising number of BBWO pairs.
Perhaps as many as 20 pairs were resident and nesting in the summers of 2007 and 2008. As of
FY11 Ottawa NF Monitoring and Evaluation Report Page 44
2011, only a couple pairs appeared to be still occupying the burned area, indicating the
ephemeral nature of ideal BBWO habitat. No fires of this size have occurred since that time on
the Ottawa, and as a result, all that remains of suitable habitat includes small scattered patches of
snag-rich conifer stands where wind or insects/diseases have killed large numbers of trees (Ross
2011a). In the near future, we expect that on-going tree mortality from spruce decline, and
senesence of over-mature fir and aspen, will continue to provide scattered snag-rich pockets
across the Ottawa.
Spruce grouse are largely dependent upon middle-aged and mature stands of short-needled
conifers. As stated above, jack pine is the key forest type for this species, and the Ottawa is
experiencing a decline in that forest type. For example, there is a small isolated SPGR
population south of Watermeet on the Land O’ Lakes outwash delta. A 2007 NEPA decision
(Jack Pine Budworm Area Restoration Project Environmental Assessment, north of Land O’
Lakes, WI) removed many stands of bug-killed jack pine and converted some of the jack pine
sands to oak, white pine and other forest types unsuitable for SPGR, due to concerns over
wildlife risk in the Wildland Urban Interface. Actions such as this can cause local SPGR
populations to suffer viability problems.
Looking forward, these boreal birds will potentially decline on the Ottawa National Forest due to
loss of habitat. According to the Climate Change Tree Atlas
(http://www.nrs.fs.fed.us/atlas/tree/tree_atlas.html) jack pine, balsam fir and the spruces are all
predicted to retreat northward and become much less common across the western UP by the end
of the 21st century. All four of these tree species predicted changes had a “high” level of
certainty according to the model. The Climate Change Bird Atlas
(http://www.nrs.fs.fed.us/atlas/bird/index.html) did not assess these uncommon birds among the
147 species the model addresses. Presumably, current suitable forest types would gradually be
replaced by trees that can better tolerate drought conditions, and by tree species that can take
advantage of the gradually lengthening growing season.
References
Kaplan, Joseph D. and Keren B. Tischler. 2002. Black-backed Woodpecker and Spruce Grouse
occurrence in the Ottawa National Forest, Michigan.
Matthews, S.N., L. R. Iverson, A.M. Prasad, A. M., and M.P. Peters. 2007-ongoing. A Climate
Change Atlas for 147 Bird Species of the Eastern United States [database].
http://www.nrs.fs.fed.us/atlas/bird, Northern Research Station, USDA Forest Service, Delaware,
Ohio.
NatureServe; An on-line encyclopedia of life. Black-backed woodpecker. Accessed 02-13-2012.
http://www.natureserve.org/explorer/servlet/NatureServe?searchSciOrCommonName=black-
backed+woodpecker
NatureServe; An on-line encyclopedia of life. Spruce Grouse. Accessed 02-13-2012.
http://www.natureserve.org/explorer/servlet/NatureServe?loadTemplate=tabular_report.wmt&pa
ging=home&save=all&sourceTemplate=reviewMiddle.wmt
FY11 Ottawa NF Monitoring and Evaluation Report Page 45
Prasad, A. M., L. R. Iverson., S. Matthews., M. Peters. 2007-ongoing. A Climate Change Atlas
for 134 Forest Tree Species of the Eastern United States [database].
http://www.nrs.fs.fed.us/atlas/tree, Northern Research Station, USDA Forest Service, Delaware,
Ohio.
Pugh, Scott A.; Hansen, Mark H.; Pedersen, Lawrence D.; Heym, Douglas C.; Butler, Brett J.;
Crocker, Susan J.; Meneguzzo, Dacia; Perry, Charles H.; Haugen, David E.; Woodall,
Christopher; Jepsen, Ed. 2009. Michigan's Forests 2004. Resource Bulletin NRS-34. Newtown
Square, PA: U.S. Department of Agriculture, Forest Service, Northern Research Station. 210 p.
Ross, Stephen. 2011a. Black-backed Woodpecker Survey of the Eastern Ottawa National Forest,
10-20 May 2011.
Ross, Stephen. 2011b. Spruce Grouse Survey of the Eastern Ottawa National Forest, 10-20 May
2011, 23, 24 June 2011.
34d: Common loon – To what extent is forest management contributing or responding to the conservation of species of viability concern (such as Regional Forester’s Sensitive Species) and moving toward desired habitat conditions?
The common loon, Gavia immer, is currently a RFSS on the Ottawa. While loons are relatively
common in this region, especially in areas with suitable habitat, they are declining in Wisconsin
and listed as Threatened in Michigan. They are not federally listed under the Endangered Species
Act. The breeding populations of the loon in the Upper Great Lakes states (MI, MN, WI)
accounts for nearly half of the current US population, therefore, this region is considered a
conservation priority for species recovery.
The number of adult and fledged-aged loon chicks has been monitored on approximately an
average of 150 lakes on the Ottawa since 1982 to obtain data on territory occupancy. Since 2000,
this survey has been conducted in partnership with Common Coast Research and Conservation
(CCRC), an organization that has been studying loons in the western UP for more than 20 years.
The Ottawa also works with volunteer citizens, or loon rangers, from the Michigan Loon
Preservation Association. Loon rangers report yearly to area coordinators on loon nesting efforts
and protection needs on known territories on the Ottawa NF. This monitoring information
determines loon productivity and trends over time, as well as identifying lakes where adverse
impacts may be causing nest failure.
Loon productivity is estimated based on adults and chicks observed on the Ottawa; actual loon
population estimates are not determined. Survey effort and number of lakes surveyed have varied
greatly over the last 26 years (Figure 1); therefore, caution is needed when interpreting the data,
since fewer lakes were surveyed prior to the year 2000. Productivity has been based on the
number of fledged-aged chicks per lake surveyed. In 2010, the calculation for productivity was
changed to the number of fledge-aged chicks per loon territory in order to standardize our results
with other loon monitoring efforts. In addition, core lakes were established in order to help
determine reproductive trends given the great variation in survey efforts. Therefore, monitoring
efforts in 2010 focused on 81 historic territories that occurred on 72 core lakes. These lakes had
FY11 Ottawa NF Monitoring and Evaluation Report Page 46
been monitored for at least 20 of the 26 years and had shown a higher proportion of confirmed
breeding than other lakes that had been surveyed (Tischler 2011).
The Forest Plan includes the following guidelines: protection of loon nest sites and rearing
habitat; protection of loon nesting islands from disturbance from ice-off through July 15th
;
retention of natural shoreline buffers along lakes to protect habitat for loons and other species;
and support for efforts to reduce the use of lead fishing tackle, which is toxic to loons when
ingested (see Forest Plan, p. 2-33).
Gogebic, Iron, and Ontonagon Counties were designated as an Important Bird Area (IBA) by the
National Audubon Society (NAS) because of the abundant post-glacial lakes, which provide
essential habitat for the states densest population of breeding loons. The Ottawa makes up 85%
of this IBA (NAS 2012), suggesting high quality of loon habitat exists on the Forest. Many lakes
across the Ottawa do not have any private ownership and/or development, and likely contribute
to such remote quality loon habitat.
According to the IBA site description, few threats to the loon exist other than heavy metal
pollution of lakes. However, Tischler (2011) with Common Coast Research and Conservation
(CCRC), suggests potential threats specifically to loon habitat include habitat loss, human
disturbances, over-utilization by recreational users (that can negatively impact loon nesting
success), and lack of sufficient regulation on mercury and lead in fishing gear. The above FS
management guidelines may help reduce some of these potential threats to loon habitat, though
residential development and recreational use can be difficult to influence or control. At this time,
no new recreational facilities are planned for construction on the Ottawa, though some receive
basic maintenance or repairs (subject to Forest Plan protection guidelines).
The long-term average productivity on the Ottawa NF, measured from 1985 to 2010, is 0.39
chicks/lake surveyed (Tischler 2011). Among core lakes, the average annual productivity from
1985 to 2010 is 0.49 chicks/core lake surveyed. Over the last few years, productivity has
fluctuated slightly though remained relatively stable when compared to the long-term trend
(Figure 12).
In 2011, 48 fledged loon chicks were recorded on 172 lakes, supporting 137 known loon
territories (Figure 13: Ottawa NF long-term fledged-aged juvenile loon abundance (solid line,
blue squares) and survey effort (dotted line) [from the annual monitoring report, Tischler 2012].
Years lacking sufficient data are excluded.). In 2011, loon productivity was 0.28 chicks/lake
surveyed and 0.34 chicks/core lakes surveyed; both lower than the long-term average (0.39
chicks/lake surveyed) (Figure 14). The new measure of productivity per territory (0.35
chicks/territory) was lower in 2011 than in 2010 (0.47 chicks/ territory) (see red line, Figure 14).
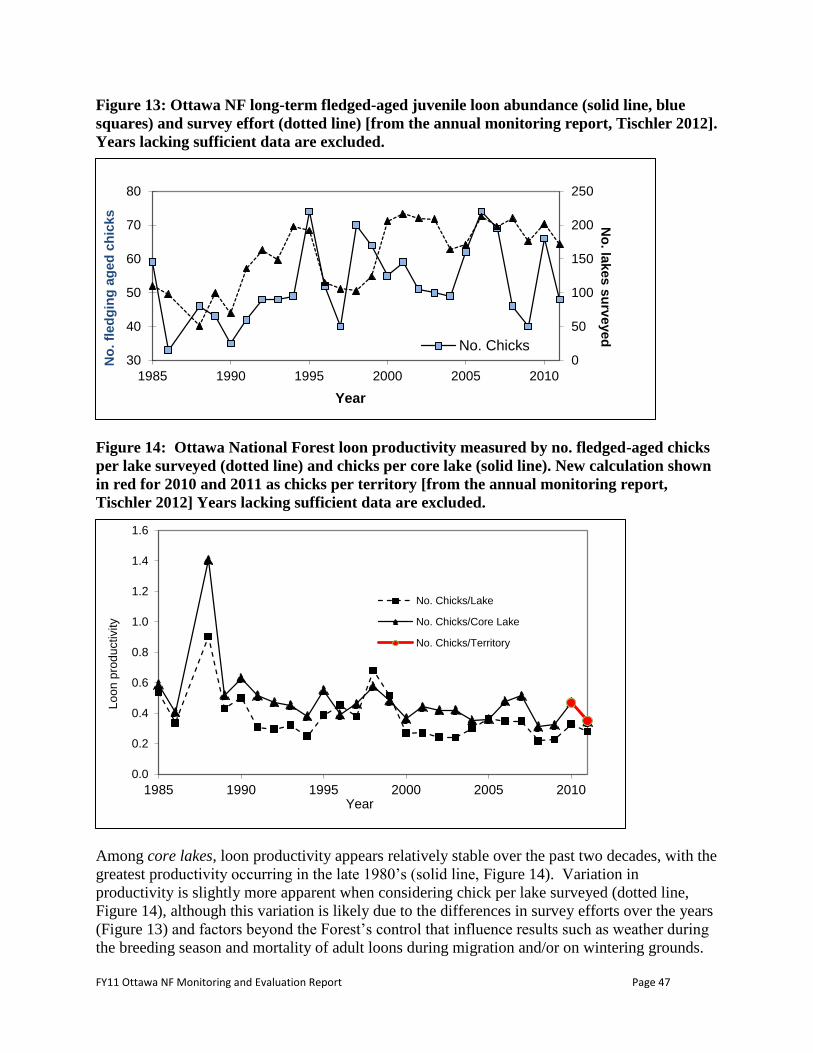
FY11 Ottawa NF Monitoring and Evaluation Report Page 47
Figure 13: Ottawa NF long-term fledged-aged juvenile loon abundance (solid line, blue
squares) and survey effort (dotted line) [from the annual monitoring report, Tischler 2012].
Years lacking sufficient data are excluded.
Figure 14: Ottawa National Forest loon productivity measured by no. fledged-aged chicks
per lake surveyed (dotted line) and chicks per core lake (solid line). New calculation shown
in red for 2010 and 2011 as chicks per territory [from the annual monitoring report,
Tischler 2012] Years lacking sufficient data are excluded.
Among core lakes, loon productivity appears relatively stable over the past two decades, with the
greatest productivity occurring in the late 1980’s (solid line, Figure 14). Variation in
productivity is slightly more apparent when considering chick per lake surveyed (dotted line,
Figure 14), although this variation is likely due to the differences in survey efforts over the years
(Figure 13) and factors beyond the Forest’s control that influence results such as weather during
the breeding season and mortality of adult loons during migration and/or on wintering grounds.
0
50
100
150
200
250
30
40
50
60
70
80
1985 1990 1995 2000 2005 2010
No
. lakes s
urv
eyed
No
. fl
ed
gin
g a
ged
ch
icks
Year
No. Chicks
0.0
0.2
0.4
0.6
0.8
1.0
1.2
1.4
1.6
1985 1990 1995 2000 2005 2010
Lo
on
pro
du
ctivity
Year
No. Chicks/Lake
No. Chicks/Core Lake
No. Chicks/Territory

FY11 Ottawa NF Monitoring and Evaluation Report Page 48
As discussed earlier, results from core lakes likely provide a more accurate trend of reproductive
success of Ottawa loons (Figure 2).
The long-term average productivity among core lakes (0.49 chicks/core lake) is nearly the same
as the average (0.48 chicks/territory) considered necessary to sustain breeding populations
(Tischler 2011), suggesting a rather stable and healthy breeding population. However, the
average of all loon territories in the United States (0.53) is greater, suggesting the loon
population on the Ottawa still remains slightly lower than the North America average population
(Tischler 2011).
Productivity was generally lower in 2011 across the region, including the Seney National
Wildlife refuge, East-central UP, Isle Royale, and Northern WI. Tischler (2012) suggests this
may be due to a combination of late ice-off of northern lakes in the spring of 2011 and how black
fly activity peaked during nesting. The loon is the only host to this parasitic fly (Simulium
annulus), which can cause nest abandonment (Tischler 2012). Tischler suggests (2012) low
average productivity of loons within the Ottawa NF may also be due to human factors including
land-use changes, fluctuating water levels, contaminants and recreational disturbances. The
survival of adults is a major factor in the viability of these long-lived species. Threats to adults
can include entanglement in fishing gear, lead or mercury poisoning, type E botulism, oil spills
on wintering grounds, and disease, much of which cannot be controlled by the Forest Service.
Nesting platforms can be an effective management tool and help reduce predation and minimize
impacts from changing water levels. Placement of buoys around known nesting locations or
platforms can also improve reproductive success and help increase awareness to recreational
users (Tischler 2012). The Forest currently has 20 artificial nesting platforms placed on the
Ottawa. Buoys are also placed around six nesting platforms and three natural nesting locations.
Whether productivity has increased because of these tools is not known at this time. However,
the change in productivity calculations will help improve our ability to monitor the trend in
platform and buoy use. In the Sylvania Wilderness Area, seasonal closures discourage people
from using islands from ice-off through July 15.
In 2011, the USFS received funding from the Great Lakes Restoration Initiative (GLRI) and
requested a Conservation Assessment (CA) for the loon, prepared by CCRC. This CA
summarizes the status, distribution, ecology, threats, and population biology of loons in the great
lakes region (Tischler 2011b). The GLRI funding was also used to design and print new
educational signs, which replaced older signs, and were placed at boat landings on over 20 lakes
with known loon territories to increase awareness on the impact of human disturbance to loon
nesting. An educational presentation has also been scheduled for the public in collaboration with
our partner, CCRC, during the summer of 2012, to help increase loon awareness, discuss the
impact of human-disturbances on loons, and discus how lead-tackle can impact loons and other
birds of prey. Such educational efforts will help indirectly fulfill all forest objectives.
The Ottawa will continue to protect loons and loon habitat through efforts described above under
Forest Plan Objectives and will continue working with Common Coast Research and
Conservation and the Michigan Loon Preservation Association to monitor loon-breeding success
on the Forest. Information gathered will help address threats to loons and loon habitat, help us
continue public awareness on loons.
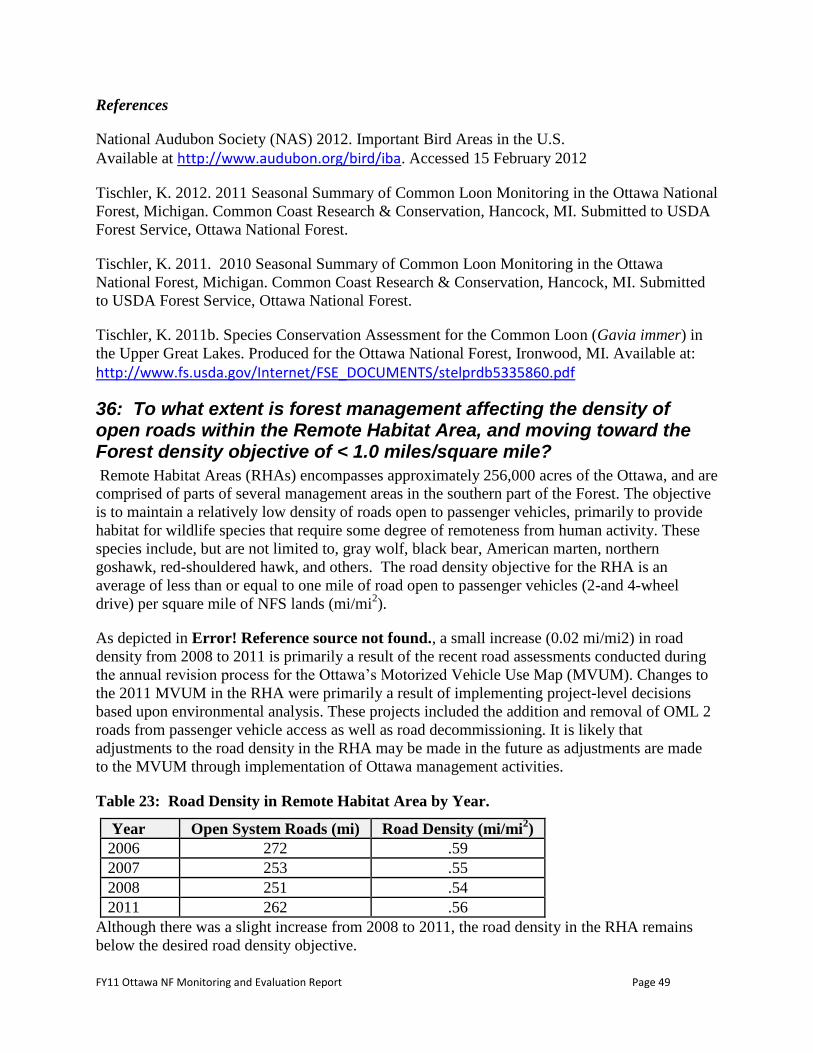
FY11 Ottawa NF Monitoring and Evaluation Report Page 49
References
National Audubon Society (NAS) 2012. Important Bird Areas in the U.S.
Available at http://www.audubon.org/bird/iba. Accessed 15 February 2012
Tischler, K. 2012. 2011 Seasonal Summary of Common Loon Monitoring in the Ottawa National
Forest, Michigan. Common Coast Research & Conservation, Hancock, MI. Submitted to USDA
Forest Service, Ottawa National Forest.
Tischler, K. 2011. 2010 Seasonal Summary of Common Loon Monitoring in the Ottawa
National Forest, Michigan. Common Coast Research & Conservation, Hancock, MI. Submitted
to USDA Forest Service, Ottawa National Forest.
Tischler, K. 2011b. Species Conservation Assessment for the Common Loon (Gavia immer) in
the Upper Great Lakes. Produced for the Ottawa National Forest, Ironwood, MI. Available at:
http://www.fs.usda.gov/Internet/FSE_DOCUMENTS/stelprdb5335860.pdf
36: To what extent is forest management affecting the density of open roads within the Remote Habitat Area, and moving toward the Forest density objective of < 1.0 miles/square mile?
Remote Habitat Areas (RHAs) encompasses approximately 256,000 acres of the Ottawa, and are
comprised of parts of several management areas in the southern part of the Forest. The objective
is to maintain a relatively low density of roads open to passenger vehicles, primarily to provide
habitat for wildlife species that require some degree of remoteness from human activity. These
species include, but are not limited to, gray wolf, black bear, American marten, northern
goshawk, red-shouldered hawk, and others. The road density objective for the RHA is an
average of less than or equal to one mile of road open to passenger vehicles (2-and 4-wheel
drive) per square mile of NFS lands (mi/mi2).
As depicted in Error! Reference source not found., a small increase (0.02 mi/mi2) in road
density from 2008 to 2011 is primarily a result of the recent road assessments conducted during
the annual revision process for the Ottawa’s Motorized Vehicle Use Map (MVUM). Changes to
the 2011 MVUM in the RHA were primarily a result of implementing project-level decisions
based upon environmental analysis. These projects included the addition and removal of OML 2
roads from passenger vehicle access as well as road decommissioning. It is likely that
adjustments to the road density in the RHA may be made in the future as adjustments are made
to the MVUM through implementation of Ottawa management activities.
Table 23: Road Density in Remote Habitat Area by Year.
Year Open System Roads (mi) Road Density (mi/mi2)
2006 272 .59
2007 253 .55
2008 251 .54
2011 262 .56
Although there was a slight increase from 2008 to 2011, the road density in the RHA remains
below the desired road density objective.
FY11 Ottawa NF Monitoring and Evaluation Report Page 50
37: To what extent is forest management contributing to the development and maintenance of foraging and denning habitat, and connectivity of habitats for Canada lynx?
Historically, lynx occurred primarily in the boreal forest, sub-boreal and western montane forests
of North America, and mixed coniferous/deciduous forests of southern Canada, the Lake States
and New England. Lynx habitat or territory can be characterized as having areas of mature
forests with downed logs and windfalls to provide cover for denning sites, and escape and
protection from severe weather. Early successional forest stages provide habitat for the lynx's
primary prey, the snowshoe hare. Lynx and snowshoe hare populations increase and decline
dramatically in approximately 10-year cycles. When the snowshoe hare population crashes in
the boreal forest regions of Canada, lynx tend to disperse southward, often times reaching the
northern tier of states in the United States.
Canada lynx are classified as federally threatened throughout the contiguous United States, and
listed as endangered by the State of Michigan. There have been no verified records of Canada
lynx presence in the western UP since the early 1960s, however there was a recent record of a
lynx in Michigan occurred on the eastern end of the UP (Mackinac County) in November 2003.
The animal was caught accidentally in a leg hold trap and released unharmed. Other possible
lynx occurrences have been reported on or near the Ottawa over the last several years. However,
not enough evidence has been available to verify these reports.
Lynx immigrating into the UP continues to be a possibility based on the historic irruptions of the
hare cycle and reactive lynx populations in Canada and Minnesota. As a result, the Ottawa’s
strategy contained in the Forest Plan is to provide favorable dispersal conditions for potentially
immigrating lynx. However, it is unlikely that lynx will establish a permanent population in the
UP due to several factors. These factors include poor habitat quality, low snowshoe hare
densities, competing predators, and sub-optimal snow conditions (USDA Forest Service, 2005).
The primary objective of this strategy is to provide suitable habitat for the main prey for lynx
(snowshoe hare) through proactive management activities. Clearcutting is the predominate
method to regenerate aspen and mixed aspen forested stands. Conifer stands are most often
clearcut and allowed to regenerate naturally or re-planted with trees.
Analysis of lynx habitat centers on some key habitat components that constitute potential habitat.
These components are foraging habitat (prey habitat), denning habitat, acreage and connectivity
of suitable habitats, and human disturbance. Because there is no direct evidence of lynx in the
Upper Peninsula, productivity, mortality, competition and regional landscape factors are not
relevant at this time.
The Ottawa Forest Plan includes goals and objectives applicable to the components of lynx
foraging and denning habitat. These habitat components pertain to habitat conditions for the
production of prey species such as snowshoe hare and ruffed grouse. The Forest Plan also
contains direction to maintain habitat connectivity for lynx dispersal across the Ottawa. In
addition, Forest Plan direction to provide a remote habitat area also benefits species sensitive to
human intrusion, like Canada lynx (Forest Plan, pp. 2-9 and 2-29).
FY11 Ottawa NF Monitoring and Evaluation Report Page 51
The Forest Plan gives some specific guidelines and objectives for habitat maintenance on the
Ottawa’s forested land base. Those guidelines are as follows: (Forest Plan p. 2-30)
Maintain approximately 90,000 acres of aspen for foraging habitat, and 25% of this
acreage in the 5- to 20-year age class;
Maintain approximately 10,000 acres of jack pine foraging habitat, and 30% in the 10- to
30-year age class;
Maintain at least 91,000 acres of lowland conifer types as lynx foraging habitat; and
Maintain approximately 10,000 acres of spruce/fir-aspen forest type for foraging habitat
and maintain approximately 30% in the 10- to 40-year age class.
Through direct and indirect management, the Ottawa has continued to exceed the amount of the
key habitat components maintained on its land base for Canada lynx (Table 24). Winter mammal
tracking continued in 2011 as part of the Ottawa’s ongoing monitoring program. No lynx have
been detected during these surveys. Although the Ottawa and the Michigan Department of
Natural Resources (MDNR) collect extensive information through public contacts and the State’s
predator trapping season reports, there were no verified reports of lynx present in the UP
received in 2011. This data has extensive geographic coverage and has been collected over
several years. At this time, it is unlikely that there is a resident lynx population in the western
UP based on the data gathered by the Ottawa and MDNR.
Table 24: Canada Lynx Habitat Guidelines, Objectives, and Actual Outputs.
Lynx Habitat
Maintenance
Guidelines
Management Objectives Actual Acreage Maintained
Aspen 90,000 Acres total with 22,500
Acres (25%) in the 5 to 20 year
class
192,400 Acres total with 27,000
Acres in the 5 to 20 year class
Jack Pine 10,000 Acres total with 3,000
Acres (30%) in the 10 to 30 year
class
16,700 Acres total with 4,500
Acres in the 10 to 30 year class
Lowland Conifer 91,000 Acres Total 142,200 Acres Total
Spruce/Fir/Aspen 10,000 Acres total with 3,000
Acres (30%) in the 5 to 20 year
class
48,900 Acres total with 4,300
Acres in the 5 to 20 year class
40: To what extent has land ownership adjustment facilitated forest management activities?
This topic was last addressed in the previous FY 2008 M&E Report (USDA Forest Service,
2009, see page 39). There have been 2 major land adjustments since the last report, both of
which are purchases. These have facilitated forest management activities through consolidated
ownership, eliminating boundary maintenance, and reducing special use permits needed.
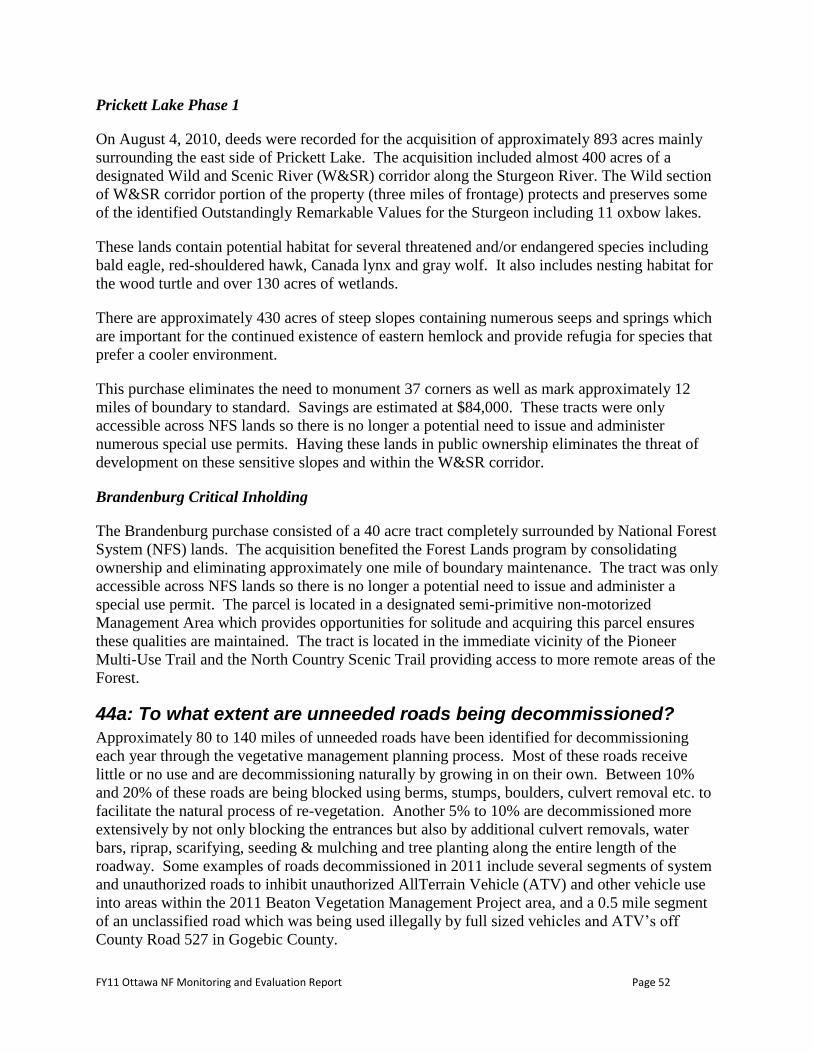
FY11 Ottawa NF Monitoring and Evaluation Report Page 52
Prickett Lake Phase 1
On August 4, 2010, deeds were recorded for the acquisition of approximately 893 acres mainly
surrounding the east side of Prickett Lake. The acquisition included almost 400 acres of a
designated Wild and Scenic River (W&SR) corridor along the Sturgeon River. The Wild section
of W&SR corridor portion of the property (three miles of frontage) protects and preserves some
of the identified Outstandingly Remarkable Values for the Sturgeon including 11 oxbow lakes.
These lands contain potential habitat for several threatened and/or endangered species including
bald eagle, red-shouldered hawk, Canada lynx and gray wolf. It also includes nesting habitat for
the wood turtle and over 130 acres of wetlands.
There are approximately 430 acres of steep slopes containing numerous seeps and springs which
are important for the continued existence of eastern hemlock and provide refugia for species that
prefer a cooler environment.
This purchase eliminates the need to monument 37 corners as well as mark approximately 12
miles of boundary to standard. Savings are estimated at $84,000. These tracts were only
accessible across NFS lands so there is no longer a potential need to issue and administer
numerous special use permits. Having these lands in public ownership eliminates the threat of
development on these sensitive slopes and within the W&SR corridor.
Brandenburg Critical Inholding
The Brandenburg purchase consisted of a 40 acre tract completely surrounded by National Forest
System (NFS) lands. The acquisition benefited the Forest Lands program by consolidating
ownership and eliminating approximately one mile of boundary maintenance. The tract was only
accessible across NFS lands so there is no longer a potential need to issue and administer a
special use permit. The parcel is located in a designated semi-primitive non-motorized
Management Area which provides opportunities for solitude and acquiring this parcel ensures
these qualities are maintained. The tract is located in the immediate vicinity of the Pioneer
Multi-Use Trail and the North Country Scenic Trail providing access to more remote areas of the
Forest.
44a: To what extent are unneeded roads being decommissioned?
Approximately 80 to 140 miles of unneeded roads have been identified for decommissioning
each year through the vegetative management planning process. Most of these roads receive
little or no use and are decommissioning naturally by growing in on their own. Between 10%
and 20% of these roads are being blocked using berms, stumps, boulders, culvert removal etc. to
facilitate the natural process of re-vegetation. Another 5% to 10% are decommissioned more
extensively by not only blocking the entrances but also by additional culvert removals, water
bars, riprap, scarifying, seeding & mulching and tree planting along the entire length of the
roadway. Some examples of roads decommissioned in 2011 include several segments of system
and unauthorized roads to inhibit unauthorized AllTerrain Vehicle (ATV) and other vehicle use
into areas within the 2011 Beaton Vegetation Management Project area, and a 0.5 mile segment
of an unclassified road which was being used illegally by full sized vehicles and ATV’s off
County Road 527 in Gogebic County.
FY11 Ottawa NF Monitoring and Evaluation Report Page 53
Additional Monitoring Information
Regional Forester’s Sensitive Species (RFSS) List Update
The Eastern Region revised its Regional Forester’s Sensitive Species List in December 2011.
The last major revision was completed in 2000, although some minor updates have occurred
every year or two since then. The following accounting includes changes made to the RFSS list
since the last update was provided in the 2010 Monitoring and Evaluation Report.
After risk evaluation of all RFSS and potential RFSS species, some are no longer on the RFSS
list (due to improved species status, revised estimates of threats, or lack of habitat on the Ottawa
National Forest) including: northern goshawk, black tern, trumpeter swan, American peregrine
falcon, Rocky Mountain sedge, Farewell’s water-milfoil, one-flowered broomrape, and heart-
leaved foam-flower). Some species were updated to reflect current scientific and common
names.
There were two bat species added to the list (northern myotis and little brown bat). Elsewhere in
the Eastern Region, white-nose syndrome continues to affect populations of the little brown bat,
northern bat and tri-colored bat. Regionally, the decision was made to pre-emptively list these
three bats as RFSS where they occur in Region 9 (tri-colored bat was already listed as sensitive
on the Ottawa). The disease continues to spread and it is anticipated population effects will
follow. The gray wolf and bald eagle were also added to the list, per Forest Service policy, after
de-listings under the Endangered Species Act (eagle and wolf will remain an RFSS for at least
five years after delisting per FS policy). Other species added include two butterflies, chryxus
arctic and tawny crescent, and the northern barrens tiger beetle. Ten vascular plants were added
(Mingan moonwort, least grapefern, greater yellow and showy lady’s-slippers, white fawnlily,
Virginia bugleweed, small yellow water-crowfoot, snowy campion, strict blue-eyed grass, and
meadow zizia).
The Forest Service is directed to ensure the viability of sensitive species and preclude trends
toward listing under the Endangered Species Act. The Forest Plan includes management
objectives for populations and/or habitats of sensitive species.
Monitoring of Forest Roads and Off-Highway Vehicle Use (OHV)
In FY12 the Ottawa National Forest assigned an interdisciplinary OHV Steering Team to
develop a monitoring and implementation plan for implementing the Travel Management Rule
(TMR) on the Ottawa National Forest. The TMR involves designating a system of trails and
roads open for motor vehicle use. In 2006, the Forest Plan Record of Decision implemented the
TMR on the Ottawa National Forest by closing the Forest to cross-country travel by motor
vehicles. In 2007, the Ottawa published the first MVUM to designate the trails and roads that
are open to motor vehicle use (either by passenger vehicles or off-highway vehicles). Since
2007, the Forest has continued to refine and improve the MVUM based on current needs and
resource conditions. In the FY10 M&E Report it was noted that a monitoring strategy to better
understand the effects and use of the Forest by OHVs was needed. In the spring of 2012, the
Team completed a monitoring strategy that will be implemented in the summer of 2012 and the
results are to be reported in the FY12, 5-Year M&E report.

FY11 Ottawa NF Monitoring and Evaluation Report Page 54
Future Monitoring Needs Monitoring needs for 2012 have been outlined in the 2012 Monitoring Workplan (see Appendix
1 of this document for a listing of Monitoring Items expected to be addressed in 2012). As in
previous years, the workplan was developed with an interdisciplinary review of the monitoring
questions in the Forest Plan Monitoring Guide. The review included prioritization of monitoring
items included in each year’s monitoring plan and uses criteria such as requirement by law or
regulation, ecological significance, management significance or response to a key issue. In
FY12 assessment will be done to determine the need to update and revise the monitoring plan to
address current questions or concerns identified through five years of monitoring progress
towards achieving the goals and objectives of the Ottawa Forest Plan. In addition, in FY12 we
will begin to update the Monitoring Plan to meet the monitoring requirements within the 2012
Planning Rule (36 CFR 219.12).
Preparers The following Ottawa National Forest employees have contributed to this report.
Name Title
Bill Baer Recreation Program Manager
Brian Bogaczyk Wildlife Biologist
Dave Dillman Wildlife Biologist
Lauren Hildebrandt Wildlife Biologist
Ben Toole Wildlife Technician
Susan Davis Resource Specialist
Joel Enking Land and Minerals Program Manager
Ellen Lesch Aquatic Ecologist
Christine Handler Forest Planner
Len Scuffham Timber/Silviculture Program Manager
Dave Steffensen Silviculturist
Susan Trull Botanist
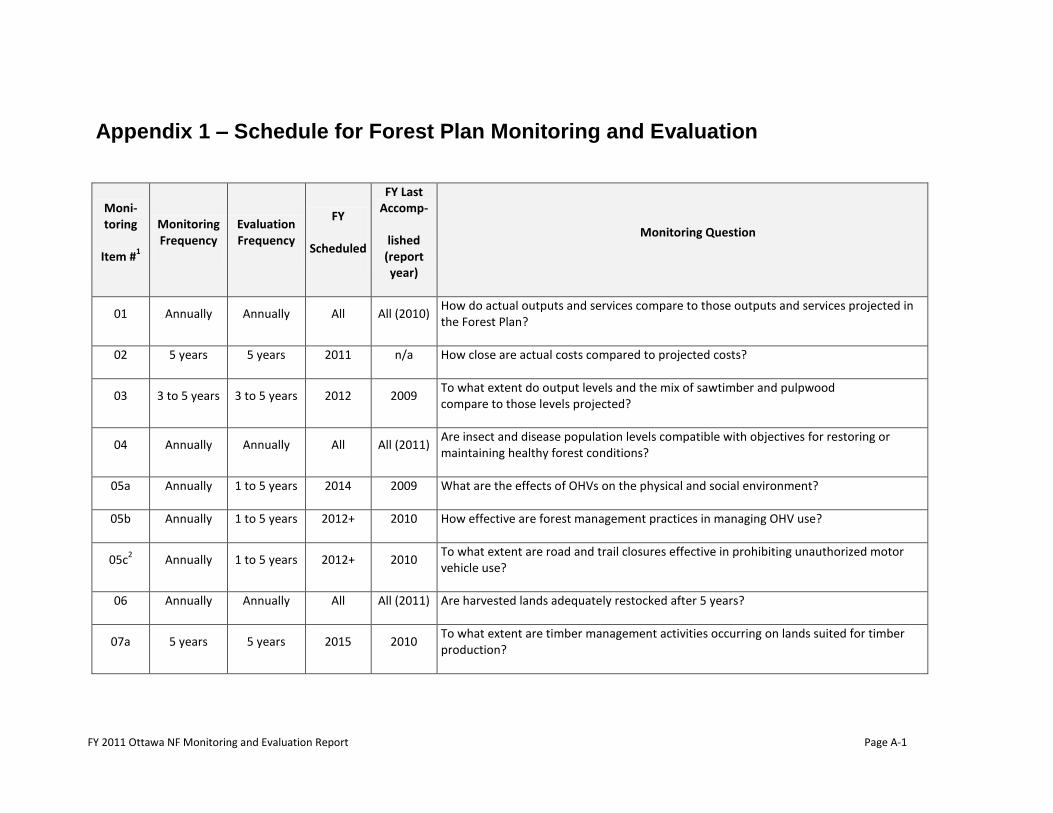
FY 2011 Ottawa NF Monitoring and Evaluation Report Page A-1
Appendix 1 – Schedule for Forest Plan Monitoring and Evaluation
Moni-toring
Item #1
Monitoring Frequency
Evaluation Frequency
FY
Scheduled
FY Last Accomp-
lished (report year)
Monitoring Question
01 Annually Annually All All (2010) How do actual outputs and services compare to those outputs and services projected in the Forest Plan?
02 5 years 5 years 2011 n/a How close are actual costs compared to projected costs?
03 3 to 5 years 3 to 5 years 2012 2009 To what extent do output levels and the mix of sawtimber and pulpwood compare to those levels projected?
04 Annually Annually All All (2011) Are insect and disease population levels compatible with objectives for restoring or maintaining healthy forest conditions?
05a Annually 1 to 5 years 2014 2009 What are the effects of OHVs on the physical and social environment?
05b Annually 1 to 5 years 2012+ 2010 How effective are forest management practices in managing OHV use?
05c2
Annually 1 to 5 years 2012+ 2010 To what extent are road and trail closures effective in prohibiting unauthorized motor vehicle use?
06 Annually Annually All All (2011) Are harvested lands adequately restocked after 5 years?
07a 5 years 5 years 2015 2010 To what extent are timber management activities occurring on lands suited for timber production?
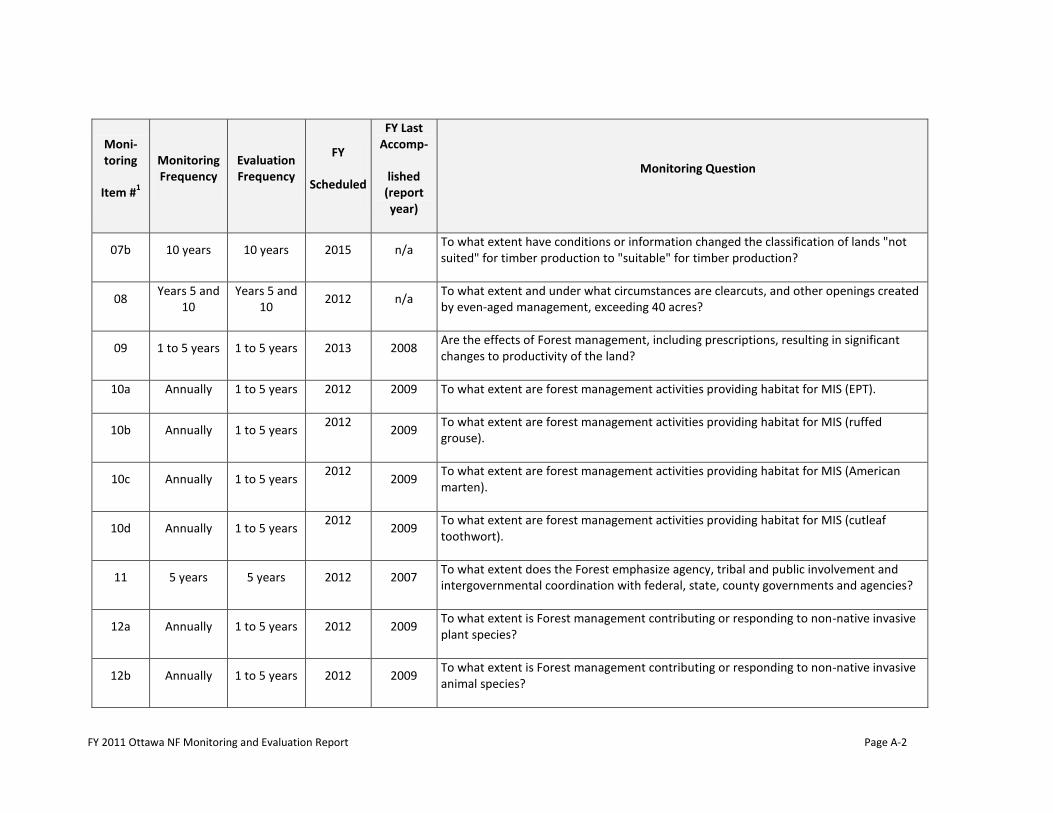
FY 2011 Ottawa NF Monitoring and Evaluation Report Page A-2
Moni-toring
Item #1
Monitoring Frequency
Evaluation Frequency
FY
Scheduled
FY Last Accomp-
lished (report year)
Monitoring Question
07b 10 years 10 years 2015 n/a To what extent have conditions or information changed the classification of lands "not suited" for timber production to "suitable" for timber production?
08 Years 5 and
10 Years 5 and
10 2012 n/a
To what extent and under what circumstances are clearcuts, and other openings created by even-aged management, exceeding 40 acres?
09 1 to 5 years 1 to 5 years 2013 2008 Are the effects of Forest management, including prescriptions, resulting in significant changes to productivity of the land?
10a Annually 1 to 5 years 2012 2009 To what extent are forest management activities providing habitat for MIS (EPT).
10b Annually 1 to 5 years 2012
2009 To what extent are forest management activities providing habitat for MIS (ruffed grouse).
10c Annually 1 to 5 years 2012
2009 To what extent are forest management activities providing habitat for MIS (American marten).
10d Annually 1 to 5 years 2012
2009 To what extent are forest management activities providing habitat for MIS (cutleaf toothwort).
11 5 years 5 years 2012 2007 To what extent does the Forest emphasize agency, tribal and public involvement and intergovernmental coordination with federal, state, county governments and agencies?
12a Annually 1 to 5 years 2012 2009 To what extent is Forest management contributing or responding to non-native invasive plant species?
12b Annually 1 to 5 years 2012 2009 To what extent is Forest management contributing or responding to non-native invasive animal species?
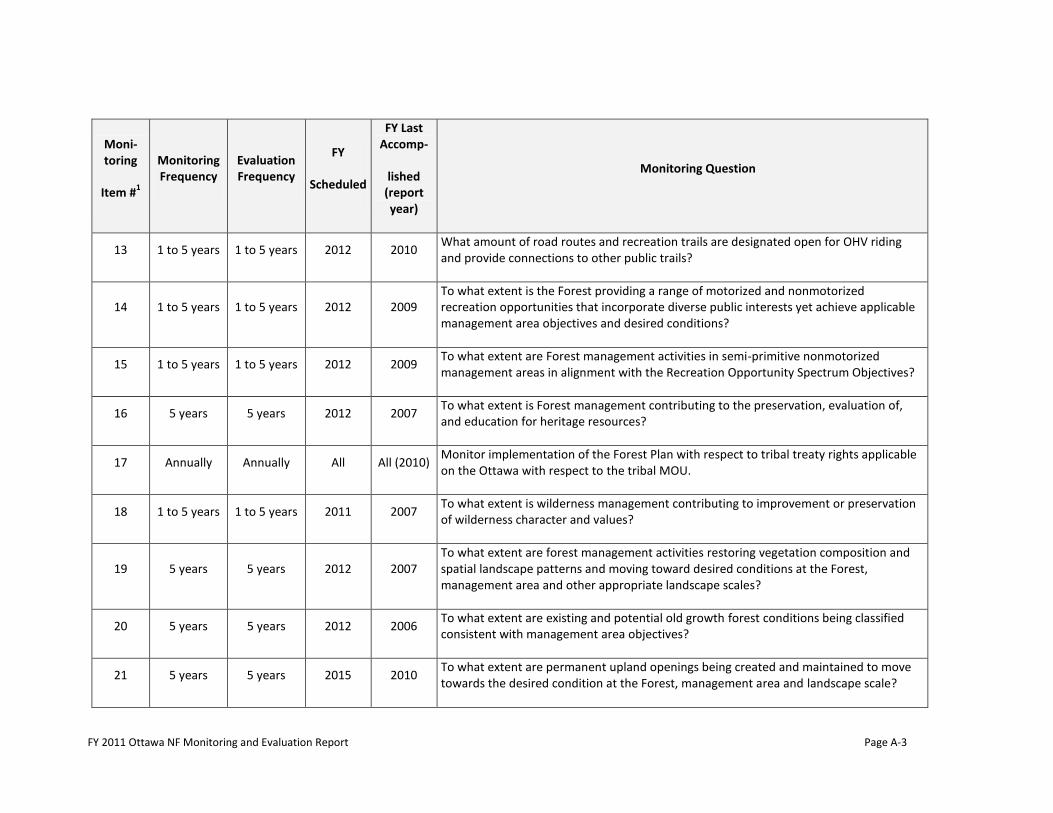
FY 2011 Ottawa NF Monitoring and Evaluation Report Page A-3
Moni-toring
Item #1
Monitoring Frequency
Evaluation Frequency
FY
Scheduled
FY Last Accomp-
lished (report year)
Monitoring Question
13 1 to 5 years 1 to 5 years 2012 2010 What amount of road routes and recreation trails are designated open for OHV riding and provide connections to other public trails?
14 1 to 5 years 1 to 5 years 2012 2009 To what extent is the Forest providing a range of motorized and nonmotorized recreation opportunities that incorporate diverse public interests yet achieve applicable management area objectives and desired conditions?
15 1 to 5 years 1 to 5 years 2012 2009 To what extent are Forest management activities in semi-primitive nonmotorized management areas in alignment with the Recreation Opportunity Spectrum Objectives?
16 5 years 5 years 2012 2007 To what extent is Forest management contributing to the preservation, evaluation of, and education for heritage resources?
17 Annually Annually All All (2010) Monitor implementation of the Forest Plan with respect to tribal treaty rights applicable on the Ottawa with respect to the tribal MOU.
18 1 to 5 years 1 to 5 years 2011 2007 To what extent is wilderness management contributing to improvement or preservation of wilderness character and values?
19 5 years 5 years 2012 2007 To what extent are forest management activities restoring vegetation composition and spatial landscape patterns and moving toward desired conditions at the Forest, management area and other appropriate landscape scales?
20 5 years 5 years 2012 2006 To what extent are existing and potential old growth forest conditions being classified consistent with management area objectives?
21 5 years 5 years 2015 2010 To what extent are permanent upland openings being created and maintained to move towards the desired condition at the Forest, management area and landscape scale?
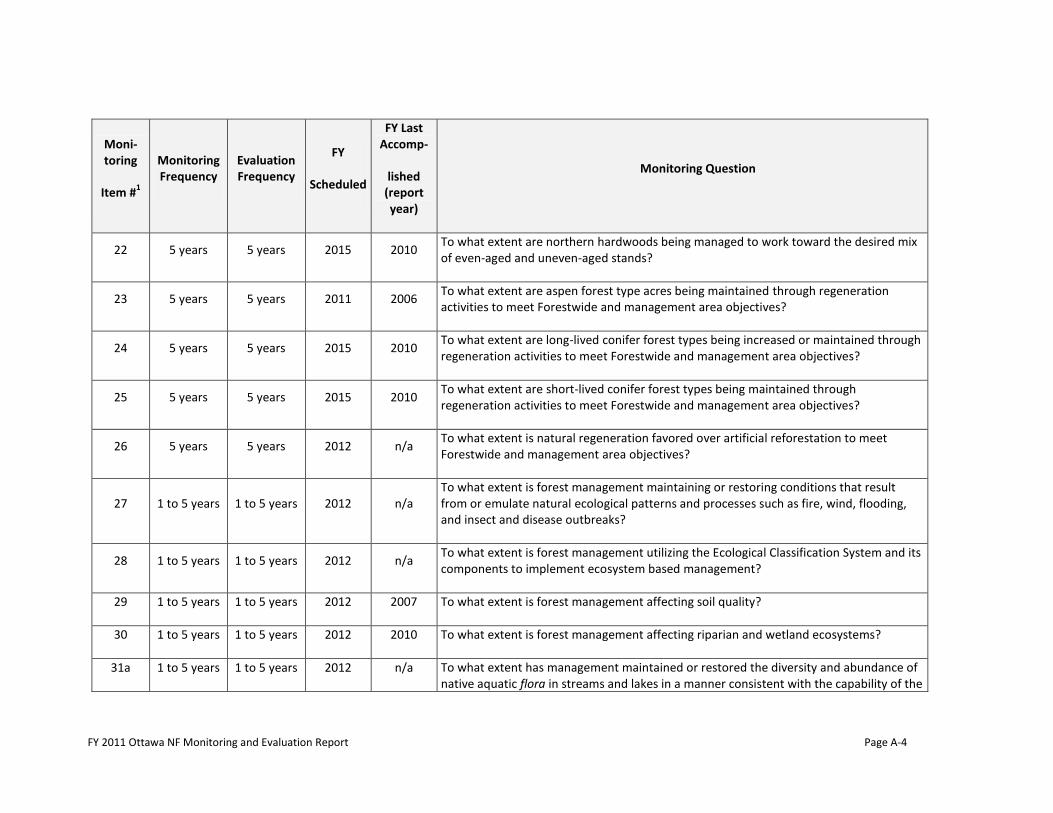
FY 2011 Ottawa NF Monitoring and Evaluation Report Page A-4
Moni-toring
Item #1
Monitoring Frequency
Evaluation Frequency
FY
Scheduled
FY Last Accomp-
lished (report year)
Monitoring Question
22 5 years 5 years 2015 2010 To what extent are northern hardwoods being managed to work toward the desired mix of even-aged and uneven-aged stands?
23 5 years 5 years 2011 2006 To what extent are aspen forest type acres being maintained through regeneration activities to meet Forestwide and management area objectives?
24 5 years 5 years 2015 2010 To what extent are long-lived conifer forest types being increased or maintained through regeneration activities to meet Forestwide and management area objectives?
25 5 years 5 years 2015 2010 To what extent are short-lived conifer forest types being maintained through regeneration activities to meet Forestwide and management area objectives?
26 5 years 5 years 2012 n/a To what extent is natural regeneration favored over artificial reforestation to meet Forestwide and management area objectives?
27 1 to 5 years 1 to 5 years 2012 n/a To what extent is forest management maintaining or restoring conditions that result from or emulate natural ecological patterns and processes such as fire, wind, flooding, and insect and disease outbreaks?
28 1 to 5 years 1 to 5 years 2012 n/a To what extent is forest management utilizing the Ecological Classification System and its components to implement ecosystem based management?
29 1 to 5 years 1 to 5 years 2012 2007 To what extent is forest management affecting soil quality?
30 1 to 5 years 1 to 5 years 2012 2010 To what extent is forest management affecting riparian and wetland ecosystems?
31a 1 to 5 years 1 to 5 years 2012 n/a To what extent has management maintained or restored the diversity and abundance of native aquatic flora in streams and lakes in a manner consistent with the capability of the
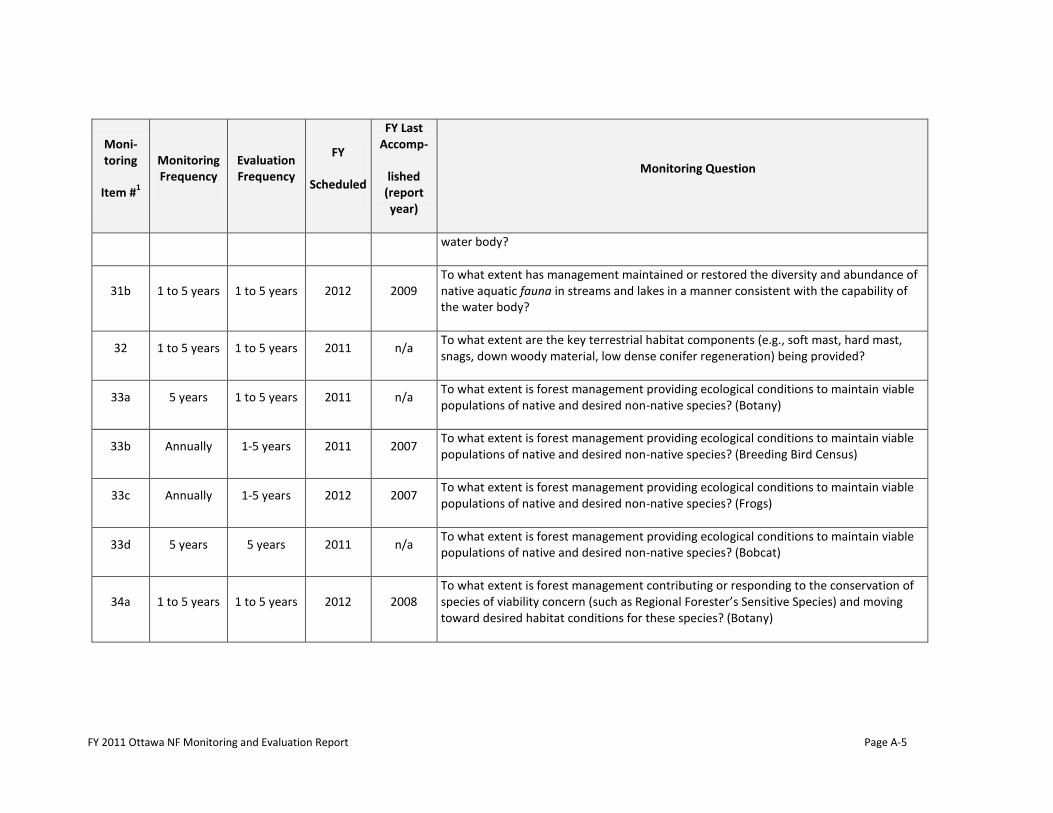
FY 2011 Ottawa NF Monitoring and Evaluation Report Page A-5
Moni-toring
Item #1
Monitoring Frequency
Evaluation Frequency
FY
Scheduled
FY Last Accomp-
lished (report year)
Monitoring Question
water body?
31b 1 to 5 years 1 to 5 years 2012 2009 To what extent has management maintained or restored the diversity and abundance of native aquatic fauna in streams and lakes in a manner consistent with the capability of the water body?
32 1 to 5 years 1 to 5 years 2011 n/a To what extent are the key terrestrial habitat components (e.g., soft mast, hard mast, snags, down woody material, low dense conifer regeneration) being provided?
33a 5 years 1 to 5 years 2011 n/a To what extent is forest management providing ecological conditions to maintain viable populations of native and desired non-native species? (Botany)
33b Annually 1-5 years 2011 2007 To what extent is forest management providing ecological conditions to maintain viable populations of native and desired non-native species? (Breeding Bird Census)
33c Annually 1-5 years 2012 2007 To what extent is forest management providing ecological conditions to maintain viable populations of native and desired non-native species? (Frogs)
33d 5 years 5 years 2011 n/a To what extent is forest management providing ecological conditions to maintain viable populations of native and desired non-native species? (Bobcat)
34a 1 to 5 years 1 to 5 years 2012 2008 To what extent is forest management contributing or responding to the conservation of species of viability concern (such as Regional Forester’s Sensitive Species) and moving toward desired habitat conditions for these species? (Botany)
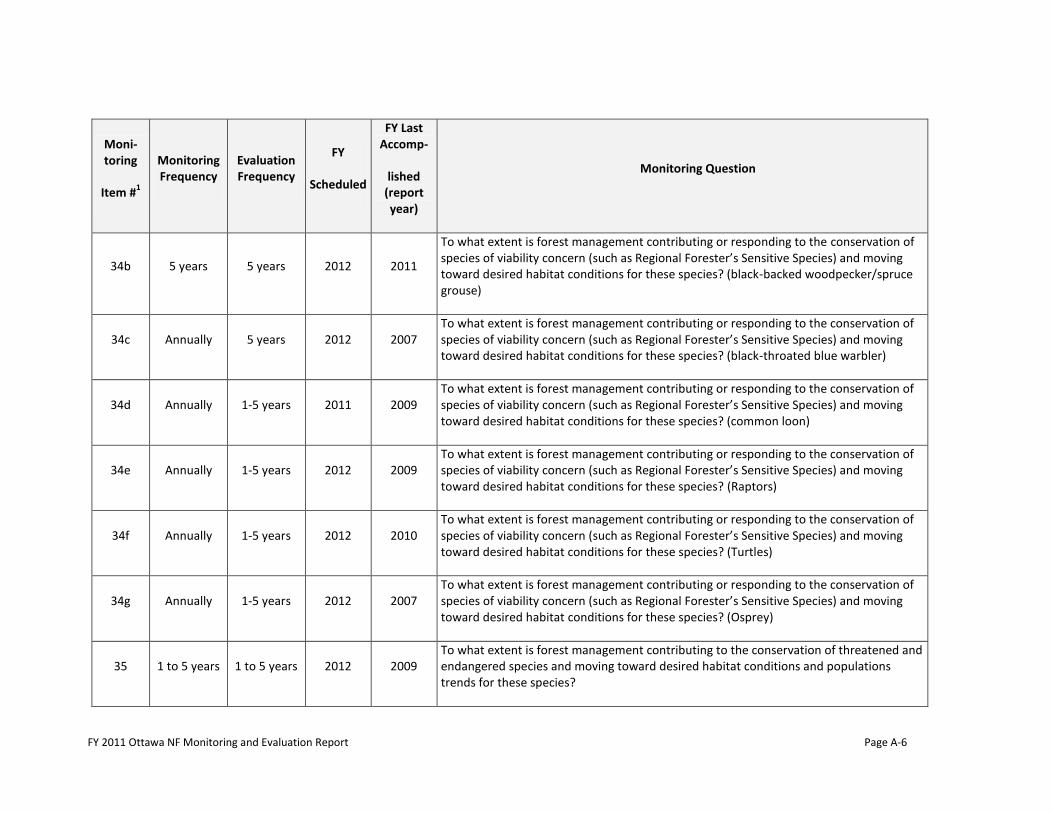
FY 2011 Ottawa NF Monitoring and Evaluation Report Page A-6
Moni-toring
Item #1
Monitoring Frequency
Evaluation Frequency
FY
Scheduled
FY Last Accomp-
lished (report year)
Monitoring Question
34b 5 years 5 years 2012 2011
To what extent is forest management contributing or responding to the conservation of species of viability concern (such as Regional Forester’s Sensitive Species) and moving toward desired habitat conditions for these species? (black-backed woodpecker/spruce grouse)
34c Annually 5 years 2012 2007 To what extent is forest management contributing or responding to the conservation of species of viability concern (such as Regional Forester’s Sensitive Species) and moving toward desired habitat conditions for these species? (black-throated blue warbler)
34d Annually 1-5 years 2011 2009 To what extent is forest management contributing or responding to the conservation of species of viability concern (such as Regional Forester’s Sensitive Species) and moving toward desired habitat conditions for these species? (common loon)
34e Annually 1-5 years 2012 2009 To what extent is forest management contributing or responding to the conservation of species of viability concern (such as Regional Forester’s Sensitive Species) and moving toward desired habitat conditions for these species? (Raptors)
34f Annually 1-5 years 2012 2010 To what extent is forest management contributing or responding to the conservation of species of viability concern (such as Regional Forester’s Sensitive Species) and moving toward desired habitat conditions for these species? (Turtles)
34g Annually 1-5 years 2012 2007 To what extent is forest management contributing or responding to the conservation of species of viability concern (such as Regional Forester’s Sensitive Species) and moving toward desired habitat conditions for these species? (Osprey)
35 1 to 5 years 1 to 5 years 2012 2009 To what extent is forest management contributing to the conservation of threatened and endangered species and moving toward desired habitat conditions and populations trends for these species?
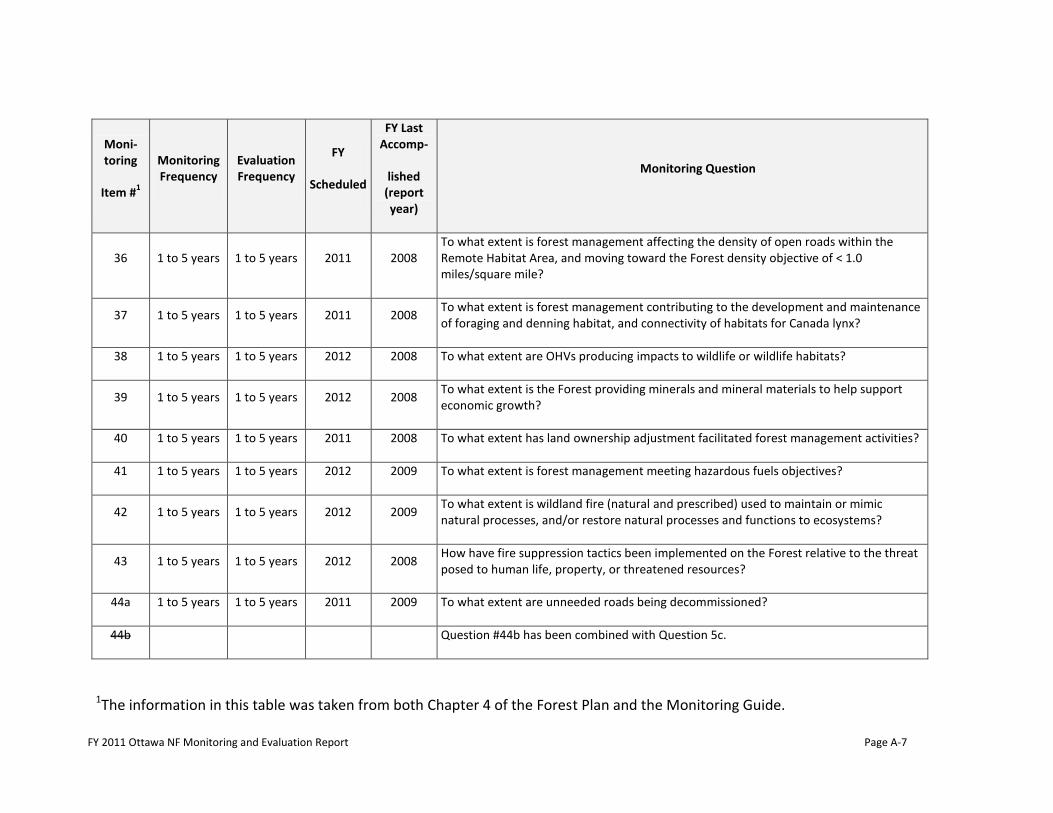
FY 2011 Ottawa NF Monitoring and Evaluation Report Page A-7
Moni-toring
Item #1
Monitoring Frequency
Evaluation Frequency
FY
Scheduled
FY Last Accomp-
lished (report year)
Monitoring Question
36 1 to 5 years 1 to 5 years 2011 2008 To what extent is forest management affecting the density of open roads within the Remote Habitat Area, and moving toward the Forest density objective of < 1.0 miles/square mile?
37 1 to 5 years 1 to 5 years 2011 2008 To what extent is forest management contributing to the development and maintenance of foraging and denning habitat, and connectivity of habitats for Canada lynx?
38 1 to 5 years 1 to 5 years 2012 2008 To what extent are OHVs producing impacts to wildlife or wildlife habitats?
39 1 to 5 years 1 to 5 years 2012 2008 To what extent is the Forest providing minerals and mineral materials to help support economic growth?
40 1 to 5 years 1 to 5 years 2011 2008 To what extent has land ownership adjustment facilitated forest management activities?
41 1 to 5 years 1 to 5 years 2012 2009 To what extent is forest management meeting hazardous fuels objectives?
42 1 to 5 years 1 to 5 years 2012 2009 To what extent is wildland fire (natural and prescribed) used to maintain or mimic natural processes, and/or restore natural processes and functions to ecosystems?
43 1 to 5 years 1 to 5 years 2012 2008 How have fire suppression tactics been implemented on the Forest relative to the threat posed to human life, property, or threatened resources?
44a 1 to 5 years 1 to 5 years 2011 2009 To what extent are unneeded roads being decommissioned?
44b
Question #44b has been combined with Question 5c.
1The information in this table was taken from both Chapter 4 of the Forest Plan and the Monitoring Guide.

FY 2011 Ottawa NF Monitoring and Evaluation Report
Page A-8