Embed Size (px)
Citation preview

Monitoring and Measuring the Availability and Reliability Performance (RAM) of one OEM’s Advanced Gas Turbine Class Fleet: Computation Method Based on Continuous
Data Collection
Salvatore A. Della Villa Jr. Carlos Koeneke, Ph.D. Strategic Power Systems, Inc.® Mitsubishi Power Systems America United States of America United States of America
Abstract
The availability and reliability characteristics of today’s power generation product offerings are
key performance indicators for both owner/operators and equipment manufacturers alike. For
the owner/operator, how the equipment performs on a service hour per start basis, impacts
maintenance schedules and outage durations, influences parts lives and spare part requirements,
and ultimately determines whether pro forma profitability goals are achievable. For the
equipment manufacturer, availability and reliability performance are a reflection of both product
and service quality. Consequently, the owner/operators and equipment manufacturers have a
shared objective; to ensure that the actual availability and reliability performance of the
operating asset is measured, is acceptable, and is sustainable. This data can be used for
benchmarking purposes but needs to be calculated following a common standard and preferably
by an unbiased party.
The use of remote monitoring systems in the power generation industry has proven to be a very
effective tool for early detection of potential malfunctions and trouble shooting. In addition, the
remote monitoring data can also be used for availability and reliability calculations. This
automated approach can reduce the burden of data input at the owner/operators end, providing an
opportunity to obtain timelier, accurate, and reliable data by eliminating errors that can result
through manual input.
This paper will describe an automated system developed by Strategic Power Systems, Inc.®
(SPS) to monitor and measure the availability and reliability characteristics of the Mitsubishi “F”
& “G” fleets. This newly deployed approach leverages ORAP® (Operational Reliability
Analysis Program) by capturing and transforming “real time” plant data into industry standard
availability and reliability performance metrics. A primary objective is to pursue “best in class”

2
availability and reliability performance relative to corporate pro forma and market expectations.
The value and benefits of this approach, for both the OEM and participating owner/operators will
be discussed in this paper. It will also present the RAM data of Mitsubishi’s advanced M501G
Fleet.
Abbreviation Reference – FOF (%) - Forced Outage Factor SR (%) - Starting Reliability AF (%) - Availability Factor RF (%) - Reliability Factor SF (%) - Service Factor SH/ST - Service Hours per Start CF % - Capacity Factor OF % - Output Factor SOF % - Scheduled Outage Factor USOF % - Unscheduled Outage Factor GT - Gas Turbine
Background
The energy marketplace continues to be highly competitive and focused on profitability and
return on investment opportunity. Profitability requires the control and minimization of
operating expense, while maximizing top line growth. For power plants, this requires effective
asset management; operating at times of high return, generating with the highest efficiency
possible, minimizing the affects of forced outages, and controlling scheduled and unscheduled
maintenance. These objectives can be in conflict, with appropriate economic tradeoffs,
especially when higher efficiency advanced technology generation equipment is applied.
Effective asset management is necessary to mitigate operating risks; unacceptable or unforeseen
events that can prevent the plant from achieving its’ pro forma goals and objectives, such as;
The likelihood that the plant will be deterred from meeting a dispatched load because it
cannot successfully start...
The likelihood that the plant will not successfully complete its operating mission due to a trip from load, and a replacement source of power is required...
3
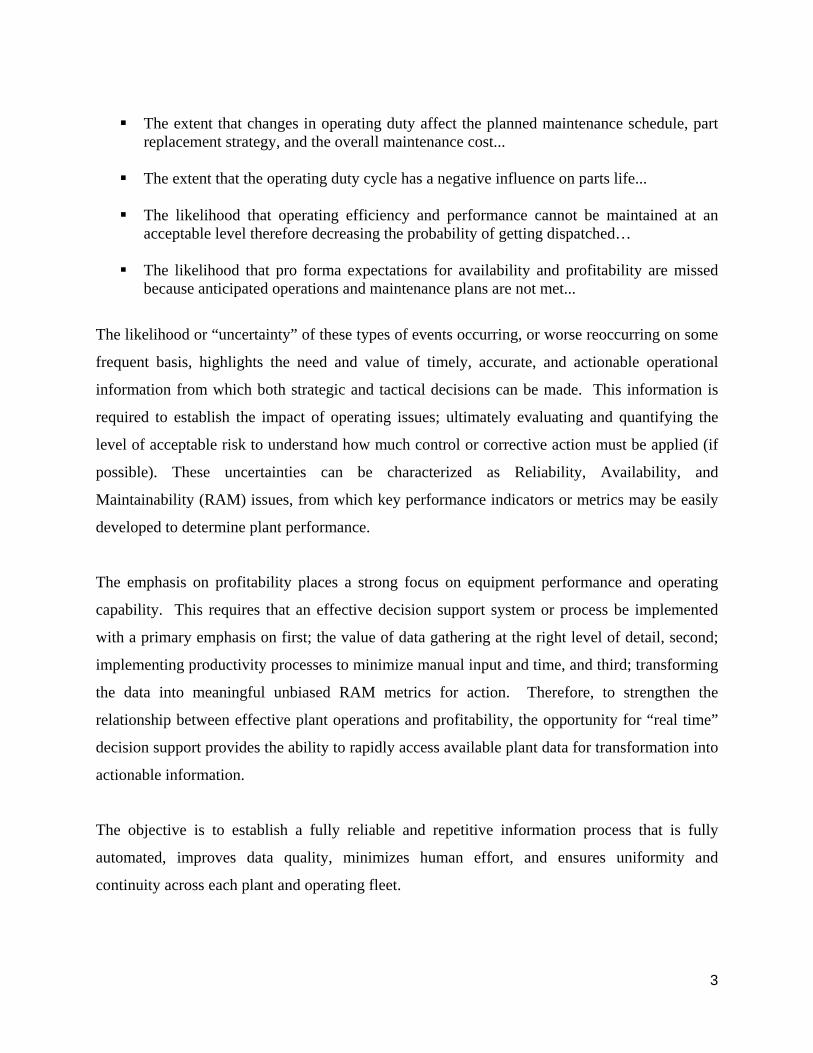
The extent that changes in operating duty affect the planned maintenance schedule, part
replacement strategy, and the overall maintenance cost...
The extent that the operating duty cycle has a negative influence on parts life...
The likelihood that operating efficiency and performance cannot be maintained at an acceptable level therefore decreasing the probability of getting dispatched…
The likelihood that pro forma expectations for availability and profitability are missed
because anticipated operations and maintenance plans are not met...
The likelihood or “uncertainty” of these types of events occurring, or worse reoccurring on some
frequent basis, highlights the need and value of timely, accurate, and actionable operational
information from which both strategic and tactical decisions can be made. This information is
required to establish the impact of operating issues; ultimately evaluating and quantifying the
level of acceptable risk to understand how much control or corrective action must be applied (if
possible). These uncertainties can be characterized as Reliability, Availability, and
Maintainability (RAM) issues, from which key performance indicators or metrics may be easily
developed to determine plant performance.
The emphasis on profitability places a strong focus on equipment performance and operating
capability. This requires that an effective decision support system or process be implemented
with a primary emphasis on first; the value of data gathering at the right level of detail, second;
implementing productivity processes to minimize manual input and time, and third; transforming
the data into meaningful unbiased RAM metrics for action. Therefore, to strengthen the
relationship between effective plant operations and profitability, the opportunity for “real time”
decision support provides the ability to rapidly access available plant data for transformation into
actionable information.
The objective is to establish a fully reliable and repetitive information process that is fully
automated, improves data quality, minimizes human effort, and ensures uniformity and
continuity across each plant and operating fleet.

4
Establishing the Information Infrastructure – ORAP®
ORAP is a widely accepted source of operating, failure, and maintenance data for combustion
and steam turbine plants worldwide. The data input to ORAP has evolved from phone/fax
communication in the 80’s, to Web Based input (ORAP DE Web™) and more recently to direct
data feeding from remote monitoring facilities.
“Remote monitoring” has had a positive impact on the automation and computation of
availability and reliability metrics. While “remote monitoring” has been introduced to provide
an extra level of plant protection and diagnostic capability, a secondary benefit has been the
ability to more accurately derive RAM metrics, representing the performance, operability, and
availability of the plant. The fact that “remote monitoring” has facilitated rapid data acquisition
and massive storage has had a positive impact on the calculation of availability and reliability
metrics, making them more timely and accurate.
The basis for the automated RAM data acquisition and reporting system begins with the existing
Mitsubishi remote monitoring infrastructure combined with SPS’ ORAP system. The data is
confidentially recognized, enforced and maintained through designed-in security features. The
ORAP information architecture provides a strong infrastructure that effectively and
confidentially handles and supports the information flow of data from participating plants; from
data retrieval, to information processing and storage, through report generation and analysis.
The information available in ORAP covers various applications, duty cycles, and plant
arrangements for both simple and combined cycles. SPS adheres to industry measurement
standards (i.e. IEEE 762 and ISO 3977). EPRI’s Standard Equipment Codes, developed under
contract by SPS, are the basis for reporting system and component outages. Additionally, the
ORAP system is compliant with the European KKS (Kraftwerk-Kennzeichensystem) equipment
structure as well. Many ORAP participants provide their outage reporting using the KKS
standard. These codes provide reporting uniformity across all equipment types.

5
The ORAP database schema (relational structure) provides a framework for capturing and
storing operational data, outage events, counter readings, and plant configuration (pedigree)
information from participating generating plants. Significant design features of the ORAP
system are as follows:
1. Operating Data –
Service hours Starts (successful, attempted, testing) Megawatts, steam-generated
2. Event Data –
Planned, unplanned, and forced outages Major inspection activity (Time to Perform and Interval) Concurrent maintenance, non-curtailing events, and deratings Outage cause, symptoms, and corrective actions (narrative)
3. Counter Readings –
Fired Hours Fired Starts Equivalent operating hours/Maintenance factors
4. Other data reporting –
Part replacements Major equipment removals Compliance with manufacturer service bulletins Testing details
For the Mitsubishi covered fleet, most of the data is acquired on a “real time” basis, for review
and incorporation in the ORAP database. Data analysis and reporting, based on statistical
processes, allows MPSA and participating plant/asset managers to see what affects successful
operation, to determine what is required to be “best in class”, and to delineate technology
differences for product selection.

6
“Remote Monitoring” – A Positive Impact on RAM Tracking
Remotely monitored installations undoubtedly benefit from expert support/advice that can either
prevent events or expedite the installation return to service if an event induces its shutdown.
Troubleshooting activities are also considerably improved when a team of experts can quickly
gather and access accurate data stored in the service provider’s archives. These advantages have
a direct and positive effect on the RAM statistics by reducing operation interruptions and
expediting the return to service.
Historically, reliability data capture and reporting has been a totally human system and process.
However, an effective and accurate reliability reporting system requires a strong infrastructure
that places an emphasis on the value of data gathering, implementing productivity processes to
minimize manual input and time, as well as transforming the data into meaningful unbiased
information for action. Remote monitoring provides a platform to improve the process of
reliability reporting from operating power plants, providing an opportunity to automate a
significant amount of the essential data necessary for a comprehensive reliability assessment
from operating plants.
Remote monitoring, as a non-intrusive technology offering, has improved the speed and the
accessibility of process quality data for use by owner/operators and OEM’s alike. Near real-time
data can be made actionable through engineering review, data trending, and deviation analysis.
The objective is to monitor process points to determine on-condition issues at a stage where
intervention can protect the operating asset. In addition, remote monitoring provides the
opportunity to transform the process data points into time and energy based measurements;
essential input for developing the reliability metrics. The process begins with the collection of
once per second control data into three major production related measures; time, capacity (or
energy), and events. Transforming the raw process (once per second) data into time (e.g. hours,
starts, and equivalent hours), load (e.g. megawatts), and events (e.g. trips, failed starts, successful
starts), as well as trending process data provides productivity benefit and improved accuracy. A
major benefit is the reduction in human error and reporting redundancy.

7
SPS and Mitsubishi have established an approach for the transformation and transfer of
operational data from the remote monitoring center in Orlando, FL for direct input to the ORAP
system.
The Process and How it Works
The process begins with the collection of once per second control data from the Mitsubishi
remote monitoring center, located in Orlando, Florida, that is captured and transformed into three
major production related measures; time, capacity (or energy), and events. The data collection
and transformation process is based on logic developed by SPS (refer to Figure 1). Selected data
points are used to develop the specific mission profile for each operating unit, from start-up to
shutdown. The objective is to develop a complete operating mission for each unit, each plant,
and the total fleet, with higher data fidelity, improved accuracy and quality, while eliminating the
human effort and potential error in manipulating and managing this key performance data.
MPSA RMC Center
Ethernet
ORAP Database
SPS Internal Network
WEB SERVERSecure Access Gateway
MPSA OPS Center Architecture for SPS ORAP Transformation Logic
VPN Server
PI OPC DA /HDA Server
Connection to SPS over VPN
SPS Data Center
PI Server
`
ORAP DE WebSites Monitored Remotely by MPSA
`
ORAP DE Web Sites Not Monitored
MPSA Remote Data Capture
MPSA Remote Data Capture
Inc.®
SPS Transformation Logic
Auto Data Collection Workstation
Remotely by MPSA
Figure 1: Data Transformation and Transfer Process

8
The transformation logic develops the actual start-up times; starting reliability; running
reliability (based on recording trips at load and ambient conditions); operating hours and
megawatt hours generated. It is the basis for calculating equivalent availability and reliability
(adjusting for seasonal plant MW rating) and capacity and output factors. Many other operating
parameters that impact all scheduled maintenance (combustion inspections, hot gas path
inspections, and major overhauls) are also captured and developed during the data transformation
process.
Mitsubishi’s primary objective is to establish a reliable and repetitive information process that
improves data quality, minimizes human effort, and ensures uniformity and continuity across
each operating plant. The ORAP system provides this foundation through the data
transformation logic. Once the production data is developed, the time; capacity; and event data is
automatically placed into the ORAP Data Entry (DE) Web™ tool for additional input as
required. The only additional data requirement is to add relevant outage detail available through
knowledgeable plant operations and maintenance staff. This additional data is based on outage
activities (either maintenance or forced outages), including the reason for the event, the actions
taken, the symptom, corrective action, and root cause. These inputs are only available through
human knowledge and must be entered into the ORAP DE Web™ tool to complete each
operating period. This required and essential input completes the data requirements necessary
for developing and calculating the operational availability, reliability, and maintainability of each
plant. Since this process is fully automated operating staff need only review the transformations
for accuracy and acceptance.
Data is transformed and is to be fully compliant with ORAP reporting requirements. As an
example, for a week’s worth of operating data, the process data begins at 00:00 on Saturday and
ends at 24:00 midnight on the following Friday. This ensures that a 168 hour week is captured
(i.e. 168 period hours). A similar process is followed to develop the actual monthly period hours
for each unit and each plant. Each start sequence, either successful or unsuccessful is captured
during this transformation process. Any failure to start and each trip at load at some ambient
condition and power level are captured to develop static references for both starting failures and
trips. If no trips or failures to start occur, and the operating mission is fully successful with a

9
safe shutdown sequence, the operating or service hours, the megawatts generated (gross and net),
fuel used, load swings, and other operating metrics are derived from the process data. No
additional input from operating and maintenance staff is required for these process
transformations. Any and all outages, regardless of duration or impact, require operating and
maintenance staff to add all related details into ORAP DE Web™ to complete the weekly
reporting period, as described previously. Consequently each economic mission is completely
captured. This process repeats itself for each operating mission and for each of the fifty-two (52)
weekly reporting periods, and each twelve (12) month period. Since each economic mission is
captured in this transformation process, Mitsubishi and plant/asset management have an accurate
understanding of the probability that each mission will be completed successfully and profitably.
This provides an effective operational planning and risk management tool, with both Mitsubishi
and plant/asset management able to determine the actual performance of each unit and plant
rapidly.
It should also be restated that all performance metrics and measures that are provided through
both the weekly and monthly reports are fully compliant with industry standards; both ISO 3977
and IEEE 762. This ensures that Mitsubishi and plant/asset management are able to benchmark
their operating performance against internal goals and objectives, as well as through relevant
fleet comparisons. ORAP provides a more specific and timely benchmarking reference for
Mitsubishi and each participating plant through a broader access to various and more similar
operating duty cycles, technologies, and combined cycle plants.
Key RAM Metrics
As we have stated before, the data is transformed into time, capacity, and event information and
is available to develop standard RAM performance metrics. The data is sufficient to characterize
both the uptime and downtime experienced by the operating plants on a unit basis, with the
downtime tracked to a component level of detail. Some of the key performance indicators
developed include; Service Factor (%), Service Hours per Start (Ratio), Availability Factor (%),
Reliability Factor (%) or Forced Outage Factor (%), Scheduled and Unscheduled Outage Factors
(%), and Starting Reliability (%). While several other RAM metrics exist and are developed,

10
these metrics are sufficient to characterize the performance of today’s gas turbine fleets at
several levels; fleet, plant, unit, component. In addition, the downtime contributors on a
frequency and duration basis can be developed from the ORAP data. Simple definitions of these
metrics are as follows;
The service factor and the service hours per start metrics are indicative of the duty cycle,
or the mission profile, that the gas turbine (either in simple or combined cycle) must meet. The metrics are both based on service hours (the time that the turbine generator is synchronized to the grid at any load). These parameters reflect the economic mission that should have been established in the pro forma.
The capacity and output factors provide an indication of the MW output contribution of
the operating assets.
The availability factor represents the percent of time that the turbine is available for service, either actually operating (i.e. service hours), or in a state of ready reserve. The complement of availability is unavailability (the percent of time the unit is out of service).
The reliability factor is the complement of the forced outage factor. The forced outage
factor represents the percent of time that the turbine plant is forced out of service. Therefore the reliability excludes forced outages.
The scheduled and unscheduled outage factor is the percent of time that the turbine plant is out of service for maintenance (either well scheduled in advance or not).
Starting reliability is also a very important metric, especially for peaking and cycling duty cycles, and a major value of remote monitoring data is the ability to more accurately determine the true starting reliability of a unit.
There is a real concern that the manual reporting of starting reliability data (attempted and successful starts) is less uniform and has a level of error that is significant. The issue concerns the definition of the time and point for defining a successful start; flame, breaker closure, or a preset load. While the standards are clear that a pre-set load must be established in a pre-determined period of time, there is concern that manual reporting from plant to plant is not sufficiently consistent. Data from the remote monitoring center addresses and eliminates this issue, since all points in the start-up cycle are clearly defined and time stamped. As an example, it is clear from the data when flame is established, when the breaker closes, and when a pre-set load is reached. These are key points in the start-up cycle and are essential for determining a successful start.
As stated earlier, these metrics are time based, not energy based metrics. The precise definition
of these metrics can be found in two industry standards; IEEE 762, ISO 3977. However, the

11
capacity and output factors provide an indication of the generated load. For combined cycles,
especially multi-shaft configurations, the impact of equipment deratings will reduce the capacity
of the plant for some period of time. These deratings are reflected in the equivalent availability
statistics.
In addition to plant availability and reliability RAM metrics, the data assessment includes;
Equipment outage factors down to the component level. Symptom, corrective action, and root cause analysis.
The value proposition is the establishment of an information architecture that is automated and
shared across an operating fleet. A further objective is improved overall performance, shared
operating values and practices, and a better understanding of what is required to achieve “best in
class” performance through a review of uniform performance metrics.
Advanced Class Gas Turbines RAM Data compared with Previous Generation Frames
The optimized pro forma goals described in previous sections of this paper may involve
conflicting objectives. Advanced technology is progressively introduced to maximize efficiency
and output, however, the more demanding operating conditions involved in pursue of higher
efficiency and output (higher firing temperatures and pressure ratio, reduced cooling flows, etc)
may affect reliability and availability of the more advanced GT frames. This section presents a
comparison of one Advanced Technology fleet (steam cooled M501G) and the mature air cooled
“F” class.
Industry “F” Class Statistics
SPS monitors a large number of “F” Class Gas Turbines manufactured by all large frame
manufacturers. This includes units operating under very different regimes (peaking, cyclic and
base loaded). Table 1 below, summarizes the most important parameters for this mature
technology fleet (more than 200 units).
12
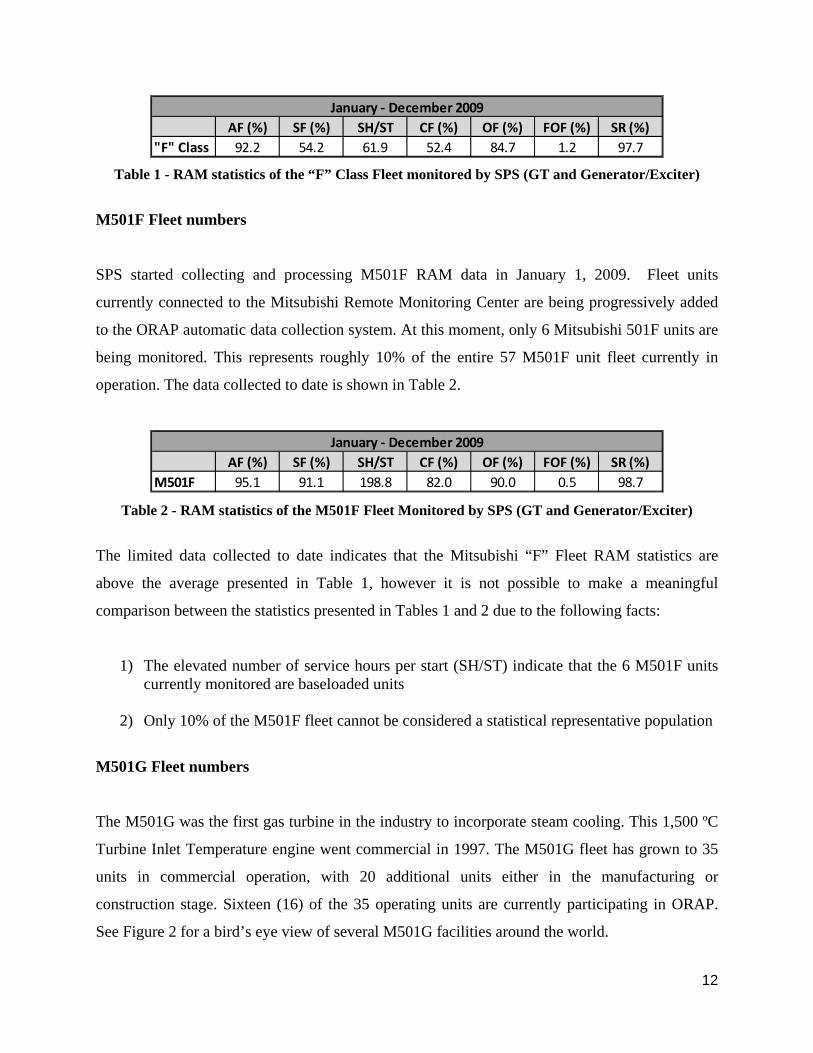
AF (%) SF (%) SH/ST CF (%) OF (%) FOF (%) SR (%)"F" Class 92.2 54.2 61.9 52.4 84.7 1.2 97.7
January ‐ December 2009
Table 1 - RAM statistics of the “F” Class Fleet monitored by SPS (GT and Generator/Exciter)
M501F Fleet numbers
SPS started collecting and processing M501F RAM data in January 1, 2009. Fleet units
currently connected to the Mitsubishi Remote Monitoring Center are being progressively added
to the ORAP automatic data collection system. At this moment, only 6 Mitsubishi 501F units are
being monitored. This represents roughly 10% of the entire 57 M501F unit fleet currently in
operation. The data collected to date is shown in Table 2.
AF (%) SF (%) SH/ST CF (%) OF (%) FOF (%) SR (%)M501F 95.1 91.1 198.8 82.0 90.0 0.5 98.7
January ‐ December 2009
Table 2 - RAM statistics of the M501F Fleet Monitored by SPS (GT and Generator/Exciter)
The limited data collected to date indicates that the Mitsubishi “F” Fleet RAM statistics are
above the average presented in Table 1, however it is not possible to make a meaningful
comparison between the statistics presented in Tables 1 and 2 due to the following facts:
1) The elevated number of service hours per start (SH/ST) indicate that the 6 M501F units currently monitored are baseloaded units
2) Only 10% of the M501F fleet cannot be considered a statistical representative population
M501G Fleet numbers
The M501G was the first gas turbine in the industry to incorporate steam cooling. This 1,500 ºC
Turbine Inlet Temperature engine went commercial in 1997. The M501G fleet has grown to 35
units in commercial operation, with 20 additional units either in the manufacturing or
construction stage. Sixteen (16) of the 35 operating units are currently participating in ORAP.
See Figure 2 for a bird’s eye view of several M501G facilities around the world.

13
Figure 2 - M501G units in the Philippines, USA and Japan
The 16 Mitsubishi M501G units currently monitored represent close to 45% of the entire 35 unit
fleet in commercial operation. In addition to the RAM data collected directly by SPS since the
beginning of 2009, an additional 56 unit-year’s worth of data collected by Mitsubishi since 2004
was audited by SPS following the IEEE 762 and ISO 3977 standards. The average statistics from
2004 to 2009 are presented in Table 3.
Table 3 - RAM statistics of the M501G Class Fleet 2004-2009 (GT only)

14
In terms of operating hours, the data in Table 3 represents close to 340,000 actual operating
hours out of a little over 600,000 actual operating hours accumulated by the entire fleet (more
than 50%). Contrary to the monitored M501F mentioned previously (which operates in a
baseload fashion), the Mitsubishi “G” fleet includes a wide range of operating modes, as shown
in Figure 3.
Figure 3 - Operating mode of Mitsubishi’s “G” Fleet
Considering all the information presented above, the M501G Fleet numbers included in Table 3
do provide a statistically representative population. The equivalent availability and reliability of
the M501G Fleet are very close to the (“F” Class) technology shown previously despite the
higher firing temperature and the advanced technology implemented to increase efficiency.

15
Conclusion
The collection, process and analysis of operational data for RAM calculation are fundamental
requirements for the economic success of power generating facilities. ORAP is a widely accepted
source of operating, failure, and maintenance data for combustion and steam turbine plants
worldwide that provides those tools.
The approach applied to collect data input for ORAP has evolved from manual data collection
and fax or phone feedback, to the current state where a large portion of the data is automatically
fed either through web based tools or from remote monitoring facilities. These advances in data
processing provide an additional level of accuracy and reduce the possibility of human error.
An automated process to feed operational data from Mitsubishi’s Remote Monitoring center in
Orlando has been developed by SPS in order to facilitate RAM statistics calculation of
Mitsubishi M501F & M501G fleets. This process and the data transformation system were
successfully commissioned and the system will be monitoring more than 30 Mitsubishi gas and
steam turbines in the near future.
The RAM statistics collected for the Mitsubishi F & G fleets shows a high degree of availability
and reliability. The M501F monitored fleet is still smaller than 10% of the entire population, but
additional units are being progressively added. A representative M501F fleet is expected to be
reached within the next two years. On the other hand, the advanced class M501G monitored
units includes close to 50% of the population. The RAM statistics for this advance fleet is
comparable to the mature “F” Class despite their advanced features, such as higher Turbine Inlet
Temperature.

16
References:
ANSI/IEEE Std. 762-1987, IEEE Standard Definitions for Use in Reporting Electric Generating Unit Reliability, Availability, and Productivity
International Standard ISO 3977-9:1999, Gas Turbines – Procurement, Part 9: Reliability, Availability, Maintainability and Safety A. Ligato (Direct Energy, L.P), and S.A. Della Villa (Strategic Power Systems, Inc.), "Direct Energy – Optimizing the Flow and Analysis of Plant Operating Data A Strategic Information Architecture for Effective Asset Management", Power-GEN International Conference, New Orleans, LA, December 2007 A.W. von Rappard, H.G. Neuhoff (ABB Power Generation Ltd.) & S.A. Della Villa (Strategic Power Systems, Inc.) “RAM-Performance of Modern Gas Turbines”, ASME International Gas Turbine and Aeroengine Congress & Exhibition, June 1996
S.A Della Villa & C. Koeneke; “A Historical and Current Perspective of the Availability and Reliability Performance of Heavy Duty Gas Turbines: Benchmarking and Expectations. ASME Turbo Expo, Glasgow, UK, June 2010
T.M. Christiansen; “Effective Utilization of Operating Data in Asset Management, ASME Turbo Expo: Power for Land, Sea and Air, Orlando, FL, June 2009