Embed Size (px)
Citation preview
Monitoring and Mitigation of Sustained, Localized Pitting Corrosion
YuPo J. Lin, Edward J. St.Martin, and James R. Frank Argonne National Laboratory
Argonne, IL 60439
Submitted to:
8th International Petroleum Environmental Conference
November 6−9, 2001 Houston, TX
The submitted manuscript has been created by the University of Chicago as Operator of Argonne National Laboratory (“Argonne”) under Contract No. W-31-109-Eng-38 with the U.S. Department of Energy. The U.S. Government retains for itself, and others acting on behalf, a paid-up, nonexclusive, irrevocable worldwide license and said article to reproduce, prepare derivative works, distribute copies to the public, and perform publicly and display publicly, by or on behalf of the Government.
Monitoring and Mitigation of
Sustained, Localized Pitting Corrosion
YuPo J. Lin, Edward J. St.Martin, and James R. Frank Argonne National Laboratory
Argonne, IL 60439
ABSTRACT
Many unexpected failures in pipelines and storage vessels can be traced to sustained, localized pitting (SLP) corrosion. Detecting such pitting is often difficult because standard corrosion probes can only measure generalized corrosion, not the localized corrosion that can drill holes into metal. Argonne used both laboratory and field experiments to design a corrosion probe that detect rapid SPL corrosion by taking electrochemical noise measurements. Argonne researchers have reexamined electrochemical noise analysis (ENA) of localized corrosion by using hardware, signal collection, and signal processing designs that are different from those used in conventional ENA techniques. The new data acquisition system was designed to identify and monitor the progress of SLP by analyzing the power spectral density (PSD) of the trend of the corrosion potential noise level (PNL). The results of the PSD analysis consistently demonstrated that the trends of PNL contain information that can be used to differentiate between SLP corrosion and general corrosion mechanisms. The degree of linear slope in the low-frequency portion of the PSD analysis was correlated with the SLP corrosion process. Laboratory metal coupons, as well as commercial corrosion probes, were tested to ensure the reproducibility and consistency of the results. Argonne evaluated the on-line monitoring capability of this new ENA method in a bench-scale flow-loop system, which simulated microbially influenced corrosion (MIC) activity. The ENA results demonstrated that this in-situ corrosion monitoring system could effectively identify SLP corrosion associated with MIC, compared to a more uniform general corrosion mechanism. A reduction in SLP activity could be clearly detected by the ENA monitoring system when a corrosion inhibitor was added into one of the test loops during the corrosion testing. On the basis of the results obtained from laboratory experiments and field tests, Argonne integrated a user-friendly ENA system, designed for on-line and continuously monitoring of corrosion activity, that can automatically report the onset of SLP corrosion. Keywords: electrochemical noise, corrosion, microbially influenced corrosion (MIC), sensor, sustained, localized pitting (SLP).
INTRODUCTION
Corrosion of pipelines and storage facilities is a significant problem for the oil and gas industry. The most destructive form of corrosion is sustained, localized pitting (SLP) corrosion, in which the metal or alloy is perforated rapidly. Although several methods to measure general corrosion rates are available, reliable on-line methods to predict when and where SLP will occur are not available. A preliminary evaluation indicated that electrochemical noise analysis (ENA) could be an effective method to analyze SLP corrosion (1).
ENA is a nondestructive, in-situ method of monitoring natural corrosion processes. Using ENA, researchers measure the endogenous electrochemical corrosion current and potential fluctuations simultaneously. Because natural corrosion processes are chaotic, signal processing of the recorded current and potential noise is very critical in interpreting the data collected. To characterize the corrosion mechanism, Argonne used different signal processing algorithms to interpret the ENA data. Several characteristic evaluations of the time-series noise signal, such as potential and current noise levels, noise resistance (2,3,4,5), and pitting index (6), were proposed to describe the corrosion mechanism. These data and methods alone did not allow researchers to effectively identify the different corrosion mechanisms (7). However, when spectral analysis of the chaotic electrochemical noise was also applied, researchers found that it was a powerful signal processing technique that could be used to characterize the noise data in a frequency domain (8,9). In this technique, the slope of the power spectral density (PSD) versus frequency of the transformed signal is believed to relate to the corrosion mechanism (10,11,12,13). Most of the results presented in the references demonstrated a correlation between the corrosion process and the slope of the PSD under controlled constant potential or current laboratory studies. However, very few literature citations discussed the application of this technique in a natural corrosion process in which the potential or current is not controlled. Coupling the PSD analysis technique with ENA would be an important step in developing a practical tool for monitoring SLP for industrial applications.
The main challenge was to differentiate SLP from uniform corrosion. The uniform corrosion process discussed here includes general corrosion and the development of a very large number of uniformly distributed small corrosion pits. SLP, as its name implies, refers to the few pits or group of pits that dominate the corrosion process and force a very fast metal loss on a small portion of the surface area. As discussed in Reference 13, uniform corrosion appears to be a stochastic process; localized pitting corrosion appears to be a deterministic process. In most natural corrosion systems, SLP occurs together with uniform corrosion. They can be seen in the potential noise PSD analysis as a plateau in the high-frequency portion of the spectrum for the stochastic process and as a slope in the low-frequency portion of the spectrum for the deterministic process (13). Therefore, the low-frequency portion of the potential noise PSD could be used to
characterize the pitting corrosion process. Conventional ENA techniques have been used with some success in detecting the pitting corrosion process. However, it was not clear from these studies whether conventional ENA could effectively differentiate the rapid growth of corroded pits in a small area (i.e., SLP) from the uniformly distributed pitting over the entire area. Inspecting a much lower frequency range of the potential noise PSD spectrum (e.g., beyond 10-3 Hz) may be necessary to differentiate dominating SLP from uniformly distributed pitting. However, in this low-frequency range, some artifacts, such as flicker noise, could limit the application of conventional ENA.
Argonne has developed a new approach to signal collection for electrochemical noise measurements. The new method can effectively detect the SLP process and avoid the artifacts. Instead of collecting the original corrosion current and potential noise signal, Argonne collects the current and potential noise level (CNL and PNL). The CNL and PNL values are collected by calculating (in-situ) the mean-square-error (MSE) of a few hundred noise-signal data points. These data points are recorded continuously during one electrochemical noise measurement. In Argonne’s new method, the data collected reflect the trend of amplitude change of the current and potential noise caused by corrosion during any test period. Therefore, in theory, researchers can collect the new form of signal data at much lower frequencies (e.g., 10-6 or lower), allowing them to avoid the signal drift (or any interference from other sources) caused by using a very low recording (i.e., sampling) rate. Also, Argonne did not find any artifacts, such as flicker noise effect, from the instruments or environment during the CNL and PNL measurements. This new approach, in principle, should improve the resolution of PSD analysis in the low-frequency range and allow analysis of any deterministic process recorded by the noise signal. The effectiveness of this new technique in detecting SLP was demonstrated by conducting well-controlled laboratory experiments and a field test in a natural gas pipeline. The laboratory experiments were carried out in flow-loop systems that were built to simulate corrosion in a gas pipeline. With the flow-loop system, Argonne could also design reproducible experiments under controlled conditions to examine various corrosion mechanisms and the effects of chemical treatments.
APPARATUS Probes
Electrochemical noise measurements were taken by simultaneously recording the current noise and potential noise with a three-electrode probe. The working and counter electrodes were shorted together and connected through a zero-resistance amperometer (ZRA) to monitor the corrosion current flow. The third electrode was used as a reference electrode to measure the corrosion
potential of the shorted electrode pair through a high-impedance voltmeter. A personal computer with a plug-in potentiostatt(1) served as the ZRA and voltmeter.
Two types of electrochemical probes were used. The type I probe
included a standard calomel electrode (SCE) as the reference electrode and a carbon steel coupon (C1018)(2) as the working electrode. The counter electrode was either the same material as the working electrode or a stainless-steel (S.S. 316) electrode. The stainless-steel counter electrode is nobler than the carbon steel coupon. Therefore, the working electrode (i.e., the carbon steel coupon) was forced into a galvanic corrosion. The type II probe was a commercial probe(3) that consisted of three round-end cylindrical electrodes. Again, carbon steel (C1018) was used both in the working and in the counter electrodes. A stainless-steel (S.S. 304) electrode was used as the reference.
Before each experiment, the new method coupon and electrode specimens were cleaned in an acid cleaning solution and rinsed with deionized water. After rinsing, the specimen was cleaned by sonication in water. The cleaned specimen was dipped into acetone and then dried in an oven to remove the water. Electrochemical noise and weight loss were measured in each experiment. Flow-Loop System
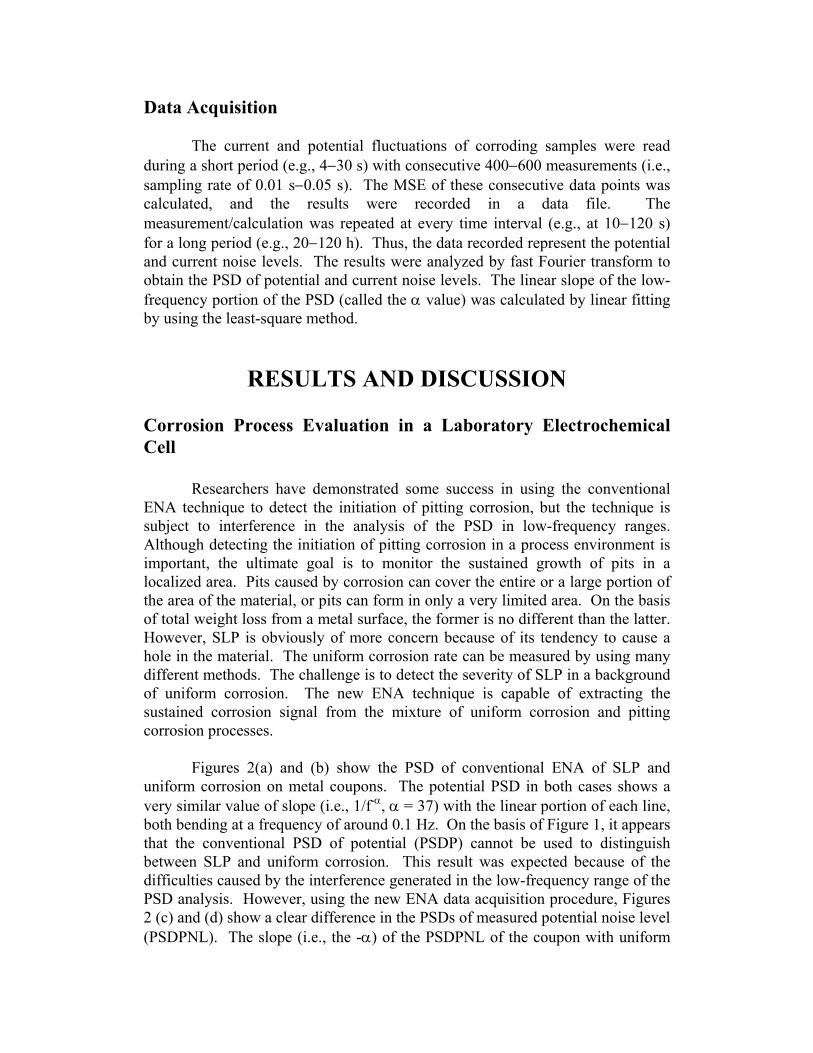
Four independent flow loops (A, B, C, and D) with separate simulated produced-water solutions, fluid reservoirs, and pumps were used. Each flow loop was 4 in. in diameter and 6 ft long with separate flow-control and gas-purging systems. The simulated produced-water fluid was circulated through each loop. Two commercial ENA probes (i.e., type II) were inserted into each of the four loops, for a total of eight probes (see Figure 1).
To evaluate the performance of the new ENA technique in detecting SLP caused by MIC, several nutrients and salts (such as chloride and sulfate) were added to accelerate the MIC in the flow-loop system. Ethanol was injected into each test loop to trigger pitting corrosion because ethanol was rapidly converted by sulfate-reducing bacteria to acetic acid and hydrogen sulfide. This step resulted in a localized low-pH region that accelerated the sustained pitting corrosion under the biofilm.
(1)Trademark of Gamry Instruments, Inc. (2)Obtained from Metal Samples, Inc. (3)Rohrback Cosasco, Inc.
Data Acquisition
The current and potential fluctuations of corroding samples were read during a short period (e.g., 4−30 s) with consecutive 400−600 measurements (i.e., sampling rate of 0.01 s−0.05 s). The MSE of these consecutive data points was calculated, and the results were recorded in a data file. The measurement/calculation was repeated at every time interval (e.g., at 10−120 s) for a long period (e.g., 20−120 h). Thus, the data recorded represent the potential and current noise levels. The results were analyzed by fast Fourier transform to obtain the PSD of potential and current noise levels. The linear slope of the low-frequency portion of the PSD (called the α value) was calculated by linear fitting by using the least-square method.
RESULTS AND DISCUSSION
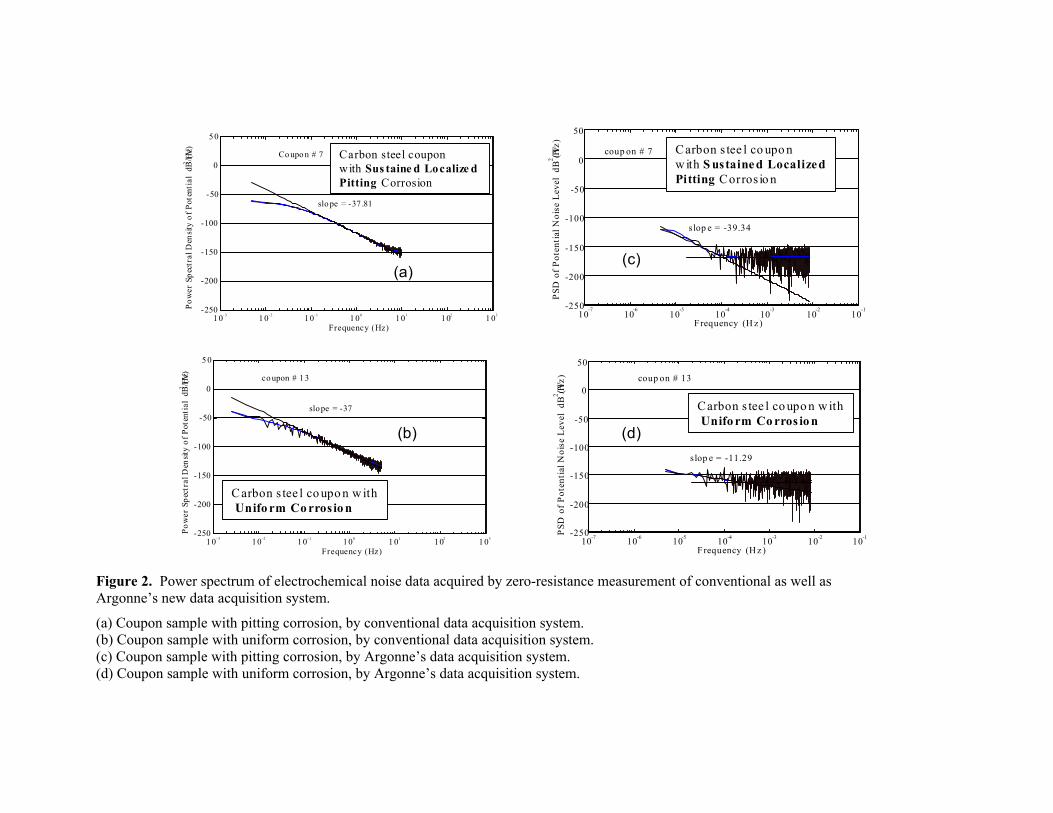
Corrosion Process Evaluation in a Laboratory Electrochemical Cell Researchers have demonstrated some success in using the conventional ENA technique to detect the initiation of pitting corrosion, but the technique is subject to interference in the analysis of the PSD in low-frequency ranges. Although detecting the initiation of pitting corrosion in a process environment is important, the ultimate goal is to monitor the sustained growth of pits in a localized area. Pits caused by corrosion can cover the entire or a large portion of the area of the material, or pits can form in only a very limited area. On the basis of total weight loss from a metal surface, the former is no different than the latter. However, SLP is obviously of more concern because of its tendency to cause a hole in the material. The uniform corrosion rate can be measured by using many different methods. The challenge is to detect the severity of SLP in a background of uniform corrosion. The new ENA technique is capable of extracting the sustained corrosion signal from the mixture of uniform corrosion and pitting corrosion processes. Figures 2(a) and (b) show the PSD of conventional ENA of SLP and uniform corrosion on metal coupons. The potential PSD in both cases shows a very similar value of slope (i.e., 1/f-α, α = 37) with the linear portion of each line, both bending at a frequency of around 0.1 Hz. On the basis of Figure 1, it appears that the conventional PSD of potential (PSDP) cannot be used to distinguish between SLP and uniform corrosion. This result was expected because of the difficulties caused by the interference generated in the low-frequency range of the PSD analysis. However, using the new ENA data acquisition procedure, Figures 2 (c) and (d) show a clear difference in the PSDs of measured potential noise level (PSDPNL). The slope (i.e., the -α) of the PSDPNL of the coupon with uniform
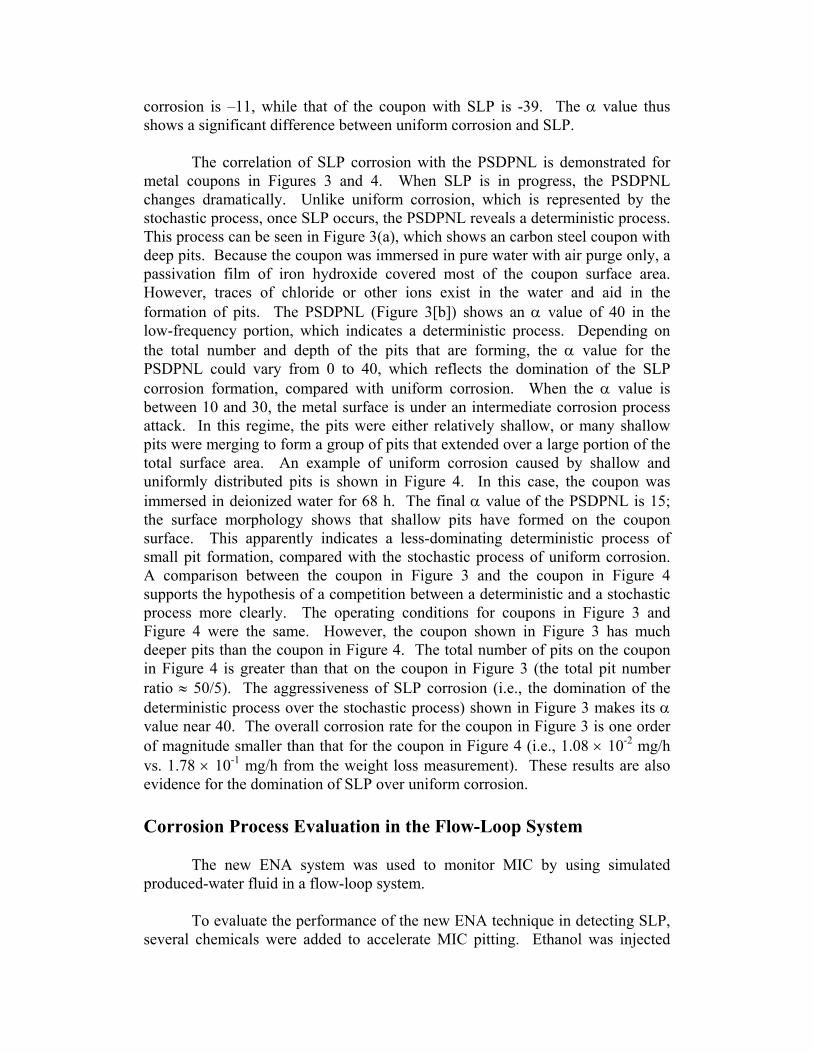
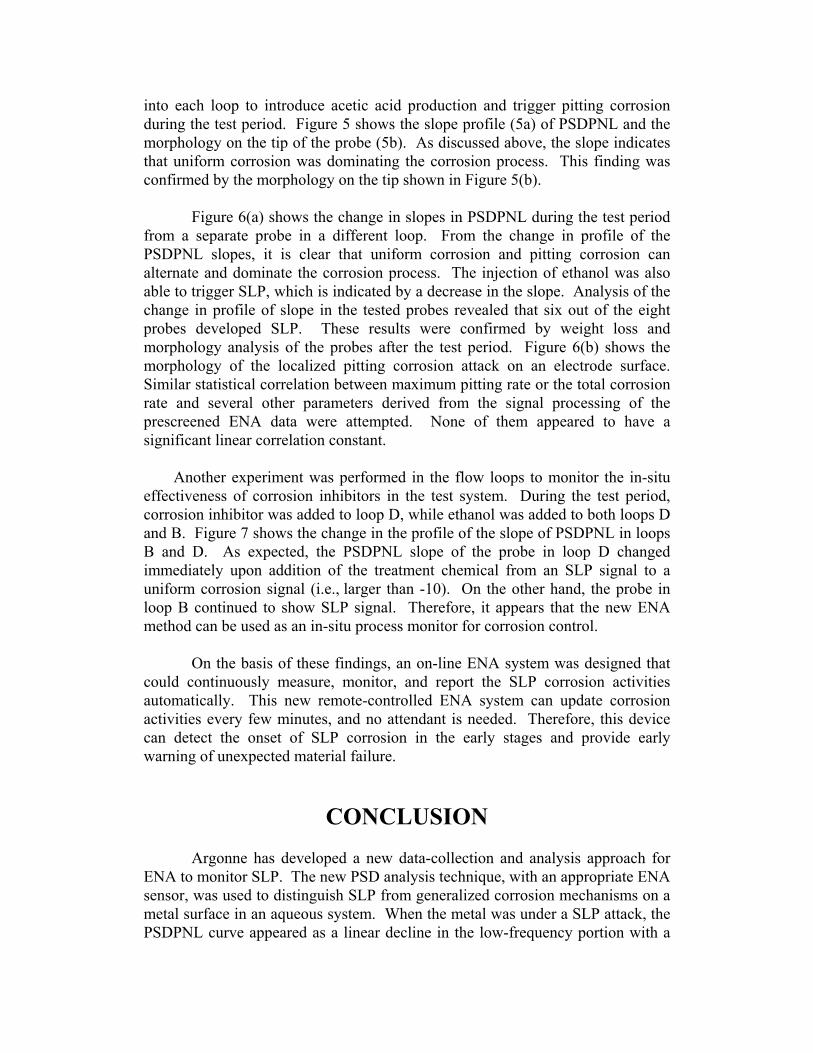
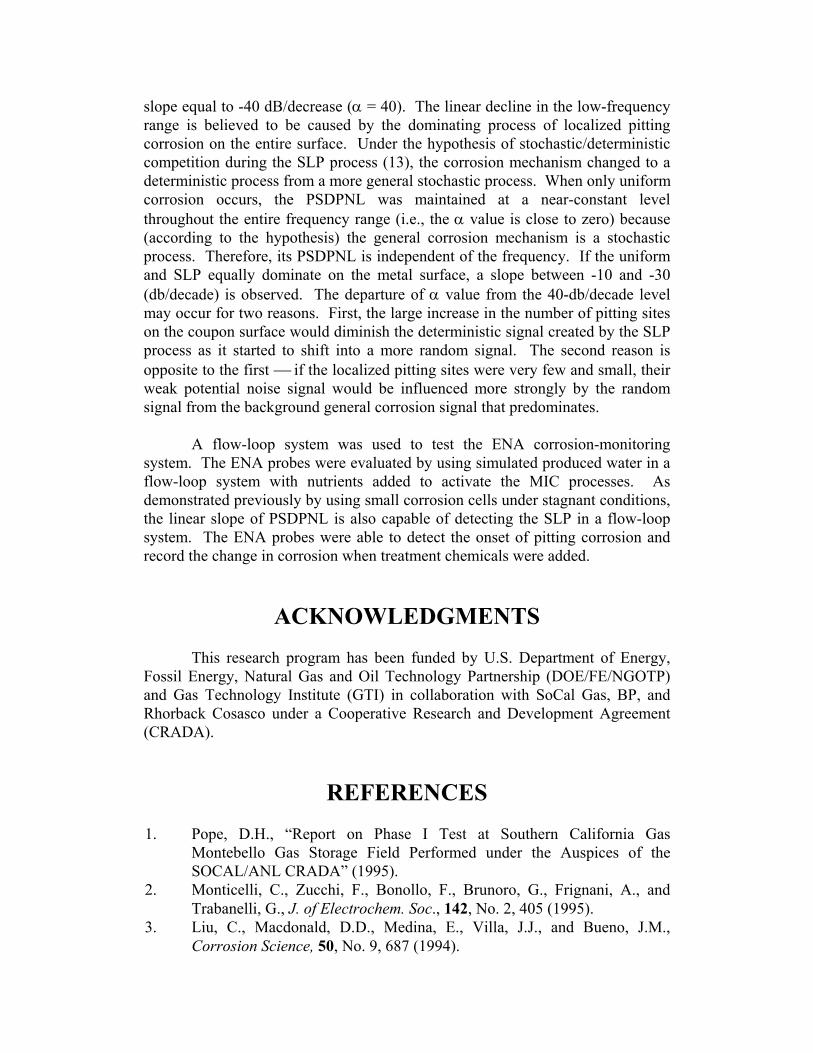
corrosion is –11, while that of the coupon with SLP is -39. The α value thus shows a significant difference between uniform corrosion and SLP. The correlation of SLP corrosion with the PSDPNL is demonstrated for metal coupons in Figures 3 and 4. When SLP is in progress, the PSDPNL changes dramatically. Unlike uniform corrosion, which is represented by the stochastic process, once SLP occurs, the PSDPNL reveals a deterministic process. This process can be seen in Figure 3(a), which shows an carbon steel coupon with deep pits. Because the coupon was immersed in pure water with air purge only, a passivation film of iron hydroxide covered most of the coupon surface area. However, traces of chloride or other ions exist in the water and aid in the formation of pits. The PSDPNL (Figure 3[b]) shows an α value of 40 in the low-frequency portion, which indicates a deterministic process. Depending on the total number and depth of the pits that are forming, the α value for the PSDPNL could vary from 0 to 40, which reflects the domination of the SLP corrosion formation, compared with uniform corrosion. When the α value is between 10 and 30, the metal surface is under an intermediate corrosion process attack. In this regime, the pits were either relatively shallow, or many shallow pits were merging to form a group of pits that extended over a large portion of the total surface area. An example of uniform corrosion caused by shallow and uniformly distributed pits is shown in Figure 4. In this case, the coupon was immersed in deionized water for 68 h. The final α value of the PSDPNL is 15; the surface morphology shows that shallow pits have formed on the coupon surface. This apparently indicates a less-dominating deterministic process of small pit formation, compared with the stochastic process of uniform corrosion. A comparison between the coupon in Figure 3 and the coupon in Figure 4 supports the hypothesis of a competition between a deterministic and a stochastic process more clearly. The operating conditions for coupons in Figure 3 and Figure 4 were the same. However, the coupon shown in Figure 3 has much deeper pits than the coupon in Figure 4. The total number of pits on the coupon in Figure 4 is greater than that on the coupon in Figure 3 (the total pit number ratio ≈ 50/5). The aggressiveness of SLP corrosion (i.e., the domination of the deterministic process over the stochastic process) shown in Figure 3 makes its α value near 40. The overall corrosion rate for the coupon in Figure 3 is one order of magnitude smaller than that for the coupon in Figure 4 (i.e., 1.08 × 10⁻² mg/h vs. 1.78 × 10⁻¹ mg/h from the weight loss measurement). These results are also evidence for the domination of SLP over uniform corrosion. Corrosion Process Evaluation in the Flow-Loop System The new ENA system was used to monitor MIC by using simulated produced-water fluid in a flow-loop system. To evaluate the performance of the new ENA technique in detecting SLP, several chemicals were added to accelerate MIC pitting. Ethanol was injected
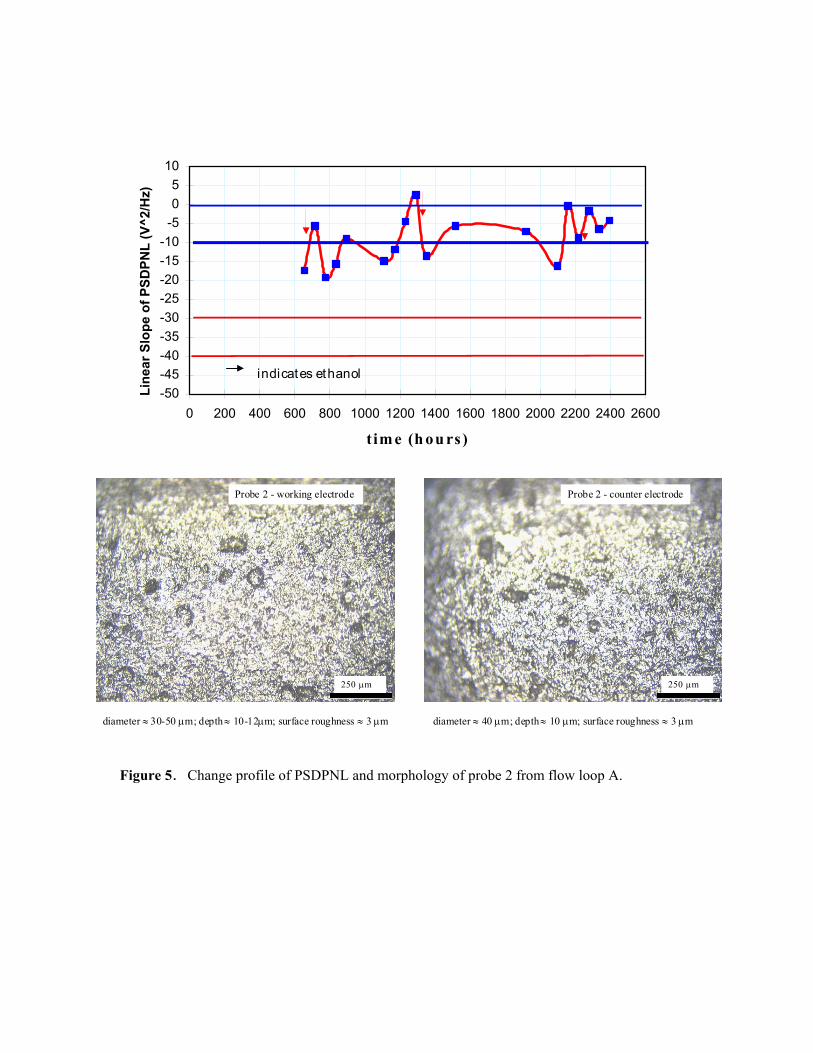
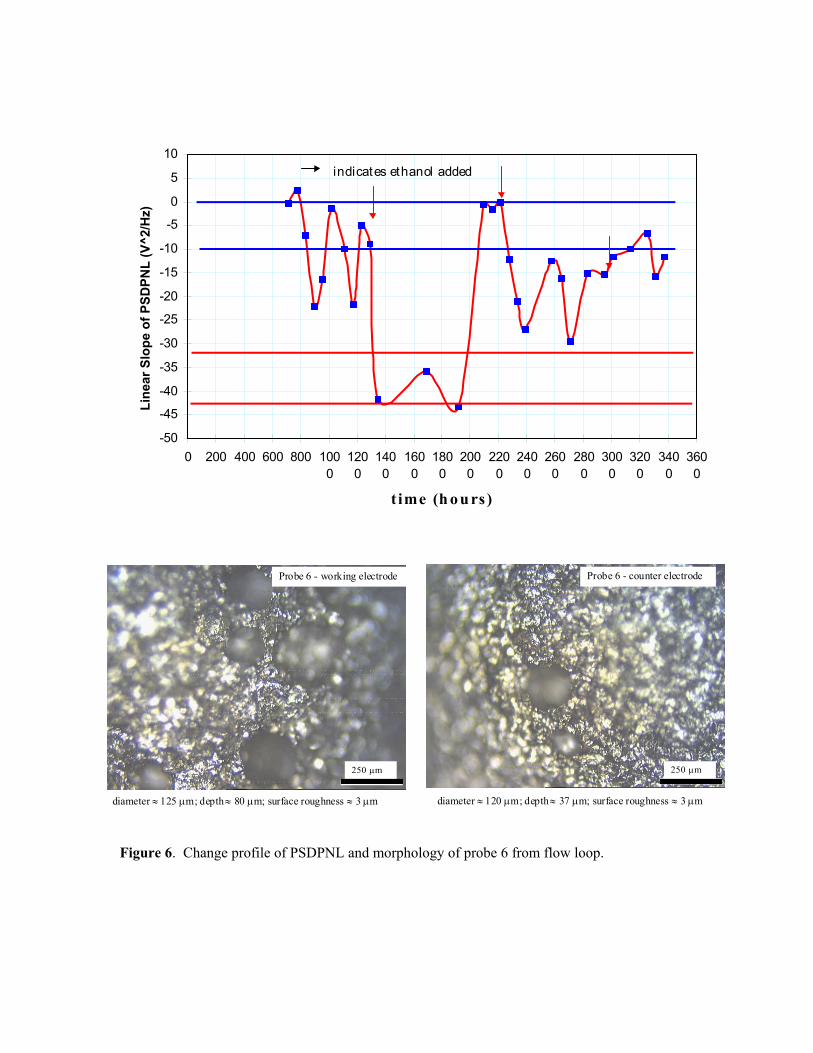
into each loop to introduce acetic acid production and trigger pitting corrosion during the test period. Figure 5 shows the slope profile (5a) of PSDPNL and the morphology on the tip of the probe (5b). As discussed above, the slope indicates that uniform corrosion was dominating the corrosion process. This finding was confirmed by the morphology on the tip shown in Figure 5(b). Figure 6(a) shows the change in slopes in PSDPNL during the test period from a separate probe in a different loop. From the change in profile of the PSDPNL slopes, it is clear that uniform corrosion and pitting corrosion can alternate and dominate the corrosion process. The injection of ethanol was also able to trigger SLP, which is indicated by a decrease in the slope. Analysis of the change in profile of slope in the tested probes revealed that six out of the eight probes developed SLP. These results were confirmed by weight loss and morphology analysis of the probes after the test period. Figure 6(b) shows the morphology of the localized pitting corrosion attack on an electrode surface. Similar statistical correlation between maximum pitting rate or the total corrosion rate and several other parameters derived from the signal processing of the prescreened ENA data were attempted. None of them appeared to have a significant linear correlation constant. Another experiment was performed in the flow loops to monitor the in-situ effectiveness of corrosion inhibitors in the test system. During the test period, corrosion inhibitor was added to loop D, while ethanol was added to both loops D and B. Figure 7 shows the change in the profile of the slope of PSDPNL in loops B and D. As expected, the PSDPNL slope of the probe in loop D changed immediately upon addition of the treatment chemical from an SLP signal to a uniform corrosion signal (i.e., larger than -10). On the other hand, the probe in loop B continued to show SLP signal. Therefore, it appears that the new ENA method can be used as an in-situ process monitor for corrosion control.
On the basis of these findings, an on-line ENA system was designed that
could continuously measure, monitor, and report the SLP corrosion activities automatically. This new remote-controlled ENA system can update corrosion activities every few minutes, and no attendant is needed. Therefore, this device can detect the onset of SLP corrosion in the early stages and provide early warning of unexpected material failure.
CONCLUSION Argonne has developed a new data-collection and analysis approach for ENA to monitor SLP. The new PSD analysis technique, with an appropriate ENA sensor, was used to distinguish SLP from generalized corrosion mechanisms on a metal surface in an aqueous system. When the metal was under a SLP attack, the PSDPNL curve appeared as a linear decline in the low-frequency portion with a
slope equal to -40 dB/decrease (α = 40). The linear decline in the low-frequency range is believed to be caused by the dominating process of localized pitting corrosion on the entire surface. Under the hypothesis of stochastic/deterministic competition during the SLP process (13), the corrosion mechanism changed to a deterministic process from a more general stochastic process. When only uniform corrosion occurs, the PSDPNL was maintained at a near-constant level throughout the entire frequency range (i.e., the α value is close to zero) because (according to the hypothesis) the general corrosion mechanism is a stochastic process. Therefore, its PSDPNL is independent of the frequency. If the uniform and SLP equally dominate on the metal surface, a slope between -10 and -30 (db/decade) is observed. The departure of α value from the 40-db/decade level may occur for two reasons. First, the large increase in the number of pitting sites on the coupon surface would diminish the deterministic signal created by the SLP process as it started to shift into a more random signal. The second reason is opposite to the first if the localized pitting sites were very few and small, their weak potential noise signal would be influenced more strongly by the random signal from the background general corrosion signal that predominates. A flow-loop system was used to test the ENA corrosion-monitoring system. The ENA probes were evaluated by using simulated produced water in a flow-loop system with nutrients added to activate the MIC processes. As demonstrated previously by using small corrosion cells under stagnant conditions, the linear slope of PSDPNL is also capable of detecting the SLP in a flow-loop system. The ENA probes were able to detect the onset of pitting corrosion and record the change in corrosion when treatment chemicals were added.
ACKNOWLEDGMENTS
This research program has been funded by U.S. Department of Energy, Fossil Energy, Natural Gas and Oil Technology Partnership (DOE/FE/NGOTP) and Gas Technology Institute (GTI) in collaboration with SoCal Gas, BP, and Rhorback Cosasco under a Cooperative Research and Development Agreement (CRADA).
REFERENCES 1. Pope, D.H., “Report on Phase I Test at Southern California Gas
Montebello Gas Storage Field Performed under the Auspices of the SOCAL/ANL CRADA” (1995).
2. Monticelli, C., Zucchi, F., Bonollo, F., Brunoro, G., Frignani, A., and Trabanelli, G., J. of Electrochem. Soc., 142, No. 2, 405 (1995).
3. Liu, C., Macdonald, D.D., Medina, E., Villa, J.J., and Bueno, J.M., Corrosion Science, 50, No. 9, 687 (1994).
4. Cottis, R.A., and Loto, C.A., Corrosion Scienc, 46, Vol. 1, 12, (1990). 5. Xiao, H., and Mansfeld, F., J. of Electrochem. Soc., 141, Vol. 9, 2332
(1994). 6. Eden, D.A., John, D.G., and Dawson, J.L., International Patent No.
87/07022 (1987). 7. Mansfeld, F., and Xiao, H., J. of Electrochem. Soc., 140,Vol. 8, 2005
(1993). 8. Hladky, K., U.S. Patent 4,575,678 (1986). 9. Gabrielli, C., Huet, F., and Keddam, M., Electrochemical and Optical
Techniques for the Study and Monitoring of Metallic Corrosion, 135, Kuiwer Academic Publishers, NATO ASI Series Vol. 203 (1991).
10. Legat, A., and Dolecek, V., Corrosion Science, 51, Vol. 4, 295 (1995). 11. Bertocci, U., and Huet, F., Corrosion Science, 51, Vol. 2, 131 (1995). 12. Legat, A., and Dolecek, V., J. of Electrochem. Soc., 142, Vol. 6, 1851
(1995). 13. Roberge, P.R., J. of Applied Electrochemistry, 23, 1223 (1993).
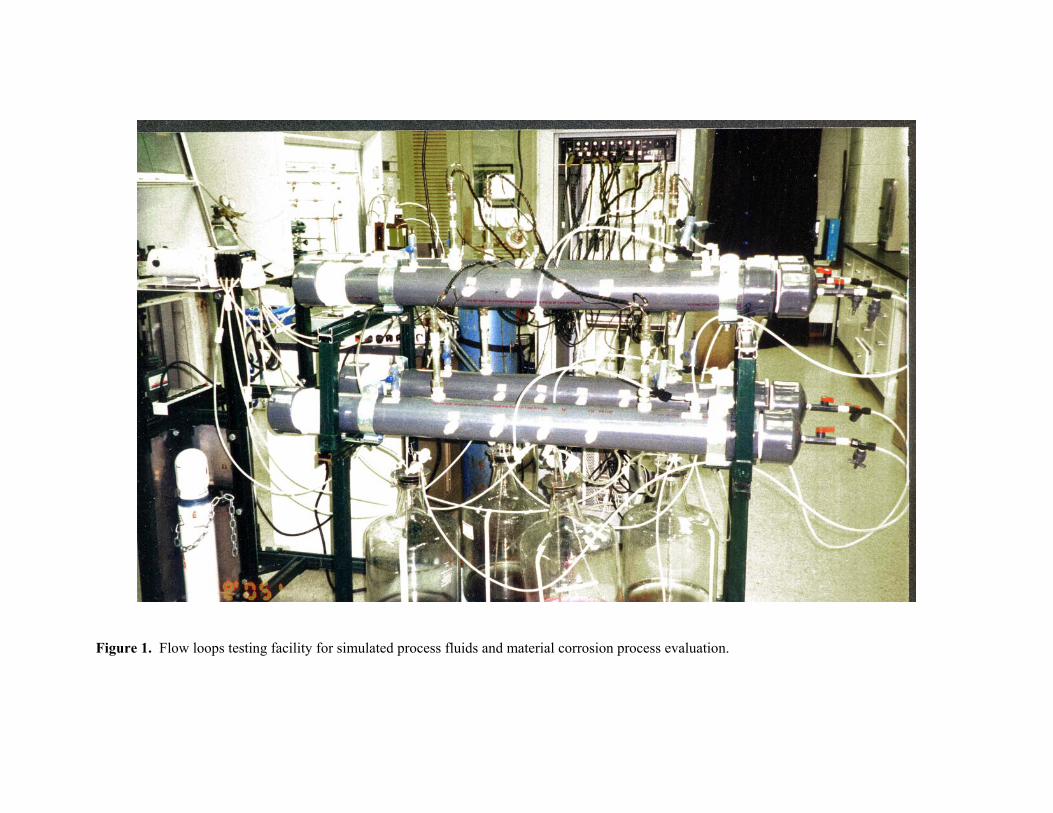
Figure 1. Flow loops testing facility for simulated process fluids and material corrosion process evaluation.
1 0-3 1 0-2 10-1 1 00 101 102 1 03-250
-200
-150
-100
-50
0
5 0
Frequency (Hz)
Co upo n # 7
slo pe = -37 .81
1 0- 3 10-2 1 0-1 100 1 01 102 1 03-250
-200
-150
-100
-50
0
5 0
Frequency (Hz)
Pow
er S
pect
ral D
ensit
y of
Pot
enti
al d
B (
V2 /H
z) co upon # 1 3
slope = -37
Carbon s tee l co upo n w ithUnifo rm Co rros io n
10-7
10-6
10-5
10-4
10-3
10-2
10-1-250
-200
-150
-100
-50
0
50
Frequency (H z)
PSD
of P
oten
tial N
oise
Lev
el d
B (
V2 /H
z)
coup on # 7
slop e = -39.34
Carbon s tee l co upo n w ith S ustaine d LocalizedPitting Corros io n
10-7 10-6 10-5 10-4 10-3 10-2 10-1-250
-200
-150
-100
-50
0
50
Frequency (H z )PS
D o
f Pot
enti
al N
oise
Lev
el d
B (
V2 /H
z) coup on # 13
slop e = -11.29
Carbon s tee l co upo n w ithUnifo rm Co rros io n
Carbon steel coupon with Sus taine d Localize dPitting Corrosion
Pow
er S
pect
ral D
ensit
y of
Pot
enti
al d
B (
V2 /H
z)
(a)
(b)
(c)
(d)
Figure 2. Power spectrum of electrochemical noise data acquired by zero-resistance measurement of conventional as well as Argonne’s new data acquisition system.
(a) Coupon sample with pitting corrosion, by conventional data acquisition system. (b) Coupon sample with uniform corrosion, by conventional data acquisition system. (c) Coupon sample with pitting corrosion, by Argonne’s data acquisition system. (d) Coupon sample with uniform corrosion, by Argonne’s data acquisition system.
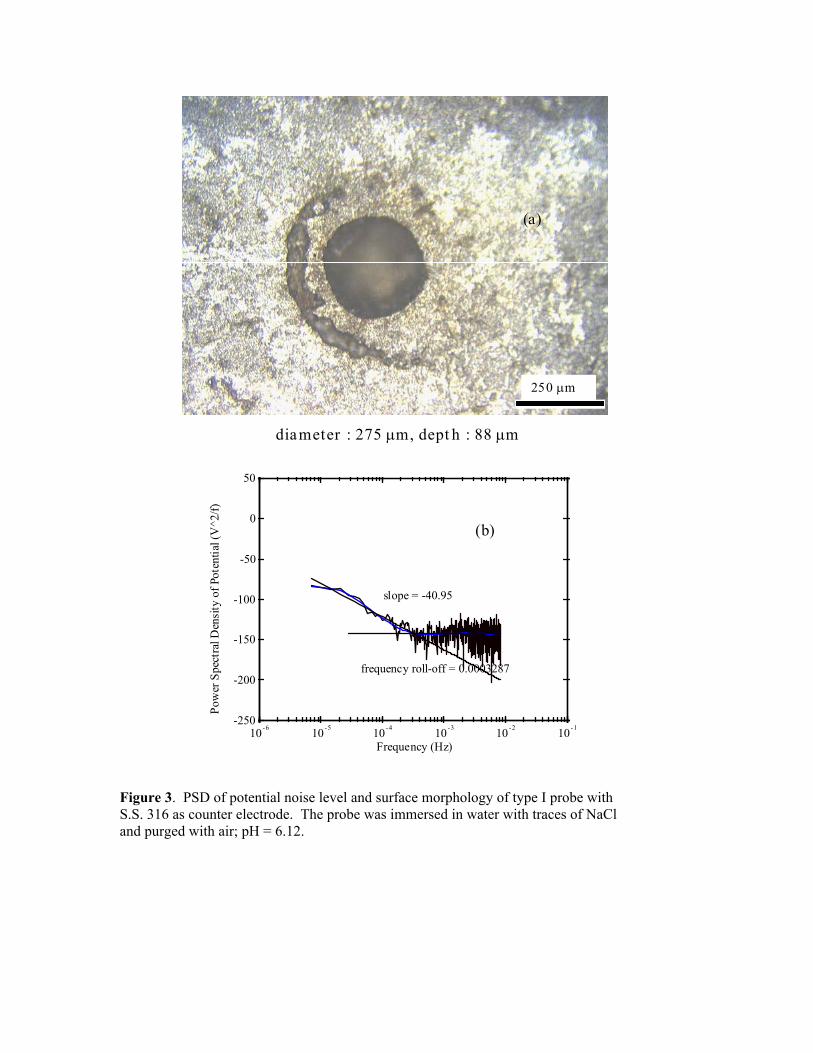
Figure 3. PSD of potential noise level and surface morphology of type I probe with S.S. 316 as counter electrode. The probe was immersed in water with traces of NaCl and purged with air; pH = 6.12.
10-6 10-5 10-4 10-3 10-2 10-1-250
-200
-150
-100
-50
0
50
Frequency (Hz)
Pow
er S
pect
ral D
ensi
ty o
f Pot
entia
l (V
^2/f)
slope = -40.95
frequency roll-off = 0.0003287
250 µm
diameter : 275 µm, dept h : 88 µm
(a)
(b)
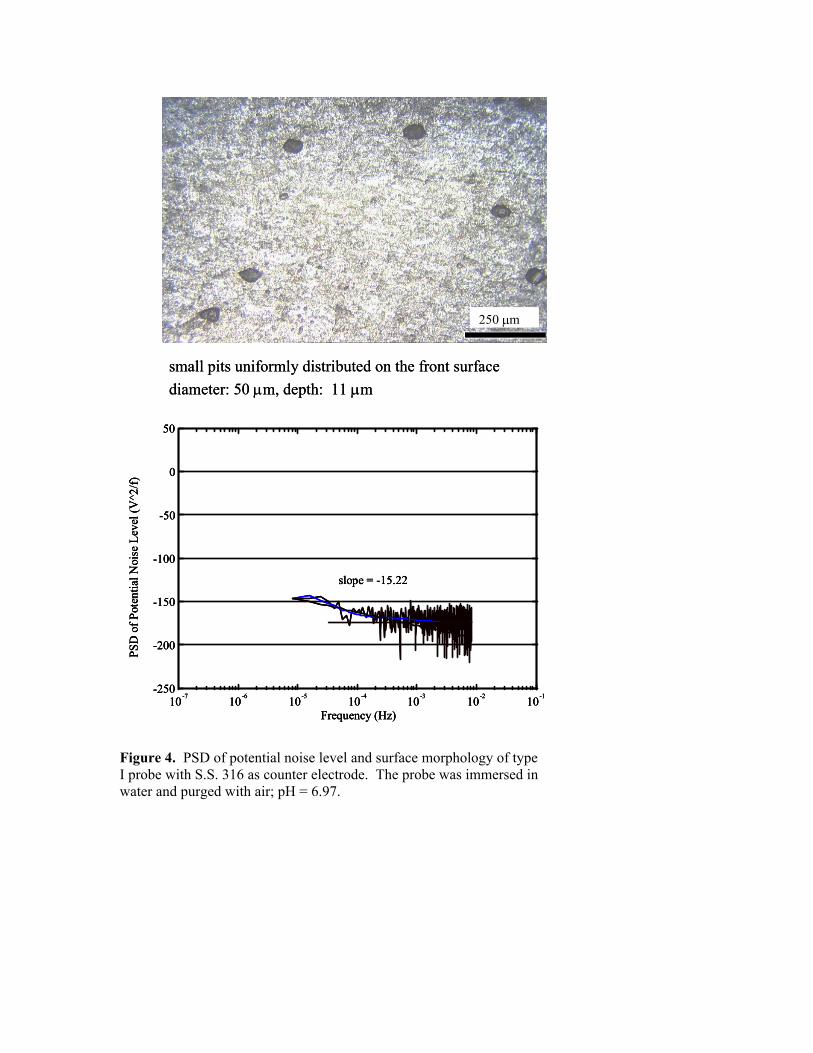
small pits uniformly distributed on the front surfacediameter: 50 µm, depth: 11 µm small pits uniformly distributed on the front surfacediameter: 50 µm, depth: 11 µm
250 µm250 µm250 µm
10-7 10-6 10-5 10-4 10-3 10-2 10-1-250
-200
-150
-100
-50
0
50
Frequency (Hz)
PSD
of P
oten
tial N
oise
Lev
el (V
^2/f)
slope = -15.22
10-7 10-6 10-5 10-4 10-3 10-2 10-1-250
-200
-150
-100
-50
0
50
Frequency (Hz)
PSD
of P
oten
tial N
oise
Lev
el (V
^2/f)
slope = -15.22
10-7 10-6 10-5 10-4 10-3 10-2 10-1-250
-200
-150
-100
-50
0
50
Frequency (Hz)
PSD
of P
oten
tial N
oise
Lev
el (V
^2/f)
slope = -15.22
Figure 4. PSD of potential noise level and surface morphology of type I probe with S.S. 316 as counter electrode. The probe was immersed in water and purged with air; pH = 6.97.
-50-45-40-35-30-25-20-15-10-505
10
0 200 400 600 800 1000 1200 1400 1600 1800 2000 2200 2400 2600
t im e (h ou rs)
Line
ar S
lope
of P
SDPN
L (V
^2/H
z)
indicates ethanol
250 µm
Probe 2 - working electrode
diameter ≈ 30-50 µm; depth ≈ 10-12µm; surface roughness ≈ 3 µm
250 µm
Probe 2 - counter electrode
diameter ≈ 40 µm; depth ≈ 10 µm; surface roughness ≈ 3 µm
Figure 5. Change profile of PSDPNL and morphology of probe 2 from flow loop A.
-50
-45
-40
-35
-30
-25
-20
-15
-10
-5
0
5
10
0 200 400 600 800 1000
1200
1400
1600
1800
2000
2200
2400
2600
2800
3000
3200
3400
3600
t ime (h ou rs)
Line
ar S
lope
of P
SDPN
L (V
^2/H
z)
indicates ethanol added
250 µm
diameter ≈ 125 µm; depth ≈ 80 µm; surface roughness ≈ 3 µm
Probe 6 - working electrode
250 µm
Probe 6 - counter electrode
diameter ≈ 120 µm; depth ≈ 37 µm; surface roughness ≈ 3 µm Figure 6. Change profile of PSDPNL and morphology of probe 6 from flow loop.
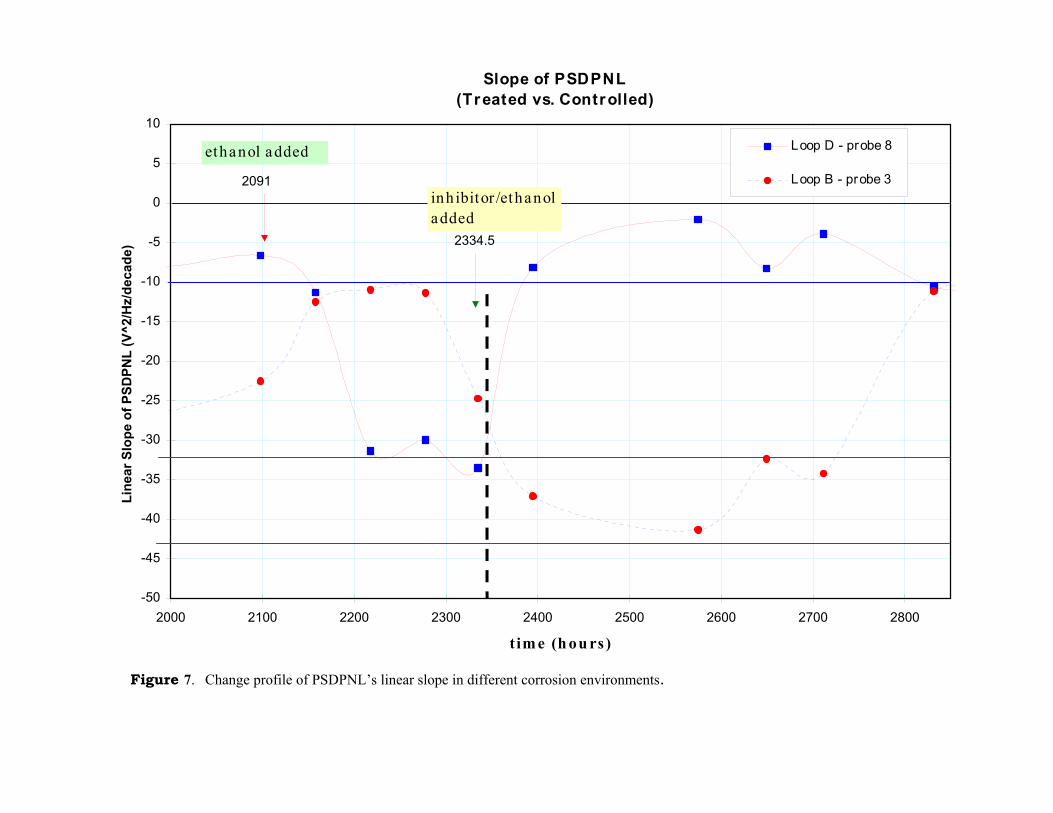
Slope of PSDPNL(Treated vs. Controlled)
-50
-45
-40
-35
-30
-25
-20
-15
-10
-5
0
5
10
2000 2100 2200 2300 2400 2500 2600 2700 2800
t im e (h ou rs)
Line
ar S
lope
of P
SDPN
L (V
^2/H
z/de
cade
)Loop D - probe 8
Loop B - probe 3
2334.5
2091inh ibitor /ethanol added
ethanol added
igure 7. Change profile of PSDPNL’s linear slope in different corrosion environments. F