Embed Size (px)
Citation preview
Final Report: Monitoring and quantifying factors that affect the growth and yield of potatoes
Final report
MONITORING AND QUANTIFYING
FACTORS THAT AFFECT THE GROWTH
AND YIELD OF POTATOES
JM Steyn (University of Pretoria)
2008
Final Report: Monitoring and quantifying factors that affect the growth and yield of potatoes
Disclaimer
Information contained in this document results from research funded wholly or in part by the Potato Industry Development Trust upon request of Potatoes South Africa acting in good faith. Opinions, attitudes and points of view expressed herein do not necessarily reflect the official position or policies of the Potatoes South Africa. Potatoes South Africa makes no claims, promises, or guarantees about the accuracy, completeness, or adequacy of the contents of this document and
expressly disclaims liability for errors and omissions regarding the content thereof. No warranty of any kind, implied, expressed, or statutory, including but not limited to the warranties of non-infringement of third party rights, title, merchantability, fitness for a particular purpose or freedom from computer virus is given with respect to the contents of this document in hardcopy, electronic format or electronic links thereto. References made to any specific product, process, and service by trade name, trade mark, manufacturer or another commercial commodity or entity are for
informational purposes only and do not constitute or imply approval, endorsement or favouring by Potatoes South Africa.
Vrywaring
Die inligting vervat in hierdie dokument is die resultaat van navorsing wat ten volle of gedeeltelik befonds is deur die Potato Industry Development Trust op versoek van Aartappels Suid-Afrika, handelend in goeder trou. Menings, sienings en standpunte hierin vervat reflekteer nie noodwendig die amptelike standpunte of beleid van Aartappels Suid-Afrika nie. Aartappels Suid-Afrika maak
geen aansprake, beloftes of waarborge oor die korrektheid, volledigheid of toereikendheid van die inhoud van hierdie dokument nie en ontken uitdruklik aanspreeklikheid vir foute en weglatings oor die inhoud daarvan. Geen waarborg van enige aard, hetsy geïmpliseerd, uitdruklik, of statutêr, insluitende maar nie beperk tot die waarborge van nie-skending van derdeparty-regte, titels, verkoopbaarheid, geskiktheid vir ʼn bepaalde doel of vry van rekenaarvirus word gegee te opsigte van die inhoud van hierdie dokument in gedrukte formaat, elektroniese formaat of elektroniese koppeling daaraan. Verwysings na enige spesifieke produk, proses en diens by wyse van
handelsnaam, handelsmerk, vervaardiger of ander kommersiële kommoditeit of entiteit is slegs vir inligtingsdoeleindes en vorm of impliseer nie goedkeuring, onderskrywing of begunstiging daarvan deur Aartappels Suid-Afrika nie.
Final Report: Monitoring and quantifying factors that affect the growth and yield of potatoes
REPORT YEAR 2005/6
OPSOMMING (Afrikaans)
Gereelde groeianalises is volgens beplanning op plantmonsters vanaf drie
lokaliteite, naamlik Dendron, Petrusburg and Bultfontein uitgevoer. SWB model
simulasies is vir elke datastel geloop en model uitsette is met die gemete data
vergelyk. Gewas parameters wat vantevore vir elke cultivar bepaal is, is vir die
simulasies gebruik. Model uitsette het oor die algemeen goed met gemete waardes
vergelyk, indien die groeiseisoen ooreengestem het met die seisoen waarvoor die
gewasparameters bepaal is. Byvoorbeeld, gewasgroei vir cv. Darius in ‘n somer
aanplanting te Petrusburg is oor die algemeen akkuraat gesimuleer indien somer
gewas parameters vir hierdie cultivar gebruik is. Indien dieselfde stel parameters
egter gebruik is om ‘n herfs seisoen vir Petrusburg te simuleer, was model uitsette
nie akkuraat nie. Hierdie resultate bevestig die huidige beperkings van SWB, wat
nie in staat is om die effek van verskillende omgewings (met dieselfde
gewasparameters) op aartappel groei, ontwikkeling en opbrengs akkuraat te
simuleer nie.
Dit is bekend dat aartappels gevoelig is vir veranderinge in fotoperiode (daglig
lengte), wat tesame met temperatuur die tempo van groei en ontwikkeling van die
gewas beïnvloed. Kort dae en koel temperature bevorder knolinisiasie, terwyl lang
dae en hoë temperature knolinisiasie weer uitstel. Sodra knolinisiasie ‘n aanvang
neem, word meer assimilate na die knolle verdeel en minder na die loofgroei.
Afhangend van wanneer knolinisiasie plaasvind (vroeg of laat in die groeiseisoen),
sal dit ‘n invloed uitoefen op die grootte van die loof en die uiteindelike
knolopbrengs.
Simulasiemodelle behoort dus die effek van fotoperiode op aartappel groei en
ontwikkeling in ag te neem ten einde hierdie veranderlikes akkuraat te kan simuleer.
Die SWB model is ‘n generiese gewas model, wat ontwikkel is as hulpmiddel vir die
besproeiingskedulering van ‘n reeks gewasse, insluitend aartappels. SWB is reeds
vantevore suksesvol vir aartappels onder plaaslike toestande gekalibreer en
gebruik. Die toepassingsmoontlikhede van die model is egter gekortwiek deur die
feit dat verskillende stelle gewasparameters vir verskillende seisoene gebruik moes
word om akkurate simulasies te verseker. Die verbetering van SWB om aartappel
groei, ontwikkeling en opbrengs akkuraat in ‘n verskeidenheid omgewings te kan
simuleer sal dus beslis die model se toepassingsmoontlikhede aansienlik verbeter.
‘n Studie is gedoen om vas te stel watter benaderings deur toegewyde
aartappelgroeimodelle gebruik word om die effek van fotoperiode op aartappels te
Final Report: Monitoring and quantifying factors that affect the growth and yield of potatoes
akkommodeer. Hieruit is sewe verskillende metodes saamgestel waarvolgens die
termiese tyd behoefte tussen opkoms en knolinisiasie beraam kon word. Die
verskillende metodes is gebruik om die aanvang van knolinisiasie vir uiteenlopende
groeiseisoene te bereken. Die berekende aantal dae tussen opkoms en knolinisiasie
is dan vergelyk met gemete data vanaf vyf historiese datastelle wat oor verskillende
seisoene en lokalitiete versamel is. Die SWB metode aangepas met ‘n relatiewe
daglengte faktor het die beste beraming van die kumulatiewe termiese tyd behoefte
tussen opkom en knolinisiasie gegee.
Hierdie resultate dui daarop dat die vermoë van SWB om die aanvang van
knolinisiasie by aartappels akkuraat te voorspel verbeter kan word deur die effek
van fotoperiode by die model in te bou. Vervolgens sal die nodige aanpassings aan
die model gemaak word om die effek van fotoperiode te kan simuleer. Die
verbeterde SWB model sal dan op onafhanklike data evalueer moet word om vas te
stel of die veranderinge die gewenste akkuraatheid teweeg gebring het.
In hierdie eerste modellering poging is slegs op die SWB model gekonsentreer. Dit
moet egter benadruk word dat die data wat tydens hierdie projek versamel word,
voortaan gebruik sal kan word vir die evaluasie en kalibrasie van toegewyde
aartappel modelle vir plaaslike cultivars en toestande. Sulke modelle kan baie
handig deur beplanners en beleidmakers gebruik word in besluitneming en scenario
analises. Die uiteenlopende toestande waaronder aartappels in Suid-Afrika verbou
word, en die ernstige tekort aan opgeleide gewaskundiges, dui daarop dat
modellering een van die min oorblywende alternatiewe is waarmee aartappel
produksie probleme aangespreek kan word.
SUMMARY
Growth analyses were conducted frequently on plant samples collected from three
different localities, namely Dendron, Petrusburg and Bultfontein. SWB model
simulations were run for each data set and model outputs were compared to the
growth analyses data. For these simulation runs, previously determined crop
parameters per cultivar were used. Comparison of growth analysis data with SWB
simulation results indicated that model performance was generally good when the
crop parameters used were for the same growing season. For example, crop growth
of cv. Darius in a summer planting at Petrusburg was simulated well, provided that
summer crop parameters for Darius were used. However, if the same set of crop
parameters were used for a different growing season (e.g. an autumn season at
Petrusburg), model simulations were not accurate. These results confirm the
limitations of the SWB model, which is currently not able to simulate the effects of
different growing seasons on potato crop growth, development and yield accurately.
Final Report: Monitoring and quantifying factors that affect the growth and yield of potatoes
It is known that the potato is sensitive to changes in photoperiod, which together
with temperature, influence the rate of growth and development of the crop. Short
days and cooler temperatures promote tuber initiation, while long days and higher
temperatures postpone tuber initiation. Once tuber initiation has commenced, more
assimilates are partitioned to the reproductive parts (tubers) and less to the canopy.
Depending whether tuber initiation is early or later in the growing season, this will
impact on the dry matter production and distribution, which will determine canopy
size and final tuber yield.
In order to accurately simulate potato growth and yield, models should be able to
accommodate the effects of photoperiod on these processes. The SWB model is a
generic crop model, which was developed for the irrigation management of various
crops, including potatoes. In the past SWB was locally calibrated and successfully
used for the irrigation scheduling of potatoes. However, the application value of the
model was limited by the fact that different sets of crop parameters had to be used
for different planting seasons to ensure accurate simulations. The improvement of
SWB to accurately simulate plant growth and water usage in different environments
will, therefore, benefit the application value of the model.
The approaches followed by dedicated potato models were studied to establish
whether the effect of photoperiod on crop growth and development could be
accommodated into SWB. Seven different methods of calculating the thermal time
required to reach tuber initiation were investigated. These methods were used to
calculate the onset of tuber initiation for different growing seasons. The calculated
days between emergence and tuber initiation were compared to measured data
from five historical data sets, collected over several seasons and locations. The
SWB method corrected by a relative day length factor gave the best estimations of
the cumulative thermal time required from emergence to tuber initiation, which was
a substantial improvement on the standard SWB method.
These results strongly suggest that the ability of SWB to correctly simulate the onset
of tuber initiation could be improved by incorporating the effect of photoperiod. The
next step would be to build the suggested changes into SWB and to evaluate
whether the suggested improvements will indeed improve model simulations of crop
growth in diverse growing conditions.
This first modelling attempt on potatoes only focussed on the SWB model. However,
the collected data sets could in future be very valuable for the calibration and
validation of potato specific growth models for locally produced potato cultivars.
Such models can be very useful for planning and scenario analysis purposes in the
hands of decision and policy makers. The divergent conditions under which
potatoes are grown in SA, and the acute shortage of potato agronomists, dictates
Final Report: Monitoring and quantifying factors that affect the growth and yield of potatoes
the use of modelling as one of the few remaining viable options for solving
production problems in the future.
OBJECTIVES 2005/2006
The overall objective of the project is to investigate the effect of climate and
production practices on the growth, development and yield of potatoes in two
production areas, namely Vivo and Petrusburg. For the reporting period frequent
destructive harvests during the growing season were planned. The collected plant
samples were destined for growth analysis, which would help to quantify potato
growth response to the different environments.
PROGRESS REPORT
Introduction
Potatoes are produced in sixteen geographic production areas in South Africa
(Theron, 2003). These production areas can differ vastly in soil, climate and
production practices applied. As planting dates can vary to almost any time of year,
there is almost a year round supply of freshly harvested potatoes, which eliminates
the need for long term storage. However, this broad production base often results in
substantial differences in yield and quality obtained from different production areas.
This requires optimization of cultivar and area specific production programmes.
Temperature, photoperiod and water supply are the most important abiotic factors
affecting the growth and yield of potatoes. Both photoperiod and temperature
influence the rate of crop growth and development. Temperature determines the
onset and duration of different growth stages (emergence, tuber initiation, bulking
and senescence) and partitioning of assimilates to different plant parts (leaves,
stems, roots and tubers). This is called the thermal time requirements of a crop.
Daylength or photoperiod mainly governs the time of tuber initiation and the length
of the growing season of potatoes (Kooman and Haverkort, 1996). Since many
interrelated factors play a role in this, a modelling approach is best suited to
describe the plant’s response to these variables.
A wide range of simulation models that differ in complexity, user friendliness and
application value are available world wide. Some of the well-known potato specific
models include SUBSTOR (Ritchie et al, 1995) and LINTUL (Kooman & Haverkort,
1995). The locally developed SWB model (Annandale et al, 1999) is not a dedicated
potato model, but a generic crop irrigation scheduling tool. It can be used for the
irrigation management of a range of commonly irrigated crops. SWB has previously
Final Report: Monitoring and quantifying factors that affect the growth and yield of potatoes
been calibrated successfully for the most important South African potato cultivars,
but as it is not a dedicated potato model, is does not take photoperiod into account.
As a result, different sets of crop parameters were developed for different growing
seasons and planting dates to ensure accurate simulation of crop growth and water
use. This is not ideal, as it detracts from the application value of the model. In both
the SUBSTOR (Ritchie et al. 1995) and LINTUL (Kooman & Haverkort, 1995)
models the time of tuber initiation is a function of cultivar response to both
temperature and photoperiod. Therefore, any of these models could potentially be
employed to study the effect of environment on crop growth and yield. However,
before crop models can be explored to help understand the effect of environment on
crop response, field data is required for the calibration and validation of such
models. The purpose of the current research work was, therefore, to collect plant
growth data from diverse production areas for the calibration and validation of crop
models.
Materials and Methods
Plant samples were frequently collected from two production areas according to
plan, as well as from a third site that was added during the course of the year. In
Limpopo province plant samples of the cultivar BP1 were collected from a farm in
the Dendron production area (instead of Vivo) during the winter 2005 season
(planted July). In the Free State samples of the cultivar Darius were collected from
Petrusburg during the summer 2005/6 season (planted September). At this site the
monitoring programme was expanded to also include the mid summer / autumn
season (planted January 2006). In this planting the cultivar Mondial was used, as
requested by producers in that area. Furthermore, the project was expanded to the
Bultfontein area, on demand of producers in that area. This site was also planted in
January 2006 and the cultivar Mondial was also used.
For Petrusburg and Bultfontein plant samples were collected fortnightly and sent to
Pretoria with the help of PSA field staff. At Dendron samples were only taken once
per month. At each sampling time point three samples (replications) were taken
from randomly selected positions in the field. For each sample all the plant material
from a 1 m row length was harvested. Depending on the row spacing, the sample
area ranged from 0.7 to 0.88 m2 each. Samples were carefully packed and sent to
Pretoria by overnight courier. On arrival growth analyses were performed on the
collected samples, which included measurement of leaf area and determination of
fresh leaf, stem and tuber mass. Plant samples were then dried for determination of
dry mass per component. Hourly weather data was collected during the growing
season for each site, using automatic weather stations. This data was used as input
for model simulations.
Final Report: Monitoring and quantifying factors that affect the growth and yield of potatoes
SWB model simulations were run for each of the sites and seasons where plant
growth data had been collected. Crop parameters previously determined for the
cultivars BP1 and Darius were used in the model simulations. As crop parameters
were not previously determined for Mondial, new parameters had to be calculated
for this cultivar, using the current data sets. The collected plant growth data was
processed and used for comparison with model simulations.
Results and Discussion
Model outputs for simulated leaf areas index (LAI), total (top) and tuber
(harvestable) dry matter yields are presented in Figures 1 to 5. Actual
measurements of these variables are also presented on the graphs to establish how
well crop growth and yield were simulated, using the exiting crop parameters for
each cultivar. Four different statistical parameters (r2, Wilmott D-index, RMSE and
Final Report: Monitoring and quantifying factors that affect the growth and yield of potatoes
Figure 1 Simulated (lines) and measured results (points) for leaf areas index,
tuber (HDM) and total dry matter (TDM) yields for the cultivar BP1 during the 2005
winter season at Dendron. Red lines and points represent total dry matter yields and
blue lines and points represent tuber dry matter yields.
MAE) were employed to evaluate the agreement between simulated and measured
values (De Jager, 1994).
According to Figure 1 the simulated values for LAI, tuber and total dry matter yields
compared relatively well with measured values collected for the Dendron locality. In
this case existing parameters for BP1 summer plantings were used.
From previous experience it was expected that simulation results would not
compare well with measured values when using BP1 summer parameters for a
winter planting. However, this could probably be explained by the fact that the
potatoes were planted relatively late (July 2005) and only emerged during the first
half of August. Therefore, these plants actually reacted like in a spring planting,
rather than a winter planting as intended.
The simulated and measured values for LAI, tuber and total dry matter yields for the
cultivar Mondial during the autumn 2006 planting at Petrusburg and Bultfontein are
presented in Figures 2 and 3. Simulated values generally compared well with
measured values for both sites. This confirms that under optimal growing conditions
Final Report: Monitoring and quantifying factors that affect the growth and yield of potatoes
the same set of model parameters could be used for different localities, provided
that the growing season is the same.
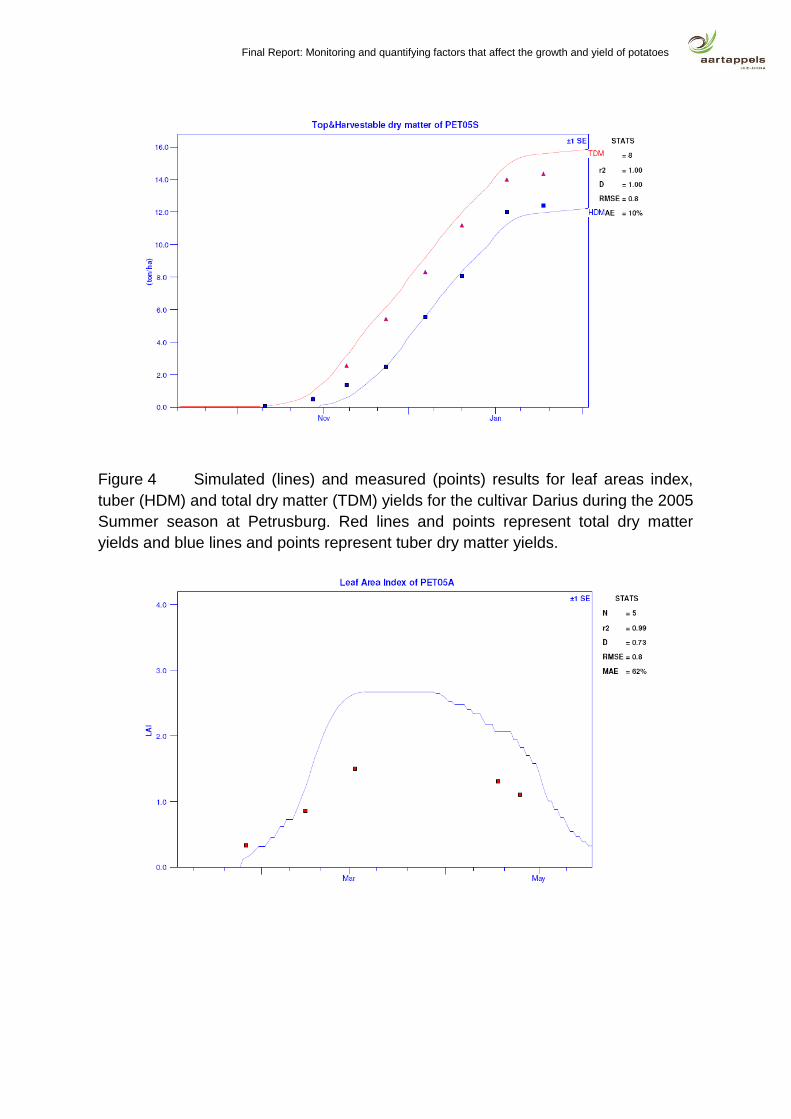
Figure 4 shows the simulated and measured values for LAI, tuber and total dry
matter yields for the cultivar Darius during the summer 2005 planting at Petrusburg.
The data generally compared well with measured values when using existing
summer parameters for Darius. In order to establish model performance for Darius
over different seasons, simulations were also run for the 2005 autumn season (the
growth analysis data were collected at Petrusburg during the 2004/05 report year).
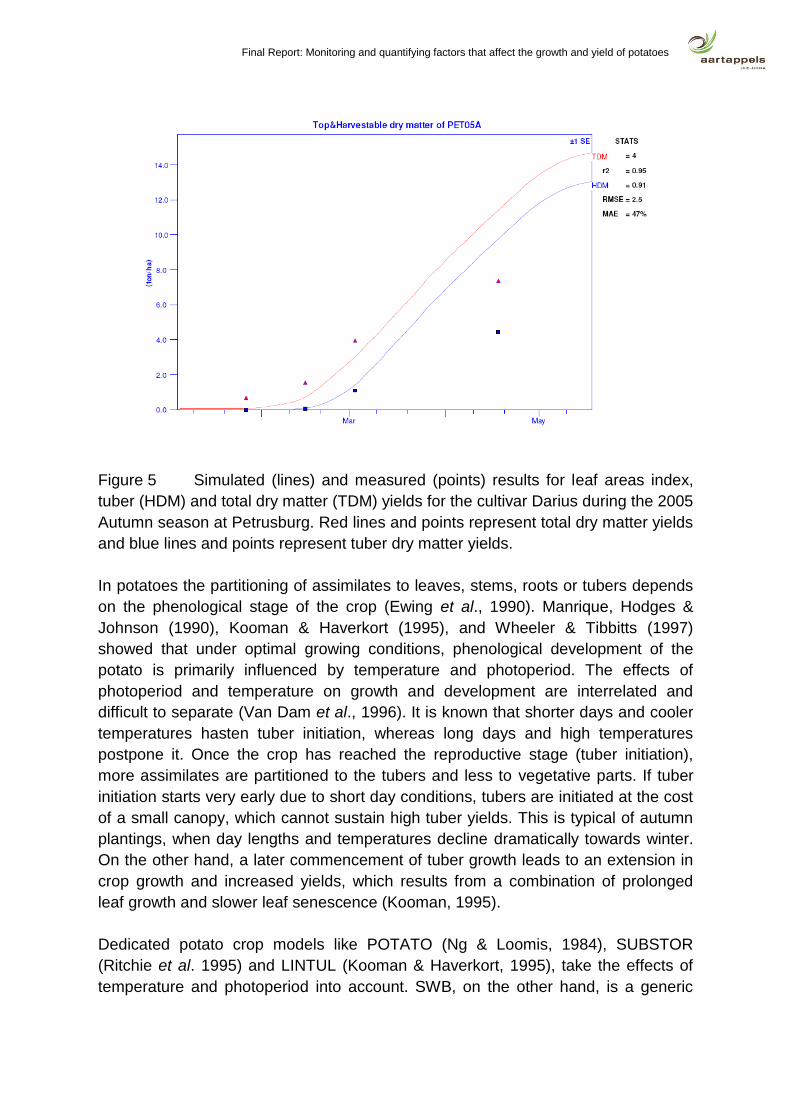
Simulation results for autumn generally performed poorly with measured values
when using summer model parameters for Darius (Figure 5). Both canopy size and
dry matter yields were over estimated. This clearly illustrates the current limitation of
SWB, namely that growth parameters determined for a certain growing season
cannot be used for simulating another season.
Final Report: Monitoring and quantifying factors that affect the growth and yield of potatoes
Figure 2 Simulated (lines) and measured (points) results for leaf areas index,
tuber (HDM) and total dry matter (TDM) yields for the cultivar Mondial during the
2006 Autumn season at Petrusburg. Red lines and points represent total dry matter
yields and blue lines and points represent tuber dry matter yields.
Final Report: Monitoring and quantifying factors that affect the growth and yield of potatoes
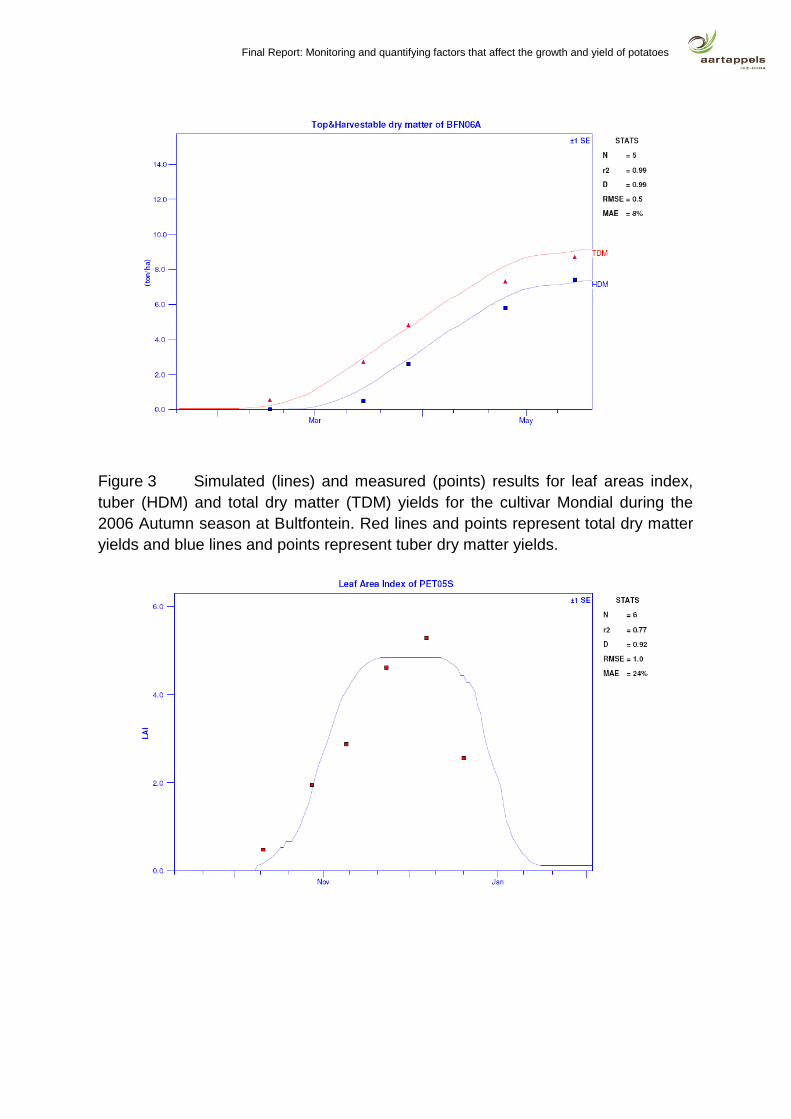
Figure 3 Simulated (lines) and measured (points) results for leaf areas index,
tuber (HDM) and total dry matter (TDM) yields for the cultivar Mondial during the
2006 Autumn season at Bultfontein. Red lines and points represent total dry matter
yields and blue lines and points represent tuber dry matter yields.
Final Report: Monitoring and quantifying factors that affect the growth and yield of potatoes
Figure 4 Simulated (lines) and measured (points) results for leaf areas index,
tuber (HDM) and total dry matter (TDM) yields for the cultivar Darius during the 2005
Summer season at Petrusburg. Red lines and points represent total dry matter
yields and blue lines and points represent tuber dry matter yields.
Final Report: Monitoring and quantifying factors that affect the growth and yield of potatoes
Figure 5 Simulated (lines) and measured (points) results for leaf areas index,
tuber (HDM) and total dry matter (TDM) yields for the cultivar Darius during the 2005
Autumn season at Petrusburg. Red lines and points represent total dry matter yields
and blue lines and points represent tuber dry matter yields.
In potatoes the partitioning of assimilates to leaves, stems, roots or tubers depends
on the phenological stage of the crop (Ewing et al., 1990). Manrique, Hodges &
Johnson (1990), Kooman & Haverkort (1995), and Wheeler & Tibbitts (1997)
showed that under optimal growing conditions, phenological development of the
potato is primarily influenced by temperature and photoperiod. The effects of
photoperiod and temperature on growth and development are interrelated and
difficult to separate (Van Dam et al., 1996). It is known that shorter days and cooler
temperatures hasten tuber initiation, whereas long days and high temperatures
postpone it. Once the crop has reached the reproductive stage (tuber initiation),
more assimilates are partitioned to the tubers and less to vegetative parts. If tuber
initiation starts very early due to short day conditions, tubers are initiated at the cost
of a small canopy, which cannot sustain high tuber yields. This is typical of autumn
plantings, when day lengths and temperatures decline dramatically towards winter.
On the other hand, a later commencement of tuber growth leads to an extension in
crop growth and increased yields, which results from a combination of prolonged
leaf growth and slower leaf senescence (Kooman, 1995).
Dedicated potato crop models like POTATO (Ng & Loomis, 1984), SUBSTOR
(Ritchie et al. 1995) and LINTUL (Kooman & Haverkort, 1995), take the effects of
temperature and photoperiod into account. SWB, on the other hand, is a generic
Final Report: Monitoring and quantifying factors that affect the growth and yield of potatoes
crop model and the onset of the reproductive stage is only determined by thermal
time (temperature dependent). SWB calculates thermal time by using an algorithm
developed by Monteith (1977). According to this approach plant development rate
increases as a linear function of average temperature between a base and an
optimal temperature. However, for potato, a non linear dependence of development
on temperature was suggested (Sands, Hackett & Nix, 1979). Manrique & Hodges
(1989) used the non linear temperature response function developed by Sands et al.
(1979) and found it adequate to describe the thermal time required for the onset of
tuber initiation. Since SWB is a generic model, the linear relationship between
development and temperature is convenient because it must not only apply to
potato but also to other crops. Gayler et al. (2002) suggested that generic models
may require modification from a single process formulation where differences occur
in physiological and ecological principles between crop classes, such as cereals and
root crops. To overcome these limitations in SWB, different sets of parameters were
developed for spring and autumn plantings. This approach worked reasonably well
(Steyn, 1997), but there are clearly shortcomings in the mechanistic description of
potato growth and development. The challenge is, therefore, to have one set of crop
parameters per cultivar that could be used to accurately simulate potato growth,
development, yield as well as the soil water balance components for different
growing seasons.
The approaches followed by dedicated potato models were studied to establish
whether the effect of photoperiod on crop growth and development could be
accommodated into SWB. Most of these models consider photoperiod only for the
first part of the growing season (from emergence until tuber initiation). Seven
different methods of calculating the thermal time required to reach tuber initiation
were investigated (Kagabo, 2006). These methods were used to calculate the onset
of tuber growth for different growing seasons, using the cultivar BP1. The calculated
days between emergence and tuber initiation were then compared to measured
data from five historical data sets, collected over several seasons and locations. The
seven calculation methods were as follows:
Method 1: Daily thermal time was calculated using the SWB (Annandale et al.,
1999) approach, in which plant development rate increases as a linear function of
average temperature between a base and an optimal temperature:
bnx T
2
TTGDD
(1)
where,
Tx is maximum temperature, Tn is minimum temperature and Tb is base
temperature below which there is no more growth and development.
Final Report: Monitoring and quantifying factors that affect the growth and yield of potatoes
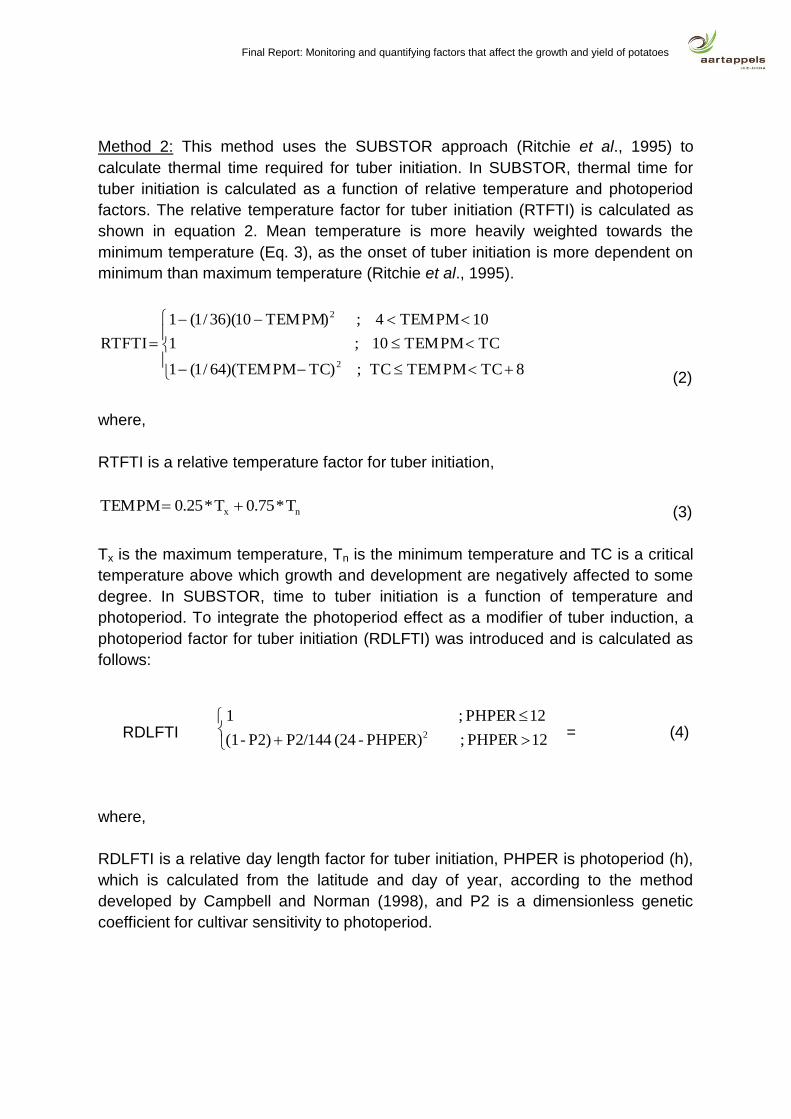
Method 2: This method uses the SUBSTOR approach (Ritchie et al., 1995) to
calculate thermal time required for tuber initiation. In SUBSTOR, thermal time for
tuber initiation is calculated as a function of relative temperature and photoperiod
factors. The relative temperature factor for tuber initiation (RTFTI) is calculated as
shown in equation 2. Mean temperature is more heavily weighted towards the
minimum temperature (Eq. 3), as the onset of tuber initiation is more dependent on
minimum than maximum temperature (Ritchie et al., 1995).
8TCTEMPMTC;)TCTEMPM)(64/1(1
TCTEMPM10;1
10TEMPM4;)TEMPM10)(36/1(1
RTFTI
2
2
(2)
where,
RTFTI is a relative temperature factor for tuber initiation,
nx T*75.0T*25.0TEMPM (3)
Tx is the maximum temperature, Tn is the minimum temperature and TC is a critical
temperature above which growth and development are negatively affected to some
degree. In SUBSTOR, time to tuber initiation is a function of temperature and
photoperiod. To integrate the photoperiod effect as a modifier of tuber induction, a
photoperiod factor for tuber initiation (RDLFTI) was introduced and is calculated as
follows:
= (4) RDLFTI
where,
RDLFTI is a relative day length factor for tuber initiation, PHPER is photoperiod (h),
which is calculated from the latitude and day of year, according to the method
developed by Campbell and Norman (1998), and P2 is a dimensionless genetic
coefficient for cultivar sensitivity to photoperiod.
12 PHPER ; PHPER) - (24 P2/144 P2) - (1
12 PHPER ; 12
Final Report: Monitoring and quantifying factors that affect the growth and yield of potatoes
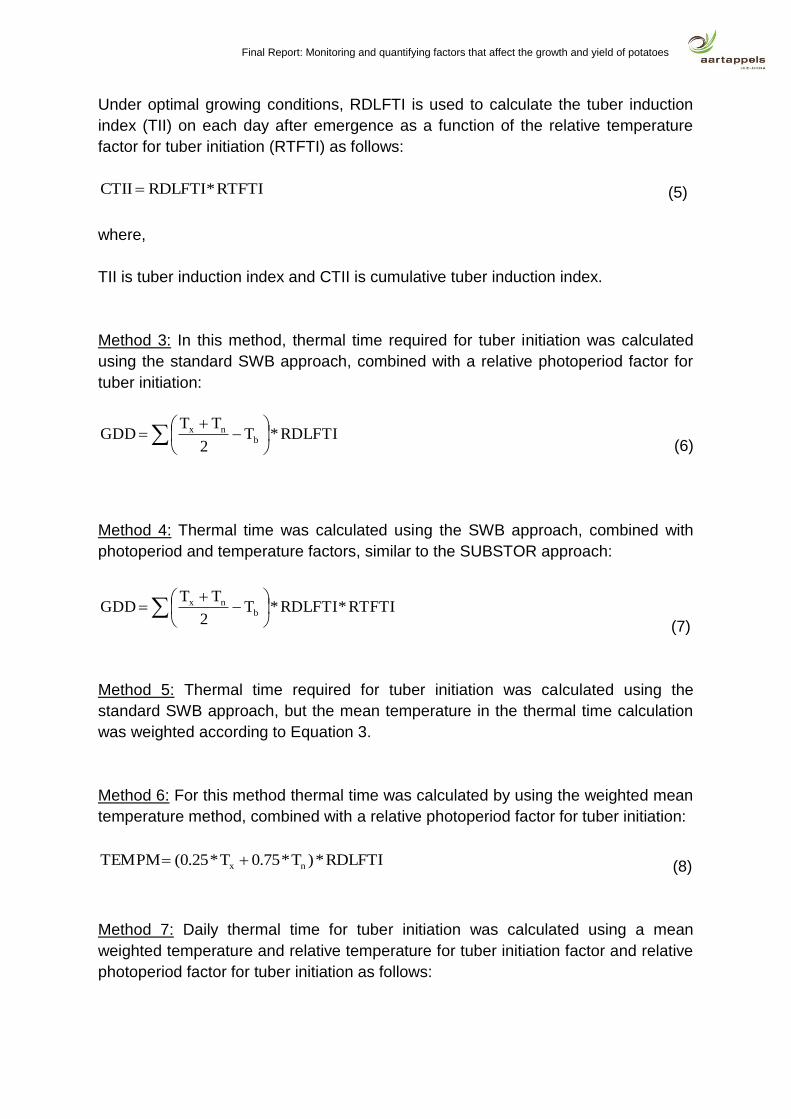
Under optimal growing conditions, RDLFTI is used to calculate the tuber induction
index (TII) on each day after emergence as a function of the relative temperature
factor for tuber initiation (RTFTI) as follows:
RTFTI*RDLFTICTII (5)
where,
TII is tuber induction index and CTII is cumulative tuber induction index.
Method 3: In this method, thermal time required for tuber initiation was calculated
using the standard SWB approach, combined with a relative photoperiod factor for
tuber initiation:
(6)
Method 4: Thermal time was calculated using the SWB approach, combined with
photoperiod and temperature factors, similar to the SUBSTOR approach:
RTFTI*RDLFTI*T2
TTGDD b
nx
(7)
Method 5: Thermal time required for tuber initiation was calculated using the
standard SWB approach, but the mean temperature in the thermal time calculation
was weighted according to Equation 3.
Method 6: For this method thermal time was calculated by using the weighted mean
temperature method, combined with a relative photoperiod factor for tuber initiation:
RDLFTI*)T*75.0T*25.0(TEMPM nx (8)
Method 7: Daily thermal time for tuber initiation was calculated using a mean
weighted temperature and relative temperature for tuber initiation factor and relative
photoperiod factor for tuber initiation as follows:
RDLFTI*T2
TTGDD b
nx
Final Report: Monitoring and quantifying factors that affect the growth and yield of potatoes
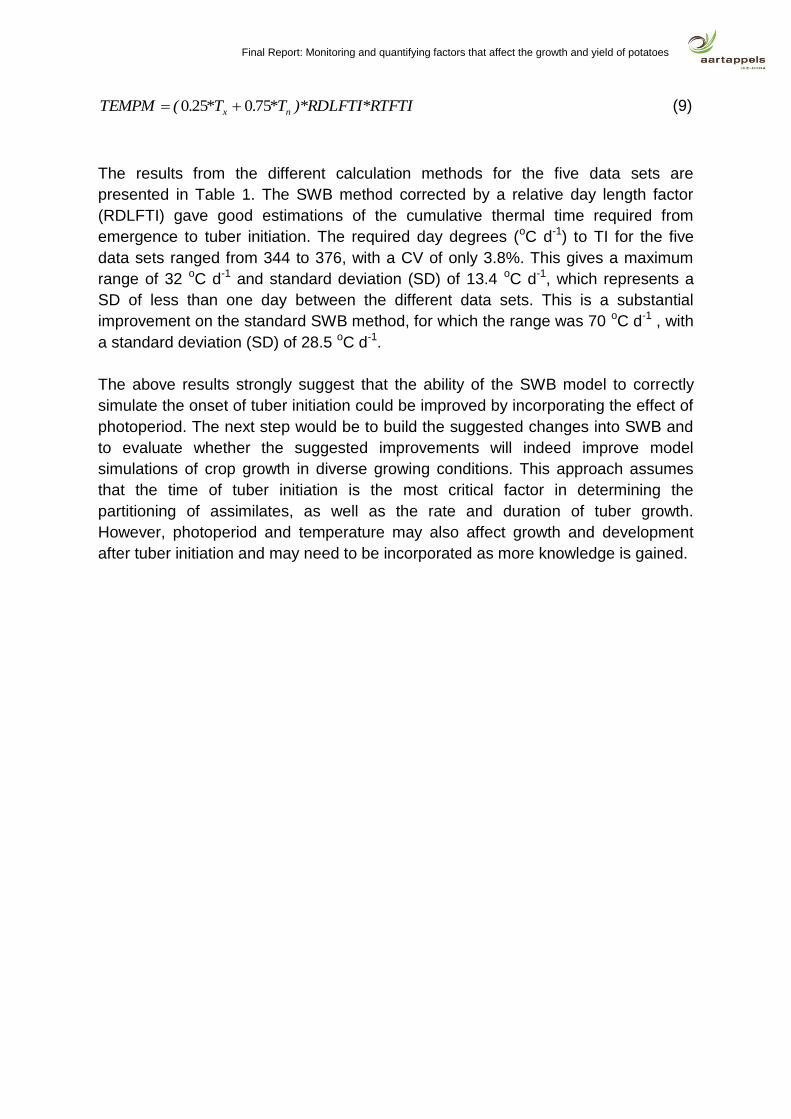
TFTI)*RDLFTI*R*T.*T.(TEMPM nx 750250 (9)
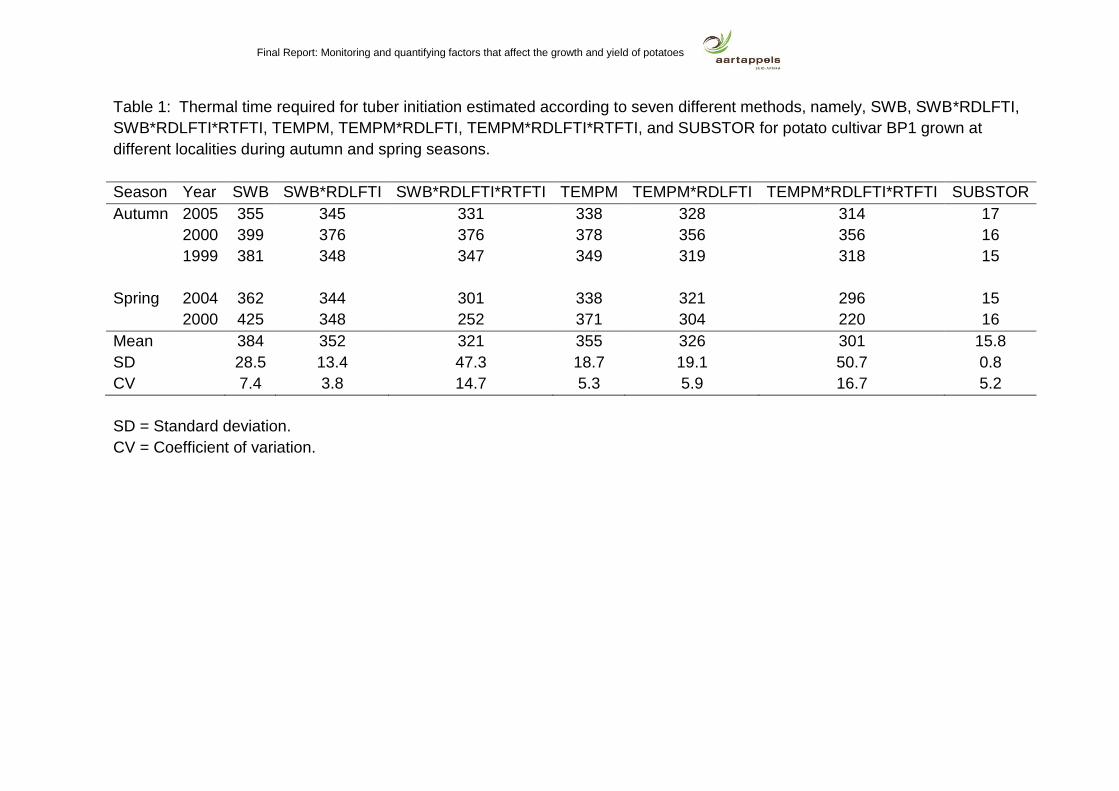
The results from the different calculation methods for the five data sets are
presented in Table 1. The SWB method corrected by a relative day length factor
(RDLFTI) gave good estimations of the cumulative thermal time required from
emergence to tuber initiation. The required day degrees (oC d-1) to TI for the five
data sets ranged from 344 to 376, with a CV of only 3.8%. This gives a maximum
range of 32 oC d-1 and standard deviation (SD) of 13.4 oC d-1, which represents a
SD of less than one day between the different data sets. This is a substantial
improvement on the standard SWB method, for which the range was 70 oC d-1 , with
a standard deviation (SD) of 28.5 oC d-1.
The above results strongly suggest that the ability of the SWB model to correctly
simulate the onset of tuber initiation could be improved by incorporating the effect of
photoperiod. The next step would be to build the suggested changes into SWB and
to evaluate whether the suggested improvements will indeed improve model
simulations of crop growth in diverse growing conditions. This approach assumes
that the time of tuber initiation is the most critical factor in determining the
partitioning of assimilates, as well as the rate and duration of tuber growth.
However, photoperiod and temperature may also affect growth and development
after tuber initiation and may need to be incorporated as more knowledge is gained.
Final Report: Monitoring and quantifying factors that affect the growth and yield of potatoes
Table 1: Thermal time required for tuber initiation estimated according to seven different methods, namely, SWB, SWB*RDLFTI,
SWB*RDLFTI*RTFTI, TEMPM, TEMPM*RDLFTI, TEMPM*RDLFTI*RTFTI, and SUBSTOR for potato cultivar BP1 grown at
different localities during autumn and spring seasons.
Season Year SWB SWB*RDLFTI SWB*RDLFTI*RTFTI TEMPM TEMPM*RDLFTI TEMPM*RDLFTI*RTFTI SUBSTOR
Autumn 2005 355 345 331 338 328 314 17
2000 399 376 376 378 356 356 16
1999 381 348 347 349 319 318 15
Spring 2004 362 344 301 338 321 296 15
2000 425 348 252 371 304 220 16
Mean 384 352 321 355 326 301 15.8
SD 28.5 13.4 47.3 18.7 19.1 50.7 0.8
CV 7.4 3.8 14.7 5.3 5.9 16.7 5.2
SD = Standard deviation.
CV = Coefficient of variation.
Final Report: Monitoring and quantifying factors that affect the growth and yield of potatoes
20
Conclusions
Frequent growth analyses were conducted on plant samples collected from three
different localities, according to plan. SWB model simulations were run for each data
set and model outputs were compared to the growth analyses data. Comparison of
growth analysis data with SWB simulation results indicated that model performance
was generally good if the crop parameters corresponded with the growing season.
For example, SWB simulated crop growth of Darius in a summer planting at
Petrusburg well when summer crop parameters were used. However, if the same
crop parameters were used for a different growing season (e.g. autumn season at
Petrusburg), model performance was poor. These results confirm the limitation of
SWB not being able to accommodate the effects of different growing seasons on
potato crop growth, development and yield.
The potato is photoperiod sensitive, as it influences the rate of growth and
development of the crop. Short days and cooler temperatures promote tuber
initiation, while long days and higher temperatures postpone tuber initiation. Once
tuber initiation has started, more assimilates are partitioned to the reproductive parts
and less to the canopy. Depending whether tuber initiation is early or late, this will
impact on dry matter production and distribution, which will determine the canopy
size and final tuber yield.
Models should be able to accommodate the effects of photoperiod on growth in
order to ensure accurate simulations. The SWB model is a generic model, which
was not specifically developed for potatoes, but has been used successfully for the
irrigation management of this crop. Improvements to SWB in order to accurately
simulate plant growth and water usage in different environments will widen the
application value thereof. It is, therefore, proposed that an algorithm that takes the
effect of photoperiod into account be incorporated into SWB.
From the results presented above it can be concluded that all the objectives set for
the year were attained. This first modelling attempt only focussed on the SWB
model as an irrigation scheduling tool for potatoes. However, the collected data sets
could also be very valuable if the need arise to calibrate and validate other potato
specific growth models for locally produced potato cultivars. Such models can be
very useful for planning and scenario analysis purposes in the hands of decision
and policy makers. The divergent conditions under which potatoes are grown in SA,
and the acute shortage of potato agronomists, dictates the use of modelling as one
of the few remaining viable options for solving production problems in the future.
Final Report: Monitoring and quantifying factors that affect the growth and yield of potatoes
21
REFERENCES
ANNANDALE, J.G., BENADE, N., JOVANOVIC, N.Z., STEYN, J.M. & DU SAUTOY,
N. 1999. Facilitating irrigation scheduling by means of the Soil Water Balance
model, University of Pretoria, submitted to the Water Research Commission, WRC
Report No 753/1/99.
CAMPBELL, G.S. and NORMAN, J.M. 1998. An Introduction to Environmental
Biophysics. Springer-verlag, New York.
DE JAGER, J.M. 1994. Accuracy of vegetation evaporation ratio formulae for
estimating final wheat yield. Water SA. 20 (4), 307-314.
EWING, E.E., HEYM, W.D., BATUTIS, E.J., SNYDER, R.G., BEN KHEDHER, M.,
SANDLAN, K.P. & TURNER, A.D. 1990. Modifications to the simulation model
POTATO for use in New York. Agricultural Systems 33, 173-192.
GAYLER, S., WANG, E., PRIESACK, E., SCHAAF, T. & MAIDI, F.X. 2002.
Modelling biomass growth, N-uptake and phenological development of potato crop.
Geordema 105, 367-383.
KOOMAN, P.L. 1995. Yielding ability of potato crops as influenced by temperature
and daylength. Ph.D. Thesis, Wageningen Agricultural University. The Netherlands.
KOOMAN, P.L. & HAVERKORT, A.J. 1995. Modelling development and growth of
the potato crop influenced by temperature and day length: LINTUL-POTATO. In
Haverkort, A.J. and Mackerron D.K.L. (eds.). Potato ecology and modelling of crops
under conditions limiting growth, 41-60. Kluwer Academic Publishers. The
Netherlands.
KOOMAN, P.L., FAHEM, M., TEGERA, P. & HAVERKORT, A.J. 1996. Effects of
climate on different potato genotypes. I: Radiation interception, total dry matter
production and tuber yield. European Journal of Agronomy 5,193–205.
MANRIQUE, L.A., HODGES, T. & JOHNSON, B.S. 1990. Genetic variables for
potato. Am. Potato J. 67, 669-683.
MANRIQUE, L.A. & HODGES, T. 1989. Estimation of tuber initiation in potatoes
grown in tropical environments based on different methods of computing
thermal time. Am. Potato J. 66, 425-436.
MONTEITH, J. L. 1977. Climate and efficiency of crop production in Britain. Philos.
trans. R. Soc. London, Ser. B 281, 277-294.
Final Report: Monitoring and quantifying factors that affect the growth and yield of potatoes
22
NG, E. and LOOMIS, R.S. 1984. Simulation of growth and yield of the potato crop.
Simulation Monographs. Wageningen: Pudoc.
RITCHIE, J.T., GRIFFIN, T.S. & JONHSON, B.S. 1995. SUBSTOR: functional
model of growth, development and yield. In: KABAT, P., MARSHALL, B.,VAN DEN
BROEK, B.J., VOS, J. and VAN KEULEN, H. (eds.). Modelling and
parameterisation of the Soil - Plant - Atmosphere System. A Comparison of potato
Growth Models, 401-405. Wageningen Pers, The Netherlands.
STEYN, J.M. 1997. Response of potato genotypes to different water regimes. PhD.
Thesis, University of Pretoria, Pretoria.
THERON, D.J. 2003. Background. The South African potato industry in perspective.
In: NIEDERWIESER, J.G. (eds.,). Guide to potato production in South Africa, 1-6.
CPD Printers, Pretoria, SA.
VAN DAM, J., KOOMAN, P. L. & STRUIK, P.C. 1996. Effects of temperature and
photoperiod on early growth and final number of tubers in potato (Solanum
tuberosum L.). Potato Research 39, 51-62
WHEELER, R.M. and TIBBITTS, T.W. 1997. Influence of changes in day length and
carbon dioxide on the growth of potato. Annals of Botany 79, 529-533.
Final Report: Monitoring and quantifying factors that affect the growth and yield of potatoes
23
REPORT YEAR 2006-8
GOAL
To investigate the effect of climate and production practices on the growth,
development and yield of potatoes.
ABSTRACT - 2008
In South Africa, potatoes are produced in different geographical areas with a wide
range of soils and climatic conditions. This requires cultivar and area specific
production programmes in order to produce good yields of high quality. The most
important environmental factors influencing potato yield and quality are radiation,
temperature and day length. Crop growth and yield responses to different
environments were studied at three localities (Dendron, Petrusburg and Bultfontein)
over the past four years. Complete data sets containing daily weather data, growth
analyses data and final tuber yields were recorded for each location.
The collected data clearly illustrated that crop growth and yields varied substantially
for the different localities, growing seasons and cultivars. Many interrelated factors
affect crop growth, development and tuber yield, which often make it difficult to
predict crop response to a specific environment. Crop models are useful tools to
help us understand the mechanisms involved and to predict how potato growth and
yield will respond to a certain set of conditions. Such models are useful for
management, planning, policy making and scenario analyses. In practice, crop
growth models can, for example be used to estimate yield potential for a certain
production area.
All collected information was collated in a complete database and can be used to
validate or improve existing crop models. As an example, the existing SWB irrigation
management model has been improved to accommodate the effects of photoperiod
on potato growth, water use and yield. It is foreseen that the data will also be very
useful for the evaluation of potato-specific models, such as SUBSTOR, under local
conditions. Such models can be useful to estimate yield potential and identify yield-
limiting factors. This approach has been applied successfully in other parts of the
world, such as Europe and the USA.
OPSOMMING (Afrikaans) - 2007
Plantmonsters vir groeianalises is gereeld vanaf drie lokaliteite geneem, naamlik
Dendron, Petrusburg and Bultfontein. Die drie lokaliteite verteenwoordig
verskillende groeiseisoene (winter, somer en herfs) en drie cultivars is gebruik
(Darius, BP1 and Mondial).
Final Report: Monitoring and quantifying factors that affect the growth and yield of potatoes
24
Die versamelde data het aansienlike verskille getoon in die groeitempo’s en finale
loofbedekking, knolopbrengste en totale droëmateriaal opbrengste wat verkry is.
Hierdie verskille was te wagte en kan hoofsaaklik toegeskryf word aan
cultivarverskille, asook die effek van omgewing.
Hierdie groeianalise resultate benadruk die feit dat verskeie interafhanklike faktore
aartappel groei, ontwikkeling en knolopbrengs bepaal. Die invloed van hierdie
faktore is gekompliseerd en dikwels moeilik om te verstaan. Gewasmodelle verskaf
aan ons een van die beste hulpmiddels om die meganismes wat betrokke is te help
verstaan. Dit kan verder ook gebruik word om te voorspel hoe aartappelgroei en
opbrengs sal reageer op ‘n sekere kombinasie van eksterne faktore.
Die SWB model is primêr ontwikkel as ‘n besproeiing skedulering hulpmiddel, maar
simuleer ook gewasgroei en opbrengs. Die model is in die verlede al suksesvol
gebruik om besproeiing by aartappels te simuleer, hoewel dit nie ‘n toegewyde
aartappel model is nie. Een van die beperkings was dat SWB nie voorsiening
gemaak het vir fotoperiode sensitiewe gewasse nie. Aartappels is egter fotoperiode
sensitief, aangesien daglengte die tempo van gewasgroei en ontwikkeling
beïnvloed. Om hierdie probleem te oorkom, is verskillende stelle gewasgroei
parameters in die model gebruik vir verskillende seisoene. Dit het egter nie altyd
akkurate simulasies verseker nie en daar is voorgestel dat SWB verbeter moet word
om te verseker dat gewasgroei en waterverbruik meer akkuraat in verskillende
omgewings voorspel kan word met ‘n enkele stel parameters per cultivar.
‘n Eerste poging is aangewend om ‘n algoritme wat die effek van fotoperiode in ag
neem, in SWB in the bou. Die SUBSTOR model se benadering tot fotoperiode is
gevolg. Die einddoel is om een stel gewasparameters per cultivar te hê wat
akkurate simulasies in ‘n verskeidenheid van omgewings sal verseker. Voorlopige
resultate na afloop van die verbeteringe was belowend en het getoon dat
gewasgroei simulasies aansienlik verbeter het, veral vir ‘n herfs seisoen wat
voorheen problematies was. Verdere evaluasies en moontlike modifikasies mag
egter nodig wees om te verseker dat die verbeterde SWB model akkurate
simulasies onder ‘n wyer reeks klimaatstoestande en vir ‘n verskeidenheid cultivars
sal lewer. Daar word geglo dat indien hierdie verbeteringe suksesvol is, dit die
toepassingswaarde van die model aansienlik sal uitbrei.
Die huidige benadering neem aan dat fotoperiode die belangrikste faktor is by die
bepaling van knolinisiasie. Ons weet egter dat temperatuur ook ‘n belangrike rol
daarin kan speel. Dit mag gevolglik nodig wees om die effek van temperatuur op die
aanvang van knolinisiasie ook aan te spreek.
Final Report: Monitoring and quantifying factors that affect the growth and yield of potatoes
25
Die gevolgtrekking kan gemaak word dat al die doelwitte wat vir die afgelope jaar
gestel is, wel bereik is. As eerste stap is daar gepoog om die SWB model vir
aartappels te verbeter. In die toekoms kan die groeianalise data wat in die uitvoering
van hierdie studie ingesamel is, ook waardevol aangewend kan word om toegewyde
aartappelmodelle te kalibreer en valideer vir Suid-Afrikaanse cultivars en toestande.
SUMMARY
Plant samples for growth analyses were frequently collected from three localities,
namely Dendron, Petrusburg and Bultfontein. The three sites represented different
growing seasons (winter, summer and autumn) and three cultivars were used
(Darius, BP1 and Mondial).
The collected data showed substantial variation in crop growth rates and final values
obtained for canopy size, tuber yields and total dry matter yields. These variations
were to be expected and could mainly be attributed to cultivar differences, as well as
the effect of growing season.
These growth analysis results highlighted the fact that many interrelated factors
affect potato crop growth, development and tuber yield. The effects of these factors
are complicated and often difficult to understand. Crop models provide us with one
of the best tools to help understand these mechanisms involved, as well as to
predict how potato growth and yield will respond to a certain combination of external
factors.
The SWB model is primarily an irrigation scheduling tool, but also simulates crop
growth. It has previously been used successfully to schedule potatoes, although it is
not a dedicated potato model. One limitation of SWB was that it did not cater for the
effect of photoperiod on crop growth. The potato is photoperiod sensitive, which
influences the rate of crop growth and development. To overcome this problem,
different sets of crop parameters were used for different seasons. This did not
always work well, and improvements to SWB were proposed in order to more
accurately simulate plant growth and water usage in different environments, using a
single set of crop parameters per cultivar.
A first attempt was made to build an algorithm into the SWB model that would take
the effect of photoperiod into account. The SUBSTOR model approach was
followed, with the ultimate goal to be able to use only one set of crop parameters
per cultivar that would work well in a range of different environments. Initial results
obtained after these modifications indicated that the accuracy of crop growth
simulations was substantially improved, especially for an autumn planting, which
proved to be problematic in the past. However, further evaluation and improvements
are necessary to ensure that the adapted SWB model will perform well for all the
Final Report: Monitoring and quantifying factors that affect the growth and yield of potatoes
26
cultivars used and under a wider range of climatic conditions. It is believed that if
successful, this will broaden the application value of the model.
The current approach assumes that photoperiod is the overriding factor that
determines the time of tuber initiation. However, we know that temperature also
plays a major role in this and it may also be necessary to incorporate temperature
effects on tuber initiation in future.
It can be concluded that all the objectives set for the year were achieved. As a first
step the focus was only on the improvement of the SWB model for potatoes. In
future the collected field data sets will be valuable for the calibration and validation
of other potato specific growth models for local conditions and potato cultivars.
OBJECTIVES FOR 2006/2007
The objectives for the reporting period were to conduct frequent destructive harvests
during the growing season, with the aim of investigating the effect of different
environments (climatic conditions) on potato growth, development and yield. The
growth analyses were planned for potatoes produced in three production areas,
namely Dendron (winter planting), Bultfontein (autumn planting) and Petrusburg
(summer planting).
A second objective was to investigate the possibility of improving the SWB model by
incorporation photoperiod into the model.
PROGRESS REPORT
Introduction
In South Aftrica potatoes are produced almost all year round in the various
production areas. The result thereof if that the crop is exposed to diverse climatic
conditions, which will influence crop growth and development. As a consequence
thereof, substantial differences in yield and quality are often obtained from different
production areas. From a scientific point of view, it is often difficult to explain or
predict crop response to a certain set of conditions. Crop models can be very useful
tools that could help scientists understand and predict possible outcomes in this
regard.
It is well known that the potato is a cool weather crop, which is grown under sub-
optimal conditions in most production regions of South Africa. Unfavourable
temperatures and photoperiods are the most important climatic factors that can
Final Report: Monitoring and quantifying factors that affect the growth and yield of potatoes
27
influence potato growth, yield and quality. Temperature is the main driving variable
that influences the rate of crop growth and development and, therefore, it also
determines the onset and duration of different growth stages (emergence, tuber
initiation, bulking and senescence) and partitioning of assimilates to different plant
parts (leaves, stems, roots and tubers). Daylength or photoperiod influences the
onset of tuber initiation and the length of the growing season of potatoes (Kooman
and Haverkort, 1996). The onset of tuber initiation plays a very important role in crop
growth and development and finally on tuber yield. Tuber initiation is postponed by
high temperatures and long days during the vegetative crop growth stage.
In order to predict potato crop response to the different environments resulting from
the various production areas, it is essential to understand the effect of these
environments on the crop. Science has proven in the past that modelling is one of
the best approaches to try to describe plant response to these interrelated factors.
SUBSTOR (Ritchie et al, 1995) and LINTUL (Kooman & Haverkort, 1995) are
examples of two potato-specific models that were developed word-wide. The
complexity and purpose of models vary tremendously. LINTUL Potato is an example
of a model that is aimed at predicting crop yields accurately, but it is mainly used by
scientists. On the other hand, SUBSTOR, which forms part of the DSSAT suite of
models, has been tested and used widely for crop growth and yield predictions. The
latter model is simpler and easier to use, with only a limited number of inputs
required. The SWB model (Annandale et al, 1999) was developed locally as a user
friendly irrigation scheduling tool. Although not a dedicated potato model, it has
previously been calibrated and successfully used for the irrigation management of a
range of potato cultivars in different regions of South Africa. However, as it is not a
dedicated potato model, one important factor, namely photoperiod, is not taken
account of. As a result, different sets of crop parameters had to be developed for
different growing seasons and planting dates to ensure accurate simulation of crop
growth and water use. However, this detracts from the application value of the
model and ideally a universal set of parameters per cultivar should be used. For that
to be possible, the effect of photoperiod on crop growth and development must be
incorporated in SWB.
Potentially, any good potato crop growth model could be used to help us understand
crop response to the above-mentioned climatic variables. Independent of which
model is used, actual crop growth data is essential for the calibration and validation
of any crop growth model. The growth analysis data collected in this study is
essential for the calibration and validation of such growth models. The purpose of
the current research work was, therefore, to build up a database of plant growth and
weather data from diverse production areas for the calibration and validation of crop
models.
Final Report: Monitoring and quantifying factors that affect the growth and yield of potatoes
28
Materials and Methods
Data collection
Trials were not specifically planted for this study, but plants were rather sampled
from existing commercial potato plantings of producers in three production areas.
Plants were frequently sampled throughout the growing season to follow the crop
growth curve. These production areas were selected to represent diverse growing
seasons and different cultivars were used. In the Dendron production area (Limpopo
province) the cultivar BP1 was used in a winter / spring season (planted in June
2006). Two locations in the Free State province were used, namely Petrusburg and
Bultfontein. At Petrusburg the cultivar Darius was used in a summer season
(planted August 2006) and at Bultfontein the cultivar Mondial was used in a summer
/ autumn season (planted January 2007).
Plant samples were taken about monthly at Dendron, while for Petrusburg and
Bultfontein samples were collected at fortnightly intervals. At each sampling time
point three replicated samples were taken from randomly selected positions in the
field. For each sample all the plant material from a 1 m row length was harvested.
The sample area ranged from 0.88 to 0.9 m2 each, depending on the row spacing
used. Samples were carefully packed and transported to Pretoria by courier. Growth
analyses were subsequently performed on the collected samples, including the
following measurements: leaf area, fresh leaf, stem and tuber mass. Plant samples
were then dried, whereafter dry leaf, stem and tuber masses were determined. For
each of the sites hourly weather data was collected throughout the growing
seasons, using automatic weather stations. The growth analyses and weather data
were collated in a database for possible inputs to future model simulations.
Modelling
During the report period, a first attempt was made to incorporate photoperiod
sensitivity into the SWB model with the aim of improving model accuracy for
potatoes grown in diverse climatic locations. The progress and preliminary findings
are reported here.
SWB model simulations were run for some of the sites and seasons where plant
growth data had been collected. The collected plant growth data was processed and
used for comparison with model simulations.
Final Report: Monitoring and quantifying factors that affect the growth and yield of potatoes
29
Results and Discussion
Growth analyses
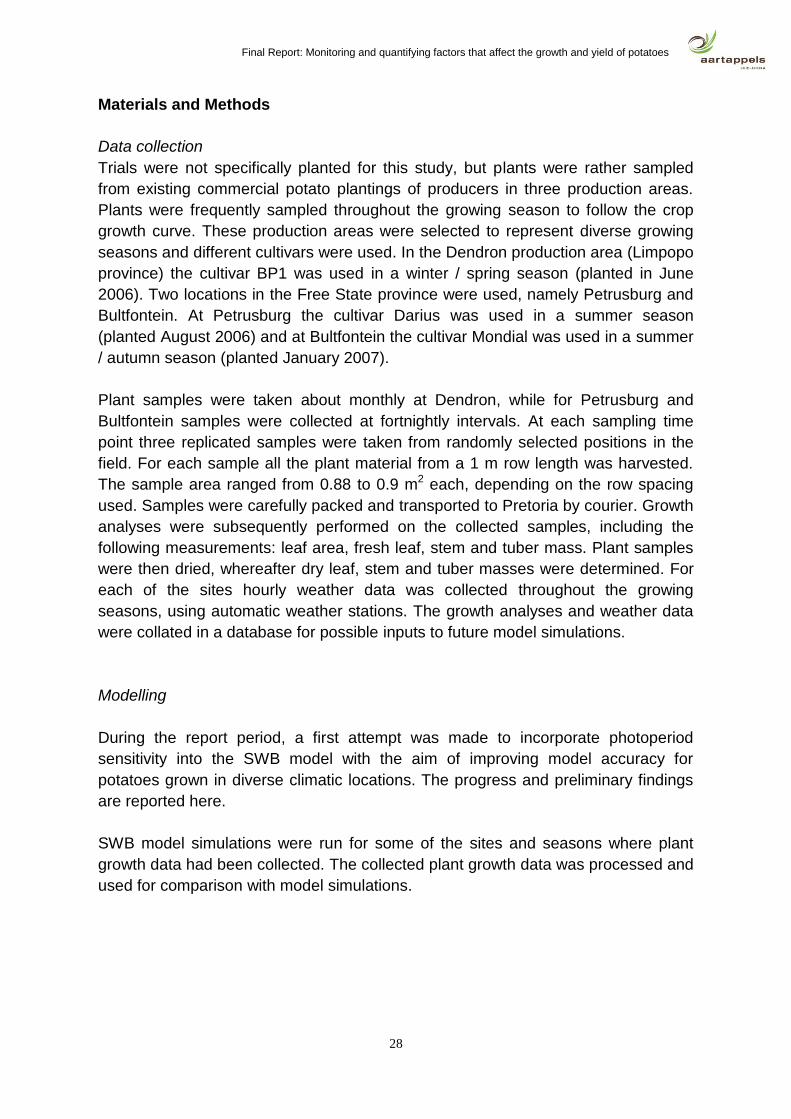
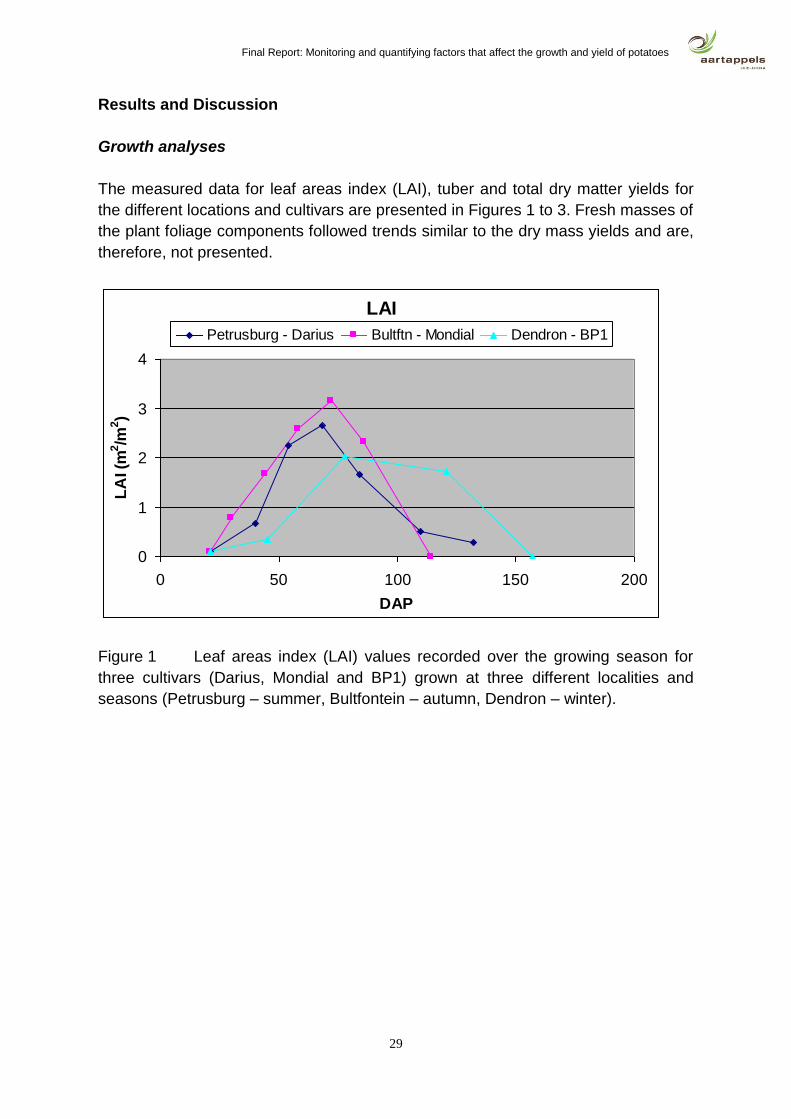
The measured data for leaf areas index (LAI), tuber and total dry matter yields for
the different locations and cultivars are presented in Figures 1 to 3. Fresh masses of
the plant foliage components followed trends similar to the dry mass yields and are,
therefore, not presented.
LAI
0
1
2
3
4
0 50 100 150 200
DAP
LA
I (m
2/m
2)
Petrusburg - Darius Bultftn - Mondial Dendron - BP1
Figure 1 Leaf areas index (LAI) values recorded over the growing season for
three cultivars (Darius, Mondial and BP1) grown at three different localities and
seasons (Petrusburg – summer, Bultfontein – autumn, Dendron – winter).
Final Report: Monitoring and quantifying factors that affect the growth and yield of potatoes
30
Total Dry Matter yield
0
4
8
12
16
0 50 100 150 200
DAP
To
tal d
ry m
att
er
(t/h
a)
Petrusburg - Darius Bultftn - Mondial Dendron - BP1
Figure 2 Total dry matter (TDM) yields recorded over the growing season for
three cultivars (Darius, Mondial and BP1) grown at three different localities and
seasons (Petrusburg – summer, Bultfontein – autumn, Dendron – winter).
Tuber Dry Mass
0
4
8
12
16
0 50 100 150 200
DAP
Tu
be
r d
ry m
as
s (
t/h
a)
Petrusburg - Darius Bultftn - Mondial Dendron - BP1
Figure 3 Tuber dry mass yields recorded over the growing season for three
cultivars (Darius, Mondial and BP1) grown at three different localities and seasons
(Petrusburg – summer, Bultfontein – autumn, Dendron – winter).
Final Report: Monitoring and quantifying factors that affect the growth and yield of potatoes
31
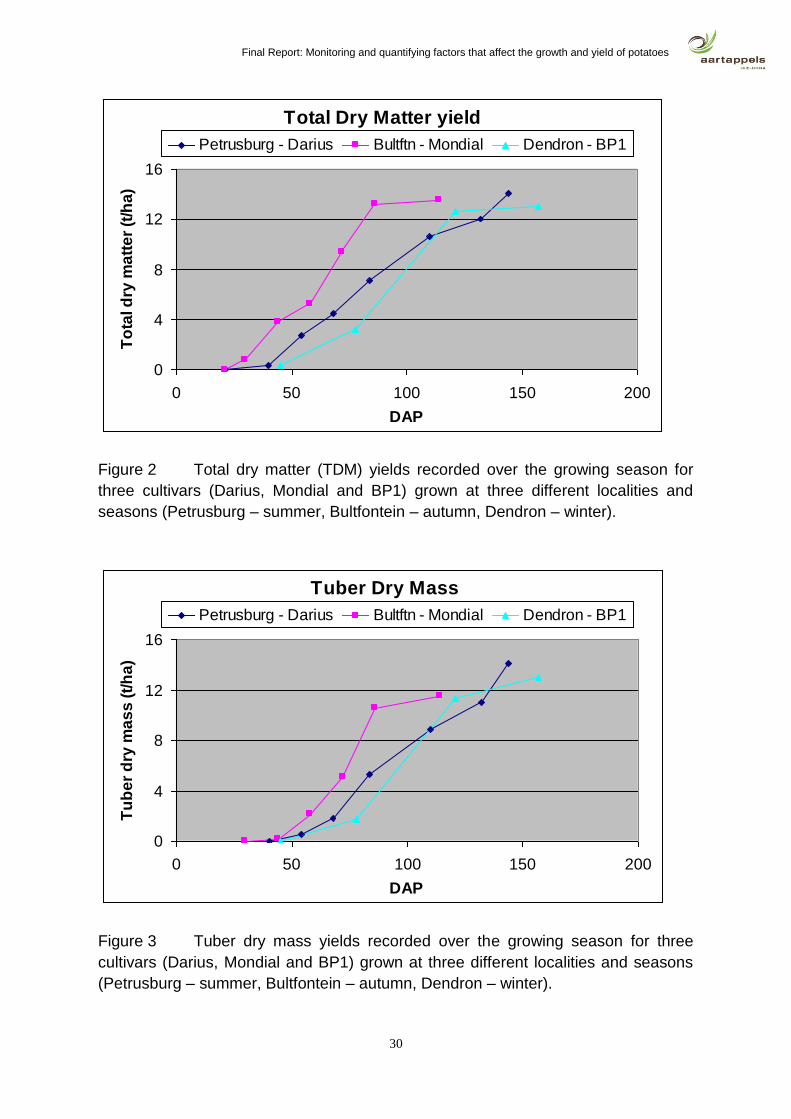
The graphs (Figures 1 to 3) show substantial cultivar / environment differences in
the rate of growth and the final maximum values obtained for all the measured
variables. These differences can firstly be ascribed to cultivar characteristics, e.g.
late maturity cultivars (long growing season), such as Darius, usually takes longer to
reach maximum canopy size. Late varieties usually also senesce later than medium
or early varieties, if grown under the same climatic conditions.
A second explanation for the observed differences is the difference in environments
under which the three cultivars were grown. At Dendron the crop was planted when
days are at their shortest and daily temperatures are low (June). This resulted in
slow initial growth rates, which accelerated as temperatures started to rise towards
summer. Days were also short (<12 hours) during the vegetative stage, which was
conducive to early tuber initiation. Conditions at Petrusburg was similar to those for
Dendron at planting (late August/September), except that days were already longer
and temperatures higher. This might have resulted in later tuber initiation and larger
canopies. At Bultfontein the crop was planted in late summer/autumn (late January),
when temperatures were very high and days long, which probably stimulated fast
initial crop growth. The crop then grew into a period of shorter and cooler days,
which probably resulted in earlier tuber initiation and a shorter growing season.
Tuber Fress Mass
0
20
40
60
80
0 50 100 150 200
DAP
Tu
be
r fr
es
h m
as
s (
t/h
a)
Petrusburg - Darius Bultftn - Mondial Dendron - BP1
Final Report: Monitoring and quantifying factors that affect the growth and yield of potatoes
32
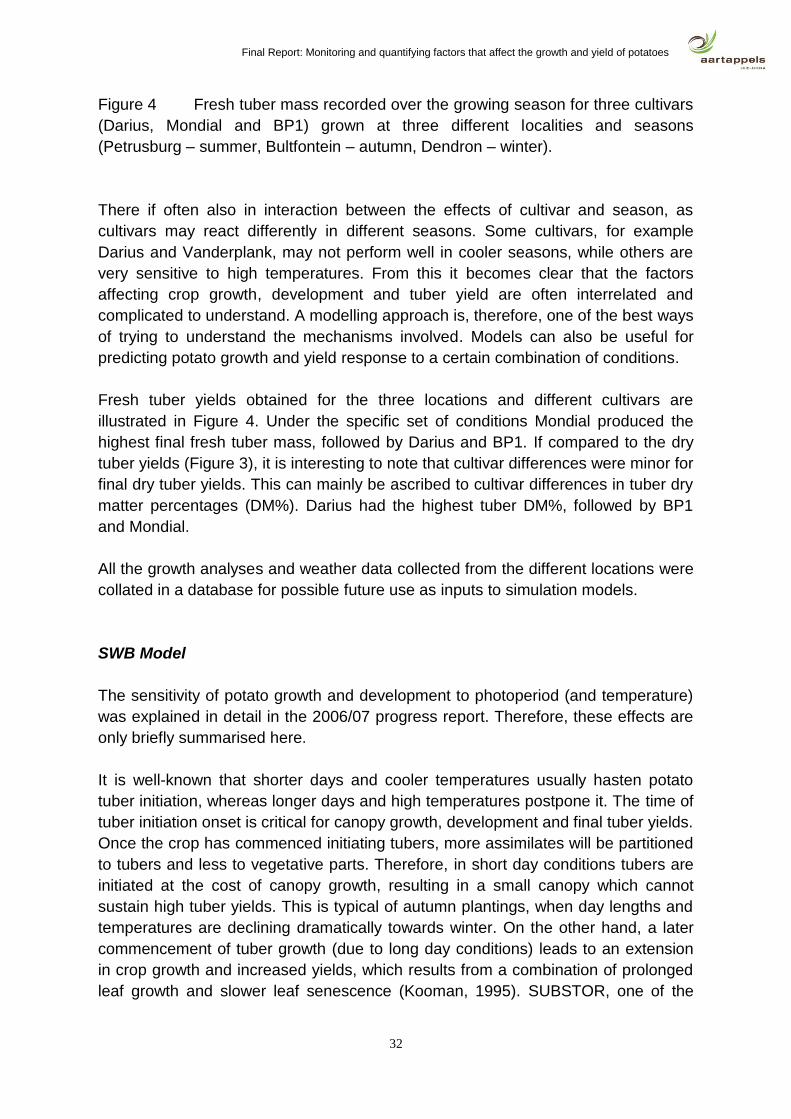
Figure 4 Fresh tuber mass recorded over the growing season for three cultivars
(Darius, Mondial and BP1) grown at three different localities and seasons
(Petrusburg – summer, Bultfontein – autumn, Dendron – winter).
There if often also in interaction between the effects of cultivar and season, as
cultivars may react differently in different seasons. Some cultivars, for example
Darius and Vanderplank, may not perform well in cooler seasons, while others are
very sensitive to high temperatures. From this it becomes clear that the factors
affecting crop growth, development and tuber yield are often interrelated and
complicated to understand. A modelling approach is, therefore, one of the best ways
of trying to understand the mechanisms involved. Models can also be useful for
predicting potato growth and yield response to a certain combination of conditions.
Fresh tuber yields obtained for the three locations and different cultivars are
illustrated in Figure 4. Under the specific set of conditions Mondial produced the
highest final fresh tuber mass, followed by Darius and BP1. If compared to the dry
tuber yields (Figure 3), it is interesting to note that cultivar differences were minor for
final dry tuber yields. This can mainly be ascribed to cultivar differences in tuber dry
matter percentages (DM%). Darius had the highest tuber DM%, followed by BP1
and Mondial.
All the growth analyses and weather data collected from the different locations were
collated in a database for possible future use as inputs to simulation models.
SWB Model
The sensitivity of potato growth and development to photoperiod (and temperature)
was explained in detail in the 2006/07 progress report. Therefore, these effects are
only briefly summarised here.
It is well-known that shorter days and cooler temperatures usually hasten potato
tuber initiation, whereas longer days and high temperatures postpone it. The time of
tuber initiation onset is critical for canopy growth, development and final tuber yields.
Once the crop has commenced initiating tubers, more assimilates will be partitioned
to tubers and less to vegetative parts. Therefore, in short day conditions tubers are
initiated at the cost of canopy growth, resulting in a small canopy which cannot
sustain high tuber yields. This is typical of autumn plantings, when day lengths and
temperatures are declining dramatically towards winter. On the other hand, a later
commencement of tuber growth (due to long day conditions) leads to an extension
in crop growth and increased yields, which results from a combination of prolonged
leaf growth and slower leaf senescence (Kooman, 1995). SUBSTOR, one of the
Final Report: Monitoring and quantifying factors that affect the growth and yield of potatoes
33
dedicated potato crop models (Ritchie et al. 1995), suggests 12 hours as the critical
photoperiod for tuber initiation in potatoes. From experience it is known that planting
in summer is conducive to later tuber initiation due to longer days (>12 hours during
vegetative stage), while planting in autumn will result in shorter days (<12 hours
during the vegetative stage), which will enhance tuber initiation. Temperature also
plays a role in the onset of tuber initiation and these factors are, therefore,
interrelated.
The possible approaches employed by dedicated potato models to accommodate
photoperiod were reported on previously. Seven different methods of calculating the
thermal time required to reach tuber initiation were discussed (Kagabo, 2006). Two
of these methods showed the highest accuracy with regard to calculating the
number of days between emergence and tuber initiation, compared to measured
data from five historical data sets, collected over several seasons and locations. The
first is the SUBSTOR approach, in which the thermal time required to tuber initiation
is calculated as a function of relative temperature and photoperiod factors. Although
the effects of photoperiod and temperature on growth and development of potato
are interrelated and difficult to separate (Van Dam et al., 1996), initial results
indicated that photoperiod inclusion might have the largest impact on SWB
accuracy. It was, therefore, decided to first focus on the inclusion of photoperiod in
SWB, which might be followed by temperature inclusion at a later stage.
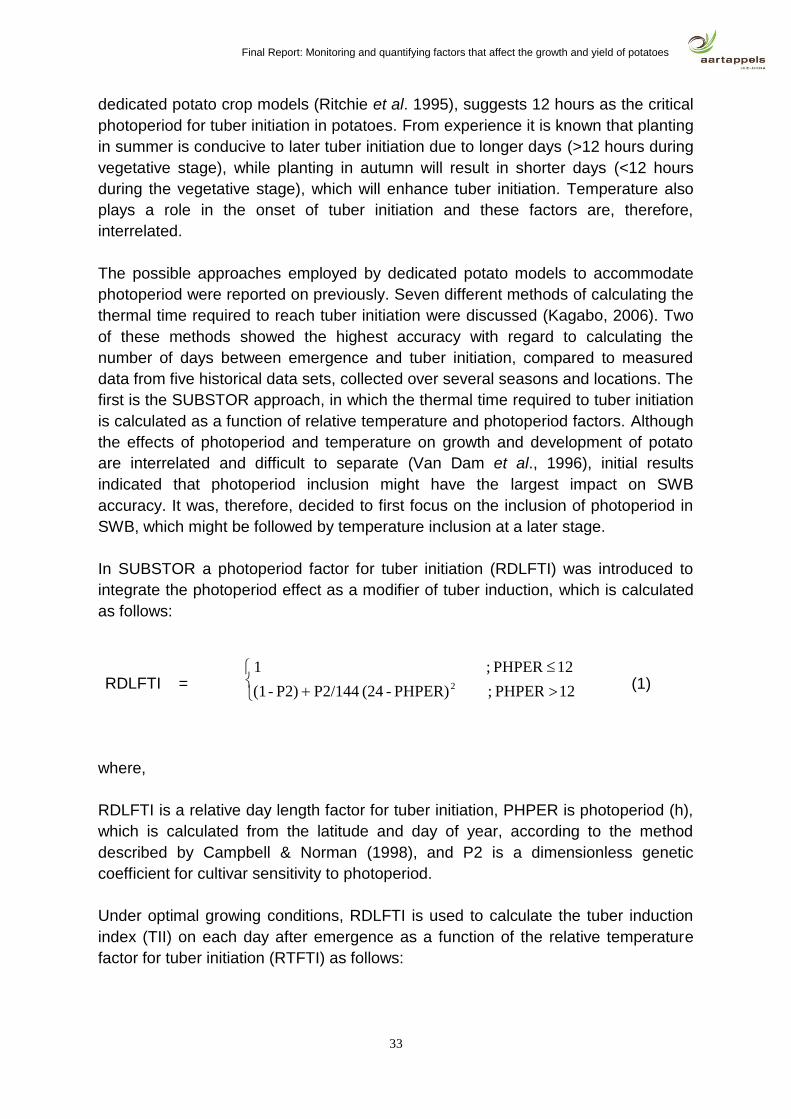
In SUBSTOR a photoperiod factor for tuber initiation (RDLFTI) was introduced to
integrate the photoperiod effect as a modifier of tuber induction, which is calculated
as follows:
RDLFTI = (1)
where,
RDLFTI is a relative day length factor for tuber initiation, PHPER is photoperiod (h),
which is calculated from the latitude and day of year, according to the method
described by Campbell & Norman (1998), and P2 is a dimensionless genetic
coefficient for cultivar sensitivity to photoperiod.
Under optimal growing conditions, RDLFTI is used to calculate the tuber induction
index (TII) on each day after emergence as a function of the relative temperature
factor for tuber initiation (RTFTI) as follows:
12 PHPER ; PHPER) - (24 P2/144 P2) - (1
12 PHPER ; 1
2
Final Report: Monitoring and quantifying factors that affect the growth and yield of potatoes
34
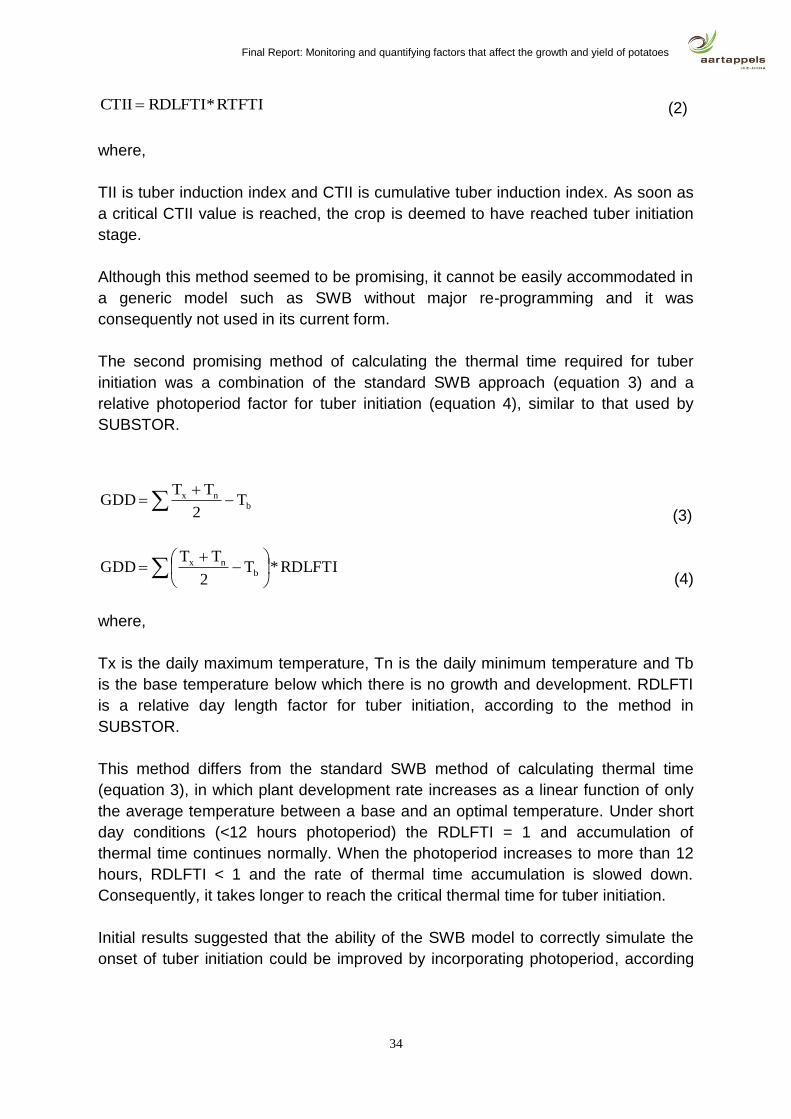
RTFTI*RDLFTICTII (2)
where,
TII is tuber induction index and CTII is cumulative tuber induction index. As soon as
a critical CTII value is reached, the crop is deemed to have reached tuber initiation
stage.
Although this method seemed to be promising, it cannot be easily accommodated in
a generic model such as SWB without major re-programming and it was
consequently not used in its current form.
The second promising method of calculating the thermal time required for tuber
initiation was a combination of the standard SWB approach (equation 3) and a
relative photoperiod factor for tuber initiation (equation 4), similar to that used by
SUBSTOR.
bnx T
2
TTGDD
(3)
(4)
where,
Tx is the daily maximum temperature, Tn is the daily minimum temperature and Tb
is the base temperature below which there is no growth and development. RDLFTI
is a relative day length factor for tuber initiation, according to the method in
SUBSTOR.
This method differs from the standard SWB method of calculating thermal time
(equation 3), in which plant development rate increases as a linear function of only
the average temperature between a base and an optimal temperature. Under short
day conditions (<12 hours photoperiod) the RDLFTI = 1 and accumulation of
thermal time continues normally. When the photoperiod increases to more than 12
hours, RDLFTI < 1 and the rate of thermal time accumulation is slowed down.
Consequently, it takes longer to reach the critical thermal time for tuber initiation.
Initial results suggested that the ability of the SWB model to correctly simulate the
onset of tuber initiation could be improved by incorporating photoperiod, according
RDLFTI*T2
TTGDD b
nx
Final Report: Monitoring and quantifying factors that affect the growth and yield of potatoes
35
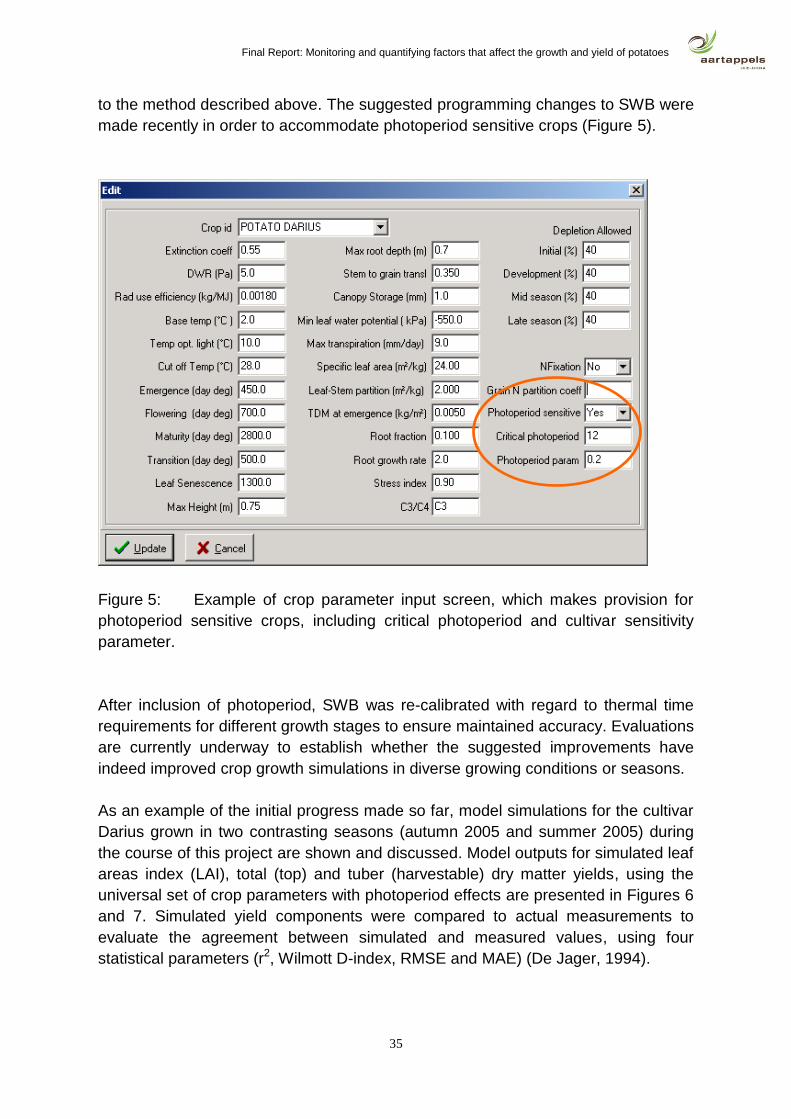
to the method described above. The suggested programming changes to SWB were
made recently in order to accommodate photoperiod sensitive crops (Figure 5).
Figure 5: Example of crop parameter input screen, which makes provision for
photoperiod sensitive crops, including critical photoperiod and cultivar sensitivity
parameter.
After inclusion of photoperiod, SWB was re-calibrated with regard to thermal time
requirements for different growth stages to ensure maintained accuracy. Evaluations
are currently underway to establish whether the suggested improvements have
indeed improved crop growth simulations in diverse growing conditions or seasons.
As an example of the initial progress made so far, model simulations for the cultivar
Darius grown in two contrasting seasons (autumn 2005 and summer 2005) during
the course of this project are shown and discussed. Model outputs for simulated leaf
areas index (LAI), total (top) and tuber (harvestable) dry matter yields, using the
universal set of crop parameters with photoperiod effects are presented in Figures 6
and 7. Simulated yield components were compared to actual measurements to
evaluate the agreement between simulated and measured values, using four
statistical parameters (r2, Wilmott D-index, RMSE and MAE) (De Jager, 1994).
Final Report: Monitoring and quantifying factors that affect the growth and yield of potatoes
36
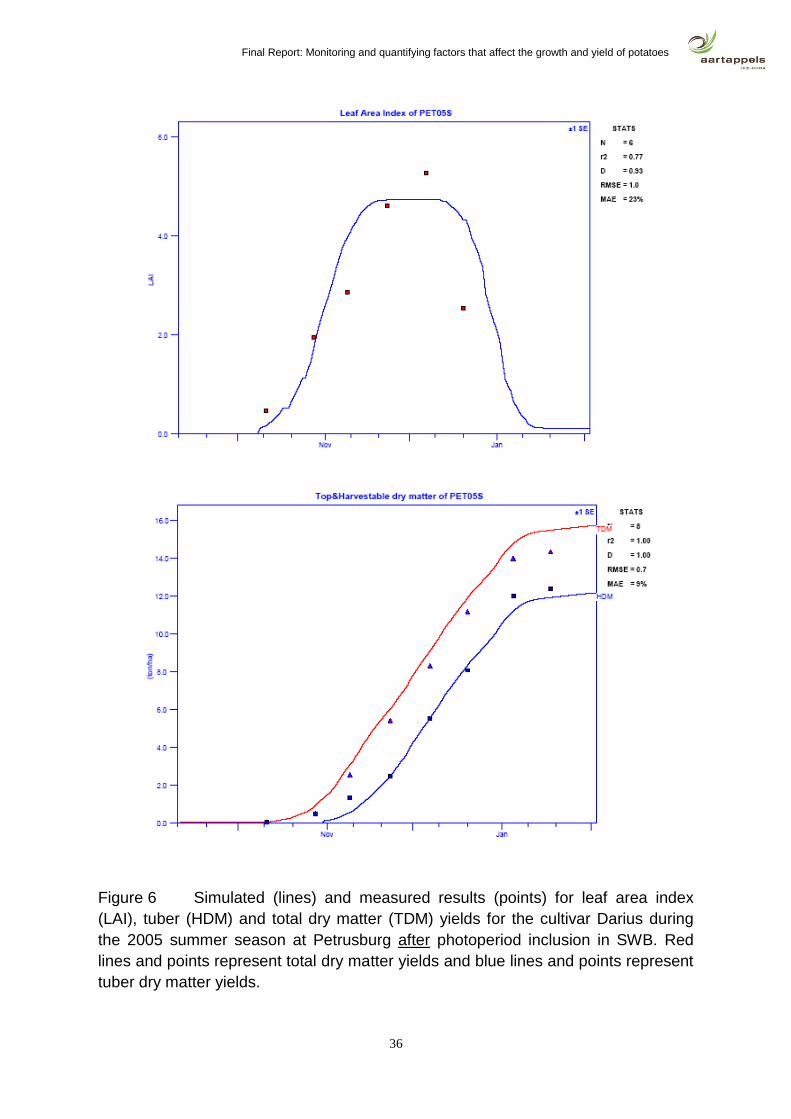
Figure 6 Simulated (lines) and measured results (points) for leaf area index
(LAI), tuber (HDM) and total dry matter (TDM) yields for the cultivar Darius during
the 2005 summer season at Petrusburg after photoperiod inclusion in SWB. Red
lines and points represent total dry matter yields and blue lines and points represent
tuber dry matter yields.
Final Report: Monitoring and quantifying factors that affect the growth and yield of potatoes
37
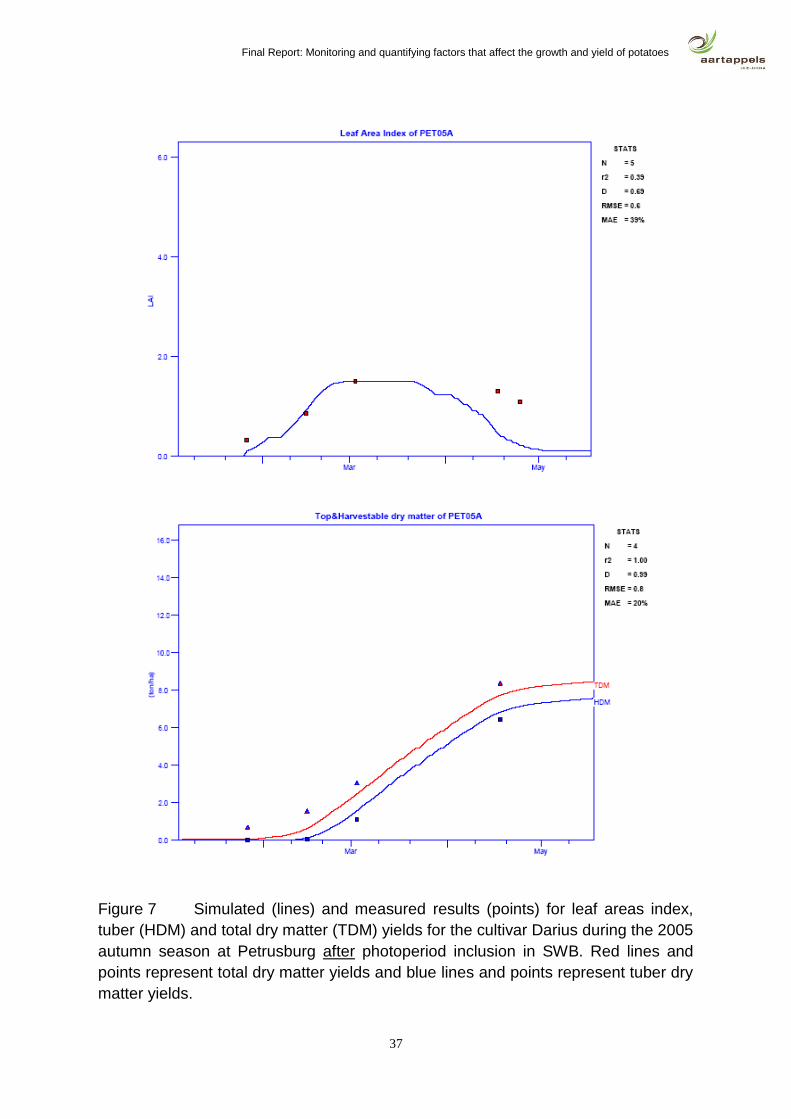
Figure 7 Simulated (lines) and measured results (points) for leaf areas index,
tuber (HDM) and total dry matter (TDM) yields for the cultivar Darius during the 2005
autumn season at Petrusburg after photoperiod inclusion in SWB. Red lines and
points represent total dry matter yields and blue lines and points represent tuber dry
matter yields.
Final Report: Monitoring and quantifying factors that affect the growth and yield of potatoes
38
The simulated values for LAI, tuber and total dry matter yields generally compared
well with measured values collected for the summer season at Petrusburg (Figure
6). These simulation results remained virtually unchanged from those when the
summer crop parameters for Darius were used.
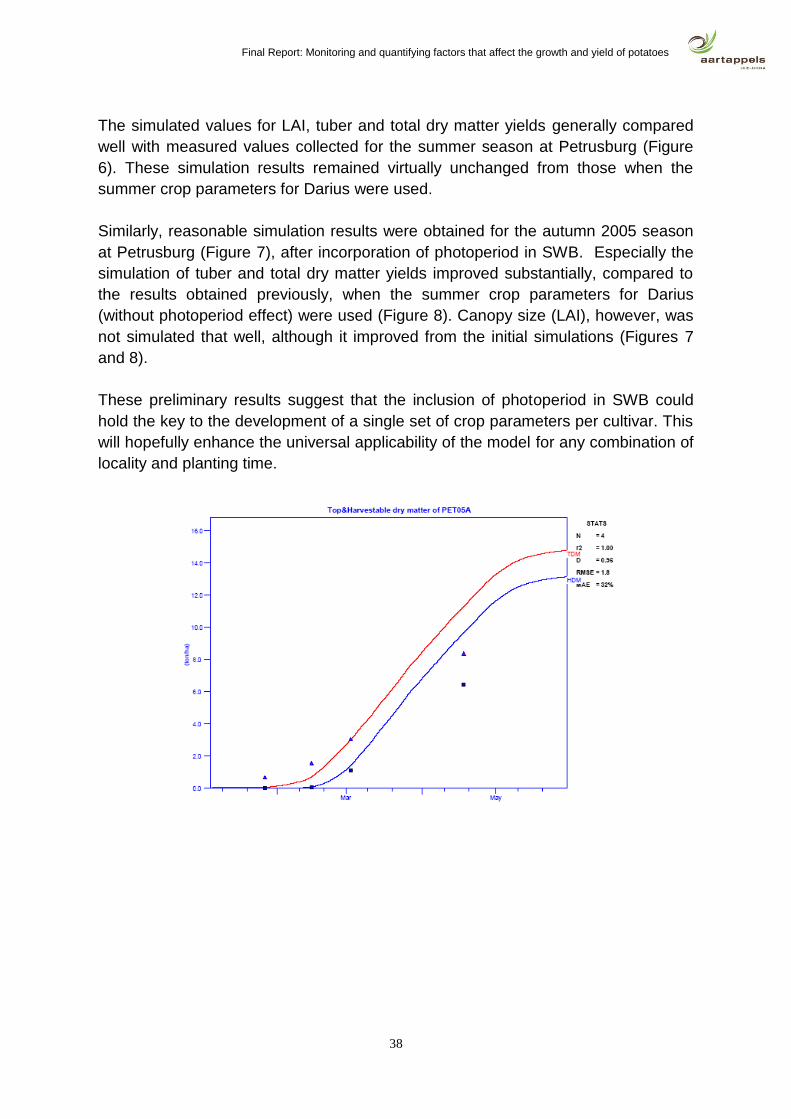
Similarly, reasonable simulation results were obtained for the autumn 2005 season
at Petrusburg (Figure 7), after incorporation of photoperiod in SWB. Especially the
simulation of tuber and total dry matter yields improved substantially, compared to
the results obtained previously, when the summer crop parameters for Darius
(without photoperiod effect) were used (Figure 8). Canopy size (LAI), however, was
not simulated that well, although it improved from the initial simulations (Figures 7
and 8).
These preliminary results suggest that the inclusion of photoperiod in SWB could
hold the key to the development of a single set of crop parameters per cultivar. This
will hopefully enhance the universal applicability of the model for any combination of
locality and planting time.
Final Report: Monitoring and quantifying factors that affect the growth and yield of potatoes
39
Figure 8 Simulated (lines) and measured results (points) for leaf areas index
(LAI), tuber (HDM) and total dry matter yields (TDM) for the cultivar Darius during
the 2005 autumn season at Petrusburg before photoperiod inclusion in SWB. Red
lines and points represent total dry matter yields and blue lines and points represent
tuber dry matter yields.
Conclusions
Plant samples for growth analyses were frequently collected from three different
localities, according to plan. The collected data showed substantial variation in crop
growth rates and final values obtained for canopy size (LAI), tuber mass and total
dry matter yields. These variations could be attributed to cultivar differences, as well
as the effect of different growing seasons.
The growth analysis results highlighted the fact that many interrelated factors affect
crop growth, development and final tuber yield. It is often difficult and complicated to
understand these processes in the plant. A crop model is one of the best tools that
could help us better understand the mechanisms involved and to predict potato
growth and yield response to a combination of external conditions.
The SWB model is primarily an irrigation scheduling tool, but also simulates crop
growth. SWB has previously been used to schedule potatoes, although it is not a
dedicated potato model. One limitation of SWB was that it did not cater for the effect
of photoperiod on crop growth. The potato is photoperiod sensitive, which influences
the rate of crop growth and development. To overcome this problem, different sets
Final Report: Monitoring and quantifying factors that affect the growth and yield of potatoes
40
of crop parameters were used for different seasons. This did not always work well,
and improvements to SWB were proposed in order to accurately simulate plant
growth and water usage in different environments, using a single set of crop
parameters.
Recently a first attempt was made to build an algorithm that takes the effect of
photoperiod into account into the SWB model. Initial results indicated that the
accuracy of crop growth simulations was substantially improved, especially for an
autumn planting, which proved to be problematic in the past. Further evaluation is
necessary to ensure that the adapted SWB model will perform well for all the
cultivars used and under a wider range of climatic conditions. It is believed that if
successful, this will broaden the application value of the model.
The current approach assumes that photoperiod is the overriding factor that
determines the time of tuber initiation. However, we know that temperature also
plays a major role in this and it may also be necessary to incorporate this in future
as more knowledge is gained.
It can be concluded that all the objectives set for the year were achieved. As a first
step the focus was only on the SWB model as an irrigation scheduling tool for
potatoes. The collected field data sets could also be very valuable for the calibration
and validation of other potato specific growth models for local conditions and potato
cultivars.
Acknowledgements
Financial support by Potatoes South Africa is gratefully acknowledged. We would
also like to thank the potato growers in the different production areas for their
cooperation, as well as the PSA and NDA field staff for assistance with the
collection of plant samples.
REFERENCES
ANNANDALE, J.G., BENADE, N., JOVANOVIC, N.Z., STEYN, J.M. & DU SAUTOY,
N. 1999. Facilitating irrigation scheduling by means of the Soil Water Balance
model, University of Pretoria, submitted to the Water Research Commission, WRC
Report No 753/1/99.
CAMPBELL, G.S. and NORMAN, J.M. 1998. An Introduction to Environmental
Biophysics. Springer-verlag, New York.
Final Report: Monitoring and quantifying factors that affect the growth and yield of potatoes
41
DE JAGER, J.M. 1994. Accuracy of vegetation evaporation ratio formulae for
estimating final wheat yield. Water SA. 20 (4), 307-314.
KAGABO, D.M. 2006. Modelling the soil water balance of potatoes for improved
irrigation management. M.Sc. dissertation. University of Pretoria. Pretoria.
KOOMAN, P.L. & HAVERKORT, A.J. 1995. Modelling development and growth of
the potato crop influenced by temperature and day length: LINTUL-POTATO. In
Haverkort, A.J. and Mackerron D.K.L. (eds.). Potato ecology and modelling of crops
under conditions limiting growth, 41-60. Kluwer Academic Publishers. The
Netherlands.
KOOMAN, P.L., FAHEM, M., TEGERA, P. & HAVERKORT, A.J. 1996. Effects of
climate on different potato genotypes. I: Radiation interception, total dry matter
production and tuber yield. European Journal of Agronomy 5,193–205.
RITCHIE, J.T., GRIFFIN, T.S. & JONHSON, B.S. 1995. SUBSTOR: functional
model of growth, development and yield. In: KABAT, P., MARSHALL, B.,VAN DEN
BROEK, B.J., VOS, J. and VAN KEULEN, H. (eds.). Modelling and
parameterisation of the Soil - Plant - Atmosphere System. A Comparison of potato
Growth Models, 401-405. Wageningen Pers, The Netherlands.
VAN DAM, J., KOOMAN, P. L. & STRUIK, P.C. 1996. Effects of temperature and
photoperiod on early growth and final number of tubers in potato (Solanum
tuberosum L.). Potato Research 39, 51-62