Embed Size (px)
Citation preview

THE 19TH
INTERNATIONAL CONFERENCE ON COMPOSITE MATERIALS
1 Introduction
The vacuum infusion (VI) process [1] is a relatively
cheap composite manufacturing process that is
widely used for the manufacture of large-scale
structures in a number of industries, in particular the
aerospace, marine and wind turbine industries. Fig. 1
describes schematically the vacuum infusion process
and the typical make-up of the assembled stack.
Once the vacuum bag is sealed, the resin inlet is
sealed and the air is extracted by means of a vacuum
pump. This serves two purposes, firstly to compress
the preform in order to achieve a part with a high
fibre volume fraction and secondly to create a
differential pressure to allow the infusion of the
resin.
From the resin inlet to the vacuum vent, the preform
thickness and the compaction pressure are affected
due to the flexible nature of the vacuum bag. The
preform has to be infused completely before the
resin cures. Therefore, the monitoring of the process
is very important to ensure the quality of the final
composite part.
Analytical [2] and numerical [3] studies are
extremely useful for understanding the entire
manufacturing process and designing new products.
Numerical simulations of resin infusion can assist in
positioning the inlet and the vent, which is especially
useful for large and complex parts. Various infusion
strategies can be studied using a virtual model. This
can reduce prototype testing and process set-up
costs. Based on Darcy`s law, many mould filling
codes such as LIMS [4], Polyworks and PAM-RTM
[5] have been developed in order to optimise
manufacturing processes. It is essential to know the
principal permeability values to compute the filling
times in a simulation. In addition to the permeability
information, the cure and the viscosity data of the
resin are needed for more realistic and accurate flow
simulations.
In this study, a vacuum infusion process monitoring
methodology with thermocouples and the simulation
of the vacuum infusion process were studied for an
unsaturated polyester resin system. Experimental
studies were performed to determine the resin and
the preform related parameters for the flow
simulations. The VARI module of the PAM-RTM
simulation package was used to simulate the filling
times. Finally, the vacuum infusion experiments
were conducted to validate the simulations.
2 Aims and Objectives
The global aim of the vacuum infusion process
monitoring and the process simulation is to assess
the processability of novel fire resistant co-blended
resin systems composed of unsaturated polyester and
phenolic resins [6]. The present study aims to
investigate the processability of an unsaturated
polyester resin system (Crystic 701 resin and 1%
Methylethylketone Peroxide catalyst) in the vacuum
infusion process forming a basis for the
processability of the novel resin systems for the
global project. This study focused on a thorough
investigation of the vacuum infusion process by
exploring the process and the material (the fibre and
the resin) related parameters. The objectives of this
study can be divided into seven main categories and
they are listed below.
a- Monitoring of the vacuum infusion process
incorporating thermocouples to monitor the fibre
volume fraction, the flow rate, and the flow front
advancement.
b- Preform characterisation involving an in-plane
permeability measurement method to determine the
MONITORING AND SIMULATION OF THE VACUUM
INFUSION PROCESS
A. Aktas*, S.W. Boyd, R.A. Shenoi
Faculty of Engineering and the Environment, University of Southampton, Southampton,
SO17 1BJ, UK * Corresponding author ([email protected])
Keywords: Vacuum infusion process, flow monitoring, permeability, flow and cure simulations

2
effective permeability values and the compressibility
curve.
c- Cure kinetics study based on Differential
Scanning Calorimetry (DSC) data.
d- Cure modelling using the autocatalytic cure
kinetics model.
e- Cure simulation using the DSC study results, the
cure model and the thermal properties of the
materials.
f- Flow simulation of the vacuum infusion process in
PAM-RTM software using the preform and the resin
data, and the boundary conditions.
g- Validation of the flow simulation results with the
experimental results.
3 Process Monitoring Methodology
The vacuum infusion process monitoring setup (Fig.
2) included i) a vacuum infusion setup using a glass
mould, ii) two high resolution cameras to monitor
the flow front progression, iii) K type teflon
insulated thermocouples to monitor the flow fronts
inside the preform and measure the temperatures at
various locations, iv) LVDTs to measure the
thickness variations in different regions for the
calculation of the fibre volume fractions, iv) a
weighing scale to monitor the mass flow rate of
resin, v) a vacuum pump with a pressure regulator,
and vi) a National Instruments compact-rio as the
data acqusition system and associated Labview
software to record the data.
During the experiments, the thermocouples
demonstrated their ability to detect the flow front
advancement without needing a temperature
difference between the resin, the mould and the
reinforcement. This methodology is explained in
Section 6. The thermocouples were also informative
on the exothermic reaction during curing (Fig. 18).
4 Preform Characterisation
Due to the flexible nature of the vacuum bag, there
is no direct control over the thickness (or the fibre
volume fraction) of the composite part in the
vacuum infusion process. The compaction of the
preform is dynamic and depends upon the
compressibility and relaxation of the preform under
pressure, and the interaction between the preform
and the infusion liquid. This is distinctly different
from Resin Transfer Moulding (RTM) where
thickness and fibre volume fraction can be
controlled due to the rigid moulds.
For the characterisation of the preform, composed of
twelve layers of triaxial non-crimp e-glass fabric
(Table 1), the compaction rig (Fig. 4) was designed
by the authors. It composed of a square base mould
and a flat top platen. The compaction plate (top
platen) was able to slide in the mould with no
resistance. This rig was constructed for two
purposes, i) the preform compressibility analysis and
ii) the channel flow in-plane permeability
measurements. Corn oil was used in the permeability
experiments. The results of the preform
characterisation study were the inputs in the
numerical flow simulations in Section 7.
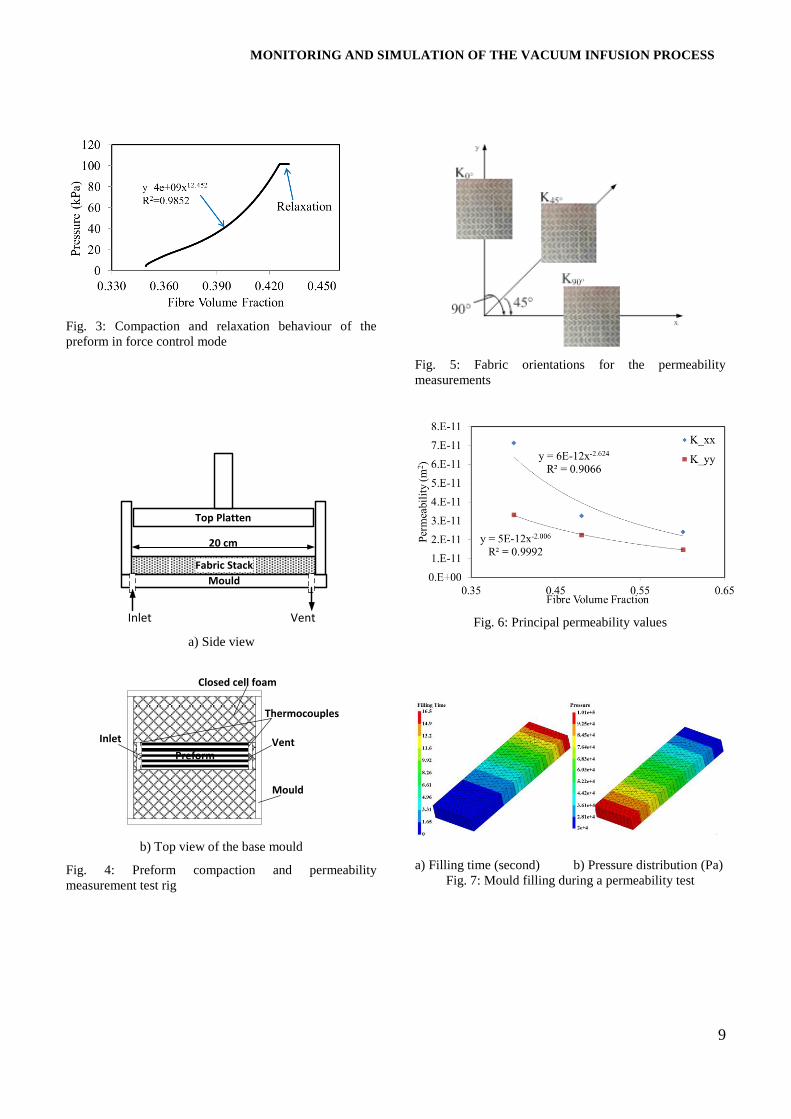
4.1 Compressibility
The compaction behaviour of the multi-layer
preform was experimentally characterised using the
compaction rig on an Instron 5569 testing machine
fitted with a 50 kN load cell in force control mode.
The preform (20cm x 20cm) was compressed at the
rate of 2mm/min. Once the pressure reached 100kPa,
the load was maintained for 30 minutes and fabric
relaxation occurred (Fig. 3). The equation in Fig. 3
was obtained by plotting a power trendline up to the
relaxation point.
4.2 Permeability
The in-plane (channel flow) unsaturated
permeability measurements of the preform (15cm x
5cm) were performed using the compaction rig (Fig.
4) on an Instron 5569 testing machine. Instron
machine provided precise top platen movement that
controlled the fibre volume fraction accurately and
precisely for the permeability measurements.
Flexible closed-cell foam (dimensions of 19.5cm x
19.5cm) with an opening area of 16cm x 5cm was

3
MONITORING AND SIMULATION OF THE VACUUM INFUSION PROCESS
placed in the base mould and the preform was placed
in the gap. The thickness of the twelve-layer preform
was nearly 12 mm and the thickness of the foam was
15 mm. The foam provided sealing while the
preform was under compression. Due to the
invisibility of the process, K type thermocouples
(Fig. 4b) were used to monitor the flow front
advancement in the rig. The principle of the
thermocouple flow front monitoring methodology
can be found in Section 6.
Due to the inhomogeneity of the preform, the
permeability measurements were conducted in three
different directions, shown in Fig. 5. In the tests, the
fibre volume fractions for each orientation were 0.4,
0.48 and 0.6. The properties of the infusion liquid
and the fabric used in the permeability
measurements are given in Table 1.
For the permeability measurements, a vacuum pump
was connected to the vent and the inlet was blocked
to obtain a pressure gradient in the mould and infuse
the corn oil through the preform. The procedure of
the permeability measurement is listed below.
i) The preform was placed in the opening area of the
foam, and the thermocouples were located inside the
preform at the inlet and at the vent for the flow front
monitoring.
ii) The top platen was lowered to obtain the desired
fibre volume fraction. The following equation was
used for the fibre volume fraction calculations.
(1)
where is the areal weight of the fabric, is the
number of fabric layers in the preform, is the
thickness and is the density of the fibres.
iii) Once the desired fibre volume fraction was
achieved, the inlet was closed and the air was
extracted with the help of the vacuum pump.
iv) The inlet was opened and the corn oil was
infused through the fabric with the aid of the
pressure difference between the atmospheric and the
vacuum pressures. The vent pressure was 0.2 bar.
The atmospheric pressure was measured using a
barometer. The flow was from the atmospheric
pressure to the vacuum pressure in the mould.
v) The corn oil flow front was monitored using the
thermocouples inside the mould during the flow and
the flow travel time was recorded.
vi) The permeability was measured according to the
(one-dimensional) equation [7] below.
(2)
where is the pressure differential between the
inlet and the flow front, is the flow front position,
is the dynamic viscosity of the fluid, is the
porosity, is the time.
The approach presented by Gebart and Lidstrom [8]
was used to determine the principal permeability
values (Fig. 6) from the effective permeability
values that were experimentally measured. Table 2
presents the effective (K) and the principal
permeability (K`) values and the orientation angles
for each fibre volume fraction.
As an example, Fig. 7 shows the filling time (Fig.
7a) and the resin pressure distribution (Fig. 7b) in
the rig during a permeability test for the 90˚ oriented
sample (fibre volume fraction of 60%). The
principal permeability values (K`90 in the flow
direction and K`0 in widthwise), the infusion liquid,
the fabric and the preform properties, and the
boundary conditions were used to simulate the flow
and the liquid pressure in the compaction rig. The
preform was represented by solid elements and each
layer was defined in the setup.
5 Curing Analysis
Crystic 701 [9] with a styrene content of 40-45% is a
pre-accelerated, isophthalic polyester resin with low
viscosity (1.6 poise) and controlled exotherm
characteristics. The viscosity and exotherm
characteristics of Crystic 701 make it particularly
suitable for the manufacture of large structures in the
vacuum infusion process. The recommended curing
cycle of the laminates manufactured by Crystic 701
is for 24 hours at room temperature, and followed by
a post-cure for 16 hours at 40°C or 3 hours at 80°C.
The manufacturer recommends using the catalyst

4
between 1% (slow curing) and 2% (fast curing) by
weight. 1% content was chosen for this work to
provide the longest curing time and, therefore, to
increase the processing time of the resin.
5.1 Cure Kinetics
In order to improve the accuracy of the flow
simulations (in Section 7) and to do more realistic
comparisons with the vacuum infusion experiments,
the cure kinetics of the resin system was studied.
The results of this study were used in the cure
simulation in Section 5.2 and in the flow simulations
in Section 7. The cure kinetics study of the
unsaturated polyester resin system was based on
DSC analyses. The measurement of the heat evolved
during the curing reaction was conducted by means
of a TA Instruments DSC Q2000 apparatus. The
DSC analyses provided the heat flow versus time
and temperature data. To investigate the ultimate
heat of the reaction ( ), the heat flow was
measured for the heating ramps of 3°C, 5°C, 10°C
and 20°C for the samples weighing 7mg (±0.1) until
250°C. The information obtained from the dynamic
runs did not depend on the heating rate, so an
average result of 256 J/g was defined as the ultimate
heat of reaction. Also, the isothermal tests were
performed at the temperatures of 30°C, 40°C, 50°C,
60°C, 70°C and 80°C for the samples weighing 7mg
(±0.1). The details of the calculations can be found
in references [10] and [11].
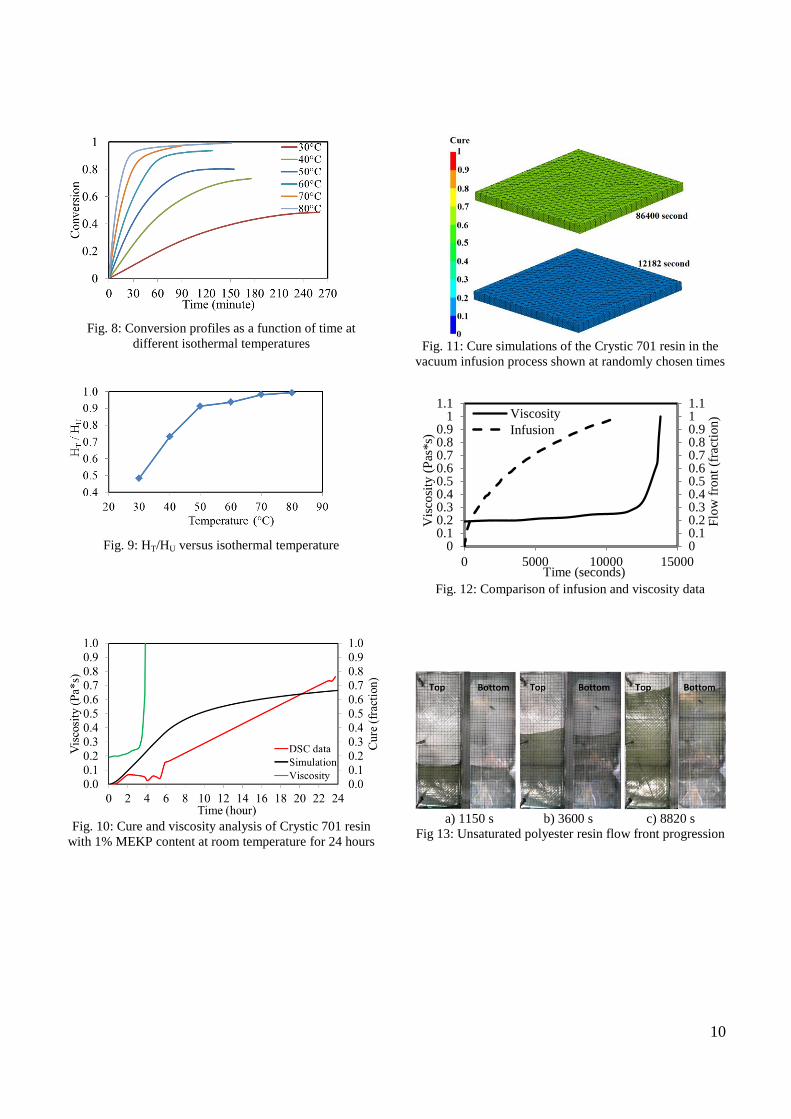
The conversion profiles for each isothermal test are
shown in Fig. 8. As expected, the ultimate overall
conversion increased with temperature. A graph of
experimentally determined values of versus
temperature (T) is shown in Fig. 9. The ratio of
rose with temperature and was approximated
by a piece-wise linear function of temperature as
expressed by Eq. 3. The evolution of was
linear with the temperature until 50°C and almost
levelled off after 50°C.
{ ( )
} (3)
As a result of the cure kinetics study, the
autocatalytic equation (Eq. 4) represented the curing
of the unsaturated polyester resin system with the
reaction orders of 0.43 and 3.87 for m and n,
respectively. These were the inputs coupled with the
thermal properties (Table 3) of the constituent
materials for the cure simulation.
( (
)) ( ) (4)
here, 109098 (1/min) is the pre-exponential factor,
40730 (J/mol) is the activation energy, 8.31 (J/mol
K) is the universal gas constant, is the
temperature, and is the rate of degree of cure.
5.2 Cure Simulation
The initial 24 hours curing stage was simulated in
the curing module of PAM-RTM and compared with
the DSC cure data in Fig. 10. In the simulations, the
twelve-layer preform was represented by solid
elements. One more layer was extruded around the
solid mesh to represent the vacuum bag. The results
of the cure kinetics study, the properties of the
preform (density, areal weight, fibre volume
fraction, and thickness), the vacuum bag, the mould
and the resin were the inputs in the simulation. Fig.
11 shows the cure simulation results at randomly
chosen times.
In the cure simulations, the role of and the
material properties in the thermal phenomena are
represented by the following equation:
{ }
(5)
here, is the temperature, is the time, is the
density, is the specific heat, is the heat
conduction coefficient tensor, is the total
enthalpy of the polymerisation of the resin, is the
resin cure, and represents the resin.
The differences between the DSC cure data and the
simulation result can be attributed to the small
quantity of resin used in the DSC test for the
experimental cure analysis, but the cure simulation
involved the resin and the reinforcement properties
in the vacuum infusion process. The final cure
results were close to each other, and the beginning
of the cure simulation up to 3 hours was important

5
MONITORING AND SIMULATION OF THE VACUUM INFUSION PROCESS
for the flow simulations. Normally, one can expect a
very high exothermic temperature during the curing
reaction of a thermoset resin system, but there was
~3˚C increase in the temperature data (Fig. 18) in the
vacuum infusion experiment due to the interaction of
the resin with the preform on a large surface area.
5.3 Viscosity Analysis
The viscosity (measured by ICI viscometer) change
over time was compared with a typical infusion time
for a twelve-layer preform without using an infusion
mesh (Fig. 12). The preform specification was same
as the preform used in Section 6. The infusion mesh
and the peel ply (Fig. 1) were not incorporated in the
process to identify the maximum possible processing
time for the resin. It can be seen that the viscosity
was 0.19 Pa*s in the beginning and it was 0.26 Pa*s
at the end of the filling. The infusion was completed
just before the significant jump in the viscosity data.
6 Thermocouple Monitoring Methodology
Fig. 13 presents a twelve-layer fabric preform
(length of 45cm and width of 15cm) infusion case
study (vacuum pressure of 0.5 bar) without an
infusion mesh. In this experiment, the preform
consisted of alternate 0˚ and 90˚ orientation fabrics
(Fig. 5) to obtain a more homogeneous structure.
This structure was used to obtain an infusible
preform for the flow front monitoring because other
tests indicated that an entirely 90˚ oriented preform
did not completely infuse (Fig. 20).
In order to monitor the flow fronts inside the
laminate, seven thermocouples were located
between the fourth and the fifth layers equally
spaced, and a second set of seven thermocouples
were located between the eight and the ninth layers.
The measurements were performed without a
temperature difference between the resin and the
mould. Typical flow front data is shown in Fig. 14.
The thermocouple readings were almost identical
with the camera recordings indicative of a uniform
through thickness flow from inlet to vent. The data,
plotted in Fig. 15, clearly shows the uniformity of
the flow front through the thickness.
The experimental flow front locations detected by
means of the cameras at three randomly chosen
times can be seen in Fig. 13. The top and the bottom
flow front locations for the three cases were
identical.
The response of the thermocouple sensing method
was tested out of the mould in order to understand
the interaction between the thermocouple and the
liquid without a temperature difference at room
temperature (Fig. 16). Two thermocouples,
connected to a National Instruments Compact-Rio,
were used in the test. One thermocouple was
inserted through a small hole of a closed transparent
container to isolate it and avoid its interaction with
the surrounding air circulation in order to resemble
the sealing of the thermocouples in the glass preform
in the vacuum infusion process. The second
thermocuple was out of the container, and measuring
the ambient temperaure.
The results presented in Fig. 17 demonstrate a clear
temperature variation from the ambient temperature
recording, while the temperature was relatively
steady for the thermocouple recording within the
pot. The pot, the liquid and the thermocouples were
at room temperature before the test, and the
conditions were the same during the test. The test
procedure was: i) keeping one thermocouple out of
the liquid but other one (case-1 in Fig. 16) in the pot
and allowing the temperature data to reach a steady
state in the container for ~90 seconds, and ii)
dipping the thermocouple into corn oil manually
(case-2 in Fig. 16). Once the thermocouple was
dipped into the liquid a sudden drop occurred (Fig.
17). This behaviour was similar to the thermocouple
flow front sensing in the vacuum infusion process,
therefore providing evidence of the thermocouple
acting as a flow front sensor.
The thermocouples were also informative on the
exothermic reaction during the curing stage. Fig. 18,
which is one thermcouple`s full range of data from
Fig. 14, shows the complete temperature data up to
21 hours after infusion. The resin reaches the
maximum temperature after approximately 5 hours.
The change in thickness and the flow versus time
data until the end of the filling are presented in Fig.
19. It can be seen that the thickness was higher at the
vent and lower at the inlet region, and the flow rate
was in a decreasing trend.

6
7 Flow Simulations
The inputs in the PAM-RTM simulation software
were i) the preform characterisation data (the
equations representing the principal permeability
curves in Fig. 6, and the compressibility curve in
Fig. 3), ii) the cure equation (Eq. 4), the enthalpy of
the resin, and the viscosity data (Fig. 12), iii) the
material properties (Table 3), and iv) the boundary
conditions (inlet and vent pressures). A shell
element (flow length of 45cm and width of 15cm)
represented the preform in the simulations (Fig. 21
and Fig. 22).
In the simulations, the principal permeability
directions were also defined. K`90 was in the flow
direction and K`0 was in the width direction for the
90˚ sample. These orientations were vice-versa for
the 0˚ orientation sample.
In order to validate the numerical flow simulations,
vacuum infusion experiments (with 0.5 bar vacuum
pressure) with Crystic 701 resin were performed for
two different samples (flow length of 45cm and
width of 15cm). The first sample incorporated all the
fabric layers in 0˚ orientation, whereas all the layers
were in 90˚ orientation for the second sample (Fig.
5). The infusion result of the homogeneous preform
was also included in Fig. 20 for a comparison with
others. The total experimental filling time was
nearly 11000 seconds for the homogeneous sample;
it was nearly 4500 seconds for the 0˚ sample. The
impregnation time was the longest (~13500 seconds)
for 90˚ sample. Due to the resin gelation in ~13000
seconds (from Fig. 12), the resin flow stopped after
nearly 75% flow front advancement for the 90˚
sample. The flow fronts were uniform for both 0˚
and 90˚ infusion cases and similar to the
homogeneous sample used in Section 6.
The trend of the numerical and the experimental
curves were similar to each other (Fig. 20). Similar
to the experimental flow for the 90˚ sample, the flow
front simulation stopped after 80% impregnation of
the preform in ~13500 seconds (Fig. 21a). From
here, the importance of using the curing behaviour
of the resin system in the simulation can be seen.
The resin pressure and the fibre volume fraction
distribution along the flow length of the preform can
be seen in Fig. 22. The fibre content was around
50% at the vent and it was around 42% at the inlet
after the completion of the infusion.
8 Discussion
The resin, the preform and the vacuum infusion
process related parameters were studied to inform
the vacuum infusion simulations. The VARI module
in PAM-RTM was used and the preform was
represented by shell elements. The principal
permeability equations, the compaction equation of
the preform, the resin cure and viscosity data and the
material properties were the inputs in the
simulations. The simulation results were in good
agreement with the vacuum infusion experiments.
A flow front monitoring method using cost-effective
thermocouples was presented, which did not require
a temperature difference between the resin and the
mould. This method provided a three-dimensional
flow front profile at room temperature. This method
validated the uniform flow front from inlet to vent
through the samples used in this study. A
thermocouple-dipping test was conducted to validate
the flow front detection behaviour of the
thermocouples in the infusion process.
Preform characterisation was studied to determine
the compressibility equation of the preform and the
permeability values. The measured permeability
values were converted to the principal permeability
values which were involved in the simulations. The
viscosity measurement and the cure kinetics of the
resin system were needed for more accurate and
realistic flow simulations. The cure kinetics study
was based on the DSC analyses and the autocatalytic
empirical model represented the cure behaviour of
the resin system. Due to the shorter filling time in
the 0˚ orientation sample, the cure and the viscosity
data were not effective. However, they were very
effective in the 90˚ orientation sample due to the
longer filling time.
Normally, the infusion mesh decreases the infusion
time by providing z-directional flow during the
infusion process. In this study, it was not
incorporated in the experiments to assess the
maximum possible processability time of the resin.
Elimination of the infusion mesh resulted in a
7
MONITORING AND SIMULATION OF THE VACUUM INFUSION PROCESS
uniform and two-dimensional flow front from inlet
to vent. This uniform flow front was simulated using
shell elements in VARI module of PAM-RTM.
The infusion experiments were performed for two
different types of preforms. All of the fabric layers
were in 0˚ orientation in the first sample and all of
the fabric layers were in 90˚ orientation in the
second sample (Fig. 5). The main reason behind the
significant difference in the filling times was the
inhomogeneity of the triaxial non-crimp glass fabric.
The perpendicular coarse bundles (in 90˚ orientation
sample) to the flow direction reduced the speed of
the flow front. However, the coarse bundles were
parallel to the flow front for the 0˚ oriented sample.
This parallel arrangement of the fibres resulted in
long flow channels for the resin from inlet to vent,
which increased the speed of the flow. Due to the
longer infusion time for the 90˚ orientation sample,
the resin cured before reaching the vent. This
resulted in a 25% unimpregnated region, which was
20% in the simulation.
9 Conclusions
As a result of this study, the good agreement
between the simulation and the experimental results
indicates that the approach in this study can be used
for the flow and the cure simulations of alternative
resins such as the novel blended fire resistant resin
systems in the vacuum infusion process for the
global project or any other thermoset resin systems.
For the novel resin systems, the cure kinetics and the
viscosity modelling are needed as the inputs in the
numerical simulations. The main challenge in the
cure simulations is the requirement of the complex
cure cycles of the blended resin systems varying
from 24 to 42 hours (up to the temperature of
180˚C). Also, the embedded cure monitoring
methods such as thermocouples should be
incorporated in the experiments for the validation of
the cure simulations.
Acknowledgement
This project is supported by the EPSRC project:
EP/H020926/1. The authors would like to
acknowledge ESI Group for the PAM-RTM
software and Scott Bader for the unsaturated
polyester resin.
References [1] Marco Method, US Patent No 2495640 (1950).
[2] YS Song and JR Youn. “Modelling of resin infusion
in vacuum assisted resin transfer moulding”. Polymer
Composites. DOI 10.1002/pc.20326. 2008.
[3] L Joubaud, V Achim, F Trochu. “Numerical
simulation of resin infusion and reinforcement
consolidation under flexible cover”. Polymer Composites.
DOI 10.1002/pc.20069. 2005.
[4] A Gokce, M Chohra, SG Advani, SM Walsh.
“Permeability estimation algorithm to simultaneously
characterise the distribution media and the fabric preform
in vacuum assisted resin transfer moulding process”.
Composites Science and Technology. Vol. 65, Issue 14,
pp.2129-2139, 2005.
[5] M Arnold, G Rieber, M Wahl, P Mitschang.
“Comparison between the numerical simulation program
PAM-RTM and RTM measurements on a flat plate”.
Proceedings of the FPCM-11 Conference, Auckland, 9-12
July 2012.
[6] Novel co-blended polymer matrix systems for fire
resistant structural marine composites.
http://gow.epsrc.ac.uk/NGBOViewGrant.aspx?GrantRef=
EP/H020926/1.
[7] JR Weitzenbock, RA Shenoi, PA Wilson.
“Measurement of principal permeability with the channel
flow experiment”. Polymer Composites, April 1998, Vol.
20, No.2, 1998.
[8] BR Gebart, P Lidstrom. “Measurement of in-plane
permeability of anisotropic fibre reinforcements”.
Polymer Composites, February 1996, Vol.17, No.1,
pp.43-51, 1996.
[9] Crystic Composites Handbook. Scott Bader.
[10] JL Vilas, JM Laza, MT Garay, M Rodriguez, LM
Leon. “Unsaturated polyester resins cure: Kinetic,
rheologic, and mechanical-dynamical analysis. I. Cure
Kinetics by DSC and TSR”. Journal of Applied Polymer
Science. Vol.79, pp.447-457, 2001.
8
[11] R Seifi, M Hojjati. “Heat of reaction, cure kinetics,
and viscosity of Araldite LY-556 resin”. Journal of
Composite Materials, Vol. 39, No.11, 2005.
[12] PA Cutter. “Predictive methods for the fire
resistance of single skin and sandwich composite
materials”. PhD Thesis, University of Southampton,
November 2008.
[13] KT Hsiao, R Little, O Restrepo, M Bob. “A study of
direct cure kinetic characterisation during liquid
composite moulding”. Composites: Part A: Applied
Science and Manufacturing, Vol. 37, pp.925-933, 2006.
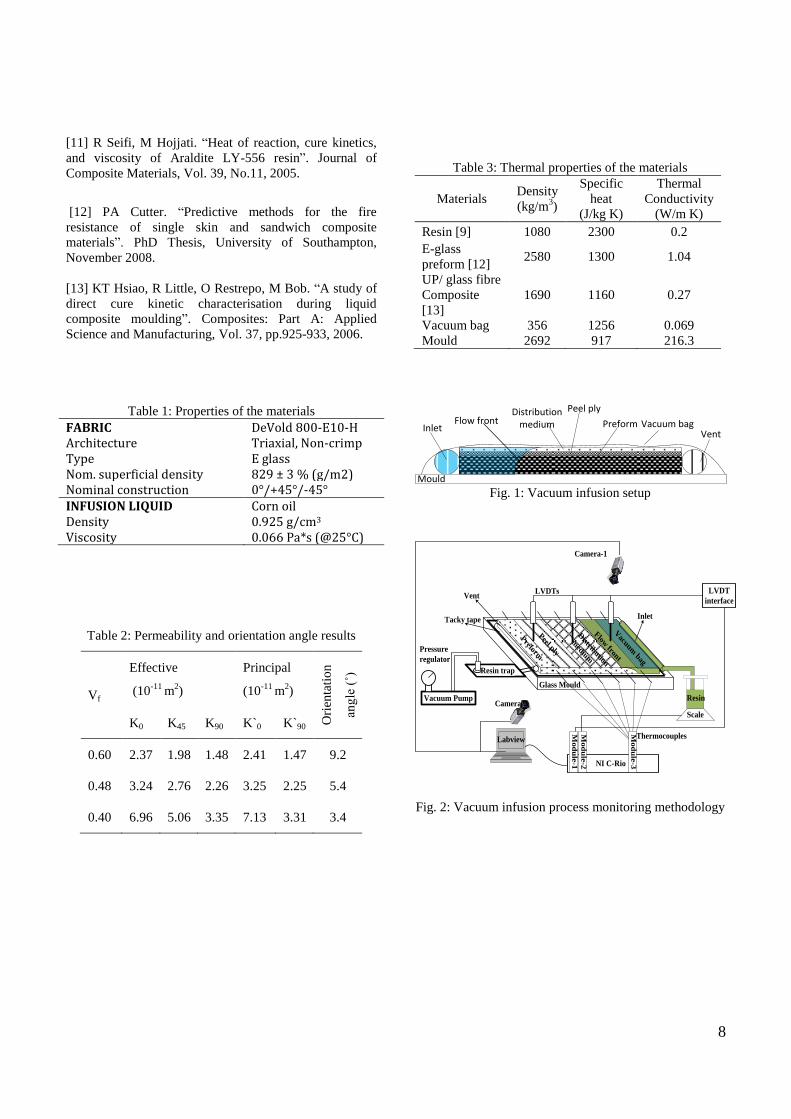
Table 1: Properties of the materials
FABRIC DeVold 800-E10-H Architecture Triaxial, Non-crimp Type E glass Nom. superficial density 829 ± 3 % (g/m2) Nominal construction 0°/+45°/-45° INFUSION LIQUID Corn oil Density 0.925 g/cm3 Viscosity 0.066 Pa*s (@25°C)
Table 2: Permeability and orientation angle results
Vf
Effective
(10-11
m2)
Principal
(10-11
m2)
Ori
enta
tio
n
ang
le (
˚)
K0 K45 K90 K`0 K`90
0.60 2.37 1.98 1.48 2.41 1.47 9.2
0.48 3.24 2.76 2.26 3.25 2.25 5.4
0.40 6.96 5.06 3.35 7.13 3.31 3.4
Table 3: Thermal properties of the materials
Materials Density
(kg/m3)
Specific
heat
(J/kg K)
Thermal
Conductivity
(W/m K) Resin [9] 1080 2300 0.2 E-glass
preform [12] 2580 1300 1.04
UP/ glass fibre
Composite
[13] 1690 1160 0.27
Vacuum bag
Mould
356
2692
1256
917
0.069
216.3
Mould
Vacuum bagDistribution
medium
Peel ply
PreformInletVent
Flow front
Fig. 1: Vacuum infusion setup
Glass Mould
Thermocouples
Inlet
Vent
Camera-1
Flow
front
Preform
Scale
Resin
Tacky tape
Resin trap
Vacuum Pump
LVDT
interface
NI C-Rio
Mod
ule
-1
Mod
ule
-2
Labview
Mod
ule
-3
Peel ply
Distribution
medium
Vacuum
bag
Pressure
regulator
Camera-2
LVDTs
Fig. 2: Vacuum infusion process monitoring methodology
9
MONITORING AND SIMULATION OF THE VACUUM INFUSION PROCESS
Fig. 3: Compaction and relaxation behaviour of the
preform in force control mode
Top Platten
Fabric Stack
Mould
20 cm
Inlet Vent
a) Side view
Closed cell foam
VentInlet
Thermocouples
Mould
Preform
b) Top view of the base mould
Fig. 4: Preform compaction and permeability
measurement test rig
Fig. 5: Fabric orientations for the permeability
measurements
Fig. 6: Principal permeability values
a) Filling time (second) b) Pressure distribution (Pa)
Fig. 7: Mould filling during a permeability test
10
Fig. 8: Conversion profiles as a function of time at
different isothermal temperatures
Fig. 9: HT/HU versus isothermal temperature
Fig. 10: Cure and viscosity analysis of Crystic 701 resin
with 1% MEKP content at room temperature for 24 hours
Fig. 11: Cure simulations of the Crystic 701 resin in the
vacuum infusion process shown at randomly chosen times
Fig. 12: Comparison of infusion and viscosity data
a) 1150 s b) 3600 s c) 8820 s
Fig 13: Unsaturated polyester resin flow front progression
00.10.20.30.40.50.60.70.80.911.1
00.10.20.30.40.50.60.70.80.9
11.1
0 5000 10000 15000
Flo
w f
ront
(fra
ctio
n)
Vis
cosi
ty (
Pas
*s)
Time (seconds)
Viscosity
Infusion

11
MONITORING AND SIMULATION OF THE VACUUM INFUSION PROCESS
Fig. 14: Resin flow front advancement results measured
by thermocouples
Fig. 15: Through-thickness flow front advancement
c
c
Corn oil
1 2
Camera
Pot
Fig. 16: Thermocouple flow detection phenomena test
procedure
Fig. 17: Thermocouple dipping test at room temperature
Fig. 18: Exothermic reaction monitoring during the curing
stage
Fig. 19: Thickness and flow rate monitoring results

12
Fig. 20: Flow front advancement monitoring data
a) 90˚ b) 0˚
Fig. 21: Simulation results
a) Pressure b) Fibre volume fraction
Fig. 22: Resin pressure and fibre volume fraction
distribution
Dry region