Embed Size (px)
Citation preview
Monitoring Conflict to Reduce Violence:
Evidence from a Satellite Intervention in Darfur∗
Grant Gordon†
December 22, 2015
The most recent version of this paper is available here.
Abstract
Does establishing evidence of atrocities through the systematic monitoring of waraffect the strategic use of violence during conflict? Does monitoring conflict ultimatelydeter crimes against humanity before they take place? To answer this question, I an-alyze the impact of “Eyes on Darfur”, the first-ever satellite intervention implementedby Amnesty International USA amidst a brutal genocide with the objective of reduc-ing violence. To examine whether this project changed the behavior of the SudaneseGovernment in Darfur, I estimate the impact of exposure to monitoring using a noveldataset I construct of high-frequency, sub-national data on genocidal attacks. Usingdifference-in-difference and matching estimators, results suggest that monitoring gen-erated pernicious and persistent effects: Amnesty’s intervention increased violence inmonitored villages during the program and in subsequent years. The program did notincrease or decrease violence in neighboring villages, which assuages fears that monitor-ing may simply displace violence but tempers hopes that it may create geographicallyprotective enclaves. Coupled with qualitative data, results suggest that the Governmentof Sudan leveraged the monitoring intervention to signal their resolve to stay in power.
Preliminary, please do not cite.
∗My deepest thanks to Scott Edwards and the team at Amnesty International USA who are committedto understanding the impact of their work. I am particularly grateful to Graeme Blair, Chris Blattman,Darin Christenson, Albert Fang, Jim Fearon, Page Fortna, Don Green, Chad Hazlett, Macartan Humphreys,Suresh Naidu, Eric Kramon, Gabby Sacramone-Lutz, Cyrus Samii, Bilal Siddiqi, Jack Snyder, John Sulik,Jeremy Weinstein, Peter van der Windt, and Lauren Young, who all provided invaluable feedback on thisproject as well as audiences at Columbia University, Stanford University, ISA, and MPSA. Nikita Ashprovided outstanding research assistance for this project. This project was supported by the United StatesInstitute for Peace Jennings Randolph Fellowship, the Eisenhower Institute Roberts Fellowship, and theMellon/ACLS Dissertation Completion Fellowship.†PhD Candidate, Columbia University Department of Political Science, [email protected]
1
1 Introduction
Exposing atrocities is a key strategy used by advocacy groups and international organi-
zations to document and deter violence in conflict zones. Indeed, the battle cry of anti-
genocide advocates has long been, “The world is watching.” By producing evidence of
violence, organizations are able to publicize the actions of perpetrators and decry their
behavior. The goal of these interventions is to deter the atrocities, violations, and violent
conflict that have exacted a profound toll on human and physical capital globally (Gho-
barah, Huth and Russett, 2003). The underlying logic is that by bringing attention of abuse
to the public, violators will reduce their transgressions out of fear of negative repercussions
that may come in the form of restricted aid, increased turmoil at home, and in severe cases,
international criminal warrants.
Scholars hold that this advocacy-based model of collecting and publicizing information
not only reduces human rights violations around the world, but operates to change interna-
tional norms around rights (Rise, Ropp and Kathryn Sikkink, 1999). Monitoring remains
the backbone of human rights organizations waging a battle of information politics (Keck
and Sikkink, 1998), and “information strategies” are crucial to deterring violations (Hafner-
Burton, 2012). A growing literature empirically examines the impact of these strategies and
finds support for these claims: Hafner-Burton (2008) demonstrates that the documentation
and release of reports by NGOs, the UN, and media decreases human rights violations
broadly; Hendrix and Wong (2012) show that naming and shaming campaigns generate
particularly strong impacts in democratic states; and Murdie and Davis (2012) illustrate
that these campaigns are powerful when complemented by local human rights organizations
that are able to apply pressure domestically.
Documenting and disseminating evidence about transgressions in order to change be-
havior is not unique to human rights monitoring, but is core to the very architecture of the
international system. Monitoring is integral to bureaucracies implementing peace accords
and ceasefires (Fortna 2008, Fortna and Howard 2008), third parties assessing the quality of
elections (Hyde 2011, Inchino and Schundeln 2012), and states enforcing bilateral or multi-
lateral agreements (Maggi 1999, Martin 1992). Verification is the cornerstone component of
deals made and monitoring the accountability mechanism used to ensure that both states
and non-state actors comply with international norms or law.
Yet, the impact of monitoring regimes are not straightforward, particularly in the con-
text of conflict, where advocacy efforts may lead to worse outcomes (de Waal, 2015).
2
Monitoring conflict may increase violence by allowing actors to signal their strength or
commitment to an issue (Fearon, 1998), reducing the exit strategies available to actors
by furnishing evidence of culpability (Mansfield and Snyder, 2002), or legitimizing actors
who would not have engaged in transgressions in the absence of coverage (Kuperman 2008,
Kydd and Strauss 2013). Alternatively, these interventions may be ineffective, or more
importantly, drive displacement into non-observable locations, or forms of violent behavior.
Indeed, studies from criminology repeatedly illustrate that monitoring certain spaces may
drive down violence in observed locations but increase it non-monitored areas, resulting in
no net change in violence (Levitt and Miles 2006, Nagin 2013).
This study brings novel evidence to bear on the debate over whether monitoring works
and uses a unique test to illuminate the ways in which it changes behavior in the context of
violent conflict. I analyze the impact of “Eyes on Darfur”, the first-ever satellite interven-
tion implemented by a human rights organization amidst a raging conflict with the objective
of deterring violence. Between June 2007 and January 2008, Amnesty International USA
selected a set villages in Darfur, monitored them using satellites, and notified the Govern-
ment of Sudan that those villages were monitored and that any atrocities committed in
them would be globally publicized. To examine whether this innovative program changed
the behavior of the Sudanese Government in Darfur, I estimate the impact of exposure to
monitoring using a novel dataset I construct of high-frequency, sub-national data on geno-
cidal attacks. I assess whether the program reduced or amplified violence and whether it
generated any unintended consequences by displacing violence. To do so, I use difference-
in-difference estimators over the full population of all village in Darfur as well as a smaller
set of counter-factual villages that I identify by leveraging Amnesty’s initial village selection
criteria.
My analysis proceeds in two broad steps. I first estimate the direct effect of monitoring
on violence and find that Amnesty’s intervention is associated with significant increases
in the likelihood that the Government of Sudan attacked monitored villages. I find that
the 15 percentage point increase in violence is robust to a series of alternative regression
specifications. A deep empirical challenge in analyzing monitoring is that violators may
alter their behavior to go undetected; while a cursory analysis may suggest that a moni-
toring intervention works or not, it may have just displaced violence. In the second step,
I address these concerns and analyze whether the program caused temporal and spatial
displacement effects. Specifically, I assess whether the Government of Sudan attacked vil-
3
lages in anticipation of the intervention or refrained from attacking this villages until they
believed monitoring had ended, as well as whether they avoided monitored villages and at-
tacked neighboring villages. I find that the impact of the program was not only pernicious,
but persistent: monitored villages experienced a 20 percentage point increase in attacks in
the year after the program ended. However, the intervention did not increase or decrease
violence in neighboring villages, which assuages fears that monitoring may simply displace
violence but tempers hopes that it may generate geographically protective enclaves.
I draw on suggestive, albeit limited, qualitative data to analyze these counterintuitive
results and explain why the Government of Sudan targeted these villages. The Government’s
public behavior and messaging suggests that they used Amnesty’s monitoring intervention
to signal its resolve to stay in power through violence to local audiences. This resonates
with a theory of monitoring that highlights its potential use as a mechanism to signal
commitment, which is particularly salient in low-information environments where the costs
of communicating resolve are high. It also underscores the potential perverse effects of
human rights interventions that aim to reduce the impact conflict through surveillance and
situates these findings in a broader framework of strategic signaling.
A series of challenges that complicate analysis merit discussion. First, Amnesty only
monitored 10 villages in Darfur due to feasibility constraints. While I draw on a dataset of
10,000 Darfuri villages to increase precision in estimation, underlying concerns over statis-
tical power warrant caution in interpretation. Second, I analyze data that is observational
in nature. To address this issue, I implement a matching algorithm to pre-process data to
account pre-treatment covariates and trends in violence, I use difference-in-difference esti-
mators to account for geographic- and time-fixed effects, and I conduct a series of robustness
checks to ensure that results are not artefactual to any single regression specification. Lastly,
I rely on secondary data for analysis as collecting first-hand accounts from perpetrators or
victims in active conflict remains a key obstacle to understanding the dynamics of violence.
Where possible, I conduct validity checks of the data and integrate qualitative interviews
to assess the validity of the findings and buttress the results.
While ‘Eyes on Darfur’ was a unique satellite program launched amidst an ongoing
genocide in the western region of Sudan, the findings are not limited to this case. The
underlying characteristics of the this program resonate with a broader family of monitoring
interventions that human rights organizations implement during conflict. Moreover, while
the use of satellite technologies are new, traditional concerns about the credibility, accuracy
4
and precision that characterize debates around monitoring similarly framed the debate
in this case. And, given that this intervention took place at the height of the Darfuri
genocide, this paper provides a hard test of monitoring conflict: evidence that human rights
organizations can shape the behavior of governments engaged in genocide may provide a
lower- or upper-bound estimate of the impact of these interventions more broadly.
This article contributes to a broad debate on the impact of monitoring by analyzing
the ways in which monitoring interventions that seek to reduce conflict shape the use of
violence. It responds to scholarly appeals to generate causal estimates of interventions that
seek to reduce violence (Hafner-Burton, 2014), and to the best of my knowledge, provides
the first micro-level quantitative study that examines whether monitoring atrocities incen-
tivizes governments to refrain from violence. It does so while appropriately accounting
for spillover effects, which are more than just nuisance parameters, but quantities of deep
theoretical interest. The results highlight the potential for monitoring interventions imple-
mented by NGOs to amplify violence. Paradoxically, however, these results simultaneously
demonstrate that even states entrenched in the most severe forms of violence are sensitive
to human rights organizations that monitor their behavior. These findings are all the more
important as NGOs increasingly engage in ‘NGO diplomacy’ to pressure states to change
their behavior (Betsill and Corell, 2008).
The findings of this study also contribute to a rich literature on the dynamics of civilian
abuse and illuminates the internal workings of violent regimes (Weinstein 2006, Wood,
Kathman and Gent 2012, Valentino 2014). Rather than analyze individual unit commanders
or soldiers, the empirical approach I use examines the use of violence between villages as
a portfolio choice of the Government and in doing so assesses the nature of command and
control within states. This case offers a sort of ‘statistical forensics’ for identifying and
implicating those responsible for violence. While Sudanese officials continuously claimed
they did not have any control over janjaweed militias exacting violence in Darfur, it was the
only actor notified of the intervention. Evidence provided here highlights that monitored
villages were strategically targeted and, as such, suggests that there was indeed a command
and control structure between the Government of Sudan and the militias. These findings
suggest that violence is the source of deep structure rather than its absence (Humphreys
and Weinstein, 2006).
Lastly, this article provides the first set of estimates on the effect of a new technology
championed by human rights activists as a groundbreaking tool to enhance human rights,
5
and in doing so provides early evidence on the impact of an increasingly democratized
form of surveillance. While this itself is non-trivial, the core question remains whether
and how these new technologies change the strategic dynamics between those who monitor
and those monitored. Theory offers guidance in answering this question and understanding
the importance of this case. Collecting information in conflict zones remain deeply difficult,
particularly in countries that deny access to monitors in order to avoid the documentation of
their behavior. Sudan did not consent to Amnesty’s presence, yet Amnesty was nonetheless
able to monitor a set of villages. By removing the decision-node at which the government
could accept or reject monitoring, this case illuminates the impact of monitoring for a
broad family of conflicts that often go unexplored. In doing so, this article contributes a
set of estimates that get past the selection bias in evidence that monitoring often produces
both within conflicts and across conflicts. As such, it moves beyond a key impediment in
understanding the role of human rights interventions in conflict and more broadly expands
the scope of evidence on the effect of human rights monitoring.
2 Theory
2.1 Direct Effects
While methods vary, the core activities of human rights organizations and actors that
monitor conflict to deter violence remains constant: produce, document, and disseminate
evidence about the behavior of a given regime or non-state actor. Monitoring affects behav-
ior by altering the expected cost of engaging in certain behavior. A given actor’s expected
utility over an action is expressed as follows: E(u) = pU(B − C) + (1 − p)U(B), where
E(u) is the expected utility, p is the probability of sanction, B are the benefits of a given
action, and C is the cost of sanction.1 The impact human rights monitoring, which is rooted
in accurate, credible and impartial information collection, is to increase the probability of
detection p in order to reduce the expected utility of engaging in violent behavior (Hill,
Moore and Mukherjee, 2013).2
Monitoring may deter violence during conflict through two unique mechanisms.3 First,
1This follows from the core model of expected utility that Becker (1968) originally proposed an individualfaces when deciding to engage in a crime.
2This presumes that the cost of sanctions are non-zero, which is not always clear.3In a third, but less relevant mechanism in the context of human rights advocacy, monitoring may deter
conflict by reducing the information asymmetries that lead to war in the first place. Potential adversariesmay wage war due to information asymmetries in which one or both sides don’t know the true capabilities
6
evidence of atrocity often mobilizes third party actors to take action against those re-
sponsible (Kydd, 2010). These are often meted out in the form of economic sanctions or
international criminal court warrants, and in severe cases, military intervention. The lack
of evidence of atrocities is often cited by third parties as a barrier to appropriate reprisal:
without reliable evidence, it is difficult to justify action. In these cases monitoring may
provide sufficient information to trigger action or mobilize domestic bases to pressure states
to take action (Keck and Sikkink, 1998). Additionally, the vast majority of contemporary
conflicts ends in negotiated settlements mediated by third parties (Walters 2002, Toft 2005,
Sisk 2009). At the negotiation table itself, parties make claims to the division of goods
based on their bargaining power, which is often shaped by what happened during the con-
flict. Cases in which one side committed mass atrocities or were particularly harmful may
have a weaker position at the bargaining table. Lastly, while international criminal law
remains weakly institutionalized, increasing evidence suggest that actors may incorporate
potential future legal implications into their decision-making (Sikkink, 2011).
Alternatively, the infrequently-considered mechanism of ‘legacy effects’ may prevent
violence as actors engaged in conflict may not want to be remembered for their behavior.
Shaming strategies are crucial to human rights organizations and may indeed have an effect
on the decisions actors make if they are concerned with the legacies they leave behind.
In this sense, monitoring may deter violence by producing evidence with which actors do
not want to be associated. This is uniquely different from economic or legal reprisal as
it encompasses non-material losses. While research on the legacies of war for victims has
received increasing attention (Blattman, 2009), the legacies of perpetrators remains scant
and a viable mechanism through which monitoring may reduce violence.
Both mechanisms require that monitored parties are ultimately responsible for, and
capable of, restricting violence. Indeed, models of human rights monitoring typically ascribe
responsibility for violations to a command structure within a state or non-state actor. Given
findings that civilian abuse and human rights violations are often the source of institutionally
weak actors unable to restrain violence, this assumption is not innocent (Humphreys and
Weinstein 2006, Hafner-Burton 2014). A more important question is under what conditions
monitoring may indeed reduce violence through these mechanisms. For material sanctions to
motivate change, actors must have something to lose or feel vulnerable to intervention. This
suggests that monitoring may be relatively effective in nascent conflicts in which states have
of their foe and therefore over-estimate their ability win a emerge victorious from a conflict (Powell 2002Fearon 1995). Monitoring conflict may serve to correct these asymmetries and therefore reduce conflict.
7
not yet been isolated or in states that are of particular strategic value in the international
arena. Identifying when ‘legacy effects’ may be at play is more idiosyncratic given that they
occur at the individual-level, but may be relevant when conflicts are cast as unnecessarily
brutal rather than strategically necessary. While these mechanisms differ in the ways in
which they reduce conflict, the suggest the following hypothesis:
H1: Monitoring communities reduces violence by increasing the probability of detection.
However, this hypothesis is contentious precisely because monitoring may operate to
amplify conflict. First, monitoring may increase violence by allowing actors to signal their
strength or commitment to an issue. A key challenge of warring factions in low-information
environments is signaling their capacity or resolve to their adversaries. While violence is a
costly act used to induce a certain type of behavior in victims and others, actors would prefer
to use less violence to generate the same behavior if possible (Cohen 2011, Downes 2008,
Esteban, Morelli and Rohner 2012, Valentino, Huth and Balch-Lindsay 2004). If monitoring
produces and transmits the type of information that actors wish to inform their enemies of,
it may amplify violence in certain areas by incentivizing actors to “send a strong message.”
In the case of third-party monitoring, actors are provided two audiences: the human rights
community or international arena, and local groups party to the conflict. Monitored actors
may wish to signal to one or both audiences and can shape their strategies accordingly.
Lastly, monitoring may increase violence by reducing ambiguity in actor’s transgressions
and producing sufficiently incriminating evidence. This may be imposed, or facilitated,
by monitoring. In the former case, monitoring may generate information about violent
behaviors that reduces the possibility of reaching a negotiated settlement or exiting quietly;
here actors may pursue conflict if outside options for peace have been reduced. This may
be particularly relevant at the beginning of a conflict when the culpability of certain actors
remains opaque. Scholarship on the impact of the international criminal court has debated
whether issuing warrants extends the duration of conflict by reducing available exit options
(Snyder and Vinjamuri 2006, Jo and Simmons 2014); monitoring follows the same logic. In
the latter case, actors who want to signal commitment to an issue, but are unable to do
so in the absence of monitoring, may use it to generate that exact type of evidence: by
actively removing an outside option, actors commit to an arc of violence. Here, monitoring
solves the problem of credibly committing to violence (Fearon, 1998).4
4Salient to conflicts with multiple non-state actors, monitoring may increase violence by legitimizing
8
Ultimately, monitoring may generate different effects and findings in favor or against of
the hypothesis that monitoring reduces violence provide substantively interesting interpre-
tations, as would null effects. If monitoring reduces violence, this suggests that a keystone
strategy of human rights organization generates its indented effects. Alternatively, null
results suggest that actors are not sensitive to the establishment of monitoring. Null ef-
fects, however, are quite powerful: by detecting these effects precisely, the international
community can learn that monitoring does not alter the strategic calculus of actors en-
gaged in conflict. If monitoring increases the frequency or intensity of violence, this might
suggest that violence functions as a signal. Positive findings may illuminate the signaling
value of violence in conflict and also highlight the possibility that monitoring can result in
unintended, adverse effects.
2.2 Substitution Effects
A significant challenge to evaluating the effect of any monitoring intervention is determining
whether violence has been deterred or displaced. While failing to appropriately account for
spillover effects may generate spurious results (Gerber and Green, 2012), spillovers are more
than just nuisance parameters. The presence, or lack thereof, of spillover effects illuminates
the strategic choices that actors make in light of monitoring. While actors who shift their
violence reveal that they are fundamentally sensitive to these interventions, actors who
make no adjustments reveal a total lack of sensitivity.
Evidence from multiple fields suggests that monitoring interventions do indeed induce
displacement. Criminological analysis of various policing programs suggest that these in-
terventions generally displace violence (Dills, Miron and Summers 2008, McCarthy 2002).
Indeed, Donohue, Ho and Leahy (2013) re-analyze Di Tella and Schargrodsky (2004) sem-
inal study on the impact of policing in Argentina and show that the core result that it
reduced crime drops out once displacement is accounted for in analysis. Similarly, electoral
monitoring has been consistently shown to displace vote irregularities (Hyde 2010, Inchino
and Schundeln 2012). In the context of conflict, evidence suggests that actors are often
sensitive to the production of information about crimes against humanity and invest in sub-
stitution strategies; mass graves are one example of how actors engage in costly behavior
actors who would have otherwise gone unnoticed or not engaged in violence. Here, monitoring solves thekey challenge that non-state actors face in being recognized as a group with legitimate policy or ideologicalgoals. This logic of legitimization highlights the potential for third parties to breed conflict due to the moralhazards they produce (Kuperman 2008, Kydd and Strauss 2013).
9
to conceal their actions.
Specifically, armed actors can draw on three strategies in light of monitoring beyond
increasing or decreasing violence: 1) wait to commit violence until they believe monitor-
ing has ended, 2) re-target their violence to non-monitored areas, or 3) alter the type of
violence used in order to camouflage their behavior. Because the relative value of substi-
tution decreases as the marginal cost of relocation increases, the presence of displacement
illuminates the elasticity of targeting in conflict. However, each strategy corresponds to a
different type of substitution that reveals the underlying strategic calculus of conflict. The
most commonly analyzed form of displacement is spatial. In this case, actors shift their tar-
geting to non-monitored villages in order to pursue their goals without the clear production
of evidence around these issues. This dynamic generates the following hypothesis:
H2: Monitoring communities displaces violence to neighboring communities by increas-ing the probability of detection.
While monitoring may indeed displace violence to neighboring areas, it may also provide
protection. If actors are indeed sensitive to monitoring and seek to minimize their exposure
to risk, they may avoid broader swaths of areas encompassing monitored sites. In this case,
monitoring generates positive externalities and results in a ‘halo effect.’ An alternative form
of displacement is temporal: actors may simply wait to exact violence in villages until they
believe monitoring is completed. During military operations deployed over vast areas, the
cost of waiting may be high; troops remain stationed and must be re-supplied. However, the
cost of culpability may outweigh these logistical concerns. Given a prior that monitoring
does change behavior, this suggests the following hypothesis:
H3: Monitoring communities delays violence within communities by increasing the prob-ability of detection.
This type of displacement reveals an underlying patience that resonates with actors
invested in long-term strategic planning. Indeed, if actors were sensitive to monitoring, yet
faced urgent time constraints, they may solely change the location rather than the timing
of the targeting. Alternatively, if actors seek to leverage monitoring to amplify violence,
monitored sites will be targeted more swiftly than planned. An alternative concern is that
actors are notified that monitoring will take place prior to its actual implementation. This
is common occurrence in the deployment of peacekeepers and human rights monitors in
simmering conflicts where the delay between the announcement of the program and its
10
launch are substantial. In anticipation of monitoring, actors may target communities that
are future areas of scrutiny. I analyze both long-term and anticipation effects in my empirical
analysis.
A last form of displacement is one in which actors substitute into alternative forms of
violence, most commonly, by shifting from publicly observable forms of violence to private
forms of violence.5 This form of camouflage is often employed in conflicts where actors
attempt to obscure their behavior. In the context of satellite monitoring in Darfur for
example, actors may stop raising villages, which are detectable by satellites, and instead
commit atrocities that leave no visual signature. This type of substitution is untestable with
the data I use in this paper and highlights a key challenge is analyzing spillovers: correctly
estimating spillovers requires articulating and testing models of spillover, yet, the failure to
identify the appropriate model may leave other estimates biased.
3 Eyes on Darfur
In February 2003, the Sudan Liberation Army (SLA) and Justice and Equality Movement
(JEM) launched an attack on a Sudanese airbase in Al Fashir, the capital of North Darfur.
While this is attack has become the commonly accepted marker for the beginning of a
brutal conflict that would subsume the Darfuri region over the next few years, violence
in the region has long historical roots (Flint and de Waal, 2008). Both the SLA and JEM
formed in response to a campaign of systematic oppression and discrimination waged by the
Sudanese Government against the Region of Darfur, demanding regime change and equal
rights for all Sudanese citizens.
In response to attacks by the SLA and JEM, the Government of Sudan launched a
vicious counter-insurgency operation in collaboration with mercenary fighters known as the
Janjaweed (Prunier, 2008). With the support of indiscriminate aerial bombings dropped
by the Government of Sudan, the Janjaweed conducted ground attacks throughout Darfur,
burning villages, killing livestock, raping woman, and massacring villages (Hazlett, 2013).
Between 2003 and 2008, an estimated 450,00 deaths were directly attributable to the conflict
and 3.2 million people were displaced (de Waal et al., 2014). The nature, intensity and intent
of the violence sparked a broad debate over whether the conflict should be classified as a
5Monitoring may also incentivize two other types of camouflage: one in which actors use monitoring tosend false signals to their adversaries as was famously done during World War II when the allied forces builtan army of inflatable tanks to deceive Axis forces, and another in which actors camaflouge themselves astheir adversaries and commit atrocities in order to reduce the credibility (Gambetta, 2009).
11
genocide.
The conflict in Darfur mobilized unprecedented amounts of activism throughout the
United States and Europe. Anti-genocide advocates, human rights organizations and hu-
manitarians championed intervention in Darfur and an immediate stop to violence. Core to
the movement was collecting information about the conflict and using that information to
change the behavior of those involved in the conflict. This project itself was deeply contro-
versial. In the muddy landscape of information politics, organizations charged that other
groups weren’t collecting accurate information or were manipulating information for polit-
ical ends, over-simplifying complex narratives to achieve campaign goals without concern
for unintended consequences (Mamdani 2009, Lanz 2009).6
While multiple organizations engaged in various forms of information collection and
advocacy over the arc of the conflict, Amnesty International was the first organization to
use satellite technology to monitor violence in Darfur. The objective of the intervention
was to collect credible information about the violent behavior of both the Government of
Sudan and the Janjaweed and in doing so, alter their incentives to engage in violence.
3.1 Amnesty International’s Satellite Intervention
In June of 2007, Amnesty International launched Eyes on Darfur. The goal of the project
was to deter violence in these villages by generate evidence of atrocities that could be used to
mobilize the base back home, as well as to document violence in order to provide historical
record of the conflict. The motivation for using satellites was simple: the Government of
Sudan’s denial of entry visas to human rights organization and researchers reduced the
ability to collect information about the conflict on the ground and satellite imaging offered
an opportunity to circumvent these barriers to ‘groundtruth’ the genocide.
The project monitored ten villages throughout Darfuri region and two refugee camps in
Chad. Amnesty developed a set of criteria for village selection and chose treatment units in
consultation experts on conflict and the Darfuri crisis more generally, as well as specialists
in satellite technology. Throughout the criteria development process, Amnesty aimed to
maximize the scope of the program subject to both financial and technological constraints.
The process was largely qualitative in nature.
6The information gathered and used by the Save Darfur Coalition, for example, moved Sam Worthingtion,then head of Interaction, to send a letter to David Rubenstein the head of the Save Darfur Coalition in 2008that stated, ‘I am deeply concerned by the inability of Save Darfur to be informed by the realities on theground and to understand the consequences of your proposed actions,” (Strom and Polgreen, 2007)
12
Ultimately, three criteria were used to determine participation in the program: 1) prox-
imity to the frontline of conflict in 2007, 2) proximity to natural resources such as water,
3) geographic location. Twelve villages close to the conflict but geographically dispersed
throughout the region and endowed with resources were included in the program. Upon
village selection, Amnesty tasked and acquired satellite images of these villages to establish
a visual baseline before launching the project.
The Eyes on Darfur project was officially launched on June 6, 2007 with an event at the
Fifth International Symposium on Digital Earth (ISDE5) at the University of California.
At this point, villages were selected and monitored, the Government of Sudan was notified,
and a website that activists could access with information about the project was estab-
lished. Over the next six months, Amnesty waged a continuous campaign that targeted the
Government of Sudan to stop violence in these monitored villages.
3.1.1 Defining the Treatment
To monitor villages in Darfur, Amnesty tasked high-resolution satellites to image monitored
villages prior to and after their mobilization campaign. Satellite images provide static aerial
snapshots, that compiled over time, can be used to detect changes in the landscape. These
images offer the ability to identify destroyed infrastructure, bombings and mortar shellings,
and mass livestock death or theft. They err towards capturing highly visible, indiscriminate
forms of violence. Given that this was the first time a human rights organization launched an
ongoing satellite monitoring intervention, it was important that the Government of Sudan
understood the scope and nature of the program.
As such, the project was accompanied by a series of actions common to activist cam-
paigns and coordinated through a publicly accessible online platform. The Eyes on Darfur
website7 included satellite evidence of genocidal destruction that had taken place in Darfur
to demonstrate the capacity of aerial surveillance to generate evidence of atrocities, an anal-
ysis of the conflict provided by academics and policymakers, a list of the villages that were
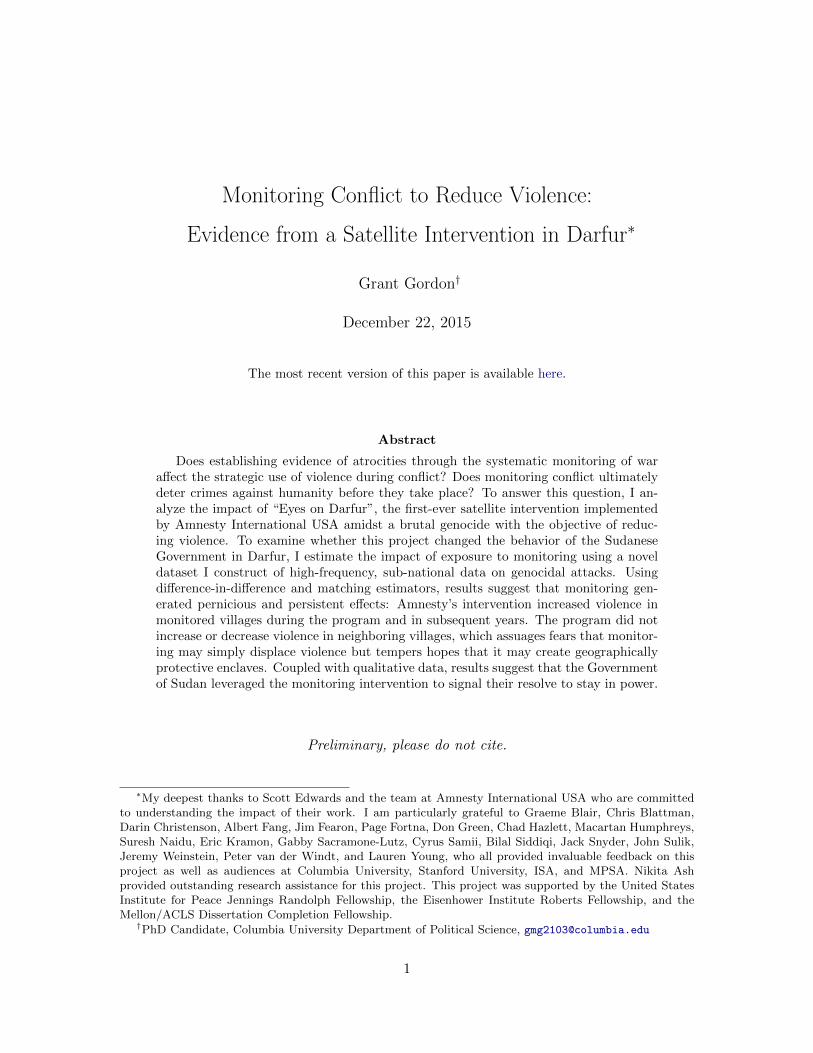
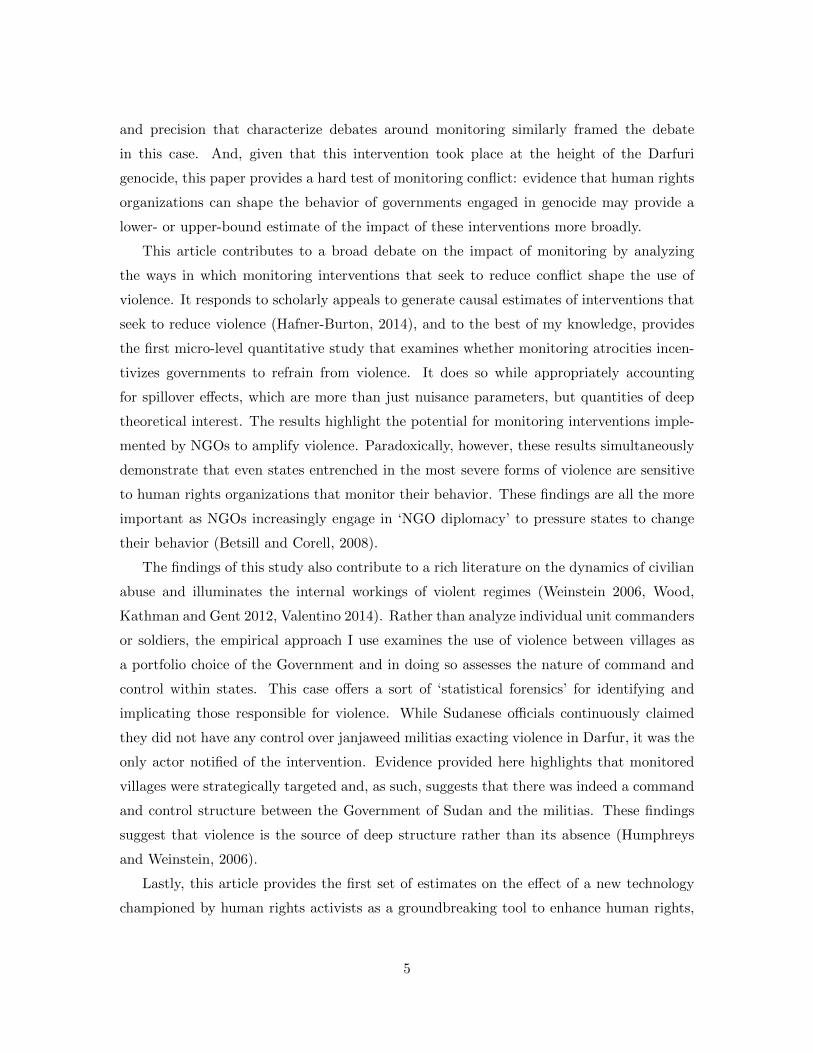
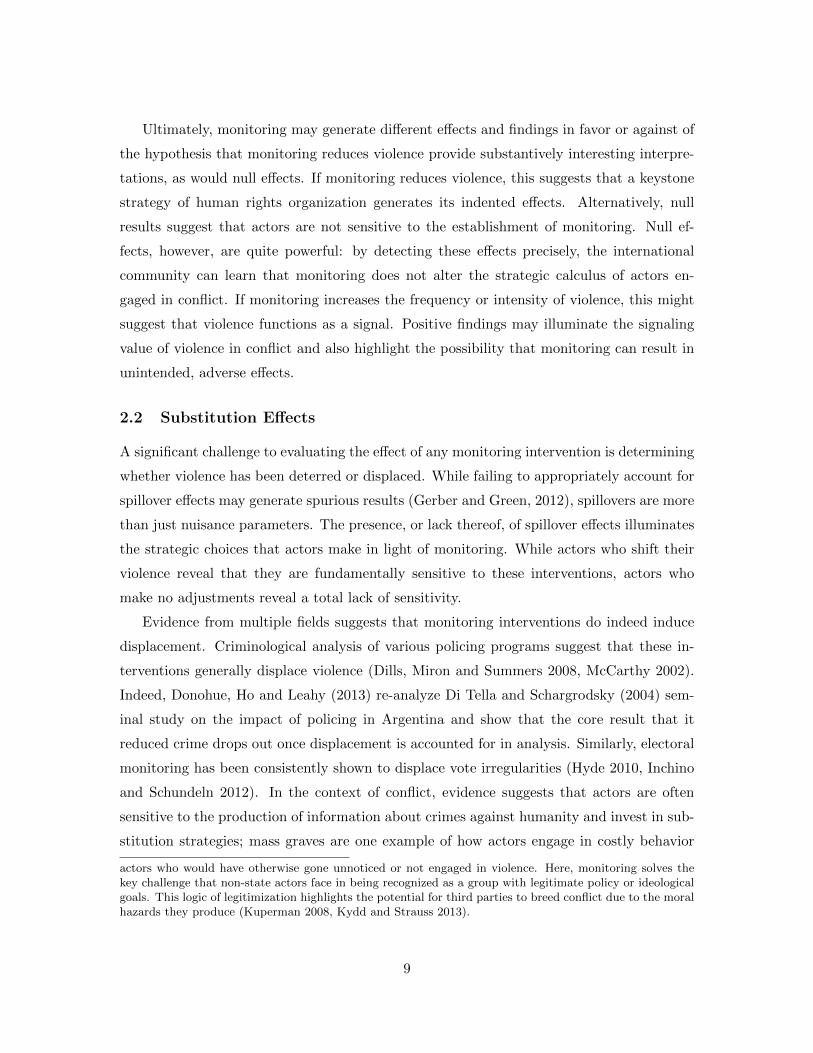
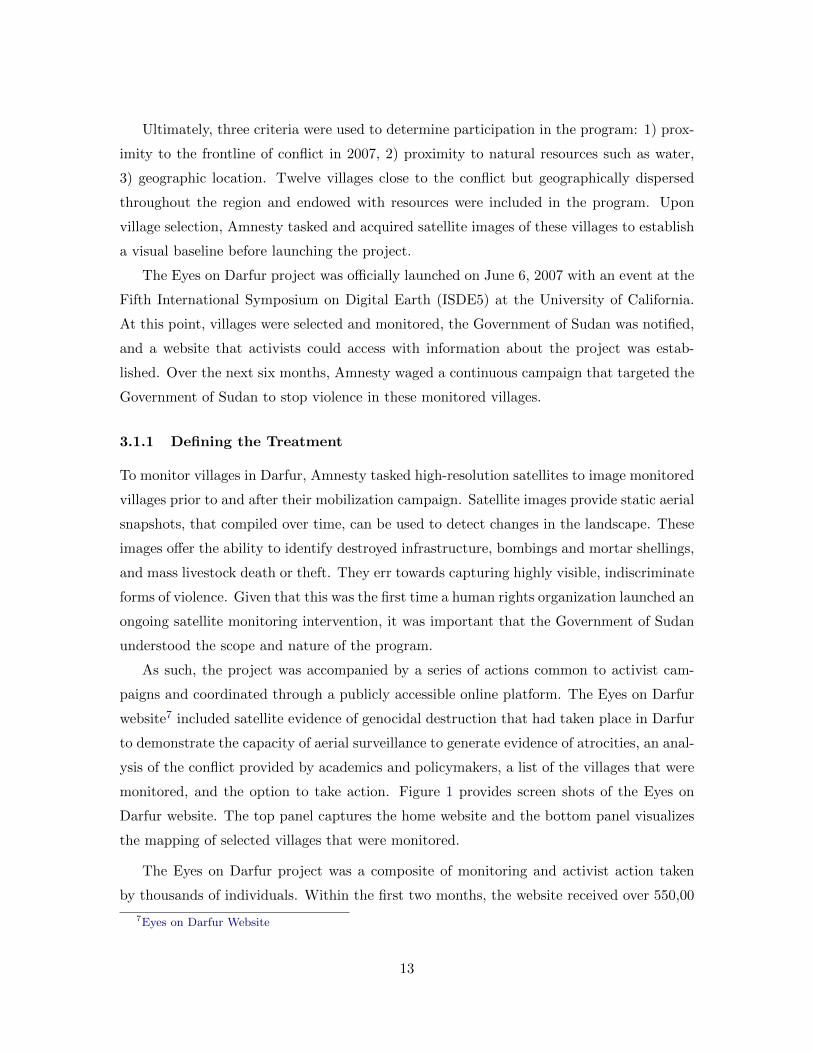
monitored, and the option to take action. Figure 1 provides screen shots of the Eyes on
Darfur website. The top panel captures the home website and the bottom panel visualizes
the mapping of selected villages that were monitored.
The Eyes on Darfur project was a composite of monitoring and activist action taken
by thousands of individuals. Within the first two months, the website received over 550,00
7Eyes on Darfur Website
13
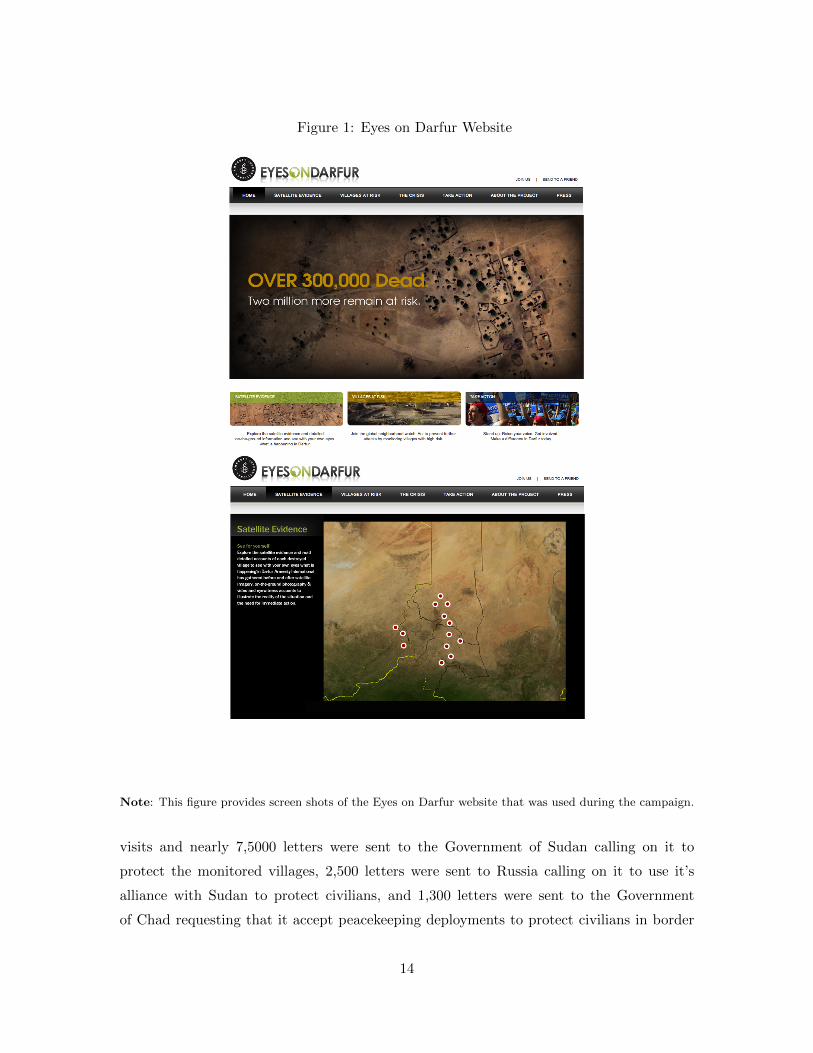
Figure 1: Eyes on Darfur Website
Note: This figure provides screen shots of the Eyes on Darfur website that was used during the campaign.
visits and nearly 7,5000 letters were sent to the Government of Sudan calling on it to
protect the monitored villages, 2,500 letters were sent to Russia calling on it to use it’s
alliance with Sudan to protect civilians, and 1,300 letters were sent to the Government
of Chad requesting that it accept peacekeeping deployments to protect civilians in border
14
areas. Given that this was the first satellite intervention implemented, relevant actors had
weak priors over its potential its effects and anecdotal evidence suggests that the Sudanese
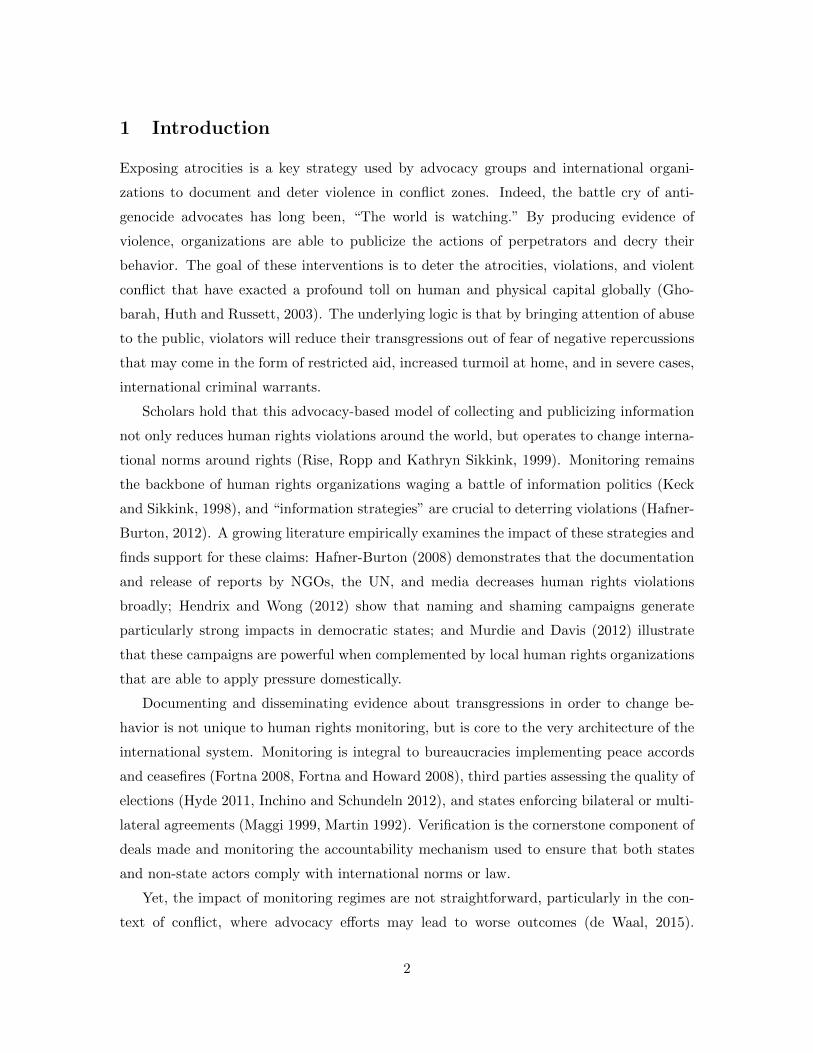
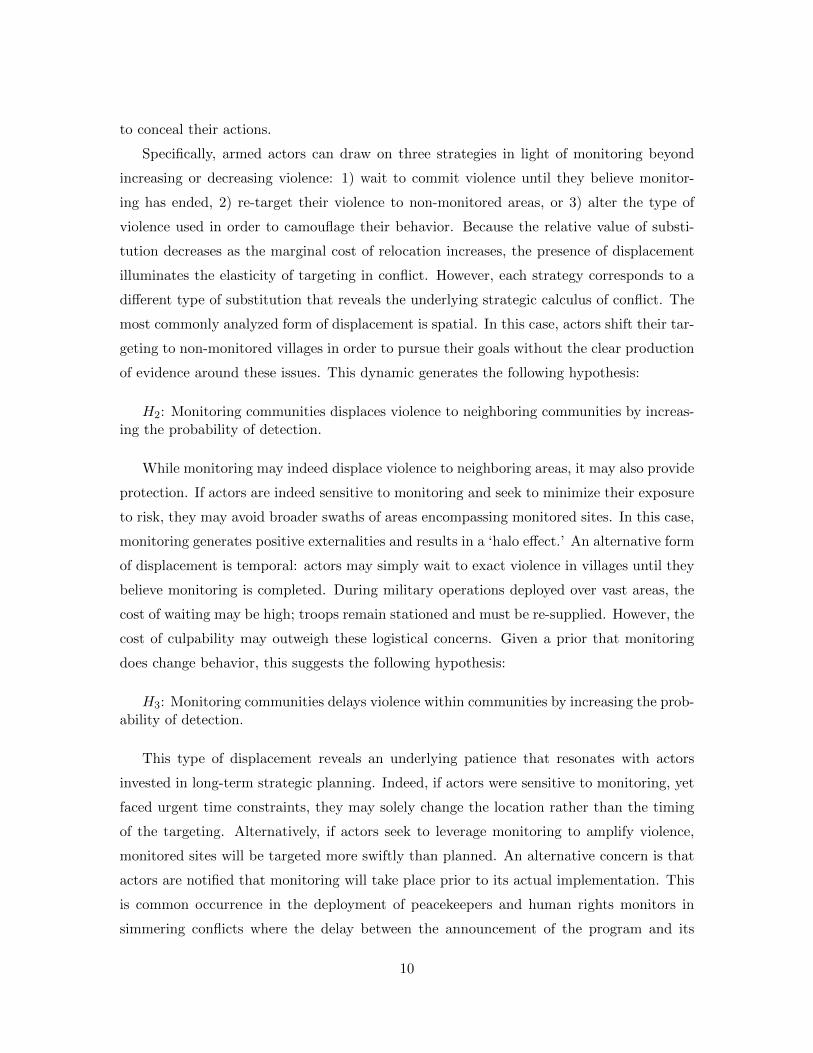
government took it quite seriously. Figure 2 provides the text of the notification that was
sent to the Government of Sudan by thousands of activists.8
Figure 2: Amnesty International Letter to Government of Sudan
Action: Act to Protect 12 Towns and Villages in Darfur and Eastern Chad Target: President al-Bashir Instruction to Activists: Amnesty International USA has identified 12 towns and villages in Darfur and eastern Chad that are at risk of attack by Janjawid militia, the Sudanese Government, and/or armed opposition groups. Using satellite technology, AIUSA is closely monitoring these sites and others in the region. Action must be taken now to prevent these sites from joining the long list of towns and villages utterly destroyed in Darfur and eastern Chad. Tell Sudanese President al-Bashir the world is watching and that we will know if harms comes to these civilians and ask him to take all necessary steps to prevent attacks on these sites. The message is: I am writing to bring your attention to the imminent danger facing the following 12 villages and towns in Darfur and Eastern Chad: 1. Malam al hosh in North Darfur 2. Boldong in West Darfur 3. Bir Dagig in West Darfur 4. Silea in West Darfur 5. Saraf Jidad in West Darfur 6. Bulbul in South Darfur 7. Sanam el Naga in South Darfur 8. Deleba in North Dafur 9. Hashaba in North Darfur 10. Kafod in North Dafur These villages and towns are at high risk of attack by Darfur opposition groups, Janjawid militia, and potentially the armed forces of Sudan. I implore you to protect the civilians of Sudan, and take all steps necessary to ensure these villages do not come under attack. Additionally, I am writing out of concern for the Habile and Goz Amir camps in eastern Chad, both of which are very close to the Sudan border. These sites are at risk of attacks by Janjawid militia crossing over from Darfur and their Chadian allies. I further ask you to prevent militia who identify themselves as aligned with the Sudanese government from targeting civilians in Chad, and to take all necessary steps to disarm the Janjawid and prevent their incursions in Chad as you have committed to do in the past. As you know, the insecurity facing these 12 towns, villages and camps for internally displaced persons and refugees is grave. Amnesty International has collected testimony and other documentation demonstrating the terrible effects of this vulnerability. Sudanese families have been displaced throughout Darfur, countless civilians have been killed, and the insecurity faced by humanitarian aid providers further threatens millions of civilians desperately dependent on such aid. Using new public and satellite technology, people all across the globe are watching these 12 towns, villages, and camps and other sites throughout Darfur and Eastern Chad with grave concern for the well-being of concerned people across the globe who wish to see a secure and prosperous Sudan, I ask you to ensure the protection of these sites.
8It is important to note that the treatment notification did not specify an end date. Thus, while we canassess whether there were anticipation effects or delays, it provides suggestive evidence as it is difficult toattribute this to a sharp program ending.
15
The design and delivery of the treatment have two important implications for assess-
ing the impact of Eyes on Darfur. First, participating villages were not notified that they
were being monitored. While it is possible that their status was transmitted through other
channels, this remains unlikely given the challenges of communication and low levels of
technological access in Darfur during the genocide. As such, the common alliance between
human rights organizations and the people for whom they advocate was not forged. There-
fore, if the intervention did change patterns of violence, it is unlikely that these effects
would be driven by villagers who acted differently in light of being of monitored. This sug-
gests that evidence of impact can be attributed to top-down change. Second, the campaign
was directed at the Government of Sudan rather than the Janjaweed forces the officials
asserted they had no relationship with, much less any command and control over. Letters
were sent directly to Government offices and the main concern with these types of inter-
ventions remain uptake of treatment rather than its over-disbursement. As such, evidence
of impact provides a sort of statistical forensics that connects the Government of Sudan’s
decision-making to violence on the ground. Establishing this coordination is integral to
appropriately adjudicating responsibility of the crimes against humanity that took place in
Darfur.
3.1.2 Calls Unheard?
A key question about the Eyes on Darfur is the extent to which Sudanese officials were
aware of the monitoring intervention. Establishing their knowledge of the program is key
to illuminating a causal chain of impact and whether it indeed worked through government
officials. Importantly, in the case that the program did not have an impact, it rules out the
possibility that the intervention was unsuccessful because officials were unaware. Moreover,
providing this type of ‘first stage’ allows us to analyze the strategic response of actors in
the public arena.
The magnitude and novelty of the intervention generated ample press coverage. In addi-
tion to articles in the New York Times, Washington Post, Al Jazeera and other international
new sources, the project was reported by the Sudan Tribune.9 The most direct acknowl-
edgment of the program came shortly after it’s launch on June 6, 2007, when the Sudanese
Ambassador to the US, John Ukec, publicly decried Amnesty’s program on National Public
Radio.10 Additionally, Chad’s Ambassador to the United States, Dr. Mahamoud Adam
9Link to Sudan Tribune Article.10Link to NPR Interview.
16
Bechir, contacted Amnesty to acknowledge that their advocacy had changed the Govern-
ment of Chad’s policy on the presence of UN forces in Chad that would be used to protect
Sudanese refugees.
Evidence also suggests that the project may have reached the executive office in the
Government of Sudan. In a public statement at the African Union, President Omar al-
Bashir called on member states to establish an African Space agency to protect its air
from spy satellites. This statement, however, came in 2012 after Amnesty’s project had
ended and other satellite interventions in Darfur had begun, but nonetheless suggests that
there was executive knowledge of these types of interventions more broadly.11 While the
ideal evidence would not only indicate whether the Government of Sudan was aware of the
program but which villages they believed were monitored, weak evidences does suggest a
knowledge of the program.
4 Data & Measurement Strategy
4.1 Assessing Violence in Darfur
Assessing the impact of a monitoring intervention amidst a conflict requires high-frequency,
micro-level data on genocidal violence. While the use of this type of data has grown in the
study of conflict, collecting accurate and timely information on violence remains a challenge.
This is particularly true of in Darfur, where humanitarians, human rights organizations
and researchers have been systematically denied access since the beginning of the genocide
in 2003. To overcome these challenges, I leverage a novel dataset generated by the US
Department of State Humanitarian Information Unit (henceforth HIU) on damaged and
destroyed villages in Darfur, which provides the full population of villages in Darfur with
precise geo-coordinates and identifies the year in which they experienced conflict between
2003 and 2010.
A combination of classified and non-classified information collated from satellite images,
military and civilian intelligence, and human rights organizations was used to construct this
dataset (classified information was stripped of all sensitive content prior to its inclusion).
Classification of damage was done internally and according to the State Department, “the
methodology employed is a conservative one” and only records of damage and destruction
for which there was a high degree of confidence were coded as such. Give the sourcing and
11Link to article.
17
coding process, the data is biased towards publicly observable forms of violence such as
village burning and marks left by aerial bombardments. This coding provides a hard test of
the hypotheses. While this data makes it impossible to identify whether the Eyes on Darfur
project incentivized actors to substitute into privately observable forms of violence, it does
increase certainty in conflict incidences for observable violence.
The dataset contains 9,183 observations and villages enter the dataset at least once if
they were never attacked and can enter the dataset multiple times if there were attacked
more than once. Violence is coded using a binary variable indicating if it was ever damaged
or destroyed and the data demonstrate the brutality of the conflict: 38% of villages were
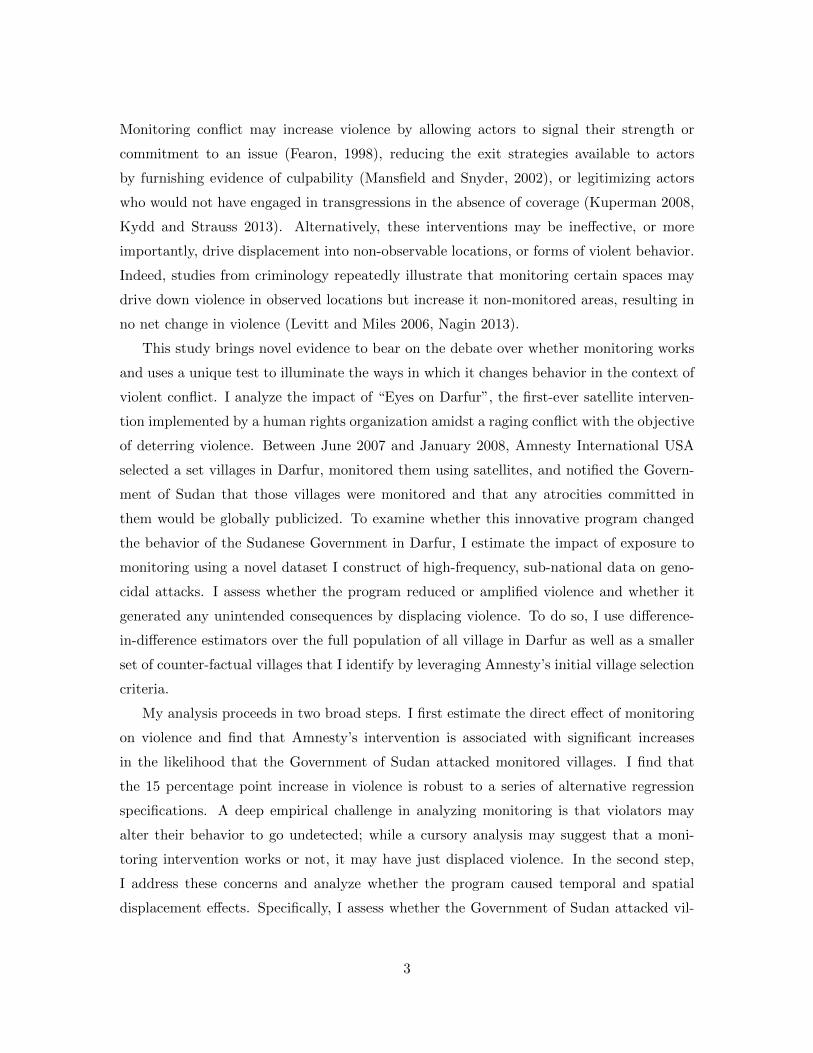
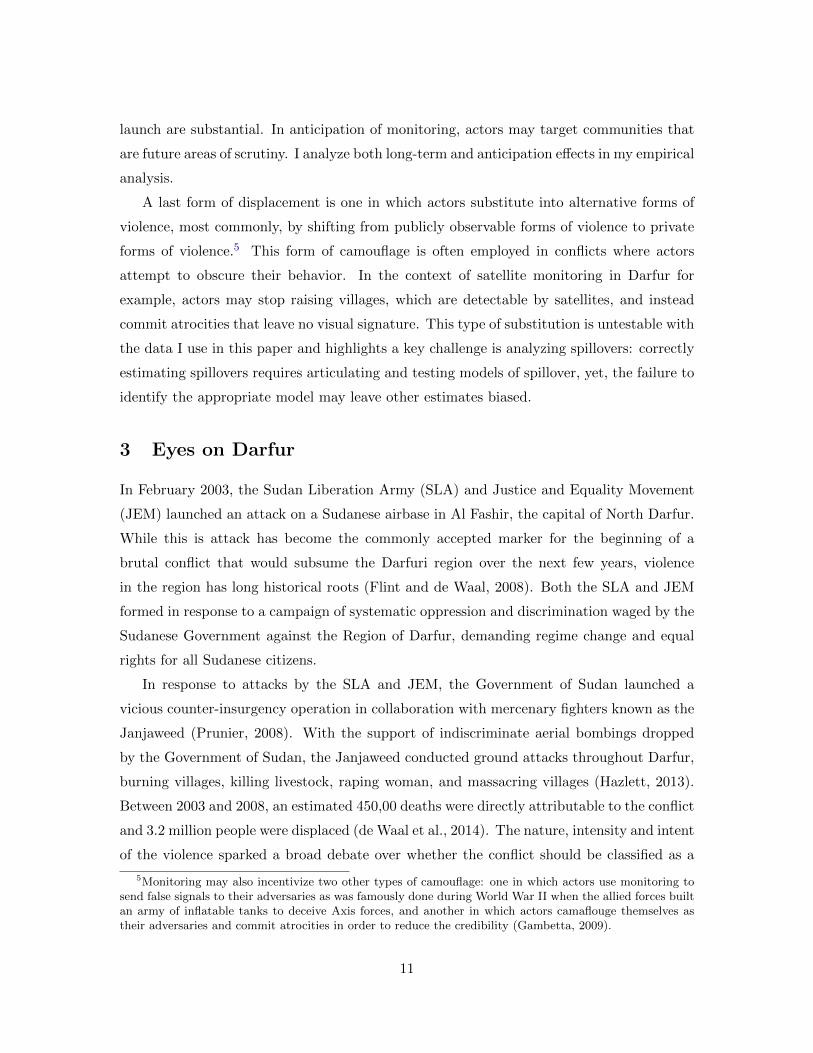
violently attacked over the arc of the war.12 Figure 3 visualizes the the distribution of
violence in Darfur and also identifies the monitored villages that were apart of the Eyes on
Darfur campaign; note that that the white space in the figure captures unpopulated areas.
4.2 Unit of Analysis
Using the HIU data, I aggregate yearly village outcomes over a geographic area to construct
a panel of cross-sectional units of grid i in year t between 2003 and 2009. The motivation
for constructing this type of panel is twofold. First, the geographic scope of the satellite
images taken by Amnesty extended beyond the border of a single village. While Amnesty
did not inform the Government of Sudan which satellite it tasked with imaging the villages
in Darfur, there were three commonly used high-resolution satellites available to task that
ranged 8 - 16.5km when Eyes on Darfur was launched.13 While the Government of Sudan
didn’t know the exact size of the images taken, a liberal estimate would have been around
16km in length and a conservative estimate would have been around 8km in length. As such,
using grids that cover broader swaths of territory than a single village more accurately reflect
the actual intervention.14 Second, this unit of analysis more flexibly allows for imprecision
generated in the data through the collection process. For example, while the HIU datset
captures the population of villages in Darfur over time, 68% of village names are missing
and there is spatial imprecision in the dataset; e.g. for villages with matching names,
12This dataset is unique because of its focus on damage and destruction rather than deaths. This elementalso makes it difficult to validate against other estimates of conflict deaths that have been produced in Darfuras the unit of analysis is different.
13This includes the Quickbird, GeoEye and Orbview-3 birds14In the HIU dataset, the average distance between a village and its nearest neighbor is 2.61 kilometers
and this distance increases by half a kilometer to each next village. This suggests that small units wouldinclude roughly 5 villages.
18
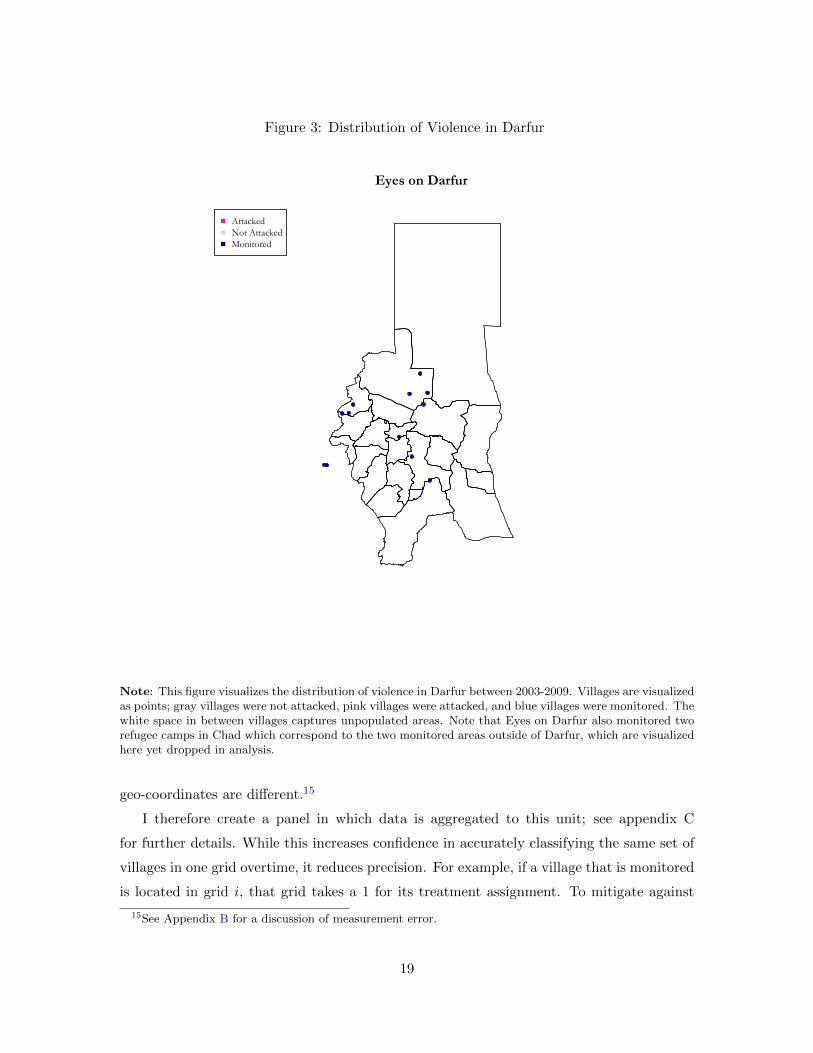
Figure 3: Distribution of Violence in Darfur
Eyes on Darfur
AttackedNot AttackedMonitored
Note: This figure visualizes the distribution of violence in Darfur between 2003-2009. Villages are visualizedas points; gray villages were not attacked, pink villages were attacked, and blue villages were monitored. Thewhite space in between villages captures unpopulated areas. Note that Eyes on Darfur also monitored tworefugee camps in Chad which correspond to the two monitored areas outside of Darfur, which are visualizedhere yet dropped in analysis.
geo-coordinates are different.15
I therefore create a panel in which data is aggregated to this unit; see appendix C
for further details. While this increases confidence in accurately classifying the same set of
villages in one grid overtime, it reduces precision. For example, if a village that is monitored
is located in grid i, that grid takes a 1 for its treatment assignment. To mitigate against
15See Appendix B for a discussion of measurement error.
19

this loss in precision and ensure that results are not artefactual to grid size construction, I
estimate all specifications against various grid sizes. The core analysis presented uses grids
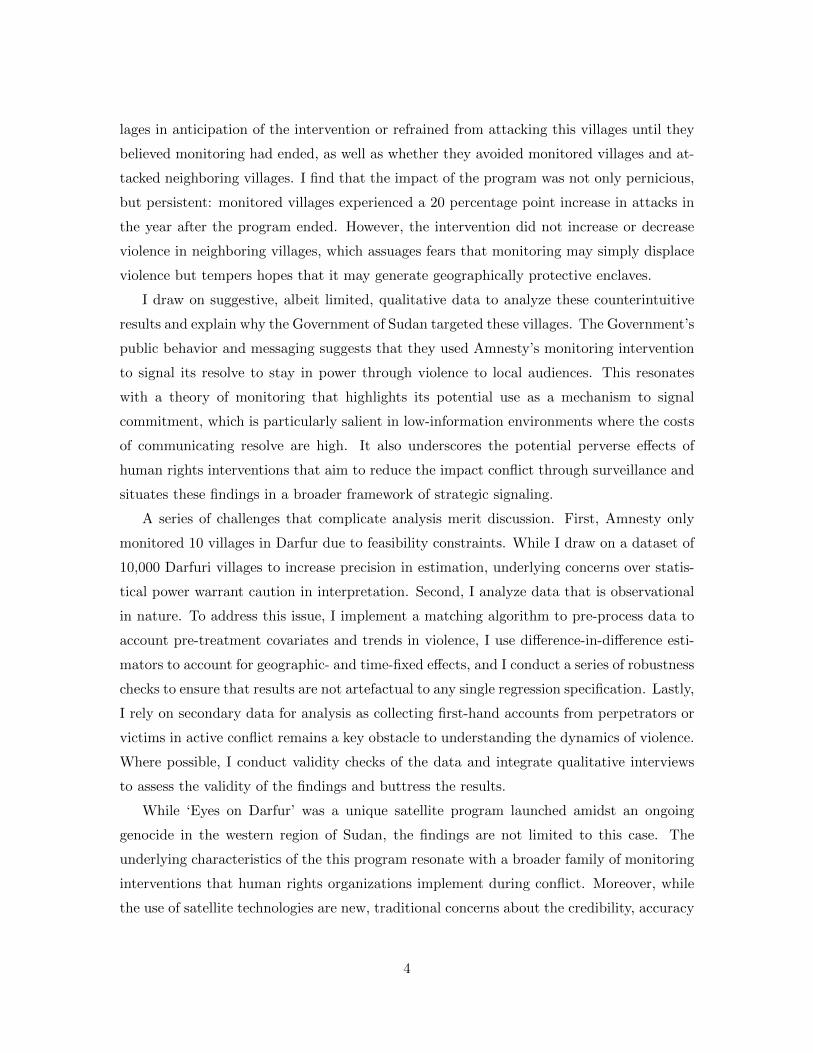
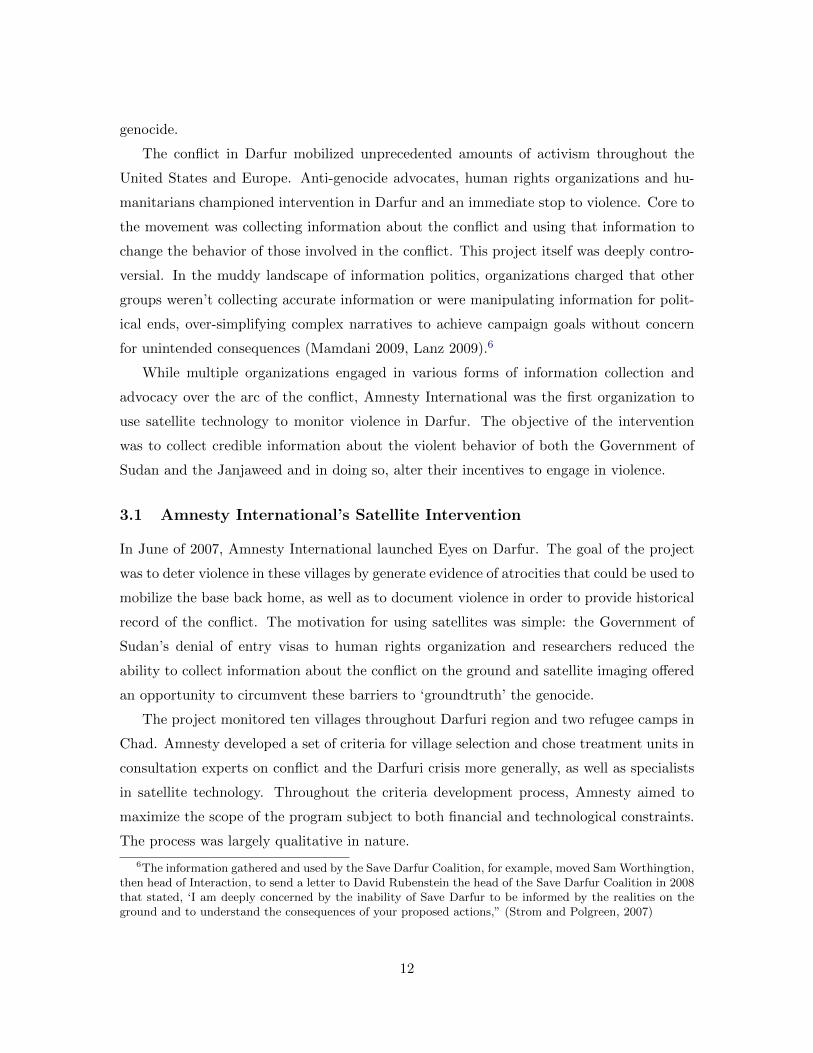
of 10 kilometers in length and robustness tests are provided throughout. Figure 4 visualizes
the panel construction process for violence in a given year. See appendix C for a detailed
description of grid construction.
20
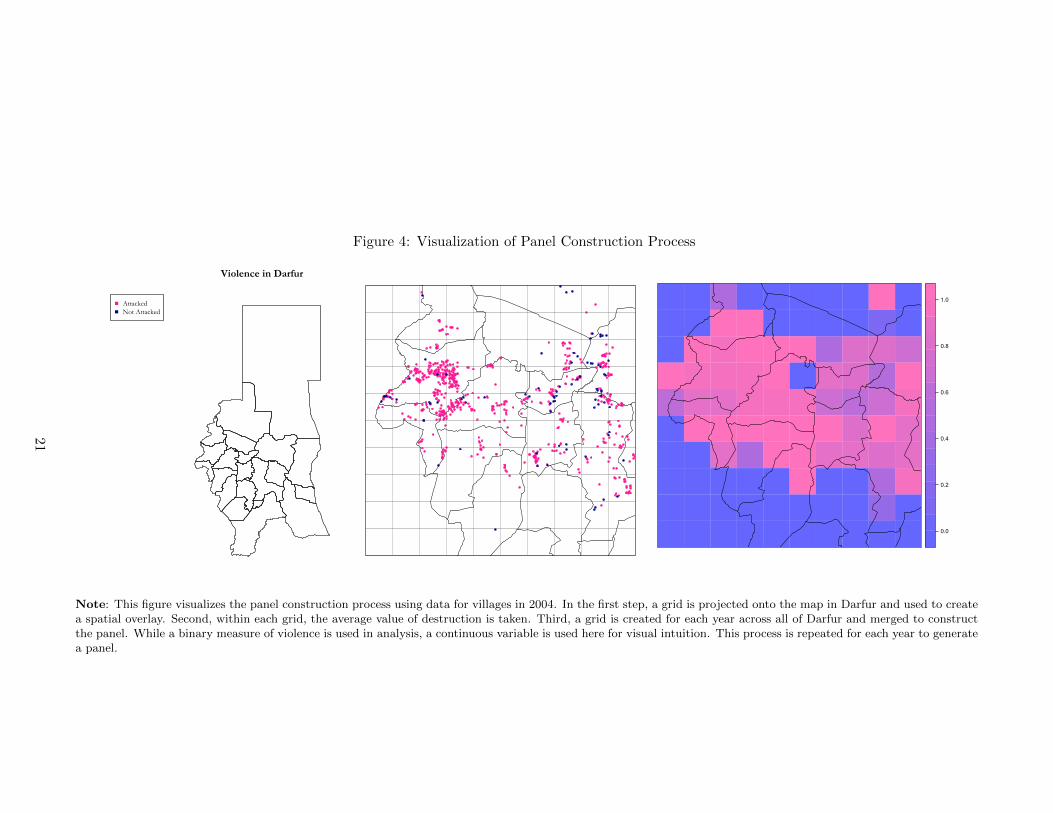
Figure 4: Visualization of Panel Construction Process
Violence in Darfur
AttackedNot Attacked
0.0
0.2
0.4
0.6
0.8
1.0
Note: This figure visualizes the panel construction process using data for villages in 2004. In the first step, a grid is projected onto the map in Darfur and used to createa spatial overlay. Second, within each grid, the average value of destruction is taken. Third, a grid is created for each year across all of Darfur and merged to constructthe panel. While a binary measure of violence is used in analysis, a continuous variable is used here for visual intuition. This process is repeated for each year to generatea panel.
21

4.3 Leveraging Amnesty’s Selection Criteria & Identifying Controls
To determine which villages were monitored, Amnesty International USA used three criteria:
1) proximity to the frontline of conflict in 2007, 2) proximity to natural resources and
3) geographic location.16 To identify appropriate control villages from the possible 9,183
possible counterfacuals, I leverage these criteria — as well as an additional set of variables
that include pre-treatment levels of violence, among others — to implement a principled
selection process that uses matching as a pre-processing strategy.17
I match on two sets of characteristics: variables that correspond to the selection criterion
Amnesty International used to select participating villages and variables that Amnesty did
not explicitly consider. The three additional variables include: 1) pre-treatment levels
of violence within villages, 2) village distance from an airport, and 3) village distance
from the closest road. Matching off the first set of characteristics provides the ability to
approximate the selection process that Amnesty International employed. I include the
additional variables for three reasons. First, including these additional measures improve
precision in estimation and as Stuart (2010) notes, increasing the number of variables in
matching algorithms rarely has a negative impact on the process. Second, these variables
may have implicitly driven selection even if they were not explicitly noted. For example, road
access may have restricted the subset of villages considered for selection. Third and more
specifically, leveraging pre-treatment levels of violence accounts for long-term differences
in the trajectories of villages shaped by violence and is an identifying assumption in the
difference-in-difference estimator used in analysis.
Following Ho et al. (2007), I implement a nearest neighbor matching algorithm. Given
the abundance of potential controls, I implement this algorithm over three different treatment-
to-control ratios: 1-100, 1-125, and 1-150. I present analysis for these different matching
sets. The benefit to this approach is that it provides the ability to analyze robustness
to various matching strategies without ex-ante adjudicating between matched data-sets on
information-reducing metrics. Care in analysis is crucial however given that increasing the
n in estimation increases the probability of generating statistically significant results; as
such, I focus on the magnitude of effect size. Table 1 enumerates the variables used for
matching and identifies whether they were a key Amnesty Criteria or not; Appendix A
sources and visualizes this data.
16Rather than characterize all villages in Darfur according to these criteria, Amnesty International USAused this as broader, guiding principles
17For a review of matching in political science, see (Sekhon, 2009).
22
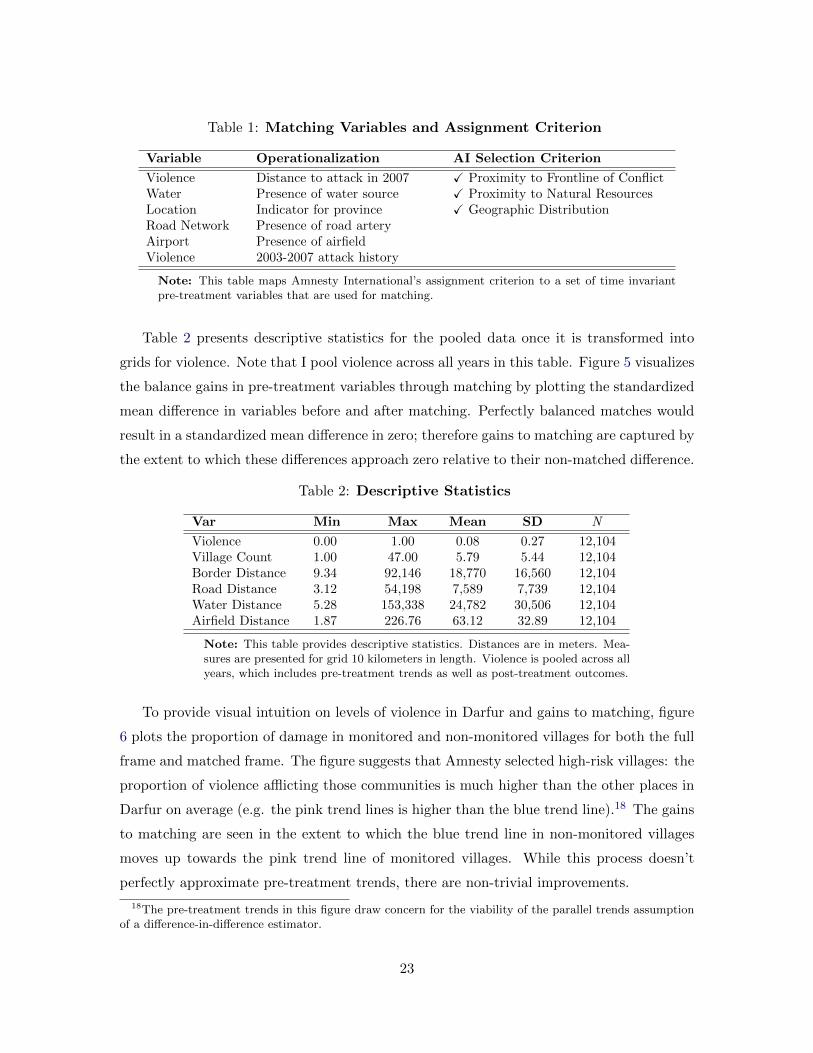
Table 1: Matching Variables and Assignment Criterion
Variable Operationalization AI Selection Criterion
Violence Distance to attack in 2007 X Proximity to Frontline of ConflictWater Presence of water source X Proximity to Natural ResourcesLocation Indicator for province X Geographic DistributionRoad Network Presence of road arteryAirport Presence of airfieldViolence 2003-2007 attack history
Note: This table maps Amnesty International’s assignment criterion to a set of time invariantpre-treatment variables that are used for matching.
Table 2 presents descriptive statistics for the pooled data once it is transformed into
grids for violence. Note that I pool violence across all years in this table. Figure 5 visualizes
the balance gains in pre-treatment variables through matching by plotting the standardized
mean difference in variables before and after matching. Perfectly balanced matches would
result in a standardized mean difference in zero; therefore gains to matching are captured by
the extent to which these differences approach zero relative to their non-matched difference.
Table 2: Descriptive Statistics
Var Min Max Mean SD N
Violence 0.00 1.00 0.08 0.27 12,104Village Count 1.00 47.00 5.79 5.44 12,104Border Distance 9.34 92,146 18,770 16,560 12,104Road Distance 3.12 54,198 7,589 7,739 12,104Water Distance 5.28 153,338 24,782 30,506 12,104Airfield Distance 1.87 226.76 63.12 32.89 12,104
Note: This table provides descriptive statistics. Distances are in meters. Mea-sures are presented for grid 10 kilometers in length. Violence is pooled across allyears, which includes pre-treatment trends as well as post-treatment outcomes.
To provide visual intuition on levels of violence in Darfur and gains to matching, figure
6 plots the proportion of damage in monitored and non-monitored villages for both the full
frame and matched frame. The figure suggests that Amnesty selected high-risk villages: the
proportion of violence afflicting those communities is much higher than the other places in
Darfur on average (e.g. the pink trend lines is higher than the blue trend line).18 The gains
to matching are seen in the extent to which the blue trend line in non-monitored villages
moves up towards the pink trend line of monitored villages. While this process doesn’t
perfectly approximate pre-treatment trends, there are non-trivial improvements.
18The pre-treatment trends in this figure draw concern for the viability of the parallel trends assumptionof a difference-in-difference estimator.
23
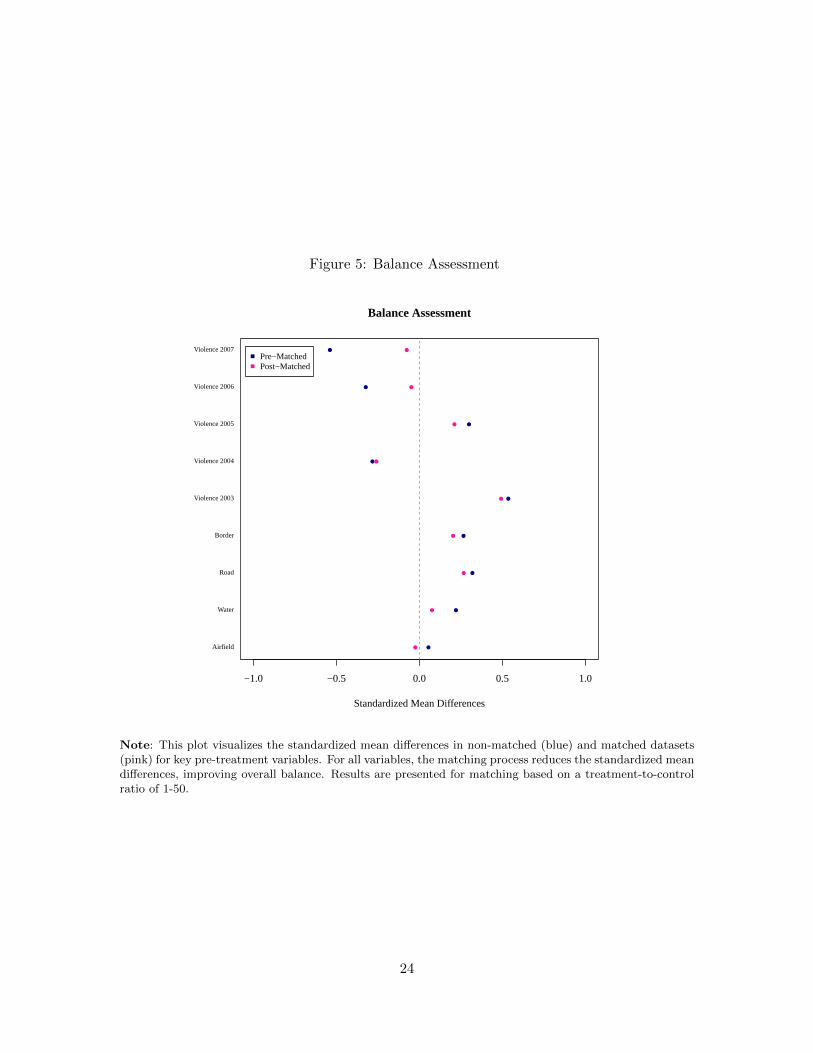
Figure 5: Balance Assessment
●
●
●
●
●
●
●
●
●
−1.0 −0.5 0.0 0.5 1.0
Balance Assessment
Standardized Mean Differences
●
●
●
●
●
●
●
●
●
Pre−MatchedPost−Matched
Airfield
Water
Road
Border
Violence 2003
Violence 2004
Violence 2005
Violence 2006
Violence 2007
Note: This plot visualizes the standardized mean differences in non-matched (blue) and matched datasets(pink) for key pre-treatment variables. For all variables, the matching process reduces the standardized meandifferences, improving overall balance. Results are presented for matching based on a treatment-to-controlratio of 1-50.
24
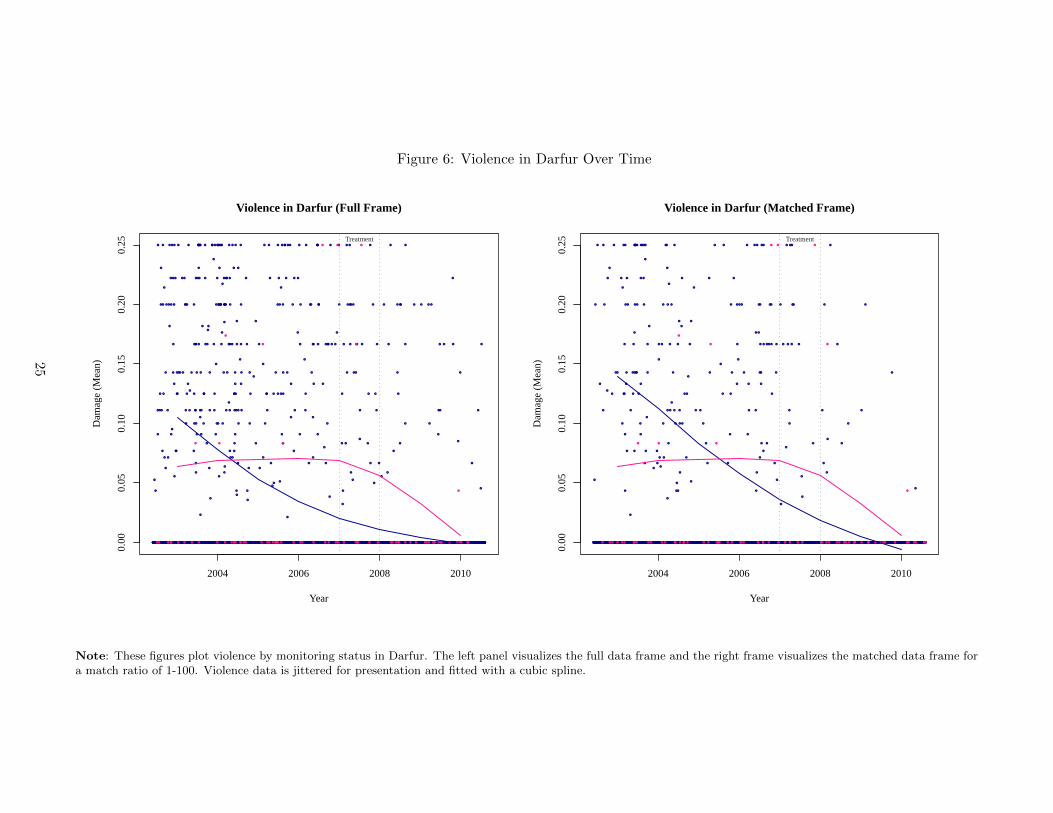
Figure 6: Violence in Darfur Over Time
●● ●● ● ●●●● ●●● ●●● ●●
●
●●●● ●● ● ●
●
● ●● ●● ● ●● ●● ●●● ●● ●
●
● ● ●
●
●● ●●●● ● ● ●● ●● ●● ● ●● ●●● ●●●● ● ●●●● ●●●● ●●
●
● ●● ● ●● ●●●● ● ●● ●● ●● ●● ●●●● ● ●● ●● ●●●● ●●●● ● ●●●●
●
●●●● ● ● ●●●● ●●● ●● ● ●●
●
●
● ●● ●● ● ●●● ●● ●● ● ●
●
●
●
●
●
●
● ●● ● ●● ●● ●●
●
●
●
●● ●●● ●●● ●● ● ●● ●
●
●
●● ●● ●● ● ●●● ● ●●●● ● ●●●
●
●● ●● ●● ●● ●●● ●●●● ● ●●
●
●● ●● ● ●●●
●
● ● ●● ●● ● ●● ● ●● ●●●●
●
● ●●● ● ●●
●
●
●
●● ●●●● ●● ● ●● ●● ●● ●● ●●●● ●● ●●
●
●● ●● ●● ●●● ● ●● ●●● ● ●● ● ●●● ●●●●●● ● ●● ●●
●
●
●●● ● ● ●● ● ● ● ●● ●● ●●
●
●●● ●● ●●● ●●●
●
●●
●
● ● ●
●
● ●● ● ●●● ● ● ●● ●● ●●● ●●
●
●
●
●●● ●● ●●●
●
●●
●
●●●●●● ●● ●●● ●● ●●●●● ●
●
●● ● ●● ●● ● ●● ● ● ●● ●● ●●●●● ●●● ●●●● ●●●● ●● ●
●
● ●● ● ●
●
●
●
● ●●
●
●●●●● ●● ●● ●● ●●●● ● ●●●●● ●●● ●
●
●
● ● ●● ●●● ● ●● ●●●●●●● ●● ●●● ●●●
●
●
●●
●●● ●● ● ●● ● ●● ● ● ●● ●●● ●● ●● ●●●● ● ● ● ●●
●●
●
●
● ●● ●●● ●● ●● ●● ●● ●● ●● ●●● ● ●●
●
● ●
● ●● ●
●
● ● ●● ● ●●● ● ●● ●● ● ●● ●● ●● ●
●
●
●
●
●●
●
●
●
● ● ●● ●●●● ● ●
●
●●● ●●●● ●● ●● ● ●●●●● ●● ●●● ●
●
●
●
●
●
●
●●
●
●
●●● ● ●● ●● ●●● ●● ●
●
● ● ●●
●
●
●
●● ● ●● ● ● ●●●●● ● ●● ●●
●
●● ● ●●
●
● ●●●● ●● ●●●● ●● ●●● ● ●● ●● ● ●● ●● ●● ●●●●●
●
●●● ● ●●●●● ●● ●●● ●● ● ●● ●● ●● ●●● ●●● ●●● ●● ●● ●● ●● ●●● ●●● ●●● ●● ●● ●● ●● ● ●●● ● ● ●●● ●● ●● ●●● ● ●● ● ● ●● ● ● ● ● ● ●●● ●● ● ●● ●●● ● ●● ●●
●
● ●● ●● ●● ●● ● ●●●● ●●● ●● ●●●● ●●●●● ●●●● ●●● ●● ●
●
● ●●●● ●● ● ●●●● ● ●● ●● ● ● ●● ● ●●● ●● ●●● ● ● ● ●●● ●● ●●● ● ●●●● ●● ●● ●●● ● ●● ● ●●● ●●●● ● ●●● ●●
●
● ●● ●●● ●● ●● ●●● ●● ●● ●● ● ●●● ● ●● ● ●●●● ● ● ● ●●● ●●● ●●● ●● ● ●● ●● ● ●● ●● ●● ●●● ●●● ● ●● ●●●● ●● ● ●●●● ●● ●●● ●●● ●● ●● ● ●●● ●● ●●● ● ●●● ●● ● ● ● ●● ● ●●●● ● ●●● ●●● ●●● ●●● ●●●● ●● ●●● ●●● ● ●●● ●●● ● ● ●●● ●●● ● ●● ●● ●● ●● ●● ●● ●● ●●●● ● ● ●● ●●● ● ●● ● ●● ● ●● ●● ●●●● ● ● ●●● ●●● ●●●● ● ● ●●●● ●● ●●●●● ● ● ●● ●● ●●● ●● ● ●● ●●● ● ● ●●●● ●● ● ● ●●● ● ●● ●● ●● ●●● ● ● ● ●● ●● ●● ●● ● ●●● ●● ●● ●● ● ●● ●● ●● ● ●●● ●● ●● ●●●●● ●● ● ●● ● ●●● ●● ●●● ●●● ● ●● ●●●● ● ● ●● ●● ●● ● ●● ●● ●● ●● ●●●● ●● ●● ●● ●● ● ●● ●●● ●●●● ●● ●●●● ●● ●●● ● ●●● ● ●●
●
● ●●●●● ● ●● ●●● ●●
●
●● ●● ●● ● ● ●● ●● ●●● ●●● ● ●
●
●● ●● ●●● ● ● ●●● ●●●●● ●● ● ●● ● ●● ●● ● ●● ●●● ●●
●
● ●●● ●●● ● ● ●●● ●● ●● ● ●● ●● ● ●● ●●●● ●● ● ●● ●●● ● ● ●● ●● ●●●●
●
●● ●● ●●●● ● ●●● ●●● ● ●
●
● ●●● ●●● ●● ●
●
●
●● ● ●●● ●● ● ●●● ●●●● ● ● ●●● ●●●●
●
● ● ●● ●● ●●● ●● ●
●
●● ●●● ●● ●● ●
●
●● ● ● ●● ●● ●●
●
● ● ● ●● ●●●
●
● ●● ● ● ● ● ●●● ●●● ●●● ●●● ● ● ●● ●● ● ● ●● ●
●
● ●●● ●●● ● ●● ● ●● ●●●● ●●● ● ● ● ●●● ●
●
● ●● ●● ●● ●●● ● ●● ● ●●
●
●
●
●● ●● ●● ●● ●●● ●● ● ●●● ●● ●●● ●●● ●●● ● ● ●●
●
●●
●
●
●
●● ● ●●●● ●● ● ●●● ● ●
●
● ●● ● ●● ●●● ●● ● ●
●
●
● ●●
●
●●● ●●● ●● ●●● ●
●
●●● ● ● ●●●●
●
●● ●● ●
●
●●
●
● ● ●●● ●● ● ●●●● ● ●● ●
●
●
●
●
●
●●● ●●● ●● ● ● ●●
●
● ●●
●
●●●● ●●● ●
●
●
●
●●● ●●● ● ● ●
●
●●● ● ●●● ●●● ●● ●
●
●● ●● ● ●●
●
●
●
●● ●●●●●●● ●● ● ●● ●●●
●
●● ●
●
●
●● ● ●●● ● ●● ●● ● ●● ● ●●● ●●
●
●
●
● ●● ●● ● ●●● ●● ● ●●● ● ● ●●
●
●●● ●●● ● ●●● ●●●●
●
●●● ●
●
●●
●
●
●● ●●
●
●
●●●● ● ●
●
● ●● ●● ● ●●● ●●
●
●● ●
●
●
●● ● ●
●
●●● ●
●
●
● ● ●● ●●●●●● ●●
●
●●● ●
●
●
●
●●
●
● ● ●●
●
●
●
●●● ●●● ● ● ●●● ●●● ●● ●● ●●●● ●●● ●●
●
●
●
● ●● ●●● ● ●● ● ●●●● ●●
●
●
●● ●
● ●
●
● ●
●
●●● ●● ●● ● ● ●●
●
●
●● ●
●
●● ●●● ●
●
● ●● ●● ●● ●
●
●
●●
●
●
● ●
●
●
●
●
●
●● ● ●●● ● ●
●
● ●● ●● ● ●● ● ●
●
●
●
●
●● ● ●●●● ●● ●● ● ●●● ● ●● ●●● ●
●
●● ●● ●● ●●● ●●● ● ●● ●● ● ● ● ●●● ● ●● ●● ● ●● ● ●●
●
●
●● ●●● ●● ●●● ●●● ●● ●●●● ●●●
●
●● ●● ●● ● ●●●●● ● ● ●●●●●● ●● ● ●● ●● ● ●● ●●● ●●● ●● ●●●● ● ●●
●
●
●●●
●
● ●● ●●●●● ●● ●● ● ●● ●● ●●● ●● ●● ●● ●
●●
●● ●● ● ●
●
●● ●● ● ●● ● ● ● ●● ●● ●● ●● ●● ●● ● ●● ●● ●●● ●●
●
●
●
●
●●● ●● ●● ●● ●●● ●●● ●● ●● ●●●●● ●●●● ●●●● ●● ●● ●●●●● ● ●● ●●●● ●●● ●● ●● ●●● ●● ●● ● ●● ●● ●● ●● ● ● ●● ●●● ● ● ●●● ●● ●●● ●
●
●●● ●●●● ● ●● ●● ●●● ● ●●● ● ●
●
●
●●● ●● ●● ●●● ● ● ●●●● ●● ●● ●●● ● ●● ●●● ●●
●
●
● ●●● ● ●● ● ●● ●● ●● ● ●● ● ● ●●● ●● ● ●●● ●● ●● ●●● ●● ●●● ●● ●● ●● ●● ●●● ● ●● ●●● ●● ● ●●● ●● ●●● ●●● ● ●●●● ●● ● ●●●● ●● ● ● ●● ●● ●● ● ●● ●● ● ● ●● ● ●●● ●●● ● ●● ● ●● ●●● ●● ●● ●●●● ●● ● ●● ●●● ●●● ●●● ●● ● ●●●● ●●●● ●● ●● ●●● ● ●● ● ●● ●● ●● ● ●● ● ●●●● ● ● ●●● ● ●● ● ●●● ●●● ●● ●● ●●● ●●● ● ●●● ●● ● ● ●●● ● ●●●● ●●● ● ●● ●● ● ● ●● ●● ● ● ●●● ●●● ● ●●● ●●●● ● ●● ●●●●● ● ●●● ●●● ●● ●●● ● ●● ●● ●●● ●● ●●● ●●●
●
●● ●● ●● ●● ●●● ●● ●● ● ●
●
● ● ●●● ● ● ●● ●● ●●●● ●● ● ●●●● ● ●●●●● ● ●● ●● ●● ●●●●●
●
●● ●●●● ● ● ●● ● ●● ● ● ●● ●● ●●● ●● ●● ●●●● ● ●● ● ●● ●●● ● ●●● ●● ● ●●● ● ●●● ●●●● ●● ●●●● ● ●● ●●● ●● ●● ● ●● ●●●●
●
● ●● ●●● ● ● ● ● ●●● ●●● ●●● ●●● ●●● ●●● ● ●
●
●●● ● ●● ●● ●● ●●●● ●●● ● ●●●●● ●●● ● ●● ●● ●●●● ●● ● ●● ●●● ●● ● ●●●● ●● ●● ● ●●●● ● ●●●● ●
●
● ● ●● ●● ● ●●●● ● ●● ●● ●●●●● ●● ●● ●●● ●● ●● ● ●
●
●●● ● ●● ● ●● ● ● ●● ●● ● ●● ●● ●● ●● ●●● ●● ●●● ●
●
●● ●● ●● ●●●●● ●● ●●● ●●●● ●● ●● ● ●●●● ● ●●● ●● ● ●●● ● ●● ●● ●●●●● ●● ● ●●● ● ●●●● ● ●●● ●●● ● ●● ● ●● ●● ●
●
● ●●●● ●●● ● ●● ● ● ●●● ●● ●● ●●● ● ●●●● ● ● ●●●●
●
●
●● ●● ●●● ●● ●● ●●
●
●
● ● ●●●● ●●● ●● ● ●● ● ● ●● ● ●● ●● ●● ●●
●
●
●●● ●● ●● ●● ● ●●● ●● ●
●
●● ●●●● ● ●●● ●●● ●●● ●● ●●● ● ●● ●● ● ●● ●●●● ●●●● ● ●● ● ●●● ●● ●●● ● ●●● ●●● ●●
●
● ●●
●
●● ●●● ●●● ●●● ●● ● ●● ●● ● ● ●●●● ●●●● ● ●● ● ● ●●● ● ●●● ●●● ●●● ● ● ●●●●● ●● ●●● ●● ●● ●●● ●● ● ●●● ● ● ● ●● ● ●● ●● ●● ● ●●●● ●
●
● ●● ●● ●● ●● ●●● ● ●●● ● ●●● ● ●● ●● ●● ●●● ●● ●● ●●●● ● ● ●● ●
●
● ● ● ●● ●●●●● ● ●●●● ●● ●● ●● ● ●●●● ● ●
●
● ●● ●●● ● ●● ●● ●●● ●●●● ●● ●● ●●● ●● ●● ● ●●● ● ●● ●●● ●● ●●● ● ●● ●● ●● ● ●● ● ●● ● ●●●● ●●● ●● ● ●●●● ●● ●● ●●●● ●● ●
●
● ●
●
●●● ● ●●●● ●●● ●● ●●● ● ● ●● ●● ●● ●● ● ●
●
●
●● ●●●● ● ●● ●●● ●●● ●● ● ●● ●●●● ● ●● ●●
●
●
●● ●● ●●●● ●● ●● ● ●● ●● ●●● ●● ●●●● ●● ●●
●
● ● ●●●●● ● ●● ● ●●● ●●●● ●●● ●●● ●●● ●● ● ●● ●●●●● ●●
●
●
● ●●
●
●
●
●
●
●●● ●●● ● ●● ●● ●●●● ●● ●● ●● ●●● ● ●●● ●● ●● ●
●
●
●
●● ●●●● ●●● ●● ●
●
● ●● ●●● ●●● ●● ●● ●● ●●● ● ●● ●●●
●
●●●
●
● ●● ●●●●● ●●● ● ●●● ●● ● ●●●● ●● ●● ● ●●● ● ●● ●● ●● ●●● ● ●● ●● ● ●● ●● ● ●● ●● ● ● ●●● ●● ● ●● ● ●● ● ●●● ● ●●● ●● ●● ●●● ●●●● ●● ●● ●
●
● ●● ● ●● ●● ●●●● ●●● ● ● ●●● ●
●
●●
●
●● ● ● ● ●● ●● ●● ●● ●●● ●●● ● ●●●● ●● ●● ● ●●
●
●●●● ●●●● ●●● ●●●●● ●●●●● ●●●● ●● ●●● ●●● ● ●● ● ●● ● ●●●●● ●● ● ●● ●● ●●● ● ● ● ● ●●●● ● ● ●●● ●●● ● ●●●● ●● ● ●●●● ● ●● ● ●● ● ●●● ●● ●● ●● ●● ●●● ●● ●●● ●● ● ●●●● ●●● ● ●● ●● ●●● ●●● ● ● ●● ●●●●● ●● ● ●● ●● ●●● ●● ●●● ●● ●● ●● ●●●● ●● ●● ●● ● ● ●● ●● ●● ●●● ● ●● ●●● ●●● ●● ● ●● ●● ● ●●● ● ●●●● ●●● ●● ●● ●● ●●● ● ●● ● ●●● ●● ●● ●● ● ●●●● ● ●●● ●●●● ● ●● ●● ● ● ●●● ●●● ●● ●● ●● ●● ●●●● ● ●●● ● ● ●● ●●●
●
● ●●●●● ●● ●● ●
● ●
●● ●●
●
● ● ●●● ●●● ●● ●● ●●● ●● ●● ●● ● ● ●●●● ●
●
●● ●●● ●●●●● ●● ● ●●●●●● ●●● ● ●●●●● ●● ● ●● ●
●
●● ●●● ●● ●●● ●● ● ●● ● ●● ●●●● ●
●
● ●●●●● ● ●● ● ●●●● ●● ●
●
●● ●●●● ● ●●●● ●●● ● ●● ●● ●●● ●● ●●●
●
●●●● ●
●
●
● ●●●
●
●●● ● ●● ● ●● ●● ●●● ●●●● ● ●● ●●● ●●●
●
●
●
●● ●●● ● ●●● ●● ●● ●●●● ●●● ●●●● ●●● ● ●●● ●● ●● ●● ●
●
●● ●● ● ●● ●●●●● ●●● ● ●● ● ●● ●● ● ●● ●● ● ●●●
●
●● ● ● ●● ●● ●● ●● ●●● ● ●●●
●
●● ●● ● ●●● ●●● ●● ●● ● ●●●● ●●●● ●● ●● ● ●● ● ●● ●● ● ● ●●● ●● ● ●● ●●●● ● ●●
●
●●●●
●
●●●● ●● ●●● ●● ●●● ●● ●● ●● ●●● ●●● ●●● ●●● ●● ●●●● ●● ● ●●●●●●● ●● ● ●●● ●●●●● ● ●●●● ●●●● ●● ● ●● ●●● ● ●●● ● ●●●● ●● ● ● ●●● ●● ●● ● ●●●●●● ●● ●● ●●● ●● ●●● ●●● ●● ● ●● ●● ●● ●● ●●
●
●● ● ●● ●● ●● ●● ● ●● ● ●
●
●●●●● ●
●
●●●●● ●● ● ●●● ●●● ●●● ●● ●●● ●● ● ●● ●● ● ●● ●● ●● ●● ● ●●● ●● ●● ● ● ●●●● ●●● ●● ●●●● ●● ● ●●● ●● ●● ● ●● ● ●● ● ● ●● ●● ●●● ●● ● ●●● ●●● ●● ● ●●●● ● ● ●● ●● ●● ●●●● ● ●●●● ●●●●● ●●● ● ●● ●● ● ●●● ●●●● ● ●● ●
●
●
●
● ●●● ●● ● ●● ●● ● ●●● ●● ●● ●●● ●●●●●●● ●
●
● ● ●● ● ● ●●● ●●●● ● ●● ●●● ●● ●●● ●● ●● ●
●
●● ●●●●● ●●● ●●● ●● ●● ●●● ● ●●●
●
●● ●● ●●
●
● ● ●
●
● ●● ● ●●● ●●● ●●●● ●●● ● ●● ●●● ● ● ●
●
● ●● ● ●●●● ●● ●● ● ●● ●● ●●● ●●●●● ●● ●
●
●
●● ●● ●●● ● ●●● ●● ●● ● ● ●●● ●● ●●● ● ●●
●
●
●
●
●
●● ●● ● ●●●
●
● ●● ●● ● ●● ●● ●● ●●● ●● ●
●
●
●
●
●● ●● ●● ●●● ●●● ●●● ●●● ● ●● ● ●● ● ●●●
●
●
●● ● ●●●● ●● ●● ●●● ● ●● ●●● ● ●● ●● ● ●● ●●● ● ●
●
● ● ●● ●●● ●● ● ● ●●●●● ● ● ●●● ●● ●●●● ● ●●
●
● ●●● ●●●
●
●●●● ●●●● ●● ●● ● ●●●● ● ●●●●● ● ● ●●● ●●
●
●
● ●● ●● ●● ●●●●● ●● ●● ●● ●●● ● ●●● ●● ●●● ●● ●● ●● ● ●●● ●● ●● ●●● ● ●●● ●● ●●● ● ●● ● ●●● ●●● ●● ●●●● ●● ● ●●● ●●●● ●● ● ●● ● ● ●● ●●● ●● ●●●● ●● ●● ● ●● ● ●● ● ●●●
●
● ●●● ● ●●● ●● ●●●● ●●●●● ●●●● ●●● ● ●●● ●●● ●●● ●●● ● ●● ● ●● ●● ●●● ● ● ●● ●● ●●●● ● ●●●● ●●●● ●●●●● ● ●● ●●●● ●●● ●●●● ● ●●● ● ●● ●● ●● ● ●●● ●●● ●●● ●● ● ●● ● ●● ●● ●●● ●● ● ●● ●● ● ●●● ●● ● ●● ● ●● ●●● ●● ●● ●● ●●● ● ● ● ●● ● ● ●● ●●●● ●●● ●●●● ●● ●● ●●● ● ●● ●● ●● ●● ●● ● ●●● ● ●●●●● ● ●●● ●● ●●● ● ●● ● ●● ● ●● ●●● ● ●●●● ● ●● ●● ● ●● ●● ●●●● ●● ●●● ●● ● ● ● ●● ● ● ● ● ●●● ●●● ●● ● ● ●● ●● ● ●● ●● ●● ●●●● ●●● ●●● ●●● ● ● ●●● ●●● ●● ●● ●●●●● ●● ●● ● ●● ● ●● ● ●● ●● ●●● ●●●● ● ●● ● ●●● ● ●● ● ●●●● ●● ● ●● ●●● ●● ● ●● ●● ●● ●●●● ●● ● ●● ●●● ● ●●● ●●●● ●●●● ●●● ● ●● ●● ●● ● ●●● ●●● ● ●● ●● ●● ●● ●● ●● ● ●● ● ● ●● ●●● ● ● ●
●
●●●● ●● ● ●●● ● ●●● ●●
●
●●●● ● ● ●●● ●●
●
●
●● ●● ●● ●● ●● ●● ● ●● ●●● ● ● ●● ●● ● ●●● ●●● ●●● ●●● ●● ● ●● ● ●●●
●
● ●● ●● ●●● ●● ●●● ●●●● ● ●● ●● ●●● ●●● ● ●●● ●●●● ●●
●
●●● ● ●●
●
●● ● ●●●● ● ●● ●● ●●● ●● ●● ●● ●● ●● ●●
●
●
●
● ●● ●● ●● ● ●●● ● ●● ●●● ●●●● ●●● ●● ● ●● ●●
●
●
● ●●● ●●● ● ●●● ● ●● ●● ●● ●● ● ●● ● ● ●●● ● ● ● ● ●●●●● ● ●● ● ●●● ●● ●●● ● ● ●●●●● ●●● ●● ●●
●
●●● ●● ● ●●● ● ●● ● ●●● ●● ●● ●● ● ●●●● ●● ●● ●●●●●● ●● ● ●● ● ●●● ●● ● ●● ●● ●●●● ●● ● ●●● ● ●●●●●●● ● ● ●● ● ● ●● ●●●●
●
● ●● ● ●●● ●● ●● ●●●● ●●● ●● ●
●
● ●● ●●● ● ●● ●
●
● ●●● ●● ● ●
●
●● ●●●●● ●●● ●● ●●● ●●● ● ●● ●● ● ●●●● ●● ●●● ●●● ● ●●● ●● ●●● ● ●● ● ● ●●
●
●● ●●● ●● ●●● ●●● ●● ●●●●● ●●● ● ●● ● ●●● ● ●● ●●● ●● ●●● ●●● ● ●● ●●● ● ●● ●● ● ●● ●● ● ●●● ●● ●● ●● ●●● ● ● ●● ●● ●● ●
●
● ●● ●● ●● ●●●● ●● ●●● ● ●●● ● ●● ●●●● ● ●●●●● ● ●●● ●●●● ●● ● ● ●● ●● ●● ●● ●● ●● ●●●●● ●●● ●●● ●● ●● ●● ● ●●● ●● ● ●●● ● ●●● ●● ●
●
●
● ●● ●● ●● ●● ● ●● ●● ●●●● ●● ●● ●● ● ●●●● ●● ●● ● ●● ●●● ●● ●●● ● ●● ●● ●●● ●●● ● ● ●● ●● ● ●● ●● ●●● ● ●●● ● ●● ●●● ●● ●●● ●● ●●● ● ●● ●● ● ● ●●● ●● ●● ●● ●● ●● ● ●●● ●● ●● ● ●●●● ●● ● ● ●● ●● ● ●● ●●●● ●
●
●● ●●●● ● ●● ●● ● ●● ●● ●●● ●● ●● ● ●● ●●● ●
●
● ● ●●●● ●● ● ● ●●● ●●● ●●● ● ● ● ● ●● ●● ●●●●
●
●● ●● ●●● ●● ●●●●● ●● ●● ● ●●● ● ● ●● ●● ●● ●●● ●●
●
●
●
●● ● ●●●● ● ●● ●● ● ●●●● ●●●● ●●●● ●● ●● ●●
●
● ● ●● ● ●● ●●● ● ●● ●● ● ● ●●● ● ●● ●●● ●● ● ●●●● ● ●
●
●● ●● ●●
●
●
●● ● ● ●● ●●● ● ●●● ● ●● ●●● ●●
●
● ●●● ●●●● ●
●
●● ●●● ● ●● ●● ● ● ●●●● ● ●●●● ●●● ●●● ●● ● ●● ●●●● ● ●●● ● ●● ● ●●●● ●●● ●●● ●●● ●●●
●
●● ● ●●● ●● ● ●●● ●●● ●● ● ●● ● ●●●
●
● ● ●●● ●● ● ●●●● ●● ●●● ●● ●●●● ● ●●● ●●●● ●● ●
●
● ● ●● ●●●●●●●●● ●●●● ●●● ●● ●● ●●
●
● ● ●● ●●● ●●● ●● ●●● ●●● ●● ●● ●● ●●● ● ●● ●● ●● ●●●● ●●● ●●● ● ●●●● ● ● ●● ●● ●●● ● ●●● ●● ●● ● ●●●● ●● ● ●●● ●● ●
●
●●
●
● ●● ●● ●●● ●● ●● ● ●●● ●● ●● ● ●● ●● ●● ●● ●
●
● ●●●● ●● ●●●● ● ●● ●● ●●● ●●● ● ●● ●●● ●● ● ●● ●● ●●● ●● ● ●● ● ●● ●● ●● ●●● ●●● ●●● ●●●●● ● ● ●● ●●●● ●● ●● ●●● ●●● ●● ●● ● ●● ●●● ●● ●● ● ●● ●● ●● ●● ●●● ●●● ●● ●● ●●● ● ●●●● ●●● ●● ●● ●● ● ●●● ●● ●● ● ●●● ● ●● ● ●●● ●● ●●●● ● ●● ●●●● ●● ●●●● ●●● ● ●● ●●●● ● ●● ● ●● ●● ●●● ●● ● ● ● ●● ● ● ●● ●●● ●●● ●● ● ●●●● ● ●● ●● ●● ● ●●●●●●● ● ●● ●● ●● ● ●● ● ● ●●●
●
● ●● ●●● ●● ●● ●● ● ●● ●● ●●● ● ●●●● ● ● ●
●
●
● ●●● ●● ●● ●● ●● ●●● ● ●●●● ●● ●●● ●● ● ●● ● ●● ● ●●● ● ●● ● ●● ● ●
●
●● ●● ●● ● ●● ●●
●
● ●● ● ●● ●●● ●● ●● ●● ●● ●● ●● ●● ●● ●●● ● ●● ●●● ● ●●● ●●● ● ●● ● ●●
●
●● ●●●● ●●● ●●● ●● ●● ●● ●● ●●● ●● ● ●● ●●
●
● ●● ●● ●●● ●●● ● ●●● ●● ●●●●● ●●● ●● ●●●●
●
●
●●●● ●●● ●●● ●●●● ● ●●● ●●●●● ●● ●●● ● ●● ●● ● ●●●● ● ●●●● ●● ● ●● ● ●● ●● ●● ●● ●●● ●● ●● ● ●● ●●● ●●● ●● ●● ●● ● ●● ●● ● ●● ● ●● ●●● ● ●● ●●
●
●● ●● ●● ● ● ●● ●● ●● ● ●●●● ●●● ●● ● ●●●●● ● ● ●● ● ●● ●●● ●● ●●● ●● ●●● ●●● ●● ● ●● ● ●● ● ●●● ●● ●● ● ●● ●●● ●●●● ● ●● ●● ● ●●●● ●● ● ● ●●● ●● ● ●● ●● ●● ● ●● ● ● ●● ●●●● ● ●● ● ●●● ●●●● ● ● ●● ●● ●●● ●●●●●● ●● ●●● ● ●●● ●● ●●● ●●● ● ●●●●● ●● ●● ●●●● ● ● ● ●●● ● ● ●● ● ●● ●●● ●● ● ●●● ●● ● ●● ●● ●● ●● ●● ●● ● ●● ●● ●● ● ●●● ● ●● ● ●● ●●● ●●● ●● ●● ●●● ●● ● ●● ●● ●●●● ● ● ●●● ●●● ●●
●
● ● ●●● ●●● ●●● ●●● ● ●● ●● ●● ●● ●● ●●● ●●● ●● ● ●● ● ● ●●●●● ●● ●●● ● ●● ●● ●● ●● ● ●● ●●●● ● ● ●●● ● ● ●● ●●● ●● ●● ● ●● ●● ●●● ●●● ●● ● ● ●●● ●●●● ● ●●●● ● ● ●● ●● ● ●● ●● ● ●● ● ● ●●●● ●
●●
● ● ●● ●● ● ● ●●●● ●●●● ●● ● ●● ●● ●● ●● ● ● ●● ●●● ●● ● ● ●● ● ●●●● ●● ● ● ● ●●
●
●
●● ●● ●●● ●● ●● ●●● ●● ●● ● ●●
●
● ● ● ●●●●● ●● ●●● ●● ●●● ●● ● ●●● ●● ●● ●● ●●● ● ●●● ●● ●●●● ●●● ● ●● ●●●●● ●● ● ●●● ●● ● ●●●● ● ●● ●●● ●● ●●●● ●● ● ●● ●●●● ●● ● ●● ●● ● ●● ●●●● ●● ●● ●● ●● ● ●● ●●● ● ● ●● ●● ●●●● ●●● ● ● ●●●● ● ●● ● ●● ●●● ● ●● ● ● ●● ●● ●● ●●● ●● ● ●
●
● ●● ●● ●●●● ●● ●● ●●●● ● ●● ●● ●● ●●● ● ●● ●
●
●●●● ● ●●●●● ●● ●●●● ●●●● ●● ● ● ● ● ● ●● ● ● ● ●● ●●●●
●
● ● ●●● ●●● ●● ●● ●●● ●●● ●● ●●● ●●● ● ●● ●●● ●● ●● ●●● ●●● ●●●● ●
●
●
● ●● ●●● ●●●● ●●● ●● ●●●●● ●● ● ●●● ● ●●●
●
●● ●●● ● ●● ●●●● ● ● ●● ●●●● ●● ●●● ●●● ●● ● ●●●● ● ● ●●● ●
●
● ●●● ●● ●● ● ●●● ●● ●●● ● ●●
●
● ●● ●● ●● ●● ●●● ●● ●● ● ●● ● ●●●● ●● ● ●● ●●●● ●● ● ●● ● ●● ●● ●● ●●● ●●● ●● ●●
●
● ●● ● ● ●● ● ●●● ●● ● ●●● ●● ● ●● ●●● ●● ● ●● ●● ● ●●●●● ● ●● ●●● ●●● ● ●● ●● ●●●● ● ● ● ●● ●●● ●●●●● ●● ●● ●● ●●● ●●●● ●● ●●● ●● ●● ●● ●●●● ●● ●●● ●●●●●●● ●● ●●● ●● ●●● ●●● ●●●● ●● ●● ● ●●●● ●●● ●●●● ●● ● ● ●●● ●● ●● ●● ● ●● ●●●● ●● ● ●●●● ●● ● ● ●● ●● ● ●● ●● ●●● ● ●● ●● ●●● ● ●● ●●●●
●
●●● ●● ●●● ●●●● ●● ●●●● ●● ●●● ●● ●● ● ●●● ● ●●●● ● ●●●● ●●● ●● ●● ●● ●● ●● ●● ●● ●●●● ● ●● ●● ●● ● ●● ● ●● ●●● ● ●●● ● ● ● ●● ●●● ● ●● ● ●● ●●● ●● ●● ● ●● ●● ●●
●
● ●●●● ●●● ●● ●●● ● ● ●● ●● ●●● ●● ●● ●●● ●●● ● ●● ●● ●● ●● ●● ●● ● ● ●● ●● ●● ● ●●● ●● ●●● ●●●● ●●●● ●●● ●● ●● ●● ● ● ●●●● ● ●●● ● ●● ● ●●●● ● ●●● ● ●● ● ●●● ● ●●●● ● ●● ●●●● ●●● ●●● ● ●● ●● ●● ●●● ●● ●● ●● ●●●●● ●● ●●● ●●● ● ●●● ● ●● ●● ●● ● ●● ● ●● ●● ●●●● ●● ●●● ●● ● ● ●● ● ●● ● ●●● ● ● ●●● ● ●● ●● ● ●●● ●● ●● ●●● ●●● ●●●● ● ●● ●● ● ●● ●●● ●● ● ●● ● ●●● ● ● ●●● ●●● ● ●●● ●●● ●●●●● ●● ●● ●●● ● ●●●● ●●●● ● ● ●●●●● ●● ●● ●●● ●●● ● ●● ●● ●● ● ●● ●●●● ●● ● ● ●●●● ●●● ●● ● ●● ● ●●●●●●● ●● ●● ● ●●●● ● ● ●● ●● ● ●●●●● ●● ●●● ●● ●● ●● ●● ● ●●
●
●● ●● ● ● ●● ●● ●●● ● ●●●● ● ●●●●● ●● ●● ●● ●● ●● ●●● ● ●●● ●●●●● ● ●●●
●
●●● ●●● ●●● ●●● ● ●● ● ● ●● ●●● ● ●●● ●● ● ●●●● ● ●●●
●
●● ●●●● ●●● ● ●● ●●●● ●●●● ● ●●● ●● ●
●
●● ●● ●●● ● ●●●
●
●
● ● ●● ● ●●● ● ●● ● ●●● ●● ●●●●● ●●● ● ● ●
●
●● ●● ● ● ●● ● ● ●●● ●● ●● ● ●●●● ●● ●●●● ●● ●
●
●● ● ● ●●●● ●●● ●● ● ●●● ● ● ●● ●●● ●● ●● ●●●● ● ●●● ● ●●● ●● ●● ●●●● ●● ●●● ●● ● ● ●●● ●● ●●● ●● ●● ● ●●● ●● ●● ● ● ●●● ● ● ●● ●●● ●●● ● ●●● ● ●● ●●● ●●●●● ● ●● ●●● ●●● ●● ● ●● ● ●● ● ●● ●● ● ●● ● ●●● ●●●●●●● ●●●● ●● ●● ● ●● ●●●● ●● ●● ●● ●● ● ●●● ●●● ●● ● ●● ●●●● ●● ● ●●
●●
●
●●● ●●● ●● ●●● ●● ● ●●●● ●● ●●● ●● ● ● ●● ●●●● ● ● ●● ●●● ● ●●● ●● ●● ●●●● ● ● ●●● ●● ●●●● ● ●● ●●●● ● ●● ●●●● ● ●●● ●● ●●● ●●●●● ● ●● ● ● ●● ●● ● ●●● ●● ● ●●● ●●●● ●● ●● ● ●●●● ● ●● ●● ●● ● ●● ● ●●● ● ●●●●● ● ●●●● ●● ●●● ●●● ● ●●● ● ●●● ●●●●● ●● ●● ●● ●● ●● ● ●● ●● ●● ●● ●● ● ●●● ●● ●● ●● ●● ●● ●●● ●● ●●●● ● ●● ●● ●● ●●●● ●● ●● ●●● ● ● ●●●●● ● ●●● ● ●● ●●● ●● ●● ●●●● ●● ●●●● ●● ● ●● ●● ●● ●● ●● ●● ●● ●● ●●● ●● ●● ● ● ●●● ●●● ● ●● ●●● ●● ● ●●●● ●● ●● ●● ●● ●● ●●● ●● ●● ● ●●● ●● ●● ●● ●●● ● ● ●● ●● ●● ●● ● ●●● ●●● ●●● ● ●●● ●●● ● ●● ●●● ● ●● ●● ●● ●●●● ●● ●● ●●●● ●● ● ● ●● ●● ●●● ● ● ● ●● ● ●● ●● ●● ●●●● ●●●● ● ● ●●●● ●● ●● ● ●●● ●● ●●● ●● ● ●● ●●● ●●● ●● ●●● ●● ●●●● ●● ● ● ●● ●● ●●●● ●● ● ●●● ●● ●● ● ●● ●● ●●● ● ● ●●●● ●● ●● ●●● ●●●● ● ●●● ● ● ●● ●●● ●● ● ●● ● ● ● ●● ● ●● ●● ● ●● ●● ● ● ●● ● ●● ● ● ●● ●● ●●● ● ●● ●● ●● ●●● ●● ● ●● ● ●● ●● ●● ● ●●●● ●● ●● ●● ●●●●● ● ●●● ● ●●●● ● ●●●● ●●● ●● ● ●●●● ● ●●● ● ●●● ●●● ● ● ●●● ● ●● ● ●● ●● ●● ●●●● ●● ●● ●● ●●●
●
●● ●●● ●● ●● ●●●●● ●●● ●●● ●● ●● ●● ●● ● ●● ● ●● ●● ● ● ● ●● ● ● ●●● ●● ●●
●
●● ●● ● ●●● ●● ●● ● ●● ●●● ●● ● ●●● ●● ●● ● ●
●
●● ●●●●● ●● ●●● ●●● ●● ● ●● ●●● ●● ● ●● ● ●●●● ● ●● ●●●● ●● ●●●●● ● ●●● ●●● ● ●● ●● ●●●●●●● ●● ●●●● ●●● ● ●● ● ●●● ●● ● ●● ●● ●● ● ●● ●● ●●● ●●● ● ●●● ●● ●●●● ● ●● ●●●●● ● ● ●● ● ●●● ●●●●●● ● ●● ●● ●●●●● ●●● ●● ●● ●●● ●● ● ●●● ●● ●●● ●●● ●●● ● ●●● ●● ● ●● ●●● ●●●●● ● ● ●●●● ● ● ●● ●●● ●● ●● ●●● ●●● ●●●● ● ●●● ●● ●● ●● ●● ●●● ● ● ●●● ● ●●● ●● ●● ● ● ●●● ●● ●● ●● ●● ● ●●● ● ●● ● ●● ●● ● ● ●● ●●● ●●● ●●● ●● ● ●●● ● ●● ● ●●● ● ●● ●● ●● ●●● ● ●●● ● ● ●●● ●● ●●● ●● ●● ●●●●●● ● ●●●● ● ● ●● ●●● ●●● ●● ●●● ● ●● ●● ● ●●● ● ● ●●● ●●● ● ●●
●
●
●● ●● ●● ● ● ●● ● ●● ●● ● ●●●● ●● ●●● ●● ●● ●● ●●● ● ●● ●● ● ● ●●● ●●● ●● ● ●●● ● ●● ●● ● ● ● ●●●●● ● ●●●●● ● ● ●● ● ●● ●●● ● ●●●● ●●● ●● ●●● ●● ●● ●● ●● ●● ●● ● ●● ●● ● ● ●●● ● ●● ● ●● ●●●●●● ● ●●●● ●●● ● ●● ●●●
●
●
●● ●
●
●
●● ● ●●●●● ●●●●● ● ● ●● ● ●● ● ●●●● ●● ●
●
●● ●● ● ●●●● ● ●●● ●● ●● ●● ●●●● ●● ● ●●● ●
●
●
●
●● ●● ●●● ● ●● ● ●●● ●●●●● ●● ●●● ●● ●● ●●● ● ●● ●●● ●● ●●● ● ● ●●● ● ●● ●● ●● ● ● ●● ● ● ●● ●●● ●● ● ●● ●●●● ● ● ● ●●● ●● ● ●●● ●●● ● ●● ● ●●● ●●●● ●●● ●● ●● ●● ●● ●● ●●● ● ● ●●● ● ●●● ● ●● ●● ● ●●● ●●● ● ●● ● ● ●● ●●● ●● ● ●●● ● ●●● ●● ●●● ●● ● ●●● ●● ●●● ● ●● ●● ●● ●● ●●● ● ●● ●● ●● ●● ●●● ●●● ●●● ● ●● ●●● ●●● ●●● ● ●● ● ●● ●●●● ● ● ●● ● ●●● ●● ●●●●● ●● ●● ●● ●● ●●● ●● ●●●● ●● ● ●●● ● ●● ●● ● ●● ● ●● ●● ●● ● ● ●●● ●● ●●● ● ●●● ●● ●●● ●●● ●● ●● ●● ●●● ●●● ●● ●● ●● ● ●●● ●● ● ●●● ●● ●● ●●●● ● ●●●●● ●● ●● ●●●● ●●● ●●● ● ●●● ●●● ●●● ●● ● ●● ● ●●●● ●● ●● ●● ●●● ●●● ● ●● ●● ●●● ●● ●● ● ● ●●● ● ●●● ● ●● ●● ●●●● ●●● ●● ● ●● ● ●● ● ●● ● ●● ●● ●●●● ● ●●● ●● ●● ● ●● ●●●● ● ●●● ● ●●●● ●●● ●●● ●● ● ●● ●●● ●● ● ●● ●●● ●● ●● ●●● ●● ●● ● ●●● ● ●●● ●● ●● ●● ●● ●●● ●● ● ●● ●●●●● ●●●● ● ● ● ●● ●●●●● ● ● ● ●● ●●● ● ●●● ●● ● ●●●● ●● ●●● ●● ●● ●●● ●● ● ● ● ●●●● ● ●● ● ●●● ●●● ●● ●● ●● ● ●● ● ●●● ●●● ● ● ●● ● ●●●● ●●● ●●● ● ●●● ● ● ●● ●● ●●● ●● ●● ●● ●●● ●●●●● ●● ●●● ●● ●●● ● ● ●●
2004 2006 2008 2010
0.00
0.05
0.10
0.15
0.20
0.25
Violence in Darfur (Full Frame)
Year
Dam
age
(Mea
n)
● ●
●
● ●●●● ● ●● ●
●
● ●●
●
● ●● ●● ●
●
●● ● ●●● ● ●
●
●● ● ● ●● ●●
●●
●● ●● ●
●
●●●●
●
● ●● ●● ● ●● ●● ● ●●●● ● ●
●
● ●
Treatment
● ●● ●●● ●● ●●● ●● ●● ●●
●
● ●● ●●● ●● ●● ●● ●● ●●●●● ●●●●● ●●● ● ● ●
●
● ●● ● ●●● ● ●●
●
●●● ● ●● ●●● ●● ●● ●● ● ●
●
● ● ● ●●● ● ●
●
● ●● ● ●● ● ●●●
●
●
●
●
●
● ● ●●● ● ●●●● ●●●● ● ●● ●● ●● ●● ●●●
●
●● ●●● ●● ●
●
●● ●
●
●
●
●
●● ● ●●●
●
●
●
●●●
●
●●
●
●● ● ● ●● ●●●●
●
●● ●● ● ●● ●●●● ● ●● ● ●●● ●
●
●
●● ●
●
●●● ●●●● ●●
●
●
● ● ●● ● ●●●● ●● ● ●●●
●
●● ● ●● ●● ● ●● ●● ●●● ●●
●
●
●
●● ●● ● ●● ●
●
●
●● ●●● ●● ●
●
●
●
●
●
●
●● ●● ● ●
●
●
●
●
●
●
● ●● ●● ●● ●●● ●● ●● ●
●
●●●● ●●● ● ●●●●● ●●● ●●● ● ●● ●● ●●●● ● ●●● ●● ●●● ●● ●● ● ● ●● ●● ●●●● ●● ●● ● ● ●●● ● ●● ● ●●●● ● ●● ●● ●● ●● ● ●● ●●● ● ●● ● ●●●●● ● ● ● ●● ● ●●● ●● ● ●● ●●●● ●●● ●● ● ● ●●● ●● ●●● ●● ●● ●● ● ●●● ●● ● ●●●● ●●● ● ●●● ●● ● ● ●● ● ●● ●●● ● ●● ●●● ●●●● ●● ● ● ● ●● ● ●● ●● ●● ●●
●
●●●●
●
●●●
●
● ●
●
●●● ●●●
●
● ● ●
●
● ●●● ●●● ●●● ●●● ●● ● ●●● ● ●● ●● ● ●● ●
●
●● ● ●● ● ●
●
●
●● ● ●●● ● ● ●● ● ● ●● ●
●
●
●
● ●● ●●●
●
●●● ●● ●
●
●
●
●
●●●● ●
●
●● ● ●● ●
●
●●● ● ●
●
●
●
●
●
● ●● ● ● ●● ● ●● ●●
●
● ●● ●● ●● ●
●
●● ●● ●
●
●
●
● ●● ● ●●
●
●
●
●
● ● ● ●●● ●●● ● ●
●
●
● ●● ● ●●● ●
●
●● ●
●
●
●
●
● ●● ●● ●
●
●
● ●●●
●
●●●
●
●
●
●
●●
●
●
●● ●● ●
●
●
●
● ●
● ●
●
●
●
●●
●
●● ●●
●
●
●
●
●●●
●
●
●
●
● ●● ●●
●
● ● ●● ●●● ●● ●● ●
●
● ●
●
● ●●
●
●
●
●● ● ●●● ●●● ●●● ● ●●● ●●● ●●
●
●
● ●● ● ●●●● ●● ●● ●● ●● ●● ● ●● ●● ●●●● ●●●●● ● ● ●● ●● ● ●● ● ●● ● ● ●● ● ●● ●●● ●● ●●● ●●● ●●● ● ●●● ●●● ●● ●● ●● ●● ●● ●●● ●● ●● ●● ● ●● ● ●● ●● ● ●●●● ●●
●
●●● ●●● ● ●●●●●● ●● ● ●● ●●●
●
● ●●●● ● ● ●● ●● ●● ●● ● ●●● ●● ●●● ● ●● ●●● ● ●● ● ●● ●● ●● ● ● ●● ●●
●
● ●● ●● ●● ● ●●●● ●● ●
●
● ● ●●● ●● ● ●● ●●●●● ●●
●
● ●●●●● ● ●● ●● ● ●● ●●● ●● ●● ●●● ●● ●● ●●● ●● ●●●
●
● ●●●● ●●● ●● ●● ●● ●
●
●
● ●● ●● ●● ●
●
●
●● ●●● ●● ●● ●●
●
●
●● ●● ● ● ●
●
● ●●●● ● ●●● ● ●●● ● ●● ●●● ●● ●●●● ●● ●● ●● ●
●
●●● ● ●●● ●●●● ●● ●●● ●●● ●●● ●● ● ●●●● ● ●● ● ●● ●●●● ● ●● ● ●● ●
●
●● ● ●● ●●
●
●●● ●● ●●● ● ●●●● ●● ●●● ●●● ●●●
●
●● ●●●
●
●
● ●● ●●● ●●●
●
●● ●● ●● ●
●
●
●●
●
●
●●●● ●● ●●●● ● ●● ●● ● ●● ●● ● ●
●
● ●●●
●
●● ●●●●● ●● ●● ●● ●● ●●● ● ●●● ●●● ● ●●●● ●● ●●● ● ●● ● ●● ●●●● ●●● ●● ●●● ● ● ● ●● ●● ●● ●● ● ● ●● ●●● ● ●● ●● ● ●●● ●
●
● ●●● ●●● ●●● ●● ●● ● ●● ●
●
● ●●●
●
● ●● ●●
●
● ●● ●● ●
●
●●●● ●● ●●● ● ● ●● ● ●
●
● ●●
●
● ●●● ●● ●● ● ● ●
●
●
● ●● ●● ● ●● ●● ●●● ● ● ●●● ●●● ● ●● ●●●● ● ●● ● ●●
●
●● ●● ● ●● ●● ●
●
●● ● ●●●● ●● ●● ● ●●●● ●● ● ●●●
●
● ● ●
●
●● ●● ●●● ● ●● ● ● ● ●● ●● ●● ● ● ●●●●●● ● ●●●●● ●● ●● ●●● ●● ●●● ●● ●●● ●● ●●●● ● ●● ●●●● ●● ●
●
●●● ● ●●●● ●● ● ●●● ●● ●●● ● ●● ●● ●● ● ●●● ● ● ●● ●● ● ● ● ●● ●●● ●● ●●● ●●●●● ●● ●● ●● ●●●● ● ●● ●●● ●●●
●
●
●●● ●● ●●
●
●● ●● ● ●● ●●●
●
●● ● ● ● ●●● ●● ●●
●
●● ●● ●● ●●
●
●● ●● ●●● ● ●
●
●
●●
●
●
● ●●
●
●
● ● ●●●●● ●
●
● ● ●●●● ●●●
●
●● ● ●● ● ●● ●●● ● ●●● ●●● ●● ● ●●● ●●● ●● ●●● ● ●●● ●● ●● ● ●●● ● ● ●● ●●● ● ●● ●●● ●●● ●●●● ●● ●●● ●●● ●● ● ●●●● ●●●● ●● ●●● ●● ●● ●●● ●● ● ●●● ●● ●● ●● ● ●● ●●● ●● ●● ●● ●●● ● ●● ● ●
●
● ● ●● ●● ●● ●●
●
● ●●● ● ●
●
●
● ● ● ●●●●● ●● ●● ●● ● ●●● ●●
●
● ● ●●●●● ●● ●● ● ●● ● ●● ●
●
●
●
● ●● ● ● ●●● ●● ●● ●
●
●
●
●● ● ●● ●● ●● ●● ● ●● ●
●
●
●● ●●● ● ● ●● ●●●● ●● ●●● ● ●● ●● ●●● ● ●● ● ●
●
●● ●●●● ●●●●● ● ●● ●● ●● ● ●●●● ●● ●● ●● ●● ● ●●● ●● ●●●
●
● ●●● ● ● ●●●●● ●
●
● ●● ●
●
●● ●
●
●● ●● ●● ● ● ●● ●● ●●● ●●● ●● ●●● ●●●●
●
●● ●● ●●● ●● ● ●● ●●● ● ● ●●● ●●● ●● ● ● ●● ●● ●●
●
●● ● ● ●● ● ●●● ●●●● ●● ●●●● ●●● ● ●● ●●
●
●
● ●● ●●● ●●● ● ●● ●● ●● ●● ● ●●● ● ●● ●●● ●●● ●●● ●●●● ●●● ●●●
●
●● ●
●
● ●●
●
● ● ●●●
●
●
●●
●
●
●
●
●
●●●●
●
●●● ● ●
●
● ●
●
●●
●
●●● ● ● ●
●
●● ●● ●●●● ●●● ● ●● ●
●
●
●
●● ●●● ● ●● ● ● ●
●
●● ● ● ● ●● ● ●● ●● ●● ●●●● ●● ●●●● ● ●●● ● ●● ● ●●● ●●● ● ●●● ●●● ●● ●● ●● ●● ● ● ●● ●● ●●● ● ● ● ●●● ●●●●●
●
●● ●● ● ●● ●● ●●●
●
●
●●● ●● ●● ●●● ●●● ●●●● ● ● ●●●●● ●● ●
●
● ●●● ●● ●●● ●●● ●●●● ● ●●● ●● ● ●● ●● ● ●● ●●● ●● ● ●●
●
● ●● ●● ●● ●●●● ●●● ●
●
●
●● ●● ● ●● ●●●●● ●● ●●● ● ●● ● ●● ●● ● ●● ● ●● ●● ● ●●● ●●● ●● ●●● ●● ●● ● ●● ●●●● ●●●● ● ●● ● ●●● ●● ●● ● ●●●● ●● ● ● ●● ●● ●●●●● ● ●●●● ● ●●● ● ●● ●● ●●● ●● ● ●● ●●● ●● ●● ●● ●●● ● ●● ●● ● ● ●●● ●●● ●● ●● ● ●●● ●●● ●● ●● ●● ● ●● ●●● ● ●● ● ●●● ● ● ●●●● ●● ● ● ●● ●●● ●● ●● ● ●● ●● ● ●●●●●● ●● ●● ● ●● ● ●●● ● ●● ● ●●●● ●●● ●● ● ●● ●●● ●
●
●●●● ●●● ●● ●●● ●● ●● ●● ● ● ● ●● ● ●● ●● ●●
●
●●● ●● ● ● ●●● ●●● ●●● ●● ●● ●●● ● ●● ●● ● ●● ●
●
● ● ●● ● ●●● ● ●● ● ●●
●
●● ●● ● ●● ●●● ●● ●● ●●● ●●● ●●● ● ●●●●● ●● ● ●● ●● ●● ● ●●●● ●●● ●● ●● ●● ●● ●● ●● ● ● ●● ●● ●●● ● ● ●● ●● ●● ● ●● ●●● ●●●● ●●●● ●● ●● ●●● ●● ●● ●
●
● ●● ●●●● ●●● ● ●● ● ●●● ●● ●●● ● ●● ●● ●● ●●●●●● ● ●● ●●● ●●● ●●●● ● ●●● ● ● ●● ●● ●● ● ●● ● ●● ●● ●●● ●● ●● ●●● ● ●●●● ●● ●● ●●●● ● ●● ●●●● ● ● ●●● ●●● ●●● ●● ●●● ● ●●●● ●● ●●● ●●●● ● ●●● ●● ● ● ●● ●● ●● ●● ●● ●● ●●● ●● ● ●● ●● ●● ●● ●●●●● ●● ● ● ●● ●●●● ●●● ●● ● ●●● ●
●
● ●● ● ●● ●● ●●● ● ●●● ●●●●●● ●● ● ●●●● ●●● ● ● ●● ● ●● ● ●● ●● ●● ●● ●●●●● ●● ● ●●● ● ●●●● ●● ●● ●● ●●● ● ●●● ● ●●●●● ●● ●●● ●●● ●● ● ●● ● ●● ● ● ●● ●● ●●● ● ● ● ●● ●●● ● ●●● ●●●●●● ● ●● ●● ● ●●● ●
●
●
●● ● ● ●●●● ●●● ●●● ●●●● ● ●● ●● ●● ● ● ●● ● ●●●● ● ●●● ● ●●● ●●●●● ●● ●● ●●●●● ● ●●●●● ●●● ●●● ● ●● ● ●● ●● ● ●● ●● ● ●● ●●● ● ●● ● ●● ●●● ●● ● ●●●● ● ●●● ●● ●● ● ● ●● ●●● ●● ● ●● ●● ● ●●● ●● ●● ●● ●●●● ●● ● ●●●● ●● ●●●●● ●● ●●●● ●●● ●●●● ●●● ●●● ●● ● ●
●
● ●● ●● ●●● ●●●● ● ●● ●●● ●● ●●● ●● ●● ●● ●●●●●● ●● ●● ●●●● ●● ●●● ●●● ● ●● ●● ●● ●●● ● ●● ● ●●● ●●● ●●●●●●● ●● ●● ●●● ● ● ●●● ●●●● ●● ● ●● ●●● ●● ●●● ●● ● ●● ●● ● ●●● ● ●● ● ●●●● ●● ●●● ●●● ● ●● ●●●●● ● ●● ●● ●● ●● ●● ● ●●● ●● ● ●●● ● ●● ● ●●● ● ●● ● ●● ● ●● ●● ●●●
●
● ●●● ● ●● ● ●●● ● ●● ● ●●● ●●● ● ●● ●● ● ●●●● ● ●●●●● ●● ●●● ●● ● ● ●●● ●● ● ●● ●● ●● ●● ● ●
●
●●● ●●● ●● ●● ●●●● ●● ● ●● ●● ●● ●●●● ●● ●●● ●●● ●●●● ● ● ●●●● ●●● ●●●●● ● ●● ●● ● ●●● ●● ● ●●● ●● ●●● ●● ●● ●●●● ● ●●● ●●● ● ●●●● ●●● ● ●● ●●● ● ●● ● ●●● ● ●●●● ●●● ● ● ●● ●●●●● ●●●●●● ● ●● ●● ●●●● ●●●● ●●● ●● ●●● ●●●● ●●●● ●●
2004 2006 2008 20100.
000.
050.
100.
150.
200.
25
Violence in Darfur (Matched Frame)
Year
Dam
age
(Mea
n)●●
●
● ●● ●●● ●●●
●
● ●●
●
● ●● ●● ●
●
● ●● ● ●●● ●
●
● ●● ● ● ●● ●
●●
● ● ● ● ●
●
● ● ●●
●
● ●●● ●●● ● ●● ●● ●●●● ●
●
● ●
Treatment
Note: These figures plot violence by monitoring status in Darfur. The left panel visualizes the full data frame and the right frame visualizes the matched data frame fora match ratio of 1-100. Violence data is jittered for presentation and fitted with a cubic spline.
25
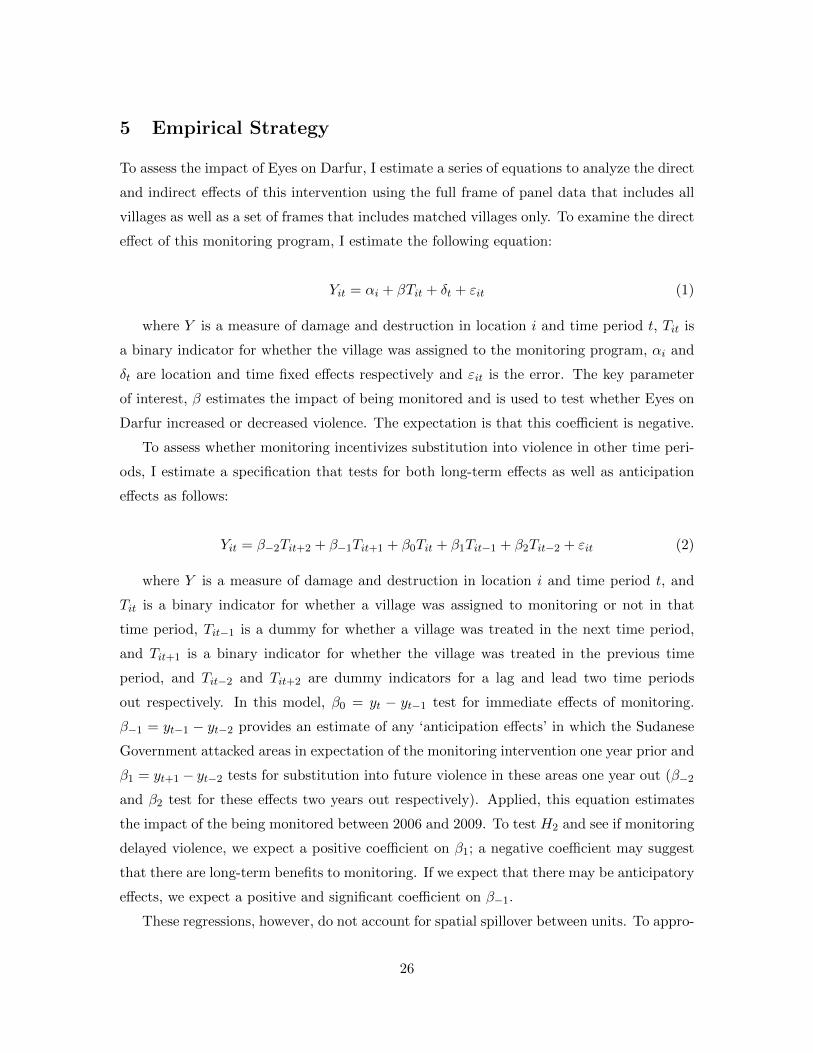
5 Empirical Strategy
To assess the impact of Eyes on Darfur, I estimate a series of equations to analyze the direct
and indirect effects of this intervention using the full frame of panel data that includes all
villages as well as a set of frames that includes matched villages only. To examine the direct
effect of this monitoring program, I estimate the following equation:
Yit = αi + βTit + δt + εit (1)
where Y is a measure of damage and destruction in location i and time period t, Tit is
a binary indicator for whether the village was assigned to the monitoring program, αi and
δt are location and time fixed effects respectively and εit is the error. The key parameter
of interest, β estimates the impact of being monitored and is used to test whether Eyes on
Darfur increased or decreased violence. The expectation is that this coefficient is negative.
To assess whether monitoring incentivizes substitution into violence in other time peri-
ods, I estimate a specification that tests for both long-term effects as well as anticipation
effects as follows:
Yit = β−2Tit+2 + β−1Tit+1 + β0Tit + β1Tit−1 + β2Tit−2 + εit (2)
where Y is a measure of damage and destruction in location i and time period t, and
Tit is a binary indicator for whether a village was assigned to monitoring or not in that
time period, Tit−1 is a dummy for whether a village was treated in the next time period,
and Tit+1 is a binary indicator for whether the village was treated in the previous time
period, and Tit−2 and Tit+2 are dummy indicators for a lag and lead two time periods
out respectively. In this model, β0 = yt − yt−1 test for immediate effects of monitoring.
β−1 = yt−1 − yt−2 provides an estimate of any ‘anticipation effects’ in which the Sudanese
Government attacked areas in expectation of the monitoring intervention one year prior and
β1 = yt+1 − yt−2 tests for substitution into future violence in these areas one year out (β−2
and β2 test for these effects two years out respectively). Applied, this equation estimates
the impact of the being monitored between 2006 and 2009. To test H2 and see if monitoring
delayed violence, we expect a positive coefficient on β1; a negative coefficient may suggest
that there are long-term benefits to monitoring. If we expect that there may be anticipatory
effects, we expect a positive and significant coefficient on β−1.
These regressions, however, do not account for spatial spillover between units. To appro-
26
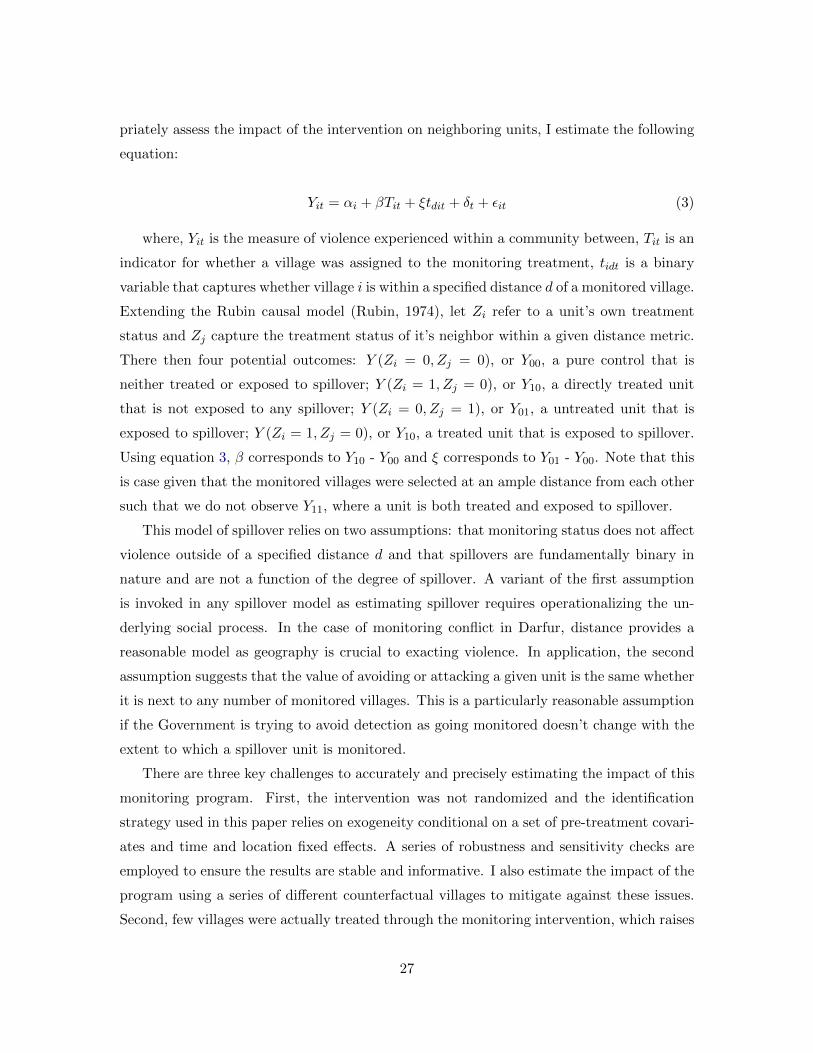
priately assess the impact of the intervention on neighboring units, I estimate the following
equation:
Yit = αi + βTit + ξtdit + δt + εit (3)
where, Yit is the measure of violence experienced within a community between, Tit is an
indicator for whether a village was assigned to the monitoring treatment, tidt is a binary
variable that captures whether village i is within a specified distance d of a monitored village.
Extending the Rubin causal model (Rubin, 1974), let Zi refer to a unit’s own treatment
status and Zj capture the treatment status of it’s neighbor within a given distance metric.
There then four potential outcomes: Y (Zi = 0, Zj = 0), or Y00, a pure control that is
neither treated or exposed to spillover; Y (Zi = 1, Zj = 0), or Y10, a directly treated unit
that is not exposed to any spillover; Y (Zi = 0, Zj = 1), or Y01, a untreated unit that is
exposed to spillover; Y (Zi = 1, Zj = 0), or Y10, a treated unit that is exposed to spillover.
Using equation 3, β corresponds to Y10 - Y00 and ξ corresponds to Y01 - Y00. Note that this
is case given that the monitored villages were selected at an ample distance from each other
such that we do not observe Y11, where a unit is both treated and exposed to spillover.
This model of spillover relies on two assumptions: that monitoring status does not affect
violence outside of a specified distance d and that spillovers are fundamentally binary in
nature and are not a function of the degree of spillover. A variant of the first assumption
is invoked in any spillover model as estimating spillover requires operationalizing the un-
derlying social process. In the case of monitoring conflict in Darfur, distance provides a
reasonable model as geography is crucial to exacting violence. In application, the second
assumption suggests that the value of avoiding or attacking a given unit is the same whether
it is next to any number of monitored villages. This is a particularly reasonable assumption
if the Government is trying to avoid detection as going monitored doesn’t change with the
extent to which a spillover unit is monitored.
There are three key challenges to accurately and precisely estimating the impact of this
monitoring program. First, the intervention was not randomized and the identification
strategy used in this paper relies on exogeneity conditional on a set of pre-treatment covari-
ates and time and location fixed effects. A series of robustness and sensitivity checks are
employed to ensure the results are stable and informative. I also estimate the impact of the
program using a series of different counterfactual villages to mitigate against these issues.
Second, few villages were actually treated through the monitoring intervention, which raises
27
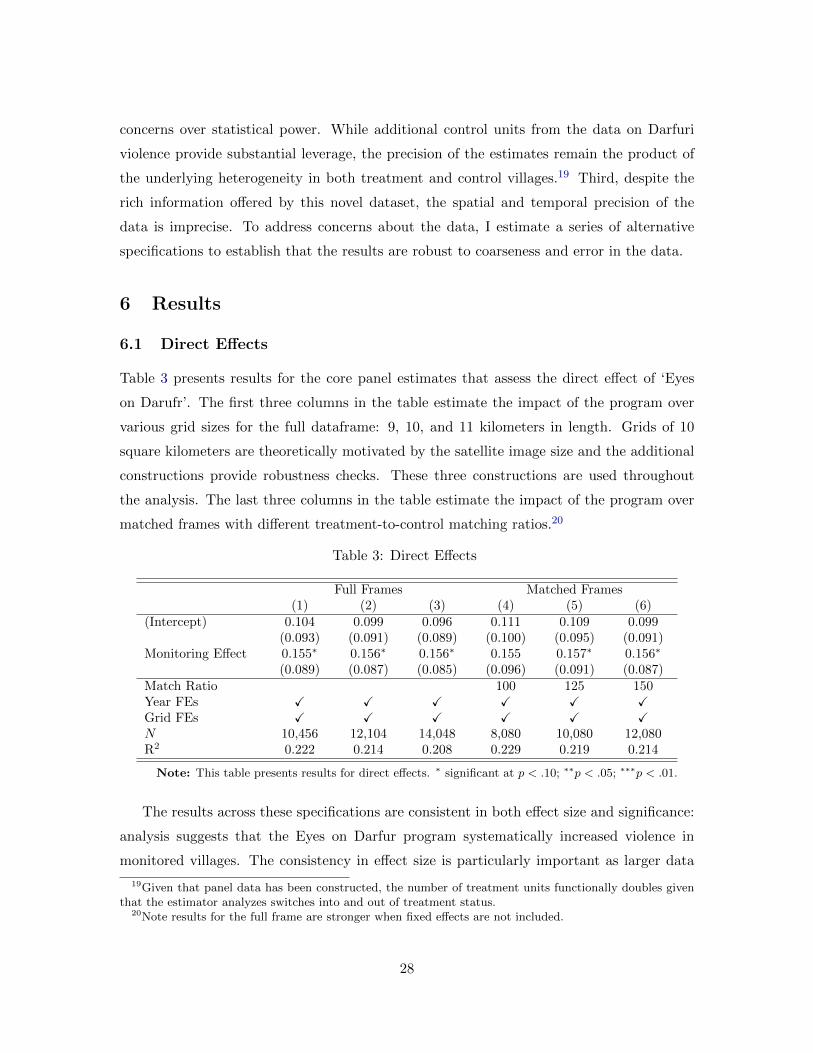
concerns over statistical power. While additional control units from the data on Darfuri
violence provide substantial leverage, the precision of the estimates remain the product of
the underlying heterogeneity in both treatment and control villages.19 Third, despite the
rich information offered by this novel dataset, the spatial and temporal precision of the
data is imprecise. To address concerns about the data, I estimate a series of alternative
specifications to establish that the results are robust to coarseness and error in the data.
6 Results
6.1 Direct Effects
Table 3 presents results for the core panel estimates that assess the direct effect of ‘Eyes
on Darufr’. The first three columns in the table estimate the impact of the program over
various grid sizes for the full dataframe: 9, 10, and 11 kilometers in length. Grids of 10
square kilometers are theoretically motivated by the satellite image size and the additional
constructions provide robustness checks. These three constructions are used throughout
the analysis. The last three columns in the table estimate the impact of the program over
matched frames with different treatment-to-control matching ratios.20
Table 3: Direct Effects
Full Frames Matched Frames(1) (2) (3) (4) (5) (6)
(Intercept) 0.104 0.099 0.096 0.111 0.109 0.099(0.093) (0.091) (0.089) (0.100) (0.095) (0.091)
Monitoring Effect 0.155∗ 0.156∗ 0.156∗ 0.155 0.157∗ 0.156∗
(0.089) (0.087) (0.085) (0.096) (0.091) (0.087)Match Ratio 100 125 150Year FEs X X X X X XGrid FEs X X X X X XN 10,456 12,104 14,048 8,080 10,080 12,080R2 0.222 0.214 0.208 0.229 0.219 0.214
Note: This table presents results for direct effects. ∗ significant at p < .10; ∗∗p < .05; ∗∗∗p < .01.
The results across these specifications are consistent in both effect size and significance:
analysis suggests that the Eyes on Darfur program systematically increased violence in
monitored villages. The consistency in effect size is particularly important as larger data
19Given that panel data has been constructed, the number of treatment units functionally doubles giventhat the estimator analyzes switches into and out of treatment status.
20Note results for the full frame are stronger when fixed effects are not included.
28
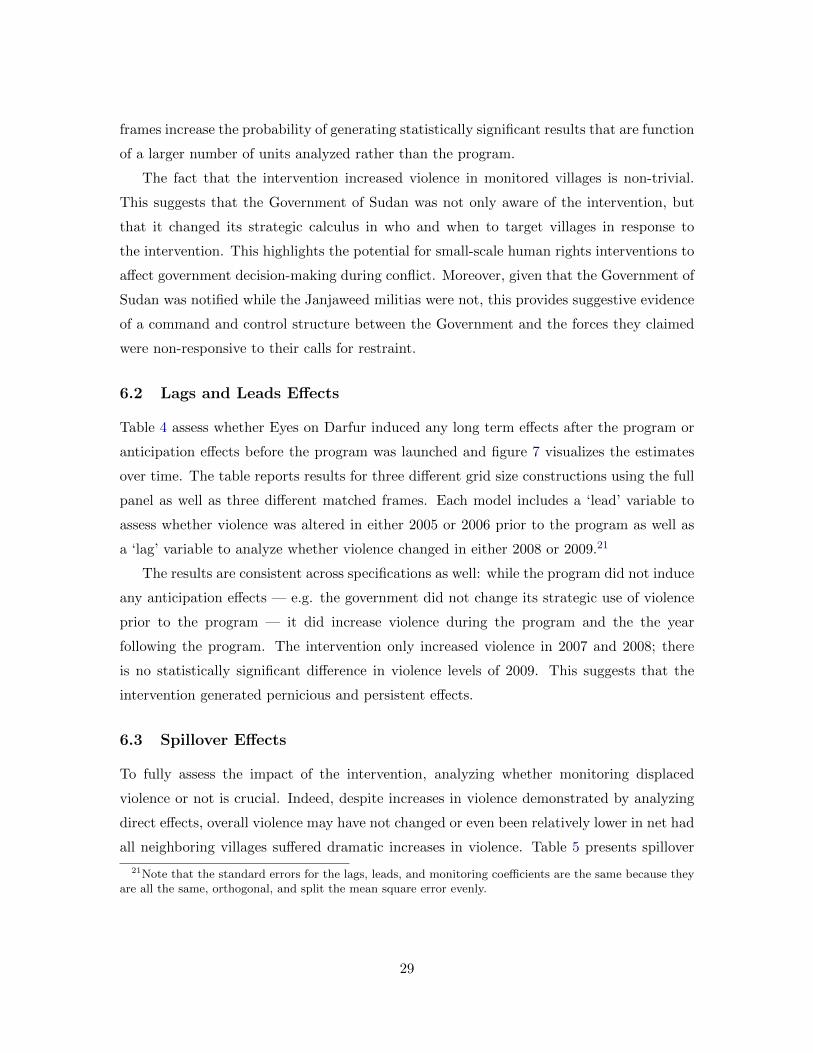
frames increase the probability of generating statistically significant results that are function
of a larger number of units analyzed rather than the program.
The fact that the intervention increased violence in monitored villages is non-trivial.
This suggests that the Government of Sudan was not only aware of the intervention, but
that it changed its strategic calculus in who and when to target villages in response to
the intervention. This highlights the potential for small-scale human rights interventions to
affect government decision-making during conflict. Moreover, given that the Government of
Sudan was notified while the Janjaweed militias were not, this provides suggestive evidence
of a command and control structure between the Government and the forces they claimed
were non-responsive to their calls for restraint.
6.2 Lags and Leads Effects
Table 4 assess whether Eyes on Darfur induced any long term effects after the program or
anticipation effects before the program was launched and figure 7 visualizes the estimates
over time. The table reports results for three different grid size constructions using the full
panel as well as three different matched frames. Each model includes a ‘lead’ variable to
assess whether violence was altered in either 2005 or 2006 prior to the program as well as
a ‘lag’ variable to analyze whether violence changed in either 2008 or 2009.21
The results are consistent across specifications as well: while the program did not induce
any anticipation effects — e.g. the government did not change its strategic use of violence
prior to the program — it did increase violence during the program and the the year
following the program. The intervention only increased violence in 2007 and 2008; there
is no statistically significant difference in violence levels of 2009. This suggests that the
intervention generated pernicious and persistent effects.
6.3 Spillover Effects
To fully assess the impact of the intervention, analyzing whether monitoring displaced
violence or not is crucial. Indeed, despite increases in violence demonstrated by analyzing
direct effects, overall violence may have not changed or even been relatively lower in net had
all neighboring villages suffered dramatic increases in violence. Table 5 presents spillover
21Note that the standard errors for the lags, leads, and monitoring coefficients are the same because theyare all the same, orthogonal, and split the mean square error evenly.
29
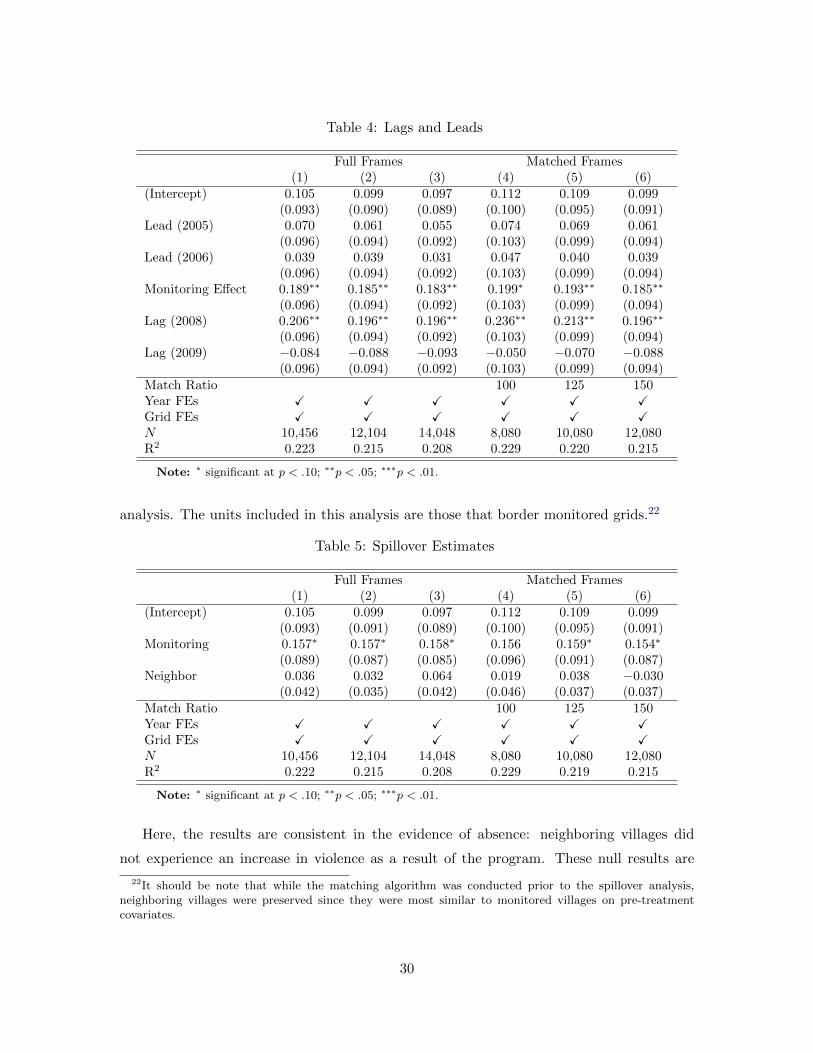
Table 4: Lags and Leads
Full Frames Matched Frames(1) (2) (3) (4) (5) (6)
(Intercept) 0.105 0.099 0.097 0.112 0.109 0.099(0.093) (0.090) (0.089) (0.100) (0.095) (0.091)
Lead (2005) 0.070 0.061 0.055 0.074 0.069 0.061(0.096) (0.094) (0.092) (0.103) (0.099) (0.094)
Lead (2006) 0.039 0.039 0.031 0.047 0.040 0.039(0.096) (0.094) (0.092) (0.103) (0.099) (0.094)
Monitoring Effect 0.189∗∗ 0.185∗∗ 0.183∗∗ 0.199∗ 0.193∗∗ 0.185∗∗
(0.096) (0.094) (0.092) (0.103) (0.099) (0.094)Lag (2008) 0.206∗∗ 0.196∗∗ 0.196∗∗ 0.236∗∗ 0.213∗∗ 0.196∗∗
(0.096) (0.094) (0.092) (0.103) (0.099) (0.094)Lag (2009) −0.084 −0.088 −0.093 −0.050 −0.070 −0.088
(0.096) (0.094) (0.092) (0.103) (0.099) (0.094)Match Ratio 100 125 150Year FEs X X X X X XGrid FEs X X X X X XN 10,456 12,104 14,048 8,080 10,080 12,080R2 0.223 0.215 0.208 0.229 0.220 0.215
Note: ∗ significant at p < .10; ∗∗p < .05; ∗∗∗p < .01.
analysis. The units included in this analysis are those that border monitored grids.22
Table 5: Spillover Estimates
Full Frames Matched Frames(1) (2) (3) (4) (5) (6)
(Intercept) 0.105 0.099 0.097 0.112 0.109 0.099(0.093) (0.091) (0.089) (0.100) (0.095) (0.091)
Monitoring 0.157∗ 0.157∗ 0.158∗ 0.156 0.159∗ 0.154∗
(0.089) (0.087) (0.085) (0.096) (0.091) (0.087)Neighbor 0.036 0.032 0.064 0.019 0.038 −0.030
(0.042) (0.035) (0.042) (0.046) (0.037) (0.037)Match Ratio 100 125 150Year FEs X X X X X XGrid FEs X X X X X XN 10,456 12,104 14,048 8,080 10,080 12,080R2 0.222 0.215 0.208 0.229 0.219 0.215
Note: ∗ significant at p < .10; ∗∗p < .05; ∗∗∗p < .01.
Here, the results are consistent in the evidence of absence: neighboring villages did
not experience an increase in violence as a result of the program. These null results are
22It should be note that while the matching algorithm was conducted prior to the spillover analysis,neighboring villages were preserved since they were most similar to monitored villages on pre-treatmentcovariates.
30
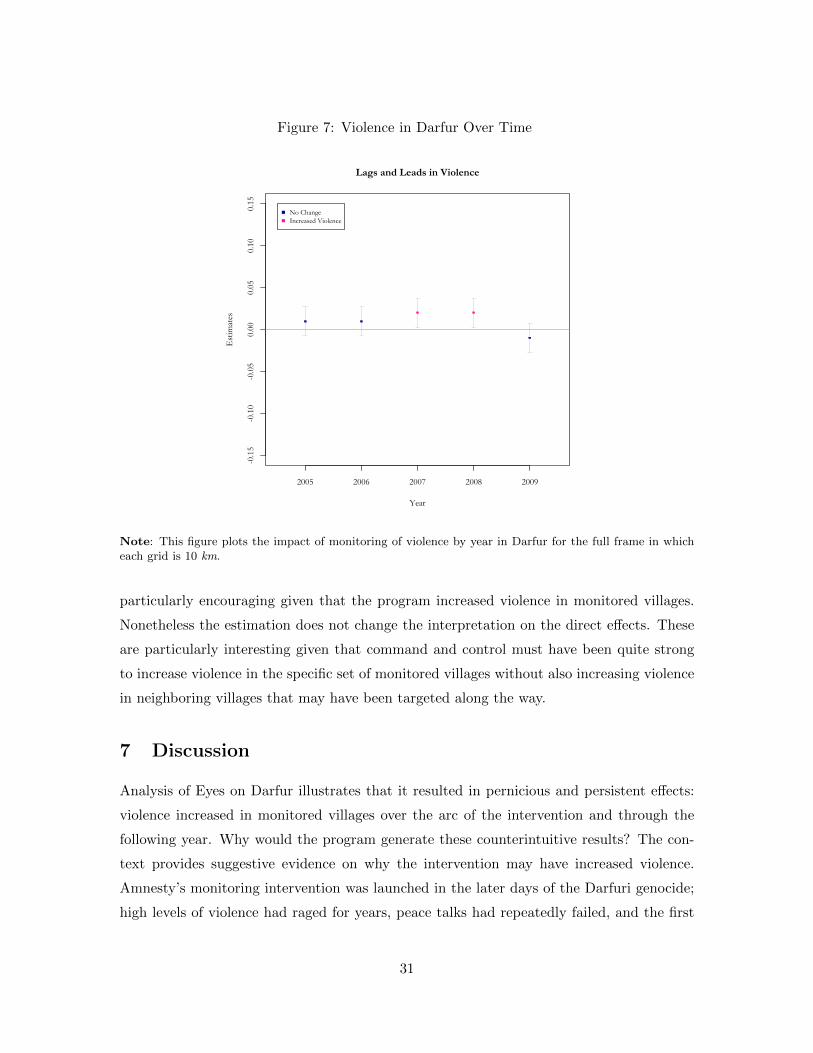
Figure 7: Violence in Darfur Over Time
2005 2006 2007 2008 2009
-0.15
-0.10
-0.05
0.00
0.05
0.10
0.15
Lags and Leads in Violence
Year
Estimates
No ChangeIncreased Violence
Note: This figure plots the impact of monitoring of violence by year in Darfur for the full frame in whicheach grid is 10 km.
particularly encouraging given that the program increased violence in monitored villages.
Nonetheless the estimation does not change the interpretation on the direct effects. These
are particularly interesting given that command and control must have been quite strong
to increase violence in the specific set of monitored villages without also increasing violence
in neighboring villages that may have been targeted along the way.
7 Discussion
Analysis of Eyes on Darfur illustrates that it resulted in pernicious and persistent effects:
violence increased in monitored villages over the arc of the intervention and through the
following year. Why would the program generate these counterintuitive results? The con-
text provides suggestive evidence on why the intervention may have increased violence.
Amnesty’s monitoring intervention was launched in the later days of the Darfuri genocide;
high levels of violence had raged for years, peace talks had repeatedly failed, and the first
31
set of ICC warrants for war crimes had been issued. As such, the Government of Sudan
had little to lose from additional evidence implicating it in the genocide.
Moreover, while the results highlight the alarming potential for these interventions to
generate violence, they are not unexpected. Amnesty International monitored a small num-
ber of villages at the outset given concerns that the project may increase violence. They
decided not to expand the program given anecdotal evidence that it increased violence, an
internal decision that buttresses the findings in this paper. Additionally, later interventions
run by the Satellite Sentinel Program that also used satellites to monitor violence in Darfur
were thought to cause violence. Coupled, these speak to the underlying potential for lim-
ited external interventions conducted by human rights organizations to change the strategic
calculus of actors involved in genocide, even if they cause violence.
While the context provides suggestive clues to why violence may have increased, deeper
incentives for the Government of Sudan to engage in violence are also at play. Monitoring
facilitates the ability to signal commitment to a cause — or the capacity to effectively
pursue a cause — to both international and local audiences. This function is particularly
important in low-information environments where the cost of communicating resolve is high.
Evidence from other conflict highlights the importance of monitoring as a legitimizing that
sends signals and qualitative evidence suggests that this may be at work in Darfur. Had
the Government of Sudan wanted to signal their strength and commitment to violence to
the international community, they would have actively acknowledged the program to reduce
any ambiguity to which increases in violence may have been attributed. While evidence
suggests that the Government was indeed aware of the program, it does not resonate with
the effort the Government would have taken to signal it’s knowledge to the international
community. This provides suggestive evidence that the Government may have been more
interested in signaling internally rather than externally.23
Caution in interpretation is warranted. The analysis presented here is observational and
while the results draw on novel, high-frequency, geo-coded data, the data themselves are
noisy and subject to error. Whereas sensitivity analysis suggests the results are robust to
various model specifications and approaches to cutting the data, these robustness checks
are themselves limited by underlying blemishes in the data. More broadly, the analysis
23It is worth noting that a strong external signal may buttress a strong a internal signal. If the Governmentof Sudan had absolutely nothing to use and was going for a strong internal signal, they would have moreactively acknowledged the intervention. While the Government had little to lose, there were still minorincentives to not signal externally; Omar Al-Bashir had not yet been indicted by the ICC and South Sudanhad yet to vote in their independence referendum.
32
assesses the strategic behavior of a singular actor, the Government of Sudan. Rather than
analyze individual unit commanders or soldiers, this approach examines the use of violence
between villages as the portfolio choice of the Government. While an advantage of this
approach is that it offers the ability to establish a link of command and control between
the government and Janjaweed fighters, it may also mask important heterogeneous effects
that occur in these relationships.
A key question is whether these results are generalizable. Eyes on Darfur was undoubt-
edly unique: it was the first-ever satellite intervention launched amidst an ongoing genocide
in a small subset of villages in the western region of Sudan. Genocides are few and far-
between, the scope of the intervention was limited, and the very fact that an innovative
technology was used reduces the extent to which these results can be validated.
However, the characteristics of this intervention and context speak to a broader family of
cases in which human rights organizations monitor violations during conflict. Human rights
monitoring has become commonplace in the international arena (Hendrix and Wong 2012,
Murdie and Davis 2012), and as Hafner-Burton (2008) points out, while only 25 countries
were annually shamed by Amnesty International in 1975, more than 100 countries were
shamed by 2000. The core activities of documenting and disseminating information about
violations that underpin the broad surge in human rights monitoring are the exact same as
those as used in Eyes on Darfur.
Additionally, while the technology used is new, few of the underlying characteristics of
this information are; questions about credibility, accuracy, and precision are core to human
rights monitoring and affect satellite monitoring in the same ways they affect more tradi-
tional forms of information collection. Moreover, the growing use of satellites in monitoring
areas inaccessible to human rights researchers — Syria, Northern Nigeria, and other places
— increase the relevance of the findings in this paper. As these technologies become more
affordable and more common, so too will this type of monitoring. These results, therefore,
present an important estimate of what may become a prevailing intervention.
More troubling to external validity is the fact that this was launched amidst a genocide,
a unique and rare form of violence. However, as scholars have shown, governments strate-
gically target civilians during campaigns of mass violence (Valentino, 2014), and recent
research has identified the theoretical conditions under which third-party interventions may
incentivize violence (Kydd and Strauss, 2013). The impact of the Eyes on Darfur project
speaks to a deeper set of questions about when and why monitoring programs affects pat-
33
terns of civilian abuse. The analysis presented here, nonetheless, provides one estimate from
one case, which is a modest, but crucial step in analyzing the conditions under which these
interventions alter the strategic use of violence.
8 Conclusions
While monitoring has long-been a traditional tool of statecraft that nations use to further
their interests, NGOs and human rights activists have increasingly embraced it as a key
strategy to pursue their own agendas over the past 75 years (Keck and Sikkink 1998, Rise,
Ropp and Kathryn Sikkink 1999). Human rights organizations consistently document and
disseminate information about violations in order to pressure those responsible to change
their behavior. Yet, the impact of monitoring conflict is not straightforward, and theory
predicts that it may reduce or amplify violence.
To contribute to this debate, I bring unique evidence and a test of the first-ever satellite
intervention implemented by Amnesty International during the Darfuri genocide. Amnesty
selected a set of villages, tasked satellites to monitor these villages and informed the Gov-
ernment of Sudan that the world was watching. While the objective of this project was to
reduce violence in monitored villages, analysis suggests that the project increased violence
by 15-30 percentage points in these sites. Evidence suggests that the Government of Sudan
used this monitoring intervention as a method to signal their resolve to maintain power to
local audiences. Additionally, analysis also suggests that the intervention did not increase
or decrease violence in neighboring villages. This assuages fears that monitoring may simply
displace violence but tempers hopes that it may generate geographically protective enclaves.
There are three key implications of this research. First, this analysis highlights the
perverse outcomes that monitoring interventions may generate. The fact that a fairly com-
monplace human rights strategy had pernicious effects speaks to the broad range of out-
comes that these interventions may fuel. Understanding when and why monitoring increases
violence is integral to reducing the impact of conflict and this paper provides suggestive evi-
dence about the conditions under which these strategies result in unintended consequences.
Monitoring may lose its deterrent-capacity when it fails to produce new information and
actors have little to lose. In low-information environments where monitoring operates to
advertise behavior, it may even increase violence. While the findings in this paper are dis-
couraging, they nonetheless suggest that even actors engaged in the most brutal of conflict
are sensitive to international pressure that generates evidence of their behavior.
34
Second, these findings illuminate ways in which human rights monitoring can be re-
designed to mitigate risk. Given that these interventions provide a platform for actors to
credibly signal commitment through violence, projects that seek to document conflict to
ultimately hold those to account may keep the information they collect private to avoid
providing any signaling opportunities. Additionally, analysis suggests that the impact of
Eyes on Darfur endured beyond the scope of the intervention. While this type of persistence
is beneficial when outcomes are positive and detrimental when outcomes are negative, these
long-term effects should influence investments into monitoring.
Lastly, these findings garner much-needed evidence on the role and impact of new tech-
nologies in human rights monitoring. First and foremost, the use of satellite technology to
monitor conflict increased violence in this case, which should temper excitement over new
technologies championed as silver bullets. However, these satellite technologies facilitated
collecting credible, high-frequency, sub-national data on violence in a set of villages for
which the Government had denied organizations and activists access. Indeed, it is in the
ways that new technologies restructure the strategies available to actors and the decision-
nodes at which they act that fundamentally reshape the monitoring game. In this sense, the
analysis in this paper speaks to ways in which new technologies have altered the strategic
interactions between human rights organizations and their targets, and in doing so, pro-
vides the first set of estimates on the impact of monitoring in previously unexplored areas
of conflict.
35
References
Becker, Gary. 1968. “Crime and Punishment: An Economic Approach.” Journal of Political Economy76(2):169–217.
Betsill, Michele Merrill and Elisabeth Corell. 2008. NGO diplomacy: The influence of nongovernmentalorganizations in international environmental negotiations. Mit Press.
Blattman, Christopher. 2009. “From Violence to Voting: War and Political Participation in Uganda.”American Political Science Review 103(2):231–247.
Cohen, Dara Kay. 2011. “Causes of Sexual Violence During Civil War: Cross-National Evidence (1980-2009).” Unpublished Manuscript, University of Minnesota.
de Waal, Alex. 2015. Advocacy in Conflict: Critical Perspectives on Transnational Activism. Zed Books.
de Waal, Alex, Chad Hazlett, Christian Davenport and Joshua Kennedy. 2014. “The epidemiology of lethalviolence in Darfur: Using micro-data to explore complex patterns of ongoing armed conflict.” SocialScience & Medicine 120:368–377.
Di Tella, Rafael and Ernesto Schargrodsky. 2004. “Do police reduce crime? Estimates using the allocationof police forces after a terrorist attack.” The American Economic Review 94(1):115–133.
Dills, Angela K., Jeffrey A. Miron and Garrett Summers. 2008. “What do Economics Know About Crime.”NBER Working Paper.
Donohue, John J, Daniel E Ho and Patrick Leahy. 2013. “Do police reduce crime?” Empirical Legal Analysis:Assessing the Performance of Legal Institutions p. 125.
Downes, Alexander B. 2008. Targeting Civilians in War. Ithica, N.Y.: Cornell University Press.
Esteban, Joan, Massimo Morelli and Dominic Rohner. 2012. “Strategic Mass Killings.” UnpublishedManuscript, NYU.
Fearon, James D. 1995. “Rationalist Explanations for War.” International Organization 49(3):379–414.
Fearon, James D. 1998. “Bargaining, enforcement, and international cooperation.” International Organiza-tion 52(02):269–305.
Flint, Julie and Alex de Waal. 2008. Darfur: A New History of a Long War. London, UK: Zed Books.
Fortna, Page. 2008. Does peacekeeping keep peace? Shaping Belligerents’ Choices After Civil War. Princeton,NJ: Princeton University Press.
Fortna, Virginia Page and Lisa Morje Howard. 2008. “Pitfalls and Prospects in the Peacekeeping Literature.”Annual Review of Political Science 11(283-301).
Gambetta, Diego. 2009. Codes of the Underworld. Princeton, NJ: Princeton University Press.
Gerber, Alan S. and Donald P. Green. 2012. Field Experiments: Design, Analysis, and Interpretation. NewYork: W.W. Norton.
Ghobarah, Hazem Adam, Paul Huth and Bruce Russett. 2003. “Civil Wars Kill and Maim People-Longafter the Shooting Stops.” American Political Science Review 97(2):189–202.
Hafner-Burton, Emilie M. 2008. “Sticks and Stones: Naming and Shaming the Human Rights EnforcementProblem.” International Organization 62:689–716.
Hafner-Burton, Emilie M. 2012. “International Regimes for Human Rights.” Annual Review of PoliticalScience 15:265–286.
36
Hafner-Burton, Emilie M. 2014. “A Social Science of Human Rights.” Journal of Peace Research 51(2):273–286.
Hazlett, Chad. 2013. “Angry or Weary? The effect of physical violence on attitudes towards peace inDarfur.” UCLA Manuscript .
Hendrix, Cullen S. and Wendy H. Wong. 2012. “When Is the Pen Truly Might? Regime Type and theEfficacy of Naming and Shaming in Curbing Human Rights Abuses.” British Journal of Political Science43:651–672.
Hill, Daniel W, Will H Moore and Bumba Mukherjee. 2013. “Information Politics Versus OrganizationalIncentives: When Are Amnesty International’s “Naming and Shaming”Reports Biased? 1.” InternationalStudies Quarterly 57(2):219–232.
Ho, Daniel E, Kosuke Imai, Gary King and Elizabeth A Stuart. 2007. “Matching as Nonparametric Prepro-cessing for Reducing Model Dependence in Parametric Causal Inference.” Political Analysis 15(3):199–236.
Humphreys, Macartan and Jeremy M. Weinstein. 2006. “Handling and Manhandling Civilians in Civil War.”American Political Science Review 100(3):429–447.
Hyde, Susan. 2010. “The Future of Field Experiments in International Relations.” The ANNALS of theAmerican Academy of Political and Social Science 628:72–84.
Hyde, Susan. 2011. The Pseudo-Democrat’s Dilemma: Why Election Observation Became an InternationalNorm. New York: Cornell University Press.
Inchino, Nahomi and Matthias Schundeln. 2012. “Deterring or Displacing Electoral Irregularities? SpilloverEffects of Observers in a Randomized Field Experiment in Ghana.” The Journal of Politics 74(1):292–307.
Jo, Hyeran and Beth A Simmons. 2014. “Can the International Criminal Court Deter Atrocity?” Availableat SSRN 2552820 .
Keck, Margaret E. and Kathryn Sikkink. 1998. Activists without Borders. New York: Cornell UniversityPress.
Kuperman, Alan J. 2008. “The Moral Hazard of Humanitarian Intervention: Lessons from the Balkans.”International Studies Quarterly 52:49–80.
Kydd, Andrew H. 2010. “Rationalist Approaches to Conflict Prevention and Resolution.” Annual Review ofPolitical Science 13:101–121.
Kydd, Andrew H. and Scott Strauss. 2013. “The Road to Hell? Third-Party Intervention to PreventAtrocities.” American Journal of Political Science Forthcoming.
Lanz, David. 2009. “Save Darfur: a movement in its discontents.” African Affairs 108(433):669–677.
Levitt, Steven D. and Thomas J. Miles. 2006. “Economic Contributions to the Understanding of Crime.”Annual Review of Law and Social Sciences 2:147–164.
Maggi, Giovanni. 1999. “The Role of Multilateral Institutions in International Trade Cooperation.” AmericanEconomic Review 89(1):190–214.
Mamdani, Mahmood. 2009. Saviors and Survivors: Dafur, Politics and the War on Terror. New York:Doubleday.
Mansfield, Edward D and Jack Snyder. 2002. “Democratic transitions, institutional strength, and war.”International Organization 56(02):297–337.
Martin, Lisa L. 1992. “Interests, Power, and Multilateralism.” International Organization 46(04):765–792.
37
McCarthy, Bill. 2002. “New Economics of Sociological Criminology.” Annual Review of Sociology 28:417–442.
Murdie, Amanda and David R. Davis. 2012. “Shaming and Blaming: Using Events Data to Assess theImpact of Human Rights INGOs.” International Studies Quarterly 56(1):TBA.
Nagin, Daniel S. 2013. “Deterrence: A Review of the Evidence by a Criminologist for Economists.” AnnualReview of Economics Forthcoming.
Powell, Robert. 2002. “Bargaining theory and international conflict.” Annural Review of Political Science5:1–30.
Prunier, Gerard. 2008. Darfur: A 21st Century Genocide. New York: Cornell University Press.
Rise, Thomas, Stephen C. Ropp and Eds Kathryn Sikkink. 1999. The Power of Human Rights: InternationalNorms and Domestic Change. Cambridge, UK: Cambridge Univeristy Press.
Rubin, Donald B. 1974. “Estimating Causal Effects of Treatments in Randomized and NonrandomizedStudies.” Journal of Educational Psychology 66(5):688–701.
Sekhon, Jasjeet S. 2009. “Opiates for the Matches: Matching Methods for Causal Inference.” Annual Reviewof Political Science 12(1):487–508.
Sikkink, Kathryn. 2011. The Justice Cascade: How Human Rights Prosecutions Are Changing World Politics.New York: W.W. Norton & Company.
Sisk, Timothy D. 2009. International Mediation in Civil Wars: Bargaining with Bullets. New York, NY:Routledge.
Snyder, Jack and Leslie Vinjamuri. 2006. “Trials and errors: principle and pragmatism in strategies ofinternational justice.”.
Strom, Stephanie and Lydia Polgreen. 2007. “Darfur Advocacy Group Undergoes a Shake-Up.” New YorkTimes 2.
Stuart, Elizabeth A. 2010. “Matching Methods for Causal Inference: A Review and a Look Forward.”Statistical Science 25(1):1–21.
Toft, Monica. 2005. The Geography of Ethnic Violence: Identity, Interests and the Indivisibility of Territory.Princeton, NJ: Princeton University Press.
Valentino, Benjamin. 2014. “Why We Kill: The Political Science of Political Violence against Civilians.”Annual Review of Political Science 17:89–103.
Valentino, Benjamin, Paul Huth and Dylan Balch-Lindsay. 2004. “‘Draining the Sea’: Mass Killing andGuerrilla Warfare.” International Organization 58(1):375–407.
Walters, Barbara. 2002. Committing to Peace: The Successful Settlement of Civil Wars. Princeton, NJ:Princeton University Press.
Weinstein, Jeremy M. 2006. Inside Rebellion: The Politics of Insurgent Violence. New York: CambridgeUniversity Press.
Wood, Reed M, Jacob D. Kathman and Stephen E Gent. 2012. “Armed intervention and civilian victimiza-tion in intrastate conflicts.” Journal of Peace Research 29(5):647–660.
38
Appendices
A Pre-Treatment Data
Table 6 sources the data used for matching; figure 8 visualizes time invariant pre-treatment
data, excluding violence, in Darfur used in the matching process.
Table 6: Matching Variables Source
Variable Source
Violence State Department HIU DatasetWater International Steering Committee for Global MappingLocation Global Administrative Areas DatabaseRoad Network International Steering Committee for Global MappingAirport International Steering Committee for Global Mapping
Note: This table sources the data used for matching.
39
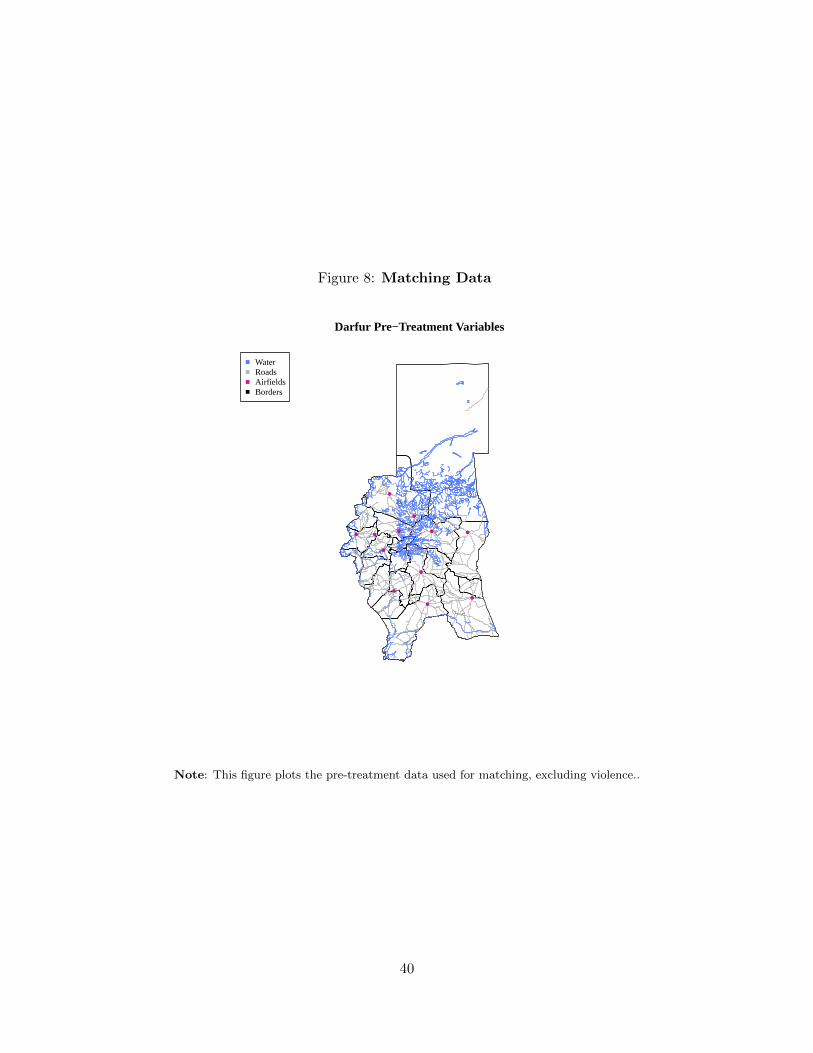
Figure 8: Matching Data
●
●
●● ●
●
●
●
● ●
●
●
Darfur Pre−Treatment Variables
WaterRoadsAirfieldsBorders
Note: This figure plots the pre-treatment data used for matching, excluding violence..
40
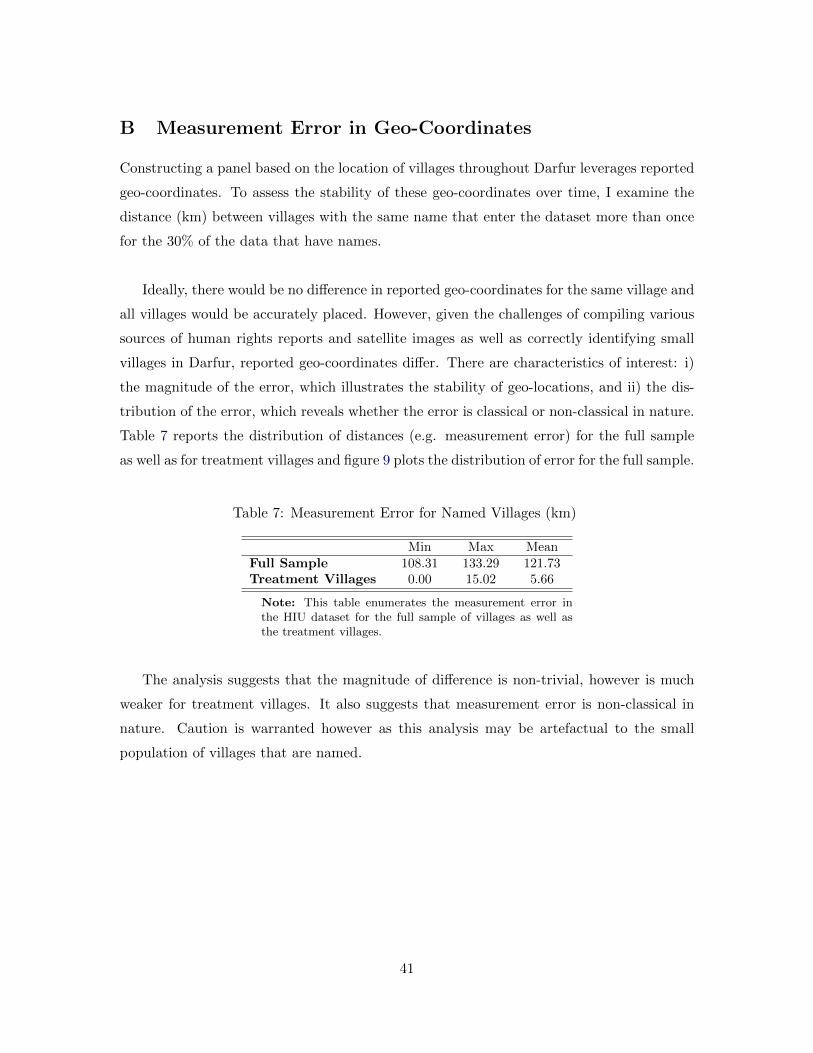
B Measurement Error in Geo-Coordinates
Constructing a panel based on the location of villages throughout Darfur leverages reported
geo-coordinates. To assess the stability of these geo-coordinates over time, I examine the
distance (km) between villages with the same name that enter the dataset more than once
for the 30% of the data that have names.
Ideally, there would be no difference in reported geo-coordinates for the same village and
all villages would be accurately placed. However, given the challenges of compiling various
sources of human rights reports and satellite images as well as correctly identifying small
villages in Darfur, reported geo-coordinates differ. There are characteristics of interest: i)
the magnitude of the error, which illustrates the stability of geo-locations, and ii) the dis-
tribution of the error, which reveals whether the error is classical or non-classical in nature.
Table 7 reports the distribution of distances (e.g. measurement error) for the full sample
as well as for treatment villages and figure 9 plots the distribution of error for the full sample.
Table 7: Measurement Error for Named Villages (km)
Min Max MeanFull Sample 108.31 133.29 121.73Treatment Villages 0.00 15.02 5.66
Note: This table enumerates the measurement error inthe HIU dataset for the full sample of villages as well asthe treatment villages.
The analysis suggests that the magnitude of difference is non-trivial, however is much
weaker for treatment villages. It also suggests that measurement error is non-classical in
nature. Caution is warranted however as this analysis may be artefactual to the small
population of villages that are named.
41
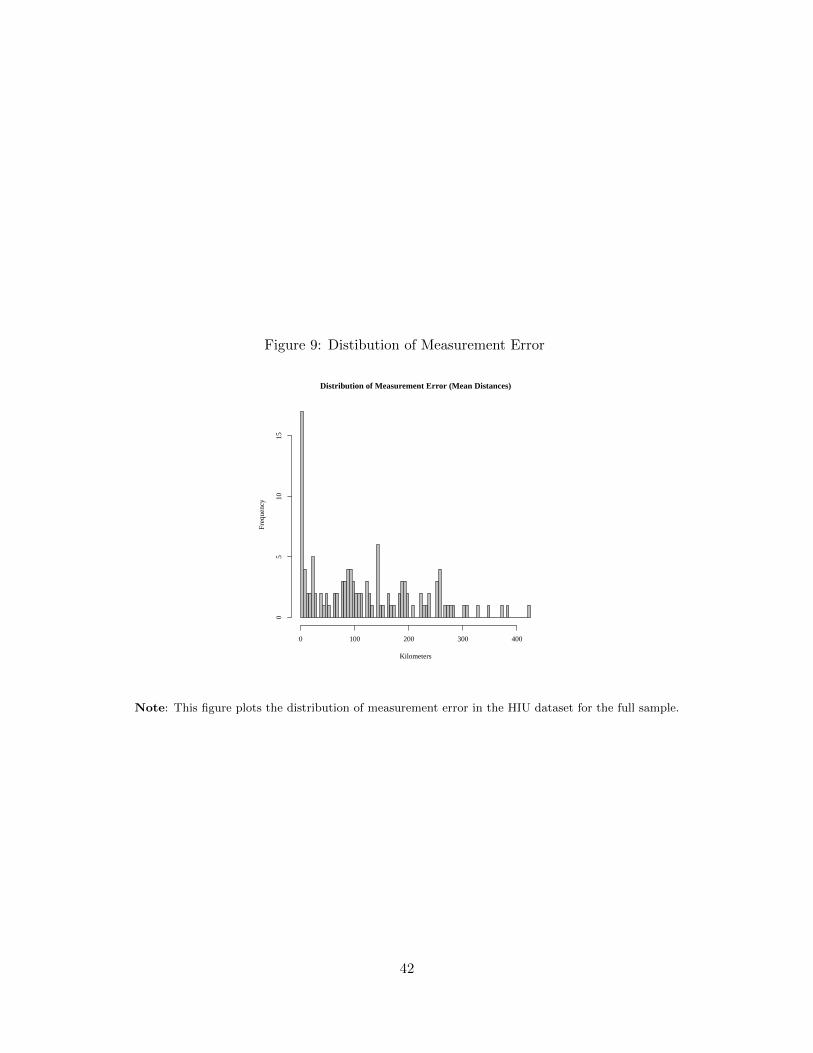
Figure 9: Distibution of Measurement Error
Distribution of Measurement Error (Mean Distances)
Kilometers
Fre
quen
cy
0 100 200 300 400
05
1015
Note: This figure plots the distribution of measurement error in the HIU dataset for the full sample.
42
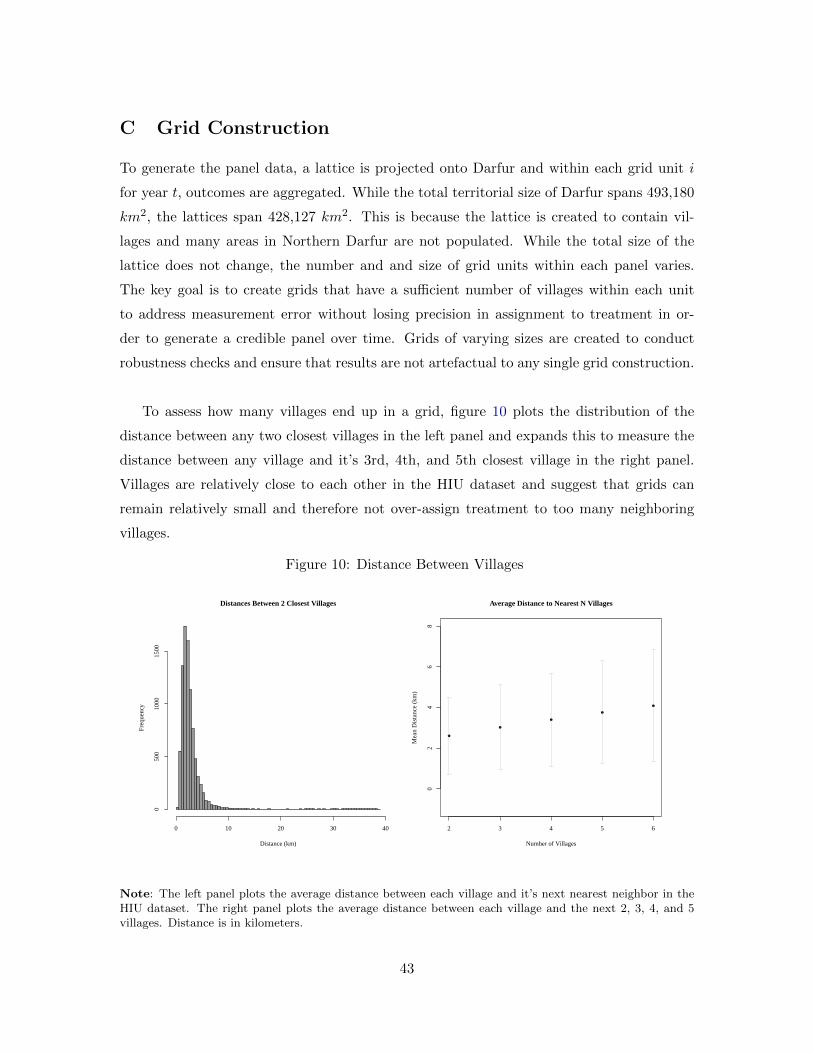
C Grid Construction
To generate the panel data, a lattice is projected onto Darfur and within each grid unit i
for year t, outcomes are aggregated. While the total territorial size of Darfur spans 493,180
km2, the lattices span 428,127 km2. This is because the lattice is created to contain vil-
lages and many areas in Northern Darfur are not populated. While the total size of the
lattice does not change, the number and and size of grid units within each panel varies.
The key goal is to create grids that have a sufficient number of villages within each unit
to address measurement error without losing precision in assignment to treatment in or-
der to generate a credible panel over time. Grids of varying sizes are created to conduct
robustness checks and ensure that results are not artefactual to any single grid construction.
To assess how many villages end up in a grid, figure 10 plots the distribution of the
distance between any two closest villages in the left panel and expands this to measure the
distance between any village and it’s 3rd, 4th, and 5th closest village in the right panel.
Villages are relatively close to each other in the HIU dataset and suggest that grids can
remain relatively small and therefore not over-assign treatment to too many neighboring
villages.
Figure 10: Distance Between Villages
Distances Between 2 Closest Villages
Distance (km)
Fre
quen
cy
0 10 20 30 40
050
010
0015
00
2 3 4 5 6
02
46
8
Average Distance to Nearest N Villages
Number of Villages
Mea
n D
ista
nce
(km
)
●
●
●
●
●
Note: The left panel plots the average distance between each village and it’s next nearest neighbor in theHIU dataset. The right panel plots the average distance between each village and the next 2, 3, 4, and 5villages. Distance is in kilometers.
43
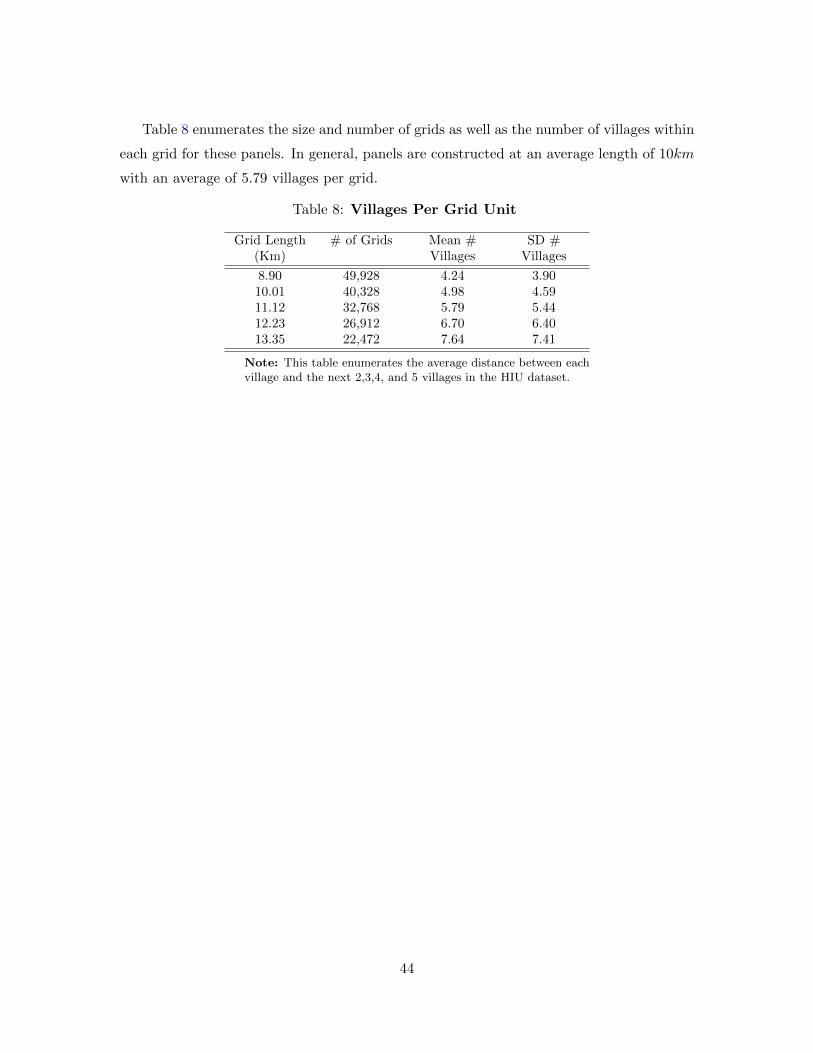
Table 8 enumerates the size and number of grids as well as the number of villages within
each grid for these panels. In general, panels are constructed at an average length of 10km
with an average of 5.79 villages per grid.
Table 8: Villages Per Grid Unit
Grid Length(Km)
# of Grids Mean #Villages
SD #Villages
8.90 49,928 4.24 3.9010.01 40,328 4.98 4.5911.12 32,768 5.79 5.4412.23 26,912 6.70 6.4013.35 22,472 7.64 7.41
Note: This table enumerates the average distance between eachvillage and the next 2,3,4, and 5 villages in the HIU dataset.
44