Embed Size (px)
Citation preview
in La Llorona Park at Picacho Bridgein Las Cruces, New Mexico
Monitoring Dog Waste
Monitoring Dog Waste in La Llorona Park at Picacho Bridge in Las Cruces, New Mexico
May 2012
Brian Hanson, Watershed Coordinator 319(h) Grant, Paso del Norte Watershed CouncilNew Mexico Department of Agriculture, 1620 Standley Drive, MSC APR/P.O. Box 30005,
New Mexico State University, Las Cruces 88003-8005
This document is the author’s conclusions and does not reflect the opinion of the New Mexico Department of Agriculture.

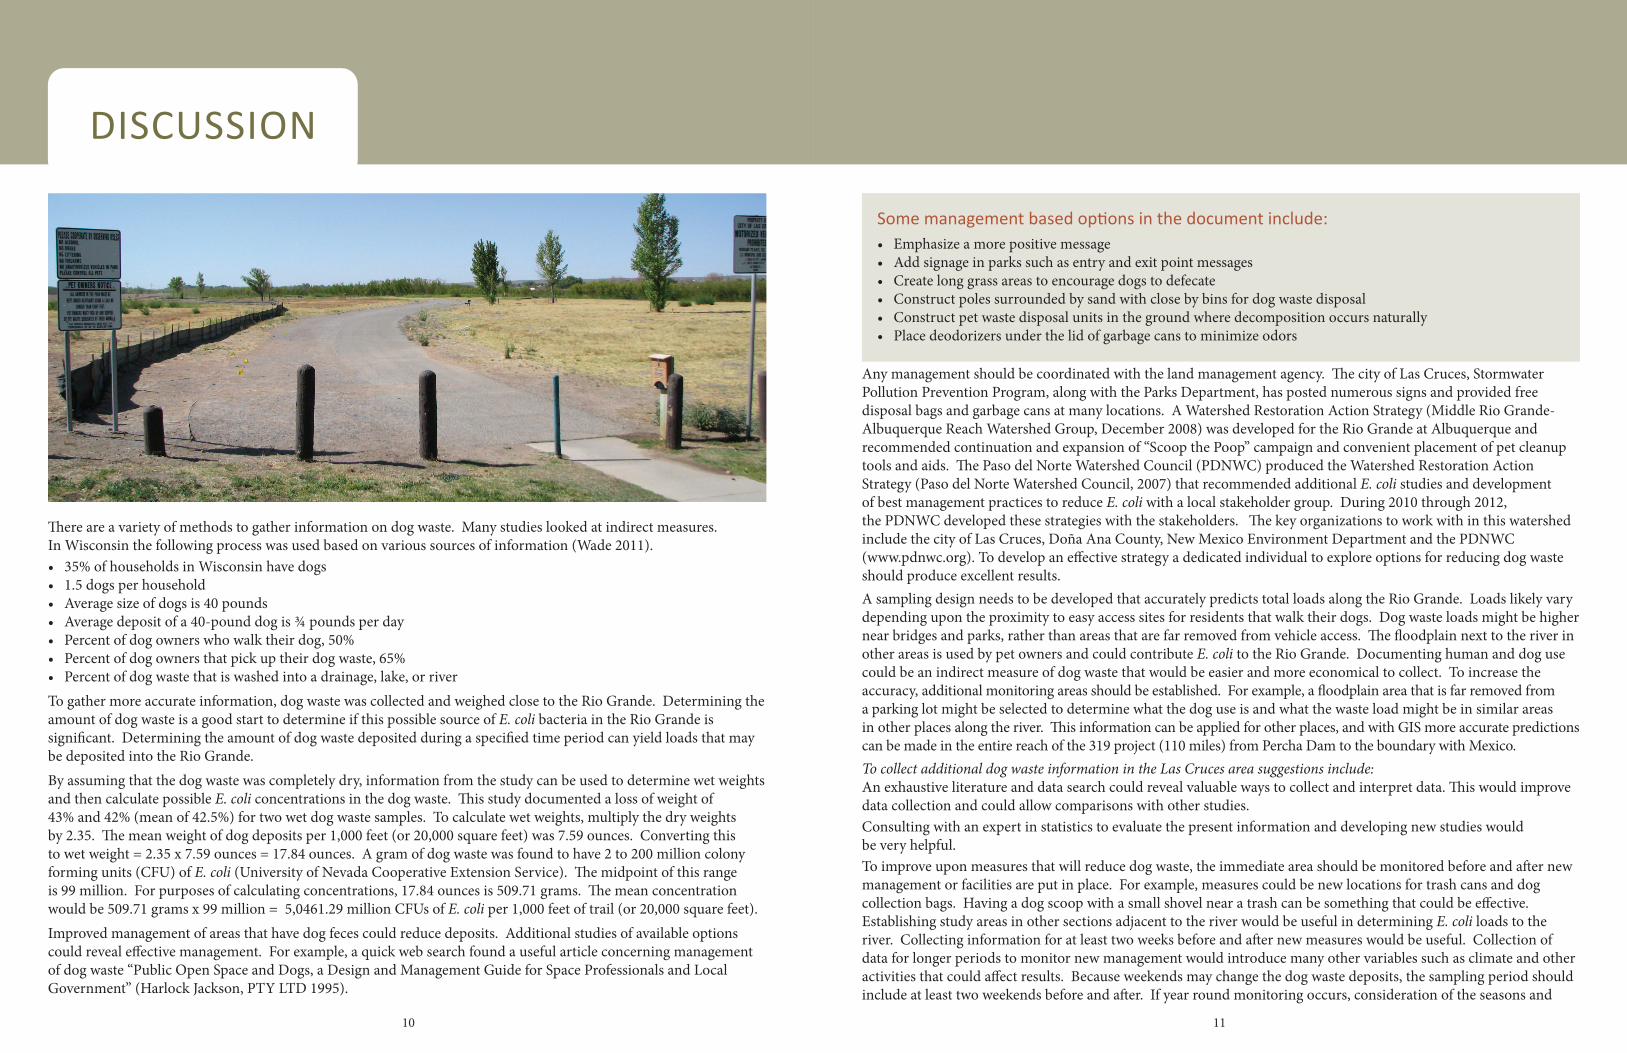
Monitoring dog waste in La Llorona Park at Picacho Bridge To determine the amount of dog waste close to the Rio Grande, the location and weight of dog waste was documented May 24, 2011 to December 12, 2011, on a walking trail south of Highway 70 bridge over the Rio Grande in Las Cruces. (Figure 1). The lower 110 miles of the Rio Grande in New Mexico exceeds state water quality standards for Escherichia coli (E. coli) bacteria. E. coli is present in dog waste and could be contributing to E. coli concentrations in the river. This study can be used to calculate E. coli loads from dogs to the river and improve management so that dog waste is reduced.The study area was next to a walkway along the Rio Grande and dog waste was collected in a 10 foot wide area on both sides of an asphalt path for a length of 2,300 feet. The dry weight of dog waste (in units of 1,000 feet length or 20,000 square feet) ranged from 0.00 to 23.00 ounces per 1,000 feet of trail per day with a mean of 7.59 ounces per 1,000 feet. Most deposits were between 200 and 500 feet, south of the park, (40 sites), 31% of all the sites. Placing a trash can and waste dog dispenser bags at 350 feet would make it easier for a dog owner to dispose of their dog waste. The west side area had the highest weights of 51.55 ounces total compared to 14.50 ounces total for the east side (5 sampling trips August 12 to December 12). There could be many reasons for this, but the primary reasons could be because it is a grassy area and is on the right side of the path as a dog owner walks south from La Llorona Park. Posting of signs and waste bag dispensers may be more effective if they are on the west side of the path. Individual dog waste deposits less than 0.50 ounces accounted for 74% of the total individual weights. This could indicate that some owners of small dogs may not be picking up after their dog. Informing these owners may help reduce dog waste. There are many management options that would reduce dog waste (see the Discussion section). Having a dedicated individual to address this issue would be an effective tool in reducing dog waste.Dog waste takes about 89 hours to dry and it loses 42.5% of its weight according to this study (sample size of 2). This can be used to calculate wet weight and then calculate E. coli loads since the literature has information pertaining to wet weights. Taking the mean weight of dog waste for a 1,000 feet x 20 feet area (7.59 ounces dry weight) and a concentration of E. coli of 99 million colony forming units (CFUs) per gram of waste, the number of E. coli could be 5,0461 million E. coli CFUs per 1,000 feet of trail or 20,000 square feet (see the Discussion section). The manner of E. coli in dog feces entering the river could be direct deposit in the water from a dog, waste that is moved into the river from extreme rainfall or runoff events, people putting the waste in the river, or dog waste on shoes of individuals that enter the water. To document and predict E. coli loading to the river for the 110 miles of the lower Rio Grande (the area of E. coli exceedence in the Rio Grande), dog waste studies in other parts of the floodplain would help predict possible loading and GIS would be useful.Concerning the study area, the strip of willows next to the river and the grass in the study area would likely prevent most dog waste from washing into the river. Because of the climate, the E. coli is likely to succumb to high temperatures, drying, and ultraviolet light. The vegetation would prevent the movement of dog waste to the river during rainfall events. If other areas along the banks of the river could be vegetated, then it is likely that less dog waste would enter the river.There are a number of factors that could influence the density of dog waste along the river and the movement to the river (see Discussion Section). To collect additional dog waste information in the Las Cruces area, suggestions include an exhaustive literature and data search; statistical analyses; monitoring of new management measures; verbal and written surveys of residents; studies of the concentrations of E. coli in dog waste; study of the concentration and survival of E. coli in dog waste in the Rio Grande; and studies of the mortality rates caused by drying, ultraviolet light, and temperature.
ABStRACt
Figure 1: Dog Waste Study Area along the Rio Grande in Las Cruces.
1
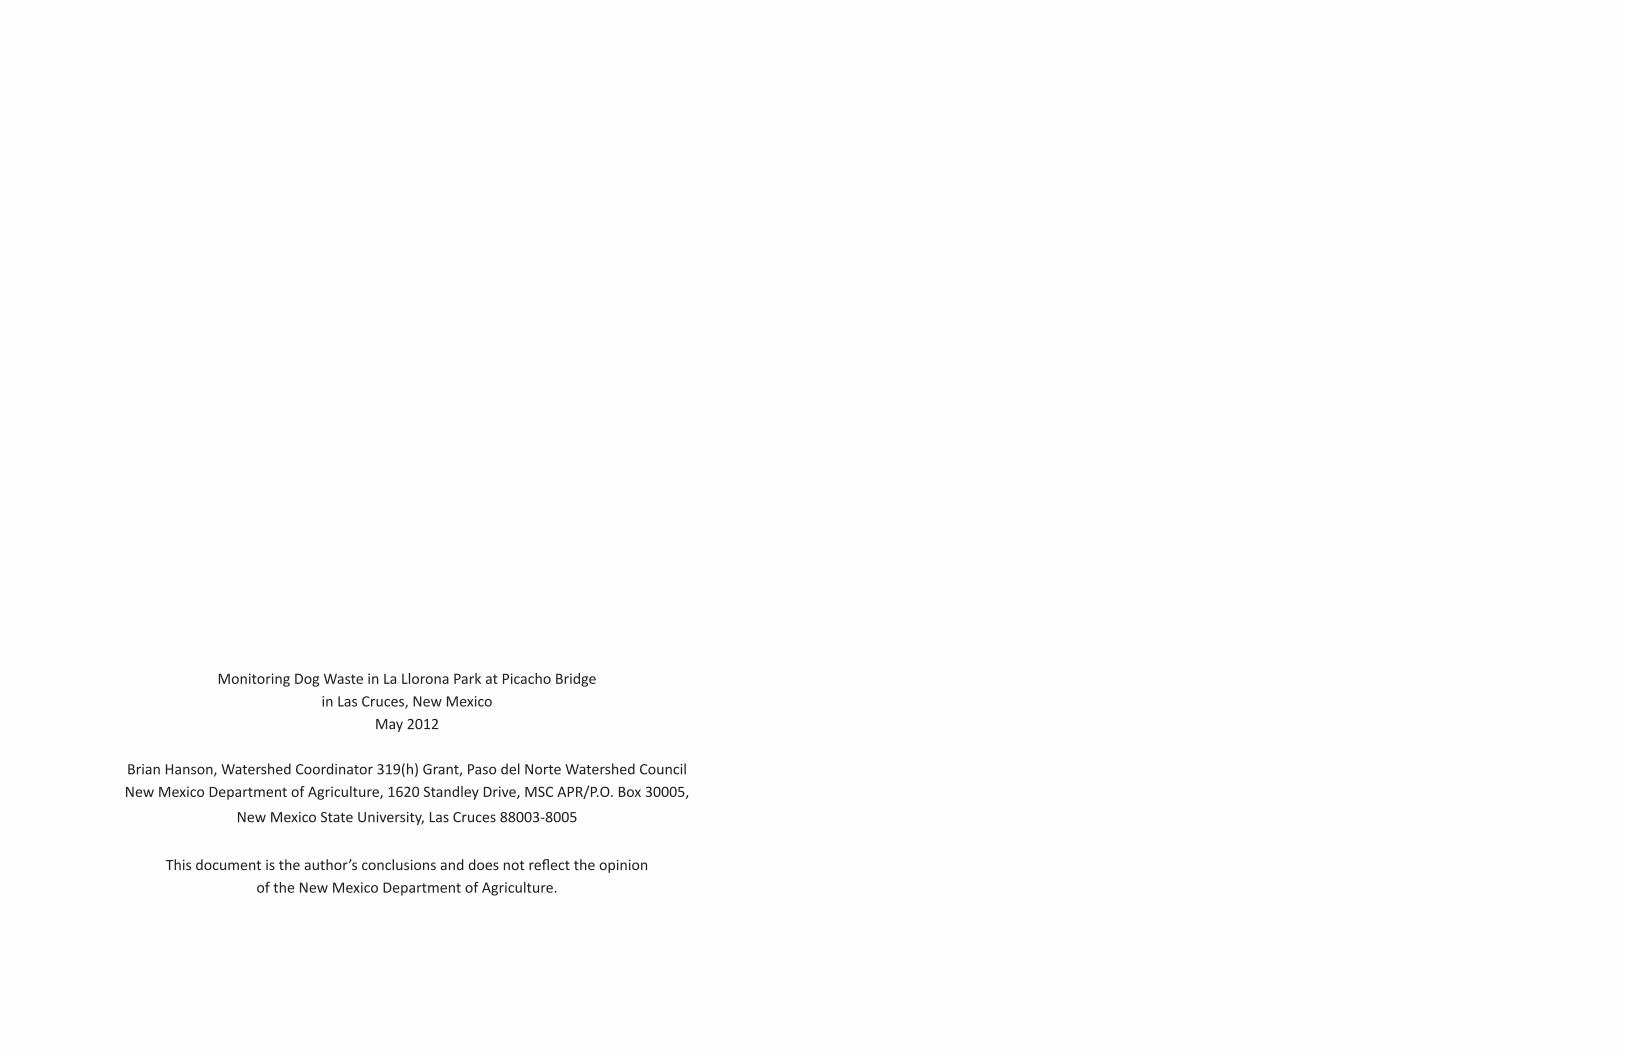
An intensive surface water quality study in the lower Rio Grande by the New Mexico Environment Department (NMED) in 2004 found that the water was impaired for E. coli bacteria. The stretch of the Rio Grande in southern New Mexico was from the international Mexico boundary upstream to Percha Dam. The watershed that contributes to the Rio Grande includes 2,292 square miles (Boykin, Ken and Propeck-Gray, Suzanne, 2007). One of the possible sources for bacteria impairment in the Lower Rio Grande is waste from dogs. (NMED, 2007). Other locations have documented that dog waste can be a source for E. coli contamination. During a microbial source tracking study in the Middle Rio Grande in Albuquerque, the study found 21.9% of the fecal coliform in the Rio Grande were from canines (Parsons Water and Infrastructure, October 2005). Another study in the Tualatin Sub basin in Oregon found canines were responsible for 13% of the E. coli identified (Clean Water Services). A single gram (.035 ounces) of dog waste can have 23 million fecal coliform bacteria (Texas Watershed Steward Online Training 2011, tws.tamu.edu/ online-course). Another study in Nevada found an average of 50 million colony forming units (CFU) in 1 gram of feces with a range of 2 million to 200 million CFUs (University of Nevada Cooperative Extension Fact Sheet).Dog waste could be a contributor to E. coli in the Rio Grande. Because of the presence of dog waste on the hiking trail south of La Llorona Park and the close proximity to the Rio Grande, dog deposits were studied in 2011. The overall goal for this study was to document the presence of dog waste and use the data to determine management that would reduce dog waste.
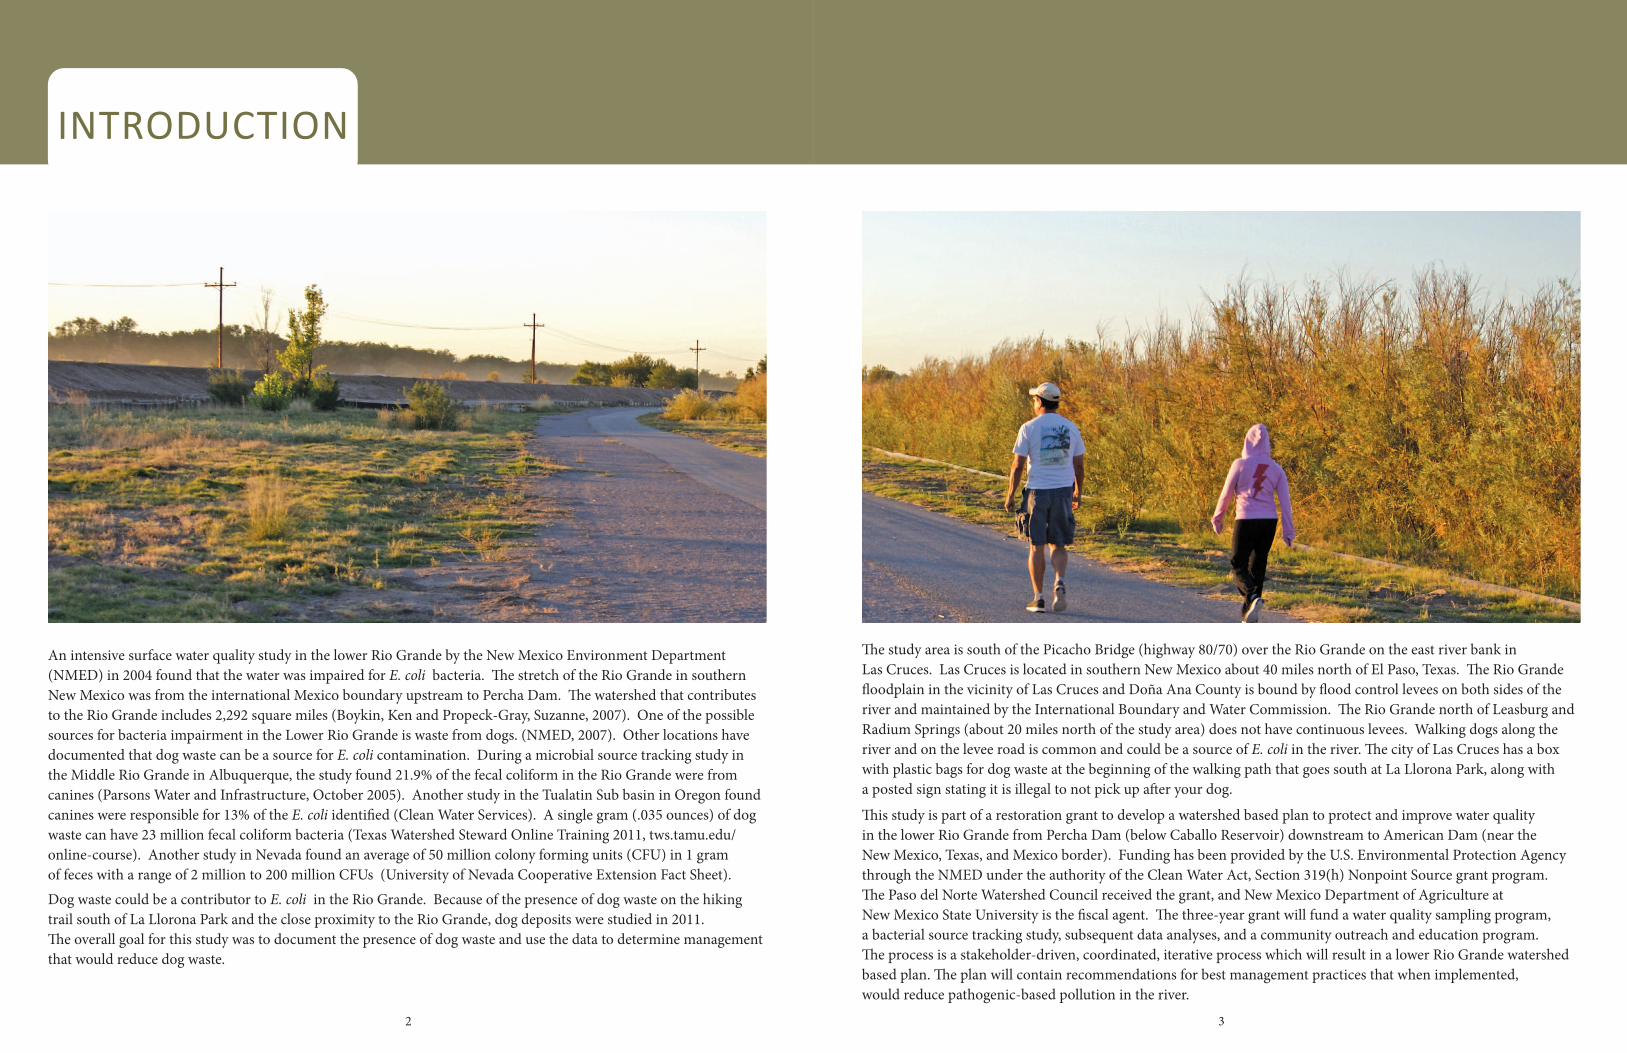
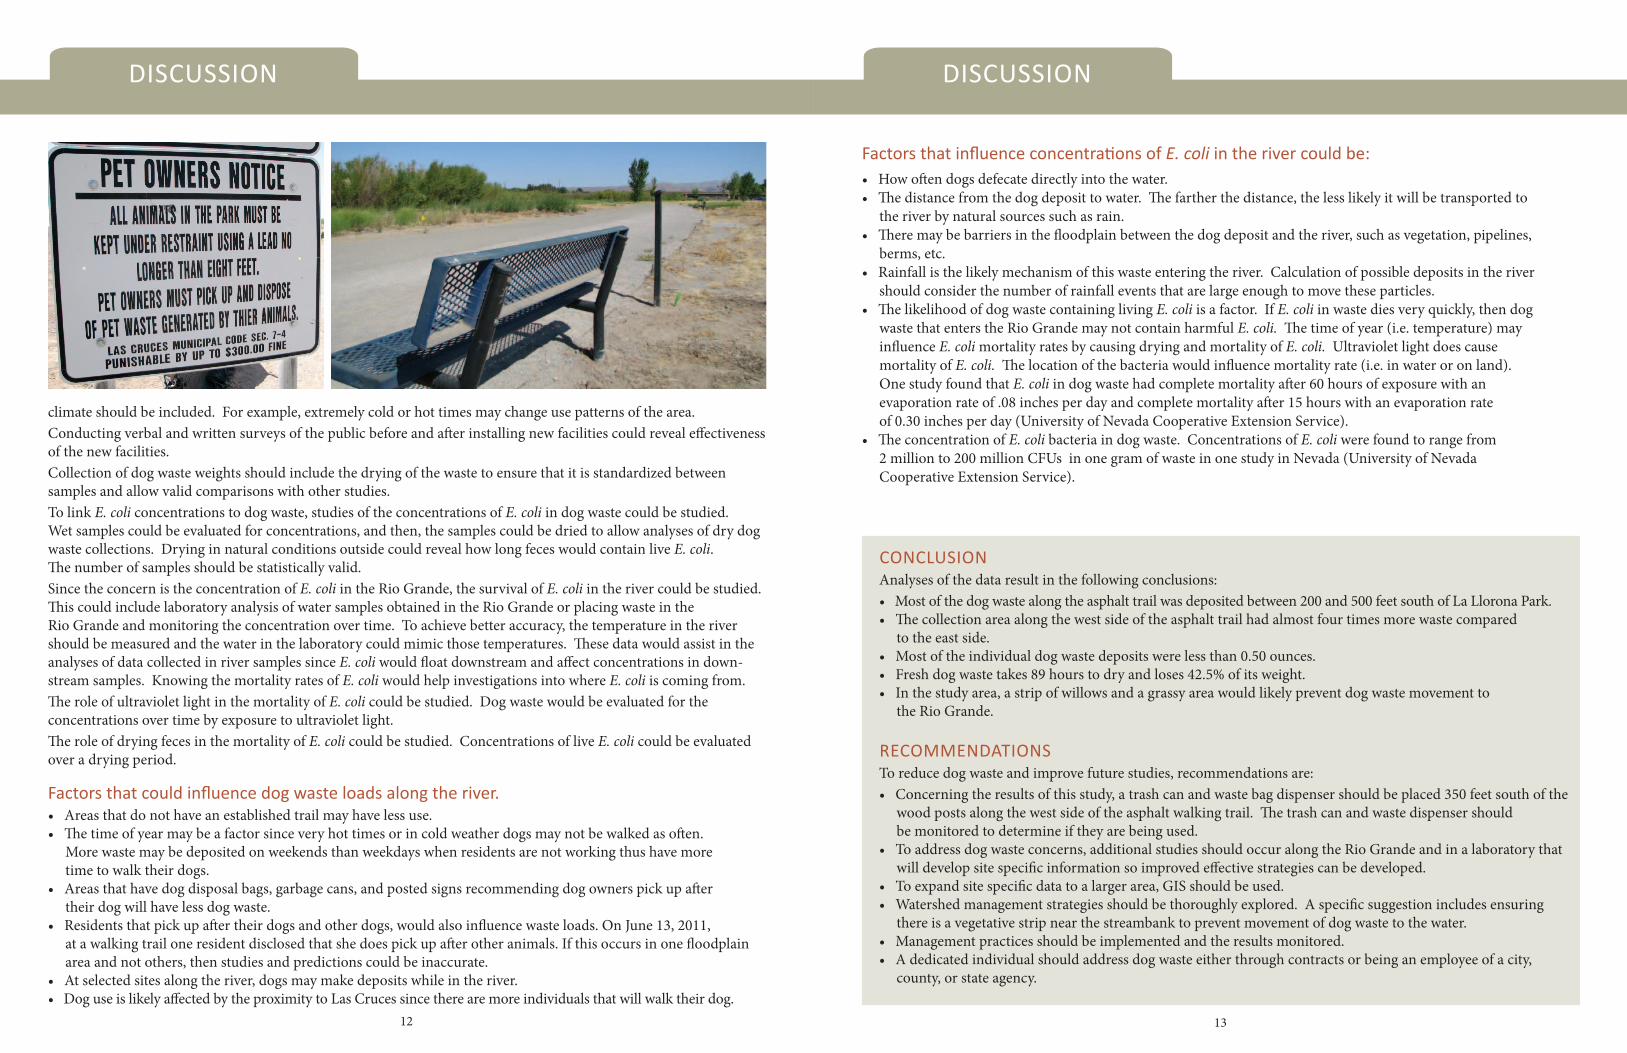
The study area is south of the Picacho Bridge (highway 80/70) over the Rio Grande on the east river bank in Las Cruces. Las Cruces is located in southern New Mexico about 40 miles north of El Paso, Texas. The Rio Grande floodplain in the vicinity of Las Cruces and Doña Ana County is bound by flood control levees on both sides of the river and maintained by the International Boundary and Water Commission. The Rio Grande north of Leasburg and Radium Springs (about 20 miles north of the study area) does not have continuous levees. Walking dogs along the river and on the levee road is common and could be a source of E. coli in the river. The city of Las Cruces has a box with plastic bags for dog waste at the beginning of the walking path that goes south at La Llorona Park, along with a posted sign stating it is illegal to not pick up after your dog.
This study is part of a restoration grant to develop a watershed based plan to protect and improve water quality in the lower Rio Grande from Percha Dam (below Caballo Reservoir) downstream to American Dam (near the New Mexico, Texas, and Mexico border). Funding has been provided by the U.S. Environmental Protection Agency through the NMED under the authority of the Clean Water Act, Section 319(h) Nonpoint Source grant program. The Paso del Norte Watershed Council received the grant, and New Mexico Department of Agriculture at New Mexico State University is the fiscal agent. The three-year grant will fund a water quality sampling program, a bacterial source tracking study, subsequent data analyses, and a community outreach and education program. The process is a stakeholder-driven, coordinated, iterative process which will result in a lower Rio Grande watershed based plan. The plan will contain recommendations for best management practices that when implemented, would reduce pathogenic-based pollution in the river.
INtRODUCtION
2 3

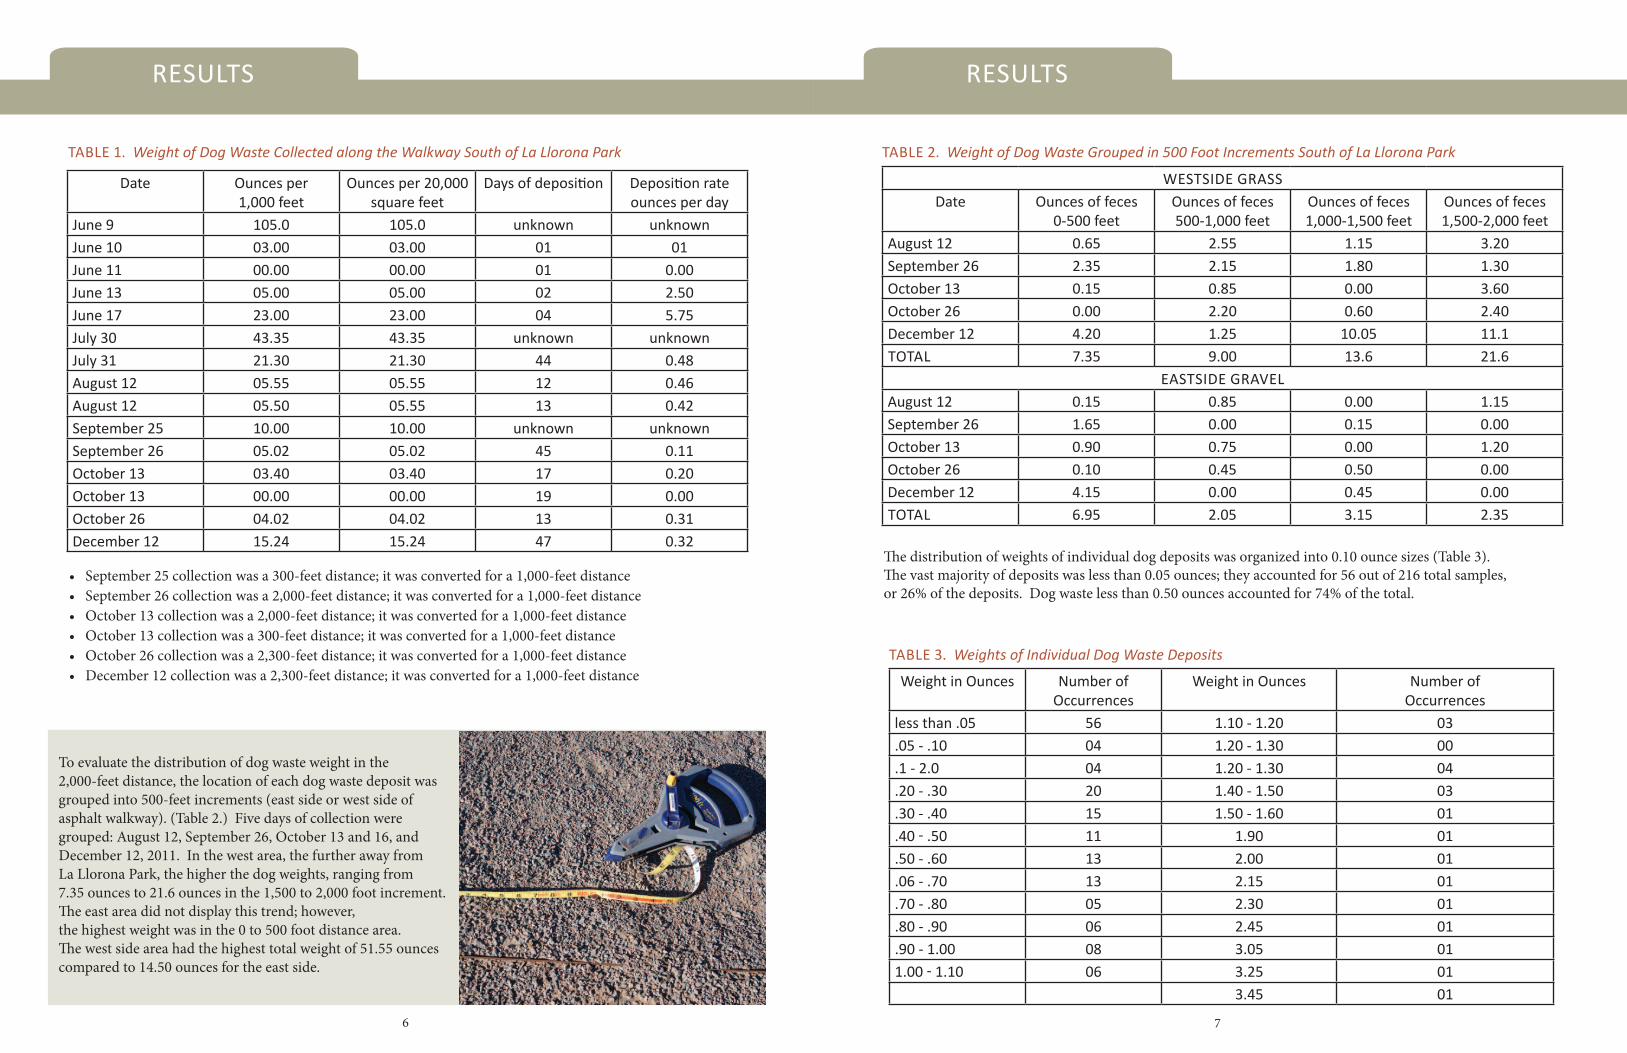
ReSULtSAll data pertaining to collections and measurements are displayed in Appendix A. The data is presented in English measurement units so that it is easier for everyone to understand the results. The weight of the dog waste is considered to be dry weight since air temperatures were very high and the air was very dry. The weight of dog waste was collected in an area 20 feet wide and 1,000 feet long and ranged from a low of 0 ounces per 1,000 feet to a high of 105 ounces per 1,000 feet (Table 1). The highest weights occurred during the days when dog waste was collected for the first time. The dog waste could have accumulated for many months, and it is likely the majority of the dog waste did not have viable E. coli. Therefore, it would be more accurate to exclude those dates. For the rest of the data, the range was 0.00 to 23.00 ounces per 1,000 feet. The mean of the data set was 7.59 ounces. The deposition rate (ounces per day) was calculated and ranged from 0.00 ounces per day to a high of 5.75 ounces per day. The mean of the data set was 1.13 ounces per day.
A quick summary of each day’s work follows:YeAR 2011May 24 Marked 100 dog waste locations with yellow flags along asphalt trail south of La Llorona Park, 0 to 993 feet south of vehicle barrier (no weights, no collections)June 9 Collected dog waste deposits in 0 to 1,000 feet south of La Llorona Park in a 10 foot width on both sides of the asphalt trail; marked 100 foot increments, no site locations for each dog deposit; do not know when deposits were made.June 10 Collected dog waste deposits in 0 to 1,000 feet south.June 11 Collected dog waste deposits in 0 to 1,000 feet south.June 13 Collected dog waste deposits in 0 to 1,000 feet south.June 17 Collected dog waste deposits in 0 to 1,000 feet south.July 30 Collected dog waste deposits in 1,000 feet to 2,000 feet south; documented the distance south for each location; do not know when deposits were made; did not collect individual weights.July 31 Collected dog waste deposits in 0 to 1,000 feet south; recorded individual weights.August 12 Collected dog waste deposits in 0 to 2,000 feet south.September 24 Established new area 2,000 to 2,300 feet south; did not collect dog waste; added new pins and replaced pins at 100 foot increments where they had been removed.September 25 Collected dog waste deposits in 2,000 to 2,300 feet south.September 26 Collected dog waste deposits in 0 to 2,000 feet south.October 13 Collected dog waste deposits in 0 to 2,300 feet south.October 16 Collected dog waste deposits in 0 to 2,300 feet south.December 12 Collected dog waste deposits in 0 to 2,300 feet south.
Brian Hanson conducted this study from May 24, 2011 to December 12, 2011. The study began by documenting dog waste with yellow flags (a 21-inch-tall wire with a yellow plastic flag (4.5 inches by 4 inches)) and taking photographs to document the problem visually. On June 9 the study area was established by collecting dog waste in the first 1,000 feet south of the wood barriers on the south side of La Llorana Park. The location of each dog waste pile was documented by the distance south of the beginning with a 100 foot tape. The area was further expanded to 2,000 feet on July 31 and another 300 feet was added September 24. Since this study involved dog waste, individuals handling the waste wore latex gloves and washed their hands and equipment with a Clorox spray after each study period.The study area was marked every 100 feet with a pin on both sides of the asphalt trail. Dog waste was collected in a 10 foot area on both sides of the asphalt walkway. The 10 foot sample area on the east side of the walkway was easily identified by a metal strip that kept the fine sand in place. The western 10 foot sample area adjacent to the asphalt was mostly short-cut grass. If there was a question about the location of a dog waste pile in the sample area, the distance was measured to ensure it was within 10 feet. This particular area was chosen because it was close to the Rio Grande and because of the presence of dog waste. It was easily accessible because of the parking lot.Dog waste was collected with a scoop with a handle 37 inches long (scoop measured 6.5 inches wide, 6.5 inches deep, and 2 inches high) made for dogs. The waste was placed in a paper bag (11 inches tall x 5 inches x 3 inches) in a 3-gallon plastic bucket. Weights were taken from a Berkley digital fish scale with a 50-pound capacity and a 1-ounce resolution digital readout (June 10 to June 17 samples) and a more precise balance, Dymo digital postal scale, M3 with a .05-ounce resolution. Dog waste was discarded in waste containers onsite.To document the distance of the trail from the bank of the Rio Grande, the distance was measured every 100 feet for the length of 2,300 feet.To provide information about the drying time for dog waste, waste from two dogs was weighed until the waste dried and stabilized at the lowest level. The waste was outside exposed to natural conditions in direct sunlight. The dogs included an 80 pound golden retriever (Murphy) and a 50-pound goldendoodle (Teddi). The study was conducted in Albuquerque October 17 and continued in Las Cruces until October 21. Air temperature and humidity were collected at the same time. The dog waste along the trail was dry weight. To calculate possible E. coli loads in the dog waste along the trail, the dry weights can be converted to wet weights by using this information.
MAteRIALS & MetHODS
4 5
ReSULtS
Date Ounces per 1,000 feet
Ounces per 20,000 square feet
Days of deposition Deposition rate ounces per day
June 9 105.0 105.0 unknown unknownJune 10 03.00 03.00 01 01June 11 00.00 00.00 01 0.00June 13 05.00 05.00 02 2.50June 17 23.00 23.00 04 5.75July 30 43.35 43.35 unknown unknownJuly 31 21.30 21.30 44 0.48August 12 05.55 05.55 12 0.46August 12 05.50 05.55 13 0.42September 25 10.00 10.00 unknown unknownSeptember 26 05.02 05.02 45 0.11October 13 03.40 03.40 17 0.20October 13 00.00 00.00 19 0.00October 26 04.02 04.02 13 0.31December 12 15.24 15.24 47 0.32
To evaluate the distribution of dog waste weight in the 2,000-feet distance, the location of each dog waste deposit was grouped into 500-feet increments (east side or west side of asphalt walkway). (Table 2.) Five days of collection were grouped: August 12, September 26, October 13 and 16, and December 12, 2011. In the west area, the further away from La Llorona Park, the higher the dog weights, ranging from 7.35 ounces to 21.6 ounces in the 1,500 to 2,000 foot increment. The east area did not display this trend; however, the highest weight was in the 0 to 500 foot distance area. The west side area had the highest total weight of 51.55 ounces compared to 14.50 ounces for the east side.
tABLe 1. Weight of Dog Waste Collected along the Walkway South of La Llorona Park
• September 25 collection was a 300-feet distance; it was converted for a 1,000-feet distance• September 26 collection was a 2,000-feet distance; it was converted for a 1,000-feet distance• October 13 collection was a 2,000-feet distance; it was converted for a 1,000-feet distance• October 13 collection was a 300-feet distance; it was converted for a 1,000-feet distance• October 26 collection was a 2,300-feet distance; it was converted for a 1,000-feet distance• December 12 collection was a 2,300-feet distance; it was converted for a 1,000-feet distance
WeStSIDe GRASSDate Ounces of feces
0-500 feetOunces of feces500-1,000 feet
Ounces of feces1,000-1,500 feet
Ounces of feces1,500-2,000 feet
August 12 0.65 2.55 1.15 3.20September 26 2.35 2.15 1.80 1.30October 13 0.15 0.85 0.00 3.60October 26 0.00 2.20 0.60 2.40December 12 4.20 1.25 10.05 11.1tOtAL 7.35 9.00 13.6 21.6
eAStSIDe GRAveLAugust 12 0.15 0.85 0.00 1.15September 26 1.65 0.00 0.15 0.00October 13 0.90 0.75 0.00 1.20October 26 0.10 0.45 0.50 0.00December 12 4.15 0.00 0.45 0.00tOtAL 6.95 2.05 3.15 2.35
Weight in Ounces Number of Occurrences
Weight in Ounces Number of Occurrences
less than .05 56 1.10 - 1.20 03.05 - .10 04 1.20 - 1.30 00.1 - 2.0 04 1.20 - 1.30 04.20 - .30 20 1.40 - 1.50 03.30 - .40 15 1.50 - 1.60 01.40 - .50 11 1.90 01.50 - .60 13 2.00 01.06 - .70 13 2.15 01.70 - .80 05 2.30 01.80 - .90 06 2.45 01.90 - 1.00 08 3.05 011.00 - 1.10 06 3.25 01
3.45 01
The distribution of weights of individual dog deposits was organized into 0.10 ounce sizes (Table 3). The vast majority of deposits was less than 0.05 ounces; they accounted for 56 out of 216 total samples, or 26% of the deposits. Dog waste less than 0.50 ounces accounted for 74% of the total.
tABLe 2. Weight of Dog Waste Grouped in 500 Foot Increments South of La Llorona Park
tABLe 3. Weights of Individual Dog Waste Deposits
ReSULtS ReSULtS
6 7
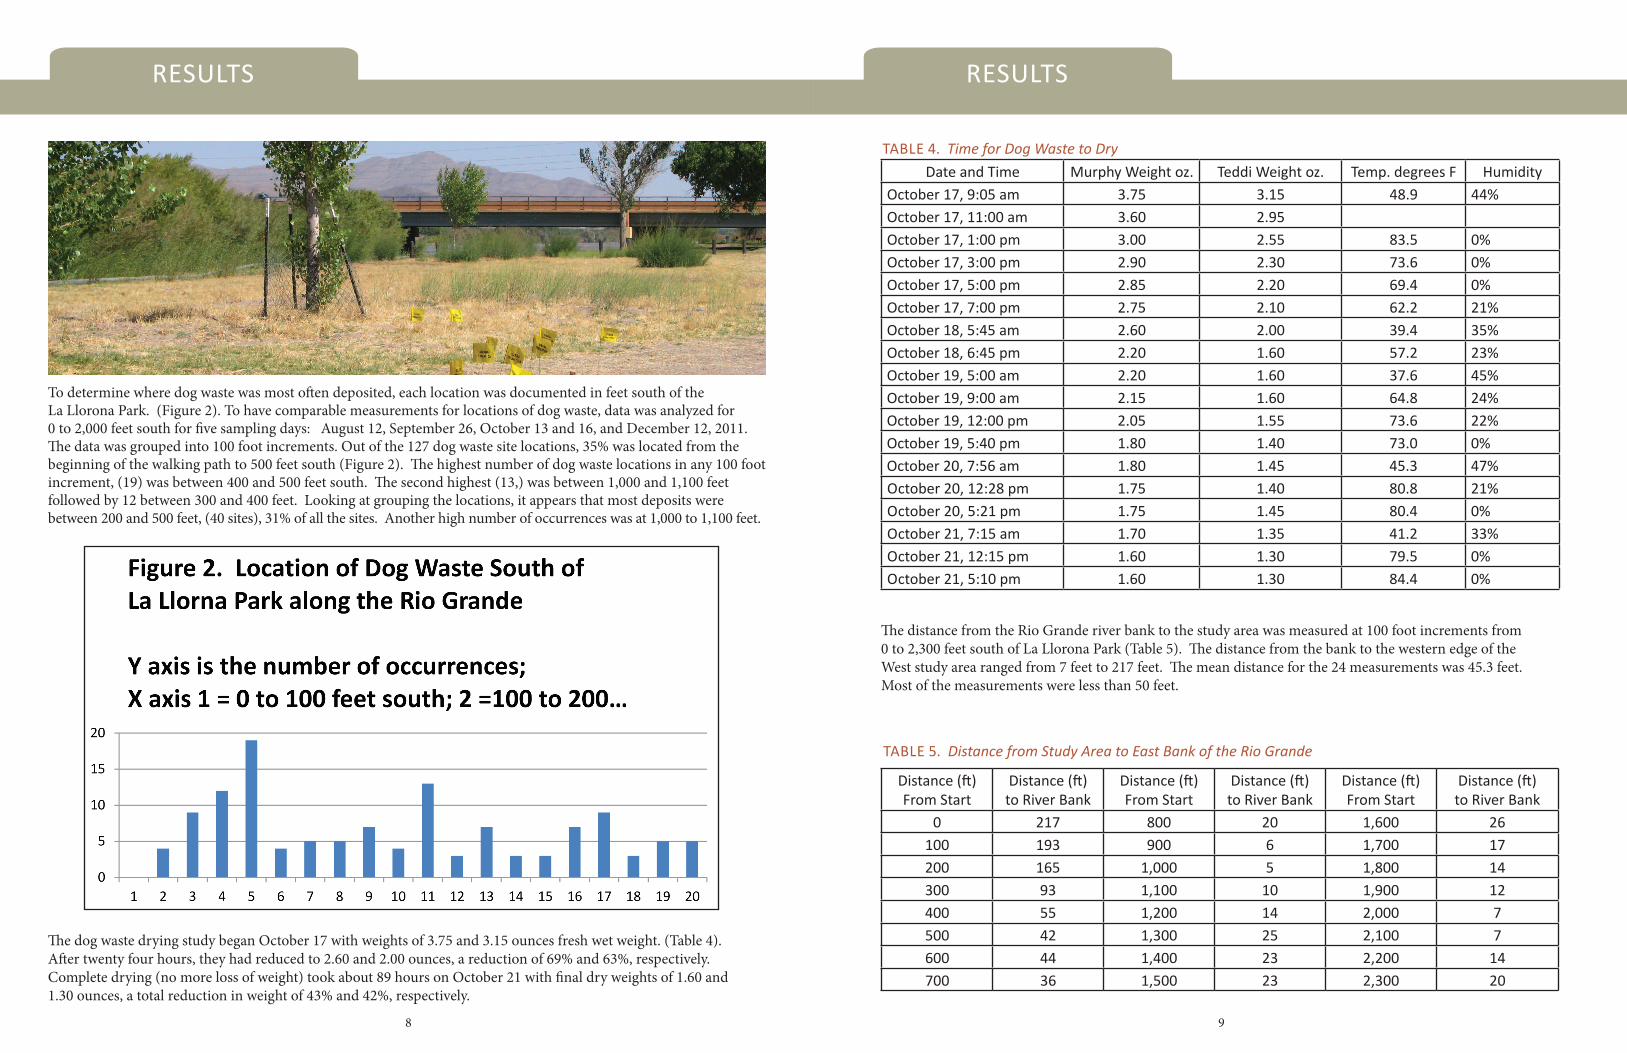
To determine where dog waste was most often deposited, each location was documented in feet south of the La Llorona Park. (Figure 2). To have comparable measurements for locations of dog waste, data was analyzed for 0 to 2,000 feet south for five sampling days: August 12, September 26, October 13 and 16, and December 12, 2011. The data was grouped into 100 foot increments. Out of the 127 dog waste site locations, 35% was located from the beginning of the walking path to 500 feet south (Figure 2). The highest number of dog waste locations in any 100 foot increment, (19) was between 400 and 500 feet south. The second highest (13,) was between 1,000 and 1,100 feet followed by 12 between 300 and 400 feet. Looking at grouping the locations, it appears that most deposits were between 200 and 500 feet, (40 sites), 31% of all the sites. Another high number of occurrences was at 1,000 to 1,100 feet.
The dog waste drying study began October 17 with weights of 3.75 and 3.15 ounces fresh wet weight. (Table 4). After twenty four hours, they had reduced to 2.60 and 2.00 ounces, a reduction of 69% and 63%, respectively. Complete drying (no more loss of weight) took about 89 hours on October 21 with final dry weights of 1.60 and 1.30 ounces, a total reduction in weight of 43% and 42%, respectively.
Date and time Murphy Weight oz. teddi Weight oz. temp. degrees F HumidityOctober 17, 9:05 am 3.75 3.15 48.9 44%October 17, 11:00 am 3.60 2.95October 17, 1:00 pm 3.00 2.55 83.5 0%October 17, 3:00 pm 2.90 2.30 73.6 0%October 17, 5:00 pm 2.85 2.20 69.4 0%October 17, 7:00 pm 2.75 2.10 62.2 21%October 18, 5:45 am 2.60 2.00 39.4 35%October 18, 6:45 pm 2.20 1.60 57.2 23%October 19, 5:00 am 2.20 1.60 37.6 45%October 19, 9:00 am 2.15 1.60 64.8 24%October 19, 12:00 pm 2.05 1.55 73.6 22%October 19, 5:40 pm 1.80 1.40 73.0 0%October 20, 7:56 am 1.80 1.45 45.3 47%October 20, 12:28 pm 1.75 1.40 80.8 21%October 20, 5:21 pm 1.75 1.45 80.4 0%October 21, 7:15 am 1.70 1.35 41.2 33%October 21, 12:15 pm 1.60 1.30 79.5 0%October 21, 5:10 pm 1.60 1.30 84.4 0%
Distance (ft) From Start
Distance (ft) to River Bank
Distance (ft) From Start
Distance (ft) to River Bank
Distance (ft) From Start
Distance (ft) to River Bank
0 217 800 20 1,600 26100 193 900 6 1,700 17200 165 1,000 5 1,800 14300 93 1,100 10 1,900 12400 55 1,200 14 2,000 7500 42 1,300 25 2,100 7600 44 1,400 23 2,200 14700 36 1,500 23 2,300 20
tABLe 4. Time for Dog Waste to Dry
The distance from the Rio Grande river bank to the study area was measured at 100 foot increments from 0 to 2,300 feet south of La Llorona Park (Table 5). The distance from the bank to the western edge of the West study area ranged from 7 feet to 217 feet. The mean distance for the 24 measurements was 45.3 feet. Most of the measurements were less than 50 feet.
tABLe 5. Distance from Study Area to East Bank of the Rio Grande
ReSULtS ReSULtS
8 9
There are a variety of methods to gather information on dog waste. Many studies looked at indirect measures. In Wisconsin the following process was used based on various sources of information (Wade 2011).• 35% of households in Wisconsin have dogs• 1.5 dogs per household• Average size of dogs is 40 pounds• Average deposit of a 40-pound dog is ¾ pounds per day• Percent of dog owners who walk their dog, 50%• Percent of dog owners that pick up their dog waste, 65%• Percent of dog waste that is washed into a drainage, lake, or riverTo gather more accurate information, dog waste was collected and weighed close to the Rio Grande. Determining the amount of dog waste is a good start to determine if this possible source of E. coli bacteria in the Rio Grande is significant. Determining the amount of dog waste deposited during a specified time period can yield loads that may be deposited into the Rio Grande.By assuming that the dog waste was completely dry, information from the study can be used to determine wet weights and then calculate possible E. coli concentrations in the dog waste. This study documented a loss of weight of 43% and 42% (mean of 42.5%) for two wet dog waste samples. To calculate wet weights, multiply the dry weights by 2.35. The mean weight of dog deposits per 1,000 feet (or 20,000 square feet) was 7.59 ounces. Converting this to wet weight = 2.35 x 7.59 ounces = 17.84 ounces. A gram of dog waste was found to have 2 to 200 million colony forming units (CFU) of E. coli (University of Nevada Cooperative Extension Service). The midpoint of this range is 99 million. For purposes of calculating concentrations, 17.84 ounces is 509.71 grams. The mean concentration would be 509.71 grams x 99 million = 5,0461.29 million CFUs of E. coli per 1,000 feet of trail (or 20,000 square feet).Improved management of areas that have dog feces could reduce deposits. Additional studies of available options could reveal effective management. For example, a quick web search found a useful article concerning management of dog waste “Public Open Space and Dogs, a Design and Management Guide for Space Professionals and Local Government” (Harlock Jackson, PTY LTD 1995).
Any management should be coordinated with the land management agency. The city of Las Cruces, Stormwater Pollution Prevention Program, along with the Parks Department, has posted numerous signs and provided free disposal bags and garbage cans at many locations. A Watershed Restoration Action Strategy (Middle Rio Grande- Albuquerque Reach Watershed Group, December 2008) was developed for the Rio Grande at Albuquerque and recommended continuation and expansion of “Scoop the Poop” campaign and convenient placement of pet cleanup tools and aids. The Paso del Norte Watershed Council (PDNWC) produced the Watershed Restoration Action Strategy (Paso del Norte Watershed Council, 2007) that recommended additional E. coli studies and development of best management practices to reduce E. coli with a local stakeholder group. During 2010 through 2012, the PDNWC developed these strategies with the stakeholders. The key organizations to work with in this watershed include the city of Las Cruces, Doña Ana County, New Mexico Environment Department and the PDNWC (www.pdnwc.org). To develop an effective strategy a dedicated individual to explore options for reducing dog waste should produce excellent results.A sampling design needs to be developed that accurately predicts total loads along the Rio Grande. Loads likely vary depending upon the proximity to easy access sites for residents that walk their dogs. Dog waste loads might be higher near bridges and parks, rather than areas that are far removed from vehicle access. The floodplain next to the river in other areas is used by pet owners and could contribute E. coli to the Rio Grande. Documenting human and dog use could be an indirect measure of dog waste that would be easier and more economical to collect. To increase the accuracy, additional monitoring areas should be established. For example, a floodplain area that is far removed from a parking lot might be selected to determine what the dog use is and what the waste load might be in similar areas in other places along the river. This information can be applied for other places, and with GIS more accurate predictions can be made in the entire reach of the 319 project (110 miles) from Percha Dam to the boundary with Mexico.To collect additional dog waste information in the Las Cruces area suggestions include:An exhaustive literature and data search could reveal valuable ways to collect and interpret data. This would improve data collection and could allow comparisons with other studies.Consulting with an expert in statistics to evaluate the present information and developing new studies would be very helpful.To improve upon measures that will reduce dog waste, the immediate area should be monitored before and after new management or facilities are put in place. For example, measures could be new locations for trash cans and dog collection bags. Having a dog scoop with a small shovel near a trash can be something that could be effective. Establishing study areas in other sections adjacent to the river would be useful in determining E. coli loads to the river. Collecting information for at least two weeks before and after new measures would be useful. Collection of data for longer periods to monitor new management would introduce many other variables such as climate and other activities that could affect results. Because weekends may change the dog waste deposits, the sampling period should include at least two weekends before and after. If year round monitoring occurs, consideration of the seasons and
Some management based options in the document include:• Emphasize a more positive message• Add signage in parks such as entry and exit point messages• Create long grass areas to encourage dogs to defecate• Construct poles surrounded by sand with close by bins for dog waste disposal• Construct pet waste disposal units in the ground where decomposition occurs naturally• Place deodorizers under the lid of garbage cans to minimize odors
DISCUSSION
10 11
Factors that influence concentrations of E. coli in the river could be: • How often dogs defecate directly into the water.• The distance from the dog deposit to water. The farther the distance, the less likely it will be transported to the river by natural sources such as rain.• There may be barriers in the floodplain between the dog deposit and the river, such as vegetation, pipelines, berms, etc. • Rainfall is the likely mechanism of this waste entering the river. Calculation of possible deposits in the river should consider the number of rainfall events that are large enough to move these particles. • The likelihood of dog waste containing living E. coli is a factor. If E. coli in waste dies very quickly, then dog waste that enters the Rio Grande may not contain harmful E. coli. The time of year (i.e. temperature) may influence E. coli mortality rates by causing drying and mortality of E. coli. Ultraviolet light does cause mortality of E. coli. The location of the bacteria would influence mortality rate (i.e. in water or on land). One study found that E. coli in dog waste had complete mortality after 60 hours of exposure with an evaporation rate of .08 inches per day and complete mortality after 15 hours with an evaporation rate of 0.30 inches per day (University of Nevada Cooperative Extension Service).• The concentration of E. coli bacteria in dog waste. Concentrations of E. coli were found to range from 2 million to 200 million CFUs in one gram of waste in one study in Nevada (University of Nevada Cooperative Extension Service).
climate should be included. For example, extremely cold or hot times may change use patterns of the area.Conducting verbal and written surveys of the public before and after installing new facilities could reveal effectiveness of the new facilities.Collection of dog waste weights should include the drying of the waste to ensure that it is standardized between samples and allow valid comparisons with other studies.To link E. coli concentrations to dog waste, studies of the concentrations of E. coli in dog waste could be studied. Wet samples could be evaluated for concentrations, and then, the samples could be dried to allow analyses of dry dog waste collections. Drying in natural conditions outside could reveal how long feces would contain live E. coli. The number of samples should be statistically valid.Since the concern is the concentration of E. coli in the Rio Grande, the survival of E. coli in the river could be studied. This could include laboratory analysis of water samples obtained in the Rio Grande or placing waste in the Rio Grande and monitoring the concentration over time. To achieve better accuracy, the temperature in the river should be measured and the water in the laboratory could mimic those temperatures. These data would assist in the analyses of data collected in river samples since E. coli would float downstream and affect concentrations in down-stream samples. Knowing the mortality rates of E. coli would help investigations into where E. coli is coming from. The role of ultraviolet light in the mortality of E. coli could be studied. Dog waste would be evaluated for the concentrations over time by exposure to ultraviolet light.The role of drying feces in the mortality of E. coli could be studied. Concentrations of live E. coli could be evaluated over a drying period.
Factors that could influence dog waste loads along the river.• Areas that do not have an established trail may have less use. • The time of year may be a factor since very hot times or in cold weather dogs may not be walked as often. More waste may be deposited on weekends than weekdays when residents are not working thus have more time to walk their dogs.• Areas that have dog disposal bags, garbage cans, and posted signs recommending dog owners pick up after their dog will have less dog waste. • Residents that pick up after their dogs and other dogs, would also influence waste loads. On June 13, 2011, at a walking trail one resident disclosed that she does pick up after other animals. If this occurs in one floodplain area and not others, then studies and predictions could be inaccurate. • At selected sites along the river, dogs may make deposits while in the river. • Dog use is likely affected by the proximity to Las Cruces since there are more individuals that will walk their dog.
CONCLUSIONAnalyses of the data result in the following conclusions:• Most of the dog waste along the asphalt trail was deposited between 200 and 500 feet south of La Llorona Park.• The collection area along the west side of the asphalt trail had almost four times more waste compared to the east side.• Most of the individual dog waste deposits were less than 0.50 ounces.• Fresh dog waste takes 89 hours to dry and loses 42.5% of its weight.• In the study area, a strip of willows and a grassy area would likely prevent dog waste movement to the Rio Grande.
ReCOMMeNDAtIONSTo reduce dog waste and improve future studies, recommendations are:• Concerning the results of this study, a trash can and waste bag dispenser should be placed 350 feet south of the wood posts along the west side of the asphalt walking trail. The trash can and waste dispenser should be monitored to determine if they are being used. • To address dog waste concerns, additional studies should occur along the Rio Grande and in a laboratory that will develop site specific information so improved effective strategies can be developed. • To expand site specific data to a larger area, GIS should be used. • Watershed management strategies should be thoroughly explored. A specific suggestion includes ensuring there is a vegetative strip near the streambank to prevent movement of dog waste to the water.• Management practices should be implemented and the results monitored.• A dedicated individual should address dog waste either through contracts or being an employee of a city, county, or state agency.
DISCUSSION DISCUSSION
12 13
West of Asphalt Path 10 feet wide
West of Asphalt Path east of Asphalt Path 10 feet wide
east of Asphalt Path
Distance (ft) south of wood posts at park
Weight of dog waste (ounces)
Distance (ft) south of wood posts at park
weight of dog waste (ounces)
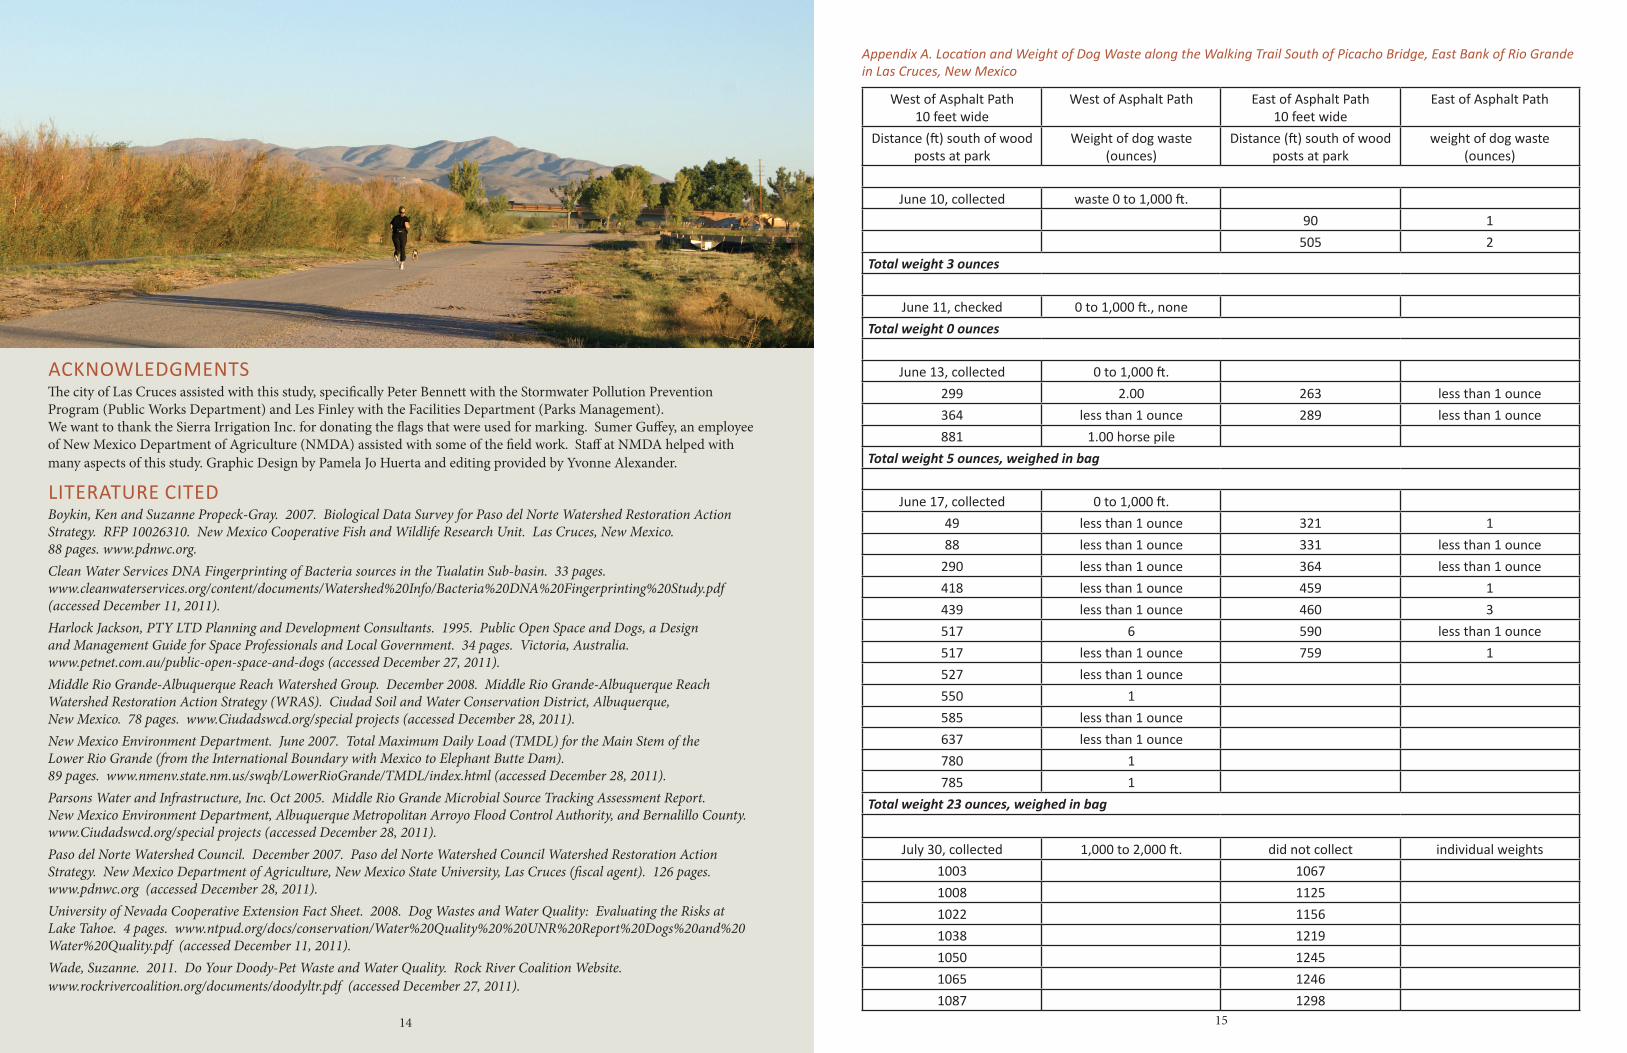
June 10, collected waste 0 to 1,000 ft.90 1
505 2Total weight 3 ounces
June 11, checked 0 to 1,000 ft., noneTotal weight 0 ounces
June 13, collected 0 to 1,000 ft.299 2.00 263 less than 1 ounce364 less than 1 ounce 289 less than 1 ounce881 1.00 horse pile
Total weight 5 ounces, weighed in bag
June 17, collected 0 to 1,000 ft.49 less than 1 ounce 321 188 less than 1 ounce 331 less than 1 ounce
290 less than 1 ounce 364 less than 1 ounce418 less than 1 ounce 459 1439 less than 1 ounce 460 3517 6 590 less than 1 ounce517 less than 1 ounce 759 1527 less than 1 ounce550 1585 less than 1 ounce637 less than 1 ounce780 1785 1
Total weight 23 ounces, weighed in bag
July 30, collected 1,000 to 2,000 ft. did not collect individual weights1003 10671008 11251022 11561038 12191050 12451065 12461087 1298
ACkNOWLeDGMeNtSThe city of Las Cruces assisted with this study, specifically Peter Bennett with the Stormwater Pollution Prevention Program (Public Works Department) and Les Finley with the Facilities Department (Parks Management). We want to thank the Sierra Irrigation Inc. for donating the flags that were used for marking. Sumer Guffey, an employee of New Mexico Department of Agriculture (NMDA) assisted with some of the field work. Staff at NMDA helped with many aspects of this study. Graphic Design by Pamela Jo Huerta and editing provided by Yvonne Alexander.
LIteRAtURe CIteDBoykin, Ken and Suzanne Propeck-Gray. 2007. Biological Data Survey for Paso del Norte Watershed Restoration Action Strategy. RFP 10026310. New Mexico Cooperative Fish and Wildlife Research Unit. Las Cruces, New Mexico. 88 pages. www.pdnwc.org.Clean Water Services DNA Fingerprinting of Bacteria sources in the Tualatin Sub-basin. 33 pages. www.cleanwaterservices.org/content/documents/Watershed%20Info/Bacteria%20DNA%20Fingerprinting%20Study.pdf (accessed December 11, 2011).Harlock Jackson, PTY LTD Planning and Development Consultants. 1995. Public Open Space and Dogs, a Design and Management Guide for Space Professionals and Local Government. 34 pages. Victoria, Australia. www.petnet.com.au/public-open-space-and-dogs (accessed December 27, 2011).Middle Rio Grande-Albuquerque Reach Watershed Group. December 2008. Middle Rio Grande-Albuquerque Reach Watershed Restoration Action Strategy (WRAS). Ciudad Soil and Water Conservation District, Albuquerque, New Mexico. 78 pages. www.Ciudadswcd.org/special projects (accessed December 28, 2011).New Mexico Environment Department. June 2007. Total Maximum Daily Load (TMDL) for the Main Stem of the Lower Rio Grande (from the International Boundary with Mexico to Elephant Butte Dam).89 pages. www.nmenv.state.nm.us/swqb/LowerRioGrande/TMDL/index.html (accessed December 28, 2011).Parsons Water and Infrastructure, Inc. Oct 2005. Middle Rio Grande Microbial Source Tracking Assessment Report. New Mexico Environment Department, Albuquerque Metropolitan Arroyo Flood Control Authority, and Bernalillo County. www.Ciudadswcd.org/special projects (accessed December 28, 2011).Paso del Norte Watershed Council. December 2007. Paso del Norte Watershed Council Watershed Restoration Action Strategy. New Mexico Department of Agriculture, New Mexico State University, Las Cruces (fiscal agent). 126 pages. www.pdnwc.org (accessed December 28, 2011).University of Nevada Cooperative Extension Fact Sheet. 2008. Dog Wastes and Water Quality: Evaluating the Risks at Lake Tahoe. 4 pages. www.ntpud.org/docs/conservation/Water%20Quality%20%20UNR%20Report%20Dogs%20and%20Water%20Quality.pdf (accessed December 11, 2011).Wade, Suzanne. 2011. Do Your Doody-Pet Waste and Water Quality. Rock River Coalition Website. www.rockrivercoalition.org/documents/doodyltr.pdf (accessed December 27, 2011).
Appendix A. Location and Weight of Dog Waste along the Walking Trail South of Picacho Bridge, East Bank of Rio Grande in Las Cruces, New Mexico
14 15

APPeNDIx A PAGe 3West of Asphalt Path
10 feet wideWest of Asphalt Path east of Asphalt Path
10 feet wideeast of Asphalt Path
Distance (ft) South of Wood Posts at Park
Weight of Dog Waste (ounces)
Distance (ft) South of Wood Posts at Park
Weight of Dog Waste (ounces)
July 31 collected 0 to 1,000 feet57 0.10 16 0.2074 0.10 129 0.0086 0.05 131 0.1589 0.20 186 0.0091 0.05 188 0.25136 0.05 197 0.00139 0.85 198 0.15194 0.80 253 0.10200 0.90 306 0.45244 0.00 325 0.25285 0.85 336 0.20301 0.00 367 0.00303 0.00 395 0.15306 0.00 449 0.00336 0.70 452 0.00341 0.10 458 0.00426 1.40 484 0.25432 0.50 525 0.00440 0.00 569 0.00441 0.00 622 0.00444 0.00 638 0.00452 0.00 651 0.10471 0.15 669 0.00499 0.50 674 0.05502 0.00 727 0.00546 0.00 730 0.00574 0.00 757 0.10593 0.45 796 0.00705 0.00 848 0.00732 2.05 850 0.00860 0.65 898 0.25870 0.00 960 0.00900 0.55 964 0.95901 1.05 993 0.55904 0.45908 0.15944 0.15945 1.05948 0.10
APPeNDIx A PAGe 2West of Asphalt Path
10 feet wideWest of Asphalt Path east of Asphalt Path
10 feet wideeast of Asphalt Path
Distance (ft) South of Wood Posts at Park
Weight of Dog Waste (ounces)
Distance (ft) South of Wood Posts at Park
Weight of Dog Waste (ounces)
July 30 continued1087 13021108 13261110 13641126 13711144 13831146 14291204 14391237 15501239 15801247 15991270 16031280 16251315 17091401 17121441 189014571496153115871590159616081630164416561663166817431758175817611789183918471888 a horse deposit was documented at 1376 westside; 4.6 ounces1950 Total weight 43.35 ounces, weighed in bag1953 first time collection in this area1975
16 17
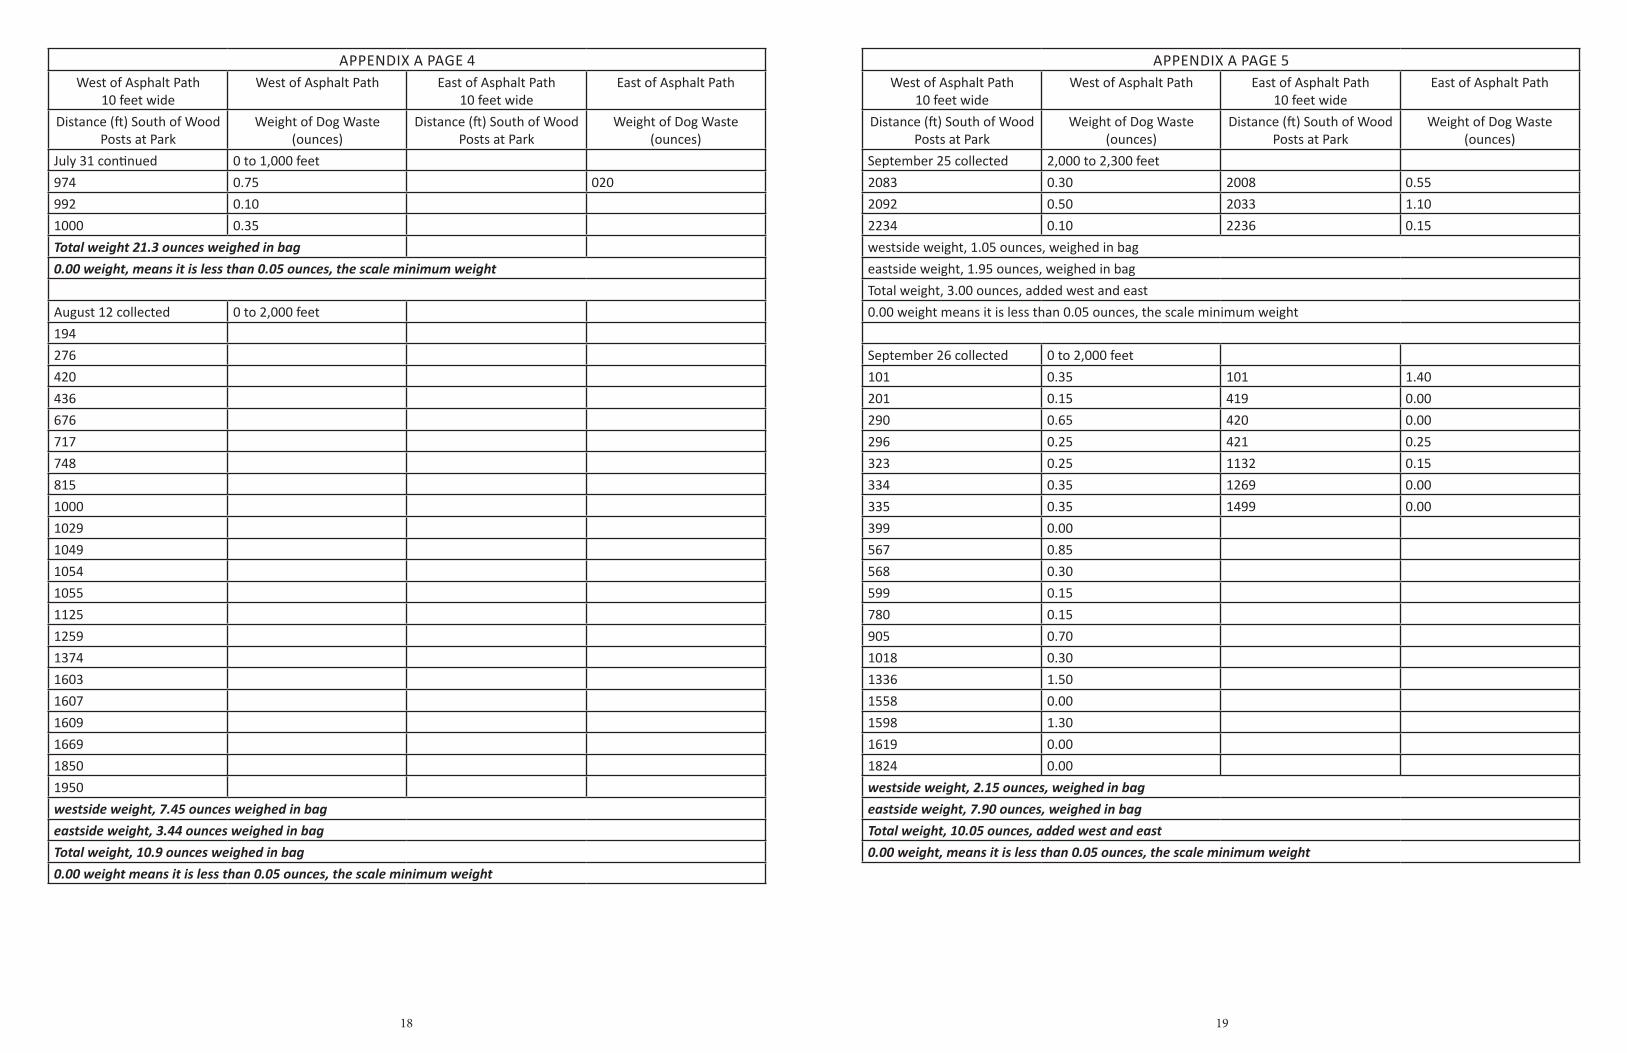
APPeNDIx A PAGe 5West of Asphalt Path
10 feet wideWest of Asphalt Path east of Asphalt Path
10 feet wideeast of Asphalt Path
Distance (ft) South of Wood Posts at Park
Weight of Dog Waste (ounces)
Distance (ft) South of Wood Posts at Park
Weight of Dog Waste (ounces)
September 25 collected 2,000 to 2,300 feet2083 0.30 2008 0.552092 0.50 2033 1.102234 0.10 2236 0.15westside weight, 1.05 ounces, weighed in bageastside weight, 1.95 ounces, weighed in bagtotal weight, 3.00 ounces, added west and east0.00 weight means it is less than 0.05 ounces, the scale minimum weight
September 26 collected 0 to 2,000 feet101 0.35 101 1.40201 0.15 419 0.00290 0.65 420 0.00296 0.25 421 0.25323 0.25 1132 0.15334 0.35 1269 0.00335 0.35 1499 0.00399 0.00567 0.85568 0.30599 0.15780 0.15905 0.701018 0.301336 1.501558 0.001598 1.301619 0.001824 0.00westside weight, 2.15 ounces, weighed in bageastside weight, 7.90 ounces, weighed in bagTotal weight, 10.05 ounces, added west and east0.00 weight, means it is less than 0.05 ounces, the scale minimum weight
APPeNDIx A PAGe 4West of Asphalt Path
10 feet wideWest of Asphalt Path east of Asphalt Path
10 feet wideeast of Asphalt Path
Distance (ft) South of Wood Posts at Park
Weight of Dog Waste (ounces)
Distance (ft) South of Wood Posts at Park
Weight of Dog Waste (ounces)
July 31 continued 0 to 1,000 feet974 0.75 020992 0.101000 0.35Total weight 21.3 ounces weighed in bag0.00 weight, means it is less than 0.05 ounces, the scale minimum weight
August 12 collected 0 to 2,000 feet19427642043667671774881510001029104910541055112512591374160316071609166918501950westside weight, 7.45 ounces weighed in bageastside weight, 3.44 ounces weighed in bagTotal weight, 10.9 ounces weighed in bag0.00 weight means it is less than 0.05 ounces, the scale minimum weight
18 19