Embed Size (px)
Citation preview
Copyright # 2003 John Wiley & Sons, Ltd. DYSLEXIA 9: 3–17 (2003)Published online in Wiley InterScience (www.interscience.wiley.com). DOI: 10.1002/dys.232
& Monitoring Dyslexics’Intelligence and Attainments:A Follow-up StudyMichael Thomson*
East Court School, Victoria Parade, Ramsgate. CT11 8ED, UK
Intelligence (Wechsler Intelligence Scale for Children R and III,1992) and written language attainment (BAS Word Reading, NealeAnalysis of Reading, Vernon Graded Word Spelling) data foraround 250 children attending a specialist school for dyslexics arepresented. The Wechsler scales data show some evidence for ‘ACID’and ‘SCAD’ profile effects on the subtests, with specifically weakIndex scores on Freedom from Distractibility and Processing Speed.The relationship between intelligence and reading development isalso examined, with evidence for significant correlations betweenintelligence and written language and a longitudinal study showingthat there is no ‘Matthew’ or drop-off effect in intelligence. Theattainments tests demonstrate that the widening gap between adyslexic’s chronological age and his/her attainments can be closed,and how attainments may be monitored within the context of‘growth curves’. The results are discussed in relation to recentreports (e.g. B.P.S. on Dyslexia, Literacy and PsychologicalAssessment) on the relationship between intelligence andattainments and it is concluded that this report could be seriouslymisleading for practising educational psychologists. Copyright #2003 John Wiley & Sons, Ltd.
Keywords: Dyslexia; Intelligence; WISC subtests; Discrepancy; Monitoring attainments;DECP working party
INTRODUCTION
The recent report by the British Psychological Society Division ofEducational and child Psychology working party on Dyslexia, Literacyand Psychological assessment concluded that the so-called ‘ACID’ profile
*Correspondence to: Michael Thomson, East Court School, Victoria Parade, Ramsgate,CT11 8ED, UK. Tel.: +1843-592-077; e-mail: [email protected]
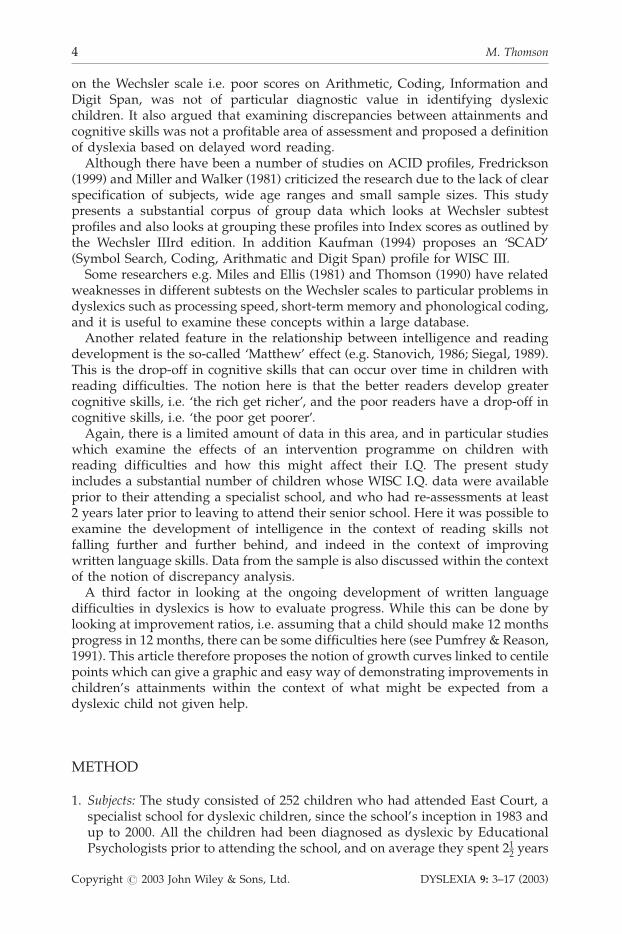
on the Wechsler scale i.e. poor scores on Arithmetic, Coding, Information andDigit Span, was not of particular diagnostic value in identifying dyslexicchildren. It also argued that examining discrepancies between attainments andcognitive skills was not a profitable area of assessment and proposed a definitionof dyslexia based on delayed word reading.
Although there have been a number of studies on ACID profiles, Fredrickson(1999) and Miller and Walker (1981) criticized the research due to the lack of clearspecification of subjects, wide age ranges and small sample sizes. This studypresents a substantial corpus of group data which looks at Wechsler subtestprofiles and also looks at grouping these profiles into Index scores as outlined bythe Wechsler IIIrd edition. In addition Kaufman (1994) proposes an ‘SCAD’(Symbol Search, Coding, Arithmatic and Digit Span) profile for WISC III.
Some researchers e.g. Miles and Ellis (1981) and Thomson (1990) have relatedweaknesses in different subtests on the Wechsler scales to particular problems indyslexics such as processing speed, short-term memory and phonological coding,and it is useful to examine these concepts within a large database.
Another related feature in the relationship between intelligence and readingdevelopment is the so-called ‘Matthew’ effect (e.g. Stanovich, 1986; Siegal, 1989).This is the drop-off in cognitive skills that can occur over time in children withreading difficulties. The notion here is that the better readers develop greatercognitive skills, i.e. ‘the rich get richer’, and the poor readers have a drop-off incognitive skills, i.e. ‘the poor get poorer’.
Again, there is a limited amount of data in this area, and in particular studieswhich examine the effects of an intervention programme on children withreading difficulties and how this might affect their I.Q. The present studyincludes a substantial number of children whose WISC I.Q. data were availableprior to their attending a specialist school, and who had re-assessments at least2 years later prior to leaving to attend their senior school. Here it was possible toexamine the development of intelligence in the context of reading skills notfalling further and further behind, and indeed in the context of improvingwritten language skills. Data from the sample is also discussed within the contextof the notion of discrepancy analysis.
A third factor in looking at the ongoing development of written languagedifficulties in dyslexics is how to evaluate progress. While this can be done bylooking at improvement ratios, i.e. assuming that a child should make 12 monthsprogress in 12 months, there can be some difficulties here (see Pumfrey & Reason,1991). This article therefore proposes the notion of growth curves linked to centilepoints which can give a graphic and easy way of demonstrating improvements inchildren’s attainments within the context of what might be expected from adyslexic child not given help.
METHOD
1. Subjects: The study consisted of 252 children who had attended East Court, aspecialist school for dyslexic children, since the school’s inception in 1983 andup to 2000. All the children had been diagnosed as dyslexic by EducationalPsychologists prior to attending the school, and on average they spent 212 years
M. Thomson4
Copyright # 2003 John Wiley & Sons, Ltd. DYSLEXIA 9: 3–17 (2003)
at the school. One objective of the school is to return children to mainstreameducation, and leaving at 13+ years, with some leaving at 11 years old.
2. Procedure: All children who had WISCR or WISC III data availablewere included in the study. Some 30 children had other measures ofintelligence}for example, British Ability Scales}and therefore their intelli-gence test data were excluded from the study. All children on arrival at theschool are given a baseline measure on British Ability Scales Word Reading,Neale Analysis of Reading Ability (Accuracy, Rate and Comprehension) andthe Vernon GradedWord Spelling test. The children are given the same writtenlanguage attainment tests on leaving the school. A substantial number ofchildren had the WISC re-administered at least 2 years after attendance at theschool.
Three studies are reported:
(1) Examining the WISC subtest and Index scores.(2) Evaluating the development of intelligence and its relationship to
reading.(3) Monitoring written language progress.
STUDY 1
Wechsler Intelligence Scale Subtests and Index Scores
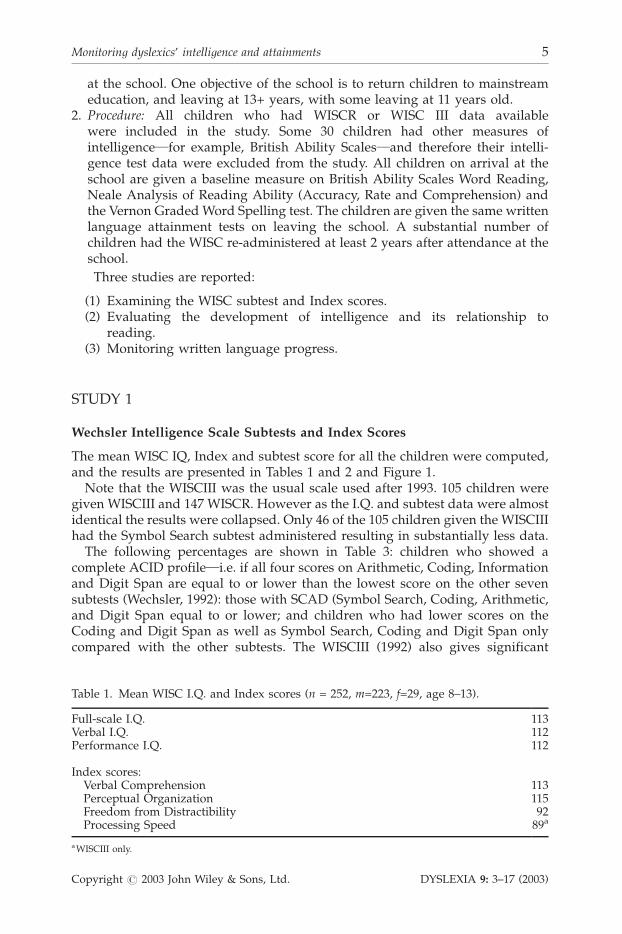
The mean WISC IQ, Index and subtest score for all the children were computed,and the results are presented in Tables 1 and 2 and Figure 1.
Note that the WISCIII was the usual scale used after 1993. 105 children weregiven WISCIII and 147 WISCR. However as the I.Q. and subtest data were almostidentical the results were collapsed. Only 46 of the 105 children given the WISCIIIhad the Symbol Search subtest administered resulting in substantially less data.
The following percentages are shown in Table 3: children who showed acomplete ACID profile}i.e. if all four scores on Arithmetic, Coding, Informationand Digit Span are equal to or lower than the lowest score on the other sevensubtests (Wechsler, 1992): those with SCAD (Symbol Search, Coding, Arithmetic,and Digit Span equal to or lower; and children who had lower scores on theCoding and Digit Span as well as Symbol Search, Coding and Digit Span onlycompared with the other subtests. The WISCIII (1992) also gives significant
Table 1. Mean WISC I.Q. and Index scores (n = 252, m=223, f=29, age 8–13).
Full-scale I.Q. 113Verbal I.Q. 112Performance I.Q. 112
Index scores:Verbal Comprehension 113Perceptual Organization 115Freedom from Distractibility 92Processing Speed 89a
aWISCIII only.
Monitoring dyslexics’ intelligence and attainments 5
Copyright # 2003 John Wiley & Sons, Ltd. DYSLEXIA 9: 3–17 (2003)
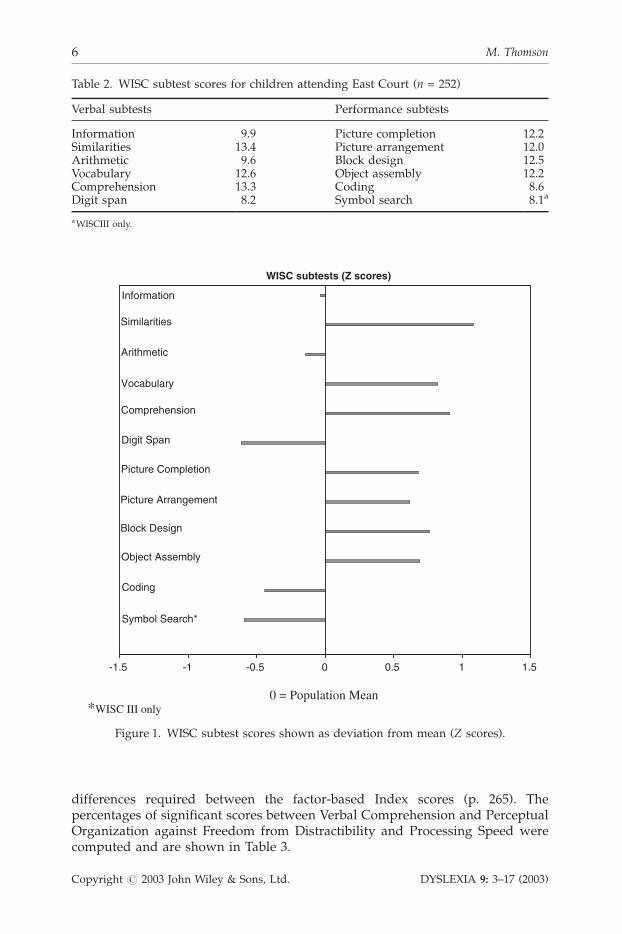
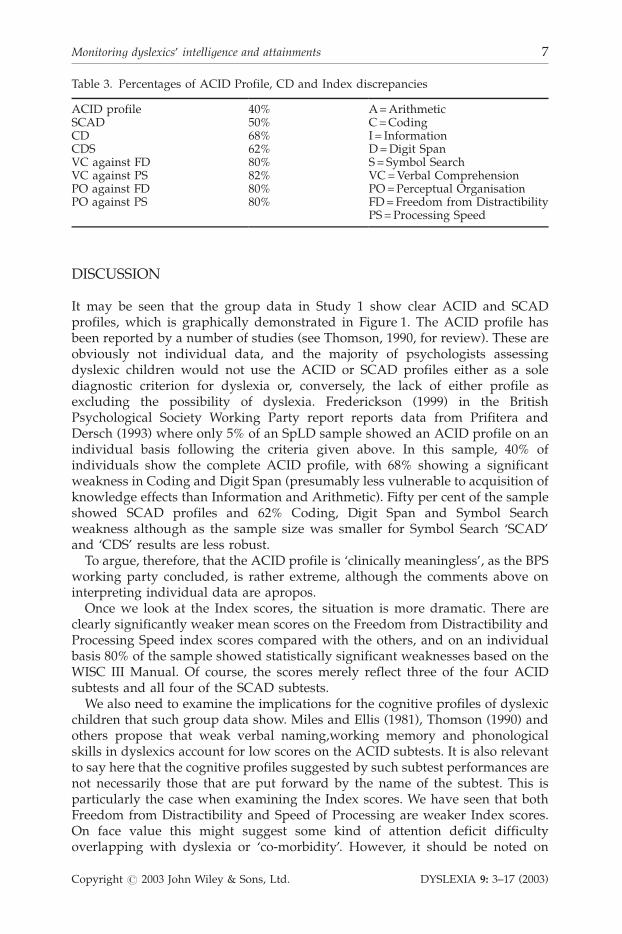
differences required between the factor-based Index scores (p. 265). Thepercentages of significant scores between Verbal Comprehension and PerceptualOrganization against Freedom from Distractibility and Processing Speed werecomputed and are shown in Table 3.
Table 2. WISC subtest scores for children attending East Court (n = 252)
Verbal subtests Performance subtests
Information 9.9 Picture completion 12.2Similarities 13.4 Picture arrangement 12.0Arithmetic 9.6 Block design 12.5Vocabulary 12.6 Object assembly 12.2Comprehension 13.3 Coding 8.6Digit span 8.2 Symbol search 8.1a
aWISCIII only.
*WISC III only
WISC subtests (Z scores)
Similarities
Arithmetic
Vocabulary
Symbol Search*
Coding
Object Assembly
Block Design
Picture Arrangement
Picture Completion
Digit Span
Comprehension
Information
-1.5 -1 -0.5 0 0.5 1 1.5
0 = Population Mean
Figure 1. WISC subtest scores shown as deviation from mean (Z scores).
M. Thomson6
Copyright # 2003 John Wiley & Sons, Ltd. DYSLEXIA 9: 3–17 (2003)
DISCUSSION
It may be seen that the group data in Study 1 show clear ACID and SCADprofiles, which is graphically demonstrated in Figure 1. The ACID profile hasbeen reported by a number of studies (see Thomson, 1990, for review). These areobviously not individual data, and the majority of psychologists assessingdyslexic children would not use the ACID or SCAD profiles either as a solediagnostic criterion for dyslexia or, conversely, the lack of either profile asexcluding the possibility of dyslexia. Frederickson (1999) in the BritishPsychological Society Working Party report reports data from Prifitera andDersch (1993) where only 5% of an SpLD sample showed an ACID profile on anindividual basis following the criteria given above. In this sample, 40% ofindividuals show the complete ACID profile, with 68% showing a significantweakness in Coding and Digit Span (presumably less vulnerable to acquisition ofknowledge effects than Information and Arithmetic). Fifty per cent of the sampleshowed SCAD profiles and 62% Coding, Digit Span and Symbol Searchweakness although as the sample size was smaller for Symbol Search ‘SCAD’and ‘CDS’ results are less robust.
To argue, therefore, that the ACID profile is ‘clinically meaningless’, as the BPSworking party concluded, is rather extreme, although the comments above oninterpreting individual data are apropos.
Once we look at the Index scores, the situation is more dramatic. There areclearly significantly weaker mean scores on the Freedom from Distractibility andProcessing Speed index scores compared with the others, and on an individualbasis 80% of the sample showed statistically significant weaknesses based on theWISC III Manual. Of course, the scores merely reflect three of the four ACIDsubtests and all four of the SCAD subtests.
We also need to examine the implications for the cognitive profiles of dyslexicchildren that such group data show. Miles and Ellis (1981), Thomson (1990) andothers propose that weak verbal naming,working memory and phonologicalskills in dyslexics account for low scores on the ACID subtests. It is also relevantto say here that the cognitive profiles suggested by such subtest performances arenot necessarily those that are put forward by the name of the subtest. This isparticularly the case when examining the Index scores. We have seen that bothFreedom from Distractibility and Speed of Processing are weaker Index scores.On face value this might suggest some kind of attention deficit difficultyoverlapping with dyslexia or ‘co-morbidity’. However, it should be noted on
Table 3. Percentages of ACID Profile, CD and Index discrepancies
ACID profile 40% A=ArithmeticSCAD 50% C=CodingCD 68% I= InformationCDS 62% D=Digit SpanVC against FD 80% S=Symbol SearchVC against PS 82% VC=Verbal ComprehensionPO against FD 80% PO=Perceptual OrganisationPO against PS 80% FD=Freedom from Distractibility
PS=Processing Speed
Monitoring dyslexics’ intelligence and attainments 7
Copyright # 2003 John Wiley & Sons, Ltd. DYSLEXIA 9: 3–17 (2003)
psychometric grounds that the subtest clusters contributing towards these Indexscores are based on factor analysis. It is notoriously difficult to provide anappropriate label for a factor that succinctly summarizes the contributing ‘factorloadings’. In the case of Freedom from Distractibility, the two main subtests thatload on this are Arithmetic and Digit Span with Speed of Processing derivedfrom the Coding and Symbol Search.
It therefore behoves us to look at the Index scores in relation to individualsubtest differences rather than suggesting an overall factor which is weak indyslexics. The Information subtest is essentially general knowledge, andobviously if a child has weak reading ability he/she may not pick up muchinformation from text. Similarly, some of the questions on the directionality andtime are quite clearly linked to difficulties described in dyslexics.
The Digit Span subtest, although involving elements of attention andconcentration is essentially is a test of auditory sequential memory. Crucially itinvolves phonological/naming and working memory skills which are wellknown to be weak in dyslexics (see Snowling, 2000; Thomson, 2001). The Codingsubtest involves elements of serial scanning, visual memory and possibly namingmemory, speed of graphic and motor control skills and a whole host of othersubskills that are notoriously weak in dyslexics. The Arithmetic subtest isinteresting because that would suggest problems in mathematics or arithmetic indyslexic children. While it is true that dyslexics do have difficulties with tables,addends and the like, it is more likely that the Arithmetic subtest, as it is mentalarithmetic, is also testing elements of verbal short-term memory. In addition, asthe arithmetical items are embedded in language, it may be a problem with someof the phonological and verbal decoding difficulties which beset dyslexics. It isinteresting to note anecdotally that we can improve our children’s performanceup to and above age levels in mathematics profiles, yet the same children couldbe weak at the Arithmetic subtest.
The Symbol Search test also involves serial scanning and some visual memoryskills although the emphasis here is on speed of visual scanning. Similar taskssuch as the Speed of Information Processing on the British Ability Scales are alsoweak in dyslexics (Thomson, 1982). It is interesting to note that less than half ofthe educational psychologists assessing the children with WISCIII use the Symbolsearch test. An important conclusion from this data is that this test is a veryimportant part of the assessment and diagnostic process where WISCIII is used.
In summary, I would agree with the BPS conclusion that the ACID profile is notthe sole criterion for diagnosing dyslexia, nor should its absence suggest a lackof dyslexia. Some dyslexic children, for example those having ‘dyspraxic’difficulties, may well have low scores in Block Design or Object Assembly.Dyslexia is a syndrome of overlapping difficulties and detailed examination ofthe individual child is crucial in the assessment process. However, I would arguethat it is certainly not the case that ‘it is clinically meaningless’. There is quiteclearly a higher incidence of this profile amongst dyslexics, and it does haveimportant implications for their cognitive skills and is, in my opinion, oneelement that can be used to aid diagnosis. The same can be said of the ‘SCAD’data which is the more recent attempt at arguing for a ‘dyslexia profile’.This is particularly important when we look at Study 2, where the same profile isfound despite children’s reading, writing and spelling having considerablyimproved.
M. Thomson8
Copyright # 2003 John Wiley & Sons, Ltd. DYSLEXIA 9: 3–17 (2003)
STUDY 2
The Relationship Between Intelligence and Reading Development
It is unfortunate, in my opinion, that the BPS working party has chosen to statethat the calculation of discrepancies between I.Q. and achievement does not linkwith theoretical explanations of dyslexia. The results of the working party’s vieware not only confusing for educational psychology practice where ability/achievement calculation is almost universal, but results in children not receivingappropriate help. The last two SEN Tribunals I’ve attended, where parents wereattempting to obtain statements for their dyslexic children hinged on localeducational psychologists stating that children with high IQs is could not beexpected to read (or spell) at predicted levels from IQ but that only attainmentscompared to chronological age would be acceptable}the BPS working party wasquoted as justification. This resulted in resources and SEN provision not beingprovided for these children as their difficulties ‘were not severe enough’.
I have discussed this in detail elsewhere (Thomson, 2000, 2001) with thefollowing conclusions:
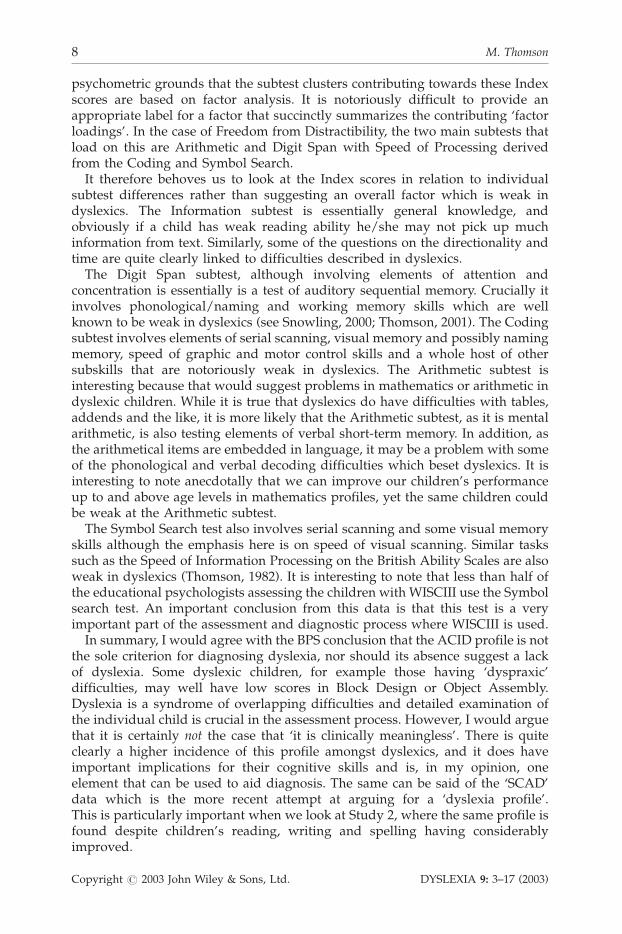
1. The Division of Education and Child Psychology (DECP), in rejecting thenotion of a discrepancy model, have returned to describing variouscharacteristics of the learning process that describe dyslexia when it was theDECP who rejected ‘descriptions’ and only accepted the notion of a specificlearning difficulty as defined by discrepancy models following regressionequation data.
2. With the introduction of the WISCIII and Wechsler Objective ReadingDimensions (WORD) (1993) it is possible to calculate a discrepancy basedon standardized data and taking into account regression to the mean.
3. The predicted attainments for WISC/WORD can give meaningful discrepan-cies for children with both low and high IQs
4. Core phonological deficits as being the main descriptor and, by implication,identifier of dyslexia, can be caused by number of factors. The ‘distal’ causessuch as low IQ, poor teaching, acquired or developmental dyslexia can resultin the ‘proximal’ cause of phonological weakness.
5. Crucially, teaching for different causes will be different and therefore to lumpdyslexics together with general ‘poor readers’ ( see BPS definition of dyslexiaas where accurate and fluent reading develops incompletely or with greatdifficulty) is not helpful diagnostically or pedagogically.
The main focus of this study is to present data on the relationship betweenintelligence and written language in this sample and secondly to examine theway in which children with reading and spelling difficulties can have drop-offsin their cognitive performance. This has been referred to as the ‘Matthew effect’and Stanovich (1986) comments that ‘slow reading acquisition has cognitive,behavioural and motivational consequences that slow the development of othercognitive skills and inhibit performance on many academic tasks’ and that IQreductions of 6–9 points can be observed after 4–5 years.
One feature of this deteriorating I.Q. may be due to:
1. Vocabulary becoming poorer in weaker readers as time goes by. This might bedue to a failure to build up a large lexicon, exposure to text, awareness of
Monitoring dyslexics’ intelligence and attainments 9
Copyright # 2003 John Wiley & Sons, Ltd. DYSLEXIA 9: 3–17 (2003)
words and so on. Quite clearly development of vocabulary is linked todevelopment of reading skills.
2. Lower I.Q. on re-test due to regression to the mean.3. Learned helplessness on cognitive tasks other than reading, writing and
spelling}in other words, children give up more easily.
The first componant of the study looks at the relationship between intelligenceand written language by examining the prediction of leavers reading and spellingbased on their IQ. Of course, as has been seen from Study 1, the sample is‘skewed’ towards higher IQ levels and has been specifically selected on the basisthat they had weak reading and spelling skills.
Multiple regression using two unordered sets of predictors as on the SPSSstatistical package examined correlations between criteria and predictedvariables. These results are presented in Table 4.
Out of the sample of children in the study, 76 had the Wechsler scalesadministered towards the end of their time at the school (at least 2 years afterthey joined), and therefore a comparison of cognitive skills development can begiven over time. There are obviously test–retest effects that occur and these arereported in the Wechsler scales up to a 3-month period. It is common practice ineducational psychology to allow at least a 6-month period between testing.It is highly unlikely that there would be any retesting or learned effectsafter a minimum of a 2-year period and in any case that the same effect wouldoccur in poor readers who are reported to have IQ reductions as describedabove.
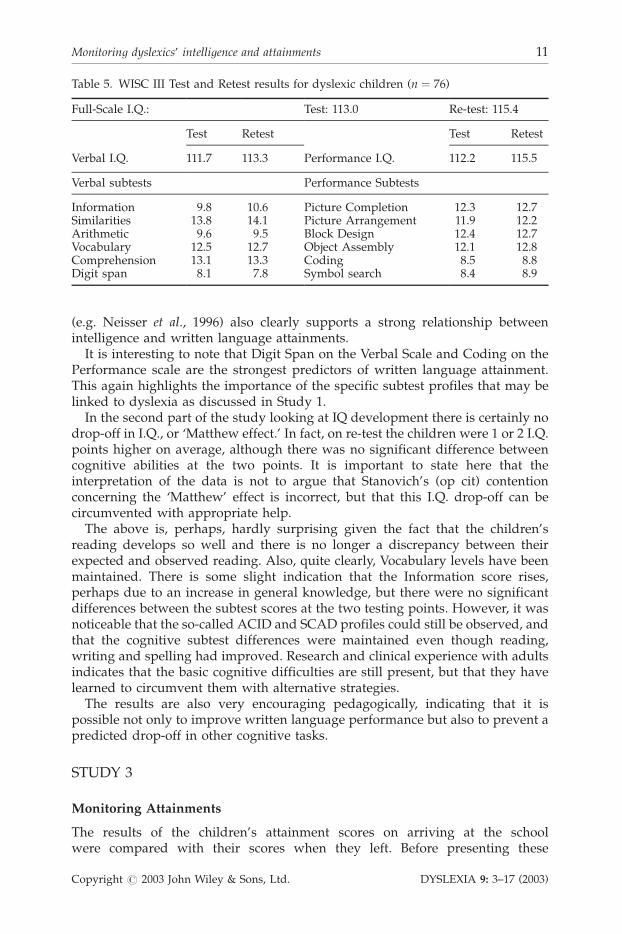
Table 5 gives WISC III subtest and I.Q. scores on entering and leaving EastCourt School. It shows that the subtest data for the sample of children was almostidentical to Figure 1. (A profile is not shown of the retest data as it would beredundant.)
Table 4 indicates that out there are high and significant correlations betweenintelligence and written language skills in this sample of dyslexic children. This isdespite the fact that there is a positively skewed range of I.Q. Intelligence istherefore an important factor in children with specific difficulties and to arguethat written language difficulties are independent of intelligence as implied bythe notion that there is no difference between general poor readers and those thathave a specific learning difficulty is not supported by this data. This is importantas the BPS working party following Stanovich(op cit) is taking this view intheir definition of dyslexia and comments on discrepancy models. Other research
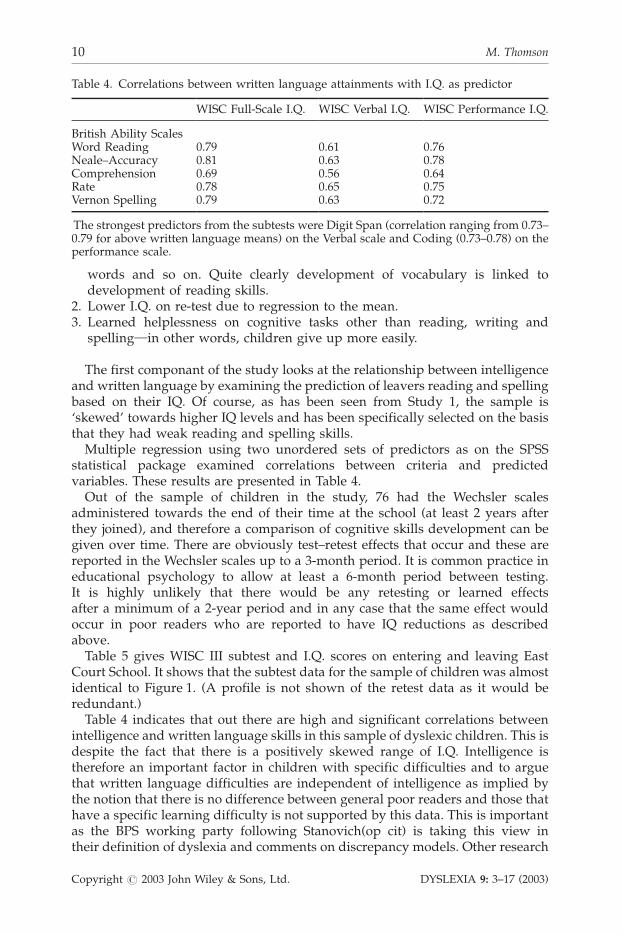
Table 4. Correlations between written language attainments with I.Q. as predictor
WISC Full-Scale I.Q. WISC Verbal I.Q. WISC Performance I.Q.
British Ability ScalesWord Reading 0.79 0.61 0.76Neale–Accuracy 0.81 0.63 0.78Comprehension 0.69 0.56 0.64Rate 0.78 0.65 0.75Vernon Spelling 0.79 0.63 0.72
The strongest predictors from the subtests were Digit Span (correlation ranging from 0.73–0.79 for above written language means) on the Verbal scale and Coding (0.73–0.78) on theperformance scale.
M. Thomson10
Copyright # 2003 John Wiley & Sons, Ltd. DYSLEXIA 9: 3–17 (2003)
(e.g. Neisser et al., 1996) also clearly supports a strong relationship betweenintelligence and written language attainments.
It is interesting to note that Digit Span on the Verbal Scale and Coding on thePerformance scale are the strongest predictors of written language attainment.This again highlights the importance of the specific subtest profiles that may belinked to dyslexia as discussed in Study 1.
In the second part of the study looking at IQ development there is certainly nodrop-off in I.Q., or ‘Matthew effect.’ In fact, on re-test the children were 1 or 2 I.Q.points higher on average, although there was no significant difference betweencognitive abilities at the two points. It is important to state here that theinterpretation of the data is not to argue that Stanovich’s (op cit) contentionconcerning the ‘Matthew’ effect is incorrect, but that this I.Q. drop-off can becircumvented with appropriate help.
The above is, perhaps, hardly surprising given the fact that the children’sreading develops so well and there is no longer a discrepancy between theirexpected and observed reading. Also, quite clearly, Vocabulary levels have beenmaintained. There is some slight indication that the Information score rises,perhaps due to an increase in general knowledge, but there were no significantdifferences between the subtest scores at the two testing points. However, it wasnoticeable that the so-called ACID and SCAD profiles could still be observed, andthat the cognitive subtest differences were maintained even though reading,writing and spelling had improved. Research and clinical experience with adultsindicates that the basic cognitive difficulties are still present, but that they havelearned to circumvent them with alternative strategies.
The results are also very encouraging pedagogically, indicating that it ispossible not only to improve written language performance but also to prevent apredicted drop-off in other cognitive tasks.
STUDY 3
Monitoring Attainments
The results of the children’s attainment scores on arriving at the schoolwere compared with their scores when they left. Before presenting these
Table 5. WISC III Test and Retest results for dyslexic children (n ¼ 76)
Full-Scale I.Q.: Test: 113.0 Re-test: 115.4
Test Retest Test Retest
Verbal I.Q. 111.7 113.3 Performance I.Q. 112.2 115.5
Verbal subtests Performance Subtests
Information 9.8 10.6 Picture Completion 12.3 12.7Similarities 13.8 14.1 Picture Arrangement 11.9 12.2Arithmetic 9.6 9.5 Block Design 12.4 12.7Vocabulary 12.5 12.7 Object Assembly 12.1 12.8Comprehension 13.1 13.3 Coding 8.5 8.8Digit span 8.1 7.8 Symbol search 8.4 8.9
Monitoring dyslexics’ intelligence and attainments 11
Copyright # 2003 John Wiley & Sons, Ltd. DYSLEXIA 9: 3–17 (2003)
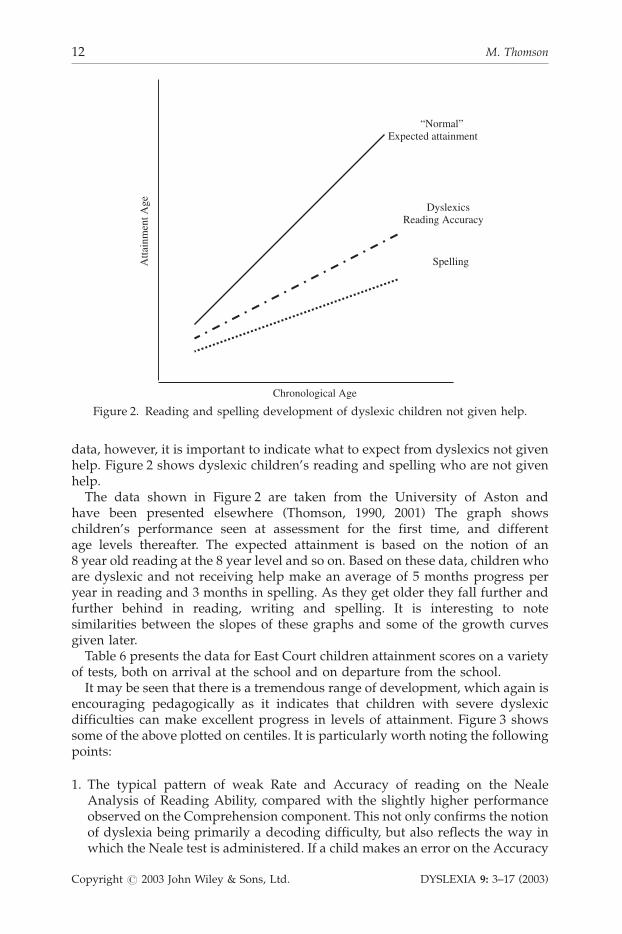
data, however, it is important to indicate what to expect from dyslexics not givenhelp. Figure 2 shows dyslexic children’s reading and spelling who are not givenhelp.
The data shown in Figure 2 are taken from the University of Aston andhave been presented elsewhere (Thomson, 1990, 2001) The graph showschildren’s performance seen at assessment for the first time, and differentage levels thereafter. The expected attainment is based on the notion of an8 year old reading at the 8 year level and so on. Based on these data, children whoare dyslexic and not receiving help make an average of 5 months progress peryear in reading and 3 months in spelling. As they get older they fall further andfurther behind in reading, writing and spelling. It is interesting to notesimilarities between the slopes of these graphs and some of the growth curvesgiven later.
Table 6 presents the data for East Court children attainment scores on a varietyof tests, both on arrival at the school and on departure from the school.
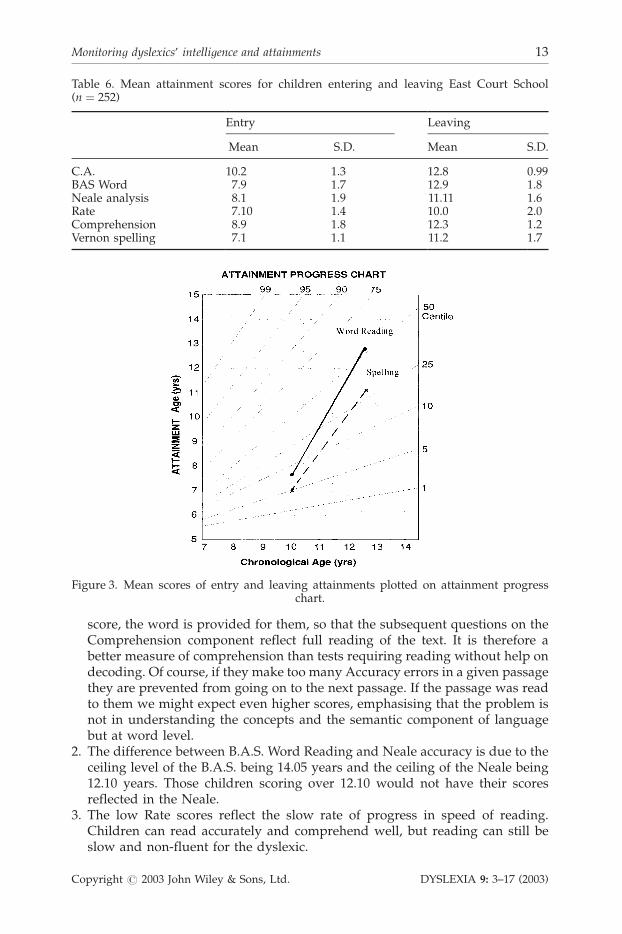
It may be seen that there is a tremendous range of development, which again isencouraging pedagogically as it indicates that children with severe dyslexicdifficulties can make excellent progress in levels of attainment. Figure 3 showssome of the above plotted on centiles. It is particularly worth noting the followingpoints:
1. The typical pattern of weak Rate and Accuracy of reading on the NealeAnalysis of Reading Ability, compared with the slightly higher performanceobserved on the Comprehension component. This not only confirms the notionof dyslexia being primarily a decoding difficulty, but also reflects the way inwhich the Neale test is administered. If a child makes an error on the Accuracy
Atta
inm
ent A
ge
“Normal”Expected attainment
Dyslexics Reading Accuracy
Spelling
Chronological Age
Figure 2. Reading and spelling development of dyslexic children not given help.
M. Thomson12
Copyright # 2003 John Wiley & Sons, Ltd. DYSLEXIA 9: 3–17 (2003)
score, the word is provided for them, so that the subsequent questions on theComprehension component reflect full reading of the text. It is therefore abetter measure of comprehension than tests requiring reading without help ondecoding. Of course, if they make too many Accuracy errors in a given passagethey are prevented from going on to the next passage. If the passage was readto them we might expect even higher scores, emphasising that the problem isnot in understanding the concepts and the semantic component of languagebut at word level.
2. The difference between B.A.S. Word Reading and Neale accuracy is due to theceiling level of the B.A.S. being 14.05 years and the ceiling of the Neale being12.10 years. Those children scoring over 12.10 would not have their scoresreflected in the Neale.
3. The low Rate scores reflect the slow rate of progress in speed of reading.Children can read accurately and comprehend well, but reading can still beslow and non-fluent for the dyslexic.
Table 6. Mean attainment scores for children entering and leaving East Court School(n ¼ 252)
Entry Leaving
Mean S.D. Mean S.D.
C.A. 10.2 1.3 12.8 0.99BAS Word 7.9 1.7 12.9 1.8Neale analysis 8.1 1.9 11.11 1.6Rate 7.10 1.4 10.0 2.0Comprehension 8.9 1.8 12.3 1.2Vernon spelling 7.1 1.1 11.2 1.7
Figure 3. Mean scores of entry and leaving attainments plotted on attainment progresschart.
Monitoring dyslexics’ intelligence and attainments 13
Copyright # 2003 John Wiley & Sons, Ltd. DYSLEXIA 9: 3–17 (2003)
4. Although there is a tremendous improvement in spelling, this is still relativelyweak. However, as can be seen in Figure 3 below, this result represents aperformance at around the 25th–30th centile level. In other words, this sampleof dyslexics is spelling better than a quarter of the population, which is veryencouraging.
Another purpose of Study 3 was to look at ways in which we can evaluate theperformance of children, and Figure 3 shows word reading and spelling plottedon a graph that examines growth curves and centiles. This is adapted and basedon Cook and Cook (1988).
The centile points represent a typical ‘growth curve’ for attainments. Thecentral line at the 50th centile represents the average or expected development ofchildren i.e. 7 year olds reading at the 7 year age level and so on. It is interestingto note that the ‘growth curves’ at the 5th and 1st centile, respectively, are verysimilar to the reading and spelling profiles obtained from the University of Astondata. Figure 3, based on the group data, shows the improvements, taking readingto just above the 50th centile level and spelling to above the 25th centile level.However, one of the main features here is the visual presentation comparing themean growth curves with the expected performance at the 5th or the 1st centilethat one might observe if a dyslexic child were not given help.
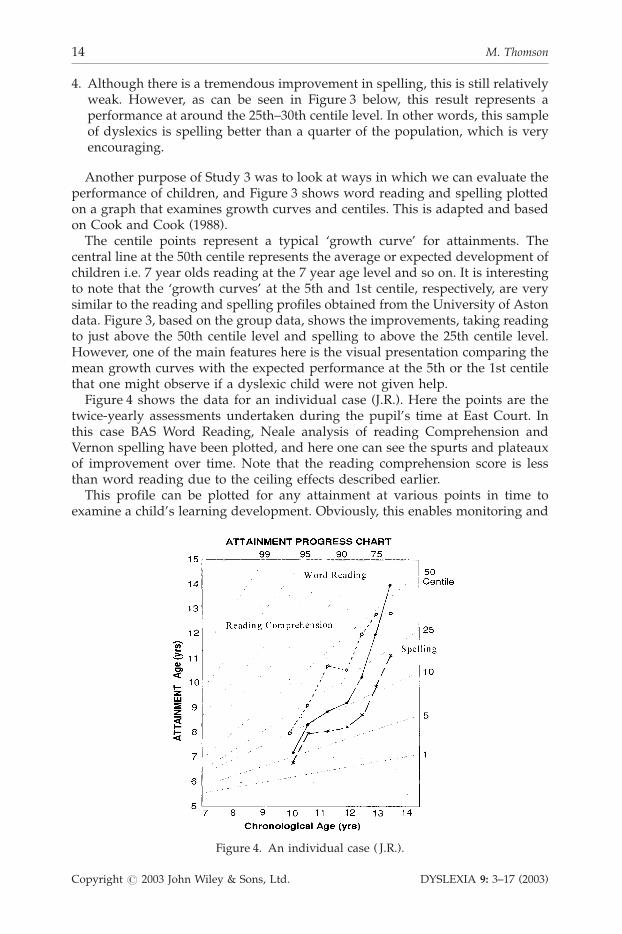
Figure 4 shows the data for an individual case (J.R.). Here the points are thetwice-yearly assessments undertaken during the pupil’s time at East Court. Inthis case BAS Word Reading, Neale analysis of reading Comprehension andVernon spelling have been plotted, and here one can see the spurts and plateauxof improvement over time. Note that the reading comprehension score is lessthan word reading due to the ceiling effects described earlier.
This profile can be plotted for any attainment at various points in time toexamine a child’s learning development. Obviously, this enables monitoring and
Figure 4. An individual case ( J.R.).
M. Thomson14
Copyright # 2003 John Wiley & Sons, Ltd. DYSLEXIA 9: 3–17 (2003)
evaluation of a child’s progress within the context of growth over time, and in thecontext of expectation of what a dyslexic might achieve. This (based on Figure 2)would be for spelling to remain at the slope of the first centile and reading at thefifth centile if help is not given. It also overcomes some of the difficulties ininterpreting age scores or centiles which can be misunderstood by those parentswho do not have psychometric or educational measurement knowledge. Here,comparisons can be made with what is a ‘normal’ growth curve or the teacher/psychologist can evaluate how attainments have developed with an interventionprogramme. We often find an initial improvement followed by a plateau orslower rate, and then another surge. Anecdotally, this seems to reflect the initiallearning of ‘phonics’, i.e. basic alphabetic, regular word reading based onphonological weaknesses. The next stage of more complex phonology, e.g. vowelcombinations as well as irregular words and more complex orthography, takeslonger to remediate.
GENERAL SUMMARY AND CONCLUSIONS
Data presented here has examined the relationship between intelligence, subsetsprofiles, and written language development in dyslexic children. Although this isa selected sample in the sense that it is from a specialist school there are someimportant conclusions to be reached.
It is clearly possible to identify specific subsets profiles on the group data indyslexic children and, in particular, cluster or Index scores. As these specificallyweak subtests are clearly linked to children’s written language development aswell as the diagnostic criteria for dyslexia. Obviously an ACID or SCAD profile isnot the only element of the assessment process but it is nevertheless an importantone.
The relationship between intelligence and written language development andintelligence profiles over time indicate the importance of examining therelationship between these variables. It is also important to monitor dyslexicchildren’s reading and spelling if a clear picture of their development over time isto be gained. The growth curves illustrated demonstrate the relationship betweenreading and spelling levels and centile positions.
These issues are not just of academic importance. I make no apologies forfurther anecdotal evidence as it is my view that children are being misidentifiedand barred from receiving appropriate help due to misconceptions arising fromthe BPS Working Party report.
I quote verbatim from a recent report by a local education authorityeducational psychologist:
The British Psychological Society, Division of Educational and Child Psychology(DECP) defines dyslexia as, ‘dyslexia is evident when accurate and fluent word reading and/or spelling develops very incompletely or with great difficulty. This focuses on literacy learningat the ‘word level’ and implies that the problem is severe and persistent despite appropriatelearning opportunities. It provides the basis for a staged process of assessment through teaching.’The definition does not rely on their being a significant discrepancy between cognitiveability and attainments scores. The DECP also states that no particular pattern ofcognitive scores is necessary for a child to be regarded as dyslexic. The important issue
Monitoring dyslexics’ intelligence and attainments 15
Copyright # 2003 John Wiley & Sons, Ltd. DYSLEXIA 9: 3–17 (2003)
is not whether or not the attainments are so severe [sic] as to be regarded as developingvery incompletely or with great difficulty and so whether he should be determineddyslexic on not, but to examine his skills and consider what teaching strategies areneeded to continue his progress.
The above is one component of a report that is trying to argue that a child at aspecialist school is not dyslexic (and, therefore, does not require funding). Firstlyit is clear that in practical terms, and in my view supported by this data, asignificant discrepancy between cognitive ability and attainments scores is acrucial part of diagnosis and identifying the special educational needs of a child.Even leaving aside the diagnostic component a child of high ability requires adifferent teaching programme to a child of lower ability, it is also clear that thereare patterns of cognitive scores associated with dyslexia and of course the issue isprecisely whether a child attainments are so poor as to be described as severe ordeveloping incompletely. I would agree that one should to consider whatteaching strategies are needed based on a child’s skills but that this should be inthe context of them being clearly identified as ‘dyslexic’. It is my experience thatthe above approach, from an LEA psychologist, using the DECP report to justifya failure to recognise dyslexia is increasingly prevalent. Depressingly it takes usback to the 1970s where specific learning difficulties/dyslexia were just seen to bepart of a general poor reading continuum and as a result large numbers ofchildren were not identified or helped appropriately.
References
British Psychological Society. (1999). Dyslexia, literacy and psychological assessment. Reportby Division of Educational and Child Psychology. Leicester: BPS.
Cook, J., & Cook, R. (1988). Reading progress chart, experimental edition. Chichester:Lyminster Publications.
Frederickson, N. (1999). The ACID test–or is it? Educational Psychology in Practice, 15(1), 2–8.
Kaufman, A. S. (1994). Intelligent testing with the WISC III. New York: Wiley.
Miller, M., & Walker, K. (1981). The myth of the LD WISC-R profile. Exceptional Children,28, 83–88.
Miles, T., & Ellis, N. (1981). A lexical coding deficiency 1 & 11: Experimental evidence andclassical observation. In G. Pavlides & T. Miles (Eds.), Dyslexia research and application toeducation. Chichester: Wiley.
Neisser, U., Boodov, G., Bouchard, T. J., Boykin, A. W., Brody, N., & Ceci, S. J. (1996).Intelligence: Knowns and unknowns. American Psychologist, 51, 77–101.
Prifitera, A., & Dersch, J. (1993). Base rates of WISC III diagnostic subtest patterns amongnormal, learning disabled and ADHD samples. Journal of Psycho-educational Assessment,WISC III monograph, 43–55.
Pumfrey, P., & Reason, R. (1991). Specific learning difficulties. Windsor: NFER-Nelson.
Siegal, L. S. (1989). I.Q. is irrelevant to the definition of Learning disabilities. Journal ofLearning Disabilities, 22, 469–478.
Snowling, M. S. (2000). Dyslexia. Oxford: Blackwell.
Stanovich, K. E. (1986). Matthew effects in reading: Some consequences of individualdifferences in the acquisition of literacy. Reading Research Quarterly, 21, 360–407.
Stanovich, K. E. (1994). Annotation: Does dyslexia exist? Journal of Child Psychology.Psychiatry, 35, 579–595
M. Thomson16
Copyright # 2003 John Wiley & Sons, Ltd. DYSLEXIA 9: 3–17 (2003)

Thomson, M. E. (1982). The assessment of children with specific learning difficulties(dyslexia) using the British ability scale. British.Journal of Psychology, 73, 461–478
Thomson, M. E. (1990). Developmental dyslexia (3rd ed.). London: Whurr.
Thomson, M. E. (2000). Definitions and discrepancies in dyslexia. Dyslexia Review, 11(4), 11–15.
Thomson, M. E. (2001). The psychology of dyslexia: A guide for teachers. London: Whurr.
Wechsler Intelligence Scale for Children III. (1992). London: The PsychologicalCorporation.
Wechsler Objective Reading Dimensions. (1993). London: The Psychological Corporation.
Monitoring dyslexics’ intelligence and attainments 17
Copyright # 2003 John Wiley & Sons, Ltd. DYSLEXIA 9: 3–17 (2003)