Embed Size (px)
Citation preview
Page 1
Monitoring Earth Pressure Balance Tunnels in Los Angeles
Thomas M. Saczynski1, M ASCE P.E., Michael Pearce2, M ASCE, P.E., G.E., andAmanda Elioff3, M ASCE, P.E.
1Sr. Manager, KBR,790 Colorado Blvd Suite 900, Pasadena, CA, 911012Sr. Engineer, Ninyo & Moore, 475 Goddard, Suite 200, Irvine, CA, 926183Sr. Professional Associate, PB Americas Inc., 444 S. Flower Street, Los Angeles, CA 90071
ABSTRACT: Tunneling using earth pressure balance (EPB) tunneling methods hasbeen active in Los Angeles over the last seven years. Three recent large-diameter EPBtunnel projects have been completed to create approximately 32km (20 miles) of pre-cast concrete lined tunnel excavated through alluvial soils and soft, sedimentary rock.This paper addresses monitoring of ground surface subsidence using data collectedfrom geotechnical instrumentation and TBM performance parameters. TBM operatingdata are used in conjunction with surface-installed instrumentation to predict surfacesubsidence. TBM operations may then be adjusted to reduce potential settlement-related damage to adjacent structures or utilities. Monitoring instruments usingremote access is also addressed. The paper provides case histories of successfulperformance monitoring to support future urban tunneling projects.
1. INTRODUCTION
More than 80 km (50 mi) of large diameter tunnels have been constructed in LosAngeles, California (USA) over the past 20 years. Three recent projects are the EastCentral Interceptor Sewer (ECIS) and Northeast Interceptor Sewer (NEIS), owned bythe City of Los Angeles, and the most recently completed tunnels for the MetropolitanTransportation Authority’s (Metro) Gold Line Eastside Extension tunnels for light rail(MGLEE). Minimizing ground surface settlement was of paramount importance forall of these urban tunnel projects. Pressure Face TBMs, i.e., Earth Pressure Balance(EPB) or Slurry Machines, were specified for these projects to reduce subsidence risk.For all three projects, the contractors selected EPB TBMs.
The ECIS project (Figure 1), completed in 2004, involved over 18 km (11mi) of EPBtunnel using four TBMs (Crow and Holzhauser, 2003). The NEIS project wascompleted in 2005 and included 11 km (7 mi) of sewer tunnel (Zernich et. al., 2005),The MGLEE tunnels, completed in 2006, comprised 2.2 km (1.3 mi) of twin bore
FMGM 2007: Seventh International Symposium on Field Measurements in Geomechanics © 2007 ASCE

Page 2
tunnels, using two EPB TBMs. All of these projects were located in a denselypopulated urban area (Choueiry et. al. 2007).
FIG 1. Location of Metro and Major Sewer Tunnels, Los Angeles
All three tunnel projects demonstrated successful tunneling performance in terms ofsurface settlement, although there were occasional incidents of surface settlementgreater than allowable along the ECIS alignment. These occasional incidents weresuccessfully mitigated.
The NEIS tunnels were bored considerably deeper than the ECIS tunnels, were ofsmaller diameter, i. e., 3.7 m (12 ft) for NEIS vs. 4.72(15.5 ft) for ECIS, and werelocated below the water table. These circumstances, which were more forgiving on theone hand, required more diligent application of EPB practice on the other.Nonetheless, the experiences on both ECIS and NEIS provided meaningful lessons forfuture tunnel work. Lessons learned were incorporated into the MGLEE project,which was highly successful in terms of avoiding measurable surface settlement.
1.1 Reducing Surface Subsidence
Surface settlement, or ground subsidence due to tunneling, can cause damage to roads,utilities, buildings and other structures. Tunneling experience in Los Angeles usingopen shield methods demonstrated such potential during previous tunnel projects. Therisk potential was therefore heightened for the subject projects, and this led to thespecification of pressure-face TBMs. The closed and pressurized face reduces loss ofground at the tunnel face and, when the machines are used in combination withgasketed pre-cast tunnel liners and backfill grout behind the installed segments, lossesfrom over-cut of the excavated surface are also reduced.
FMGM 2007: Seventh International Symposium on Field Measurements in Geomechanics © 2007 ASCE

Page 3
Identifying and mitigating subsidence were identified as major objectives in thedevelopment of the MGLEE project. A key element to this strategy was theincorporation of lessons learned on the ECIS and NEIS tunnels. The design forMGLEE thus incorporated several measures beyond the requirement for ECIS andNEIS with respect to pressure face TBMs for subsidence mitigation. These included:ground modification using permeation and compensation grouting in some cases, andadjustment of TBM operations in others. The principle of compensation groutinginvolves carefully controlled injection of grout between the tunnel crown and surfaceabove during tunneling, allowing raising of the structure should settlement occur.These adjustments included modifications to applied face pressure and backfill groutvolumes. Identifying ground surface settlement, achieved through extensive surfacesurvey and instrumentation was key to assessing performance.
Settlement mitigation through compensation grouting during tunneling was notrequired for MGLEE. This was attributed to the Contractor conscientiously followinggood EPB tunneling practice, as well as ground conditions that appeared to be idealfor EPB tunneling. Relatively little measurable surface settlement occurred, theaverage being 0.25 cm (0.1 in.) and the maximum being 12.2 mm (0.48 in) in over 2.1km (1.3 mi) of tunnel. Nonetheless, continuous monitoring of machine performanceand surface settlement was necessary throughout the project so that if actionthresholds, as defined in the specification, were reached, appropriate mitigationmeasures could be taken.
The sections below describe the instrumentation and surveying methods used toidentify surface settlement on the three projects. This is followed by a discussion ofTBM data used to assess performance as it evolved on the MGLEE project.
2. INSTRUMENTATION MONITORING PROGRAM
2.1 Organization
The instrumentation and monitoring responsibilities for the ECIS, NEIS, and MGLEEprojects were structured similarly. The types of instrumentation were indicated on theproject plans and specifications. Furnishing, installing and maintaining this equipmentwas the responsibility of the Contractor, while data collection and management andreporting were the responsibility of the Owner’s Construction Manager (CM). Suchorganization allowed the Contractor to schedule and integrate instrumentationinstallation with other construction activities to limit construction conflicts anddamage to installed equipment as well as limiting public inconveniences such as laneclosures for multiple construction activities. Additionally, the Owner had theconvenience of collecting data as often as desired without waiting for the Contractor toprovide readings. Managing the databases also gave the Owner the flexibility toprocess and provide appropriate data presentation to all interested parties in a timelymanner.
2.2 Instrumentation
The contracts for the three projects specified action level and maximum allowablesurface settlements. The specifications also prescribed maximum downwardmovement of soil directly above the tunnel crown, which eliminated tunnel depthconsiderations from performance analysis.
FMGM 2007: Seventh International Symposium on Field Measurements in Geomechanics © 2007 ASCE
Page 4
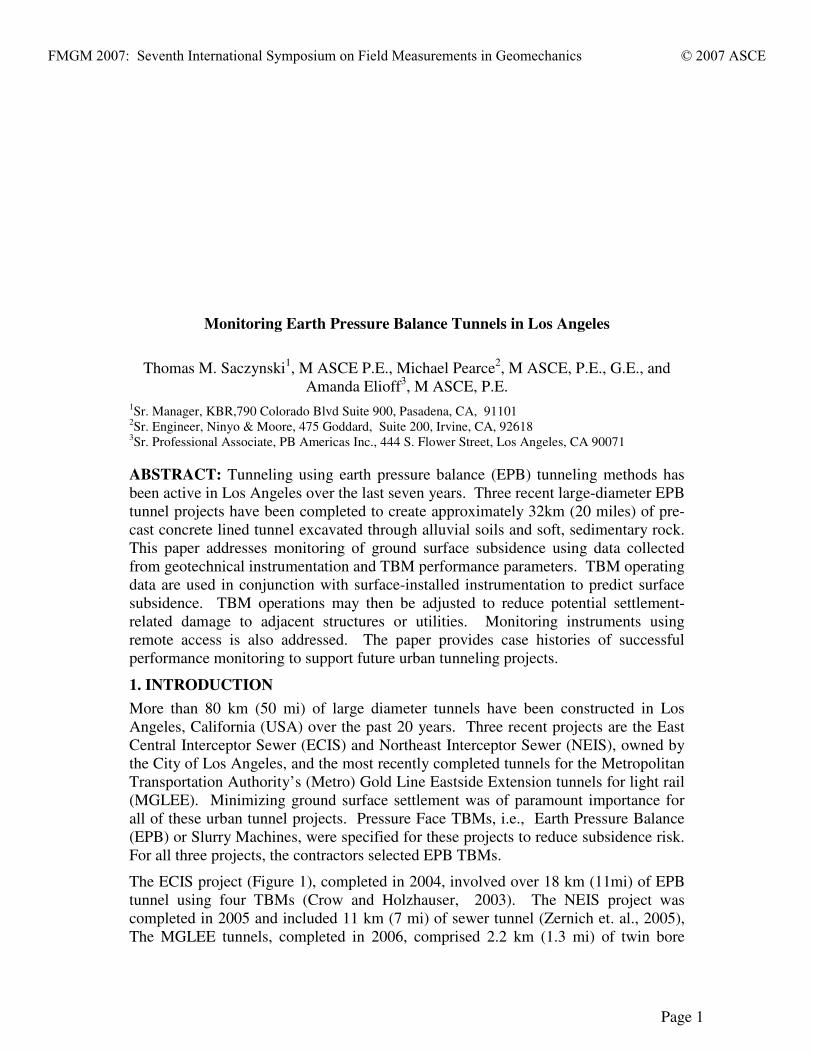
The eight EPB tunnel reaches were monitored using several types of instrumentationincluding: multiple point borehole extensometers (MPBXs) as well as conventionalsurvey of surface settlement points. Braced station excavations (not addressed in thispaper) were monitored using inclinometers, observation wells with strain gaugesplaced on struts.
Tunneling generally occurred below public right of way (city streets). Arrays ofMPBXs, along with surface settlement survey points, were placed at cross streets toidentify the surface settlement trough characteristics. Figure 2 illustrates a typicalinstrumentation layout and cross section for the MGLEE twin bores.
FIG 2. Typical Instrumentation Layout above MGLEE Tunnels
MPBXs were spaced as close as 15 m (49 ft) along the alignment at critical locations,and as much as 75 m (250 ft) along less critical areas. Lower anchors were installedapproximately 1.5 m (5 ft) above the proposed tunnel crown, surface anchors were set1.5 m (5 ft) below the ground surface and the middle anchors were spacedequidistantly between the upper and lower anchors (Fig 2).
The three projects used approximately 360 MPBXs and thousands of surfacesettlement points, with the majority of these extensometers and survey points located
FMGM 2007: Seventh International Symposium on Field Measurements in Geomechanics © 2007 ASCE
Page 5
within traffic lanes of heavily traveled city streets. With the large amount of availabledata provided by the TBM (discussed further below) it was important to have enoughsubsurface and surface settlement readings to accurately analyze the tunnelingperformance during excavation. Tightly spaced MPBXs at the start of each tunneldrive were valuable to correlate settlement with TBM performance.
Data collection
Data collection posed one of the biggest challenges of the tunnel monitoring program.At times monitoring included collecting data for four active tunnel headings inaddition to simultaneous shaft excavations. Electronic data collection from MPBXsevolved from hand held storage devices, to two-way radio transmission, and finally tocellular modem transmission. In addition to MPBXs and surface surveys, the tunnelmonitoring included an Automatic Data Acquisition system installed in the TBMs.Along with survey data, all information data could be reviewed, processed,summarized and distributed within a few hours. For MGLEE, however, this processcould be completed within a few minutes of the data readings for critical locations.Additionally, real time data from the extensometers could be monitored at the MGLEEproject field office via cellular modem, whereas on previous projects real time datacould only be viewed in the field.
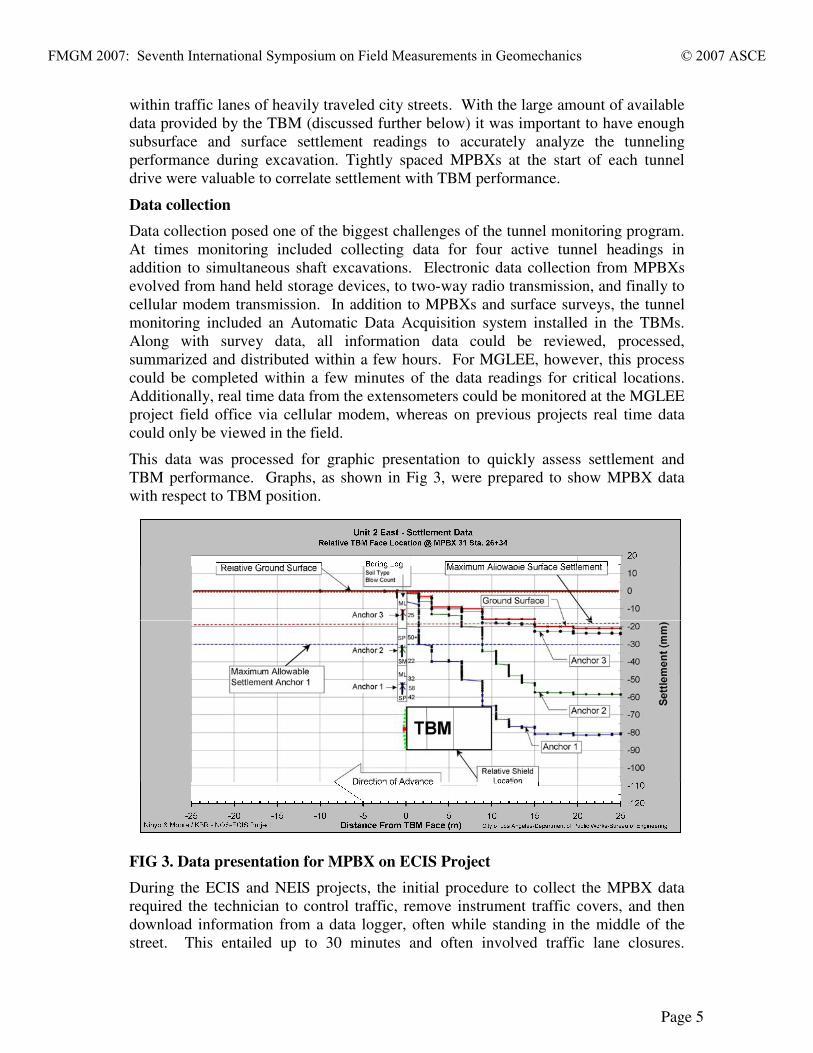
This data was processed for graphic presentation to quickly assess settlement andTBM performance. Graphs, as shown in Fig 3, were prepared to show MPBX datawith respect to TBM position.
FIG 3. Data presentation for MPBX on ECIS Project
During the ECIS and NEIS projects, the initial procedure to collect the MPBX datarequired the technician to control traffic, remove instrument traffic covers, and thendownload information from a data logger, often while standing in the middle of thestreet. This entailed up to 30 minutes and often involved traffic lane closures.
FMGM 2007: Seventh International Symposium on Field Measurements in Geomechanics © 2007 ASCE
Page 6
Performing such operations for four tunnel drives spread over 18 km (11 miles) ofalignment involved several hours, and thus created a lag in the timely identification ofexcessive settlement. This system was upgraded considerably using a two-waycommunication device and laptop computers with the ability to transfer data via anattached cellular phone. This allowed the technician to safely stand on the side of theroad, connect to the data logger using two-way communication and download orprogram the data logger as needed. The data was then sent to the office server withthe cellular phone modem and processed within minutes of the last reading. At times,there was some difficulty with transmission through the traffic covers and passingcars, but several antenna options, including a large hand held antenna, as well as theperseverance of the technicians, contributed to a successful field operation.
The MGLEE project provided the opportunity to further upgrade MPBX datacollection techniques. The MPBXs were similar to those on the ECIS and NEISprojects and were also located within high volume traffic corridors. The data loggersfor the MGLEE project were, however, equipped with cellular modems in an attemptto collect data from almost any location and at any time. Based on the experiences ofECIS and NEIS, transmitting through the traffic covers would pose the greatestdifficulty. The solution called for testing the first MPBX installation by simplyputting a cell phone in the traffic cover and testing for phone reception.
Field testing of a data logger prototype resulted in less success than the cellular phonemethod, and required retrofitting the data logger with an external antenna and a cableextension. The retrofit involved placing small holes in the traffic covers that allowedportions of the antennas to be exposed. This adaptation was sufficiently successful touse the remaining data loggers with this configuration. Ultimately antennas weremounted on top of the traffic covers and reception was greatly improved. Antennas,however, were exposed to damage and suffered a high mortality rate.
After limited success with customizing traffic covers and replacing damaged antennas,the team did not consistently use the cellular modems. In many cases, cellularreception was poor along portions of the alignment. The relatively short alignmentallowed quick access to all locations, along with contract provisions that enabled theContractor to provide traffic control, this meant that rapid recovery of data was stillpossible.
The majority of the data from extensometers were collected using a laptop computerwith hard wire to the MPBX data logger in the field. This allowed the technician todetermine in the field if action levels had been reached. The technician would thenbring the data to the field office for further formatting, analysis, and dissemination.
2.2.2 Monitoring Frequency
Tunneling on the ECIS and NEIS projects was for the most part under wide citystreets, entailing single bores and smaller diameters. MGLEE on the other hand,entailed two larger bores with the alignment along a narrower street and closer to, ordirectly beneath, surface structures. Tighter control was thereby required for MGLEE.The comprehensive surface monitoring program for MGLEE was accomplished byMPBX monitoring with over 1,500 survey points along the alignment and usingdifferential leveling survey techniques to record the elevations throughout the
FMGM 2007: Seventh International Symposium on Field Measurements in Geomechanics © 2007 ASCE
Page 7
tunneling phase.
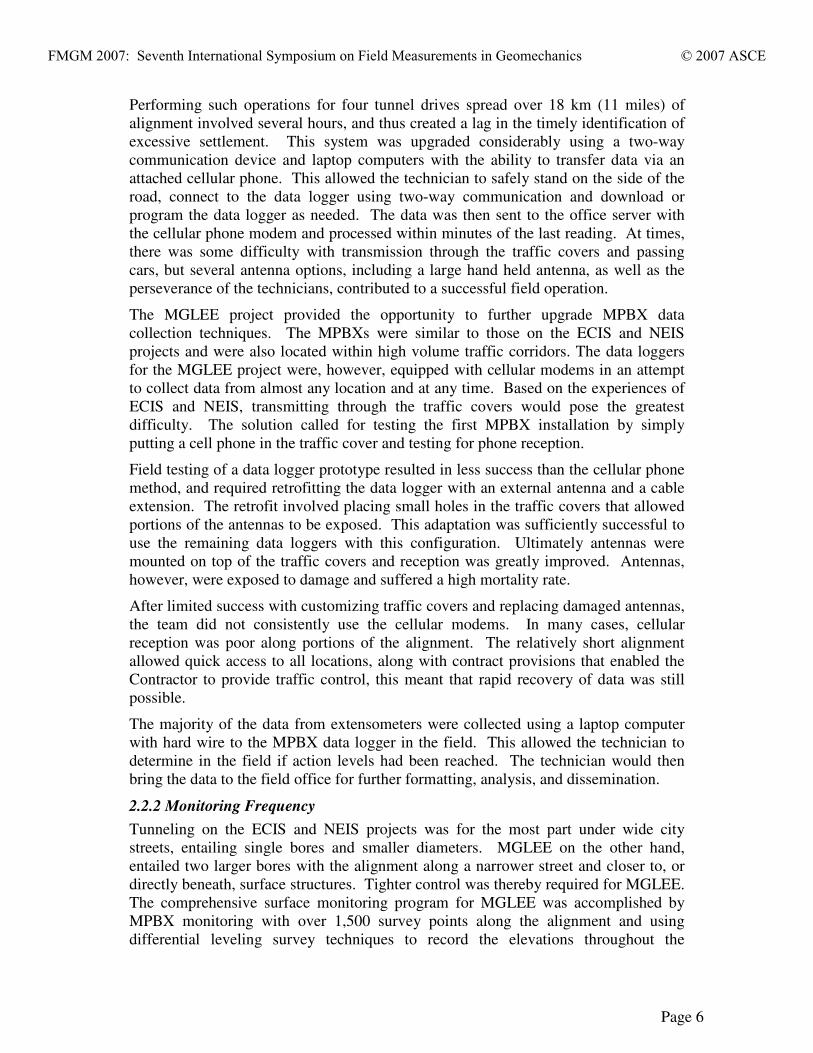
FIG 4. Format, Surface Settlement Data Daily Report
The crews performed leveling surveys during each shift of tunneling. Each survey runbegan approximately 30 m (100 ft) in advance of the TBM and extended toapproximately 100 m (300 ft) behind the TBM. The survey included tunnel centerlinemeasurements every 8 m (25 ft), as well as buildings within 100 ft of the centerline. .Additionally, the survey included arrays of points orthogonal to the centerline, whichoccurred every 30 m (100 ft) and extended out as far as 40 m (140 ft) from thecenterlines, generally at street intersections. Points adjacent to the extensometers wereincluded in the conventional surveys and used to correct relative movement of theMPBX anchors. The data collected were evaluated and distributed in a daily report.Reports consolidated data to provide a clear picture of the TBM position and surfacesettlement at specific locations and times. Figure 4 reproduces a portion of a dailyreport format.
3. TBM PERFORMANCE MONITORING
Prior to pressure-face tunneling, monitoring of ground loss from the tunnel excavation
Station 8/22/06 8/23/06 8/24/06 8/24/06 8/25/06 8/25/06 8/28/06 8/29/06228+00 0 0.02 in 0.07 in -0.02 in 0.06 in 0.02 in 0.05 in 0.08 in 0.01 in228+11 17 R 0.02 in 0.11 in -0.02 in 0.07 in 0.01 in 0.05 in 0.08 in 0.00 in228+25 0 0.01 in 0.07 in -0.02 in 0.07 in 0.04 in 0.04 in 0.07 in 0.02 in228+31 17 R 0.01 in 0.11 in 0.02 in 0.12 in 0.07 in 0.06 in 0.11 in 0.10 in228+40 17 R 0.02 in 0.01 in -0.04 in 0.07 in 0.02 in 0.04 in 0.11 in 0.02 in228+50 0 -0.04 in 0.05 in -0.05 in 0.05 in 0.01 in 0.02 in 0.05 in -0.01 in228+61 17 R 0.11 in -0.05 in 0.11 in -0.04 in 0.02 in 0.13 in -0.07 in228+75 0 0.07 in -0.07 in 0.06 in 0.00 in 0.02 in 0.07 in -0.01 in228+82 17 R 0.12 in -0.06 in -0.06 in 0.01 in 0.00 in -0.06 in228+92 20 R 0.08 in -0.10 in 0.07 in 0.00 in 0.04 in 0.17 in -0.06 in229+00 0 0.08 in -0.10 in 0.08 in -0.02 in 0.01 in 0.07 in -0.05 in229+05 20 R -0.14 in -0.05 in 0.02 in 0.01 in 0.11 in -0.08 in229+50 0 -0.01 in 0.01 in -0.07 in -0.07 in -0.01 in -0.11 in230+50 0 0.04 in -0.06 in230+75 0 0.04 in -0.05 in231+00 0 -0.02 in
Offset
EastBound:Surface Settlem entM onitoring
East Bound Monitoring Zone
Mined from230+17 to 230+98
on 8/29/2006Note: Report edited for clarity
FMGM 2007: Seventh International Symposium on Field Measurements in Geomechanics © 2007 ASCE
Page 8
was limited to visual observations and counting muck cars. Monitoring of groundsurface with MPBX and leveling has also been used effectively for many years. Thesemeasures, however, give no indication of the cause of settlement. Additionally, sinceMPBX measurements are widely spaced and surveying occurs after the fact, MPBXsmay not be comprehensive predictors of imminent settlement. EPB technologyaffords parameters that can be used to assess ground loss potential, which in turnindicate the likelihood of surface settlement. The parameters are the earth pressuremeasured in the TBM plenum and the amount of grout injected into the annular spacebetween the excavated surface and structural lining. The next section discusses theseparameters and the associated phenomena.
3.1 Stability of the Tunnel Face
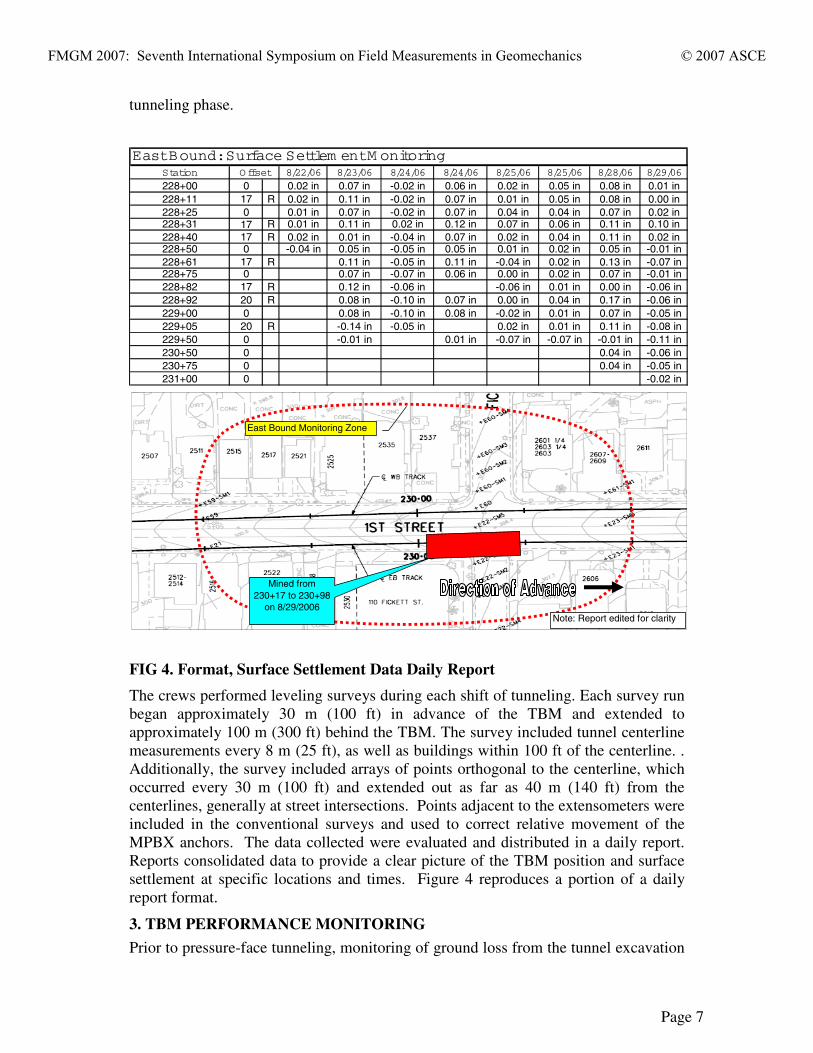
Tunneling technologies have evolved over the past 20 years to limit the amount ofground loss (over-excavation) through better control of the tunnel face and excavatedperimeter. Pressure-face TBMs, as used on the three projects described herein,demonstrate an important, cost effective approach to limiting over-excavation. Theprincipal of EPB is straight forward, i.e., the pressure exerted on the working face issufficient to prevent unexcavated soil and groundwater from running or flowing intothe tunnel. To accomplish this, EPB technology incorporates a chamber, or plenum, atthe working face that is sealed from the tunnel environment. Excavated soil fills thechamber and is removed from the chamber via an enclosed screw conveyor anddischarged at the end of the screw through a gate. Once the plenum and screw arefilled, pressure builds up and is controlled by the advance rate of the machine anddischarge rate through the auger. A schematic cross section of an EPB TBM is shownin Fig. 5.
Figure 5 Schematic of EPB TBM
FMGM 2007: Seventh International Symposium on Field Measurements in Geomechanics © 2007 ASCE
Page 9
When balanced, the closed system exhibits steady-state condition, such that:
Q in = Q out, in whichQ in = soil “flow” into the system andQ out = “flow” out of the system.
Under steady-state conditions constant pressure in the plenum and screw augerpreclude over-excavation. The pressure maintained in the plenum and screw auger isthe most important parameter. Low pressure indicates that steady-state flow is notpresent in the system or the chamber is not full, the working face may not be stable,and over-excavation could occur.
For the MGLEE operation, the contractor computed the required pressure in theplenum. The specifications required this to be equal to the hydrostatic pressure plusthe soil pressure, with soil pressure estimated to be between 10 psi and the at-resthorizontal earth pressure. As an applied safety factor, the contractor added 0.3 to 0.8bar (4 to12 psi) above the theoretical pressures. These pressures were computed overthe entire alignment for the varying water and soil pressures that the TBM wouldencounter. The computed pressures provided guidance to the TBM operatorsconcerning the pressure to be maintained upon the tunnel face at any point along thealignment.
Because the pressure within the plenum is such an important parameter in maintainingthe stability of the working face, each TBM had six pressure gauges installed in thebulkhead wall of the plenum. These were located at various levels as pressure variesfrom top to bottom of the plenum and wear could possibly render them ineffective.Pressure cells were constantly monitored and were re-calibrated monthly.
3.2 TBM Data Acquisition
Each TBM transmitted real-time data to project field offices. The data transmittedincluded over 100 parameters, recorded every 10 seconds. This resulted in 864,000elements of data for each machine daily. Although all of the parameters werepertinent to TBM operation, parameters such as soil pressure in the plenum and groutquantities were of paramount importance with respect to the stability of the face andsubsequent subsidence. Other parameters include extension of hydraulic rams,segment erecter position and grout volumes injected. In “real time” TBM parameterswere transmitted to the Contractor and CM’s field offices. They could thereforeassess progress and TBM performance instantly.
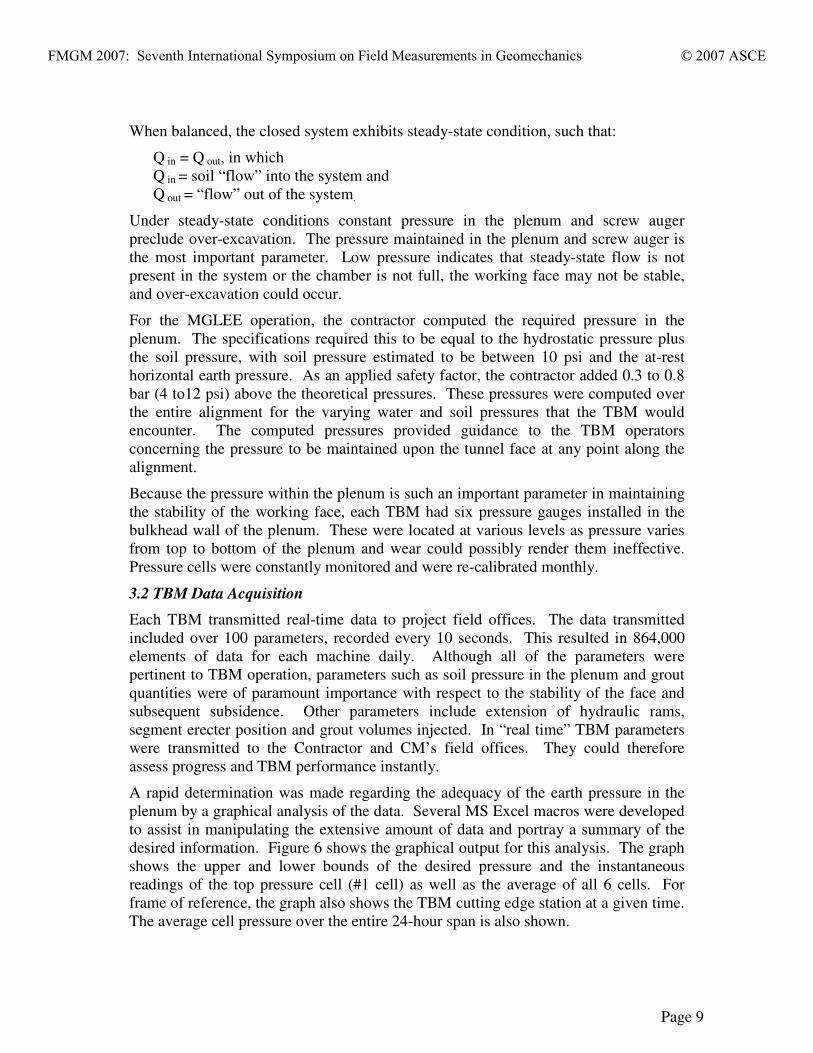
A rapid determination was made regarding the adequacy of the earth pressure in theplenum by a graphical analysis of the data. Several MS Excel macros were developedto assist in manipulating the extensive amount of data and portray a summary of thedesired information. Figure 6 shows the graphical output for this analysis. The graphshows the upper and lower bounds of the desired pressure and the instantaneousreadings of the top pressure cell (#1 cell) as well as the average of all 6 cells. Forframe of reference, the graph also shows the TBM cutting edge station at a given time.The average cell pressure over the entire 24-hour span is also shown.
FMGM 2007: Seventh International Symposium on Field Measurements in Geomechanics © 2007 ASCE
Page 10
The graph shows the pressure in cell #1 to be low, however the plot of the average ofall six cells, shows that the pressure throughout the plenum is more than adequate.This indicated malfunctioning of this cell. Pressure cells could be installed andremoved from within the TBM (“back-loaded”) without man entry into the plenum,and when malfunctioning occurred, a cell could be easily replaced. In this case, thecell was caked with clay so it was cleaned, calibrated, and re-installed.
Chamber Pressure
0.00 bar
1.00 bar
2.00 bar
3.00 bar
4.00 bar
12:00 AM 4:00 AM 8:00 AM 12:00 PM 4:00 PM 8:00 PM 12:00 AM
Time of Day
Cel
lPre
ssur
e
261+25
261+50
261+75
262+00
262+25
Sta
tion
Average EP
Cell 1 EP
DesiredEP Range
Push
Minmimum EP
MachineProgress
Ave. CellPressurehi
Fig 6: Graphic Daily Summary of Earth Pressure
Filling the Annulus
In addition to ground loss occurring at the working face, another source of loss iswithin the annulus formed between the excavated perimeter surface and the outside ofthe installed lining. For MGLEE tunnels, the additional “gap” was 135 mm (5.32 in).This gap could potentially result in void space into which soil can collapse, so the voidis filled with grout. To accomplish this, grout ports were located at the extreme end ofthe TBM shield. The theoretical volume of the annulus for a 1.5 m (5 ft) tunnelsegment was 4,146 liters (5.42 cy).
To monitor ground loss via the excavated annulus, backfill grout take volume, whichwas one of the components of the automated data acquisition, were analyzed daily ormore frequently as required to understand performance.
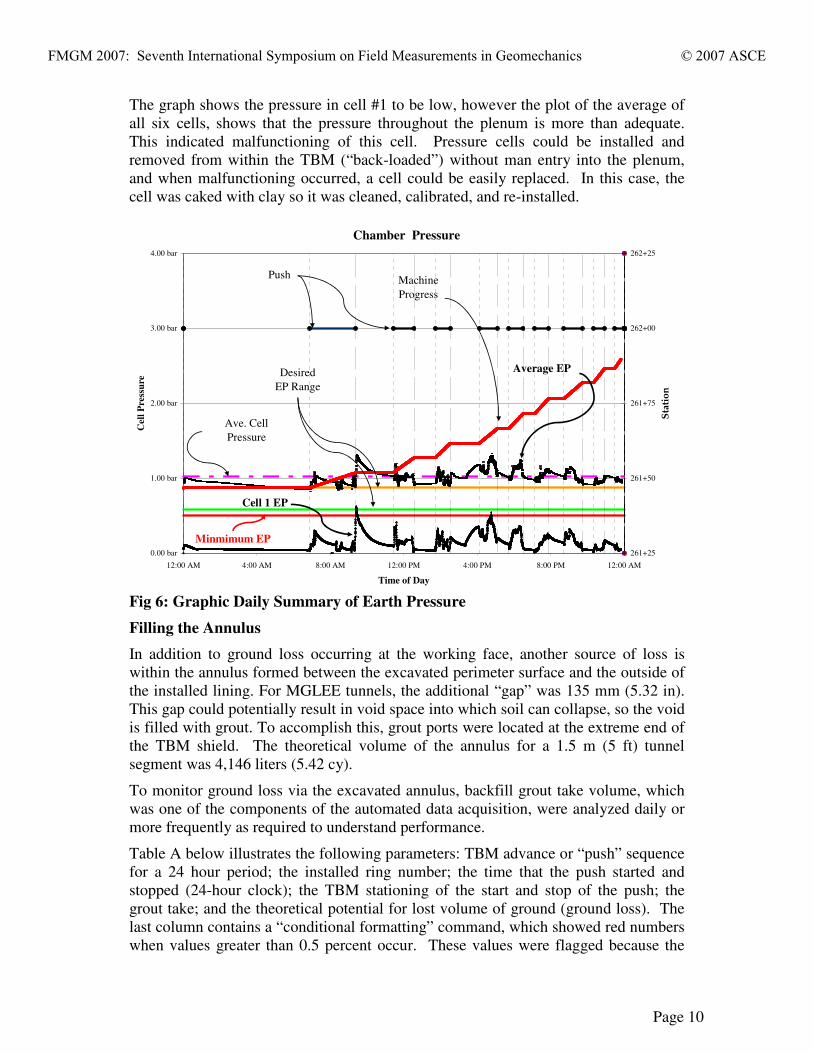
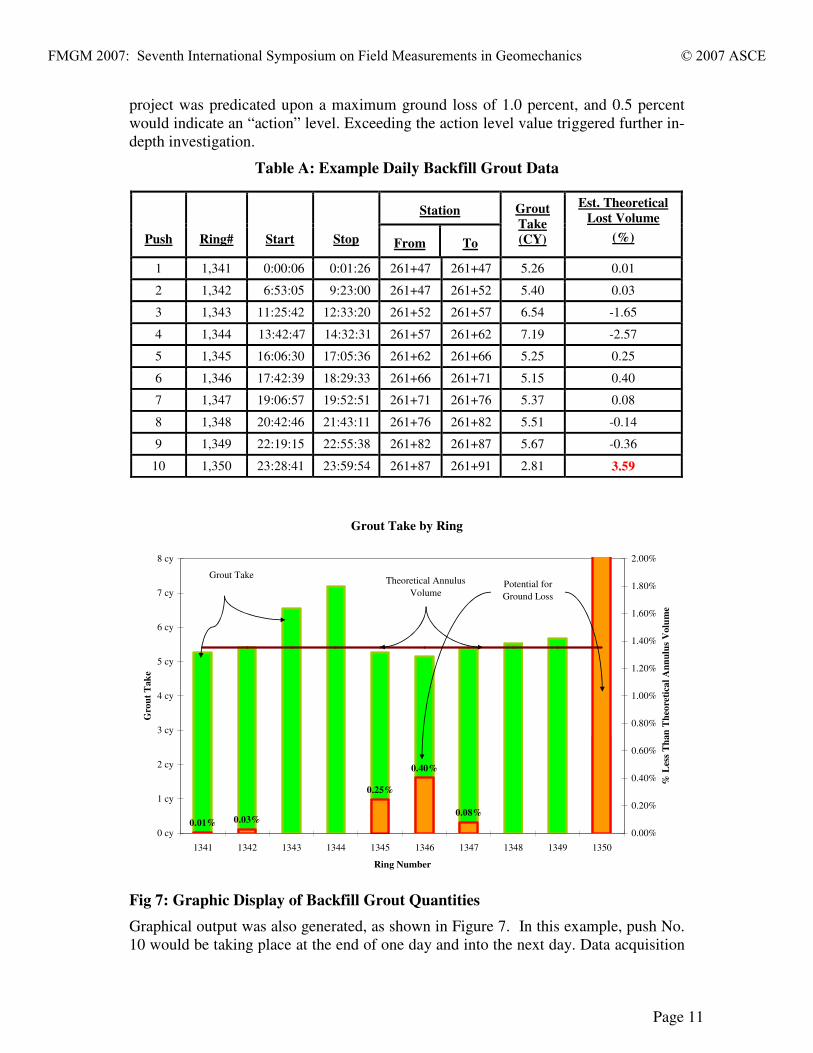
Table A below illustrates the following parameters: TBM advance or “push” sequencefor a 24 hour period; the installed ring number; the time that the push started andstopped (24-hour clock); the TBM stationing of the start and stop of the push; thegrout take; and the theoretical potential for lost volume of ground (ground loss). Thelast column contains a “conditional formatting” command, which showed red numberswhen values greater than 0.5 percent occur. These values were flagged because the
FMGM 2007: Seventh International Symposium on Field Measurements in Geomechanics © 2007 ASCE
Page 11
project was predicated upon a maximum ground loss of 1.0 percent, and 0.5 percentwould indicate an “action” level. Exceeding the action level value triggered further in-depth investigation.
Table A: Example Daily Backfill Grout Data
Grout Take by Ring
0.01% 0.03%
0.25%
0.40%
0.08%
0 cy
1 cy
2 cy
3 cy
4 cy
5 cy
6 cy
7 cy
8 cy
1341 1342 1343 1344 1345 1346 1347 1348 1349 1350
Ring Number
Gro
utT
ake
0.00%
0.20%
0.40%
0.60%
0.80%
1.00%
1.20%
1.40%
1.60%
1.80%
2.00%
%L
ess
Tha
nT
heor
etic
alA
nnul
usV
olum
e
Grout TakeTheoretical Annulus
VolumePotential forGround Loss
Fig 7: Graphic Display of Backfill Grout Quantities
Graphical output was also generated, as shown in Figure 7. In this example, push No.10 would be taking place at the end of one day and into the next day. Data acquisition
Station
Push Ring# Start Stop From To
GroutTake(CY)
Est. TheoreticalLost Volume
(%)
1 1,341 0:00:06 0:01:26 261+47 261+47 5.26 0.01
2 1,342 6:53:05 9:23:00 261+47 261+52 5.40 0.03
3 1,343 11:25:42 12:33:20 261+52 261+57 6.54 -1.65
4 1,344 13:42:47 14:32:31 261+57 261+62 7.19 -2.57
5 1,345 16:06:30 17:05:36 261+62 261+66 5.25 0.25
6 1,346 17:42:39 18:29:33 261+66 261+71 5.15 0.40
7 1,347 19:06:57 19:52:51 261+71 261+76 5.37 0.08
8 1,348 20:42:46 21:43:11 261+76 261+82 5.51 -0.14
9 1,349 22:19:15 22:55:38 261+82 261+87 5.67 -0.36
10 1,350 23:28:41 23:59:54 261+87 261+91 2.81 3.59
FMGM 2007: Seventh International Symposium on Field Measurements in Geomechanics © 2007 ASCE

Page 12
for that day, however, ended at 11:59:59 PM. This required that the final grout takequantity be determined at the completion of that push, which was recorded as data forthe next day. Thus, the high apparent high readings do not necessarily indicateexcessive ground loss. Since the data were readily available due to thecontemporaneous data acquisition scheme, it was a relatively simple matter to makethe necessary adjustments to correct for this. The Contractor and CM team couldcorrelate proper earth pressure within the plenum and sufficient grouting of theannulus to limit the potential for settlement
CONCLUSIONS
Monitoring data– geotechnical instrumentation and TBM performance - were for themost part automated and could be retrieved in real time or within a few hours. Thisallowed for the TBM data to be analyzed in conjunction with the geotechnical datawithin minutes of collection. The result was a timely cause and effect analyses ofTBM performance, which was essential to verifying compliance with the tunnelingspecifications and to initiating mitigation plans in a timely manner. This experienceproved invaluable, since geotechnical instrumentation can only be installed at discretepoints. With subsidence related to TBM performance, the stream of TBM data notonly provided a continuous record of performance, but also afforded a means toindicate potential subsidence. Conventional surveying verified the predictions.
The ability to monitor tunneling performance using the real time TBM performancedata while verifying these results with traditional geotechnical monitoring andsurveying, provided further evidence that EPB TBMs can safely excavate in an urbansetting with limited cover through soft and dense alluvial soils. The data producedwill provide case histories of successful performance needed to support futureprojects.
As technology advances, automated systems have the potential to reduce the numberof technicians needed to read instrumentation. For example using data loggers withcellular modems from within traffic covers has already shown promising results andcan facilitate web based data management from remote locations. Addition testing ofmore durable antennas, signal boosters, and traffic cover composition is needed toprovide more reliable results
REFERENCES
Choueiry E, M. Elioff, and J. Richards. Planning and Construction of the Metro GoldLine Eastside Extension Tunnels, Rapid Excavation and Tunneling Conference(RETC), Toronto, 2007
Crow, M. and Holzhauser, J., Performance of Four EPB-TBMs Above and Below theGroundwater Table on the ECIS Project, Los Angeles, CA
Robinson, B. and Bragart, C., LACMTA Gold Line Extension Tunnels Case HistoryRETC, 2007
Zernich, B, B. Robinson, and M. Krulc, Northeast Interceptor Sever, Case History,RETC, 2005.
FMGM 2007: Seventh International Symposium on Field Measurements in Geomechanics © 2007 ASCE