Embed Size (px)
Citation preview

Luna, et al. 1
Monitoring Micropile Foundations of Bridge during Construction
Ronaldo Luna1, PE, PhD, F.ASCE, Devin T. Dixon2, Kyle A. Kershaw3, PhD, PE, M.ASCE, and Timothy C. Siegel4, PE, GE, DGE, M.ASCE
1Professor and Chair, Saint Louis University, Saint Louis, MO 65409; [email protected]
2Civil Engineer, Federal Highway Administration, Lakewood, CO; [email protected] 3Assistant Professor, Rose-Hulman Institute of Technology, IN; [email protected]
4Principal, Dan Brown and Associates, TN; [email protected]
ABSTRACT: Information regarding the load transfer of micropiles during construction loading has not been reported in the literature. The instrumented micropile foundation system reported herein was for Bridge No. 2 of the Foothills Parkway in eastern Tennessee completed in December of 2012. Vibrating wire strain gages were installed at select locations along the micropiles within two of the pile groups. Two strain gages were installed in the bond zone and the remainder near the top and middle of the cased length. Subsurface conditions consisted of medium dense to very dense sand and gravel with varying amounts of silt and clay overlaying conglomerate bedrock. The bond zone of the micropiles was installed within the bedrock strata and the dramatic dipping of the top of rock impacted the length of the micropiles and load transfer. Data was collected from the array of strain gages, such that each set of data corresponded to a different bridge construction stage. Monitoring during construction loading indicated that the variable pile lengths that were necessary because of the geologic setting resulted in load concentration on the shorter piles within the pile groups. Based on the strain data measured along the entire length of the micropiles, load transfer occurred within the bond zone, but significant load was also transferred along the cased length. All the measured loads were well below the structural capacity for the piles. INTRODUCTION The Foothills Parkway project was authorized by an Act of Congress in 1944. The following year, the Tennessee Legislature appointed the Tennessee Highway Department to buy the rights-of-way for the roadway. In 1947 the State authorized the transfer of these rights to the National Parks Service. However, the Foothills Parkway project was not officially scheduled for construction as part of the National Park Service’s Mission 66 program until 1956. This program was intended to expand the visitor services of the NPS by 1966 (FPMP, 1968). Construction eventually began on the first section of the Foothills Parkway in 1960 (FPMP, 1968). Since the Foothills Parkway project was authorized in 1944, it has been constantly stalled due to funding difficulties. These difficulties have, in turn, caused the Foothills Parkway project
878IFCEE 2015 © ASCE 2015
Luna, et al. 2
to be deemed the oldest unfinished highway project in the state of Tennessee (Martin, 2009). A map of the Foothills Parkway, courtesy of the National Parks Service, can be seen in Figure 1.
FIG. 1. Foothills Parkway Overview Map (NPS, 1998)
The area of interest for this particular project was Section 8E (circled in Figure 1), also known as the “Missing Link.” This section of the roadway is expected to connect Wears Valley to Carr Creek. It will require a series of ten bridges over a 1.6 mile section. Through the cooperation of the National Parks Service, FHWA, and Dan Brown and Associates, Missouri University of Science and Technology researchers were granted permission to install instrumentation at this site. This instrumentation was used to monitor the micropiles supporting the superstructure of Bridge No. 2 on the Foothills Parkway Missing Link. The substantial completion date for Bridge No. 2 was December 13, 2012 (Bell, 2012). December 31, 2012 was the scheduled final completion date (Bell, 2012). This paper presents a summary of the installation of instrumentation and results of the monitoring program of micropile foundations during construction of the Foothills Parkway Bridge No. 2. Data collected during the construction process is uncommon among researchers. The results of this project hopefully assist micropile designers and contractors to produce more efficient micropile designs in the future (Kershaw, 2011). The results explain the behavior of load transfer and its effects during the construction timeline. In addition, a controlled load test using fully loaded dump trucks on the bridge deck was carried out towards the end of construction. The instrumentation is installed on the bridge substructure and available to researchers that wish to continue the data collection with time.
879IFCEE 2015 © ASCE 2015
Luna, et al. 3
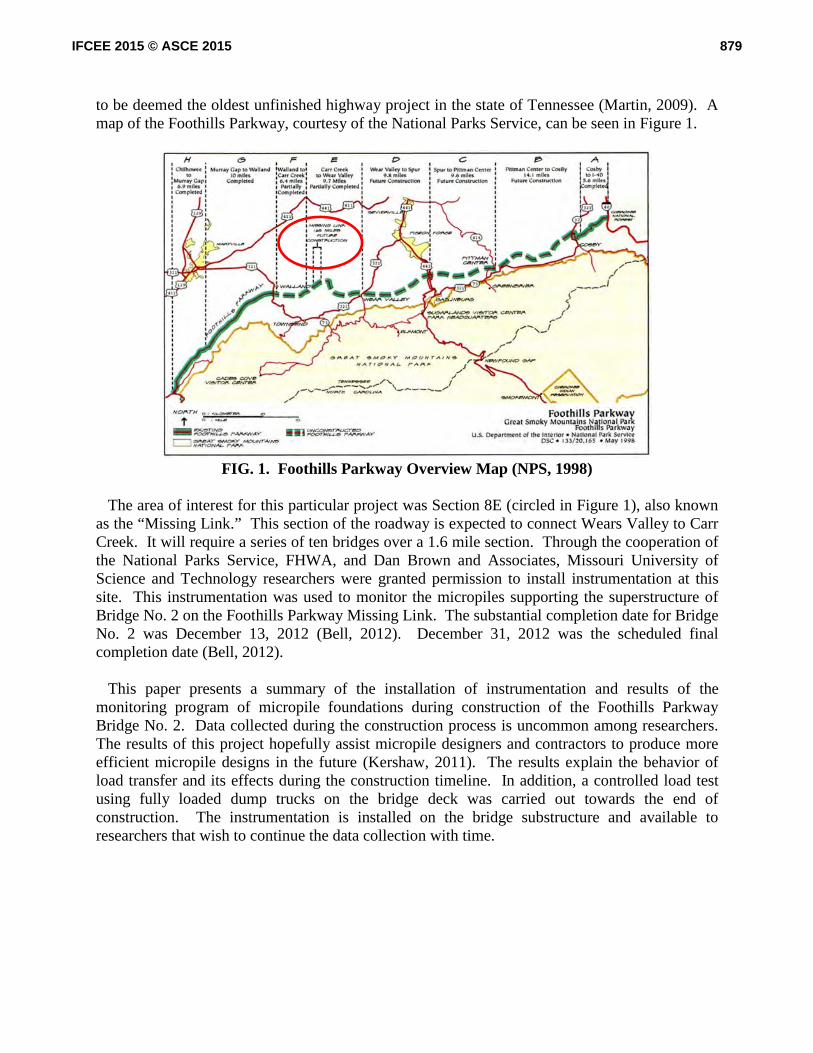
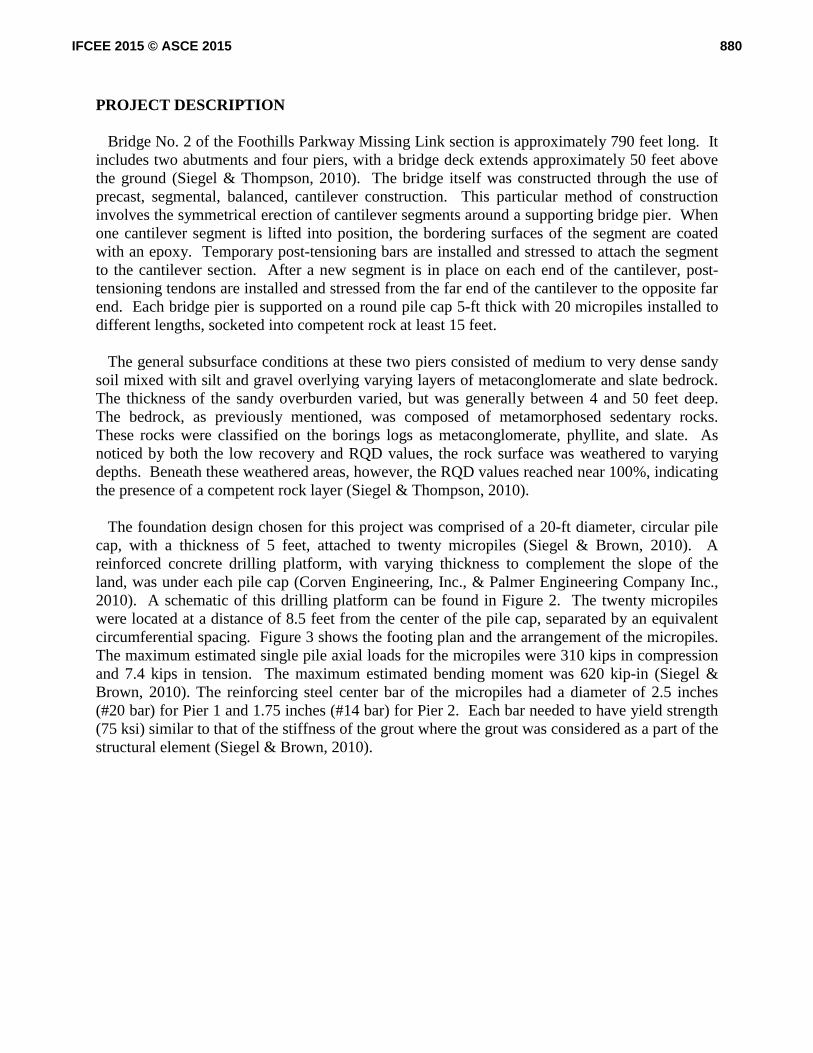
PROJECT DESCRIPTION Bridge No. 2 of the Foothills Parkway Missing Link section is approximately 790 feet long. It includes two abutments and four piers, with a bridge deck extends approximately 50 feet above the ground (Siegel & Thompson, 2010). The bridge itself was constructed through the use of precast, segmental, balanced, cantilever construction. This particular method of construction involves the symmetrical erection of cantilever segments around a supporting bridge pier. When one cantilever segment is lifted into position, the bordering surfaces of the segment are coated with an epoxy. Temporary post-tensioning bars are installed and stressed to attach the segment to the cantilever section. After a new segment is in place on each end of the cantilever, post-tensioning tendons are installed and stressed from the far end of the cantilever to the opposite far end. Each bridge pier is supported on a round pile cap 5-ft thick with 20 micropiles installed to different lengths, socketed into competent rock at least 15 feet. The general subsurface conditions at these two piers consisted of medium to very dense sandy soil mixed with silt and gravel overlying varying layers of metaconglomerate and slate bedrock. The thickness of the sandy overburden varied, but was generally between 4 and 50 feet deep. The bedrock, as previously mentioned, was composed of metamorphosed sedentary rocks. These rocks were classified on the borings logs as metaconglomerate, phyllite, and slate. As noticed by both the low recovery and RQD values, the rock surface was weathered to varying depths. Beneath these weathered areas, however, the RQD values reached near 100%, indicating the presence of a competent rock layer (Siegel & Thompson, 2010). The foundation design chosen for this project was comprised of a 20-ft diameter, circular pile cap, with a thickness of 5 feet, attached to twenty micropiles (Siegel & Brown, 2010). A reinforced concrete drilling platform, with varying thickness to complement the slope of the land, was under each pile cap (Corven Engineering, Inc., & Palmer Engineering Company Inc., 2010). A schematic of this drilling platform can be found in Figure 2. The twenty micropiles were located at a distance of 8.5 feet from the center of the pile cap, separated by an equivalent circumferential spacing. Figure 3 shows the footing plan and the arrangement of the micropiles. The maximum estimated single pile axial loads for the micropiles were 310 kips in compression and 7.4 kips in tension. The maximum estimated bending moment was 620 kip-in (Siegel & Brown, 2010). The reinforcing steel center bar of the micropiles had a diameter of 2.5 inches (#20 bar) for Pier 1 and 1.75 inches (#14 bar) for Pier 2. Each bar needed to have yield strength (75 ksi) similar to that of the stiffness of the grout where the grout was considered as a part of the structural element (Siegel & Brown, 2010).
880IFCEE 2015 © ASCE 2015
Luna, et al. 4
FIG. 2. Drilling Platform Schematic (Corven Eng. Inc. & Palmer Eng. Inc., 2010)
FIG. 3. Footing Plan (Corven Eng., Inc. & Palmer Eng., Inc., 2010)
INSTALLATION OF INSTRUMENTATION AND MONITORING PLAN The axial strain changes occurring in the micropiles were measured with concrete embedded strain gages (Geokon Model 4200). A Geokon Model 4999 terminal box was installed on the outside surface of the pile cap. The gages were pre-attached to a #4 bar bent to shape and mounted to the micropile’s central reinforcing bar (Kershaw, 2011). These gages were installed at the same time as the micropiles were installed in the ground, two in the bond zone and the rest in the cased length. The device used to collect data from both the terminal boxes as well as the surface gages installed near the base of the pre-cast concrete piers was a Geokon Model GK-404 vibrating wire readout. This palm-sized readout device provided strain readings for the location where the instrumentation was installed. The instrumentation was installed in the most ruggedized fashion to survive the heavy construction, and only one VWSG was lost out of the total 54 installed in the micropiles.
881IFCEE 2015 © ASCE 2015
Luna, et al. 5
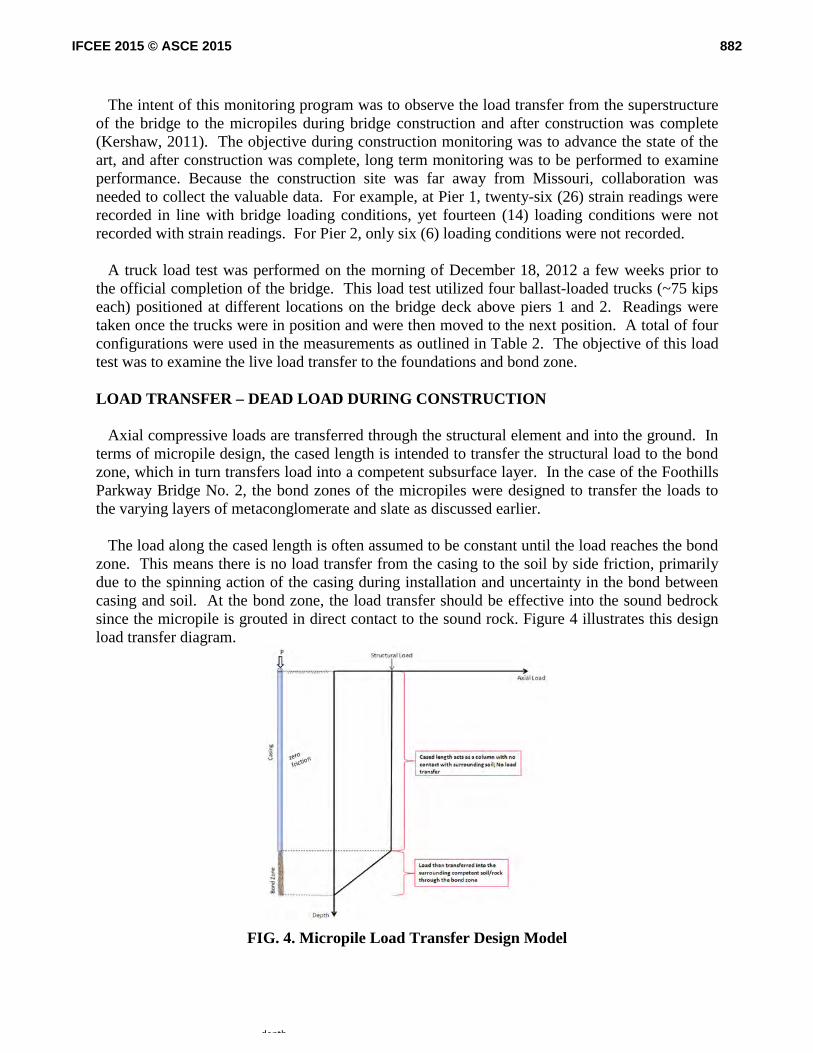
The intent of this monitoring program was to observe the load transfer from the superstructure of the bridge to the micropiles during bridge construction and after construction was complete (Kershaw, 2011). The objective during construction monitoring was to advance the state of the art, and after construction was complete, long term monitoring was to be performed to examine performance. Because the construction site was far away from Missouri, collaboration was needed to collect the valuable data. For example, at Pier 1, twenty-six (26) strain readings were recorded in line with bridge loading conditions, yet fourteen (14) loading conditions were not recorded with strain readings. For Pier 2, only six (6) loading conditions were not recorded. A truck load test was performed on the morning of December 18, 2012 a few weeks prior to the official completion of the bridge. This load test utilized four ballast-loaded trucks (~75 kips each) positioned at different locations on the bridge deck above piers 1 and 2. Readings were taken once the trucks were in position and were then moved to the next position. A total of four configurations were used in the measurements as outlined in Table 2. The objective of this load test was to examine the live load transfer to the foundations and bond zone. LOAD TRANSFER – DEAD LOAD DURING CONSTRUCTION Axial compressive loads are transferred through the structural element and into the ground. In terms of micropile design, the cased length is intended to transfer the structural load to the bond zone, which in turn transfers load into a competent subsurface layer. In the case of the Foothills Parkway Bridge No. 2, the bond zones of the micropiles were designed to transfer the loads to the varying layers of metaconglomerate and slate as discussed earlier. The load along the cased length is often assumed to be constant until the load reaches the bond zone. This means there is no load transfer from the casing to the soil by side friction, primarily due to the spinning action of the casing during installation and uncertainty in the bond between casing and soil. At the bond zone, the load transfer should be effective into the sound bedrock since the micropile is grouted in direct contact to the sound rock. Figure 4 illustrates this design load transfer diagram.
FIG. 4. Micropile Load Transfer Design Model
depth
882IFCEE 2015 © ASCE 2015
Luna, et al. 6
These design assumptions on load transfer distribution serve the purpose for the construction of a safe foundation. However, they are made due to the uncertainties and lack of understanding on the actual load transfer. In construction practice, and in particular at the Foothills Parkway Bridge No. 2 site, often the casing does develop some type of contact with the ground, hence developing some skin friction, which was measured. For example, a gap could potentially exist between the soil and the casing due to the drilling action and spinning of the casing. If a gap did exist, then load transfer through skin friction would not be possible. However the soil overburden pressure may close this gap. Also, the grout from within the casing could leak into the gap if the casing is not sealed at the bottom of the cased length. Combinations of these conditions are likely to develop a variety of load transfer distributions. At Pier 1, six column segments were placed on top of the pile cap. After that, a starter cantilever segment was placed on the top of the column segments and then 20 cantilever segments were added laterally on both the up-station and down-station sides. The approximate load to the top of the footing on Pier 1 was 1,153 tons (2,306 kips), after construction completion (VSL, personal communication, 5/17/2012). This load was then distributed to the pile cap, shallow soils below the concrete drilling platform, and the twenty micropiles. Micropiles 1, 4, 11, and 16 at Pier 1 were instrumented with vibrating wire strain gages at varying depths. Micropile No. 1 was positioned on the uphill side of the slope and was significantly shorter than the other instrumented micropiles. The cased length extended to a depth of 28 feet and the bond length continued another 15 feet making the depth of the pile below the pile cap equal to 43 feet. Another important note is that the upper foot and a half of the micropile below the pier footing was surrounded by the reinforced concrete drilling platform. As a result, this platform absorbed some of the load transferred from the pier footing. The dramatic dip of the rock layer is another geotechnical factor that needs to be taken into account. Figure 5 shows the load transfer distribution for P1P1 (Pile 1, Pier 1). The load transfer rarely followed a uniformly distributed vertical path in the cased length. This, in turn, showed that the load was mostly transferred through skin friction in the cased length. However, once the load reached the bond zone, the load was more effectively transferred into the rock formation.
Figure 5 shows two envelopes of interest. The design load envelope (dashed red) shows the load that the pile was estimated to carry by the engineer. This design load was the maximum compression axial load, or Pc, that was calculated using GROUP analysis. It can be noticed from the plot that the loads felt by the upper gages in the cased length exceeded this design load. The second envelope (solid red) is the structural capacity envelope. This envelope shows the factored structural resistance of both the upper cased length, RCC, and the lower uncased length, RCU, of a micropile having no unsupported length and loaded in compression. Based on design, this envelope, and the measured loads, it can be said that the pile performs well under the structural capacity. Of significant interest with this pile is the large amount of load that was recorded at a shallow depth. As compared to the other piles, this pile was rightly working harder than the others. Nearly 430 kips were measured in the uppermost strain gage near the time of the final loading. This may be caused in part by the fact that this pile was significantly shorter than the other piles. Consequently, shorter piles behave stiffer than longer piles. This pile was terminated short due to the top of rock being close to the surface on the uphill side as opposed to the downhill side.
883IFCEE 2015 © ASCE 2015

Luna, et al. 7
As stated by Siegel (2012), the objective of securing the micropiles was to find “15 feet of good, solid rock” to surround the bond zone area. Therefore, once the pile finished transferring the load through side friction, the remaining load then went into the surrounding rock in the bond zone.
FIG. 5. Pile 1, Pier 1 (P1P1): Construction Loading
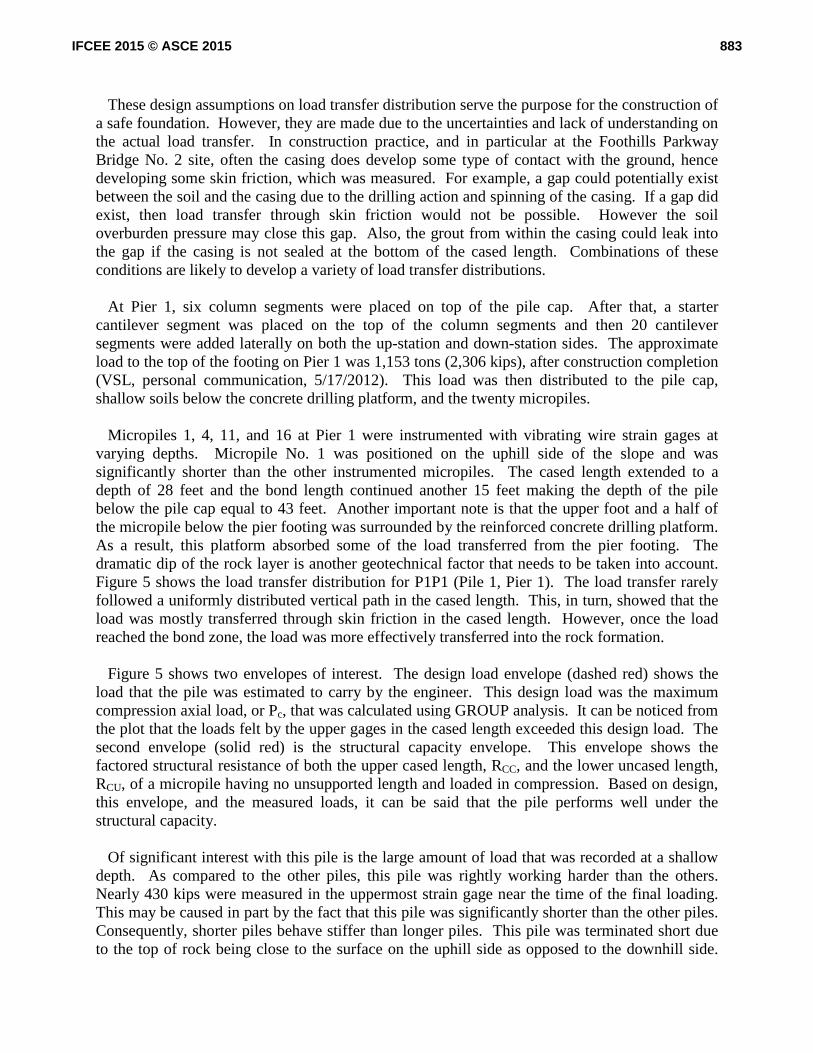
Directly opposite of P1P1 on the downhill side of the slope is P11P1. This micropile extended to a depth of 91 feet below the pile cap and had a cased length of 73 feet and a bond length of 18 feet. The depth to a competent rock layer was 76 feet below the pile cap. The drilling platform, which varied in depth, had a thickness of 6 feet meaning that micropile 11 was encased by reinforced concrete in the upper 6 feet beneath the pile cap. The inset in Figure 6 shows a sketch of pile 11 and the location of the instrumentation. Compared with pile 1, pile 11 was much less stressed and very well within the design envelope. The peak load was located in the lower half of the cased length and then steadily decreased into the bond zone and the surrounding rock. The concrete drilling platform in the upper 6 feet also assimilated some of the construction loads that were therefore not transferred to the micropile. The loads measured along this pile were well below both the design load and the overall structural capacity of the pile. These factors may be due to the fact that pile 11 was nearly twice as long as pile 1. The pile was not only longer, but also had a much stiffer connection near the top. A slight amount of tension was measured in both the uppermost and lowermost gages installed on pile 11. This can be explained by a few possible scenarios. The first of these is the grout curing effects on the installed strain gages. It is possible that while the grout was curing in the early stages of the construction process that the barbell ends of the strain gages were gradually pulled apart. This would then have forced the strain gages to read tension until a significant
884IFCEE 2015 © ASCE 2015
Luna, et al. 8
amount of compressive load was reached at these locations. In turn, this situation infers that all of the monitored loads were less than what was actually monitored by the strain gages by a certain amount of initial tensioning caused by the hydration of the grout. The second possible scenario is that a gap existed at the bottom of the pile between the grout and the rock. A gap in this location would have caused the strain gages to read tension until the gap was closed allowing for compression to take place between the grout and rock interface. The third scenario is that the tension readings may have been within the range of error of the measured load. This slight incidence of tension readings can be seen in other instrumented piles, but since it was such a diminutive amount of tension it was deemed of low impact in this research project.
FIG. 6. Pile 11, Pier 1: Construction Loading
FIG. 7. Pile 1, Pier 1 Construction Sequence
885IFCEE 2015 © ASCE 2015
Luna, et al. 9
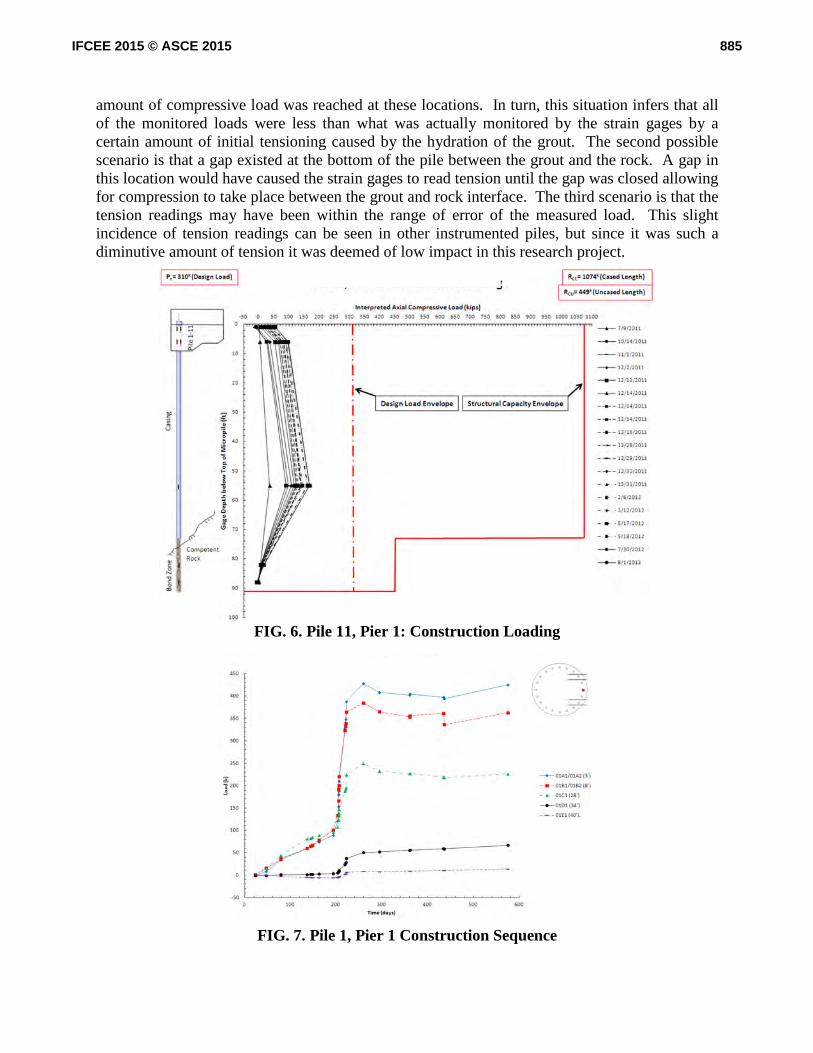
The load versus time plot for pile 1, pier 1 (P1P1) can be seen in Figure 7. The plot shows the measured load from each of the seven gages installed on the micropile. The legend to the right of the plot indicates which lines corresponds to which gage and in parentheses next to the gage name is the depth of embedment of the gage beneath the bottom of the pile cap. The figure located in the upper right of the plot shows a cross section view of the pile cap and the twenty micropiles. The micropile highlighted in red is P1P1. LOAD TRANSFER – LIVE LOADING, TRUCK
For the live loading test, the objective was to determine the load transfer only due to the loaded trucks. Thus, the zero reading (or baseline) needed to be determined. This baseline reading was taken the morning of the load test (12/18/2012 at 7:00am) without any traffic load. Table 2 shows the truck loading positions and their respective descriptions as discussed in the previous section.
Table 2. Truck Loading Configurations and Descriptions
Loading Configuration
Description
1 Four trucks directly on top of Pier 1 or Pier 2 2 Four trucks on the down-station closure joint 3 Two trucks on each closure joint 4 Four trucks on the up-station closure joint
The highest interpreted pile loads occurred during truck loading configuration #1 when all four dump trucks were directly on top on the pier. This finding was expected since all of the truck loading was concentrated on top of the bridge pier and little to none of the truck load was transferred to the bridge span. The second highest interpreted pile load occurred during loading configuration #4, when the four trucks were placed on the up-station closure joint. This may be because the bridge deck had a roughly 7.05% uphill grade from abutment 1 to abutment 2, meaning that pier 1 was set on the furthest down-slope side of the bridge and then gradually increased in elevation from pier to pier. As a result, when the four trucks were positioned on the up-station closure joint, they were also at the highest elevation on the pier bridge span. As the truck loads were transferred through the bridge, the loads progressed through the down-slope bridge span route as opposed to the up-slope route since it was the fastest and easiest means to the ground. Some of the truck loads were taken by the bridge span, or cantilever segments. Then, the remaining load was transferred through the column segments, the pile cap, the drilling platform, and then finally the micropiles.
A similar trend can be said to have happened during truck loading configuration #3, when two trucks were placed on each closure joint. The trucks located on the upslope closure joint transferred a significant portion of truck load to the micropiles because it was transferred through the downward gradient. The truck load when located on the opposite closure joint, downslope side, followed a similar trend except it was transferred towards the abutment or pier positioned at the lower elevation and thus the truck load was distributed down the bridge incline. Loading configuration #2, which positioned all four trucks on the down-station closure joint, resulted in the lowest interpreted pile load. This again follows the same theory that the load shifted down the inclined bridge deck and was transferred to the pier or abutment at the lower
886IFCEE 2015 © ASCE 2015

Luna, et al. 10
elevation than it was initially loaded. Figure 8 shows the load transfer for the live loading program at pier 1 for both micropiles discussed herein.
FIG 8. Micropiles 1 & 11, Pier 1 - Live Loading Interpretation
The highest interpreted pile load at pier 1 was 16 kips and was measured at P1P1, by gage 01B1/2 installed at 8 feet below the pile cap, during loading configuration #1. If, hypothetically, this maximum pile load was monitored by all 20 micropiles at pier 1, then the sum of the maximum loads monitored by the piles at pier 1 would be equal to 16 kips multiplied by 20 micropiles, or 320 kips. The sum of the applied truck loads was equal to roughly 294 kips, which is less than the previously calculated 320 kips. However, as shown in the plots in Figures
Loading Configuration
Loading Configuration
#1
#2
#3
#4
#1
#2
#3
#4
Pier 1, Pile 11
Pier 1, Pile 1
887IFCEE 2015 © ASCE 2015
Luna, et al. 11
8 and 9, the maximum monitored loads varied between the instrumented micropiles at pier 1 and the distribution of the applied 294 kips was not evenly shared amongst the micropiles at pier 1.
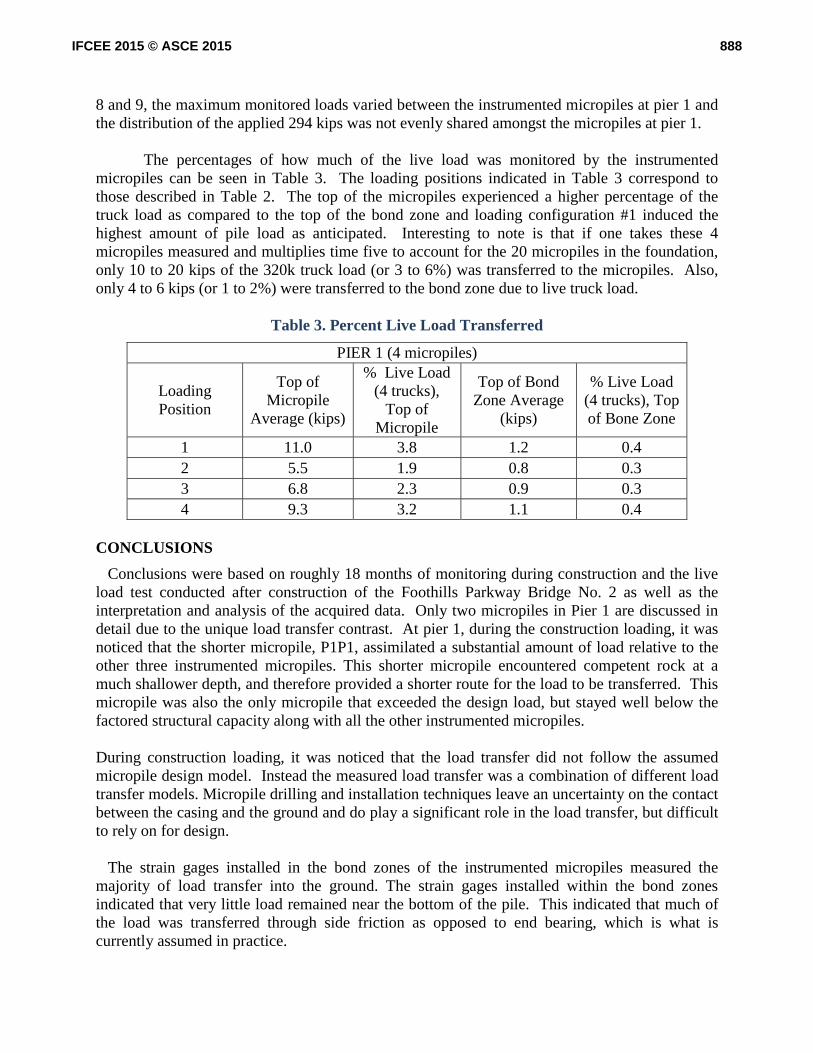
The percentages of how much of the live load was monitored by the instrumented micropiles can be seen in Table 3. The loading positions indicated in Table 3 correspond to those described in Table 2. The top of the micropiles experienced a higher percentage of the truck load as compared to the top of the bond zone and loading configuration #1 induced the highest amount of pile load as anticipated. Interesting to note is that if one takes these 4 micropiles measured and multiplies time five to account for the 20 micropiles in the foundation, only 10 to 20 kips of the 320k truck load (or 3 to 6%) was transferred to the micropiles. Also, only 4 to 6 kips (or 1 to 2%) were transferred to the bond zone due to live truck load.
Table 3. Percent Live Load Transferred
PIER 1 (4 micropiles)
Loading Position
Top of Micropile
Average (kips)
% Live Load (4 trucks),
Top of Micropile
Top of Bond Zone Average
(kips)
% Live Load (4 trucks), Top of Bone Zone
1 11.0 3.8 1.2 0.4 2 5.5 1.9 0.8 0.3 3 6.8 2.3 0.9 0.3 4 9.3 3.2 1.1 0.4
CONCLUSIONS
Conclusions were based on roughly 18 months of monitoring during construction and the live load test conducted after construction of the Foothills Parkway Bridge No. 2 as well as the interpretation and analysis of the acquired data. Only two micropiles in Pier 1 are discussed in detail due to the unique load transfer contrast. At pier 1, during the construction loading, it was noticed that the shorter micropile, P1P1, assimilated a substantial amount of load relative to the other three instrumented micropiles. This shorter micropile encountered competent rock at a much shallower depth, and therefore provided a shorter route for the load to be transferred. This micropile was also the only micropile that exceeded the design load, but stayed well below the factored structural capacity along with all the other instrumented micropiles. During construction loading, it was noticed that the load transfer did not follow the assumed micropile design model. Instead the measured load transfer was a combination of different load transfer models. Micropile drilling and installation techniques leave an uncertainty on the contact between the casing and the ground and do play a significant role in the load transfer, but difficult to rely on for design. The strain gages installed in the bond zones of the instrumented micropiles measured the majority of load transfer into the ground. The strain gages installed within the bond zones indicated that very little load remained near the bottom of the pile. This indicated that much of the load was transferred through side friction as opposed to end bearing, which is what is currently assumed in practice.
888IFCEE 2015 © ASCE 2015
Luna, et al. 12
Comparisons were made between the live truck loads, the measured final dead loads of the bridge, and the actual applied loads of the trucks. These comparisons confirmed that the truck loads were very small compared to bridge dead loads. The top of the casings measured more load than the top of the bond zones, meaning that load transfer did occur along the cased lengths of the micropiles even for live loading. Additionally, the percentage of live load that is transferred to the bond zone is less than 6 percent. A three dimensional soil-structure interaction model is currently being developed, which will incorporate the unique geologic conditions, dipping rock angles, micropile details, and constitutive relations and properties of the foundation materials. This numerical model will be used to further interpret the load transfer behavior of the measured foundation response. ACKNOWLEDGEMENTS
The authors acknowledge the collaboration of a number of companies and agencies: Bell & Associates, VSL, Structural Preservation Systems, Eastern Federal Lands Highway Division of FHWA, National Park Service and the Mid-America Transportation Center. Funding for the instrumentation equipment was provided by the ADSC-DFI Joint Micropile Committee. REFERENCES
Bell & Associates Construction (2012). “Progress Meeting, December 18, 2012.” Jobsite Trailer,Wears Valley, TN.
Corven Engineering, Inc. & Palmer Engineering Company, Inc. (2010). “Plans for Proposed Foothills Parkway Project PRA-FOOT 8E17.” Blount County, TN.
FPMP. National Parks Service- Planning, Environment, & Public Comment (NPS PEPC). (1968). “Foothills Parkway Master Plan.” U.S. Department of the Interior.
Kershaw, K. (2011). “Micropile Response to Combined Loading.” Ph.D. Dissertation, Missouri University of Science and Technology, Rolla, MO.
Martin, B. C. (2009). “Foothills Parkway.” Tennessee Encyclopedia of History and Culture Online, <http://tennesseeencyclopedia.net/entry.php?rec=477> (June 7, 2012).
National Parks Service (NPS) (1998). “Great Smoky Mountains National Park- Foothills Parkway History.” U.S. Department of the Interior.
Siegel, T.C. and Thompson, W.R., III (2010). “Foothills Parkway Bridge No. 2 Geotechnical Report.” Dan Brown and Associates Consulting Geotechnical Engineers, Sequatchie, TN.
Siegel, T.C. and Brown, D.A. (2010). “Micropile Design for Pier 1 Bridge No. 2-Foothills Parkway Blount County TN.” Dan Brown and . Associates Consulting Geotechnical Engineers, Sequatchie, TN.
Siegel, T.C. (2012). “Foothills Parkway Bridge No. 2: Micropile Design, Construction and Performance.” ADSC Expo, San Antonio, TX.
889IFCEE 2015 © ASCE 2015