Embed Size (px)
Citation preview

PUBLISHED PROJECT REPORT PPR785
Monitoring of concrete surface treatment options on the A46 Sixhills to Widmerpool September 2013 to June 2016
P D Sanders
Draft PPR785
Report details
Report prepared for: A-One+
Copyright: © Transport Research Laboratory
Report date: 2016
Report status/version: Published
Quality approval:
M Militzer
(Project Manager)
Approved M Greene
(Technical Reviewer)
Approved
Disclaimer
This report has been produced by the Transport Research Laboratory under a contract with A-One+. Any views expressed in this report are not necessarily those of A-One+.
The information contained herein is the property of TRL Limited and does not necessarily reflect the views or policies of the customer for whom this report was prepared. Whilst every effort has been made to ensure that the matter presented in this report is relevant, accurate and up-to-date, TRL Limited cannot accept any liability for any error or omission, or reliance on part or all of the content in another context.
When purchased in hard copy, this publication is printed on paper that is FSC (Forest Stewardship Council) and TCF (Totally Chlorine Free) registered.
A46 Monitoring final report
Draft 1 PPR785
Contents
Executive Summary 2
1 Introduction 3
2 Measurement equipment used 5
2.1 Skid resistance development platform 5
2.2 Pavement friction tester 6
2.3 Highways Agency road research information systems 7
3 Description of monitoring site 9
4 Measurements made and results presented 10
4.1 Low speed skid resistance 10
4.2 High speed friction 10
4.3 Road surface condition 10
4.4 Trends 11
5 Results of June 2016 measurements 12
5.1 Low speed skid resistance 12
5.2 High speed friction 13
5.3 Road surface condition 15
6 Trends 18
6.1 Low speed skid resistance 18
6.2 High speed friction 19
6.3 Texture depth 21
7 Conclusions 22
Bibliography 23
A46 Monitoring final report
Draft 2 PPR785
Executive Summary
The work detailed in this report covers a programme of monitoring to assess the properties of five surface treatments applied to six trial sites along a section of concrete pavement on the A46 between Sixhills and Widmerpool. The treatments assessed were: Bush hammering, Longitudinal diamond grinding (grinding), Fine milling, Thin Surface Course System (TSCS) and Cold Applied Surface Course (CASC).
These treatments were used under a departure granted by Highways England that required low speed skid resistance, high speed friction and surface condition properties to be monitored over a three year period. TRL were commissioned to make measurements in accordance with the departure requirements.
Measurements were made during the following dates, the nominal ages of the treatments at the time of measurement are shown in brackets:
September 2013 (2 Months)
February 2014 (7 Months)
July 2014 (12 Months)
July 2015 (24 Months)
June 2016 (35 Months)
Results collected during the most recent survey were used to characterise the performance of the surfacings after 35 months service. Average results from each measurement period were used to characterise trends in the results with time.
Based on the results from the monitoring, the following conclusions were made:
All materials provided satisfactory levels of low speed skid resistance after 35 months service. Continuing reductions in low speed skid resistance with time were observed on all but the TSCS. Results from routine annual surveys should continue to be monitored.
The high speed friction and texture performance of the bush hammering and CASC treatments was poor during the June 2016 measurements. Furthermore the relationship between texture and high speed friction measurements is unlike that which would be expected. It is therefore recommended that the high speed friction properties of these materials continue to be monitored.
The high speed friction and texture performance of the TSCS and fine milling were good throughout the monitoring period.
Low speed skid resistance and texture measurements made on the CASC and fine milling sections became more variable with time.
Despite poor texture measurements, high speed friction measurements on this surface were comfortably within the range expected of concrete materials. This suggests the SMTD technique for measuring texture on the grinding treatment is unsuitable, possible due to the directional nature of the surface texture. Therefore, measurements of high speed friction should continue to be made directly on this surface type.
A46 Monitoring final report
Draft 3 PPR785
1 Introduction
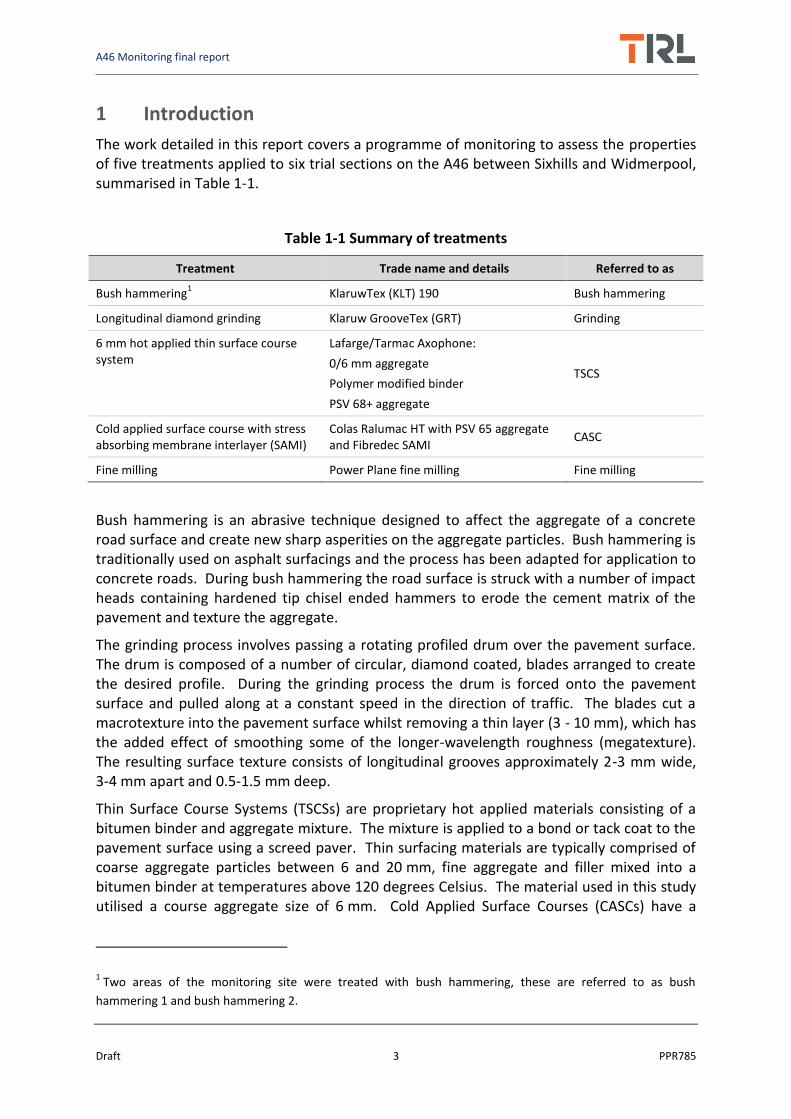
The work detailed in this report covers a programme of monitoring to assess the properties of five treatments applied to six trial sections on the A46 between Sixhills and Widmerpool, summarised in Table 1-1.
Table 1-1 Summary of treatments
Treatment Trade name and details Referred to as
Bush hammering1 KlaruwTex (KLT) 190 Bush hammering
Longitudinal diamond grinding Klaruw GrooveTex (GRT) Grinding
6 mm hot applied thin surface course system
Lafarge/Tarmac Axophone:
0/6 mm aggregate
Polymer modified binder
PSV 68+ aggregate
TSCS
Cold applied surface course with stress absorbing membrane interlayer (SAMI)
Colas Ralumac HT with PSV 65 aggregate and Fibredec SAMI
CASC
Fine milling Power Plane fine milling Fine milling
Bush hammering is an abrasive technique designed to affect the aggregate of a concrete road surface and create new sharp asperities on the aggregate particles. Bush hammering is traditionally used on asphalt surfacings and the process has been adapted for application to concrete roads. During bush hammering the road surface is struck with a number of impact heads containing hardened tip chisel ended hammers to erode the cement matrix of the pavement and texture the aggregate.
The grinding process involves passing a rotating profiled drum over the pavement surface. The drum is composed of a number of circular, diamond coated, blades arranged to create the desired profile. During the grinding process the drum is forced onto the pavement surface and pulled along at a constant speed in the direction of traffic. The blades cut a macrotexture into the pavement surface whilst removing a thin layer (3 - 10 mm), which has the added effect of smoothing some of the longer-wavelength roughness (megatexture). The resulting surface texture consists of longitudinal grooves approximately 2-3 mm wide, 3-4 mm apart and 0.5-1.5 mm deep.
Thin Surface Course Systems (TSCSs) are proprietary hot applied materials consisting of a bitumen binder and aggregate mixture. The mixture is applied to a bond or tack coat to the pavement surface using a screed paver. Thin surfacing materials are typically comprised of coarse aggregate particles between 6 and 20 mm, fine aggregate and filler mixed into a bitumen binder at temperatures above 120 degrees Celsius. The material used in this study utilised a course aggregate size of 6 mm. Cold Applied Surface Courses (CASCs) have a
1 Two areas of the monitoring site were treated with bush hammering, these are referred to as bush
hammering 1 and bush hammering 2.
A46 Monitoring final report
Draft 4 PPR785
similar composition to TSCS materials but are mixed at temperatures below 100 degrees Celsius.
The fine milling process is an adaptation of the cold milling process which uses a rotating profiled drum to remove surface material. The fine milling process differs from cold milling in that the drum is constructed from hundreds of point attack tools arranged in a grid pattern with spacings less than 8 mm; cold milling spacings are generally larger than this. During milling, the rapidly revolving drum is forced into the pavement surface and is pulled along the road at a constant speed. The milling drum cuts a fine texture into the road surface and also removes some of its large scale undulation.
The materials and techniques used in this study were applied under a departure from standards granted by Highways England (HE). Monitoring was carried out as a requirement of the departure to assess the low speed skid resistance, high speed friction and surface condition of the materials over a three year period.
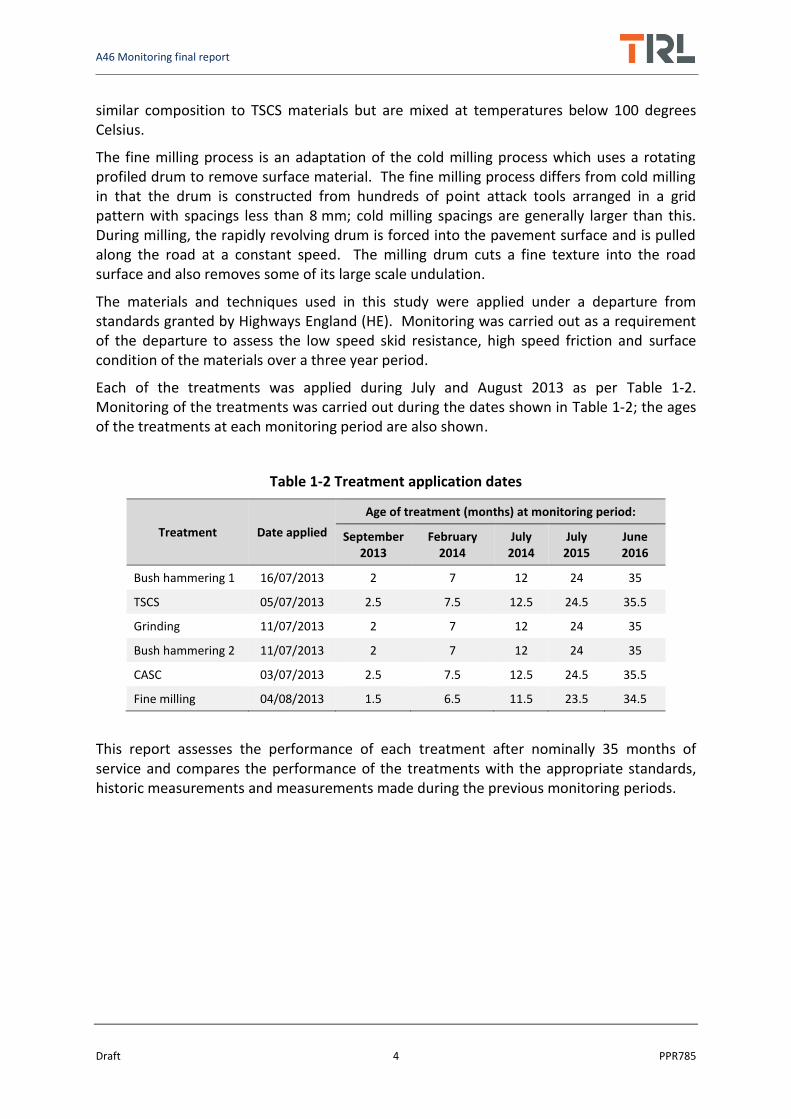
Each of the treatments was applied during July and August 2013 as per Table 1-2. Monitoring of the treatments was carried out during the dates shown in Table 1-2; the ages of the treatments at each monitoring period are also shown.
Table 1-2 Treatment application dates
Treatment Date applied
Age of treatment (months) at monitoring period:
September 2013
February 2014
July 2014
July 2015
June 2016
Bush hammering 1 16/07/2013 2 7 12 24 35
TSCS 05/07/2013 2.5 7.5 12.5 24.5 35.5
Grinding 11/07/2013 2 7 12 24 35
Bush hammering 2 11/07/2013 2 7 12 24 35
CASC 03/07/2013 2.5 7.5 12.5 24.5 35.5
Fine milling 04/08/2013 1.5 6.5 11.5 23.5 34.5
This report assesses the performance of each treatment after nominally 35 months of service and compares the performance of the treatments with the appropriate standards, historic measurements and measurements made during the previous monitoring periods.

A46 Monitoring final report
Draft 5 PPR785
2 Measurement equipment used
2.1 Skid resistance development platform
The Sideways-force Coefficient Routine Investigation Machine (SCRIM) is the standard device for monitoring the skid resistance condition of the HE road network. The Highways England Skid Resistance Development Platform (SkReDeP), Figure 2-1, incorporates SCRIM equipment and is used as a skid resistance research tool. Measurements from this device provide information that can be used to compare the performance of surfacings with the requirements for skid resistance laid out in the Design Manual for Roads and Bridges (DMRB) (Department for Transport, 2015).
Figure 2-1 Skid resistance development platform, incorporating SCRIM
SCRIM uses a smooth test tyre angled at 20 degrees to the direction of travel, mounted on an instrumented axle to record an average SCRIM Reading for every 10 m length of road. This is the average ratio between the measured sideways force and the vertical load, which is dynamically measured, multiplied by 100.
Measurements are usually made at a standard test speed of 50 km/h in the nearside wheel path. At this speed, since the test wheel is at a 20 degree angle, the effective speed at which the tyre contact patch moves over the surface is 17 km/h. For this reason, SCRIM is considered to be a low-speed test.
A46 Monitoring final report
Draft 6 PPR785
2.2 Pavement friction tester
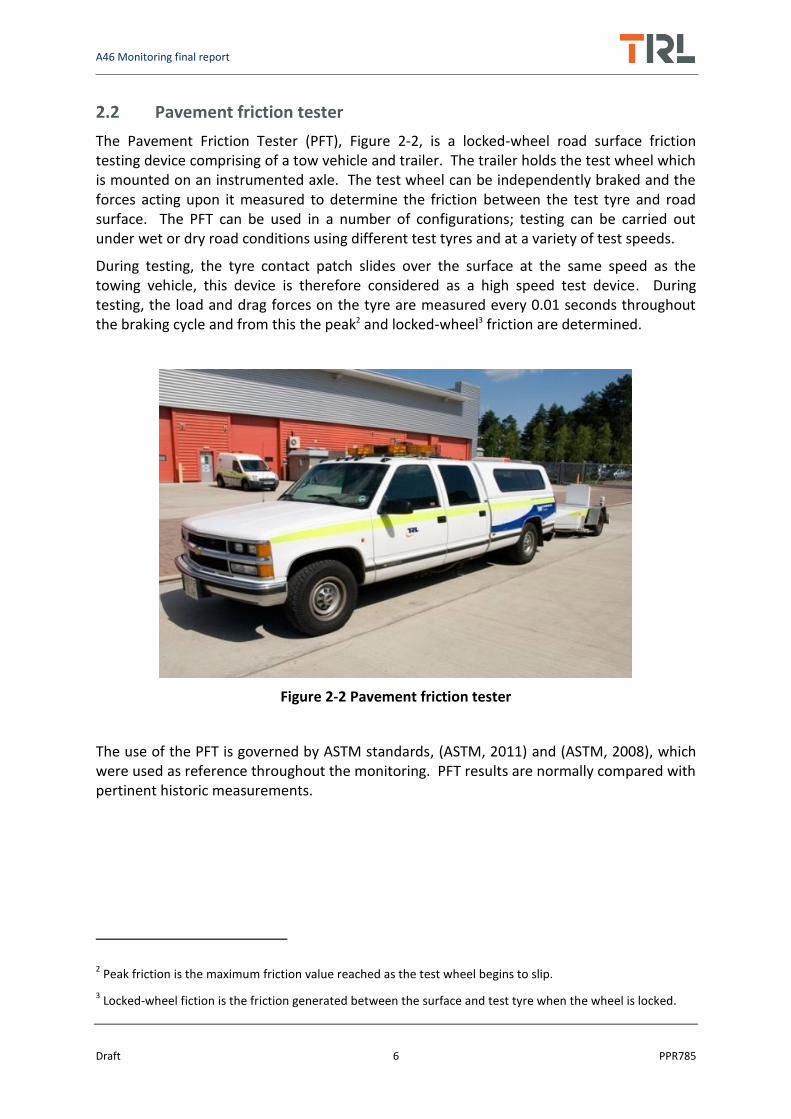
The Pavement Friction Tester (PFT), Figure 2-2, is a locked-wheel road surface friction testing device comprising of a tow vehicle and trailer. The trailer holds the test wheel which is mounted on an instrumented axle. The test wheel can be independently braked and the forces acting upon it measured to determine the friction between the test tyre and road surface. The PFT can be used in a number of configurations; testing can be carried out under wet or dry road conditions using different test tyres and at a variety of test speeds.
During testing, the tyre contact patch slides over the surface at the same speed as the towing vehicle, this device is therefore considered as a high speed test device. During testing, the load and drag forces on the tyre are measured every 0.01 seconds throughout the braking cycle and from this the peak2 and locked-wheel3 friction are determined.
Figure 2-2 Pavement friction tester
The use of the PFT is governed by ASTM standards, (ASTM, 2011) and (ASTM, 2008), which were used as reference throughout the monitoring. PFT results are normally compared with pertinent historic measurements.
2 Peak friction is the maximum friction value reached as the test wheel begins to slip.
3 Locked-wheel fiction is the friction generated between the surface and test tyre when the wheel is locked.

A46 Monitoring final report
Draft 7 PPR785
2.3 Highways Agency road research information systems
The Highways Agency Road Research Information System (HARRIS) 1 was the forerunner and prototype for the vehicles that are used to assess the condition of the trunk road network; it was developed on behalf of the Highways Agency (now HE) by TRL. HARRIS 1 used a combination of image gathering and laser displacement measurements to:
Measure road alignment in terms of crossfall, gradient and curvature
Measure texture at user-definable longitudinal intervals as short as 0.2 mm
Measure transverse road profile at 25 points across a 3.6 m width of traffic lane at 50 mm longitudinal intervals
Measure longitudinal road profile along twenty-five measurement lines, coincident with the measuring points for transverse profile, at 50 mm longitudinal intervals
Collect high quality forward facing and downward facing digital video images for automatic and manual detection of surface defects
Figure 2-3 - HARRIS 1
HARRIS 1 was used in this work to make measurements during the September 2013 monitoring. After this monitoring period the vehicle was de-commissioned and its successor HARRIS 2 was used for the remaining surveys.

A46 Monitoring final report
Draft 8 PPR785
HARRIS 2 was built on the successful development of HARRIS 1 to demonstrate the application of state of the art technology to the assessment of pavement condition at traffic speed. This vehicle is equipped with high resolution systems for the measurement of road shape and visual condition along with the additional capabilities of ground penetrating radar and road marking retro-reflectivity measurements.
The HARRIS 2 systems differ from those on HARRIS 1 in the following ways:
Collection of full colour images of the road surface at a resolution better than 2 mm over a survey width of 3.5 m in order to detect surface defects
Measurement of transverse road profile using a single scanning laser at 1000 points across a 4 m width of traffic lane
Collection of wide angle forward facing images using three cameras and on board real time image stitching
Figure 2-4 - HARRIS 2
A46 Monitoring final report
Draft 9 PPR785
3 Description of monitoring site
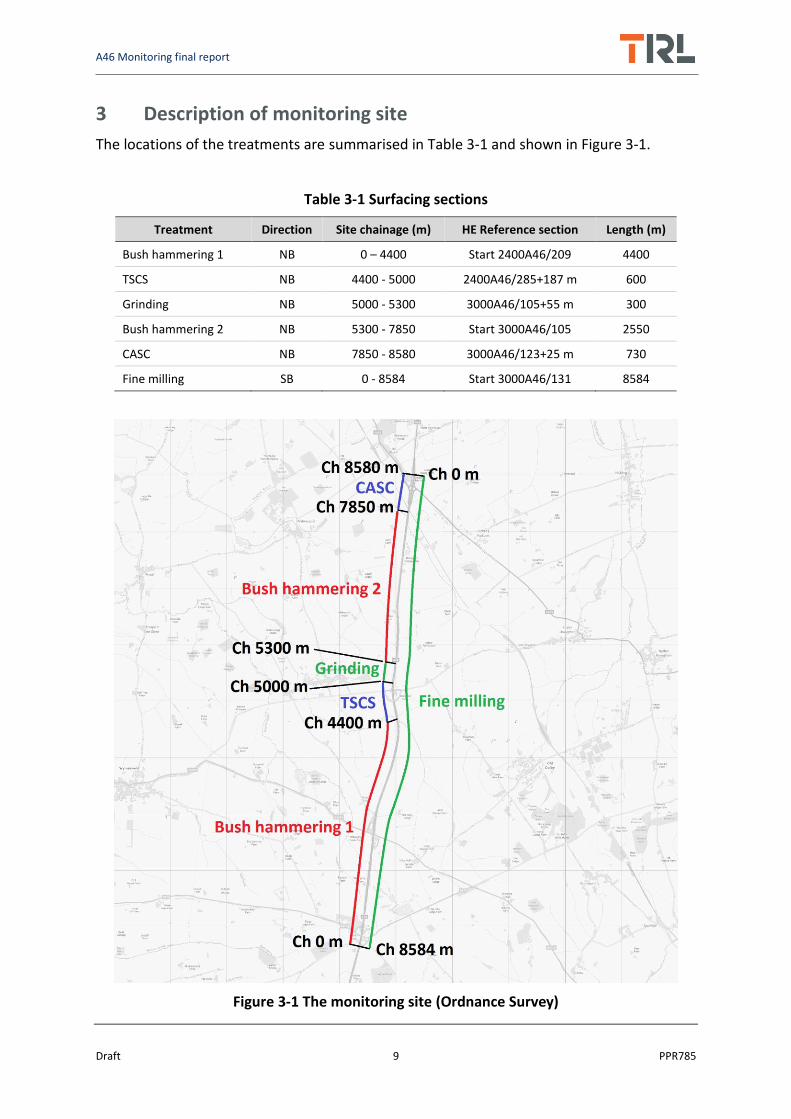
The locations of the treatments are summarised in Table 3-1 and shown in Figure 3-1.
Table 3-1 Surfacing sections
Treatment Direction Site chainage (m) HE Reference section Length (m)
Bush hammering 1 NB 0 – 4400 Start 2400A46/209 4400
TSCS NB 4400 - 5000 2400A46/285+187 m 600
Grinding NB 5000 - 5300 3000A46/105+55 m 300
Bush hammering 2 NB 5300 - 7850 Start 3000A46/105 2550
CASC NB 7850 - 8580 3000A46/123+25 m 730
Fine milling SB 0 - 8584 Start 3000A46/131 8584
Figure 3-1 The monitoring site (Ordnance Survey)
A46 Monitoring final report
Draft 10 PPR785
4 Measurements made and results presented
The measurements described in this chapter were made on each of the sections defined in Table 3-1 and shown on the map in Figure 3-1. The bush hammering 1 section contained two short asphalt sections, low speed skid resistance and texture measurements were made on these areas but omitted from subsequent analysis.
4.1 Low speed skid resistance
Low speed skid resistance measurements were made using SkReDeP on each surface at a test speed of 80 km/h, in the nearside wheel path of lane 1. Multiple passes were made on each surface to ensure the validity of the results, but the results from one pass are reported in the following chapter. Low speed skid resistance results were speed corrected using the procedure stated in HD28 of the DMRB (Department for Transport, 2015) to a test speed of 50 km/h, low speed skid resistance results are therefore reported as values of SC(50).
Average SC(50) values are shown in Figure 5-1, these are presented with reference to the 5th and 95th percentile of measurements made, represented by the error bars. SC(50) values are also shown for each 10 m section. Results are presented with each section adjacent to the next, this is to allow clarity and does not represent the relative positions of the sections. Average and 10 m SC(50) values are compared to the Investigatory Level (IL) for non-event carriageway with one-way traffic described in HD28 of the DMRB (Department for Transport, 2015).
4.2 High speed friction
High speed peak and locked-wheel friction measurements were made using the PFT at a test speed of 90 km/h, in the offside wheel path of lane 1 with a smooth test tyre and a water film thickness of 1 mm. High speed peak and locked-wheel friction results are presented as values of P-Fn90 and L-Fn90 respectively.
Average P-Fn90 and L-Fn90 values are shown in Figure 5-3 and Figure 5-4 respectively. Included with these results are the 5th and 95th percentile of measurements made, represented by the error bars. High speed friction measurements have been compared with typical ranges that have been observed on concrete and TSCS surfaces, represented by the red and grey shaded areas. The typical ranges represent the 90th percentile range of several thousand friction measurements made on surfaces of these types. They have been included as a guide and do not imply safe, nor acceptable performance.
4.3 Road surface condition
Road surface condition measurements were made using HARRIS 2; two test passes were carried out as part of the quality assurance procedure but measurements from a single run are reported. The following parameters were measured using HARRIS 2 in lane 1:
• Sensor Measured Texture Depth (SMTD), measured in the NearSide Wheel Path (NSWP).
• Transverse road profile (Rutting) measured in the NSWP and OffSide Wheel Path (OSWP).
A46 Monitoring final report
Draft 11 PPR785
• Longitudinal profile at 3 m, 10 m and 30 m wavelengths in the NSWP.
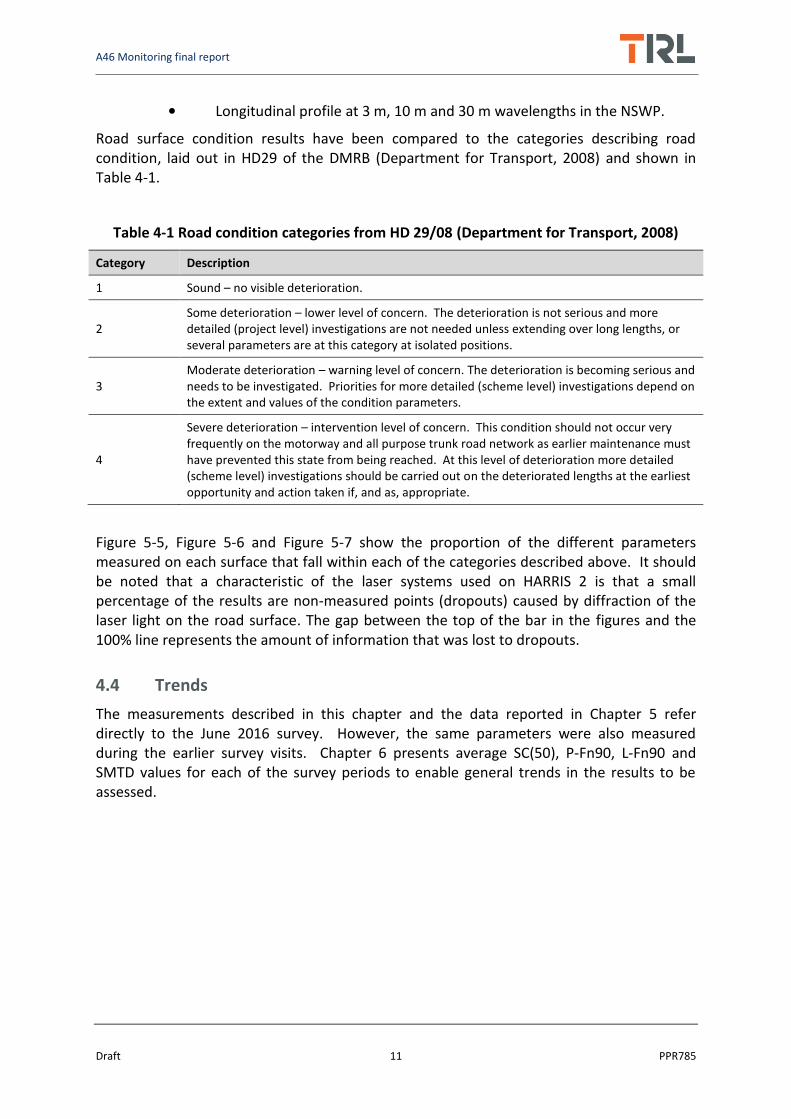
Road surface condition results have been compared to the categories describing road condition, laid out in HD29 of the DMRB (Department for Transport, 2008) and shown in Table 4-1.
Table 4-1 Road condition categories from HD 29/08 (Department for Transport, 2008)
Category Description
1 Sound – no visible deterioration.
2 Some deterioration – lower level of concern. The deterioration is not serious and more detailed (project level) investigations are not needed unless extending over long lengths, or several parameters are at this category at isolated positions.
3 Moderate deterioration – warning level of concern. The deterioration is becoming serious and needs to be investigated. Priorities for more detailed (scheme level) investigations depend on the extent and values of the condition parameters.
4
Severe deterioration – intervention level of concern. This condition should not occur very frequently on the motorway and all purpose trunk road network as earlier maintenance must have prevented this state from being reached. At this level of deterioration more detailed (scheme level) investigations should be carried out on the deteriorated lengths at the earliest opportunity and action taken if, and as, appropriate.
Figure 5-5, Figure 5-6 and Figure 5-7 show the proportion of the different parameters measured on each surface that fall within each of the categories described above. It should be noted that a characteristic of the laser systems used on HARRIS 2 is that a small percentage of the results are non-measured points (dropouts) caused by diffraction of the laser light on the road surface. The gap between the top of the bar in the figures and the 100% line represents the amount of information that was lost to dropouts.
4.4 Trends
The measurements described in this chapter and the data reported in Chapter 5 refer directly to the June 2016 survey. However, the same parameters were also measured during the earlier survey visits. Chapter 6 presents average SC(50), P-Fn90, L-Fn90 and SMTD values for each of the survey periods to enable general trends in the results to be assessed.
A46 Monitoring final report
Draft 12 PPR785
5 Results of June 2016 measurements
5.1 Low speed skid resistance
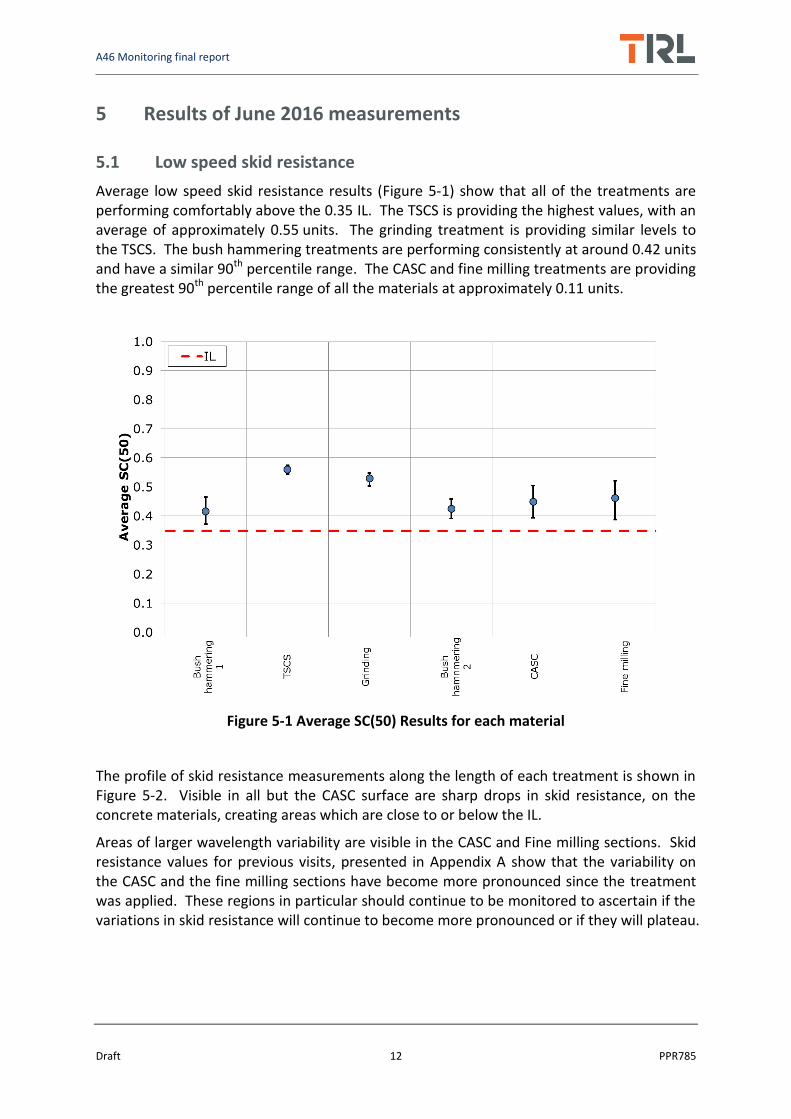
Average low speed skid resistance results (Figure 5-1) show that all of the treatments are performing comfortably above the 0.35 IL. The TSCS is providing the highest values, with an average of approximately 0.55 units. The grinding treatment is providing similar levels to the TSCS. The bush hammering treatments are performing consistently at around 0.42 units and have a similar 90th percentile range. The CASC and fine milling treatments are providing the greatest 90th percentile range of all the materials at approximately 0.11 units.
Figure 5-1 Average SC(50) Results for each material
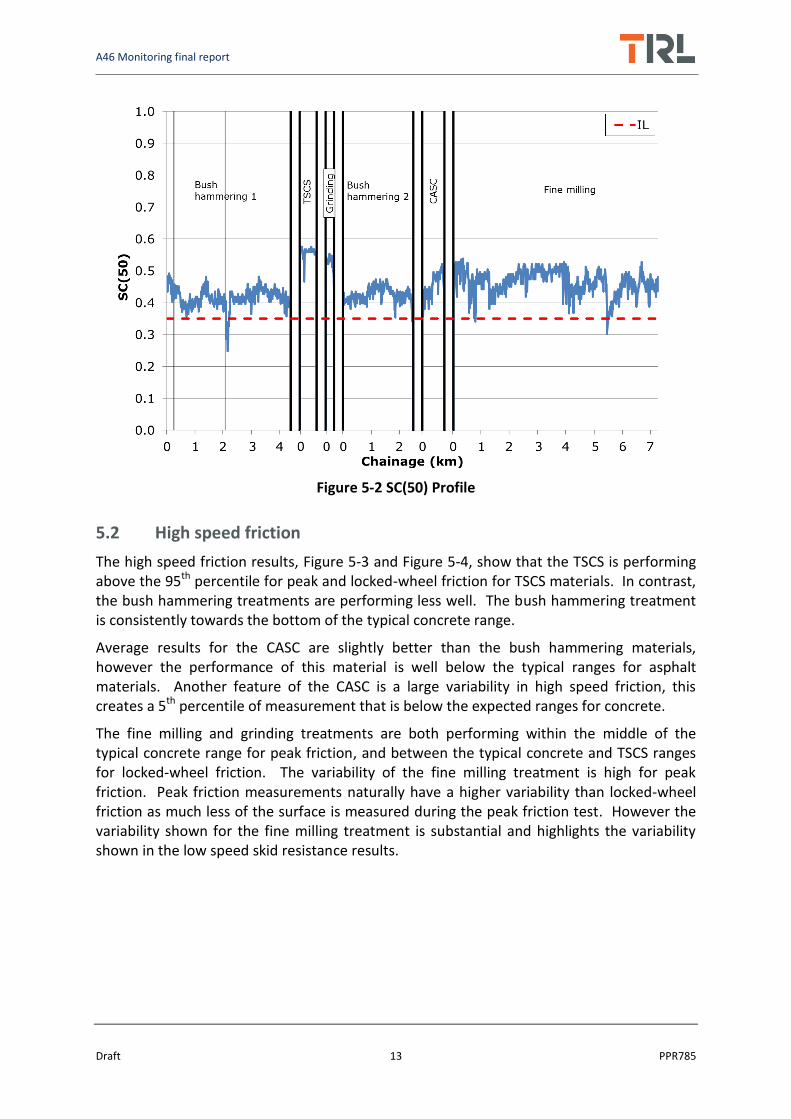
The profile of skid resistance measurements along the length of each treatment is shown in Figure 5-2. Visible in all but the CASC surface are sharp drops in skid resistance, on the concrete materials, creating areas which are close to or below the IL.
Areas of larger wavelength variability are visible in the CASC and Fine milling sections. Skid resistance values for previous visits, presented in Appendix A show that the variability on the CASC and the fine milling sections have become more pronounced since the treatment was applied. These regions in particular should continue to be monitored to ascertain if the variations in skid resistance will continue to become more pronounced or if they will plateau.
A46 Monitoring final report
Draft 13 PPR785
Figure 5-2 SC(50) Profile
5.2 High speed friction
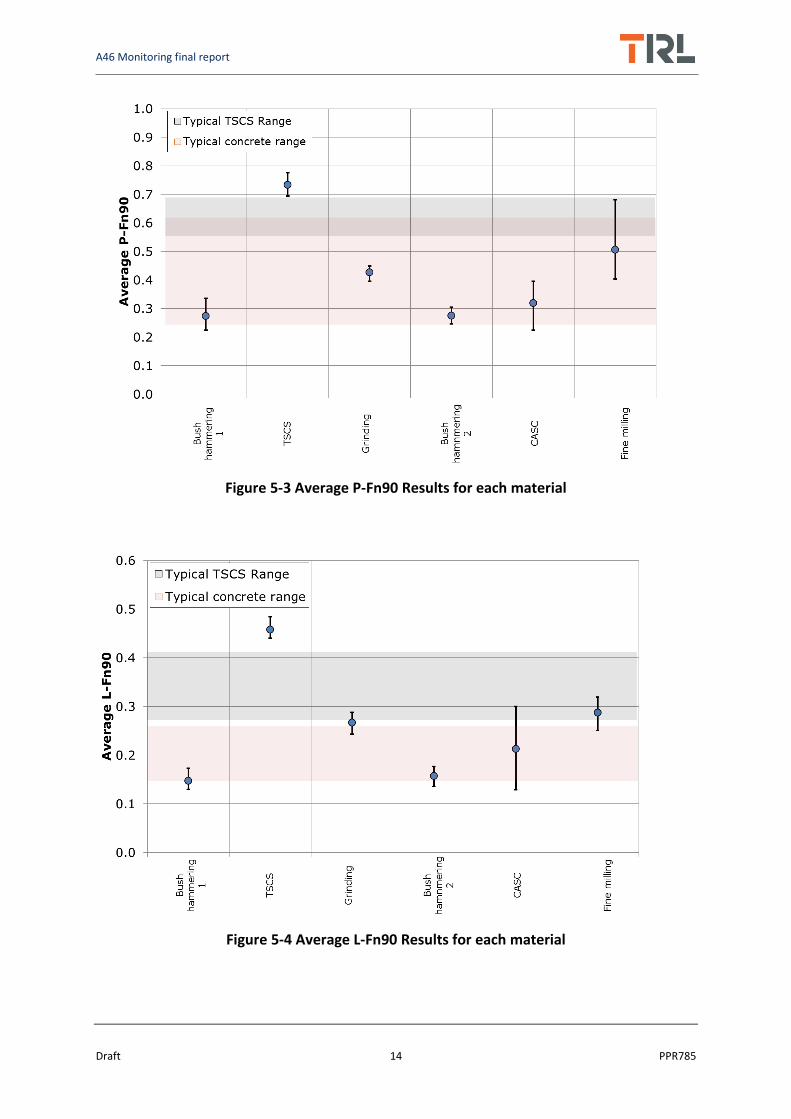
The high speed friction results, Figure 5-3 and Figure 5-4, show that the TSCS is performing above the 95th percentile for peak and locked-wheel friction for TSCS materials. In contrast, the bush hammering treatments are performing less well. The bush hammering treatment is consistently towards the bottom of the typical concrete range.
Average results for the CASC are slightly better than the bush hammering materials, however the performance of this material is well below the typical ranges for asphalt materials. Another feature of the CASC is a large variability in high speed friction, this creates a 5th percentile of measurement that is below the expected ranges for concrete.
The fine milling and grinding treatments are both performing within the middle of the typical concrete range for peak friction, and between the typical concrete and TSCS ranges for locked-wheel friction. The variability of the fine milling treatment is high for peak friction. Peak friction measurements naturally have a higher variability than locked-wheel friction as much less of the surface is measured during the peak friction test. However the variability shown for the fine milling treatment is substantial and highlights the variability shown in the low speed skid resistance results.
A46 Monitoring final report
Draft 14 PPR785
Figure 5-3 Average P-Fn90 Results for each material
Figure 5-4 Average L-Fn90 Results for each material
A46 Monitoring final report
Draft 15 PPR785
5.3 Road surface condition
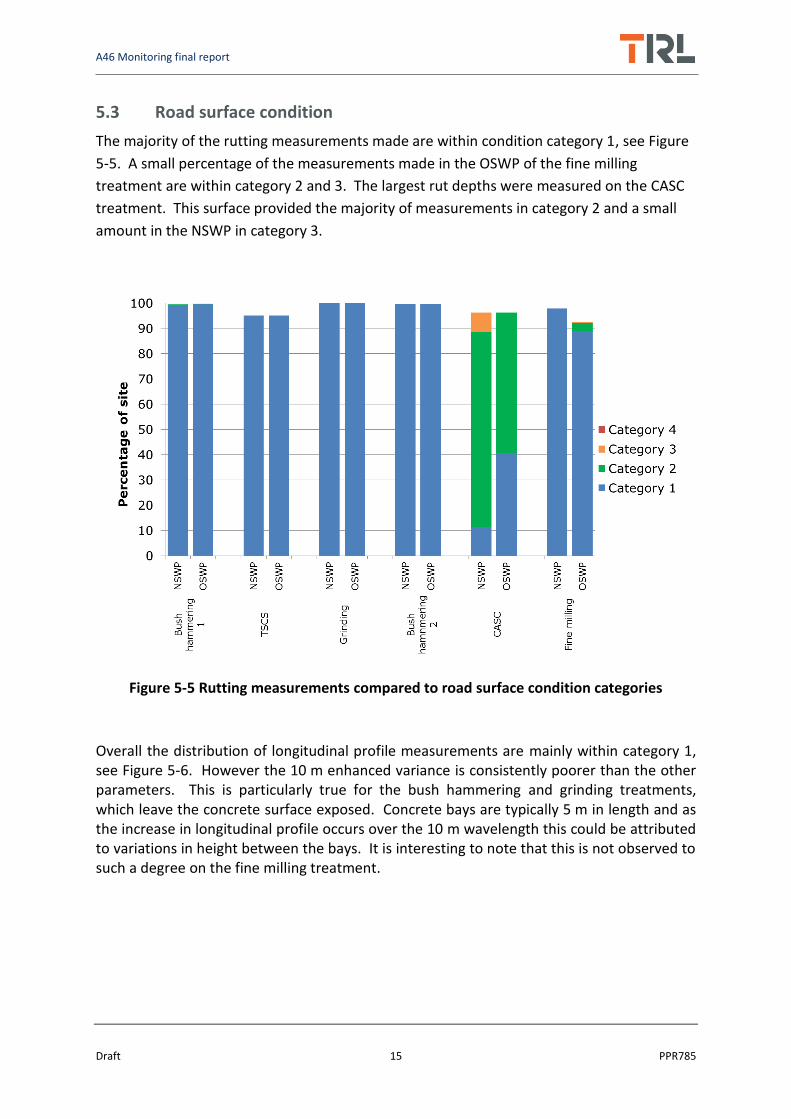
The majority of the rutting measurements made are within condition category 1, see Figure
5-5. A small percentage of the measurements made in the OSWP of the fine milling
treatment are within category 2 and 3. The largest rut depths were measured on the CASC
treatment. This surface provided the majority of measurements in category 2 and a small
amount in the NSWP in category 3.
Figure 5-5 Rutting measurements compared to road surface condition categories
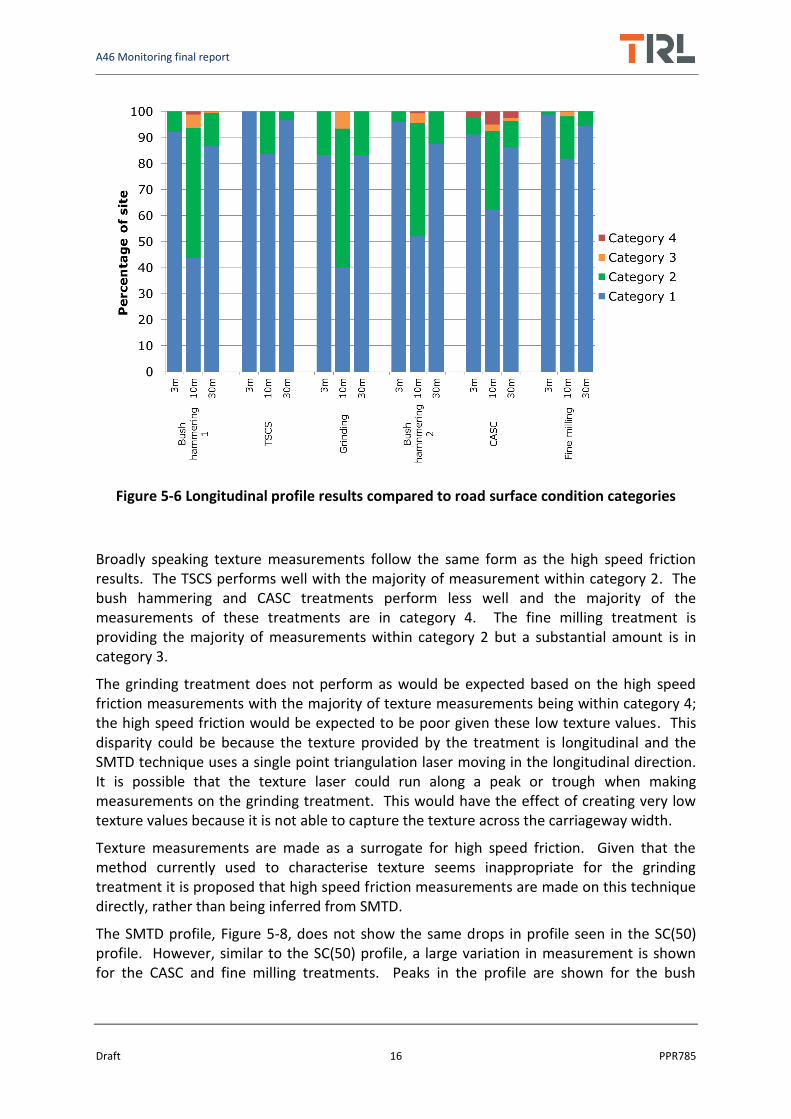
Overall the distribution of longitudinal profile measurements are mainly within category 1, see Figure 5-6. However the 10 m enhanced variance is consistently poorer than the other parameters. This is particularly true for the bush hammering and grinding treatments, which leave the concrete surface exposed. Concrete bays are typically 5 m in length and as the increase in longitudinal profile occurs over the 10 m wavelength this could be attributed to variations in height between the bays. It is interesting to note that this is not observed to such a degree on the fine milling treatment.
A46 Monitoring final report
Draft 16 PPR785
Figure 5-6 Longitudinal profile results compared to road surface condition categories
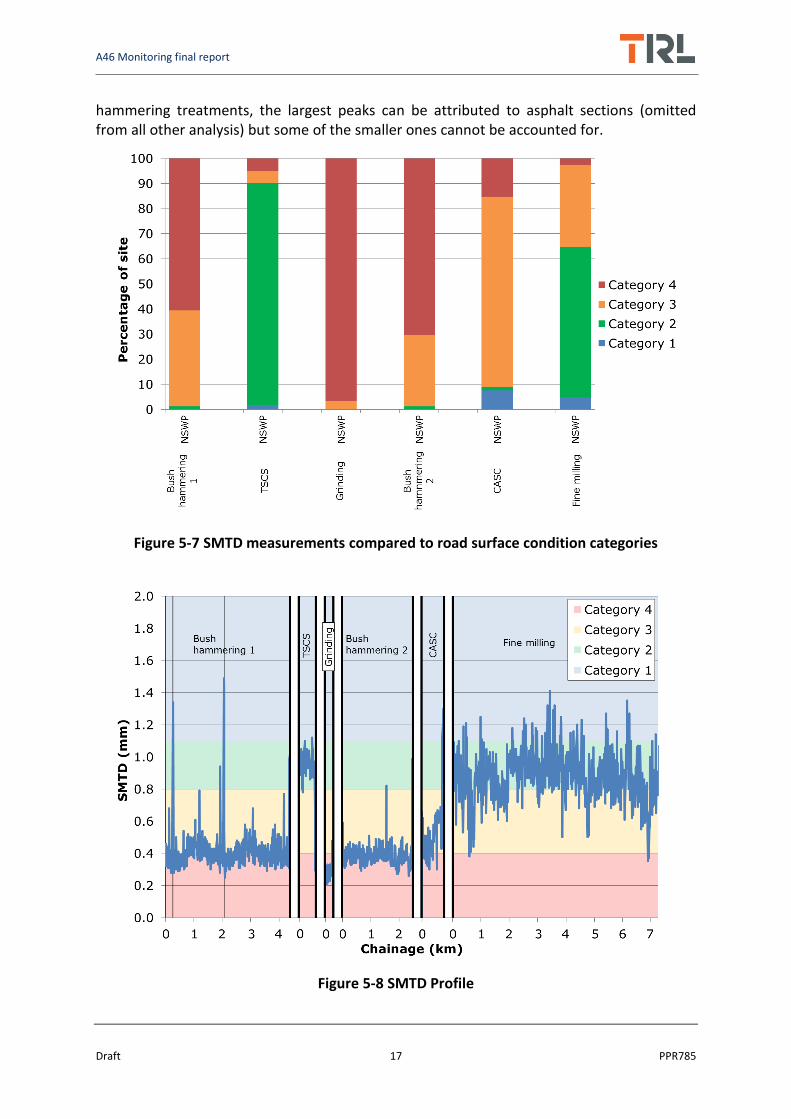
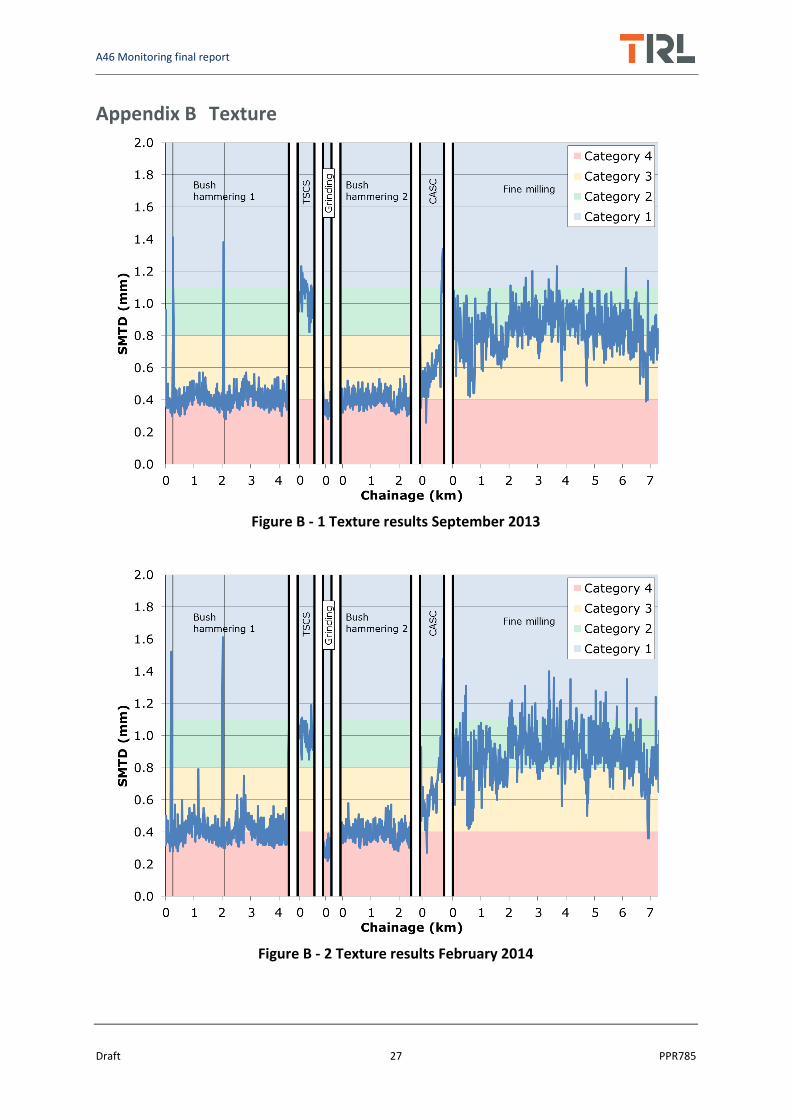
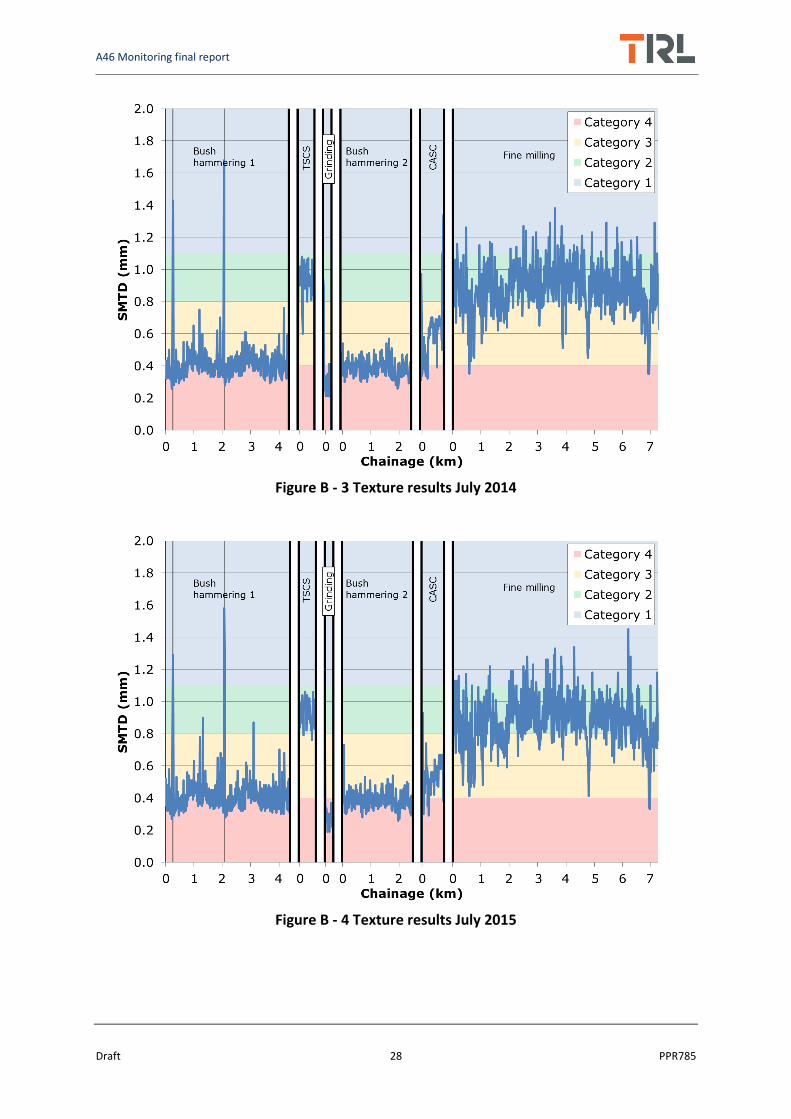
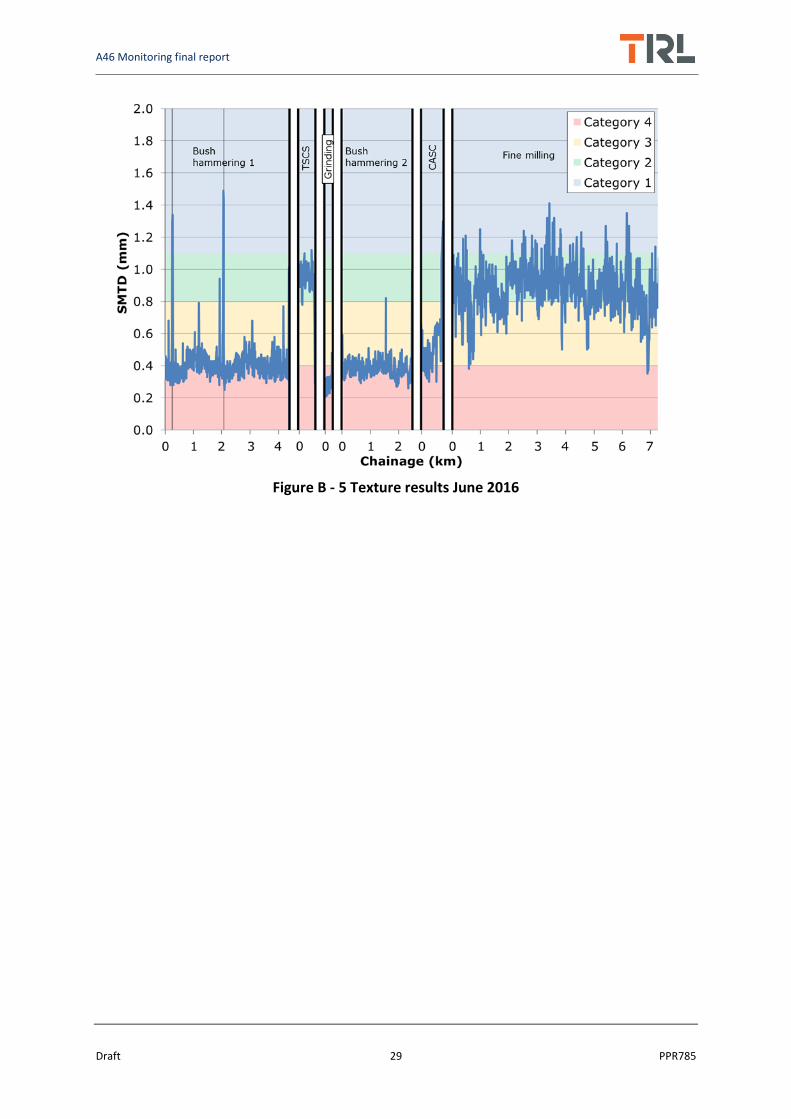
Broadly speaking texture measurements follow the same form as the high speed friction results. The TSCS performs well with the majority of measurement within category 2. The bush hammering and CASC treatments perform less well and the majority of the measurements of these treatments are in category 4. The fine milling treatment is providing the majority of measurements within category 2 but a substantial amount is in category 3.
The grinding treatment does not perform as would be expected based on the high speed friction measurements with the majority of texture measurements being within category 4; the high speed friction would be expected to be poor given these low texture values. This disparity could be because the texture provided by the treatment is longitudinal and the SMTD technique uses a single point triangulation laser moving in the longitudinal direction. It is possible that the texture laser could run along a peak or trough when making measurements on the grinding treatment. This would have the effect of creating very low texture values because it is not able to capture the texture across the carriageway width.
Texture measurements are made as a surrogate for high speed friction. Given that the method currently used to characterise texture seems inappropriate for the grinding treatment it is proposed that high speed friction measurements are made on this technique directly, rather than being inferred from SMTD.
The SMTD profile, Figure 5-8, does not show the same drops in profile seen in the SC(50) profile. However, similar to the SC(50) profile, a large variation in measurement is shown for the CASC and fine milling treatments. Peaks in the profile are shown for the bush
A46 Monitoring final report
Draft 17 PPR785
hammering treatments, the largest peaks can be attributed to asphalt sections (omitted from all other analysis) but some of the smaller ones cannot be accounted for.
Figure 5-7 SMTD measurements compared to road surface condition categories
Figure 5-8 SMTD Profile
A46 Monitoring final report
Draft 18 PPR785
6 Trends
6.1 Low speed skid resistance
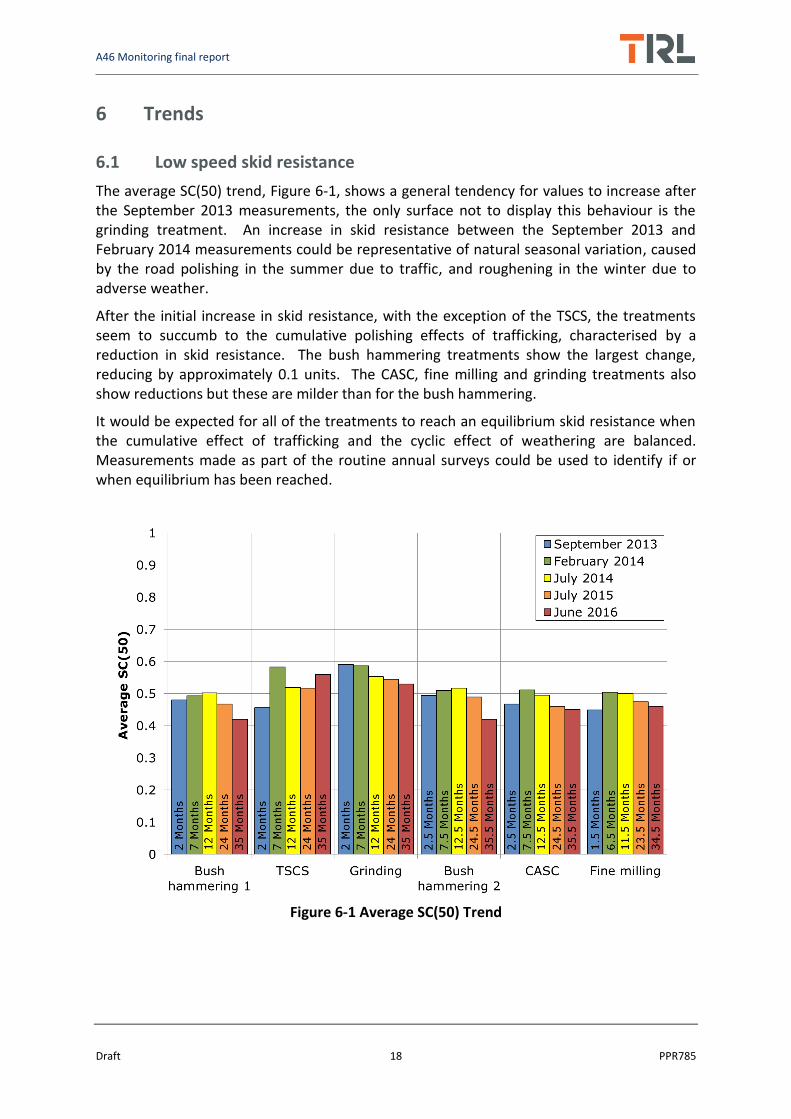
The average SC(50) trend, Figure 6-1, shows a general tendency for values to increase after the September 2013 measurements, the only surface not to display this behaviour is the grinding treatment. An increase in skid resistance between the September 2013 and February 2014 measurements could be representative of natural seasonal variation, caused by the road polishing in the summer due to traffic, and roughening in the winter due to adverse weather.
After the initial increase in skid resistance, with the exception of the TSCS, the treatments seem to succumb to the cumulative polishing effects of trafficking, characterised by a reduction in skid resistance. The bush hammering treatments show the largest change, reducing by approximately 0.1 units. The CASC, fine milling and grinding treatments also show reductions but these are milder than for the bush hammering.
It would be expected for all of the treatments to reach an equilibrium skid resistance when the cumulative effect of trafficking and the cyclic effect of weathering are balanced. Measurements made as part of the routine annual surveys could be used to identify if or when equilibrium has been reached.
Figure 6-1 Average SC(50) Trend
A46 Monitoring final report
Draft 19 PPR785
6.2 High speed friction
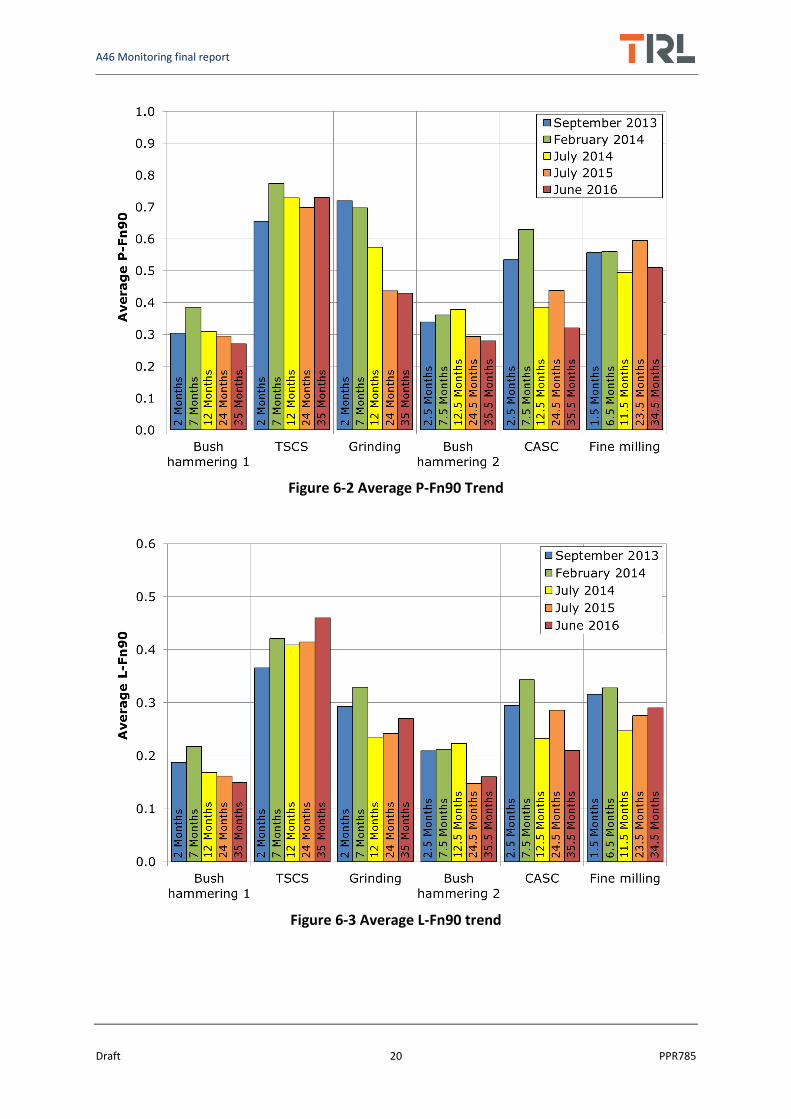
Average high speed friction trends, presented in Figure 6-2 and Figure 6-3, show a similar behaviour for the bush hammering 1 section as the SC(50) trend. After an initial increase, the friction value decreases continuously.
The bush hammering 2 trend is less well defined than that for the bush hammering 1 section. Although an increase and subsequent reduction in friction is observed here, the increase occurs over the first year of service, not the first 7 months as with the bush hammering 1 section. The reduction in friction also falls sharply after 12.5 months rather than reducing gradually.
The peak friction trend for the grinding section shows a reduction between the 2 month and 24 month measurement. This reduction is substantial, however the measurements at 24 and 35 months are relatively similar. This could indicate that this material had reached its equilibrium peak friction.
Measurements of high speed friction should be continued on all of the treatments discussed above so that any continual reductions in friction can be monitored more closely.
The locked-wheel friction trend for the grinding section displays a different behaviour than the peak friction trend. After the initial increase in friction there is a sharp drop of approximately 0.1 units. The friction value then increases by 0.05 units over the next two year period. An increasing friction trend such as this is unusual and could not be explained through this work.
The locked-wheel friction trend for the grinding section is very similar to the performance of the fine milling section. This suggests that this behaviour is typical of the treatments, given that the fine milling and grinding treatments are similar in application it is not surprising that some of their characteristics are also similar. The peak friction results collected from the fine milling section show no clear trend and are variable. It is likely that this behaviour is symptomatic of the variability in the treatment.
Measurements of peak and locked-wheel friction made on the TSCS show an initial increase in friction, which is probably due to seasonal variation, followed by a reduction in values, followed by an increase. This behaviour may seem unusual but previous work reported in TRL report PPR492 (Greene, Sanders, & Roe, 2010) has shown this behaviour to be typical of TSCSs in the initial period after laying.
The CASC is showing a similar trend to the TSCS, but over a shorter period of time. After the second increase in friction the CASC shows a further reduction. This behaviour could be similar to that seen in TSCSs where after the bitumen film on the coarse aggregate is worn off and the aggregate exposed, the aggregate then starts to polish.
A46 Monitoring final report
Draft 20 PPR785
Figure 6-2 Average P-Fn90 Trend
Figure 6-3 Average L-Fn90 trend
A46 Monitoring final report
Draft 21 PPR785
6.3 Texture depth
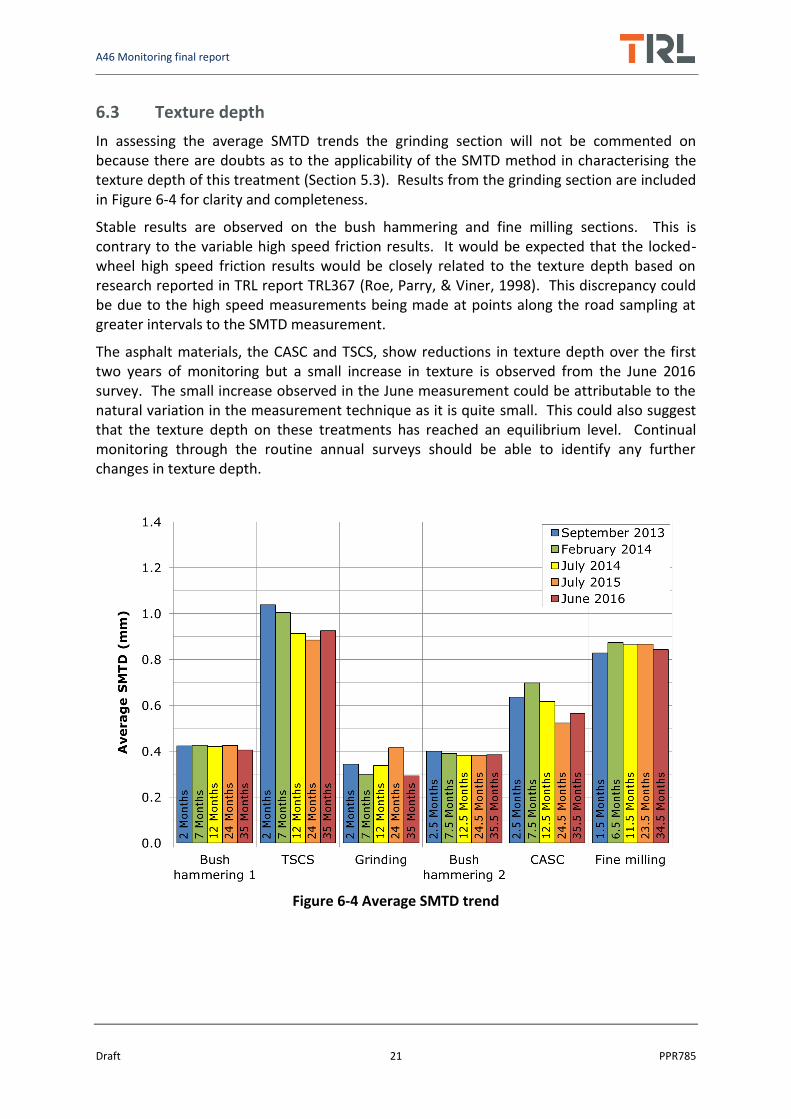
In assessing the average SMTD trends the grinding section will not be commented on because there are doubts as to the applicability of the SMTD method in characterising the texture depth of this treatment (Section 5.3). Results from the grinding section are included in Figure 6-4 for clarity and completeness.
Stable results are observed on the bush hammering and fine milling sections. This is contrary to the variable high speed friction results. It would be expected that the locked-wheel high speed friction results would be closely related to the texture depth based on research reported in TRL report TRL367 (Roe, Parry, & Viner, 1998). This discrepancy could be due to the high speed measurements being made at points along the road sampling at greater intervals to the SMTD measurement.
The asphalt materials, the CASC and TSCS, show reductions in texture depth over the first two years of monitoring but a small increase in texture is observed from the June 2016 survey. The small increase observed in the June measurement could be attributable to the natural variation in the measurement technique as it is quite small. This could also suggest that the texture depth on these treatments has reached an equilibrium level. Continual monitoring through the routine annual surveys should be able to identify any further changes in texture depth.
Figure 6-4 Average SMTD trend
A46 Monitoring final report
Draft 22 PPR785
7 Conclusions
From the measurements made and analysis carried out as part of this study, the following conclusions can be made:
All materials provided satisfactory levels of low speed skid resistance after 35 months service. Continuing reductions in low speed skid resistance with time were observed on all but the TSCS. Results from routine annual surveys should continue to be monitored.
The high speed friction and texture performance of the bush hammering and CASC treatments was poor during the June 2016 measurements. Furthermore the relationship between texture and high speed friction measurements is unlike that which would be expected. It is therefore recommended that the high speed friction properties of these materials continue to be monitored.
The high speed friction and texture performance of the TSCS and fine milling were good throughout the monitoring period.
Low speed skid resistance and texture measurements made on the CASC and fine milling sections became more variable with time.
Despite poor texture measurements, high speed friction measurements on this surface were comfortably within the range expected of concrete materials. This suggests the SMTD technique for measuring texture on the grinding treatment is unsuitable, possible due to the directional nature of the surface texture. Therefore, measurements of high speed friction should continue to be made directly on this surface type.
.
A46 Monitoring final report
Draft 23 PPR785
Bibliography
ASTM. (2008). E524-08 Standard Specification for Standard Smooth Tire for Pavement Skid-
resistance Tests. West Conshohocken: ASTM.
ASTM. (2011). E274/E274M-11 Standard Test Method for SkidResistance of Paved surfaces
Using a full-Scale Tire. West Conshohocken: ASTM.
British Standards. (2006). BS 7941-1. Methods for measuring the skid resistance of pavement
surfaces - Sideway-force coefficient routine investigation machine. London: BSi.
British Standards. (2009). DD CEN/TS 15901-6:2009 Road and airfield surface characteristics
Part 6: Procedure for determining the skid resistance of a pavement surface by
measuement of the sideways force coefficient (SFCS): SCRIM. London: BSi.
Department for Transport. (2008). HD 29/08 - Data for pavement assessment (DMRB 7.3.2).
London: The Stationery Office.
Department for Transport. (2015). HD 28/15 - Skid resistance (DMRB 7.3.1). London: The
Stationery Office.
Greene, M. J., Sanders, P. D., & Roe, P. G. (2010). PPR 606 Further studies of asphalt surfaces
in their early life. Wokingham: TRL.
Ordnance Survey. (n.d.). Ordnance survey open data. Retrieved 09 02, 2011, from
http://www.ordnancesurvey.co.uk/oswebsite/opendata/
Roe, P. G., Parry, A. R., & Viner, H. E. (1998). TRL 367. High and low speed skidding
resistance: the influence of texture depth. Crowthorne: TRL Limited.
Sanders, P. D. (2013). PPR 607 - Long term friction performance of longitudinally diamond
ground concrete. Wokingham: TRL Online Store.
Sanders, P. D., Brittain, S., & Sanders, P. J. (2013). PPR 677. Cost effective surface treatment
of concrete roads. Wokingham: TRL.
Sanders, P. D., Dunford, A., & Viner, H. E. (2013). PPR 676. Surface monitoring of re-textured
concrete on the M27 and M271 - August 2011 to October 2013. Wokingham: TRL.
Sanders, P. D., Wayman, M., Dunford, A., & Viner, H. E. (2012). PPR 607 Long term friction
performance of longitudinally diamond ground concrete. Wokingham: TRL.
A46 Monitoring final report
Draft 24 PPR785
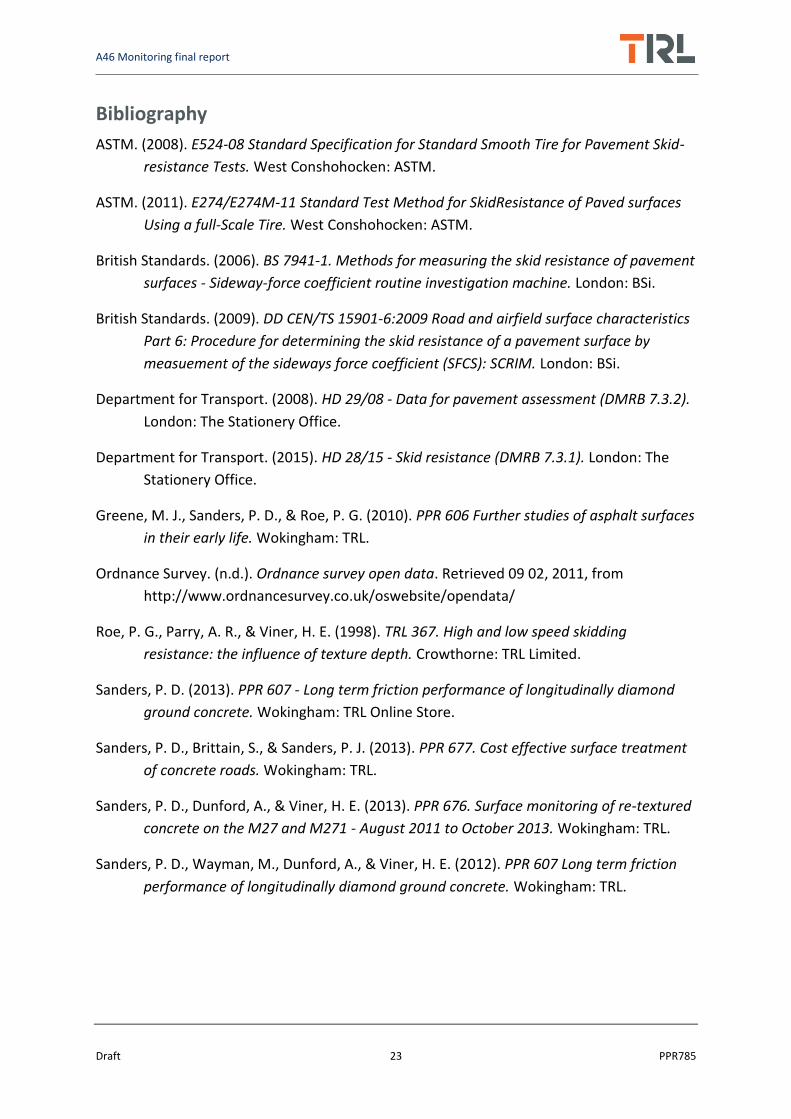
Appendix A Low speed skid resistance
Figure A - 1 Low speed skid resistance results September 2013
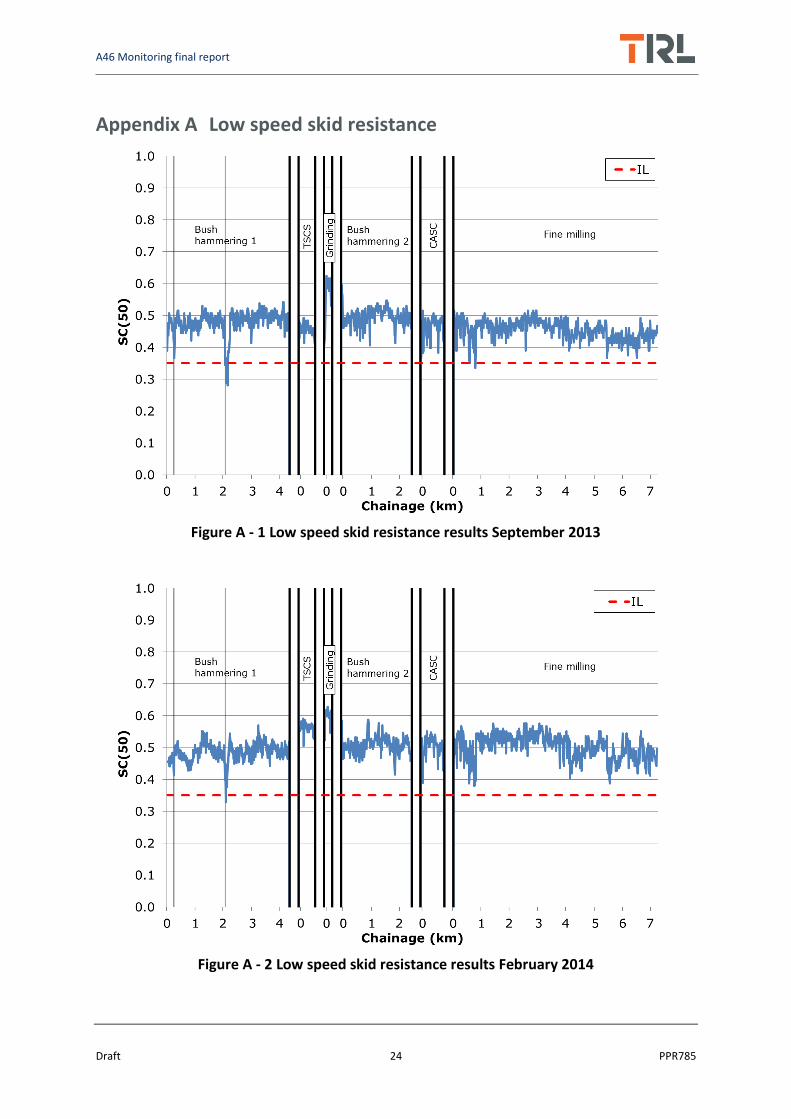
Figure A - 2 Low speed skid resistance results February 2014
A46 Monitoring final report
Draft 25 PPR785
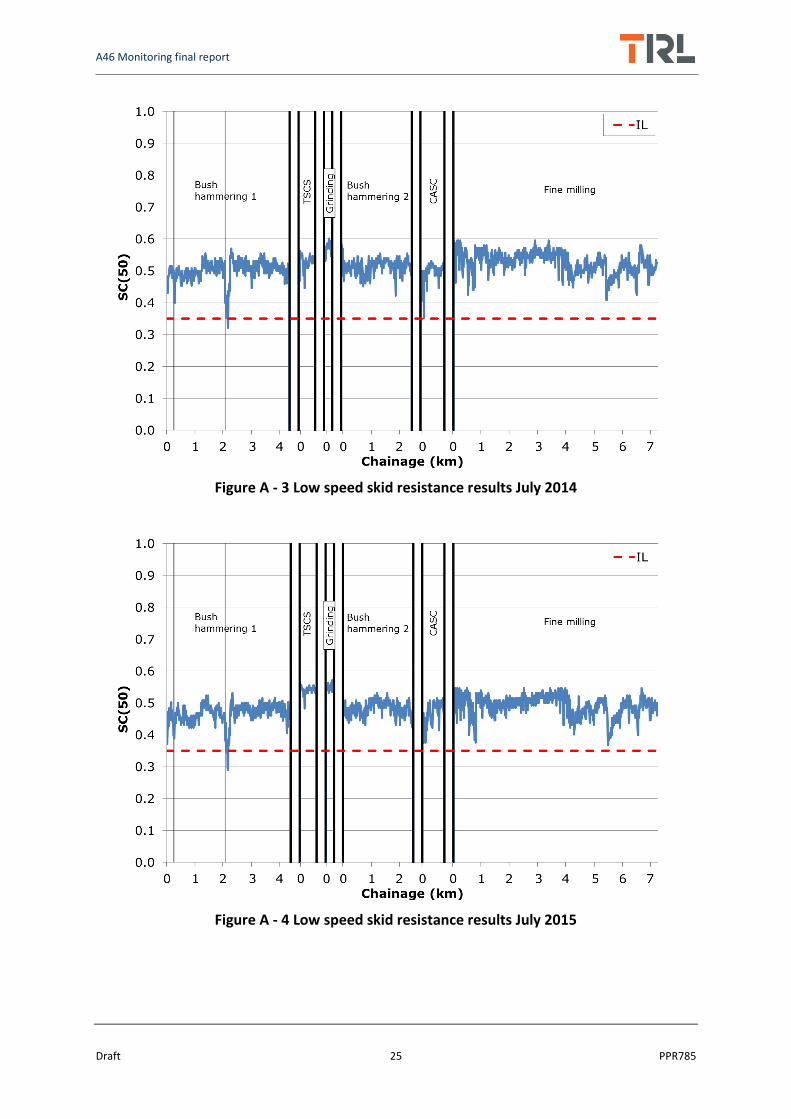
Figure A - 3 Low speed skid resistance results July 2014
Figure A - 4 Low speed skid resistance results July 2015
A46 Monitoring final report
Draft 26 PPR785
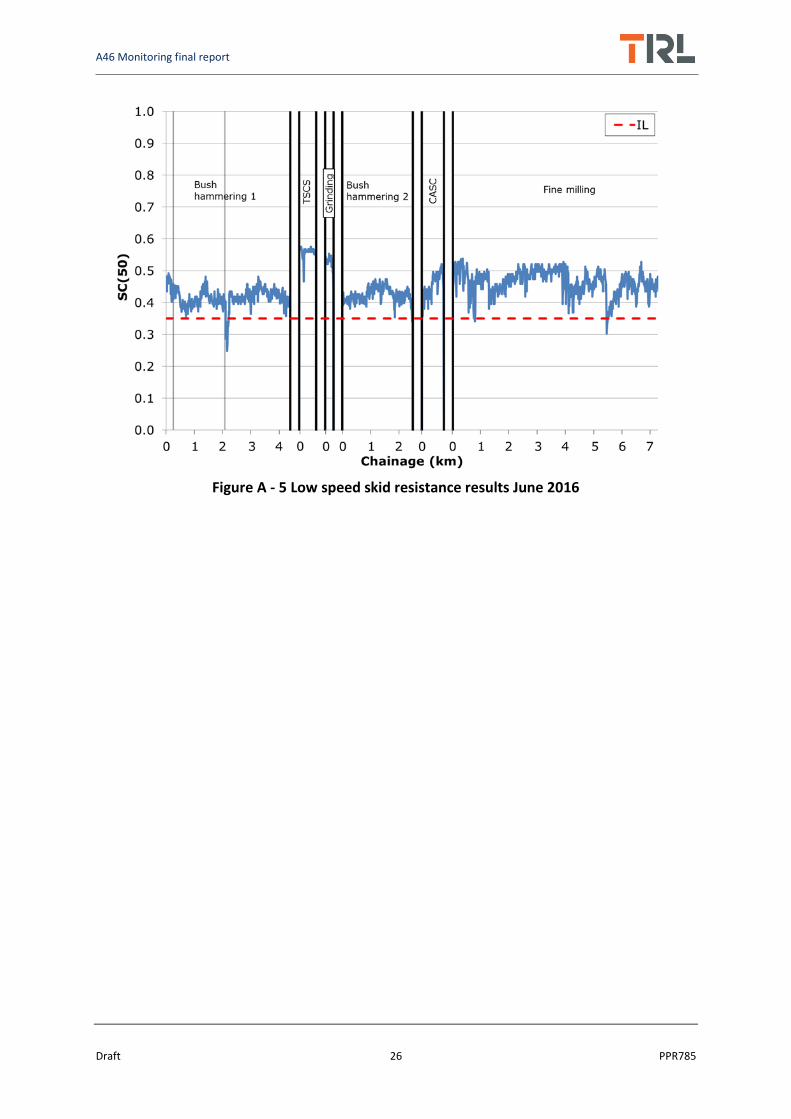
Figure A - 5 Low speed skid resistance results June 2016
A46 Monitoring final report
Draft 27 PPR785
Appendix B Texture
Figure B - 1 Texture results September 2013
Figure B - 2 Texture results February 2014
A46 Monitoring final report
Draft 28 PPR785
Figure B - 3 Texture results July 2014
Figure B - 4 Texture results July 2015
A46 Monitoring final report
Draft 29 PPR785
Figure B - 5 Texture results June 2016
Monitoring of concrete surface treatment options on the A46 Sixhills to Widmerpool
Other titles from this subject area
PPR676 Surface monitoring of re-textured concrete on the M27 and M271 – August 2011 to October 2013. P D Sanders, A Dunford, H E Viner. 2013
PPR677 Surface treatment options for concrete roads. P D Sanders, S Brittain. 2014
PPR737 Performance review of skid resistance measurement devices. P D Sanders, S Brittain, A Premathilaka. 2015
PPR771 Development of a reference surface for the assessment of pavement skid resistance measurement devices. P D Sanders, S McRobbie, J Gopaldas, H E Viner. 2015
TRL
Crowthorne House, Nine Mile Ride, Wokingham, Berkshire, RG40 3GA, United Kingdom T: +44 (0) 1344 773131 F: +44 (0) 1344 770356 E: [email protected] W: www.trl.co.uk
PPR785