Embed Size (px)
Citation preview

MONITORING OF FOREST PRODUCTIVITY,
FUNCTIONALITY AND ECOSYSTEM SERVICES OF ITALIAN
FORESTS
Prof. Marco Marchetti

Research topics:• Forest and landscape ecology• Biodiversity conservation• Remote sensing • Carbon storage in forest ecosystems• Forest planning• Tree physiology• Dendrochronology• Wood technology
www.ecogeofor.unimol.it
…and the spin off, CSIG srl

www.ecogeofor.unimol.it
ONGOING
PROJECTS
forestlab.net Network

Monitoring of forest harvesting
Study area: central Italy (approximately 34,000 km2). A set of SPOT5 HRG multispectral images: years 2002–2007. Official administrative statistics of coppice clearcuts acquisition.
Monitoring of forest harvesting
More than 9500 clearcutsmapped and dated by on-screen interpretation.Various methods for semi-automatic clearcut mapping were tested by pixel- and object-oriented approaches.
Examples of comparison of SPOT5 HRG infrared images from different years evidencing clearcut areas (white delineated polygons with the
clearcut year). The images were acquired in late spring or summer 2003, 2006 and 2007. Both cases A and B are from Regione Molise.

Simulation of forest harvesting
LIFE ManForCBD: action ECo
OBJECTIVE: analyse and quantify the potential disturbances due to the forest management actions on forest landscape.
1
2
3
4
5
6
7
STUDY AREAS: seven sites in Italy and three in Slovenia (mainly beech forests).
METHOD: analysis of changes of SFM indicators related to forest spatial pattern
HOW: comparing spatial pattern under different forest management options 10 kmqareas for each site: not managed, traditional and innovative FM
TOOLS: passive satellite sensor, FLSM (forest landscape simulation model), MSPA (morphological spatial pattern analysis) and mapping tools

Simulation of forest harvesting
LIFE ManForCBD: action ECo
Site 1 – Cansiglio Segmentation and classification Forest types map
image classification

Simulation of forest harvesting
LIFE ManForCBD: action ECo
Forest types
Forest management
Forest Age
Stand IDHARVEST software
Forest types maps and other layers asinputs for forest harvesting simulation

Simulation of forest harvesting
LIFE ManForCBD: action ECo
Not harvested Traditional Innovative
ha % ha % ha %
Branch 4.10 0.41 1.50 0.15 1.90 0.19
Edge 28.63 2.86 16.63 1.66 16.54 1.65
Perforation 4.54 0.45 0.00 0.00 0.00 0.00
Islet 0.00 0.00 0.00 0.00 0.17 0.02
Core 760.94 76.09 196.37 19.64 192.76 19.28
Bridge 1.12 0.11 485.89 48.59 419.21 41.92
Loop 1.71 0.17 10.21 1.02 3.70 0.37
Non forest 197.75 19.77 288.18 28.82 364.51 36.45
a) b)
Scheme of resulting forest stand pattern following the two forest management criteria applied in two Cansiglio site plots.

Estimation of forest
parameters for wall-to-wall
mapping
Growing stock map of Molise Region
Well-known non-parametric k-Nearest Neighbours (k-NN) method is used for deriving a wall-to-wall growing stock volume map integrating optical remote sensing from IRS LISS-III (Indian Remote Sensing Satellite) image (July 2006) imagery and a field forest inventory.
Accepted: L’Italia Forestale e Montana 2013;
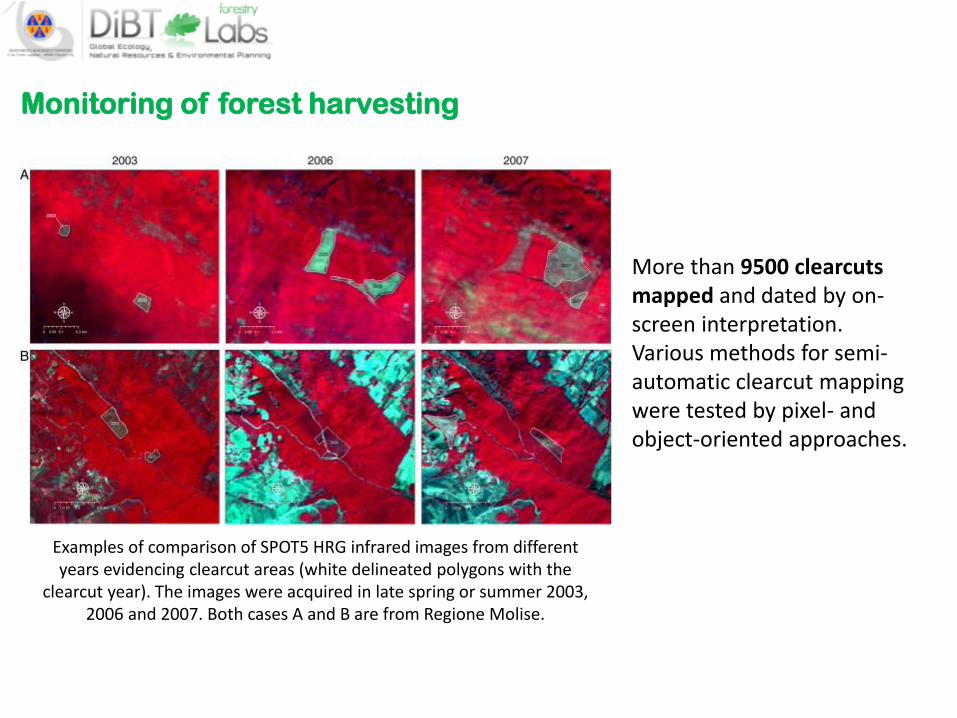
Estimation of forest
parameters for wall-
to-wall mapping
The growing stock volume map of Molise was converted in a forest age map on the basis of yield models applied for different groups of dominant even-aged tree species
Spatially explicit estimation of forest age integrating remotely sensed data and inverse yield modeling
techniques (submitted to i-Forest)
Ludovico Fratea, Maria Laura Carranzaa, Vittorio Garfib, Mirko Di Febbraroa, Daniela Tontic, Marco
Marchettic, Marco Ottavianoc, Giovanni Santopuolic, Gherardo Chiricib
a Envix Lab, Dipartimento di Bioscienze e Territorio (DiBT), Università degli Studi del Molise, c.da Fonte Lappone 86090 Pesche, IS, Italy b Global Ecology Lab, Dipartimento di Bioscienze e Territorio (DiBT), Università degli Studi del Molise, c.da Fonte Lappone 86090 Pesche, IS, Italy c Natural Resource & Environmental Planning Lab, Dipartimento di Bioscienze e Territorio (DiBT), Università degli Studi del Molise, c.da Fonte Lappone 86090 Pesche, IS, Italy
(Accepted to iForest)

Estimation of forest
parameters for wall-
to-wall mapping
Estimating and mapping forest structural diversity using AirborneLaser Scanning data
(submitted to Remote Sensing of Environment).
Mura M., McRoberts R. E., Fattorini L., Chirici G., Marchetti M.
Inference of average structural indexes values (DBH_STD and H_STD) by ALS and mapping
Indice AVG design-based AVG model-assisted
DBH_STD 6.56 ± 0.58 6.36 ± 0.06
H_STD 2.90 ± 0.17 2.93 ± 0.02
Comparison with estimation design-based

Estimation of forest
parameters for wall-
to-wall mapping
Predicting forest structural naturalness using k-NN and ALS dataSelected diversity indexes: DBH_STD, H_STD, GS)
SNI (0=min naturality; 1=max naturality):
1 −
yi1 − Y1max
Y1max +
yi2 − Y2max
Y2max + ⋯+
yin − Ynmax
Ynmax
n
DBH_STD H_STD GSMEAN SE MEAN
No. Feat. Var. Mean R2 k t SSerr R2 R2 R2 GS
5 0.595 6 -1.71 620.88 0.503 0.619 0.663
AVG SNI = 0.7379 ± 0.0118
Predicting forest structural naturalness using k-Nearest Neighbors and Airborne Laser Scanning data
(submitted to Canadian Journal of Forest Research).
Mura M., McRoberts R. E., Chirici G., Marchetti M.

Estimation of forest
parameters for wall-
to-wall mapping
Comparing echo-based and canopy height model-based metrics forenhancing estimation of forest aboveground biomass in a model-assisted framework (submitted to Remote Sensing of Environment).
Chirici, G., Mura, M., Fattorini, L., McRoberts, R., & Marchetti, M.
Predictor variablesPrediction
technique
Variables
selectedTotal estimate (t) SE(RSE) estimate 95% confidence interval
EchoesLinear 1,961,886 205,904 (10%) 1,558,314-2,365,458
k-NN 2,029,560 209,493 (10%) 1,618,954-2,440,166
CHMLinear 2,017,132 207,072 (10%) 1,611,271-2,422,993
k-NN 2,119,152 208,941 (10%) 1,709,628-2,528,676
Design-based - - 2,277,061 255,134 (11%) 1,766,793-2,787,329

Classification of LULC
Classificazione object-oriented di categorie di uso/copertura del suolo sulla base di dati ALS
G. Lopez, M. Mura, G. Chirici, M. Marchetti
Atti XVIII Conferenza Nazionale ASITA 2014
Object-oriented classification of ALS data and comparison with optical data in the LULC classification
Optical dataIRS LISS III
ALS data

Classification of LULC
Classificazione object-oriented di categorie di uso/copertura del suolo sulla base di dati ALS
G. Lopez, M. Mura, G. Chirici, M. MarchettiAtti XVIII Conferenza Nazionale ASITA 2014
OA = 80%
OA = 54%OA = 63%

• LUCC• ES• TOF
Monitoring functionality and ES

Monitoring functionality and ES
TREES OUTSIDE FOREST MAPMOLISE REGION
WIDTH > 10 Mt
WIDTH OF 1 TO 20 Mt
SURFACE >50 Mt2
LENGTH > 50 Mt

Maximum percentage values of the probability of
connectivity for node and link for both study
areas and for both landscape spatial pattern
(without and with TOF inclusion).
Study area dPCnode dPClink
Alto Molise forest 5.86551 4.25171
Alto Molise forest and TOF 7.31495 4.44020
Basso Molise forest 0.0113006 25.4541
Basso Molise forest and TOF 0.342345 25.1031
Examples of maps of the 10 links connecting the 5 largest components (A)
without TOF; (B) with inclusion of TOF. Number identify the components.
The shortest and direct pathway of connectivity for (A) landscape is from
Component 10 to Component 33. For (B) landscape is from Component 10
to Component 66.
The influence of Trees Outside Forest on the landscapeconnectivity of ecological networks: a case study in MoliseRegion.Second International Congress of Forestry - Florence 26/29November 2014.
Ottaviano M., Tonti D., Di Martino P., Chirici G., Marchetti M.
TREES OUTSIDE FOREST (LANDSCAPECONNECTIVITY)
A B
Monitoring functionality and ES

Monitoring functionality and ES
Orthophoto of an agricultural area with TOF polygons and lines
Canopy Height Model from LiDAR data
Available data: LiDAR 1x1 (2008)(at least 3 points per square meter)
TREES OUTSIDE FOREST
(REMOTE SENSING ATTRIBUTES)

LiDAR Yellowscan (L’Avion Jaune)
Laser:
Wavelength: 905 nm
Sender: Pulsed laser diode
Pulse repetition rate: 36 kHz
Pulse energy: ≤ 375 nJ
Pulse width: 4.5 ns
Returns per pulse: 3
Beam divergence: 28.6 mrad x 1.43 mrad
Angular resolution: 0.125°Scan angle (full range): 60° (100°max)
Scan rate: 100 Hz
Scan pattern: parallel
Type of scanning mirror: rotating mirror
Testing of a detection system ALS on a Ultralight
Air Vehicle

•40-50 points/m2
•1-10 points/m2 on soil
Testing of a detection system ALS on a Ultralight
Air Vehicle

Advantages and disadvantages
• Versatility/Logistics
• Autonomy – Coverage area
• Manageability - Low Flying
• Manual flight : irregular
trajectories (direction, altitude)
Testing of a detection system ALS on a Ultralight
Air Vehicle