Embed Size (px)
Citation preview
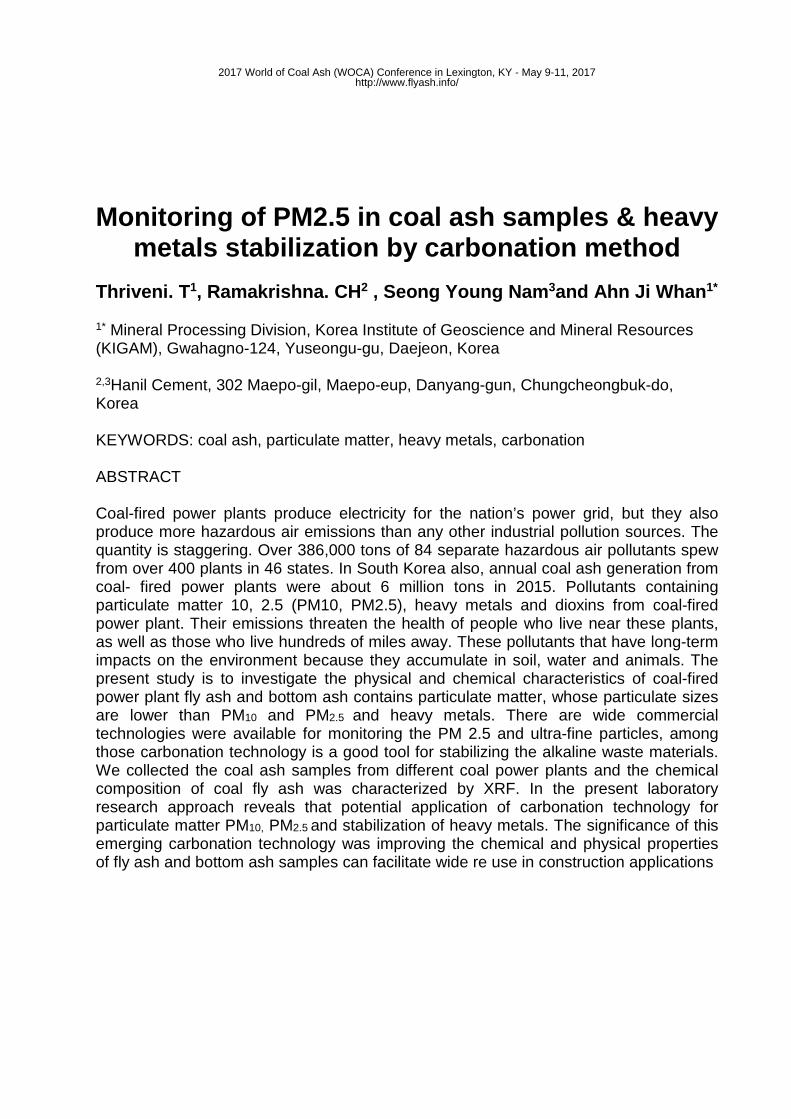
Monitoring of PM2.5 in coal ash samples & heavy metals stabilization by carbonation method
Thriveni. T1, Ramakrishna. CH2 , Seong Young Nam3and Ahn Ji Whan1* 1* Mineral Processing Division, Korea Institute of Geoscience and Mineral Resources (KIGAM), Gwahagno-124, Yuseongu-gu, Daejeon, Korea 2,3Hanil Cement, 302 Maepo-gil, Maepo-eup, Danyang-gun, Chungcheongbuk-do, Korea KEYWORDS: coal ash, particulate matter, heavy metals, carbonation ABSTRACT Coal-fired power plants produce electricity for the nation’s power grid, but they also produce more hazardous air emissions than any other industrial pollution sources. The quantity is staggering. Over 386,000 tons of 84 separate hazardous air pollutants spew from over 400 plants in 46 states. In South Korea also, annual coal ash generation from coal- fired power plants were about 6 million tons in 2015. Pollutants containing particulate matter 10, 2.5 (PM10, PM2.5), heavy metals and dioxins from coal-fired power plant. Their emissions threaten the health of people who live near these plants, as well as those who live hundreds of miles away. These pollutants that have long-term impacts on the environment because they accumulate in soil, water and animals. The present study is to investigate the physical and chemical characteristics of coal-fired power plant fly ash and bottom ash contains particulate matter, whose particulate sizes are lower than PM10 and PM2.5 and heavy metals. There are wide commercial technologies were available for monitoring the PM 2.5 and ultra-fine particles, among those carbonation technology is a good tool for stabilizing the alkaline waste materials. We collected the coal ash samples from different coal power plants and the chemical composition of coal fly ash was characterized by XRF. In the present laboratory research approach reveals that potential application of carbonation technology for particulate matter PM10, PM2.5 and stabilization of heavy metals. The significance of this emerging carbonation technology was improving the chemical and physical properties of fly ash and bottom ash samples can facilitate wide re use in construction applications
2017 World of Coal Ash (WOCA) Conference in Lexington, KY - May 9-11, 2017http://www.flyash.info/
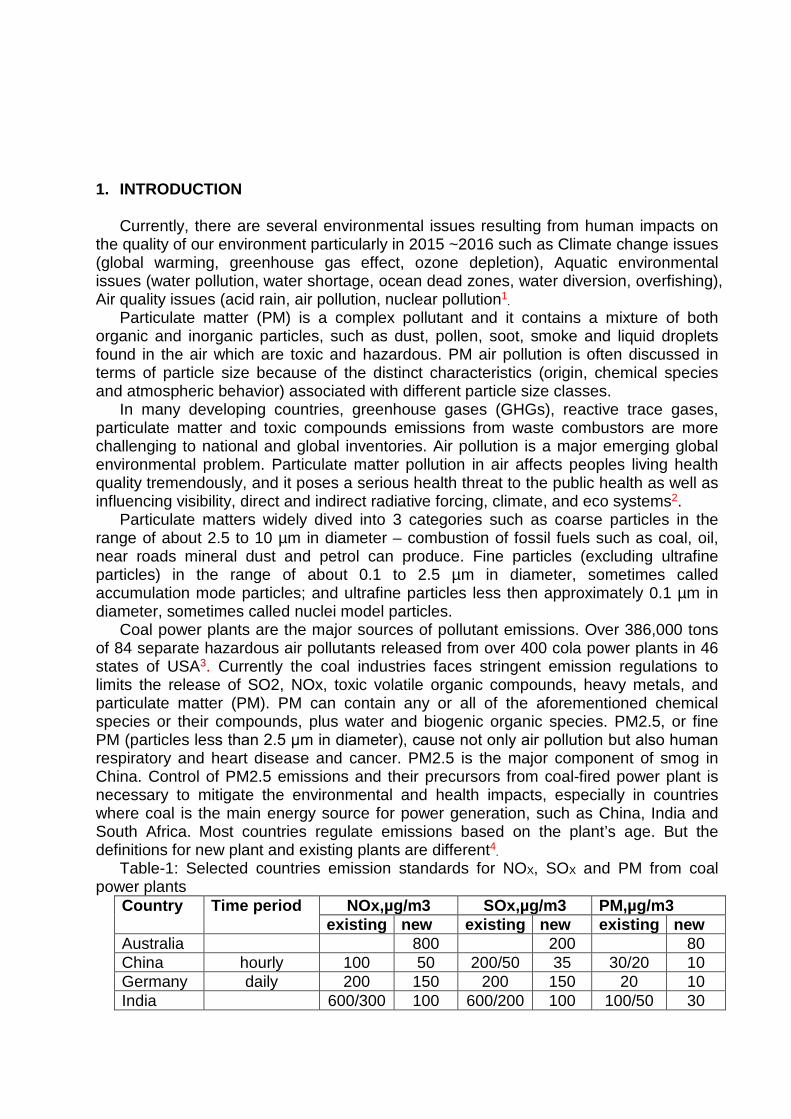
1. INTRODUCTION
Currently, there are several environmental issues resulting from human impacts on
the quality of our environment particularly in 2015 ~2016 such as Climate change issues (global warming, greenhouse gas effect, ozone depletion), Aquatic environmental issues (water pollution, water shortage, ocean dead zones, water diversion, overfishing), Air quality issues (acid rain, air pollution, nuclear pollution1.
Particulate matter (PM) is a complex pollutant and it contains a mixture of both organic and inorganic particles, such as dust, pollen, soot, smoke and liquid droplets found in the air which are toxic and hazardous. PM air pollution is often discussed in terms of particle size because of the distinct characteristics (origin, chemical species and atmospheric behavior) associated with different particle size classes.
In many developing countries, greenhouse gases (GHGs), reactive trace gases, particulate matter and toxic compounds emissions from waste combustors are more challenging to national and global inventories. Air pollution is a major emerging global environmental problem. Particulate matter pollution in air affects peoples living health quality tremendously, and it poses a serious health threat to the public health as well as influencing visibility, direct and indirect radiative forcing, climate, and eco systems2.
Particulate matters widely dived into 3 categories such as coarse particles in the range of about 2.5 to 10 µm in diameter – combustion of fossil fuels such as coal, oil, near roads mineral dust and petrol can produce. Fine particles (excluding ultrafine particles) in the range of about 0.1 to 2.5 µm in diameter, sometimes called accumulation mode particles; and ultrafine particles less then approximately 0.1 µm in diameter, sometimes called nuclei model particles.
Coal power plants are the major sources of pollutant emissions. Over 386,000 tons of 84 separate hazardous air pollutants released from over 400 cola power plants in 46 states of USA3. Currently the coal industries faces stringent emission regulations to limits the release of SO2, NOx, toxic volatile organic compounds, heavy metals, and particulate matter (PM). PM can contain any or all of the aforementioned chemical species or their compounds, plus water and biogenic organic species. PM2.5, or fine PM (particles less than 2.5 μm in diameter), cause not only air pollution but also human respiratory and heart disease and cancer. PM2.5 is the major component of smog in China. Control of PM2.5 emissions and their precursors from coal-fired power plant is necessary to mitigate the environmental and health impacts, especially in countries where coal is the main energy source for power generation, such as China, India and South Africa. Most countries regulate emissions based on the plant’s age. But the definitions for new plant and existing plants are different4.
Table-1: Selected countries emission standards for NOX, SOX and PM from coal power plants
Country Time period NOx,µg/m3 SOx,µg/m3 PM,µg/m3 existing new existing new existing new
Australia 800 200 80 China hourly 100 50 200/50 35 30/20 10 Germany daily 200 150 200 150 20 10 India 600/300 100 600/200 100 100/50 30
Indonesia 850 750 750 750 150 100 Japan 410 200 200 100 50 South Africa
continuously 1100 750 3500 500 100 50
Thailand 820 410 2002 515 180 80 USA Daily 135 95.3 185 136 18.5 12.3 EU IED continuously 200 150 200 150 20 10 There are several reports published for the source of particulate matter emissions
from industrial plants5-10. In this paper, we presented our investigated research results. We used coal
power plants bottom ash and coal ash samples for measuring the particulate matter and
2. Environmental and Public Health Effects of PM Emissions
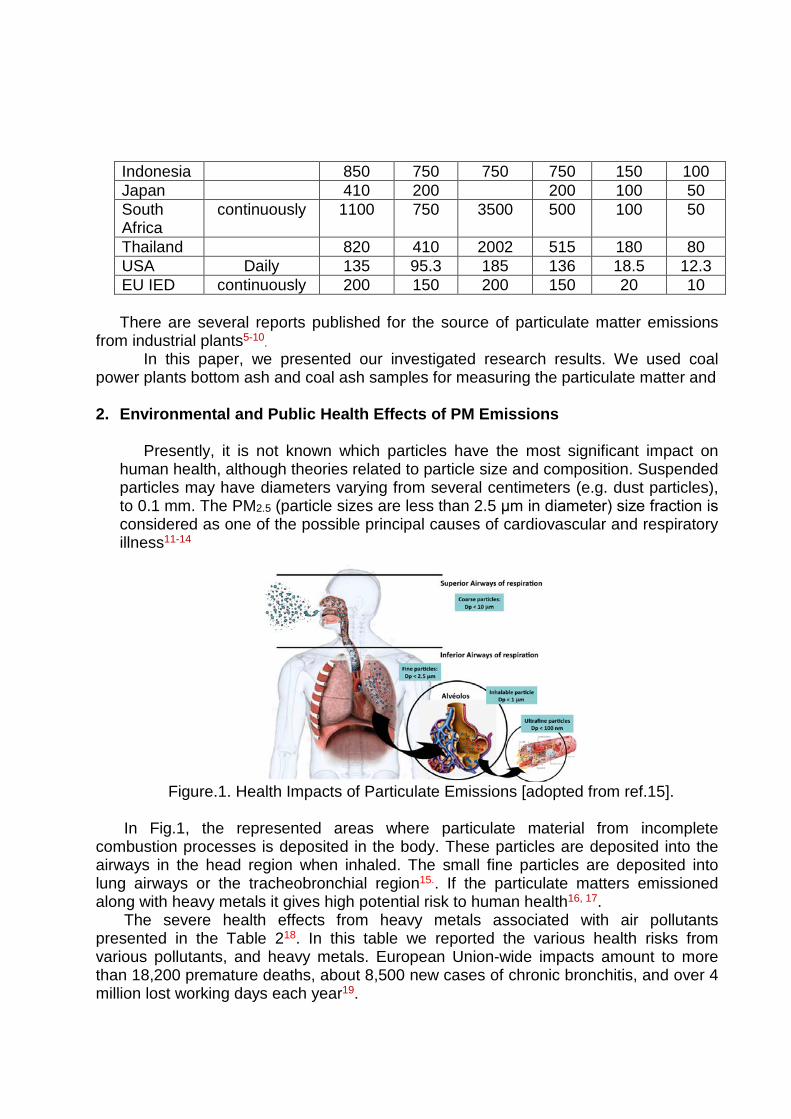
Presently, it is not known which particles have the most significant impact on human health, although theories related to particle size and composition. Suspended particles may have diameters varying from several centimeters (e.g. dust particles), to 0.1 mm. The PM2.5 (particle sizes are less than 2.5 μm in diameter) size fraction is considered as one of the possible principal causes of cardiovascular and respiratory illness11-14
Figure.1. Health Impacts of Particulate Emissions [adopted from ref.15].
In Fig.1, the represented areas where particulate material from incomplete
combustion processes is deposited in the body. These particles are deposited into the airways in the head region when inhaled. The small fine particles are deposited into lung airways or the tracheobronchial region15.. If the particulate matters emissioned along with heavy metals it gives high potential risk to human health16, 17.
The severe health effects from heavy metals associated with air pollutants presented in the Table 218. In this table we reported the various health risks from various pollutants, and heavy metals. European Union-wide impacts amount to more than 18,200 premature deaths, about 8,500 new cases of chronic bronchitis, and over 4 million lost working days each year19.
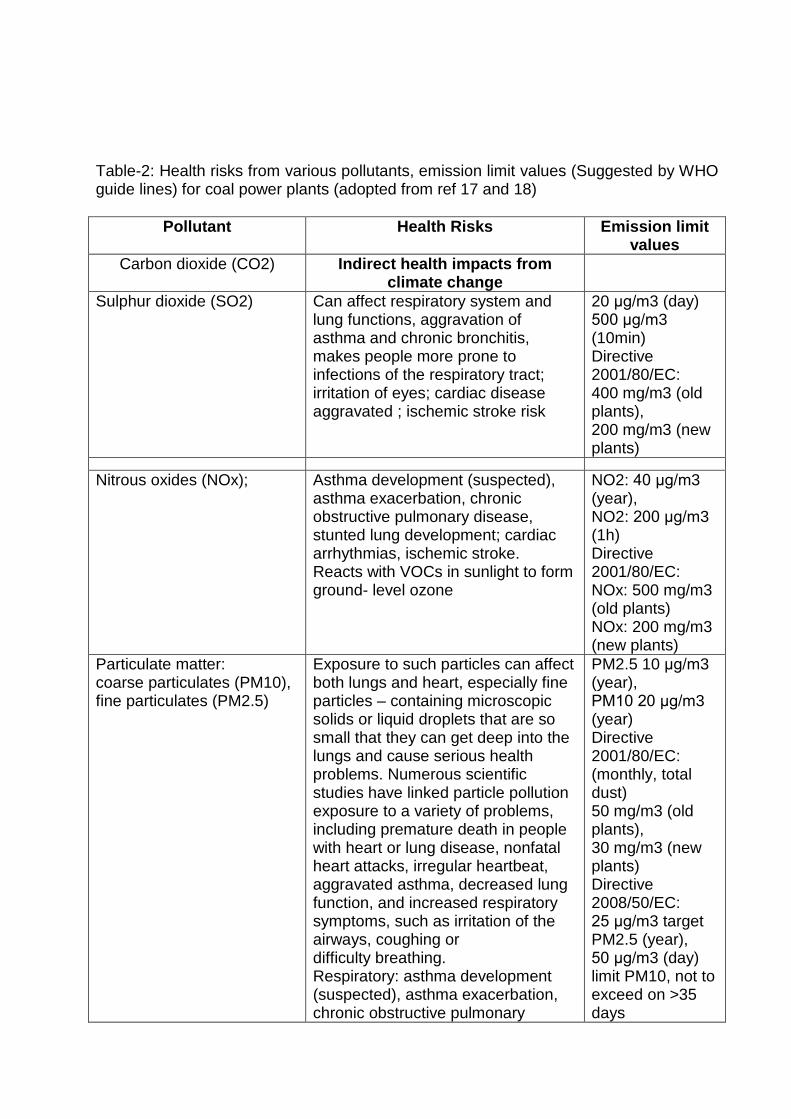
Table-2: Health risks from various pollutants, emission limit values (Suggested by WHO guide lines) for coal power plants (adopted from ref 17 and 18)
Pollutant Health Risks Emission limit values
Carbon dioxide (CO2)
Indirect health impacts from climate change
Sulphur dioxide (SO2) Can affect respiratory system and lung functions, aggravation of asthma and chronic bronchitis, makes people more prone to infections of the respiratory tract; irritation of eyes; cardiac disease aggravated ; ischemic stroke risk
20 μg/m3 (day) 500 μg/m3 (10min) Directive 2001/80/EC: 400 mg/m3 (old plants), 200 mg/m3 (new plants)
Nitrous oxides (NOx); Asthma development (suspected),
asthma exacerbation, chronic obstructive pulmonary disease, stunted lung development; cardiac arrhythmias, ischemic stroke. Reacts with VOCs in sunlight to form ground- level ozone
NO2: 40 μg/m3 (year), NO2: 200 μg/m3 (1h) Directive 2001/80/EC: NOx: 500 mg/m3 (old plants) NOx: 200 mg/m3 (new plants)
Particulate matter: coarse particulates (PM10), fine particulates (PM2.5)
Exposure to such particles can affect both lungs and heart, especially fine particles – containing microscopic solids or liquid droplets that are so small that they can get deep into the lungs and cause serious health problems. Numerous scientific studies have linked particle pollution exposure to a variety of problems, including premature death in people with heart or lung disease, nonfatal heart attacks, irregular heartbeat, aggravated asthma, decreased lung function, and increased respiratory symptoms, such as irritation of the airways, coughing or difficulty breathing. Respiratory: asthma development (suspected), asthma exacerbation, chronic obstructive pulmonary
PM2.5 10 μg/m3 (year), PM10 20 μg/m3 (year) Directive 2001/80/EC: (monthly, total dust) 50 mg/m3 (old plants), 30 mg/m3 (new plants) Directive 2008/50/EC: 25 μg/m3 target PM2.5 (year), 50 μg/m3 (day) limit PM10, not to exceed on >35 days
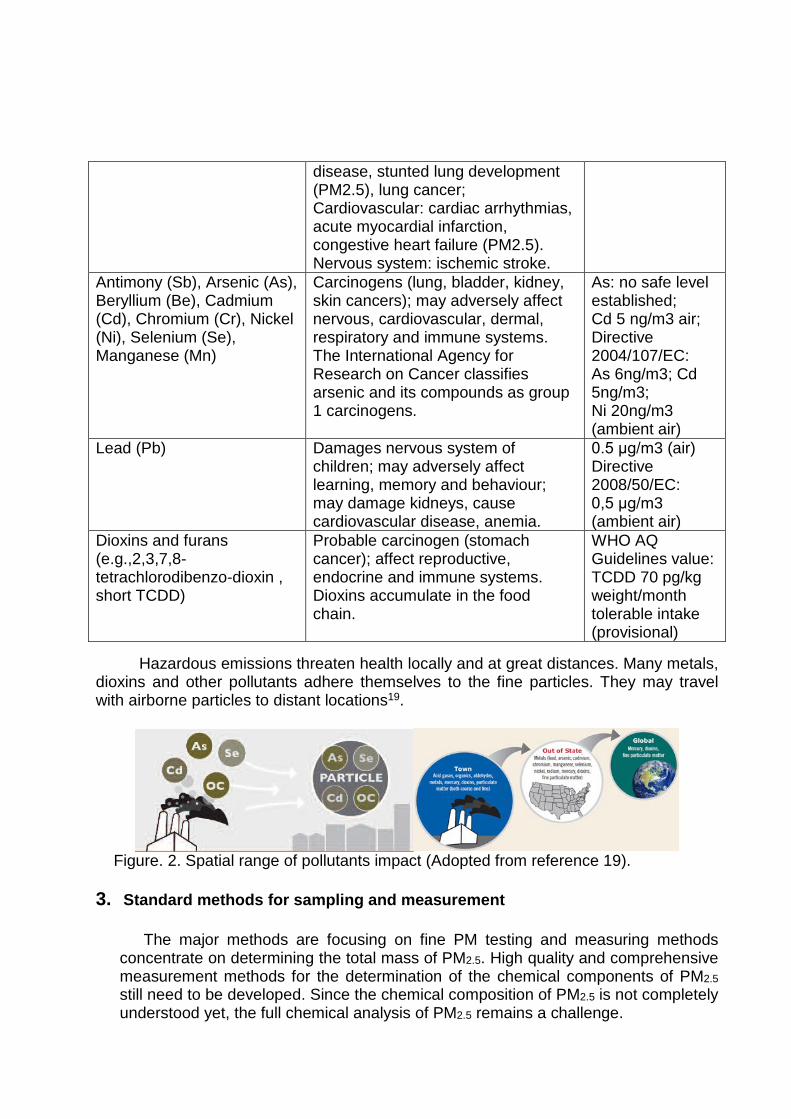
disease, stunted lung development (PM2.5), lung cancer; Cardiovascular: cardiac arrhythmias, acute myocardial infarction, congestive heart failure (PM2.5). Nervous system: ischemic stroke.
Antimony (Sb), Arsenic (As), Beryllium (Be), Cadmium (Cd), Chromium (Cr), Nickel (Ni), Selenium (Se), Manganese (Mn)
Carcinogens (lung, bladder, kidney, skin cancers); may adversely affect nervous, cardiovascular, dermal, respiratory and immune systems. The International Agency for Research on Cancer classifies arsenic and its compounds as group 1 carcinogens.
As: no safe level established; Cd 5 ng/m3 air; Directive 2004/107/EC: As 6ng/m3; Cd 5ng/m3; Ni 20ng/m3 (ambient air)
Lead (Pb) Damages nervous system of children; may adversely affect learning, memory and behaviour; may damage kidneys, cause cardiovascular disease, anemia.
0.5 μg/m3 (air) Directive 2008/50/EC: 0,5 μg/m3 (ambient air)
Dioxins and furans (e.g.,2,3,7,8-tetrachlorodibenzo-dioxin , short TCDD)
Probable carcinogen (stomach cancer); affect reproductive, endocrine and immune systems. Dioxins accumulate in the food chain.
WHO AQ Guidelines value: TCDD 70 pg/kg weight/month tolerable intake (provisional)
Hazardous emissions threaten health locally and at great distances. Many metals, dioxins and other pollutants adhere themselves to the fine particles. They may travel with airborne particles to distant locations19.
Figure. 2. Spatial range of pollutants impact (Adopted from reference 19). 3. Standard methods for sampling and measurement
The major methods are focusing on fine PM testing and measuring methods
concentrate on determining the total mass of PM2.5. High quality and comprehensive measurement methods for the determination of the chemical components of PM2.5 still need to be developed. Since the chemical composition of PM2.5 is not completely understood yet, the full chemical analysis of PM2.5 remains a challenge.
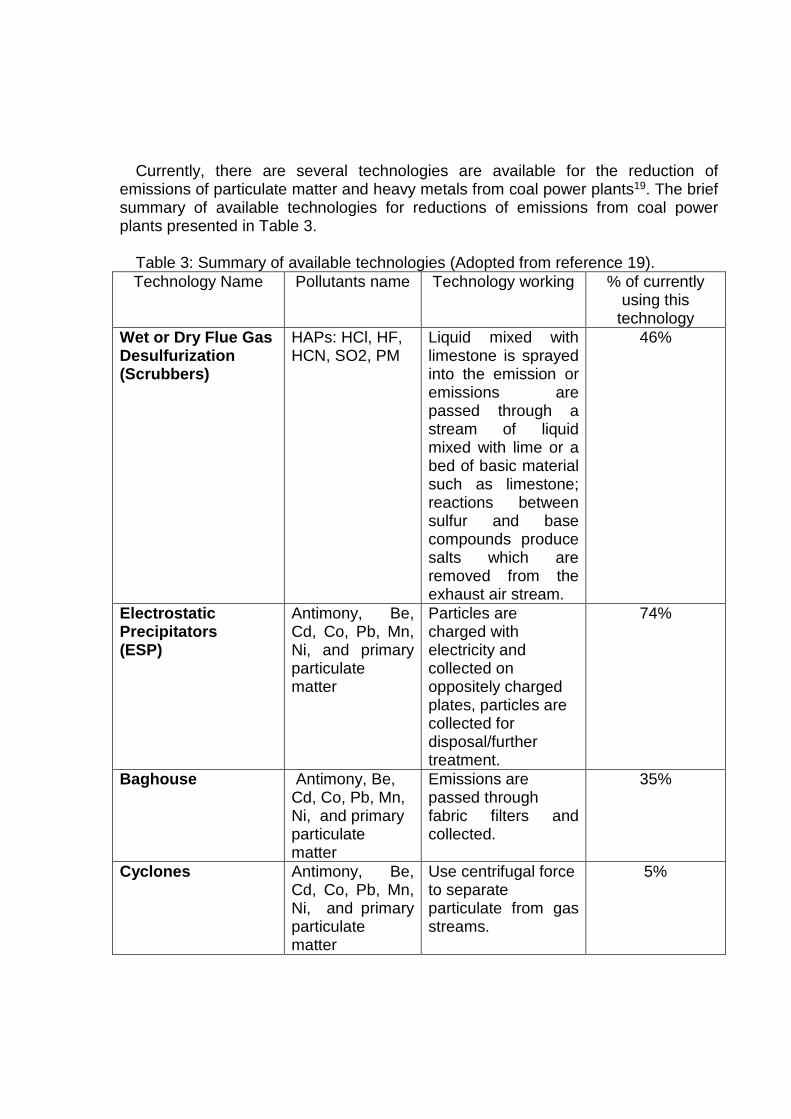
Currently, there are several technologies are available for the reduction of emissions of particulate matter and heavy metals from coal power plants19. The brief summary of available technologies for reductions of emissions from coal power plants presented in Table 3.
Table 3: Summary of available technologies (Adopted from reference 19). Technology Name Pollutants name Technology working % of currently
using this technology
Wet or Dry Flue Gas Desulfurization (Scrubbers)
HAPs: HCl, HF, HCN, SO2, PM
Liquid mixed with limestone is sprayed into the emission or emissions are passed through a stream of liquid mixed with lime or a bed of basic material such as limestone; reactions between sulfur and base compounds produce salts which are removed from the exhaust air stream.
46%
Electrostatic Precipitators (ESP)
Antimony, Be, Cd, Co, Pb, Mn, Ni, and primary particulate matter
Particles are charged with electricity and collected on oppositely charged plates, particles are collected for disposal/further treatment.
74%
Baghouse Antimony, Be, Cd, Co, Pb, Mn, Ni, and primary particulate matter
Emissions are passed through fabric filters and collected.
35%
Cyclones Antimony, Be, Cd, Co, Pb, Mn, Ni, and primary particulate matter
Use centrifugal force to separate particulate from gas streams.
5%
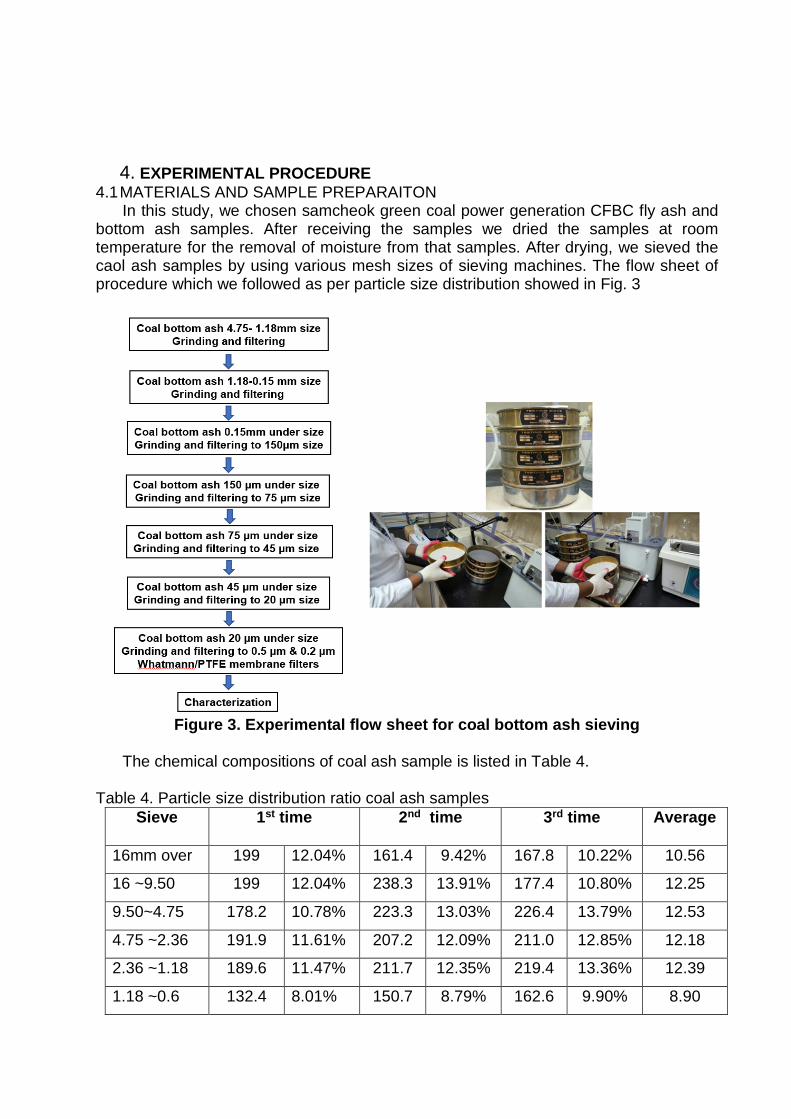
4. EXPERIMENTAL PROCEDURE 4.1 MATERIALS AND SAMPLE PREPARAITON
In this study, we chosen samcheok green coal power generation CFBC fly ash and bottom ash samples. After receiving the samples we dried the samples at room temperature for the removal of moisture from that samples. After drying, we sieved the caol ash samples by using various mesh sizes of sieving machines. The flow sheet of procedure which we followed as per particle size distribution showed in Fig. 3
Figure 3. Experimental flow sheet for coal bottom ash sieving
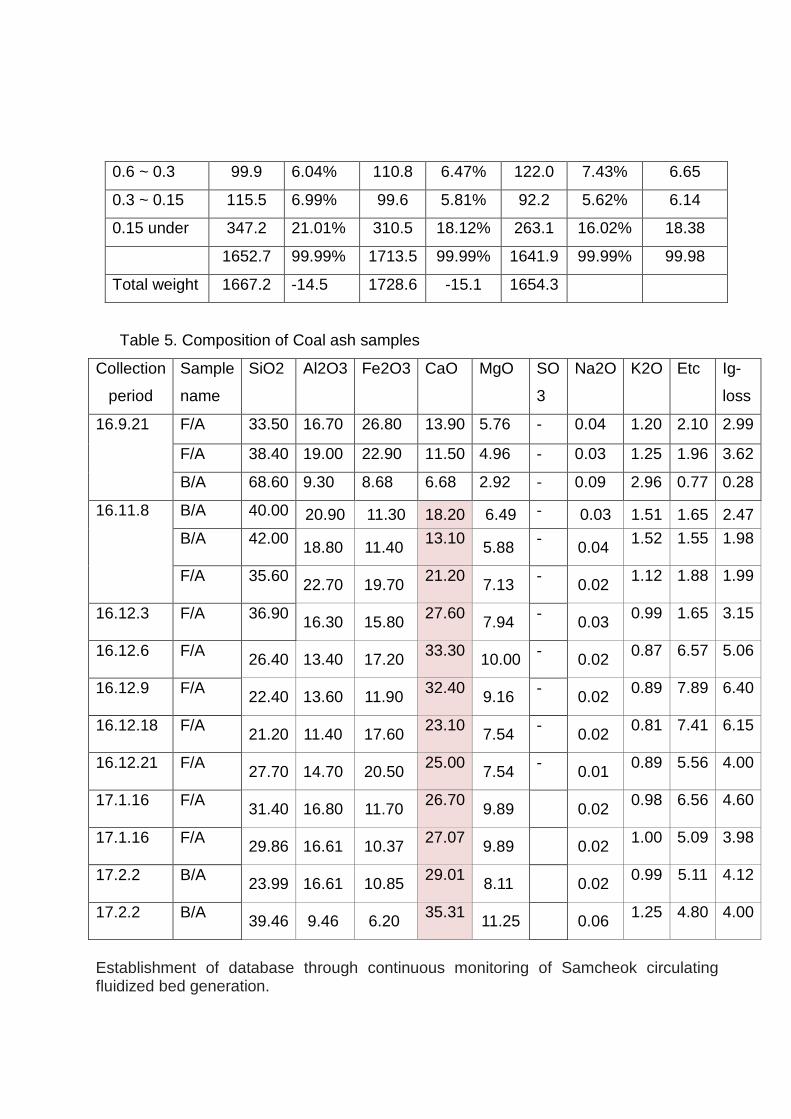
The chemical compositions of coal ash sample is listed in Table 4.
Table 4. Particle size distribution ratio coal ash samples
Sieve 1st time 2nd time 3rd time Average
16mm over 199 12.04% 161.4 9.42% 167.8 10.22% 10.56
16 ~9.50 199 12.04% 238.3 13.91% 177.4 10.80% 12.25
9.50~4.75 178.2 10.78% 223.3 13.03% 226.4 13.79% 12.53
4.75 ~2.36 191.9 11.61% 207.2 12.09% 211.0 12.85% 12.18
2.36 ~1.18 189.6 11.47% 211.7 12.35% 219.4 13.36% 12.39
1.18 ~0.6 132.4 8.01% 150.7 8.79% 162.6 9.90% 8.90
0.6 ~ 0.3 99.9 6.04% 110.8 6.47% 122.0 7.43% 6.65
0.3 ~ 0.15 115.5 6.99% 99.6 5.81% 92.2 5.62% 6.14
0.15 under 347.2 21.01% 310.5 18.12% 263.1 16.02% 18.38
1652.7 99.99% 1713.5 99.99% 1641.9 99.99% 99.98
Total weight 1667.2 -14.5 1728.6 -15.1 1654.3
Table 5. Composition of Coal ash samples
Collection
period
Sample
name
SiO2 Al2O3 Fe2O3 CaO MgO SO
3
Na2O K2O Etc Ig-
loss
16.9.21 F/A 33.50 16.70 26.80 13.90 5.76 - 0.04 1.20 2.10 2.99
F/A 38.40 19.00 22.90 11.50 4.96 - 0.03 1.25 1.96 3.62
B/A 68.60 9.30 8.68 6.68 2.92 - 0.09 2.96 0.77 0.28
16.11.8 B/A 40.00 20.90 11.30 18.20 6.49 - 0.03 1.51 1.65 2.47 B/A 42.00 18.80 11.40 13.10
5.88 - 0.04 1.52
1.55
1.98
F/A 35.60 22.70 19.70 21.20 7.13 - 0.02 1.12
1.88
1.99
16.12.3 F/A 36.90 16.30 15.80 27.60
7.94 - 0.03 0.99
1.65
3.15
16.12.6 F/A 26.40 13.40 17.20 33.30 10.00 - 0.02 0.87
6.57
5.06
16.12.9 F/A 22.40 13.60 11.90 32.40
9.16 - 0.02 0.89
7.89
6.40
16.12.18 F/A 21.20 11.40 17.60 23.10 7.54 - 0.02 0.81
7.41
6.15
16.12.21 F/A 27.70 14.70 20.50 25.00
7.54 - 0.01 0.89
5.56
4.00
17.1.16 F/A 31.40 16.80 11.70 26.70 9.89 0.02 0.98
6.56
4.60
17.1.16 F/A 29.86 16.61 10.37 27.07
9.89 0.02 1.00
5.09
3.98
17.2.2 B/A 23.99 16.61 10.85 29.01 8.11 0.02 0.99
5.11
4.12
17.2.2 B/A 39.46 9.46 6.20 35.31
11.25 0.06 1.25
4.80
4.00
Establishment of database through continuous monitoring of Samcheok circulating fluidized bed generation.

5 RESULTS AND DISCUSSION We investigated the physical and chemical characteristics of Samchuk Green Power Circulating Fluidized Bed Power Plant coal ash samples. The CFBC bottom ash contains high amount of calcium because of the desulfurization process using limestone. The particle distribution is presented in Fig.4. The particles in between 0.15 ~ 1.18mm occupies about 80%.
(+4.75mm) (4.75~2.36mm) (2.36~1.18mm) (1.18~0.6mm) (0.6~0.3mm) (0.3~0.15mm) (-0.15mm)0
10
20
30
40
50
60
Sepa
ratio
n of
CFB
C bo
ttom
ash
(%)
Partcle size of CFBC bottom ash
CFBC bottom ash
Figure.4 Particle size distribution of CFBC bottom ash
(a) (b)
Fig.5 (a) and (b) represented for CFBC fly ash and CFBC bottom ash.
The circulated fluidized bed combustion fly ash and bottom ash samples were characterized by XRD and showed in Figure 5. The fly ash collected (differential) through boiler internal dust collector, the residual bottom ash collected from the bottom of boiler (various size). The average amount of 37.0% and 30.6% of CaO is contained in fly ash and bottom ash, respectively.In fly ash, Lime 20.5%, Periclase 12.3%, Anhydrite 6.4%, Calcite 16.6% and in Flooring: Lime 9.9%, Periclase 6.0%, Anhydrite 4.6%, Calcite 1.4%. Large amounts of CaO in the Samchuk green power circulating fluidized bed power plant.
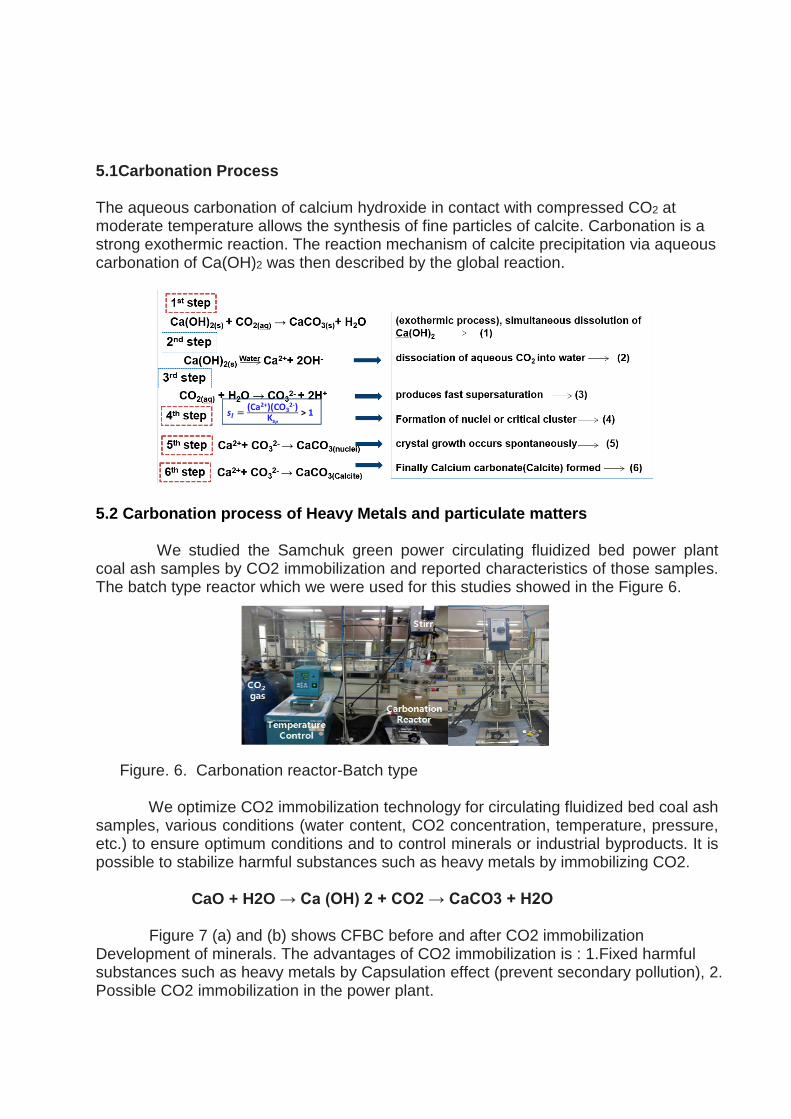
5.1Carbonation Process The aqueous carbonation of calcium hydroxide in contact with compressed CO2 at moderate temperature allows the synthesis of fine particles of calcite. Carbonation is a strong exothermic reaction. The reaction mechanism of calcite precipitation via aqueous carbonation of Ca(OH)2 was then described by the global reaction.
5.2 Carbonation process of Heavy Metals and particulate matters We studied the Samchuk green power circulating fluidized bed power plant coal ash samples by CO2 immobilization and reported characteristics of those samples. The batch type reactor which we were used for this studies showed in the Figure 6.
Figure. 6. Carbonation reactor-Batch type
We optimize CO2 immobilization technology for circulating fluidized bed coal ash samples, various conditions (water content, CO2 concentration, temperature, pressure, etc.) to ensure optimum conditions and to control minerals or industrial byproducts. It is possible to stabilize harmful substances such as heavy metals by immobilizing CO2.
CaO + H2O → Ca (OH) 2 + CO2 → CaCO3 + H2O
Figure 7 (a) and (b) shows CFBC before and after CO2 immobilization Development of minerals. The advantages of CO2 immobilization is : 1.Fixed harmful substances such as heavy metals by Capsulation effect (prevent secondary pollution), 2. Possible CO2 immobilization in the power plant.

(a) (b)
Figure. 7 (a) Carbonated CFBC fly ash (b) Carbonated CFBC bottom ash 5.3 Effect of Solid/liquid ratio We studied the effect of solid/liquid ratio of coal ash samples. The correlation between carbonate production efficiency and wastewater generation according to power generation-H2O in the case of power plant CO2 immobilization (Fig.8).
0 200 400 600 800 1000 1200 1400 16005
6
7
8
9
10
11
12
13
R2 = 0.9454 at S/L 0.1
R2 = 0.9291 at S/L 0.2
R2 = 0.8344 at S/L 0.3
pH 7
pH
Carbonation Time (sec)
CFBC Fly ash at Solid/Liquid 0.1 CFBC Fly ash at Solid/Liquid 0.2 CFBC Fly ash at Solid/Liquid 0.3
0 100 200 300 400 500 6005
6
7
8
9
10
11
12
R2 = 0.5486 at S/L 0.1
pH 7R2 = 0.5449 at S/L 0.2
R2 = 0.6137 at S/L 0.3
CFBC Bottom ash at Solid/Liquid 0.1 CFBC Bottom ash at Solid/Liquid 0.2 CFBC Bottom ash at Solid/Liquid 0.3
pH
Carbonation Time (sec) 0 100 200 300 400 500 600 700 800 900 1000
5
6
7
8
9
10
11
12
R2 = 0.3527 at S/L 0.1
pH 7R2 = 0.5542 at S/L 0.2
R2 = 0.5396 at S/L 0.3
CFBC Bottom ash (-0.15mm) at Solid/Liquid 0.1 CFBC Bottom ash (-0.15mm) at Solid/Liquid 0.2 CFBC Bottom ash (-0.15mm) at Solid/Liquid 0.3
pH
Carbonation Time (sec) Figure. 7 (a) Carbonated CFBC fly ash (b) Carbonated CFBC bottom ash, (c) bottom ash with -0.15mm size. The fly ash increased by about 4 times (S / L 0.1 → S / L 0.3) as reaction time increased although the reaction time is similar (small amount of CaO) (Fig.8).
Figure. 8 (a) CFBC fly ash (b) CFBC bottom ash with different Liquid/solid ratios. Improvement of production efficiency due to decrease of high liquid ratio (reduction of reaction time) - verified of relative occurrence of large amount of wastewater.
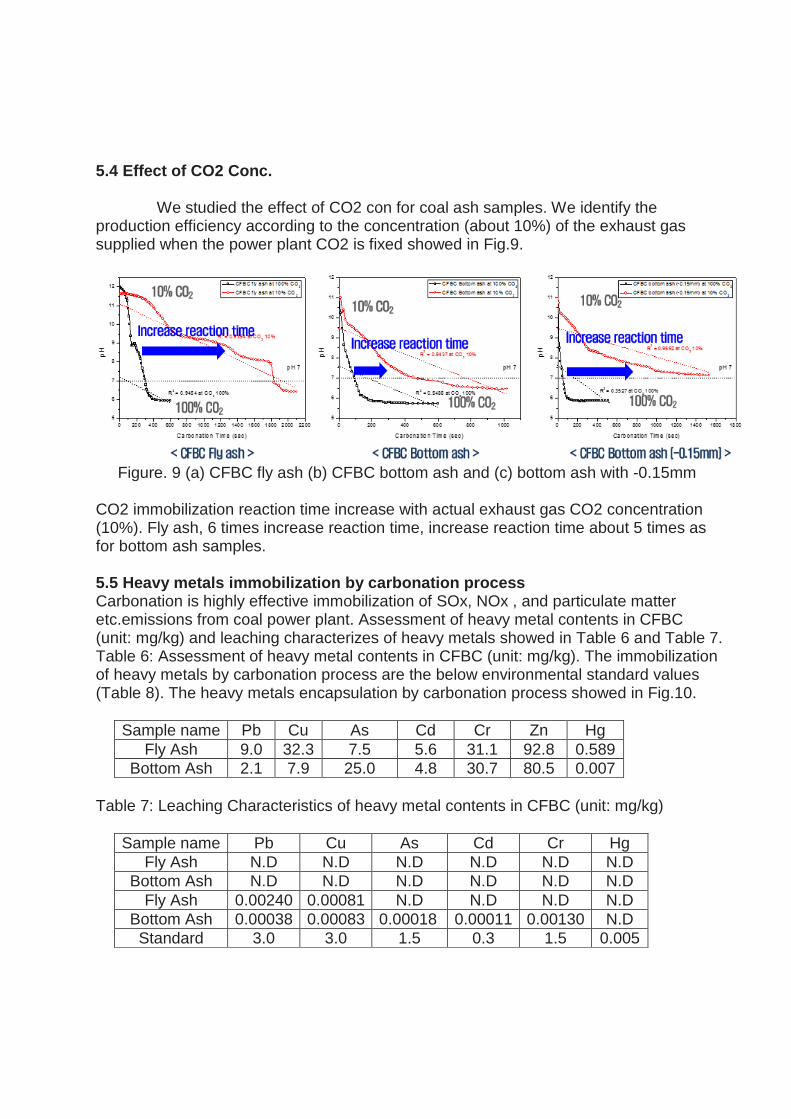
5.4 Effect of CO2 Conc. We studied the effect of CO2 con for coal ash samples. We identify the production efficiency according to the concentration (about 10%) of the exhaust gas supplied when the power plant CO2 is fixed showed in Fig.9.
Figure. 9 (a) CFBC fly ash (b) CFBC bottom ash and (c) bottom ash with -0.15mm
CO2 immobilization reaction time increase with actual exhaust gas CO2 concentration (10%). Fly ash, 6 times increase reaction time, increase reaction time about 5 times as for bottom ash samples. 5.5 Heavy metals immobilization by carbonation process Carbonation is highly effective immobilization of SOx, NOx , and particulate matter etc.emissions from coal power plant. Assessment of heavy metal contents in CFBC (unit: mg/kg) and leaching characterizes of heavy metals showed in Table 6 and Table 7. Table 6: Assessment of heavy metal contents in CFBC (unit: mg/kg). The immobilization of heavy metals by carbonation process are the below environmental standard values (Table 8). The heavy metals encapsulation by carbonation process showed in Fig.10.
Sample name Pb Cu As Cd Cr Zn Hg Fly Ash 9.0 32.3 7.5 5.6 31.1 92.8 0.589
Bottom Ash 2.1 7.9 25.0 4.8 30.7 80.5 0.007 Table 7: Leaching Characteristics of heavy metal contents in CFBC (unit: mg/kg)
Sample name Pb Cu As Cd Cr Hg Fly Ash N.D N.D N.D N.D N.D N.D
Bottom Ash N.D N.D N.D N.D N.D N.D Fly Ash 0.00240 0.00081 N.D N.D N.D N.D
Bottom Ash 0.00038 0.00083 0.00018 0.00011 0.00130 N.D Standard 3.0 3.0 1.5 0.3 1.5 0.005
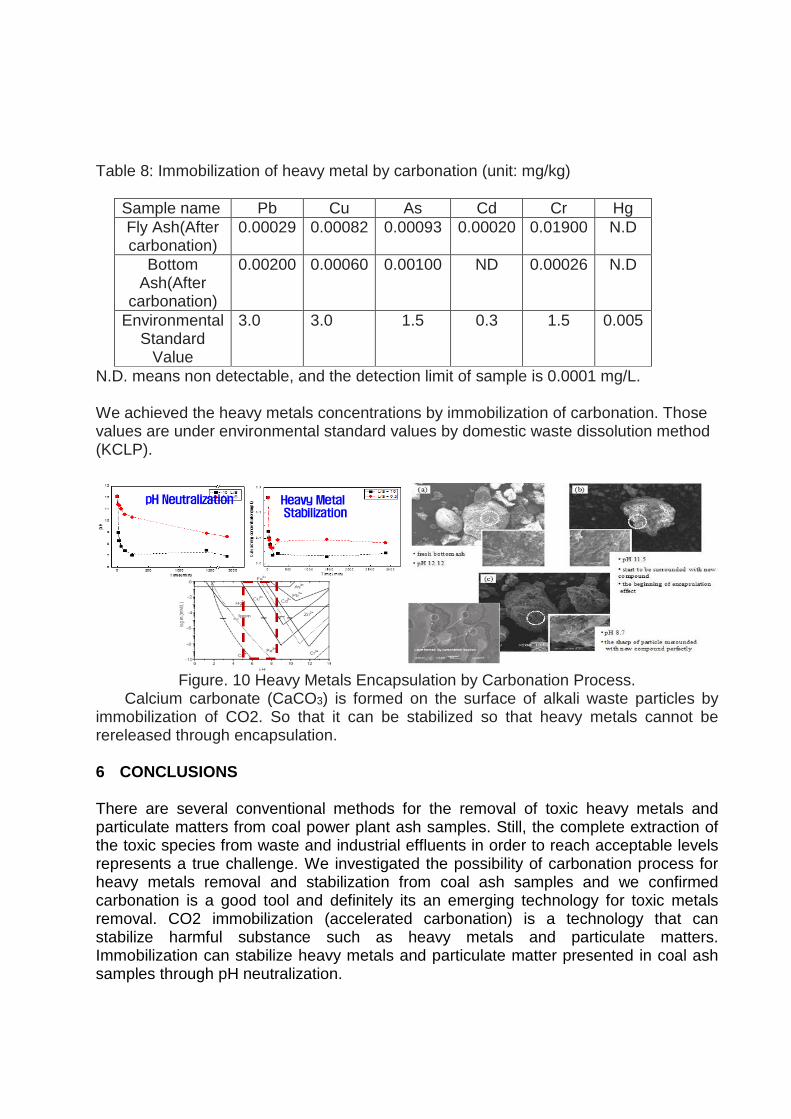
Table 8: Immobilization of heavy metal by carbonation (unit: mg/kg)
Sample name Pb Cu As Cd Cr Hg Fly Ash(After carbonation)
0.00029 0.00082 0.00093 0.00020 0.01900 N.D
Bottom Ash(After
carbonation)
0.00200 0.00060 0.00100 ND 0.00026 N.D
Environmental Standard
Value
3.0 3.0 1.5 0.3 1.5 0.005
N.D. means non detectable, and the detection limit of sample is 0.0001 mg/L. We achieved the heavy metals concentrations by immobilization of carbonation. Those values are under environmental standard values by domestic waste dissolution method (KCLP).
Figure. 10 Heavy Metals Encapsulation by Carbonation Process.
Calcium carbonate (CaCO3) is formed on the surface of alkali waste particles by immobilization of CO2. So that it can be stabilized so that heavy metals cannot be rereleased through encapsulation.
6 CONCLUSIONS There are several conventional methods for the removal of toxic heavy metals and particulate matters from coal power plant ash samples. Still, the complete extraction of the toxic species from waste and industrial effluents in order to reach acceptable levels represents a true challenge. We investigated the possibility of carbonation process for heavy metals removal and stabilization from coal ash samples and we confirmed carbonation is a good tool and definitely its an emerging technology for toxic metals removal. CO2 immobilization (accelerated carbonation) is a technology that can stabilize harmful substance such as heavy metals and particulate matters. Immobilization can stabilize heavy metals and particulate matter presented in coal ash samples through pH neutralization.
7 ACKNOWLEDGEMENTS This study was supported by the Energy Technology Development Project [20141010101880] of the Korea Institute of Energy Technology Evaluation and Planning, financed by the Ministry of Trade, Industry and Energy. 8 REFERENCES
1. Karen L. Lancour, Green generations, problems resulting from human impact, 2014, 1-20. 2. Frank J. Kelly . Julia C. Fussell, Air pollution and public health: emerging hazards and improved understanding of risk, Environ Geochem Health, 37, 2015, 631–649. 3. U.S. Environmental Protection Agency (EPA). 2007. National Emission Inventory (NEI) 2002: Inventory Data: Point Sector Data – ALLNEI HAP Annual 01232008. Web Link: http://www.epa.gov/ttn/chief/net/2002inventory.html# nventory data [Accessed 11 January 2011]. 4. International Energy Agency clean coal center report, Emission standards and control of PM2.5 from coal fired power plants, 37, 2016. 5. C. Ehrlicha, G. Nolla, W.D. Kalkoffa, G. Baumbachb, A. Dreiseidler, PM10, PM2.5 and PM1.0 Emissions from industrial plants - Results from measurement programmes in Germany, Atmospheric Environment 41, 2007, 6236–6254. 6. Baumbach, G., Zuberbu¨ hler, U., Struschka, M., Straub, D., Hein, K.R.G., 1999. Feinstaubuntersuchungen an Holzfeuerungen; Teil 1: Bereich Hausbrand und Kleingewerbe. Institut fu¨ r Verfahrenstechnik und Dampfkesselwesen, Report No. , 44, Universta¨ t Stuttgart. 7. Bayerisches Landesamt fu¨ r Umweltschutz, 2000. Grundsatzuntersuchung u¨ ber die Korngro¨ Xenverteilung im Abgas verschiedener Emittenten, Project I and II. /http://www. bayern.de/lfu/luft/veroeffentlich/umweltforsch/umweltforsch. htmS (last accessed 16/02/07). 8. Dreiseidler, A., Straub, D., Baumbach, G., 2001. Korngro¨ Xenverteilung (PM10 und PM2.5) von Staubemissionen relevanter stationa¨ rer Quellen. UBA-Forschungsbericht 298 44 280, Berlin. 9.Landesamtesfu¨r Umweltschutz Sachsen-Anhalt, 2001. Feinstaubemissionsuntersu chungen in Sachsen-Anhalt: PM10_PM2.5_ und PM1.0_ Emissionen aus Industrie und Hausbrand, Sonderheft 1. /http://www.mu. sachsen- anhalt.de/ start/ fach bereich 03/ fachberichte/main.htmS (last accessed 16/02/07). 10. Nisulescu gheorghe catalin, Ioana ionel, Delia calinoiu, Ion vetres, Air pollution monitoring in a town nearly power plant, Advances in Biology, Bioengineering and Environment, 2011, 181-184. 11. Liu F, High-resolution inventory of technologies, activities, and emissions of coal-fired power plants in China from 1990 to 2010. Atmos Chem Phys 15(23), 2015, 13299-13317. 12. J.W. Moore and E.A. Moore, Environmental chemistry, New York, San Francisco, London: Academic Press; 1976, 500.
13. US EPA, Air quality for particulate matter, National Center for Environmental Assessment, Office of Research and Development, Research Triangle Park, NC, Report No: EPA/600/p-95/001CF; 1996. 14. Shamzani Affendy Mohd Din, Nik Nurul-Hidayah Nik Yahya, Alias Abdullah, Fine Particulates Matter (PM2.5) from Coal-Fired Power Plant in Manjung and its Health Impacts, Procedia - Social and Behavioral Sciences, 85, 2013, 92-99. 15. P. Padmavathi, Jyotsna Cherukuri, M. Anji Reddy, Ambient air pollutant levels in the vicinity of NTTPS thermal power plant, IOSR Journal of Environmental Science, Toxicology and Food Technology, 9, 2015, 56-60. 16. Csavina, J., Field, J., Taylor, M. P., Gao, S., Landazuri, A., Betterton, E. A., & Saez, A. E. A review on the importance of metals and metalloids in atmospheric dust and aerosol from mining operations. Science of the Total Environment, 433, 2012, 58–73. 17. Sadovska. V, Health Risk Assessment of Heavy Metals Adsorbed in Particulates, International Journal of Environmental, Chemical, Ecological, Geological and Geophysical Engineering, 6, 2012, 481-484. 17.Lílian Lefol Nani Guarieiro and Aline Lefol Nani Guarieiro, Vehicle Emissions: What Will Change with Use of Biofuel? Chapter 14, Biofuels - Economy, Environment and Sustainability Book, 2013, 357-386. 18. Génon K. Jensen, The unpaid health bill, How coal power plants make us sick, Health and Environment Alliance (HEAL) report, 2013, 1-46. 19. Agency for Toxic Substances and Disease Registry (ATSDR). 2011. Toxic Substances Portal: Toxicological Profiles. Washington, DC, USA: ATSDR. Web Link:http://www.atsdr.cdc.gov/toxprofiles/index.asp [Accessed: 3 February 2011].