Embed Size (px)
Citation preview
Monitoring of Remote ProcedureCalls - Concepts and Evaluation
Bachelor’s Thesis
Niels Matthiessen
March 25, 2014
Kiel University
Department of Computer Science
Software Engineering Group
Advised by: Prof. Dr. Wilhelm HasselbringDipl.-Inform. Peer BrauerM.Sc. Florian Fittkau

Abstract
This thesis develops monitoring concepts for distributed systems that use remote procedurecalls. The concepts are compared with regard to usability and feasibility. The implementa-tion of one concept as part of the program ExplorViz is presented. The implementationextends ExplorViz to monitor RPC calls that are sent via HTTP connections and processedby Java Servlets. To evaluate the implementation, it has been tested with JPetStore, theLobo Browser, and a small test program. The evaluation handles the full monitoring of thetest system which creates a monitoring overhead of factor 3.6.
The thesis is part of the students bachelor/master project “Remote Procedure CallMonitoring”. In the project the program PubFlow, which is designed as a distributedsystem, has been monitored. PubFlow uses RPC calls based on connections of the tech-nologies ActiveMQ, JAX-WS, and HSQLDB. The monitoring of these technologies has beenimplemented as part of the project.
iii

Contents
1 Introduction 11.1 Motivation . . . . . . . . . . . . . . . . . . . . . . . . . . . . . . . . . . . . . . . 11.2 Goals . . . . . . . . . . . . . . . . . . . . . . . . . . . . . . . . . . . . . . . . . . 1
1.2.1 G1: Analysis of the Servlet Interface . . . . . . . . . . . . . . . . . . . . 11.2.2 G2: Development of a Monitoring Concept . . . . . . . . . . . . . . . . 21.2.3 G3: Implementation of the Servlet Monitoring . . . . . . . . . . . . . . 21.2.4 G4: Evaluation of a Software System with Full Monitoring . . . . . . 2
1.3 Document Structure . . . . . . . . . . . . . . . . . . . . . . . . . . . . . . . . . 2
2 Foundations and Technologies 32.1 Dynamic Analysis . . . . . . . . . . . . . . . . . . . . . . . . . . . . . . . . . . . 32.2 Distributed Systems . . . . . . . . . . . . . . . . . . . . . . . . . . . . . . . . . 32.3 Remote Procedure Call . . . . . . . . . . . . . . . . . . . . . . . . . . . . . . . . 42.4 Java Servlet . . . . . . . . . . . . . . . . . . . . . . . . . . . . . . . . . . . . . . 52.5 JPetStore . . . . . . . . . . . . . . . . . . . . . . . . . . . . . . . . . . . . . . . . 52.6 Java URLConnection . . . . . . . . . . . . . . . . . . . . . . . . . . . . . . . . . 52.7 Lobo Browser . . . . . . . . . . . . . . . . . . . . . . . . . . . . . . . . . . . . . 62.8 AspectJ . . . . . . . . . . . . . . . . . . . . . . . . . . . . . . . . . . . . . . . . . 62.9 Kieker . . . . . . . . . . . . . . . . . . . . . . . . . . . . . . . . . . . . . . . . . . 72.10 High-throughput Tuned Kieker Version . . . . . . . . . . . . . . . . . . . . . . 72.11 ExplorViz . . . . . . . . . . . . . . . . . . . . . . . . . . . . . . . . . . . . . . . . 7
3 Approach 93.1 S1: Analysis of JPetStore . . . . . . . . . . . . . . . . . . . . . . . . . . . . . . . 93.2 S2: Analysis of a Servlet Container . . . . . . . . . . . . . . . . . . . . . . . . . 93.3 S3: Development of Monitoring Concepts . . . . . . . . . . . . . . . . . . . . . 10
3.3.1 Global Trace ID . . . . . . . . . . . . . . . . . . . . . . . . . . . . . . . . 113.3.2 Local Trace ID . . . . . . . . . . . . . . . . . . . . . . . . . . . . . . . . . 113.3.3 Concept Evaluation . . . . . . . . . . . . . . . . . . . . . . . . . . . . . 143.3.4 Bridge Record . . . . . . . . . . . . . . . . . . . . . . . . . . . . . . . . . 153.3.5 Servlets . . . . . . . . . . . . . . . . . . . . . . . . . . . . . . . . . . . . 16
3.4 S4: Test System . . . . . . . . . . . . . . . . . . . . . . . . . . . . . . . . . . . . 163.4.1 Server . . . . . . . . . . . . . . . . . . . . . . . . . . . . . . . . . . . . . 183.4.2 Client . . . . . . . . . . . . . . . . . . . . . . . . . . . . . . . . . . . . . . 183.4.3 ExplorViz . . . . . . . . . . . . . . . . . . . . . . . . . . . . . . . . . . . 18
v
Contents
4 Evaluation 194.1 Implementation . . . . . . . . . . . . . . . . . . . . . . . . . . . . . . . . . . . . 19
4.1.1 Infrastructure . . . . . . . . . . . . . . . . . . . . . . . . . . . . . . . . . 204.1.2 Servlet Probe . . . . . . . . . . . . . . . . . . . . . . . . . . . . . . . . . 204.1.3 HttpURLConnection Probe . . . . . . . . . . . . . . . . . . . . . . . . . 214.1.4 Usage . . . . . . . . . . . . . . . . . . . . . . . . . . . . . . . . . . . . . . 21
4.2 Quality Assurance . . . . . . . . . . . . . . . . . . . . . . . . . . . . . . . . . . 234.2.1 Tests . . . . . . . . . . . . . . . . . . . . . . . . . . . . . . . . . . . . . . 234.2.2 Problems . . . . . . . . . . . . . . . . . . . . . . . . . . . . . . . . . . . . 23
4.3 Performance . . . . . . . . . . . . . . . . . . . . . . . . . . . . . . . . . . . . . . 244.3.1 Response Time . . . . . . . . . . . . . . . . . . . . . . . . . . . . . . . . 244.3.2 Created Records . . . . . . . . . . . . . . . . . . . . . . . . . . . . . . . 274.3.3 Page Load Time . . . . . . . . . . . . . . . . . . . . . . . . . . . . . . . . 27
5 Related Work 29
6 Conclusion and Future Work 316.1 Future Work . . . . . . . . . . . . . . . . . . . . . . . . . . . . . . . . . . . . . . 316.2 Conclusion . . . . . . . . . . . . . . . . . . . . . . . . . . . . . . . . . . . . . . . 32
Bibliography 33
A Data Disk 35A.1 Content . . . . . . . . . . . . . . . . . . . . . . . . . . . . . . . . . . . . . . . . . 35
vi
Chapter 1
Introduction
1.1 Motivation
Mordern software systems become more and more difficult to understand, because ofincreasing complexity. Especially when the implementation is poorly documented or thedocumentation has not been transferred to current versions, the orientation in the softwarecan be pretty hard for developers. The monitoring of the software system during its runtime can help to understand the relations of the program parts, and to regain some of theinformation that were lost by the lack of documentation. The programs developed for thispurpose need to gather and prepare the information that were collected in the monitoring,and display them to the user.
Nowadays when cloud computing establishes, software systems gain another source ofcomplexity which is the distribution of the system. The distribution makes it necessarythat the parts communicate via network interfaces. To be able to include information aboutthe network communication into the monitoring results, the communication has to bemonitored as well.
A full monitoring of distributed software systems hopefully does not only give theability to maintain the systems more easily, but also simplifies the development. Thereforethe monitoring can help to do performance analysis and identify slow components thatneed to be improved. This becomes especially important for the processing of big data,where a good performing program can save a lot of time and money.
1.2 Goals
1.2.1 G1: Analysis of the Servlet Interface
The first goal is the analysis of the servlet interface with regard to monitoring. This shouldgive us an idea how the monitoring of the servlet could be implemented, and what maybehas to be considered.
1
1. Introduction
1.2.2 G2: Development of a Monitoring Concept
The second goal is the development of a general monitoring concept that can be applied toevery, or at least a lot of message technologies. The usability of the concept with as manymessage technologies as possible is important to make the monitoring easily extensible.
1.2.3 G3: Implementation of the Servlet Monitoring
The third goal is the implementation of the monitoring concept for Java Servlets. Theservlets are used as a test system to show that the developed concept can be implemented.Therefore the implementation will be tested with JPetStore.
1.2.4 G4: Evaluation of a Software System with Full Monitoring
The fourth goal of this thesis is the evaluation of a full monitoring of a test system. Thefull monitoring includes a general monitoring of method calls and the remote monitoring.The test system is build of the JPetStore servlet and the Lobo browser and a small testapplication that create requests for the JPetStore. The evaluation should show, if a fullmonitoring is applicable on a productive system.
1.3 Document Structure
Chapter 2 introduces the programs and technologies that are used in this thesis. Chapter 3presents four steps which show our approach to reach the first three goals that werepresented in this chapter. Afterwards we discuss the implementation and the evaluationof the monitoring in Chapter 4. Related work that also deals with remote monitoring ormonitoring of servlets is presented in Chapter 5. Finally a conclusion and some ideas forfuture work can be found in Chapter 6.
2
Chapter 2
Foundations and Technologies
This chapter gives an overview of foundations and technologies which are used in thisthesis.
2.1 Dynamic Analysis
The main goal of this thesis is the improvement of dynamic program analysis. A dynamicanalysis deals with the behavior of a program during its execution. The analysis collectsdata about concerns like memory usage, execution time, internal or external communication,method calls and other usage statistics of the program. Therefore records about eventsinside of the monitored application are created and put together to traces. These traces arestored or sent to an external program. Afterwards the traces can be visualized to show thebehavior of the monitored program.
There are different possibilities how to process and prepare the traces to make themeasily interpretable by humans. What kind of visualization should be chosen, depends onthe goals of the monitoring. A possible goal of the monitoring is to identify componentswith bad performance, for example methods with a long execution time, or componentswith high memory consumption. Another possible goal of monitoring is to gain overviewover the application. We use ExplorViz to display our monitoring results, as described laterin this chapter.
2.2 Distributed Systems
A distributed system is a software system that consists of multiple running instances of thesame or different programs that communicate over network interfaces. This provides theability to distribute the instances over multiple physical devices. Distributed systems canbe used to process higher amounts of data by assigning sub tasks to different computerswhich perform these sub tasks simultaneously. In the end the individual results have to beput together to get the result for the primary task. Depending on the parallelizability ofthe task, parallelizing can reduce the run-time significantly. The parallelizability dependsespecially on the complexity of separating tasks and putting the results together.
An example where the distribution of a system decreases the execution time of a taskdramatically is web search. The web consisted already in 2011 of more than 63 billion
3
2. Foundations and Technologies
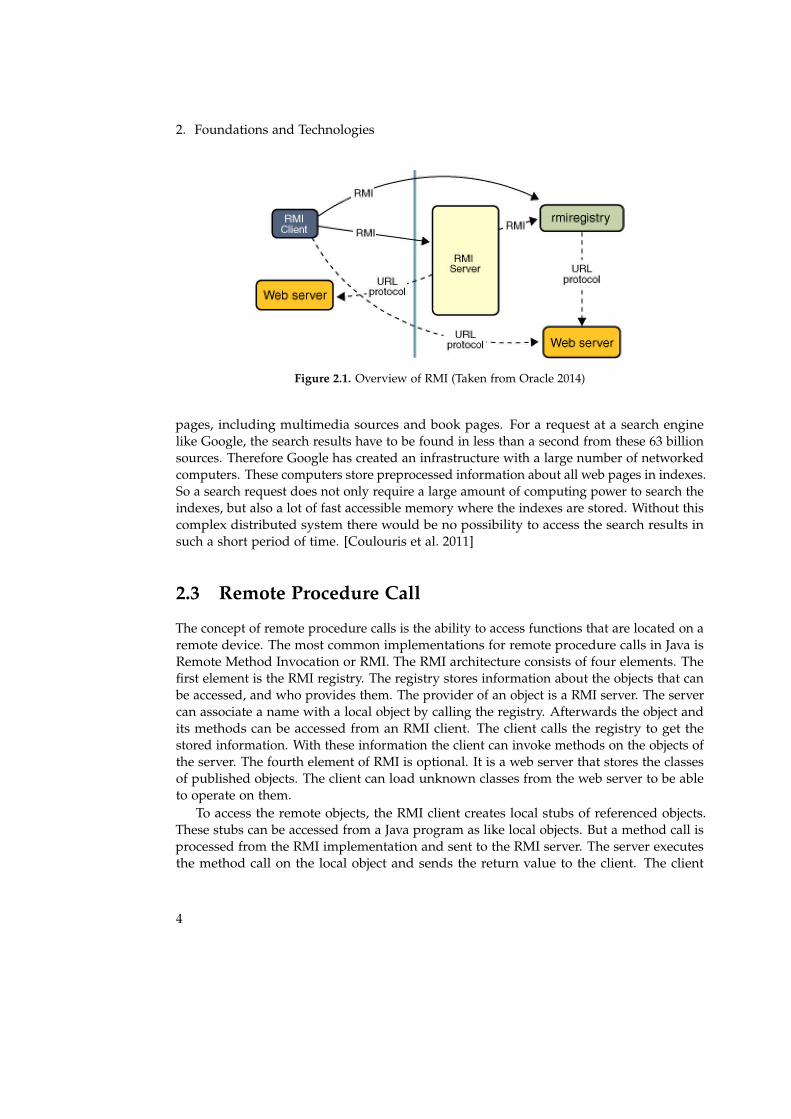
Figure 2.1. Overview of RMI (Taken from Oracle 2014)
pages, including multimedia sources and book pages. For a request at a search enginelike Google, the search results have to be found in less than a second from these 63 billionsources. Therefore Google has created an infrastructure with a large number of networkedcomputers. These computers store preprocessed information about all web pages in indexes.So a search request does not only require a large amount of computing power to search theindexes, but also a lot of fast accessible memory where the indexes are stored. Without thiscomplex distributed system there would be no possibility to access the search results insuch a short period of time. [Coulouris et al. 2011]
2.3 Remote Procedure Call
The concept of remote procedure calls is the ability to access functions that are located on aremote device. The most common implementations for remote procedure calls in Java isRemote Method Invocation or RMI. The RMI architecture consists of four elements. Thefirst element is the RMI registry. The registry stores information about the objects that canbe accessed, and who provides them. The provider of an object is a RMI server. The servercan associate a name with a local object by calling the registry. Afterwards the object andits methods can be accessed from an RMI client. The client calls the registry to get thestored information. With these information the client can invoke methods on the objects ofthe server. The fourth element of RMI is optional. It is a web server that stores the classesof published objects. The client can load unknown classes from the web server to be ableto operate on them.
To access the remote objects, the RMI client creates local stubs of referenced objects.These stubs can be accessed from a Java program as like local objects. But a method call isprocessed from the RMI implementation and sent to the RMI server. The server executesthe method call on the local object and sends the return value to the client. The client
4
2.4. Java Servlet
receives this value and returns it.
2.4 Java Servlet
A Java Servlet is an usual Java Program that is built with the purpose of responding toHTTP requests. To be not required to implement an own web server in every program,a servlet is build on a communication interface. Running a servlet requires an servletcontainer like Jetty or Apache Tomcat, which implements the communication interface.So a servlet is the equivalent to a CGI-Script on conventional web-servers and used fordynamic creation of websites with Java. The servlet container creates a new internal threadfor every incoming connection and does not fork a new process, like a CGI call does. Thismakes servlets in general more efficient than CGI. [Chan and Mordani 2013]
An other approach to RPC can be done with servlets. The servlet publishes functionsover URLs. These can be accessed via HTTP from a remote caller. The caller sends thefunctions arguments in the HTTP request. The function is executed on the server and thereturn value is sent in the HTTP response. This model is a lot more basic than RMI. It onlyprovides the access to functions and not to objects, there is no mechanism to add functionsat run time, there is no registry that provides information about the available functionsand functions can not be accessed as if they were local.
2.5 JPetStore
JPetStore is an example for a complex Java Servlet. It uses the Stripes, Spring, and MyBatisframework. It was written in order to demonstrate the simple management of servletsusing these frameworks. It implements a web store for an imaginary company that sellspets over the internet. We use this servlet as an example for our tests. Therefore, we havetried to do an analysis of the servlet, that is presented in Chapter 3.
2.6 Java URLConnection
A remote procedure call requires caller and callee. But the servlet interface is onlydesigned for receiving requests, not for sending them. In our test system, we usethe Java interface URLConnection from the java.net standard library to call the re-mote procedures. An URLConnection can easily be created by calling the methodjava.net.URL.openConnection() on an URL object of the URL that should be loaded. Whenusing a HttpURLConnection, which is a subclass of URLConnection, the HTTP header canbe set with URLConnection.setRequestProperty(String key, String Value). A connectionto the specified URL can be opened with the method URLConnection.connect(). Afterconnecting it is not possible to change the header information, because they have alreadybeen put into the OutputStream. The OutputStream can be accessed with the method
5
2. Foundations and Technologies
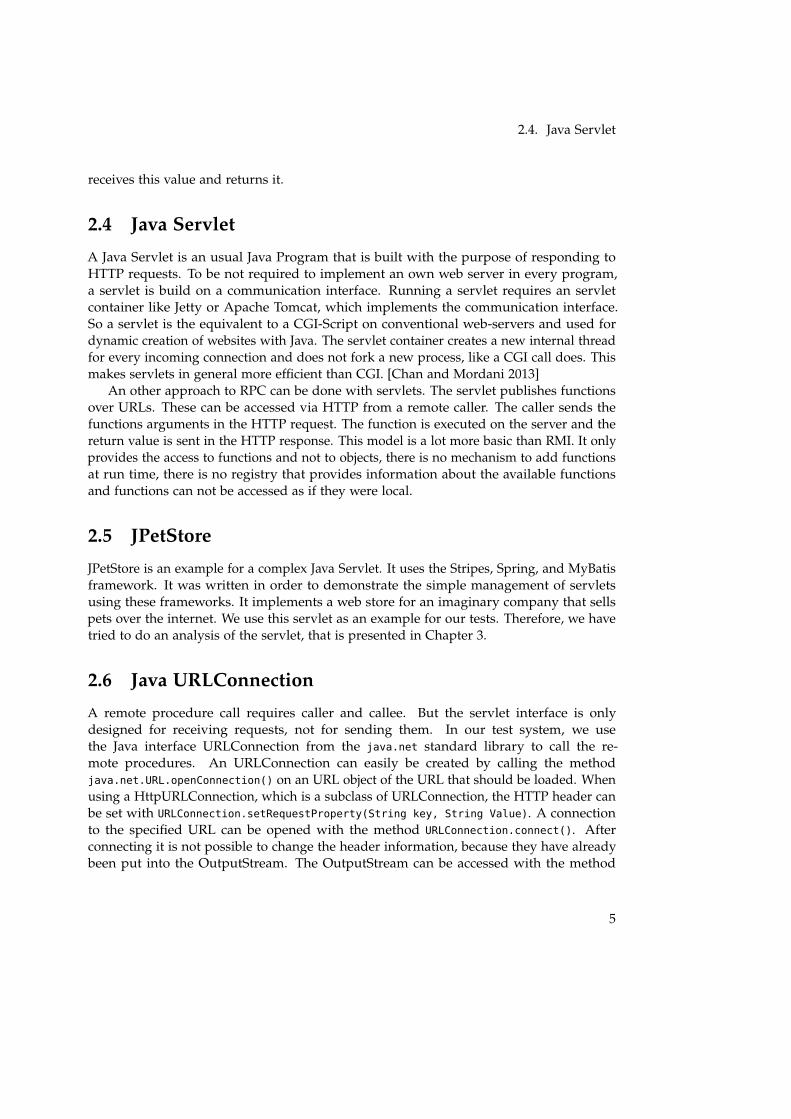
Figure 2.2. Comparison of the Lobo browser (left) to Mozilla Firefox (right).
URLConnection.getOutputStream() to send a request body. After closing the OutputStream,the response can be accessed by URLConnection.getHeaderFields for the request headersand URLConnection.getInputStream for the response body.
2.7 Lobo Browser
The Lobo browser is a graphical web browser implementation that is written solely in Java,which makes is possible to apply the ExplorViz monitoring. It has a user interface thatis comparable to common browsers like Mozilla Firefox, but with less functionality. Thebrowser can render HTML and CSS2, and has a JavaScript engine. The active developmentof Lobo has stopped in 2009, and the rendering speed can not keep up with currentbrowsers. This makes the browser not applicable in productive environments but it issufficient for our test system. Figure 2.2 shows the Lobo browser compared to MozillaFirefox. [community 2009]
2.8 AspectJ
AspectJ is an extension for Java that allows aspect-oriented programming. Aspect-orientatedprogramming gives the ability to react on events inside of a program, without adjustingthe program code at the methods where the event is triggered. Therefore AspectJ providesa concept that is called weaving. Weaving can be done with any kind of Java byte code. Itmeans that an additional method call will be integrated in the byte code, and according tothis, will be executed when the program is run. A new method call can be inserted at ajoinpoint. A joinpoint is in short every method call in the program. Pointcuts are used todescribe a set of joinpoints, for example every method with determined name, or everymethod that belongs to a determined class. The reaction to a pointcut can be defined inadvices. Advices are like usual methods that can be applied before, after, and instead of
6
2.9. Kieker
the joinpoints, that are defined by the pointcut. [Hilsdale and Hugunin 2004]
2.9 Kieker
Kieker is a framework for application performance monitoring and dynamic softwareanalysis for software systems written in Java. Kieker consists of a monitoring and ananalysis part. The monitoring part has to be included into the monitored software. Itconsists of probes, that collect information from the software, and passes the informationto the analysis part. The analysis part consists of plugins that process and display thecollected information. Therefore Kieker is easily extensible and can be used with customcomponents. [van Hoorn et al. 2012]
2.10 High-throughput Tuned Kieker Version
The high-throughput tuned Kieker version is a partial rewrite of Kieker that is designed tobe able to process about 250 times more traces per second than the original Kieker. It usesAspectJ to patch trace creation methods into the software systems. These trace creationmethods are called probes. The probes are integrated into the monitored software systemduring run time, therefore the monitored software needs not to be altered. Kieker createsthread-local trace identifiers inside of the systems to be able to connect the records ofmethod calls to traces. The trace records are sent via network interface to worker units thatcollect, preprocess, and reduce the traces. The Kieker version has the ability to dynamicallycluster these workers in order to provide support for different amounts of produced traces.[Fittkau et al. 2013]
2.11 ExplorViz
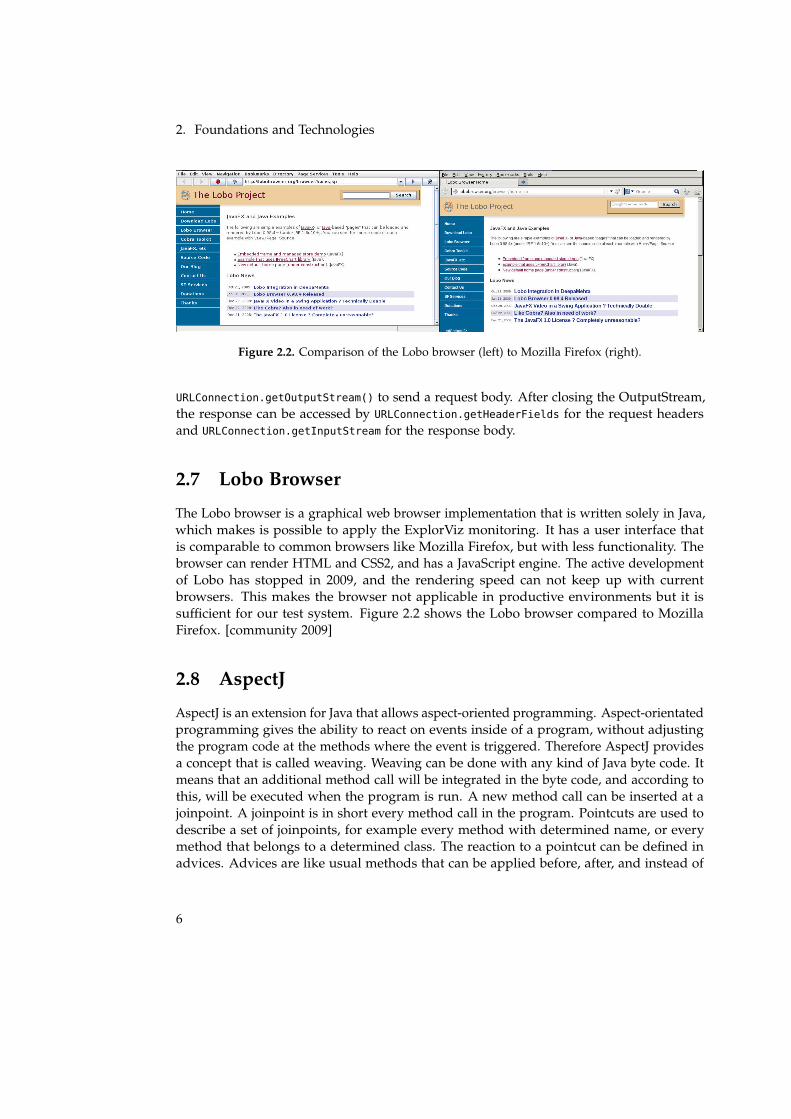
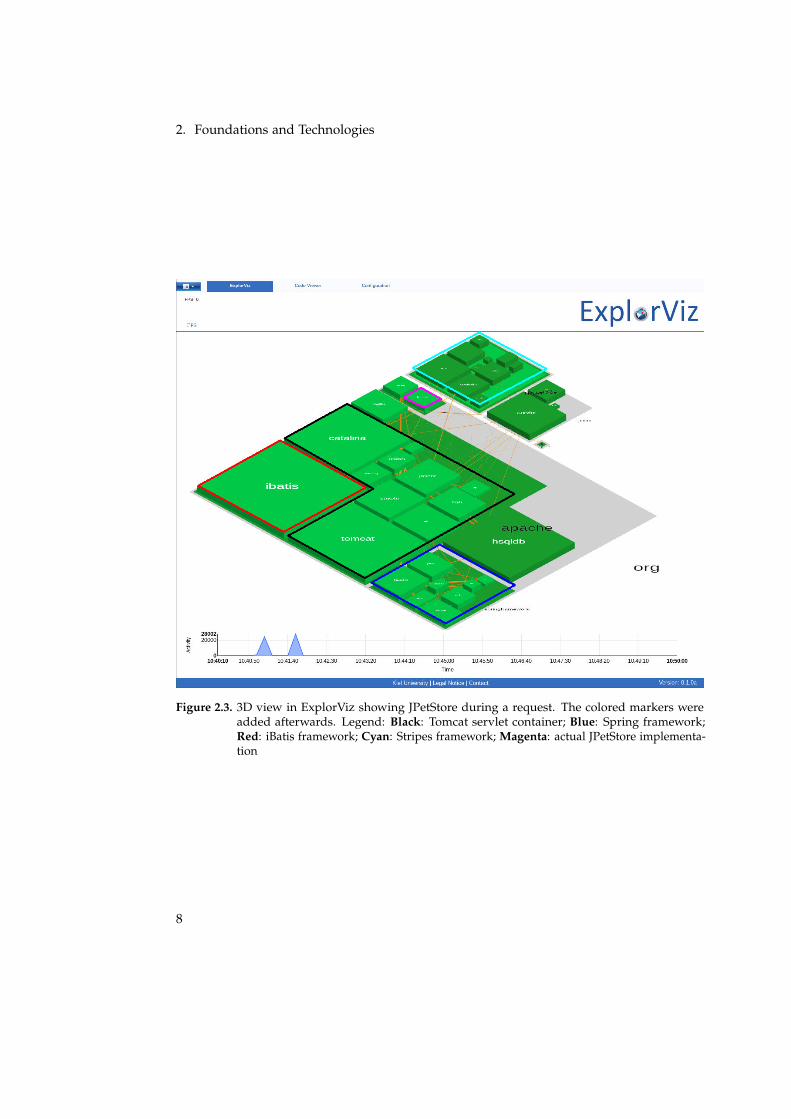
ExplorViz is a trace visualization software that is used to display traces created by the high-throughput tuned Kieker version. It is designed as a web server and prepares the tracesto be rendered in browsers with WebGL. The traces can be displayed in a 2D landscapemodel that gives an overview over the distributed components of a software system. Forthe display of a software component it provides a 3D model based on a city metaphor thatrepresents components, classes, and internal communication as districts, buildings, andconnections between the buildings. An example of the 3D view is shown in Figure 2.3, the2D view is shown later in Chapter 4.
7
2. Foundations and Technologies
Figure 2.3. 3D view in ExplorViz showing JPetStore during a request. The colored markers wereadded afterwards. Legend: Black: Tomcat servlet container; Blue: Spring framework;Red: iBatis framework; Cyan: Stripes framework; Magenta: actual JPetStore implementa-tion
8
Chapter 3
Approach
Our approach is separated in four steps.
3.1 S1: Analysis of JPetStore
As mentioned in Chapter 2 JPetStore is a servlet that is build using the Stripes, Spring,and MyBatis (formerly iBatis) framework. Without knowing the fundamental structure ofthese frameworks it is a lot of work to find out how the HTTP requests are processed. Anoverview of the used components is shown in Figure 2.3. The servlet interface is not usedin the JPetStore code, but is hidden inside of the Stripes framework. The Stripes frameworkis used for the presentation of the page contents. Therefore JPetStore defines accessiblepages in JSP files, that are interpreted by Stripes. The data access is done with the MyBatisframework, which requires the Spring framework for some advanced database transactions.The data itself is stored in a HyperSQL database that is only accessed from the MyBatisframework. The program logic that defines, which data will be accessed for a request isnearly the only thing that is implemented in the JPetStore source code.
JPetStore seems obviously to be designed with the model-view-controller pattern, andit extensively uses frameworks to only be required to implement the business logic. This isthe only knowledge that we gained from the analysis. That did not help a lot concerningthe possibility of monitoring the software. Therefore the next step is the analysis of aservlet container and the servlet interface.
3.2 S2: Analysis of a Servlet Container
There are a few different servlet containers, the most commonly used are Apache Tomcatand Jetty. Every servlet container uses the same interface to communicate with the servlet.The servlet interface is defined in javax.servlet.Servlet. Its method service(ServletRequest,
ServletResponse) is directly accessed by the servlet container for every request that is made.That means a servlet has to implement this method, to be able to receive requests. Theservlet container can spawn multiple instances of servlet to respond to multiple requests si-multaneously. Therefore a servlet has a so called life-cycle with three stages. After creationof a servlet object, the servlet is still uninitialized. The servlet must not be used to createa response, in this stage. The initialization is done with the init(ServletConfig) method
9
3. Approach
MonitoringConcepts
global trace id local trace ids
t ime stamp matching
send trace id
message matching
analyse TCP dump
local order registry
global order registry
native message id
technology on application layer
open parallel connection
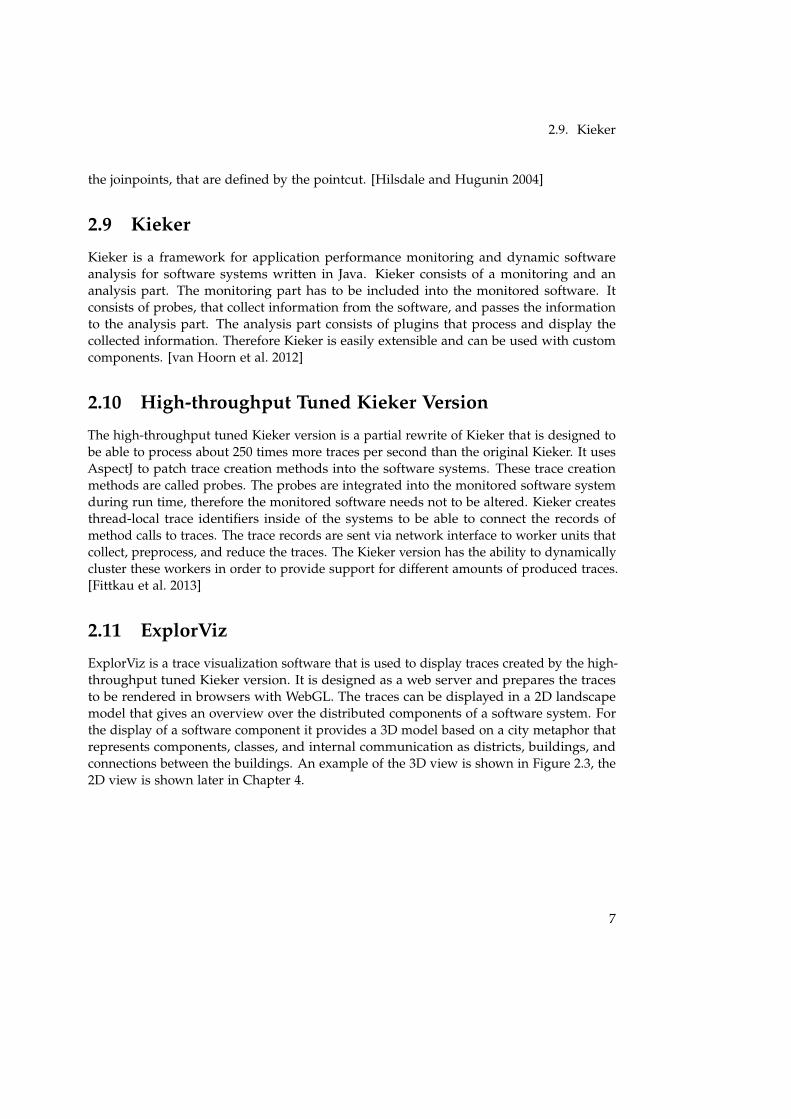
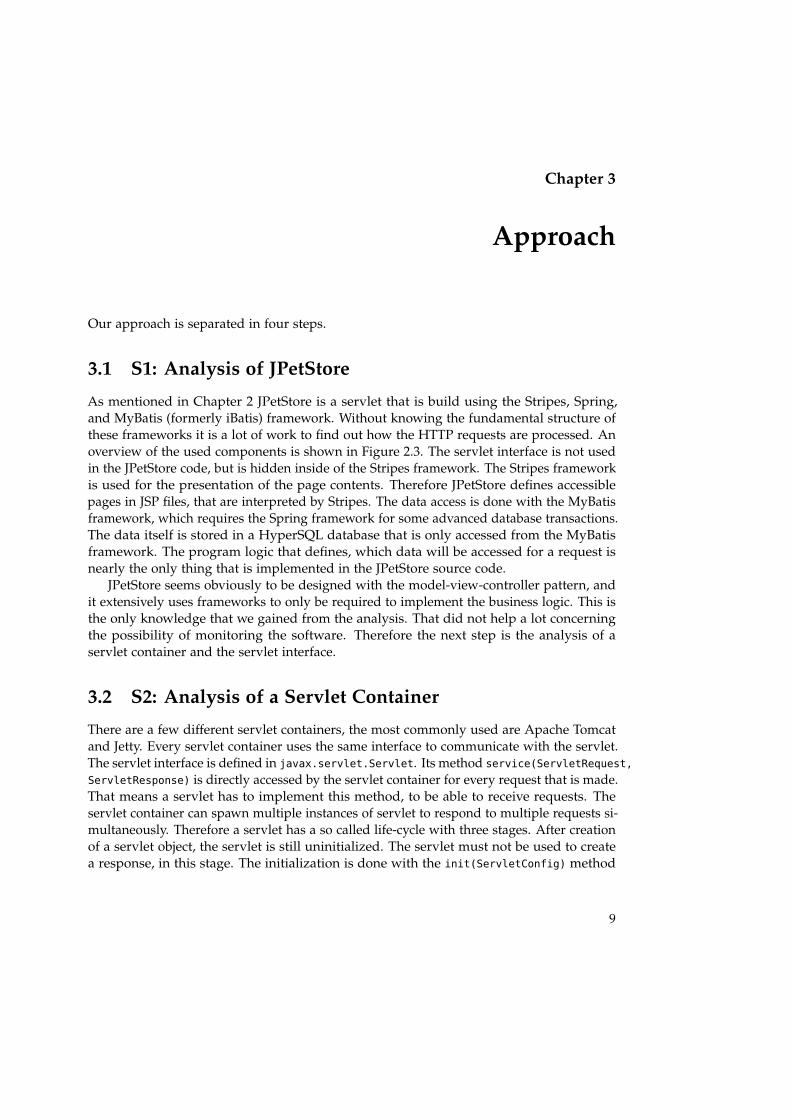
Figure 3.1. Different concepts for monitoring remote procedure calls.
which passes some start parameters to the instance. Afterwards the servlet is initializedand the service(..) method can be called from the servlet container. One instance canbe used for multiple independent requests. Therefore in general, no information shouldbe saved locally in the instance, between the requests. When the instance is no longerrequired, the destroy() method is called. This instructs the servlet to free its allocatedresources. Finally the instance can no longer be used to respond to requests and it mustnot be initialized again. For a new instance, a new object has to be created and initialized.
3.3 S3: Development of Monitoring Concepts
The general monitoring concepts presented in this section have been developed in thebachelor/master project 2013/14.
To be able to display the connection between remote programs, the monitoring has toinform ExplorViz about messages that are sent between the programs. Neither ExplorViznor Kieker have already implemented methods to display remote connections. Therefore wehad to develop a concept that defines how to extract the required information and how tocommunicate them to ExplorViz. The implementation of the handling of these informationin ExplorViz has not been part of the project but has been done by the ExplorViz developer.
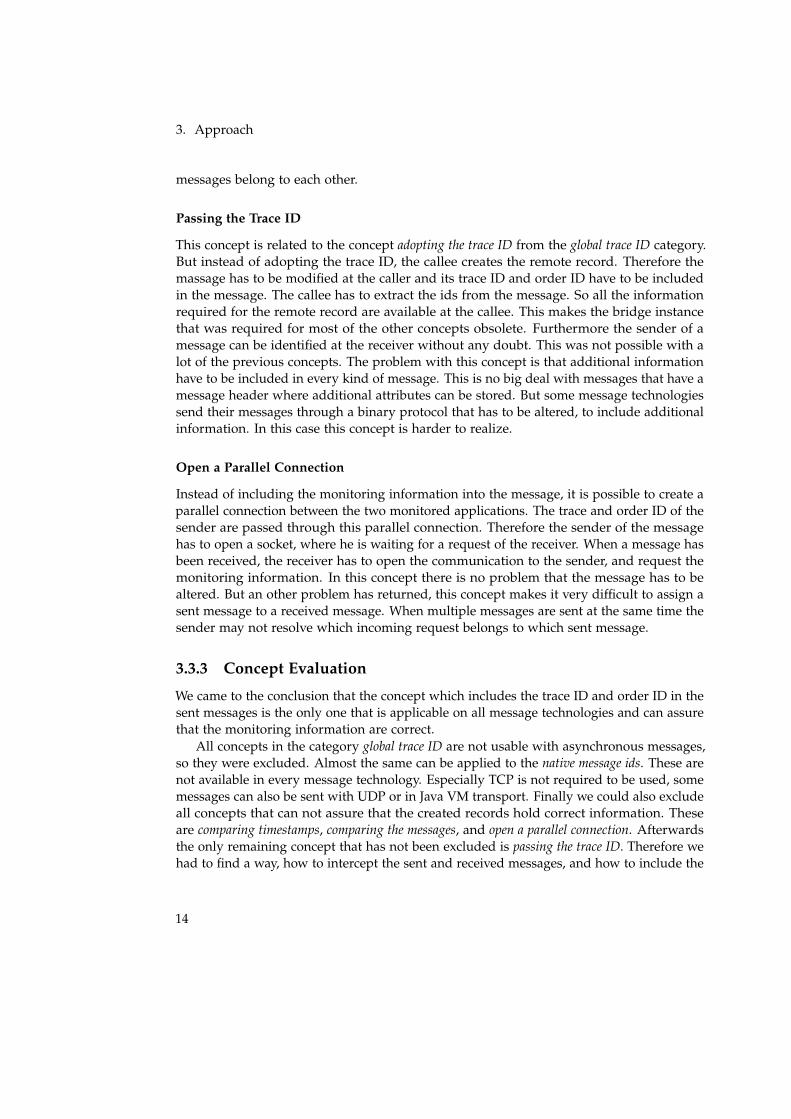
As shown in Figure 3.1 there are a few different concepts for monitoring remote calls.We separated these concepts in two categories. The first category deals with conceptswhere one trace represents one execution. The execution may go through multiple nodes ofthe remote system. Hence the category is called global trace ID. The second category dealswith concepts where one trace represents the execution inside of one thread that is whythis category is called local trace ID. The connections between the traces are represented bya new kind of record.
10
3.3. S3: Development of Monitoring Concepts
CalleeCaller
2: increment OrderID
1: increment OrderID
2.1: passing OrderID 3
1.1: passing TraceID 1
and OrderID 2
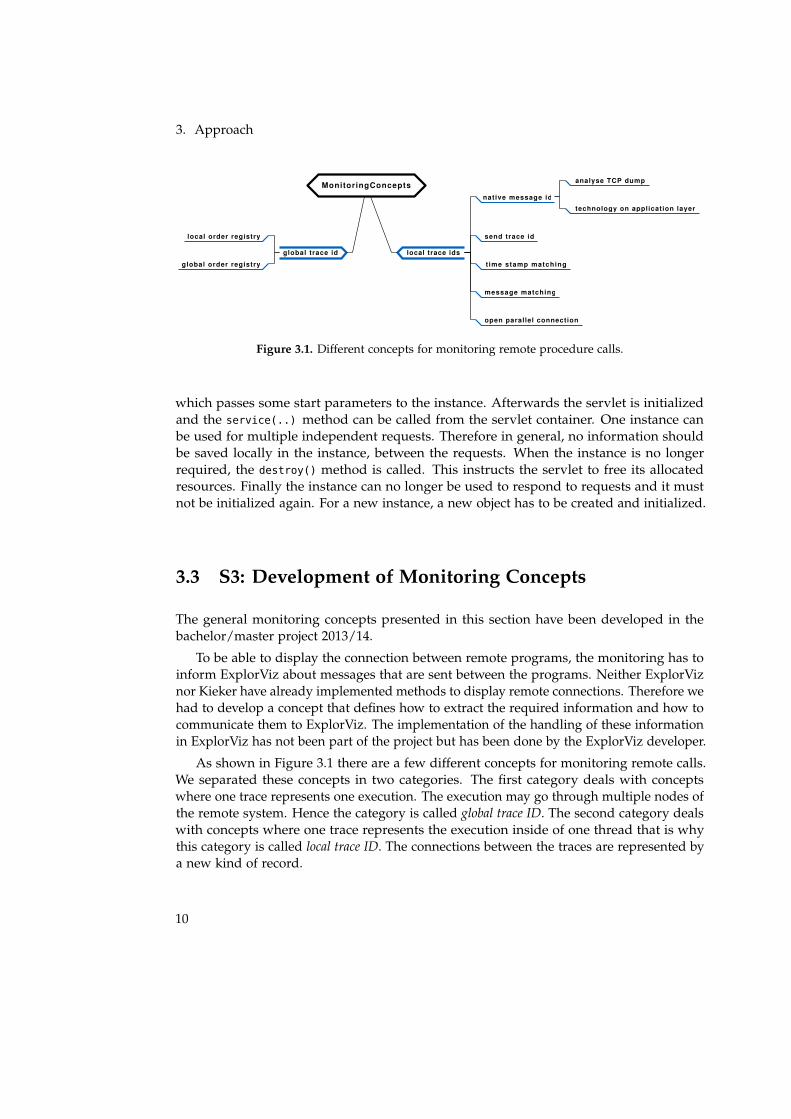
Figure 3.2. Concept of a global trace ID.
3.3.1 Global Trace ID
The simplest approach that can be included into ExplorViz is to pass over the trace IDfrom the caller to the callee. This creates one long trace over all the engaged parts of thedistributed system. In a synchronous remote call the caller passes its trace ID and order IDto the callee. The callee adopts this trace and proceedes the execution with the adoptedtrace ID. When the callee has finished its execution it passes the current order ID, pairedwith the result of the execution to the caller. The caller has to adopt the order ID that wasreceived with the response. This ensures that every order ID has been assigned to exactlyone record. Figure 3.2 shows the concept as sequence diagram.
This concept only works properly with synchronous remote calls. At asynchronouscalls the caller and callee proceed with their execution and would both create records withthe same order IDs. This problem could be solved by assigning the order ID globally.Therefore every part of the system that has the same trace ID needs to communicate witheach other. But this creates another problem: the order of the order ID does not representthe call stack anymore, because the order IDs are mixed from both parts of the trace. Wecould find no solution that arranges the global trace ID with asynchronous remote calls.
3.3.2 Local Trace ID
Instead of adopting the trace ID of the caller, it is probably easier to sustain the conceptthat a trace ID represents a thread, as it does without considering remote calls. To be ableto connect two traces with each other we need a new kind of record. Instead of influencingthe diagram of the call tree of the programs, the new record should create a referencebetween two method calls. Initially we will call this record BridgeRecord.The BridgeRecord should contain following information:
11
3. Approach
Ź Trace ID of the caller
Ź Order ID of the caller
Ź Trace ID of the callee
Ź Order ID of the callee
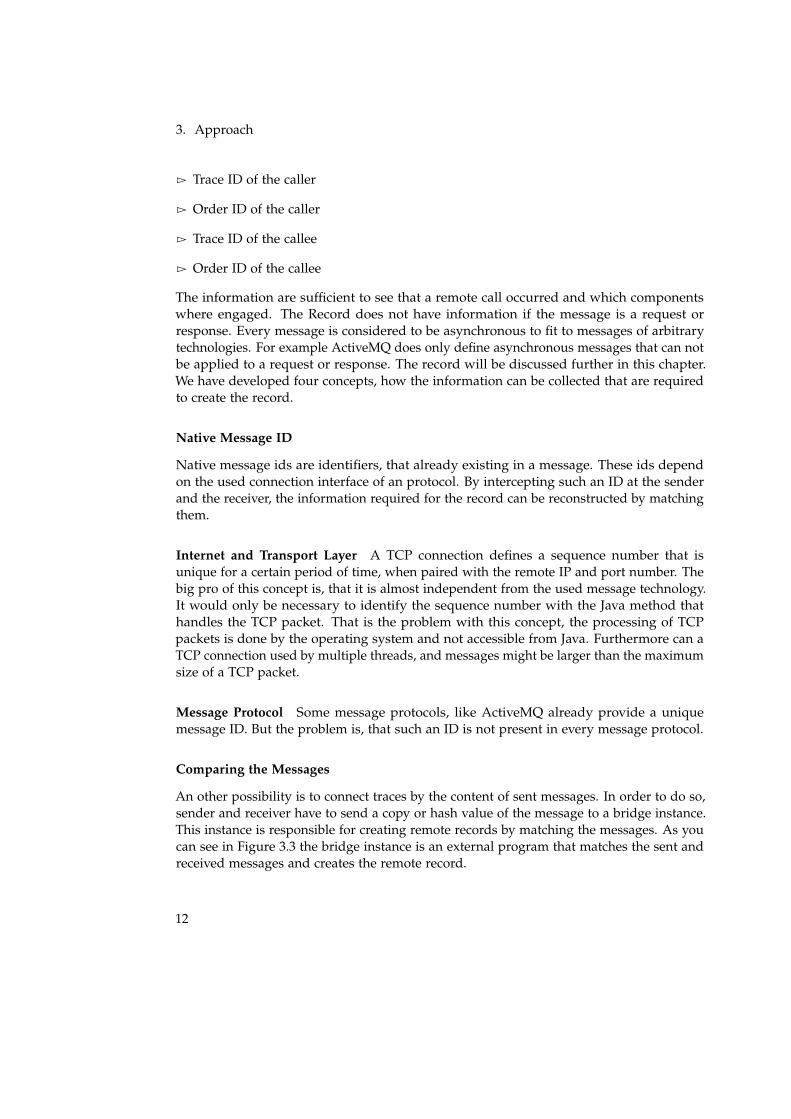
The information are sufficient to see that a remote call occurred and which componentswhere engaged. The Record does not have information if the message is a request orresponse. Every message is considered to be asynchronous to fit to messages of arbitrarytechnologies. For example ActiveMQ does only define asynchronous messages that can notbe applied to a request or response. The record will be discussed further in this chapter.We have developed four concepts, how the information can be collected that are requiredto create the record.
Native Message ID
Native message ids are identifiers, that already existing in a message. These ids dependon the used connection interface of an protocol. By intercepting such an ID at the senderand the receiver, the information required for the record can be reconstructed by matchingthem.
Internet and Transport Layer A TCP connection defines a sequence number that isunique for a certain period of time, when paired with the remote IP and port number. Thebig pro of this concept is, that it is almost independent from the used message technology.It would only be necessary to identify the sequence number with the Java method thathandles the TCP packet. That is the problem with this concept, the processing of TCPpackets is done by the operating system and not accessible from Java. Furthermore can aTCP connection used by multiple threads, and messages might be larger than the maximumsize of a TCP packet.
Message Protocol Some message protocols, like ActiveMQ already provide a uniquemessage ID. But the problem is, that such an ID is not present in every message protocol.
Comparing the Messages
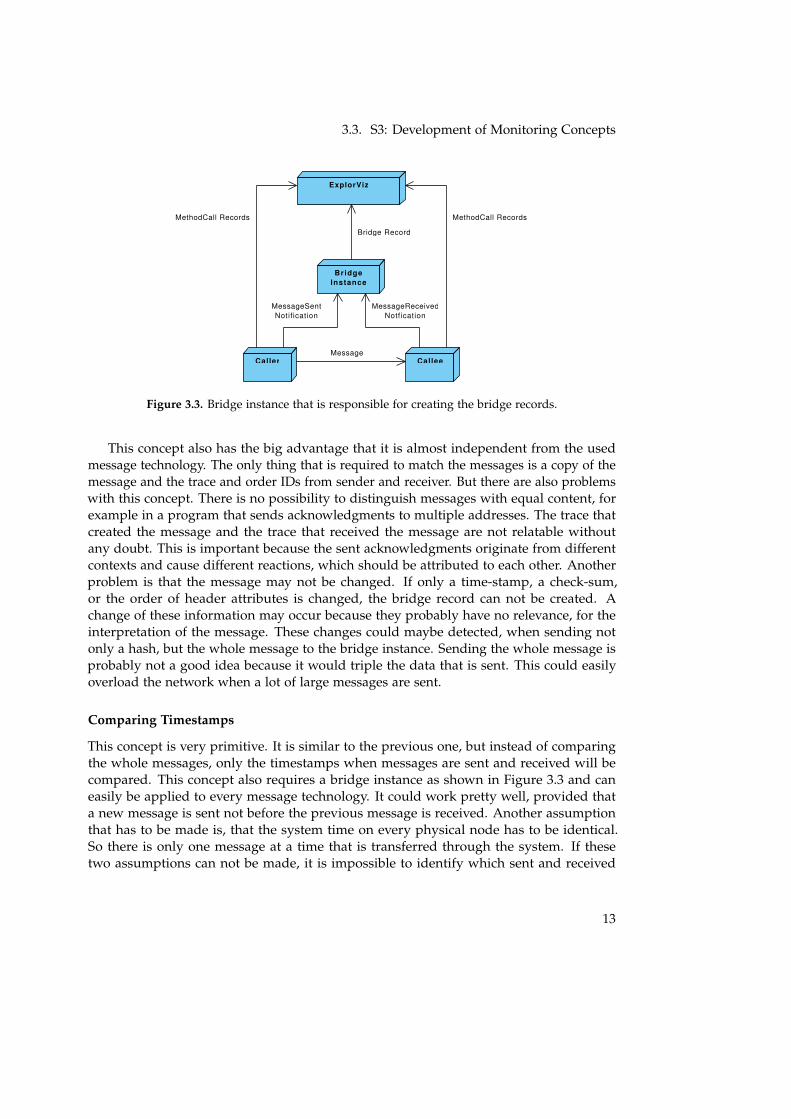
An other possibility is to connect traces by the content of sent messages. In order to do so,sender and receiver have to send a copy or hash value of the message to a bridge instance.This instance is responsible for creating remote records by matching the messages. As youcan see in Figure 3.3 the bridge instance is an external program that matches the sent andreceived messages and creates the remote record.
12
3.3. S3: Development of Monitoring Concepts
Caller Callee
BridgeInstance
ExplorViz
MessageReceivedNotfication
MessageSentNotification
Bridge Record
MethodCall RecordsMethodCall Records
Message
Figure 3.3. Bridge instance that is responsible for creating the bridge records.
This concept also has the big advantage that it is almost independent from the usedmessage technology. The only thing that is required to match the messages is a copy of themessage and the trace and order IDs from sender and receiver. But there are also problemswith this concept. There is no possibility to distinguish messages with equal content, forexample in a program that sends acknowledgments to multiple addresses. The trace thatcreated the message and the trace that received the message are not relatable withoutany doubt. This is important because the sent acknowledgments originate from differentcontexts and cause different reactions, which should be attributed to each other. Anotherproblem is that the message may not be changed. If only a time-stamp, a check-sum,or the order of header attributes is changed, the bridge record can not be created. Achange of these information may occur because they probably have no relevance, for theinterpretation of the message. These changes could maybe detected, when sending notonly a hash, but the whole message to the bridge instance. Sending the whole message isprobably not a good idea because it would triple the data that is sent. This could easilyoverload the network when a lot of large messages are sent.
Comparing Timestamps
This concept is very primitive. It is similar to the previous one, but instead of comparingthe whole messages, only the timestamps when messages are sent and received will becompared. This concept also requires a bridge instance as shown in Figure 3.3 and caneasily be applied to every message technology. It could work pretty well, provided thata new message is sent not before the previous message is received. Another assumptionthat has to be made is, that the system time on every physical node has to be identical.So there is only one message at a time that is transferred through the system. If thesetwo assumptions can not be made, it is impossible to identify which sent and received
13
3. Approach
messages belong to each other.
Passing the Trace ID
This concept is related to the concept adopting the trace ID from the global trace ID category.But instead of adopting the trace ID, the callee creates the remote record. Therefore themassage has to be modified at the caller and its trace ID and order ID have to be includedin the message. The callee has to extract the ids from the message. So all the informationrequired for the remote record are available at the callee. This makes the bridge instancethat was required for most of the other concepts obsolete. Furthermore the sender of amessage can be identified at the receiver without any doubt. This was not possible with alot of the previous concepts. The problem with this concept is that additional informationhave to be included in every kind of message. This is no big deal with messages that have amessage header where additional attributes can be stored. But some message technologiessend their messages through a binary protocol that has to be altered, to include additionalinformation. In this case this concept is harder to realize.
Open a Parallel Connection
Instead of including the monitoring information into the message, it is possible to create aparallel connection between the two monitored applications. The trace and order ID of thesender are passed through this parallel connection. Therefore the sender of the messagehas to open a socket, where he is waiting for a request of the receiver. When a message hasbeen received, the receiver has to open the communication to the sender, and request themonitoring information. In this concept there is no problem that the message has to bealtered. But an other problem has returned, this concept makes it very difficult to assign asent message to a received message. When multiple messages are sent at the same time thesender may not resolve which incoming request belongs to which sent message.
3.3.3 Concept Evaluation
We came to the conclusion that the concept which includes the trace ID and order ID in thesent messages is the only one that is applicable on all message technologies and can assurethat the monitoring information are correct.
All concepts in the category global trace ID are not usable with asynchronous messages,so they were excluded. Almost the same can be applied to the native message ids. These arenot available in every message technology. Especially TCP is not required to be used, somemessages can also be sent with UDP or in Java VM transport. Finally we could also excludeall concepts that can not assure that the created records hold correct information. Theseare comparing timestamps, comparing the messages, and open a parallel connection. Afterwardsthe only remaining concept that has not been excluded is passing the trace ID. Therefore wehad to find a way, how to intercept the sent and received messages, and how to include the
14
3.3. S3: Development of Monitoring Concepts
monitoring information in the sent messages. Another advantage of local trace ids overglobal trace ids is that not every part of the system requires to be monitored.
3.3.4 Bridge Record
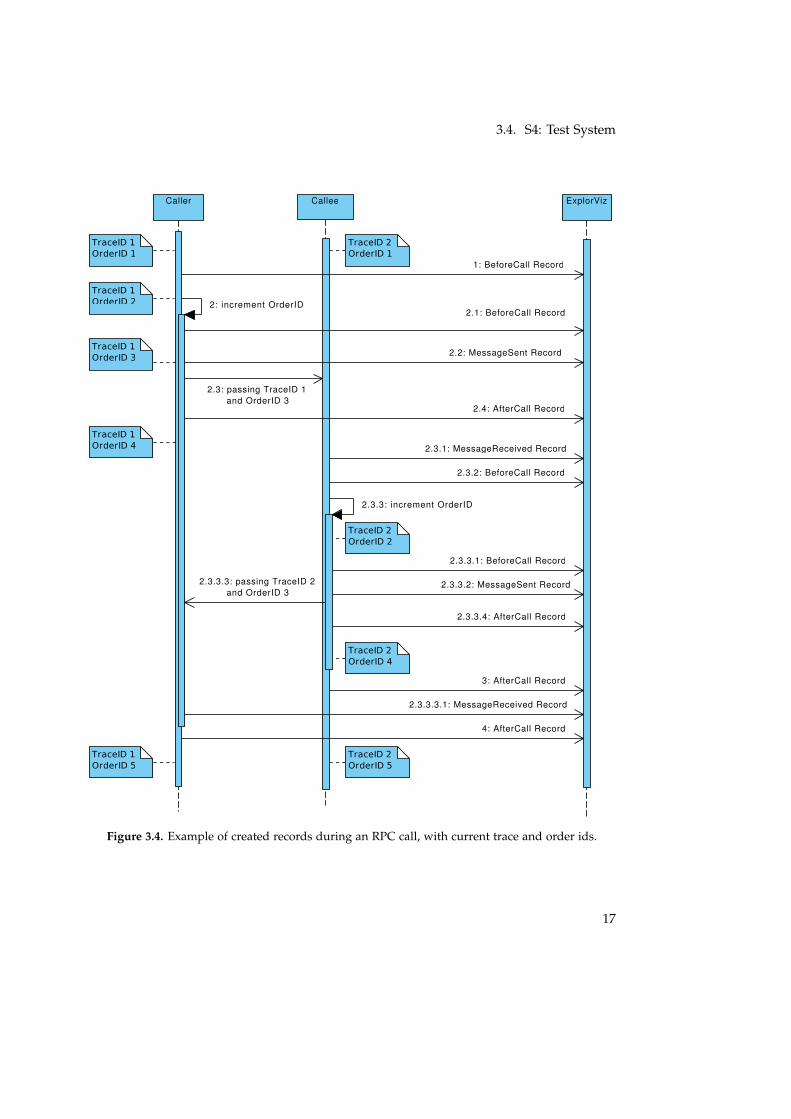
The bridge record should provide information about all the messages sent between thecomponents of the distributed system. We said in the previous part, that the bridge recordonly has to be sent from the receiver of a message. In an environment where every part ismonitored, this would be enough to identify every message. But if there is a participantthat is not monitored, the information about the existence of the message could be lost.Therefore we replace the previous bridge record with three different kinds of records. Anexample with the records is shown in Figure 3.4 as sequence diagram.
SentRecord
A SentRecord holds the information, that a message has been sent. This includes the tracethat has sent the message and at which execution point it has been sent. Additionally atimestamp of the sending time and the remote address of the receiver are stored in therecord. Though the address of the receiver is optional because it may not be possible toextract this information from the message. The record is required in situations where thereceiver of a message is not monitored. In this case it is the only record that is sent toExplorViz. It conserves the information that a message has been sent. The address of thereceiver is stored, to have an indication where the message was sent to.
Content of the record:long senderTraceId
int senderOrderId
int sentTimestamp
String destination
ReceivedRecord
The ReceivedRecord is created under the circumstance that sender and receiver of a messageare monitored. The record includes information where the message has been sent andwhen and where is has been received. This record holds the most important information.It connects the sender with the receiver. It can only be created if both sides are monitored.
Content of the record:long senderTraceId
int senderOrderId
long receiverTraceId
int receiverOrderId
int receivedTimestamp
15
3. Approach
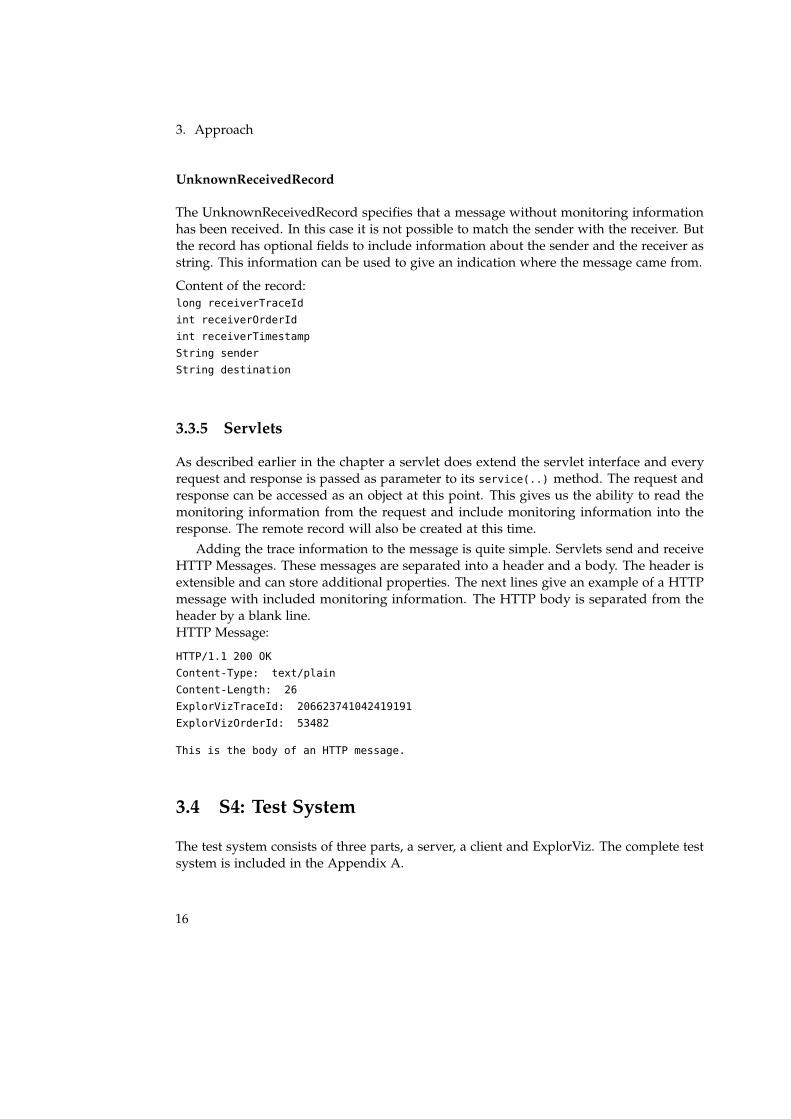
UnknownReceivedRecord
The UnknownReceivedRecord specifies that a message without monitoring informationhas been received. In this case it is not possible to match the sender with the receiver. Butthe record has optional fields to include information about the sender and the receiver asstring. This information can be used to give an indication where the message came from.
Content of the record:long receiverTraceId
int receiverOrderId
int receiverTimestamp
String sender
String destination
3.3.5 Servlets
As described earlier in the chapter a servlet does extend the servlet interface and everyrequest and response is passed as parameter to its service(..) method. The request andresponse can be accessed as an object at this point. This gives us the ability to read themonitoring information from the request and include monitoring information into theresponse. The remote record will also be created at this time.
Adding the trace information to the message is quite simple. Servlets send and receiveHTTP Messages. These messages are separated into a header and a body. The header isextensible and can store additional properties. The next lines give an example of a HTTPmessage with included monitoring information. The HTTP body is separated from theheader by a blank line.HTTP Message:
HTTP/1.1 200 OK
Content-Type: text/plain
Content-Length: 26
ExplorVizTraceId: 206623741042419191
ExplorVizOrderId: 53482
This is the body of an HTTP message.
3.4 S4: Test System
The test system consists of three parts, a server, a client and ExplorViz. The complete testsystem is included in the Appendix A.
16
3.4. S4: Test System
ExplorVizCalleeCaller
4: AfterCall Record
3: AfterCall Record
2.3.3.4: AfterCall Record
2.4: AfterCall Record
2.3.2: BeforeCall Record
2.3.3.3.1: MessageReceived Record
2.3.3.2: MessageSent Record
2.3.3.1: BeforeCall Record
2.3.1: MessageReceived Record
2.2: MessageSent Record
2.1: BeforeCall Record
1: BeforeCall Record
2.3.3.3: passing TraceID 2and OrderID 3
2.3.3: increment OrderID
2.3: passing TraceID 1and OrderID 3
2: increment OrderID
Figure 3.4. Example of created records during an RPC call, with current trace and order ids.
17
3. Approach
3.4.1 Server
The server is JPetStore1 running in a Tomcat 7 servlet container. JPetStore can be accessedas a Git repository, and built with Ant. The built war-file can be deployed with Tomcat. Themonitoring will include the whole Tomcat server, therefore the Tomcat has to be startedwith the start options described in Chapter 4.
3.4.2 Client
The client can be any Java program that connects to the server with an implementationof the abstract class java.net.HttpURLConnection. We have used two different programs inour test system.
The first one is a very small program that loads a HTML page. The main part of theprogram is an loop that finds all local links in the page, and selects a random one that isloaded in the next iteration. We have implemented this test program on our own.
The second program is the Lobo browser. Because the browser is written completely inJava and uses a subclass of URLConnection to communicate with the server it can be usedwithout modifications. The precompiled version of the browser that can be downloadedfrom sourceforge2 does not support Java 7. So we had to compile the program from thesource code3. Probably because the browser has not been updated for four years there area few problems displaying the JPetStore pages with correct formatting. But apart from zhisthe pages are loading properly and accessing pages by clicking on hyperlinks does alsowork.
3.4.3 ExplorViz
ExplorViz is also running as a servlet in a Tomcat 7 servlet container. This has to bea different instance from the Tomcat that runs the JPetStore. Because otherwise themonitoring probes could not connect to ExplorViz during start-up. Additionally the wholeTomcat is monitored when running on the same instance, so ExplorViz would also monitoritself and run slower.
1https://github.com/mybatis/jpetstore-62http://sourceforge.net/projects/xamj/3http://xamj.cvs.sourceforge.net/viewvc/xamj/XAMJ_Project/
18
Chapter 4
Evaluation
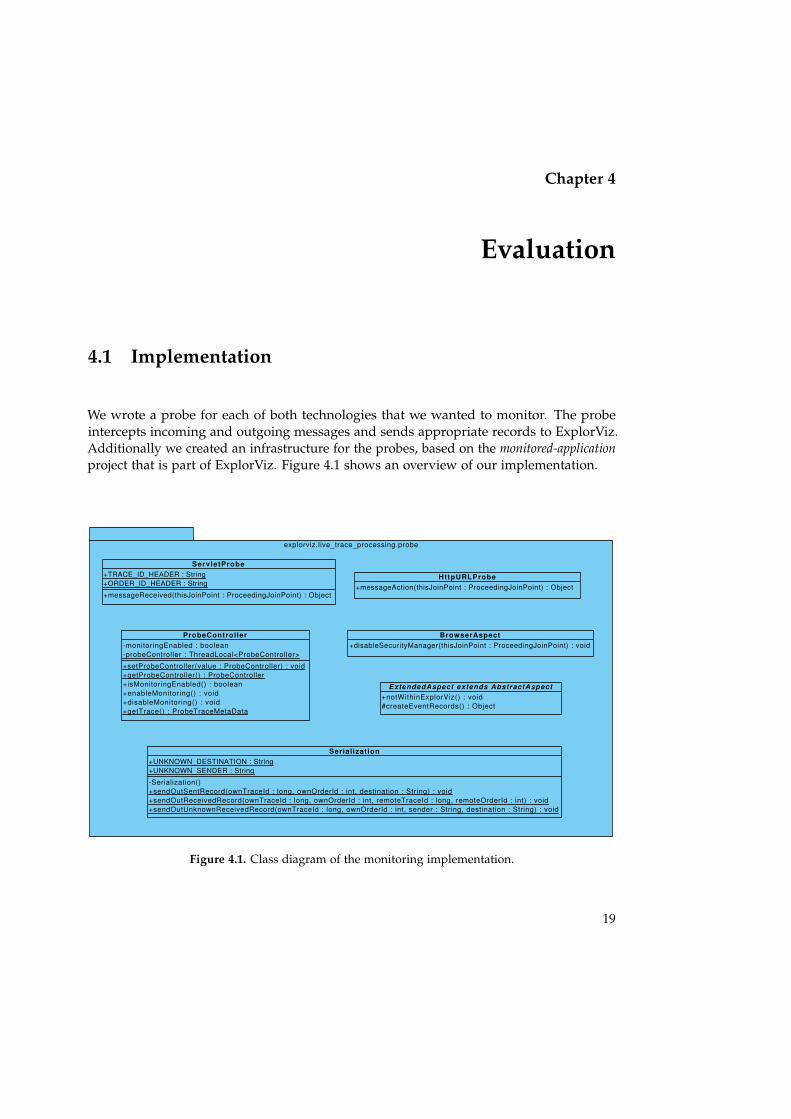
4.1 Implementation
We wrote a probe for each of both technologies that we wanted to monitor. The probeintercepts incoming and outgoing messages and sends appropriate records to ExplorViz.Additionally we created an infrastructure for the probes, based on the monitored-applicationproject that is part of ExplorViz. Figure 4.1 shows an overview of our implementation.
explorviz.live_trace_processing.probe
BrowserAspect+disableSecurityManager(thisJoinPoint : ProceedingJoinPoint) : void
Serial ization+UNKNOWN_DESTINATION : String+UNKNOWN_SENDER : String
-Serialization()+sendOutSentRecord(ownTraceId : long, ownOrderId : int, destination : String) : void+sendOutReceivedRecord(ownTraceId : long, ownOrderId : int, remoteTraceId : long, remoteOrderId : int) : void+sendOutUnknownReceivedRecord(ownTraceId : long, ownOrderId : int, sender : String, destination : String) : void
ServletProbe+TRACE_ID_HEADER : String+ORDER_ID_HEADER : String
+messageReceived(thisJoinPoint : ProceedingJoinPoint) : Object
ExtendedAspect extends AbstractAspect+notWithinExplorViz() : void#createEventRecords() : Object
ProbeController-monitoringEnabled : boolean-probeController : ThreadLocal<ProbeController>
+setProbeController(value : ProbeController) : void+getProbeController() : ProbeController+isMonitoringEnabled() : boolean+enableMonitoring() : void+disableMonitoring() : void+getTrace() : ProbeTraceMetaData
HttpURLProbe+messageAction(thisJoinPoint : ProceedingJoinPoint) : Object
Figure 4.1. Class diagram of the monitoring implementation.
19
4. Evaluation
4.1.1 Infrastructure
The infrastructure for our monitoring probes has been developed in the bachelor/master-project 2013/14.
We used the existing monitored-application1 project as a basis. This project provides aprobe for general monitoring. The probe creates BeforeOperationEvent, AfterOperation-Event, and AfterFailedOperationEvent records for every method call. The project doesalso provide a MonitoringController that is responsible for sending the record buffers toExplorViz. We created the following three classes that are required for our monitoring,additionally to the probes.
Serialization This class is used to create the remote records and to put them into theoutput buffer.
ProbeController We require the ProbeController to exclude events from the monitoringthat are caused by the monitoring, or in other words: it prevents the monitoring frommonitoring itself. This is a problem that did not occur in the monitored-applicationproject because the general monitoring probe does not access methods from the monitoredprogram. Our Probes have to do so, because they need to modify the messages inside ofthe monitored program.
ExtendedAspect This class extends the AbstractAspect from the monitored-applicationproject that is responsible for the general monitoring. So we can check if the monitoring isenabled in the ProbeController. If the call should be monitored the method delegates thecall to the AbstractAspect.
4.1.2 Servlet Probe
The servlet probe does only have one method that is called by AspectJ. The pointcut is seton execution(void Servlet.service(ServletRequest, ServletResponse)), the method thathas been discussed in the previous chapter. This method is called for every request that ismade from clients. The request and the associated response are passed to this method. Theprobe tries to read monitoring information from its header. If trace and order ids are found,a ReceivedRecord is created, otherwise an UnknownReceivedRecord is created. Afterwardsthe monitoring information are stored into the response header and the SentRecord iscreated. Finally the execution of the service method is resumed.
It is noteworthy to mention that the SentRecord is created at the same time as theReceivedRecord. This is up to the implementation of the ServletResponse class. Theresponse message is not sent when the service method returns, but can be sent from insideof the method. The message is sent through an OutputStream that is included in the
1https://build.se.informatik.uni-kiel.de/gitlab/explorviz/monitored-application
20
4.1. Implementation
ServletResponse. The response may be sent at any time, even separated in multiple parts.The Point of time, when the message is sent depends on the underlying implementationof the servlet container. To be independent of the servlet container and the version of itsimplementation, the monitoring must exclusively depend on the servlet interface.
4.1.3 HttpURLConnection Probe
The corresponding probe for the HTTP Connection of the client has only one method that iscalled by AspectJ. This method should be called, when a request is sent. Therefore two point-cuts are required. The first pointcut is call(void java.net.URLConnection+.connect()).This is the method that is defined in the JavaDoc to open the actual connection to theremote object. The documentation also states that after the connect method has returned,the remote object has become available, and its headers and contents can be accessed.[Oracle 2013] The second pointcut is required, because the Lobo browser does not imple-ment the connection as the documentation says. A subclass of URLConnection defines anown method that establishes the connection and makes the object available. Therefore thepointcut call(* java.net.HttpURLConnection+.getResponseCode()) is required.
The method of the probe is called when one of the pointcuts can be applied. When themethod is called, it tries to add the monitoring information to the header of the message.This can fail if the connection has already been established. If the connection has alreadybeen established, no message will be sent. This also means that no SentRecord has to becreated. Otherwise a SentRecord will be sent to ExplorViz. After adding the monitoringinformation, the actual connect method will be called. The probe is still active and waitsfor the call to return. As said in the documentation, the response is available after theconnect method returned. It only makes sense to create a Received Record, if a message hasbeen sent, respectively a SentRecord has been sent in the previous part. If this conditionis true, the method tries to extract trace and order id from the response header. Finally aReceivedRecord respectively UknownReceivedRecord is created and sent to ExplorViz.
There seems to be one problem depending on the implementation of the connection.Some implementations do not send a message for each URLConnection object, but receivethe message from a cache. In this case a SentRecord is created where no matchingReceivedRecord will be created. Furthermore an second ReceivedRecord for the cachedmessage will be created. Both of these records are ignored in the current implementationof ExplorViz, but it could be a problem in later versions.
4.1.4 Usage
The project uses the Apache Ant build tool. The build depends on the monitored-application project. Its location can be redefined in the build.xml file, if necessary.
When building with Ant, everything that is required for monitoring a program will beput in the dist directory of the project. Required are these four files:
21
4. Evaluation
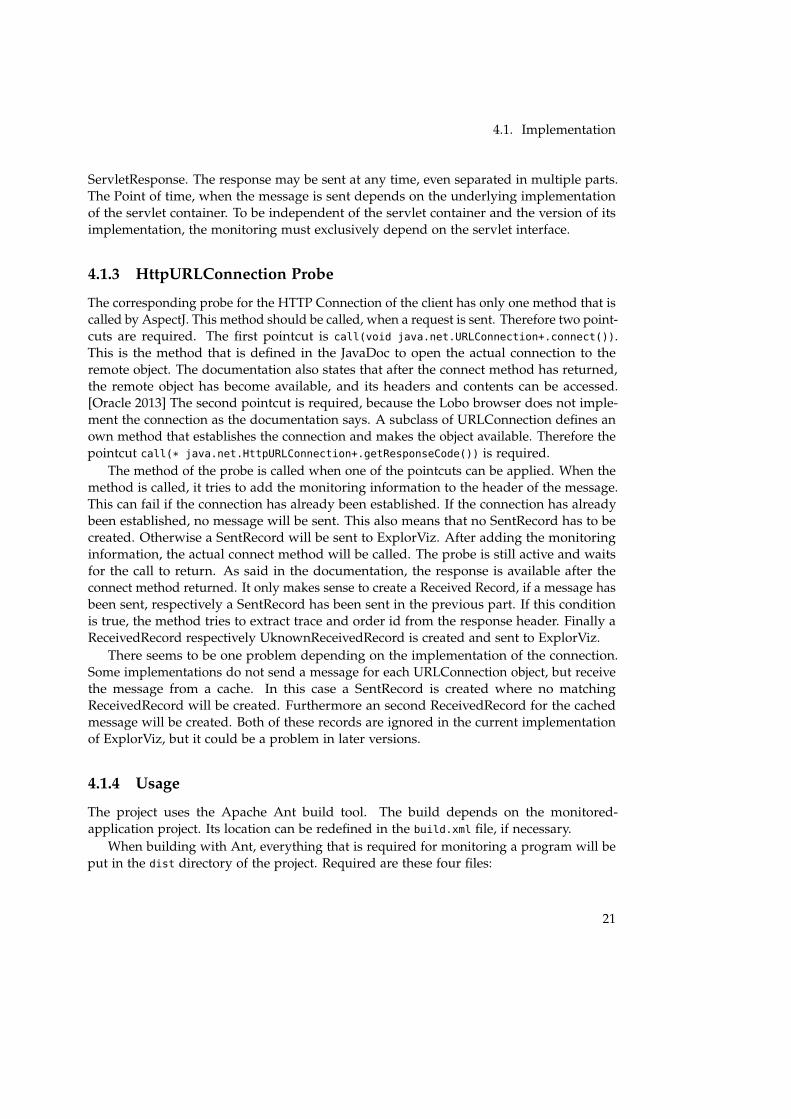
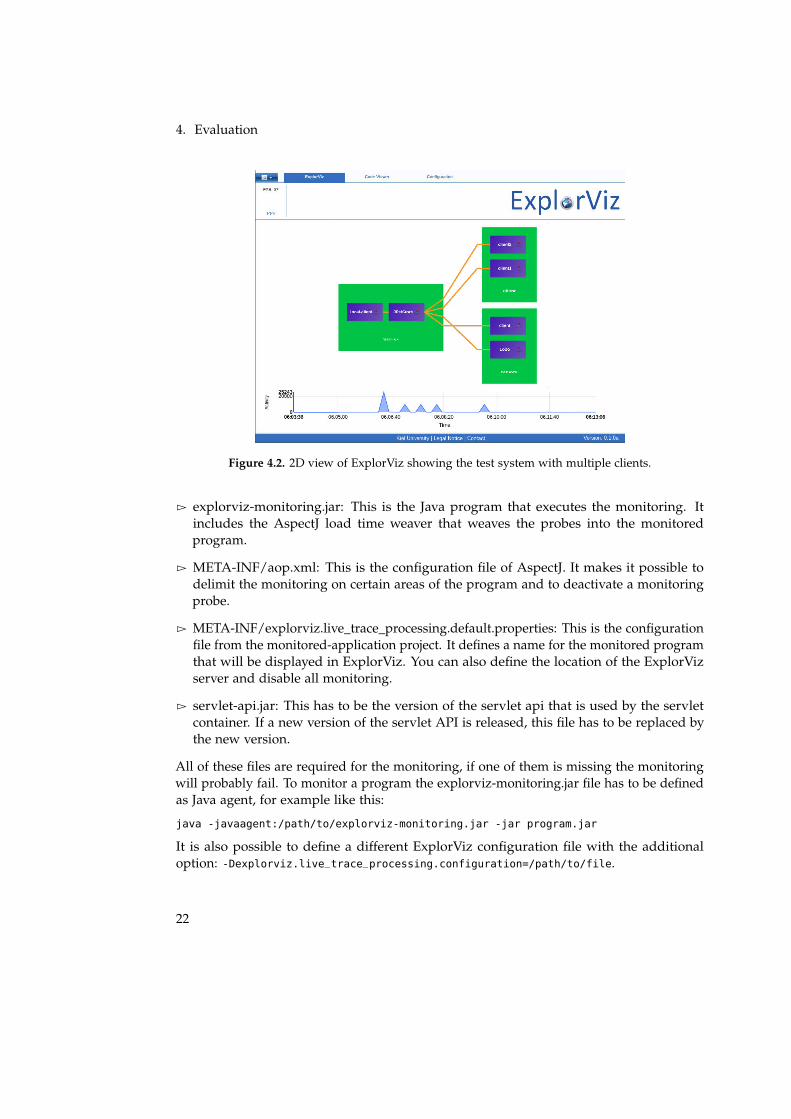
Figure 4.2. 2D view of ExplorViz showing the test system with multiple clients.
Ź explorviz-monitoring.jar: This is the Java program that executes the monitoring. Itincludes the AspectJ load time weaver that weaves the probes into the monitoredprogram.
Ź META-INF/aop.xml: This is the configuration file of AspectJ. It makes it possible todelimit the monitoring on certain areas of the program and to deactivate a monitoringprobe.
Ź META-INF/explorviz.live_trace_processing.default.properties: This is the configurationfile from the monitored-application project. It defines a name for the monitored programthat will be displayed in ExplorViz. You can also define the location of the ExplorVizserver and disable all monitoring.
Ź servlet-api.jar: This has to be the version of the servlet api that is used by the servletcontainer. If a new version of the servlet API is released, this file has to be replaced bythe new version.
All of these files are required for the monitoring, if one of them is missing the monitoringwill probably fail. To monitor a program the explorviz-monitoring.jar file has to be definedas Java agent, for example like this:
java -javaagent:/path/to/explorviz-monitoring.jar -jar program.jar
It is also possible to define a different ExplorViz configuration file with the additionaloption: -Dexplorviz.live_trace_processing.configuration=/path/to/file.
22
4.2. Quality Assurance
4.2 Quality Assurance
4.2.1 Tests
We did a lot of testing with multiple testing frameworks in the project. Creating the testscosted a lot of effort, but the results were sobering. There were only a very few findingsand a lot of the testing frameworks were not compatible with each other. For example aftermocking classes with PowerMock it was not possible to check the test coverage. That isbecause PowerMock creates new classes during run time, which is not visible to the testcoverage checking framework.
The implementation of the servlet monitoring is a rather small project with only fiveclasses that require testing. Therefore we decided to use only JUnit for testing this project.The created tests are similar to those in the monitored-application project. We use theconcept of mocking to separate the tested classes from their environment.
Our tests for the probes are made of multiple test cases. In the first test case amessage with monitoring information is received and a message is sent, where monitoringinformation have to be included. Another test case is that incomplete messages or nullpointer are passed to the probe. In this cases it will be checked that no exceptions arethrown from the probe itself and that the order id is only incremented when a recordis created. That no exceptions are thrown from the probe is important. Otherwise nomessages could be sent if the monitoring had an error, and the monitored program wouldnot be able to continue its execution. Another condition that the probes have to meet is,that the value of the monitoringEnabled variable from the ProbeController must be equalbefore and after the method has been called.
The serialization class has tests where the output buffer is checked for correct size andcontent. The ProbeController is checked for not returning null, and whether the enablingand disabling of the monitoring works. Finally the ExtendedAspect is checked for disablingthe monitoring in the correct situations.
4.2.2 Problems
The big problem for the evaluation is, that the weaving cannot be tested with conventionaltests. So we cannot verify if every sent and received message is intercepted by themonitoring.
The other problem is with the quality of our monitoring. The messages are interceptedon a very high level at general purpose interfaces and not inside of the implementation,where the message actually is sent. This has the big advantage that the implementation ofthe monitoring is theoretically compatible with any servlet container and implementationof HttpURLConnection, also in future versions as long as the interface is not changed. Buttherefore some information are lost. The servlet probe creates a received and a sent recorddirectly after each other. Therefore there is no possibility to find out how many methodcalls are required to handle the request.
23
4. Evaluation
4.3 Performance
We use three tests for performance testing. The first test measures the response time ofthe monitored JPetStore. The second test measures the number of created records andtraces per second that are produced in the servlet container and need to be processedby ExplorViz. In the third test, we measured the page load time of the monitored Lobobrowser when sending requests to the monitored servlet container. The first two testscreate CSV output files which are plotted afterwards with the program GNU Octave. Themeasurement in the third test was done manually. All tests were performed on a dual-coreCPU with 4GiB RAM.
The request for the first two tests were made with the small test program that wasintroduced in Chapter 3. For the testing of JPetStore we defined two different settings.In the first setting 50 requests are sent to JPetStore. All requests in this setting are sentfrom one client. The next request is not sent until the response to the previous request wasreceived. So the server has to execute one response at a time. This scenario will later bereferenced as relaxed test. In the second setting, four clients create requests simultaneously.Each of the clients sends 50 request in a row, so the server has to create multiple responsesat a time. This scenario will later be referenced as stress test.
The response time of JPetStore is measured directly in the test program that creates therequests. Thereby we collect this data for each request:
[requestId, request_time, response_time]
The second kind of tests, measures the number of created records and traces per second.Therefore we created the RecordCounterAspect. This aspect is weaved into the trace registryand every method that creates records.The data that is collected each second:
[timestamp, current_record_counter, started_traces_counter, completed_traces_counter]
4.3.1 Response Time
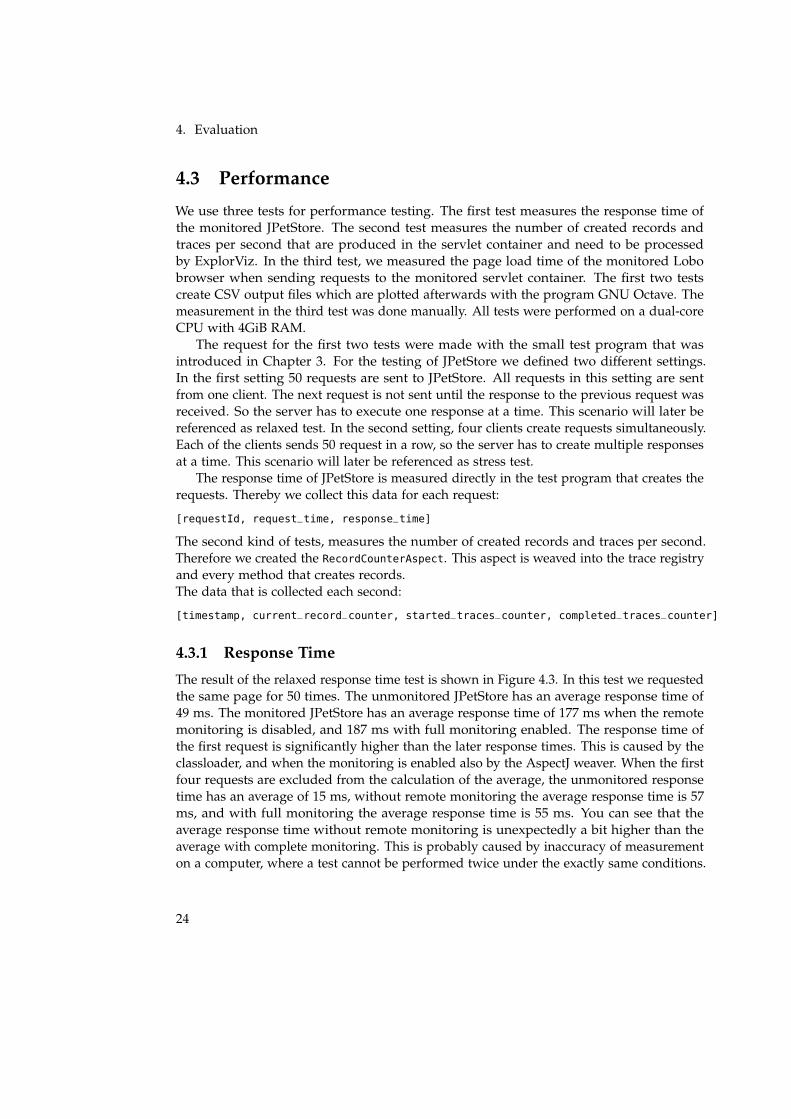
The result of the relaxed response time test is shown in Figure 4.3. In this test we requestedthe same page for 50 times. The unmonitored JPetStore has an average response time of49 ms. The monitored JPetStore has an average response time of 177 ms when the remotemonitoring is disabled, and 187 ms with full monitoring enabled. The response time ofthe first request is significantly higher than the later response times. This is caused by theclassloader, and when the monitoring is enabled also by the AspectJ weaver. When the firstfour requests are excluded from the calculation of the average, the unmonitored responsetime has an average of 15 ms, without remote monitoring the average response time is 57ms, and with full monitoring the average response time is 55 ms. You can see that theaverage response time without remote monitoring is unexpectedly a bit higher than theaverage with complete monitoring. This is probably caused by inaccuracy of measurementon a computer, where a test cannot be performed twice under the exactly same conditions.
24
4.3. Performance
Figure 4.3. Response time test with different kinds of monitoring activated.
So the additional time required for remote monitoring is insignificant compared to thetime used for general monitoring. The full monitoring has an overhead rate of 3.6. Thisis a bit more then the monitoring overhead in PubFlow, where we achieved an overheadrate of 3. The reason therefore is probably that PubFlow is a distributed system. So theunmonitored PubFlow already has a network overhead that does not multiply with themonitoring overhead.
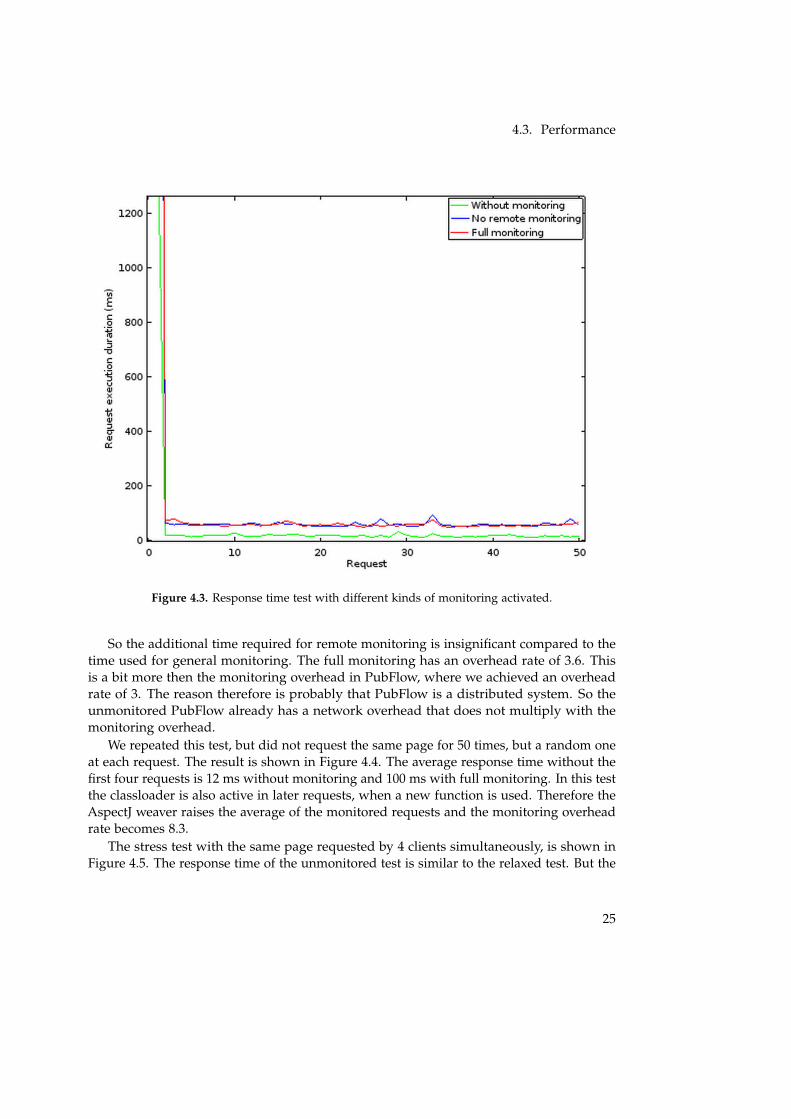
We repeated this test, but did not request the same page for 50 times, but a random oneat each request. The result is shown in Figure 4.4. The average response time without thefirst four requests is 12 ms without monitoring and 100 ms with full monitoring. In this testthe classloader is also active in later requests, when a new function is used. Therefore theAspectJ weaver raises the average of the monitored requests and the monitoring overheadrate becomes 8.3.
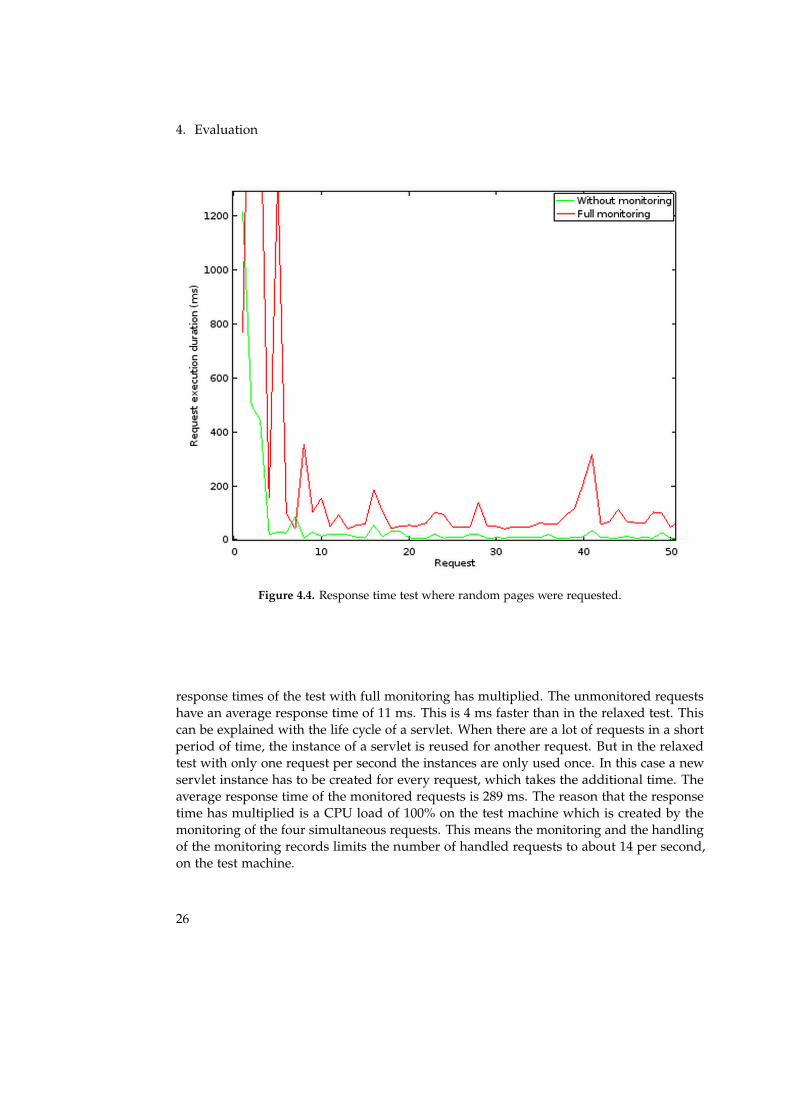
The stress test with the same page requested by 4 clients simultaneously, is shown inFigure 4.5. The response time of the unmonitored test is similar to the relaxed test. But the
25
4. Evaluation
Figure 4.4. Response time test where random pages were requested.
response times of the test with full monitoring has multiplied. The unmonitored requestshave an average response time of 11 ms. This is 4 ms faster than in the relaxed test. Thiscan be explained with the life cycle of a servlet. When there are a lot of requests in a shortperiod of time, the instance of a servlet is reused for another request. But in the relaxedtest with only one request per second the instances are only used once. In this case a newservlet instance has to be created for every request, which takes the additional time. Theaverage response time of the monitored requests is 289 ms. The reason that the responsetime has multiplied is a CPU load of 100% on the test machine which is created by themonitoring of the four simultaneous requests. This means the monitoring and the handlingof the monitoring records limits the number of handled requests to about 14 per second,on the test machine.
26
4.3. Performance
Figure 4.5. Response time test with multiple clients.
4.3.2 Created Records
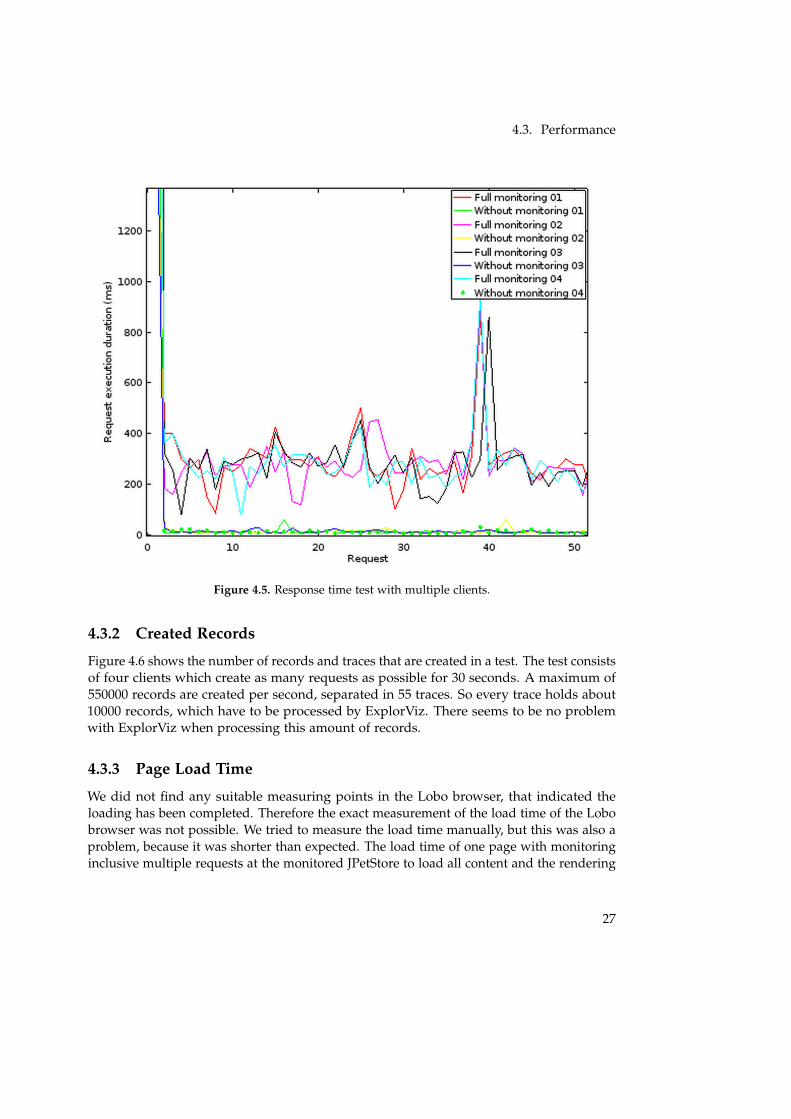
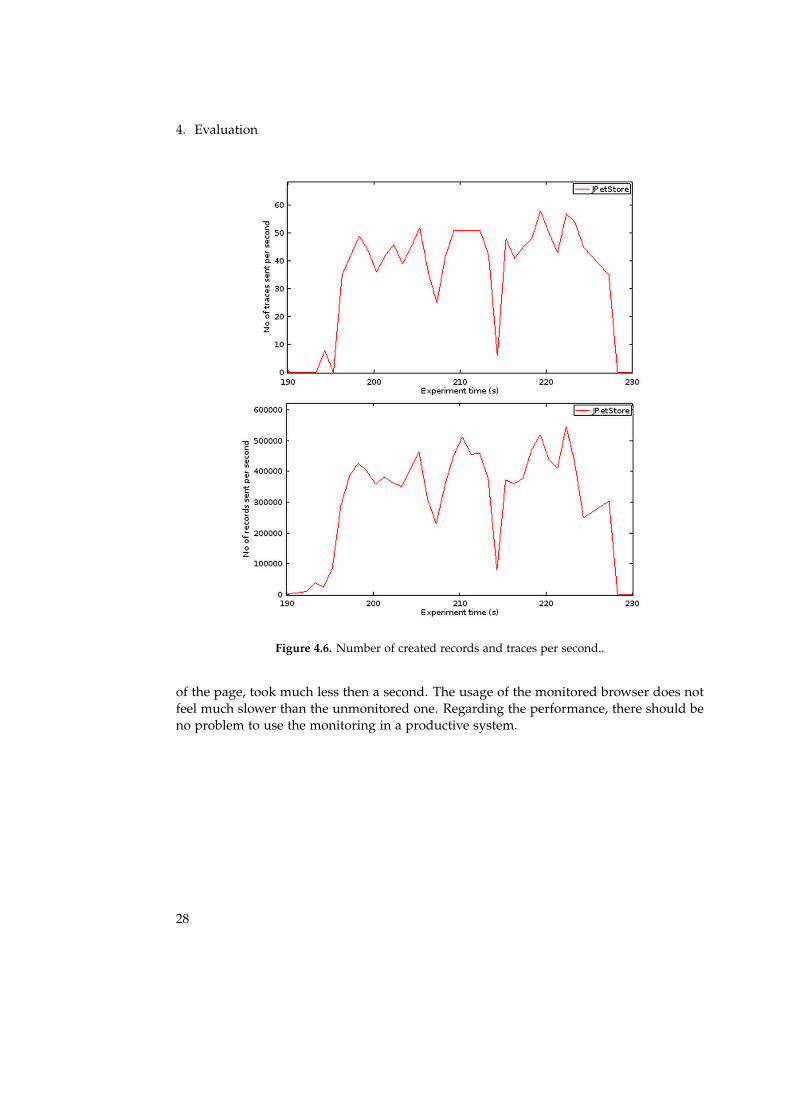
Figure 4.6 shows the number of records and traces that are created in a test. The test consistsof four clients which create as many requests as possible for 30 seconds. A maximum of550000 records are created per second, separated in 55 traces. So every trace holds about10000 records, which have to be processed by ExplorViz. There seems to be no problemwith ExplorViz when processing this amount of records.
4.3.3 Page Load Time
We did not find any suitable measuring points in the Lobo browser, that indicated theloading has been completed. Therefore the exact measurement of the load time of the Lobobrowser was not possible. We tried to measure the load time manually, but this was also aproblem, because it was shorter than expected. The load time of one page with monitoringinclusive multiple requests at the monitored JPetStore to load all content and the rendering
27
4. Evaluation
Figure 4.6. Number of created records and traces per second..
of the page, took much less then a second. The usage of the monitored browser does notfeel much slower than the unmonitored one. Regarding the performance, there should beno problem to use the monitoring in a productive system.
28
Chapter 5
Related Work
It is difficult to find related work to the monitoring of remote procedure calls. There is oneapproache towards the monitoring of RMI to reverse engineer UML sequence diagramsfrom a running distributed system. In this work the message is not altered. The matchingof the remote call at the caller and the callee is done with comparison of timestamps, asdescribed in Chapter 3. Additionally the name of the called RMI method is compared, togain a bit more safety in the matching process.[Briand et al. 2006]
This implementation could already cause trouble when two different clients call theremote method at about the same time. In large software systems, it is very probable thatthis situation appears.
A bit more can be found about the monitoring of servlets. One framework that providesperformance monitoring for servlets is Kieker. The Kieker servlet probe can handle everyincoming request and monitor its execution. It can also apply a handler chain to everyrequest and it logs the CPU and memory usage during the execution of the request. [Project2013]
This monitoring can only be used for performance analysis of the servlet. Neither theServlet container is monitored, nor references to the sender of the request can be made.
29

Chapter 6
Conclusion and Future Work
6.1 Future Work
This thesis only deals with the development of a remote monitoring concept and a proof ofconcept like implementation. So there is still a lot of work to do.
There are at the moment implementations of this concept for the message technologiesActiveMQ, HSQLDB, JAX-WS, URLConnection, and Servlets. These are just a very few ofall existing technologies. Especially RMI as a common used RPC technology is desirable tobe implemented.
Additionally to the creation of the remote record, it seems to be interesting howto process and display their information. At the moment ExplorViz does only showReceivedRecords with matching SentRecords on its 2D overview page. This could beenhanced by displaying addition information like the number of connections, and thedestination string from the sent record which may differ from the application name.
At the moment ExplorViz does not show any information about UnknownReceived-Records, and SentRecords without matching ReceivedRecord. Therefore this also has to beimplemented in the future. For example every sender or receiver that is not monitored,but receive messages from or send messages to the monitored system could be displayedas a black box. ExplorViz also lacks support for multicast messages. At the moment oneSentRecord is matched to one ReceivedRecord. If a message is received from multiplelistener, only the first receiver will be displayed.
The 3D representation in ExplorViz lacks support of remote records completely. Hereare animations conceivable, where incoming and outgoing messages are represented byconnections that leave the displayed area through a gate.
Another application where remote monitoring could be included is the standard Kiekerversion. Therefore two things has to be transferred to Kieker. At first the remote recordsmust be implemented in the Kieker Analysis part. And second the monitoring probes haveto be adapted to the Kieker API.
A lot of distributed systems probably does not consist of programs exclusively written inJava. Another possible future project is the translation of the whole monitored-applicationproject including the remote monitoring, into other programming languages. The im-plementation of monitoring in other languages should not be a big problem, becausenowadays there are aspect oriented extensions, in the style of AspectJ, for almost every
31
6. Conclusion and Future Work
language. There are also dynamic languages like Python where no extension is requiredfor object orientation, but the language itself supports some kind of run time weaving.
6.2 Conclusion
The four goals that were defined in Chapter 1 have been met. We have analyzed the servletinterface and found a way how the sent and received messages could be intercepted. Wealso developed a few different monitoring concepts for remote calls. From these conceptsone has been chosen as the best. This concept has been implemented for servlets andHttpURLConnections. Thereby we could set up a test system with full monitoring thatcould be evaluated.
The evaluation showed a monitoring overhead of factor 3.6, which seems to be relativelysmall for a full monitoring. It also showed that the work on a productive system with anoverhead of factor 3.6 can be possible.
32
Bibliography
[Briand et al. 2006] L. C. Briand, Y. Labiche, and J. Leduc. Toward the reverse engineeringof uml sequence diagrams for distributed java software. Software Engineering, IEEETransactions on 32.9 (2006), pages 642–663. (Cited on page 29)
[Chan and Mordani 2013] S. Chan and R. Mordani. JSR-340 Java Servlet 3.1 Specification.Oracle America, Inc., 2013. url: http://download.oracle.com/otndocs/jcp/servlet-3_1-fr-eval-
spec/index.html. (Cited on page 5)
[community 2009] L. community. The Lobo Project. (visited on 2014-03-16). 2009. url:http://lobobrowser.org/. (Cited on page 6)
[Coulouris et al. 2011] G. Coulouris, J. Dollimore, T. Kindberg, and G. Blair. DistributedSystems: Concepts and Design. International computer science series. Addison-Wesley,2011. url: http://books.google.de/books?id=GmYpKQEACAAJ. (Cited on page 4)
[Fittkau et al. 2013] F. Fittkau, J. Waller, P. C. Brauer, and W. Hasselbring. Scalable and livetrace processing with kieker utilizing cloud computing. In: Proceedings of the Symposiumon Software Performance: Joint Kieker/Palladio Days 2013. Volume 1083. CEUR WorkshopProceedings, 2013, pages 89–98. url: http://eprints.uni-kiel.de/22340/. (Cited on page 7)
[Hilsdale and Hugunin 2004] E. Hilsdale and J. Hugunin. Advice weaving in aspectj. In:Proceedings of the 3rd international conference on Aspect-oriented software development. ACM.2004, pages 26–35. (Cited on page 7)
[Oracle 2013] Oracle. JavaDoc Class URLConnection. (visited on 2014-03-16). 2013. url:http://docs.oracle.com/javase/7/docs/api/java/net/URLConnection.html. (Cited on page 21)
[Oracle 2014] Oracle. An Overview of RMI Applications. (visited on 2014-03-16). 2014.url: http://docs.oracle.com/javase/tutorial/rmi/overview.html. (Cited on page 4)
[Project 2013] K. Project. Kieker User Guide. Research Report. 2013. url: http://eprints.uni-kiel.de/16537/. (Cited on page 29)
[Van Hoorn et al. 2012] A. van Hoorn, J. Waller, and W. Hasselbring. Kieker: a frameworkfor application performance monitoring and dynamic software analysis. In: Proceedingsof the 3rd ACM/SPEC International Conference on Performance Engineering. ICPE ’12. Boston,Massachusetts, USA: ACM, 2012, pages 247–248. url: http://doi.acm.org/10.1145/2188286.
2188326. (Cited on page 7)
33

Appendix A
Data Disk
A.1 Content
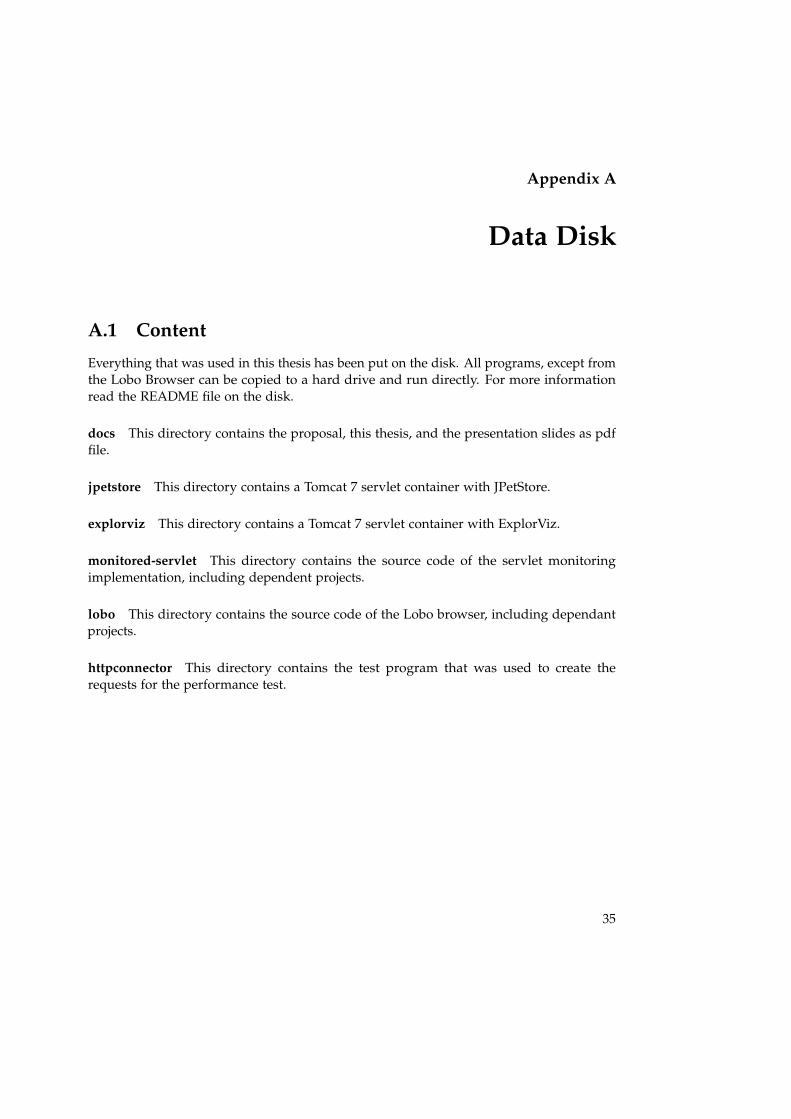
Everything that was used in this thesis has been put on the disk. All programs, except fromthe Lobo Browser can be copied to a hard drive and run directly. For more informationread the README file on the disk.
docs This directory contains the proposal, this thesis, and the presentation slides as pdffile.
jpetstore This directory contains a Tomcat 7 servlet container with JPetStore.
explorviz This directory contains a Tomcat 7 servlet container with ExplorViz.
monitored-servlet This directory contains the source code of the servlet monitoringimplementation, including dependent projects.
lobo This directory contains the source code of the Lobo browser, including dependantprojects.
httpconnector This directory contains the test program that was used to create therequests for the performance test.
35

Eidesstattliche Erklärung
Hiermit erkläre ich an Eides statt, dass ich die vorliegende Arbeit selbstständig verfasstund keine anderen als die angegebenen Quellen und Hilfsmittel verwendet habe.
Kiel,
37