Embed Size (px)
Citation preview
MONITORING OF THE SUSTAINABLE DEVELOPMENT GOALINDICATORS IN THE KYRGYZ REPUBLIC
Monitoring of the Sustainable
Development Goal Indicatorsin the Kyrgyz Republic
2014-2018
National Statistical Committeeof the Kyrgyz Republic
A Statistical Compendium
Bishkek, 2020
УДК 311:351/354ББК 60.55М77
М77 MonitoringoftheSustainableDevelopmentGoalIndicatorsintheKyrgyzRepublic,National StatisticalCommitteeoftheKyrgyzRepublic, Bishkek, 2020, 154 pages
ISBN 978-9967-11-718-1
EditorialBoard:Chair: A. SultanovMembers: N. Chuykov A. Orosbaev K. Isaliev A. Shakulov C. Turdubaeva C. Biryukova E. Isenkulova
The Compendium contains statistical data that monitors achievement of the 16 Sustainable Development Goal, characterizing the main social-economic indicators of public life in 2010 and 2014-2018. The Compendium was prepared using data received by state statistical bodies from enterprises, organizations, the general public, and also administrative sources.
More detailed information on the SDG indicators can be found on the national platform for SDG reporting at the address: https://sustainabledevelopment-kyrgyzstan.github.io/en/.
The Compendium can be used by civil servants, international organizations, academia, experts studying socio-economic and environmental issues, enterprises, students and other interested parties.
When using this statistical data in the media and academic work, or disseminating in information networks, on paper, magnetic and other media, users are obliged to refer to their source (Article 17 of the Law of the Kyrgyz Republic “On State Statistics”).
Latestdatewhendatawereupdatedforthispublication:June 2020
For information about this publication, contact Frunze str. 374, Bishkek city Telephone: 996 (312) 62-56-07 Fax: 996 (312) 66-01-38 Website: www.stat.kg e-mail: [email protected] Statistical Committee of the Kyrgyz Republic, Department of Sustainable Development and Environmental Statistics
TheCompendiumhasadoptedthefollowingconventions: - the phenomenon is absent;... no data is available;0.0 the value of the indicator is less than the unit of measurement.
In some cases, insignificant discrepancies between the totals and the sum of the terms are explained by rounding of the data.
УДК311:351/354
ISBN 978-9967-11-718-1 ББК60.55 ©National Statistical Committee of the Kyrgyz Republic, 2020 Tel.: 996 (312) 62-56-07 www.stat.kg [email protected]
Published with financial and technical support from the United Nations Children's Fund (UNICEF) in the Kyrgyz Republic. The opinions expressed in this publication do not necessarily reflect the policies or positions of UNICEF, and the organization is not responsible for them.

3
CONTENT
Forewords 9
Abbreviations 12
Introduction 13
GOAL1. END POVERTY IN ALL ITS FORMS EVERYWHERE 16
1.1.1 Proportion of population below the international poverty line 18
Figure 3 Proportion of population living below the national poverty line 191.2.1 Proportion of population living below the national poverty line 20
Figure 4 Proportion of men, women and children of all ages living in poverty in all its dimensions according to national definitions 21
1.2.2 Proportion of men, women and children of all ages living in poverty in all its dimensions according to national definitions 22
1.3.1 Proportion of population covered by social protection floors/systems, by sex, distinguishing children, unemployed persons, older persons, persons with disabilities, pregnant women, newborns, work-injury victims and the poor and the vulnerable 23
1.4.1 Proportion of population living in households with access to basic services 231.5.1 Number of deaths resulting from disasters, by territory and sex 251.5.2 Direct economic loss attributed to disasters in relation to global gross domestic
product (GDP) 261.a.2 Proportion of total government spending on essential services 26
GOAL2.END HUNGER, ACHIEVE FOOD SECURITY AND IMPROVED NUTRITION AND PROMOTE SUSTAINABLE AGRICULTURE 27
2.1.1 Prevalence of undernourishment 30
Figure 5 Prevalence of stunting among children under five years of age 302.2.1 Prevalence of stunting (height for age <-2 standard deviation from the median of the
World Health Organization (WHO) Child Growth Standards) among children under 5 years of age 31
2.2.2 Prevalence of malnutrition (weight for height >+2 or <-2 standard deviation from the median of the WHO Child Growth Standards) among children under 5 years of age, by type (wasting and overweight) 32
2.a.1 The agriculture orientation index for government expenditures 33
GOAL3.ENSURE HEALTHY LIVES AND PROMOTE WELL-BEING FOR ALL AT ALL AGES 34
Figure 6 Maternal mortality ratio per 100,000 live births 373.1.1 Maternal mortality ratio per 100,000 live births 373.1.2 Proportion of births attended by skilled health personnel 38
Figure 7 Under-five mortality rate per 1,000 live births 38
Content
Monitoring of the Sustainable Development Goal Indicators in the Kyrgyz Republic4
3.2.1 Under-five mortality rate per 1,000 live births 383.2.2 Neonatal mortality rate per 1,000 live births 393.3.1 Number of new HIV cases per 1,000 population, by sex and territory 40
Figure 8 Tuberculosis incidence per 100,000 population, by sex 413.3.2 Tuberculosis incidence per 100,000 population, by sex and territory 423.3.3 Malaria incidence per 1,000 population 433.3.4 Hepatitis B incidence per 100,000 population, by sex and territory 43
Figure 9 Mortality rate attributed to cardiovascular disease, cancer, diabetes or chronic respiratory disease 44
3.4.1 Mortality rate attributed to cardiovascular diseases per 100,000 population, by sex and territory 44
3.4.1 Mortality rate attributed to cancer per 100,000 population, by territory 453.4.1 Mortality rate attributed to diabetes per 100,000 population, by sex and territory 463.4.1 Mortality rate attributed to chronic respiratory disease per 100,000, by sex and territory 473.4.2 Suicide mortality rate per 100,000 population, by territory 47
Figure 10 Death rate due to road traffic injuries per 100,000 population, by territory, 2018 483.6.1 Death rate due to road traffic injuries per 100,000 population, by sex and territory 483.7.1. Proportion of women of reproductive age (aged 15-49 years) who have their need for
family planning satisfied with modern methods 49
Figure 11 Adolescent birth rate (aged 15-19 years), by territory 503.7.2 Adolescent birth rate (aged 15-19 years), by territory 513.9.2 Mortality rate attributed to unsafe water, unsafe sanitation and lack of hygiene per
100,000 population, by territory 513.9.3 Mortality rate attributed to unintentional poisoning and exposure to toxic substances
per 100,000 population, by territory 523.b.1. Proportion of the target population covered by all vaccines included in their national
programme 523.c.1 Health worker density and distribution per 1,000 population, by sex and territory. 53
GOAL4. ENSURE INCLUSIVE AND EQUITABLE QUALITY EDUCATION AND PROMOTE LIFELONG LEARNING OPPORTUNITIES FOR ALL 56
4.1.1 Proportion of children and young people (a) in grades 2/3; (b) at the end of primary; and (c) at the end of lower secondary achieving at least a minimum proficiency level in (i) reading and (ii) mathematics, by sex 58
4.2.1 Proportion of children aged 36-59 months who are developmentally on track in health, learning and psychosocial well-being, by territory 59
4.2.2 Participation rate in organized learning (one year before the official primary entry age) 60
4.4.1. Proportion of youth and adults with information and communications technology (ICT) skills, by type of skill 61
4.c.1 Proportion of certified teachers in educational institutions 61
Monitoring of the Sustainable Development Goal Indicators in the Kyrgyz Republic 5Content
GOAL5. ACHIEVE GENDER EQUALITY AND EMPOWER ALL WOMEN AND GIRLS 63
5.1.1. Whether or not legal frameworks are in place to promote, enforce and monitor equality and non discrimination on the basis of sex 66
5.3.1 Proportion of women aged 20-24 years who were married or in a union before age 15 and before age 18 66
5.5.1 Proportion of seats held by women in Parliament 675.5.2 Proportion of women in managerial positions 675.6.2. Number of countries with laws and regulations that guarantee full and equal
access to women and men aged 15 years and older to sexual and reproductive health care, information and education 68
Figure 12 Proportion of individuals who own a mobile telephone 685.b.1 Proportion of individuals who own a mobile telephone 68
GOAL6. ENSURE AVAILABILITY AND SUSTAINABLE MANAGEMENT OF WATER AND SANITATION FOR ALL 70
6.1.1. Proportion of population using safely managed drinking water services 726.2.1 Proportion of population using safely managed sanitation services, including a
hand-washing facility with soap and water 726.2.1.1 Proportion of population with sustainable access to sanitary facilities 736.3.1 Proportion of wastewater safely treated 736.4.1.2 Water loss in transportation, by territory 74
GOAL7. ENSURE ACCESS TO AFFORDABLE, RELIABLE, SUSTAINABLE AND MODERN ENERGY FOR ALL 75
Figure 13 Proportion of population with access to electricity 76
7.1.1 Proportion of population with access to electricity 77
7.1.2 Proportion of population with primary reliance on clean fuels and technology 78
7.2.1.1 Renewable energy share in the total energy consumption 79
7.3.1.1 Energy intensity of GDP at current market prices 79
7.3.1.2 Electricity intensity of GDP 79
GOAL8. PROMOTE SUSTAINED, INCLUSIVE AND SUSTAINABLE ECONOMIC GROWTH, FULL AND PRODUCTIVE EMPLOYMENT AND DECENT WORK FOR ALL 80
8.1.1 Annual growth rate (rate of fall) of real GDP per capita 828.2.1 Annual growth rate of real GDP per employed person 82Figure 14 Unemployment rate, by sex 828.5.2 Unemployment rate, by sex, territory and age 838.6.1 Proportion of youth (aged 15-24 years) not in education, employment or training 848.7.1 Proportion and number of children aged 5 -17 years engaged in child labour, by
sex and age 848.8.1 Frequency rates of fatal and non-fatal occupational injuries 85

Monitoring of the Sustainable Development Goal Indicators in the Kyrgyz Republic6
8.9.1.1 Direct contribution of tourism to GDP as a proportion of total GDP 878.10.1 Number of (а) commercial bank branches per 100,000 adults and (b) number of
automated teller machines (ATMs) per 100,000 adults in the Kyrgyz Republic 87
GOAL9. BUILD RESILIENT INFRASTRUCTURE, PROMOTE INCLUSIVE AND SUSTAINABLE INDUSTRIALIZATION AND FOSTER INNOVATION 89
9.1.2 Passenger and freight volumes, by mode of transport 91
Figure 15 Manufacturing employment as a proportion of total employment 91
9.2.2 Manufacturing employment as a proportion of total employment, by sex and territory 92
9.3.1 Proportion of small-scale industries in total industry value added 92
9.4.1.1 Volume of pollutants coming from stationary sources per km2 93
9.5.2 Researchers (in full-time equivalent) per million inhabitants 93
9.c.1 Proportion of population covered by a mobile network 93
GOAL10. REDUCE INEQUALITY WITHIN AND AMONG COUNTRIES 94
10.1.1 Growth rates of average income per capita, income per capita among the bottom 40 per cent of the population and the total population 96
Figure 16 Proportion of people living below 50 per cent of median income 96
10.2.1 Proportion of people living below 50 per cent of median income, by sex and age 97
10.3.1 Proportion of population reporting having personally felt discriminated against or harassed within the previous 12 months on the basis of a ground of discrimination prohibited under international human rights law 97
10.4.1 Labour share of GDP, comprising wages and social protection transfers 98
GOAL11.MAKE CITIES AND HUMAN SETTLEMENTS INCLUSIVE, SAFE, RESILIENT AND SUSTAINABLE 99
Figure 17 Proportion of population that has convenient access to public transport 101
11.2.1 Proportion of population that has convenient access to public transport 101
11.5.1 Number of deaths attributed to disasters 102
11.5.2 Direct economic loss attributed to disasters in relation to global GDP 103
11.6.1.1. Volume of solid waste disposed of 103
11.7.1.1a. Area of green space and tracts of land in residential areas 103
GOAL12. ENSURE SUSTAINABLE CONSUMPTION AND PRODUCTION PATTERNS 105
Figure 18 Hazardous waste generated per capita (first to third degree of hazard) 107
Figure 19 Hazardous waste generated per capita (kilograms per person) 107
12.4.2 Hazardous waste generated per capita 107
Monitoring of the Sustainable Development Goal Indicators in the Kyrgyz Republic 7Content
GOAL13. TAKE URGENT ACTION TO COMBAT CLIMATE CHANGE AND ITS IMPACTS 108
13.1.1 Number of deaths attributed to disasters, by sex and territory 110
13.1.2 Number of countries that adopt and implement national disaster risk reduction strategies in line with the Sendai Framework for Disaster Risk Reduction 2015-2030 111
GOAL14. CONSERVE AND SUSTAINABLY USE THE OCEANS, SEAS AND MARINE RESOURCES FOR SUSTAINABLE DEVELOPMENT 112
GOAL15. PROTECT, RESTORE AND PROMOTE SUSTAINABLE USE OF TERRESTRIAL ECOSYSTEMS, SUSTAINABLY MANAGE FORESTS, COMBAT DESERTIFICATION, AND HALT AND REVERSE LAND DEGRADATION AND HALT BIODIVERSITY LOSS 114
15.1.1.1 Forest area 116
15.1.2 Proportion of important sites for terrestrial and freshwater biodiversity that are covered by protected areas 116
15.3.1.1 Arable land by reasons for non-use 116
15.7.1.1 Proportion of wild animals that are poached or illicitly trafficked 117
15.a.1.1 Public expenditure on conservation 117
GOAL16. PROMOTE PEACEFUL AND INCLUSIVE SOCIETIES FOR SUSTAINABLE DEVELOPMENT, PROVIDE ACCESS TO JUSTICE FOR ALL AND BUILD EFFECTIVE, ACCOUNTABLE AND INCLUSIVE INSTITUTIONS AT ALL LEVELS 118
Figure 20 Proportion of population that feel safe walking alone around the area they live 120
16.1.4 Proportion of population that feel safe walking alone around the area they live 120
16.2.1 Proportion of children aged 1-14 years who experienced any physical punishment and/or psychological aggression by caregivers in the past month 121
16.3.1 Proportion of victims of violence in the previous 12 months who reported their victimization to competent authorities or other officially recognized conflict resolution mechanisms 122
16.7.1 Proportions of positions in state institutions 122
16.9.1 Proportion of children under 5 years of age whose births have been registered with a civil authority 123
16.b.1 Proportion of population reporting having personally felt discriminated against or harassed in the previous 12 months on the basis of a ground of discrimination prohibited under international human rights law 124
Monitoring of the Sustainable Development Goal Indicators in the Kyrgyz Republic8
GOAL17. STRENGTHEN THE MEANS OF IMPLEMENTATION AND REVITALIZE THE GLOBAL PARTNERSHIP FOR SUSTAINABLE DEVELOPMENT 126
17.1.1 Total government revenue as a proportion of GDP, by source 129
17.1.2 Proportion of domestic budget funded by domestic taxes 130
17.6.2 Number of fixed Internet broadband subscriptions, by speed 130
Figure 21 Proportion of individuals using the Internet 130
17.8.1 Proportion of individuals using the Internet 131
Appendix 132
Monitoring of the Sustainable Development Goal Indicators in the Kyrgyz Republic 9
Dear Readers!
We present for your attention the first issue of the statistical compendium “Monitoring of the Sustainable Development Goal Indicators in the Kyrgyz Republic”, prepared by the National Statistical Committee of the Kyrgyz Republic with assistance from the UN Resident Coordinator’s Office and financial and technical support from the United Nations Children's Fund (UNICEF).
The historic summit in 2015 that of the highest political leadership of 193 countries around the world, including Kyrgyzstan, adopted Agenda 2030 and officially announced the course for sustainable development.
Our country confirmed its commitment to the United Nations Sustainable Development Goals in the National Development Strategy of the Kyrgyz Republic until 2040: “Kyrgyzstan will strive to achieve the Sustainable Development Goals adopted by the United Nations”.
We understand the importance of statistical information for society, because we live in an age of digitalization, in which its role in making informed political and managerial decisions for the sustainable development of the country is greatly enhanced.
Monitoring of the achievement of the Sustainable Development Goals should be based on comparable and standardized official statistics, produced in accordance with the fundamental principles of official statistics – such as comparability, accessibility, timeliness and confidentiality. The key authority responsible for implementing the monitoring and reporting system of indicators is the National Statistical Committee.
The purpose of this publication is to inform the public about the current state and progress of sustainable development in our country, as well as to assist in determining further priority steps to achieve success in implementation of the SDGs.
In conclusion, I would like to express special gratitude to the United Nations system in the Kyrgyz Republic for their support in developing a monitoring system for achieving the Sustainable Development Goals.
Akylbek Sultanov Chairman of the National Statistical Committee of the Kyrgyz Republic
Forewords
Monitoring of the Sustainable Development Goal Indicators in the Kyrgyz Republic10
It gives me immense pleasure to release “Monitoring of the Sustainable Development Goal Indicators in the Kyrgyz Republic”, the Kyrgyz Republic’s first progress report on the Sustainable Development Goals (SDGs). Achieving the SDGs is a marathon, in which success can only be secured through evidence-based planning, implementation, monitoring and continuous improvement.
The United Nations is embarking on its Decade of Action for Sustainable Development. This decade will be decisive for our world, and access to timely, relevant and disaggregated data will become even more significant to determine where gaps exist, where additional efforts are needed and where advances are being made.
This report presents progress for all the available SDG indicators. It also provides time-series data for over 100 global and national indicators to allow for in-depth analysis. The efforts being made to continually improve and refine monitoring are a testament to the National Statistical Committee’s (NSC’s) key role in periodic, data-driven SDG monitoring in the country.
Leaving no one behind is the central message of the SDGs. While the NSC is making efforts to ensure that disaggregated data are available to highlight social and spatial inequalities, it is equally important to focus on communication and statistical literacy to enhance engagement and dialogue between producers and users of official statistics, especially with respect to civil society organizations and the private sector. It is commendable that the NSC has taken proactive steps to ensure participation and partnerships with a broad set of stakeholders to address data challenges.
In addition, the Kyrgyz NSC is also ensuring that the SDG data are easily accessible in a user-friendly manner online, on the SDG National Reporting Platform. The report will also help policy makers to identify areas in which interventions need to be focused. Comprehensive information on data-based SDG monitoring, data snapshots and brief highlights of progress on the SDGs have been included in the report, along with the associated metadata and disaggregated data.
On behalf of the United Nations in the Kyrgyz Republic, I congratulate the National Statistical Committee and the team for their tireless efforts and strong commitment to develop a statistically robust and comprehensive data and monitoring framework, and for leadership in the timely preparation of this Report, while Kyrgyzstan prepares the Voluntary National Review 2020. The United Nations in the Kyrgyz Republic is privileged to support the National Statistical Committee in its endeavours to create strong monitoring systems for data-driven decision-making to achieve the SDGs.
Ozonnia OjieloThe UN Resident Coordinator in the Kyrgyz Republic
Monitoring of the Sustainable Development Goal Indicators in the Kyrgyz Republic 11
When the world’s leaders adopted the 2030 Agenda for Sustainable Development in 2015, they deliberately set very ambitious goals and targets: 17 integrated and indivisible Sustainable Development Goals (SDGs) and 169 targets.
To complete such a wide-ranging agenda requires a very effective monitoring system to be in place, to show exactly what progress has been made and which areas are lagging behind. This is why the Inter-Agency and Expert Group on SDG Indicators developed the global indicator framework for the SDGs, which was agreed upon at the 48th session of the United Nations Statistical Commission, held in March 2017.
Having accurate statistical information for these indicators at national level is of critical importance. These data are also crucial for enabling strategic decisions to be taken in order to achieve the national priorities and the SDGs, as set out in the National Development Strategy.
I believe that this publication – “Monitoring of the Sustainable Development Goal (SDG) Indicators in the Kyrgyz Republic”, prepared by the National Statistical Committee (NSC) with UNICEF’s support – will meet this very important need.
I am very proud of the long-lasting and fruitful cooperation between the NSC and UNICEF, which included four rounds of the Multiple Indicator Cluster Survey (MICS), one of the largest international household surveys on the situation of children and women. The latest round of MICS in 2018 has provided data for 31 of the 80 global indicators available in this publication with disaggregated data by sex, age, income, ethnicity, migration status, disability and geographical location.
I congratulate the Office of the NSC for compiling this report, which contains a rich set of comparable and standardized data, at a time when the country is presenting its Voluntary National Review (VNR) to the High-Level Political Forum on Sustainable Development.
This publication has been the product of fruitful teamwork. I want to acknowledge here the team of specialists from the NSC, UNICEF and the United Nations Resident Coordinator’s Office that contributed to this important effort. UNICEF’s support for creating a national robust system to monitor progress on the SDGs in Kyrgyz Republic will not stop here; we will continue to help to produce and disseminate relevant data concerning Agenda 2030, with the aim of leaving no one behind.
Christine JaulmesUNICEF Representativein the Kyrgyz Republic
Forewords
Monitoring of the Sustainable Development Goal Indicators in the Kyrgyz Republic12
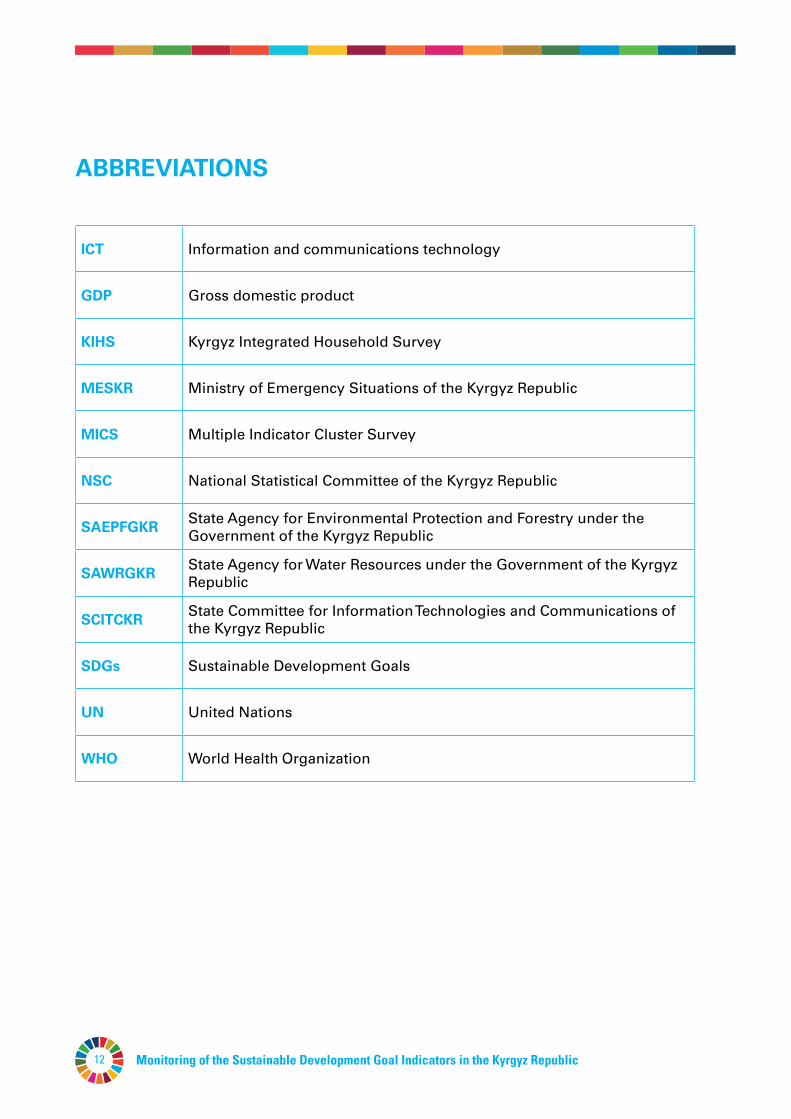
ABBREVIATIONS
ICT Information and communications technology
GDP Gross domestic product
KIHS Kyrgyz Integrated Household Survey
MESKR Ministry of Emergency Situations of the Kyrgyz Republic
MICS Multiple Indicator Cluster Survey
NSC National Statistical Committee of the Kyrgyz Republic
SAEPFGKR State Agency for Environmental Protection and Forestry under the Government of the Kyrgyz Republic
SAWRGKR State Agency for Water Resources under the Government of the Kyrgyz Republic
SCITCKR State Committee for Information Technologies and Communications of the Kyrgyz Republic
SDGs Sustainable Development Goals
UN United Nations
WHO World Health Organization

Monitoring of the Sustainable Development Goal Indicators in the Kyrgyz Republic 13
INTRODUCTION
In September 2015, world leaders at a historic United Nations summit adopted the global plan of action: Transforming our world: the 2030 Agenda for Sustainable Development.
The Sustainable Development Goals are a call to action from all countries — poor, rich and middle-income. They are intended to improve well-being and protect our planet. States recognize that measures to eliminate poverty must be taken in parallel with efforts to increase economic growth and address a range of issues in the areas of education, health, social protection and employment, as well as combating climate change and protecting the environment. In accordance with the commitments made, over the next 10 years countries will step up their efforts to eradicate poverty in all its forms, combat inequality, address climate change, and ensure that no one is behind. The final document "Transforming our world: the 2030 Agenda" contains 17 global goals, 169 related goals and 232 indicators.1
The Kyrgyz Republic, along with other countries, has committed itself to contributing to achievement of the global SDGs, as well as to monitoring indicators of SDG achievement. In this way, under the National Development Strategy of the Kyrgyz Republic 2018-2040, Kyrgyzstan will strive to achieve the adopted Sustainable Development Goals of the 2030 Agenda.
The National Statistical Committee (NSC) – as a member of the coordinating Committee for Adaptation, Implementation and Monitoring of the 2030 SDGs in the Kyrgyz Republic and the steering body of the Monitoring and Evaluation Working Group for the preparation of Voluntary National Review of progress towards achieving the Sustainable Development Goals, and in accordance with the decision of the 47th Session of the United Nations Statistical Commission on the collection of global SDG indicators on the basis of standardized and comparable official statistical data produced in accordance with the fundamental principles of official statistics – has the authority to lead and oversee data collection and evidence-based efforts related to the SDGs.
In order to adapt the global indicators of the Sustainable Development Goals in the Kyrgyz Republic, an inventory of SDG targets and indicators was conducted in 2017, taking into account national priorities. During this work, of the 232 global indicators national indicators were developed with targets for 140 indicators and 157 additional national indicators were developed with targets; this should enable monitoring of achievement of the SDGs.
AvailabilityofglobalSDGindicators.The statistical capacity assessment revealed that Kyrgyzstan is ready to report immediately on 102 indicators, or 50 per cent of all applicable global SDG indicators. Of the 102 available and easily accessible indicators, 71 indicators (70 per cent) are produced by the NSC and 28 (27 per cent) by ministries and agencies, 3 indicators (3 per cent) are produced by the NSC jointly with ministries and agencies.2
The Kyrgyz Republic adheres to the main message of the 2030 Agenda "leave no one behind". With this in mind, significant attention is paid to the disaggregation of SDG indicators. Analysis of the availability of global indicators has revealed that as of 1 January 2020, 55 indicators are available with disaggregation by geographical location, 42 by gender, 29 by age, 19 by income, and 18 by education. There are gaps in the preparation of disaggregated data on migration status and persons with disabilities.
1 The 2030 Global Agenda was approved by the Office of the Government of the Kyrgyz Republic Resolution 867 “On the Coordination Committee for Adapation, Implementation and Monitoring of the Sustainable Development Goals until 2030 in the Kyrgyz Republic” of 22 December 2015.2 The assessment of the current statistical capacity of the Kyrgyz Republic was carried out within the framework of the UNSD-DFID project "Monitoring the SDGs".
Introduction
Monitoring of the Sustainable Development Goal Indicators in the Kyrgyz Republic14
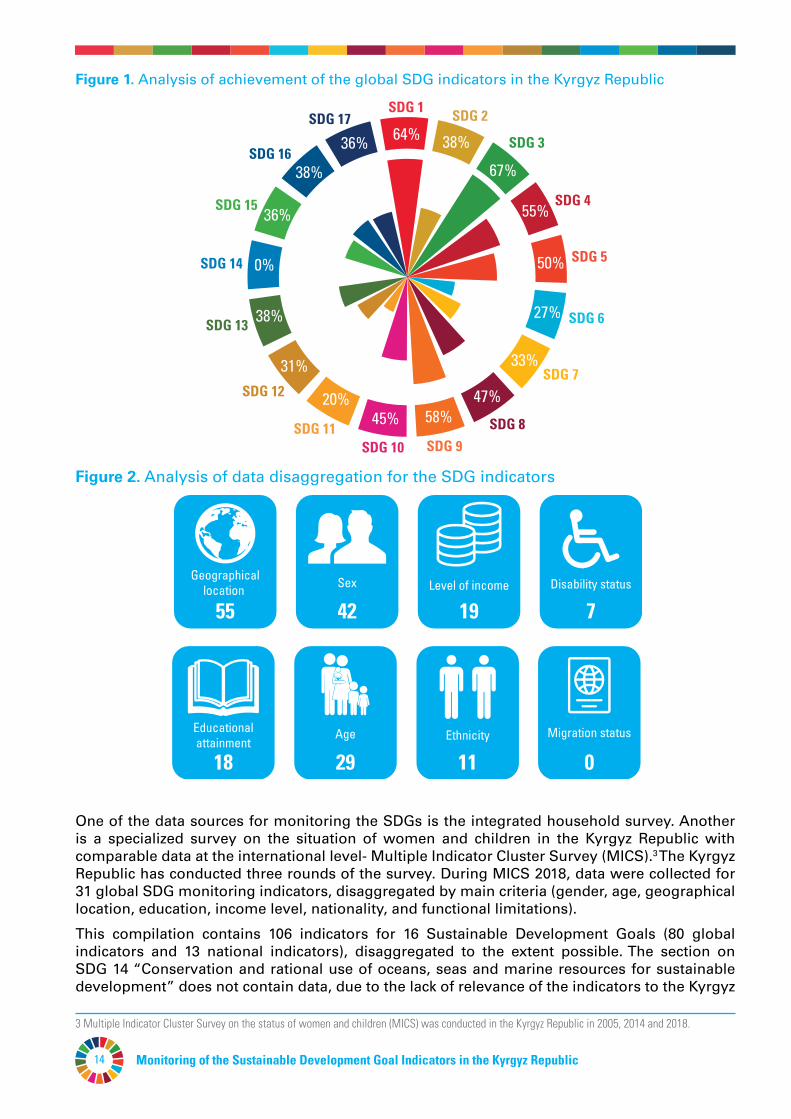
Figure2. Analysis of data disaggregation for the SDG indicators
One of the data sources for monitoring the SDGs is the integrated household survey. Another is a specialized survey on the situation of women and children in the Kyrgyz Republic with comparable data at the international level- Multiple Indicator Cluster Survey (MICS).3 The Kyrgyz Republic has conducted three rounds of the survey. During MICS 2018, data were collected for 31 global SDG monitoring indicators, disaggregated by main criteria (gender, age, geographical location, education, income level, nationality, and functional limitations).
This compilation contains 106 indicators for 16 Sustainable Development Goals (80 global indicators and 13 national indicators), disaggregated to the extent possible. The section on SDG 14 “Conservation and rational use of oceans, seas and marine resources for sustainable development” does not contain data, due to the lack of relevance of the indicators to the Kyrgyz
3 Multiple Indicator Cluster Survey on the status of women and children (MICS) was conducted in the Kyrgyz Republic in 2005, 2014 and 2018.
Figure1.Analysis of achievement of the global SDG indicators in the Kyrgyz Republic
SDG 1 SDG 2
SDG 3
SDG 4
SDG 5
SDG 6
SDG 7
SDG 8
SDG 9SDG 10SDG 11
SDG 12
SDG 13
SDG 14
SDG 15
SDG 16
SDG 1764% 38%
67%
55%
58%45%20%
31%
38%
36%
38%
36%
0% 50%
27%
33%
47%
55
Geographicallocation
42Sex
19Level of income
7Disability status
18
Educationalattainment
29Age
11Ethnicity
0
Migration status
Monitoring of the Sustainable Development Goal Indicators in the Kyrgyz Republic 15Introduction
Republic. The data presented are collected from the statistical system and administrative sources. More detailed information on the SDG indicators can be found on the National SDG Reporting Platform.4
The data in the collection are presented for the last five years, and data for 2010 are also provided for trend analysis.
The introduction sections for the Goals draw, to varying extents, on global SDG website: https://www.un.org/sustainabledevelopment/ru/sustainable-development-goals/.
4 National SDG Reporting Platform: https://sustainabledevelopment-kyrgyzstan.github.io/en
Monitoring of the Sustainable Development Goal Indicators in the Kyrgyz Republic16
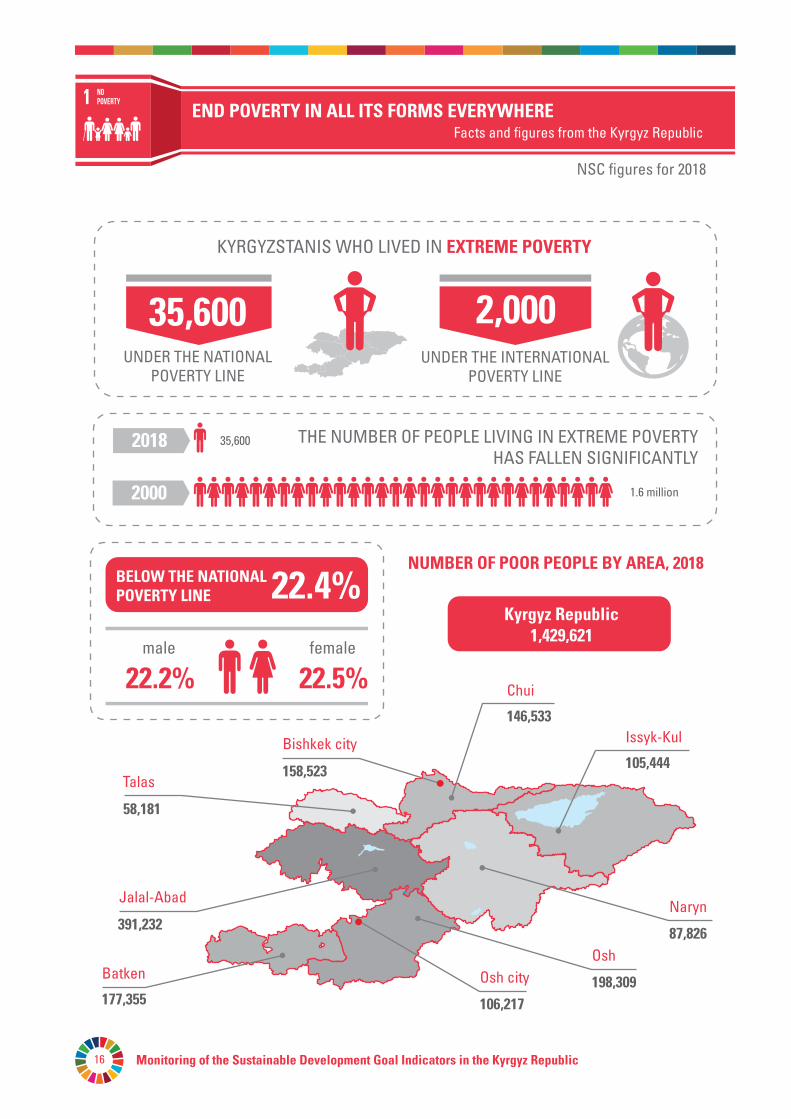
NUMBER OF POOR PEOPLE BY AREA, 2018
146,533
58,181
158,523
Bishkek city
Chui
105,444
Issyk-Kul
Talas
391,232
Jalal-Abad
198,309
Osh
106,217
Osh city
87,826
Naryn
177,355
Batken
NOPOVERTY
END POVERTY IN ALL ITS FORMS EVERYWHEREFacts and figures from the Kyrgyz Republic
KYRGYZSTANIS WHO LIVED IN EXTREME POVERTY
NSC figures for 2018
UNDER THE NATIONALPOVERTY LINE
35,600UNDER THE INTERNATIONAL
POVERTY LINE
2,000
THE NUMBER OF PEOPLE LIVING IN EXTREME POVERTYHAS FALLEN SIGNIFICANTLY
1.6 million2000
2018 35,600
22.4%
22.2% 22.5%femalemale
BELOW THE NATIONALPOVERTY LINE
Kyrgyz Republic1,429,621
Monitoring of the Sustainable Development Goal Indicators in the Kyrgyz Republic 17Goal 1
NSC figures for 2018
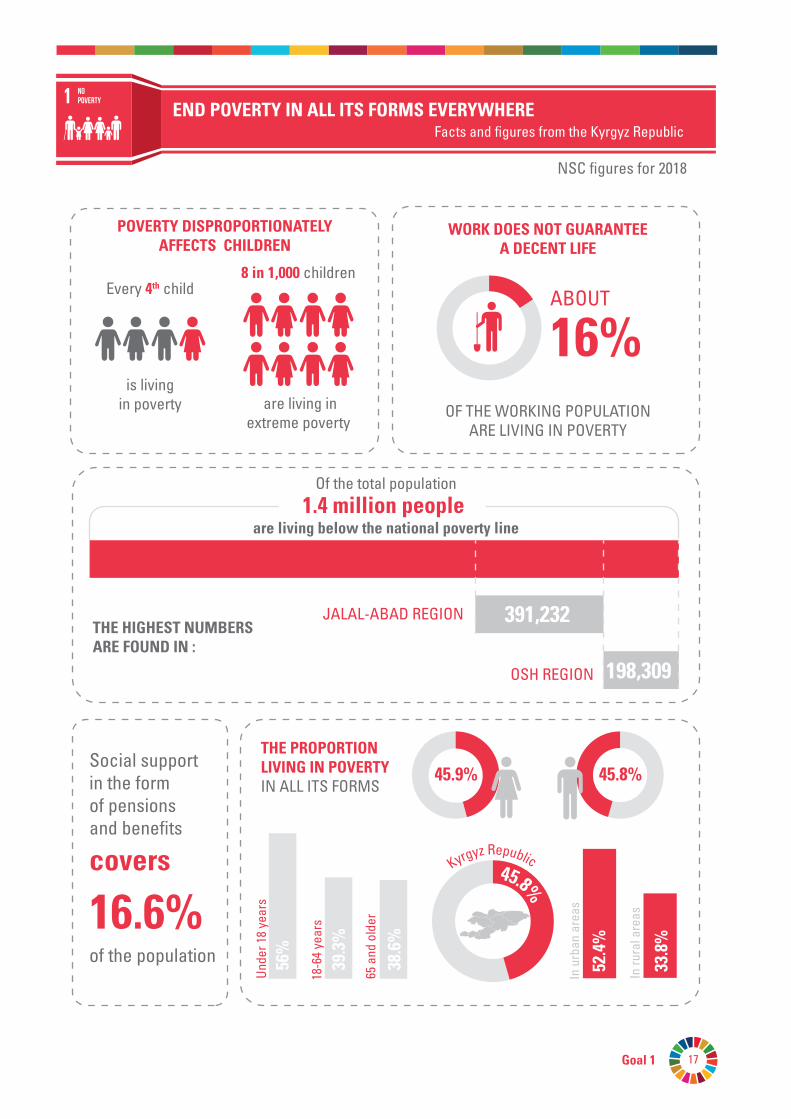
POVERTY DISPROPORTIONATELYAFFECTS CHILDREN
Every 4th child
is livingin poverty
8 in 1,000 children
are living inextreme poverty
Social support in the form of pensions and benefits
covers
16.6%of the population
WORK DOES NOT GUARANTEEA DECENT LIFE
OF THE WORKING POPULATIONARE LIVING IN POVERTY
ABOUT
16%
OSH REGION
Of the total population
391,232
198,309
THE HIGHEST NUMBERS ARE FOUND IN :
JALAL-ABAD REGION
THE PROPORTION LIVING IN POVERTY IN ALL ITS FORMS
Kyrgyz Republic45.8%
52.4
%
33.8
%
In u
rban
are
as
In ru
ral a
reas
45.9% 45.8%
56%
39.3
%
38.6
%
Und
er 1
8 ye
ars
18-6
4 ye
ars
65 a
nd o
lder
NOPOVERTY
END POVERTY IN ALL ITS FORMS EVERYWHEREFacts and figures from the Kyrgyz Republic
are living below the national poverty line1.4 million people

Monitoring of the Sustainable Development Goal Indicators in the Kyrgyz Republic18
GOAL1.ENDPOVERTYINALLITSFORMSEVERYWHERE
Although global poverty rates have halved since 2000, one in ten people in developing countries live below the international poverty line (US$ 1.90 per day), and millions of others earn just over that amount. Poverty is not just a lack of income and resources to ensure a sustainable livelihood. It manifests itself in hunger and malnutrition, limited access to education and other basic social services, social discrimination and exclusion, as well as lack of opportunity to participate in decision -making.
Targets:
1.1 By 2030, reduce at least by half the proportion of men, women and children of all ages living in poverty in all its dimensions according to national definitions.
1.2. By 2030, reduce at least by half the proportion of men, women and children of all ages living in poverty in all its dimensions according to national definitions.
1.3 Implement nationally appropriate social protection systems and measures for all, including floors, and by 2030 achieve substantial coverage of the poor and the vulnerable.
1.4 By 2030, ensure that all men and women, in particular the poor and the vulnerable, have equal rights to economic resources, as well as access to basic services, ownership and control over land and other forms of property, inheritance, natural resources, appropriate new technology and financial services, including microfinance.
1.5 By 2030, build the resilience of the poor and those in vulnerable situations and reduce their exposure and vulnerability to climate-related extreme events and other economic, social and environmental shocks and disasters.
1.a Ensure significant mobilization of resources from a variety of sources, including through enhanced development cooperation, in order to provide adequate and predictable means for developing countries, in particular least developed countries, to implement programmes and policies to end poverty in all its dimensions.
1. b Create sound policy frameworks at the national, regional and international levels, based on pro-poor and gender-sensitive development strategies, to support accelerated investment in poverty eradication actions.
1.1.1. Proportion of population below the international poverty line5 (population with income below US$1.90 per day, percentage)
2010 2014 2015 2016 2017 2018
Kyrgyz Republic 0.28 0.07 0.06 0.21 0.31 0.28
Batken 0.21 0.00 0.34 0.32 1.08 0.45
Jalal-Abad 0.22 0.00 0.00 0.00 0.00 0.00
5 Calculated based on purchasing power parity

Monitoring of the Sustainable Development Goal Indicators in the Kyrgyz Republic 19Goal 1
2010 2014 2015 2016 2017 2018
Issyk-Kul 0.11 0.00 0.00 0.00 0.00 0.89
Naryn 3.46 0.20 0.74 0.70 0.66 1.70
Osh 0.09 0.00 0.00 0.00 0.00 0.00
Talas 0.00 0.00 0.00 0.00 0.00 0.00
Chui 0.16 0.42 0.00 1.01 1.27 0.32
Bishkek city 0.00 0.00 0.00 0.00 0.00 0.33
Osh city - 0.00 0.00 0.00 0.00 0.00
Purchasing power parity is the ratio of two or more monetary units, currencies of different countries, established by their purchasing power in relation to a certain set of goods and services, i.e. the same amount of money, converted at the current exchange rate into national currencies, with which in different countries of the world you can buy the same amount of goods and services.
Monitoring of poverty is important for the global development agenda, as well as for national development agendas. When assessing poverty in a country and how best to reduce poverty, the focus is naturally on the poverty line that is considered appropriate for the country. The poverty line varies from country to country in terms of purchasing power in these countries, and it has a strong economic gradient, so that wealthier countries tend to adopt higher standards of living when determining poverty. But in order to consistently measure global absolute poverty in terms of consumption, two people are viewed with the same purchasing power for goods in the same way, both poor and non-poor, even if they live in different countries. Since the 1990 World Development Report, the World Bank has sought to apply a single standard for measuring extreme poverty, tied to what poverty means in the world's poorest countries. The wellbeing of people living in different countries can be measured on a general scale by adjusting differences in the purchasing power of currencies. In 2018, the global poverty line (US$1.90), taking into account the purchasing power parity, was about 50 per cent of the national extreme poverty line and about 26 per cent of the national overall poverty line in 2018.
For a number of years, the percentage of the population living below the global poverty line, which characterizes extreme poverty, was less than 0.4 per cent nationwide. At the same time, 1.7 per cent of the population of Naryn region and about 1 per cent of the population of Issyk Kul region lived in extreme poverty (1.1.1).
23.6 39.5 26.9 32.6 29.3 33.6 18.6 29.0 20.4 28.4 20.1 23.7
2010 2014 2015 2016 2017 2018
33.730.6 32.1
25.4 25.622.4
Urban RuralKyrgyz Republic
Figures from KIHS.
Figure3. Proportion of population living below the national poverty line (percentage)
Monitoring of the Sustainable Development Goal Indicators in the Kyrgyz Republic20
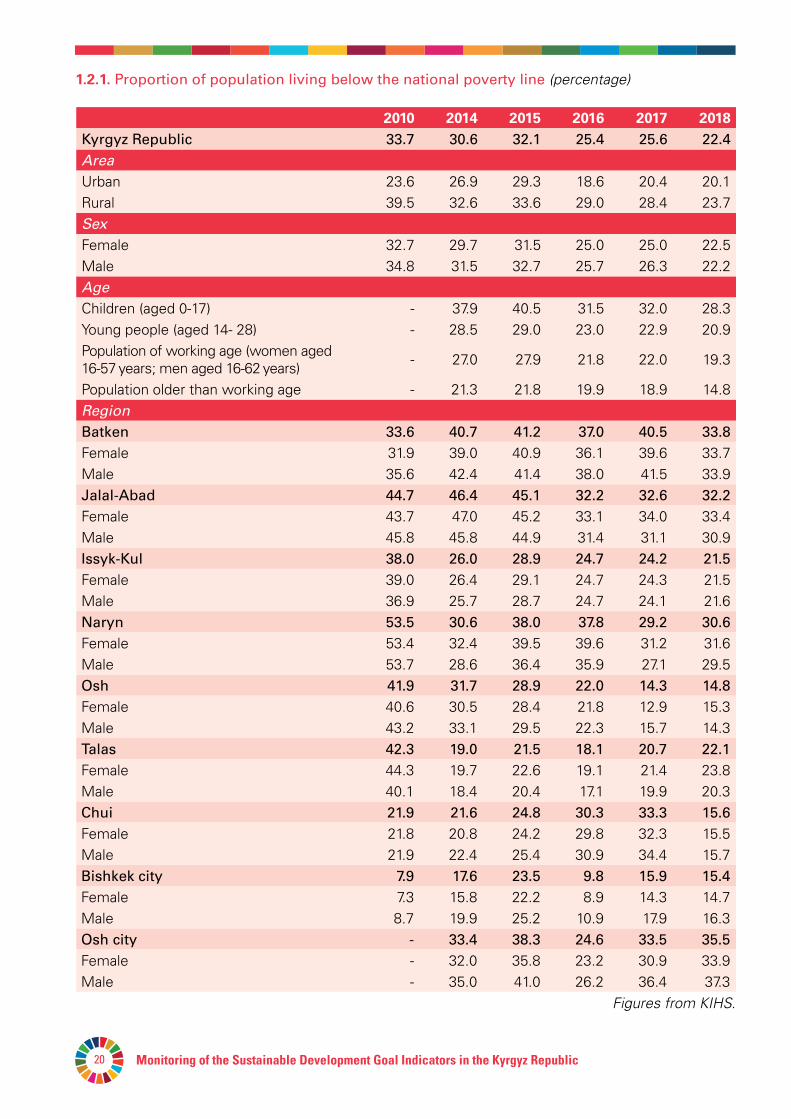
1.2.1. Proportion of population living below the national poverty line (percentage)
2010 2014 2015 2016 2017 2018Kyrgyz Republic 33.7 30.6 32.1 25.4 25.6 22.4AreaUrban 23.6 26.9 29.3 18.6 20.4 20.1Rural 39.5 32.6 33.6 29.0 28.4 23.7SexFemale 32.7 29.7 31.5 25.0 25.0 22.5Male 34.8 31.5 32.7 25.7 26.3 22.2AgeChildren (aged 0-17) - 37.9 40.5 31.5 32.0 28.3Young people (aged 14- 28) - 28.5 29.0 23.0 22.9 20.9Population of working age (women aged 16-57 years; men aged 16-62 years) - 27.0 27.9 21.8 22.0 19.3
Population older than working age - 21.3 21.8 19.9 18.9 14.8Region Batken 33.6 40.7 41.2 37.0 40.5 33.8Female 31.9 39.0 40.9 36.1 39.6 33.7Male 35.6 42.4 41.4 38.0 41.5 33.9Jalal-Abad 44.7 46.4 45.1 32.2 32.6 32.2Female 43.7 47.0 45.2 33.1 34.0 33.4Male 45.8 45.8 44.9 31.4 31.1 30.9Issyk-Kul 38.0 26.0 28.9 24.7 24.2 21.5Female 39.0 26.4 29.1 24.7 24.3 21.5Male 36.9 25.7 28.7 24.7 24.1 21.6Naryn 53.5 30.6 38.0 37.8 29.2 30.6Female 53.4 32.4 39.5 39.6 31.2 31.6Male 53.7 28.6 36.4 35.9 27.1 29.5Osh 41.9 31.7 28.9 22.0 14.3 14.8Female 40.6 30.5 28.4 21.8 12.9 15.3Male 43.2 33.1 29.5 22.3 15.7 14.3Talas 42.3 19.0 21.5 18.1 20.7 22.1Female 44.3 19.7 22.6 19.1 21.4 23.8Male 40.1 18.4 20.4 17.1 19.9 20.3Chui 21.9 21.6 24.8 30.3 33.3 15.6Female 21.8 20.8 24.2 29.8 32.3 15.5Male 21.9 22.4 25.4 30.9 34.4 15.7Bishkek city 7.9 17.6 23.5 9.8 15.9 15.4Female 7.3 15.8 22.2 8.9 14.3 14.7Male 8.7 19.9 25.2 10.9 17.9 16.3Osh city - 33.4 38.3 24.6 33.5 35.5Female - 32.0 35.8 23.2 30.9 33.9Male - 35.0 41.0 26.2 36.4 37.3
Figures from KIHS.
Monitoring of the Sustainable Development Goal Indicators in the Kyrgyz Republic 21Goal 1
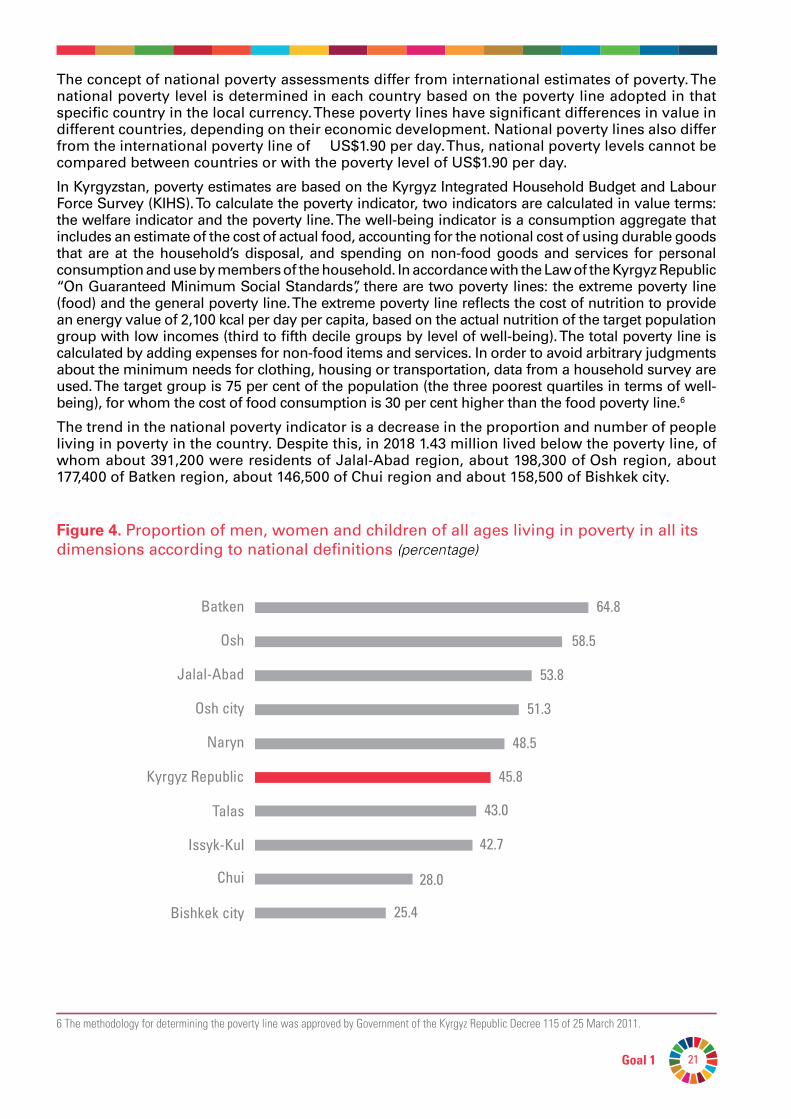
The concept of national poverty assessments differ from international estimates of poverty. The national poverty level is determined in each country based on the poverty line adopted in that specific country in the local currency. These poverty lines have significant differences in value in different countries, depending on their economic development. National poverty lines also differ from the international poverty line of US$1.90 per day. Thus, national poverty levels cannot be compared between countries or with the poverty level of US$1.90 per day.
In Kyrgyzstan, poverty estimates are based on the Kyrgyz Integrated Household Budget and Labour Force Survey (KIHS). To calculate the poverty indicator, two indicators are calculated in value terms: the welfare indicator and the poverty line. The well-being indicator is a consumption aggregate that includes an estimate of the cost of actual food, accounting for the notional cost of using durable goods that are at the household’s disposal, and spending on non-food goods and services for personal consumption and use by members of the household. In accordance with the Law of the Kyrgyz Republic “On Guaranteed Minimum Social Standards”, there are two poverty lines: the extreme poverty line (food) and the general poverty line. The extreme poverty line reflects the cost of nutrition to provide an energy value of 2,100 kcal per day per capita, based on the actual nutrition of the target population group with low incomes (third to fifth decile groups by level of well-being). The total poverty line is calculated by adding expenses for non-food items and services. In order to avoid arbitrary judgments about the minimum needs for clothing, housing or transportation, data from a household survey are used. The target group is 75 per cent of the population (the three poorest quartiles in terms of well-being), for whom the cost of food consumption is 30 per cent higher than the food poverty line.6
The trend in the national poverty indicator is a decrease in the proportion and number of people living in poverty in the country. Despite this, in 2018 1.43 million lived below the poverty line, of whom about 391,200 were residents of Jalal-Abad region, about 198,300 of Osh region, about 177,400 of Batken region, about 146,500 of Chui region and about 158,500 of Bishkek city.
6 The methodology for determining the poverty line was approved by Government of the Kyrgyz Republic Decree 115 of 25 March 2011.
Issyk-Kul 42.7
43.0Talas
45.8Kyrgyz Republic
48.5Naryn
51.3Osh city
53.8Jalal-Abad
58.5Osh
64.8Batken
Bishkek city 25.4
28.0Chui
Figure4.Proportion of men, women and children of all ages living in poverty in all its dimensions according to national definitions (percentage)
Monitoring of the Sustainable Development Goal Indicators in the Kyrgyz Republic22
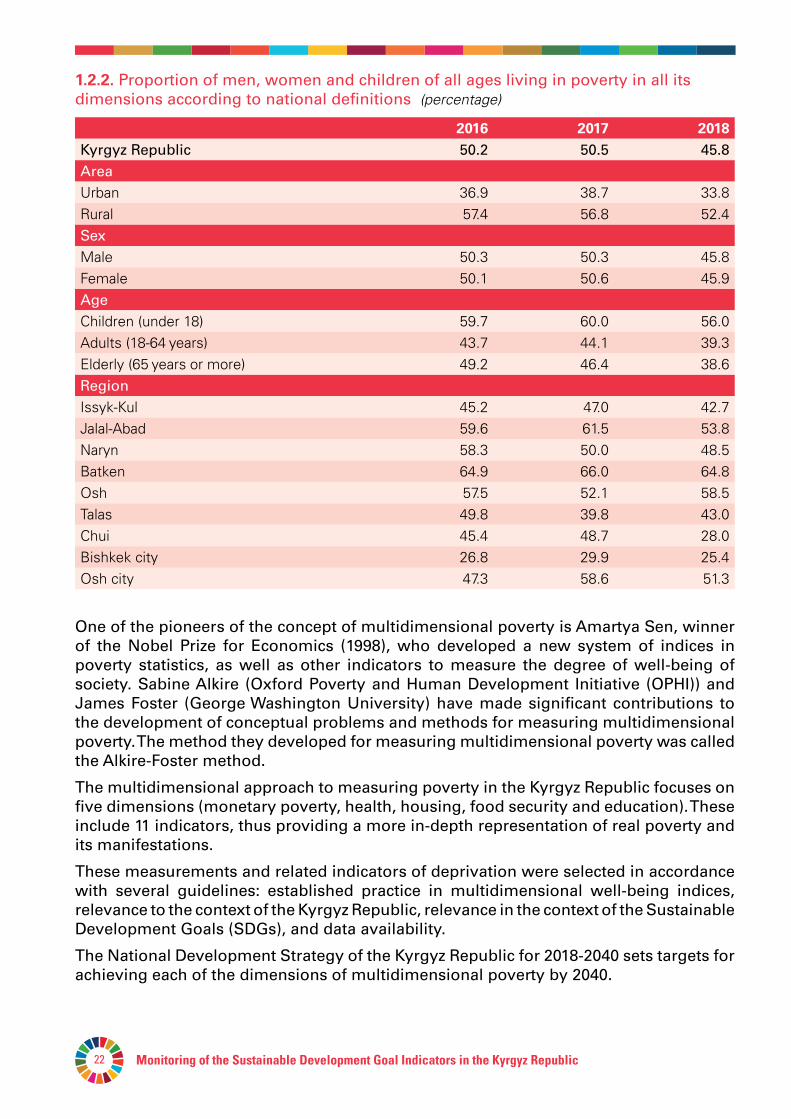
One of the pioneers of the concept of multidimensional poverty is Amartya Sen, winner of the Nobel Prize for Economics (1998), who developed a new system of indices in poverty statistics, as well as other indicators to measure the degree of well-being of society. Sabine Alkire (Oxford Poverty and Human Development Initiative (OPHI)) and James Foster (George Washington University) have made significant contributions to the development of conceptual problems and methods for measuring multidimensional poverty. The method they developed for measuring multidimensional poverty was called the Alkire-Foster method.
The multidimensional approach to measuring poverty in the Kyrgyz Republic focuses on five dimensions (monetary poverty, health, housing, food security and education). These include 11 indicators, thus providing a more in-depth representation of real poverty and its manifestations.
These measurements and related indicators of deprivation were selected in accordance with several guidelines: established practice in multidimensional well-being indices, relevance to the context of the Kyrgyz Republic, relevance in the context of the Sustainable Development Goals (SDGs), and data availability.
The National Development Strategy of the Kyrgyz Republic for 2018-2040 sets targets for achieving each of the dimensions of multidimensional poverty by 2040.
1.2.2. Proportion of men, women and children of all ages living in poverty in all its dimensions according to national definitions (percentage)
2016 2017 2018Kyrgyz Republic 50.2 50.5 45.8Area Urban 36.9 38.7 33.8Rural 57.4 56.8 52.4Sex Male 50.3 50.3 45.8Female 50.1 50.6 45.9Age Children (under 18) 59.7 60.0 56.0Adults (18-64 years) 43.7 44.1 39.3Elderly (65 years or more) 49.2 46.4 38.6Region Issyk-Kul 45.2 47.0 42.7Jalal-Abad 59.6 61.5 53.8Naryn 58.3 50.0 48.5Batken 64.9 66.0 64.8Osh 57.5 52.1 58.5Talas 49.8 39.8 43.0Chui 45.4 48.7 28.0Bishkek city 26.8 29.9 25.4Osh city 47.3 58.6 51.3
Monitoring of the Sustainable Development Goal Indicators in the Kyrgyz Republic 23Goal 1
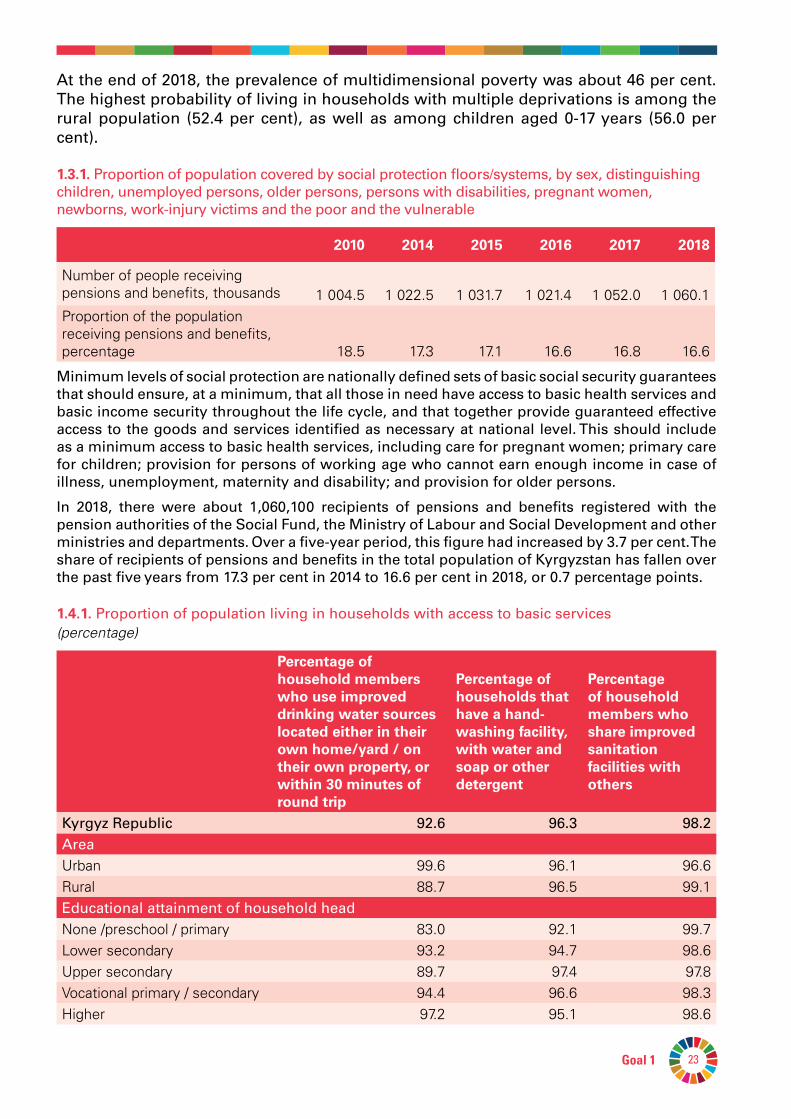
At the end of 2018, the prevalence of multidimensional poverty was about 46 per cent. The highest probability of living in households with multiple deprivations is among the rural population (52.4 per cent), as well as among children aged 0-17 years (56.0 per cent).
1.3.1. Proportion of population covered by social protection floors/systems, by sex, distinguishing children, unemployed persons, older persons, persons with disabilities, pregnant women, newborns, work-injury victims and the poor and the vulnerable
2010 2014 2015 2016 2017 2018
Number of people receiving pensions and benefits, thousands 1 004.5 1 022.5 1 031.7 1 021.4 1 052.0 1 060.1Proportion of the population receiving pensions and benefits, percentage 18.5 17.3 17.1 16.6 16.8 16.6
Minimum levels of social protection are nationally defined sets of basic social security guarantees that should ensure, at a minimum, that all those in need have access to basic health services and basic income security throughout the life cycle, and that together provide guaranteed effective access to the goods and services identified as necessary at national level. This should include as a minimum access to basic health services, including care for pregnant women; primary care for children; provision for persons of working age who cannot earn enough income in case of illness, unemployment, maternity and disability; and provision for older persons.
In 2018, there were about 1,060,100 recipients of pensions and benefits registered with the pension authorities of the Social Fund, the Ministry of Labour and Social Development and other ministries and departments. Over a five-year period, this figure had increased by 3.7 per cent. The share of recipients of pensions and benefits in the total population of Kyrgyzstan has fallen over the past five years from 17.3 per cent in 2014 to 16.6 per cent in 2018, or 0.7 percentage points.
1.4.1. Proportion of population living in households with access to basic services (percentage)
Percentageofhouseholdmemberswhouseimproveddrinkingwatersourceslocatedeitherintheirownhome/yard/ontheirownproperty,orwithin30minutesofroundtrip
Percentageofhouseholdsthathaveahand-washingfacility,withwaterandsoaporotherdetergent
Percentageofhouseholdmemberswhoshareimprovedsanitationfacilitieswithothers
Kyrgyz Republic 92.6 96.3 98.2AreaUrban 99.6 96.1 96.6Rural 88.7 96.5 99.1Educational attainment of household headNone /preschool / primary 83.0 92.1 99.7Lower secondary 93.2 94.7 98.6Upper secondary 89.7 97.4 97.8Vocational primary / secondary 94.4 96.6 98.3Higher 97.2 95.1 98.6
Monitoring of the Sustainable Development Goal Indicators in the Kyrgyz Republic24
Percentageofhouseholdmemberswhouseimproveddrinkingwatersourceslocatedeitherintheirownhome/yard/ontheirownproperty,orwithin30minutesofroundtrip
Percentageofhouseholdsthathaveahand-washingfacility,withwaterandsoaporotherdetergent
Percentageofhouseholdmemberswhoshareimprovedsanitationfacilitieswithothers
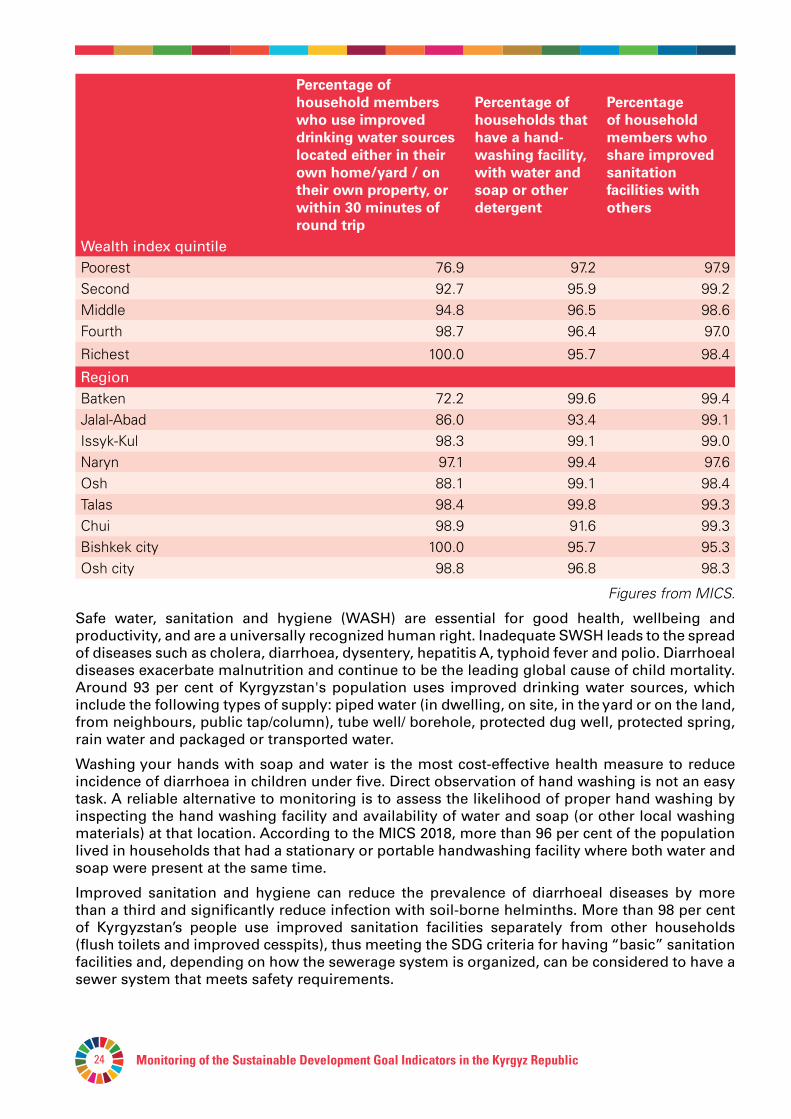
Wealth index quintilePoorest 76.9 97.2 97.9Second 92.7 95.9 99.2Middle 94.8 96.5 98.6Fourth 98.7 96.4 97.0Richest 100.0 95.7 98.4Region Batken 72.2 99.6 99.4Jalal-Abad 86.0 93.4 99.1Issyk-Kul 98.3 99.1 99.0Naryn 97.1 99.4 97.6Osh 88.1 99.1 98.4Talas 98.4 99.8 99.3Chui 98.9 91.6 99.3Bishkek city 100.0 95.7 95.3Osh city 98.8 96.8 98.3
Figures from MICS.
Safe water, sanitation and hygiene (WASH) are essential for good health, wellbeing and productivity, and are a universally recognized human right. Inadequate SWSH leads to the spread of diseases such as cholera, diarrhoea, dysentery, hepatitis A, typhoid fever and polio. Diarrhoeal diseases exacerbate malnutrition and continue to be the leading global cause of child mortality. Around 93 per cent of Kyrgyzstan's population uses improved drinking water sources, which include the following types of supply: piped water (in dwelling, on site, in the yard or on the land, from neighbours, public tap/column), tube well/ borehole, protected dug well, protected spring, rain water and packaged or transported water.
Washing your hands with soap and water is the most cost-effective health measure to reduce incidence of diarrhoea in children under five. Direct observation of hand washing is not an easy task. A reliable alternative to monitoring is to assess the likelihood of proper hand washing by inspecting the hand washing facility and availability of water and soap (or other local washing materials) at that location. According to the MICS 2018, more than 96 per cent of the population lived in households that had a stationary or portable handwashing facility where both water and soap were present at the same time.
Improved sanitation and hygiene can reduce the prevalence of diarrhoeal diseases by more than a third and significantly reduce infection with soil-borne helminths. More than 98 per cent of Kyrgyzstan’s people use improved sanitation facilities separately from other households (flush toilets and improved cesspits), thus meeting the SDG criteria for having “basic” sanitation facilities and, depending on how the sewerage system is organized, can be considered to have a sewer system that meets safety requirements.
Monitoring of the Sustainable Development Goal Indicators in the Kyrgyz Republic 25Goal 1
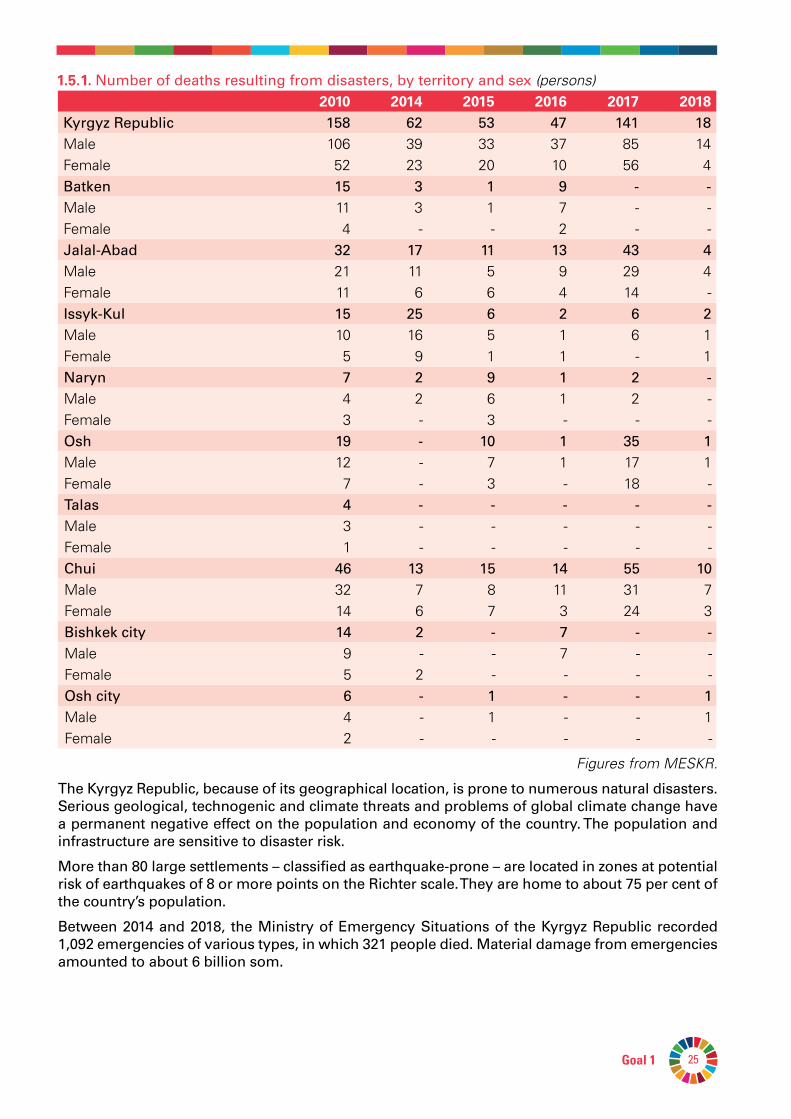
1.5.1.Number of deaths resulting from disasters, by territory and sex (persons)2010 2014 2015 2016 2017 2018
Kyrgyz Republic 158 62 53 47 141 18Male 106 39 33 37 85 14Female 52 23 20 10 56 4Batken 15 3 1 9 - -Male 11 3 1 7 - -Female 4 - - 2 - -Jalal-Abad 32 17 11 13 43 4Male 21 11 5 9 29 4Female 11 6 6 4 14 -Issyk-Kul 15 25 6 2 6 2Male 10 16 5 1 6 1Female 5 9 1 1 - 1Naryn 7 2 9 1 2 -Male 4 2 6 1 2 -Female 3 - 3 - - -Osh 19 - 10 1 35 1Male 12 - 7 1 17 1Female 7 - 3 - 18 -Talas 4 - - - - -Male 3 - - - - -Female 1 - - - - -Chui 46 13 15 14 55 10Male 32 7 8 11 31 7Female 14 6 7 3 24 3Bishkek city 14 2 - 7 - -Male 9 - - 7 - -Female 5 2 - - - -Osh city 6 - 1 - - 1Male 4 - 1 - - 1Female 2 - - - - -
Figures from MESKR.
The Kyrgyz Republic, because of its geographical location, is prone to numerous natural disasters. Serious geological, technogenic and climate threats and problems of global climate change have a permanent negative effect on the population and economy of the country. The population and infrastructure are sensitive to disaster risk.
More than 80 large settlements – classified as earthquake-prone – are located in zones at potential risk of earthquakes of 8 or more points on the Richter scale. They are home to about 75 per cent of the country’s population.
Between 2014 and 2018, the Ministry of Emergency Situations of the Kyrgyz Republic recorded 1,092 emergencies of various types, in which 321 people died. Material damage from emergencies amounted to about 6 billion som.
Monitoring of the Sustainable Development Goal Indicators in the Kyrgyz Republic26
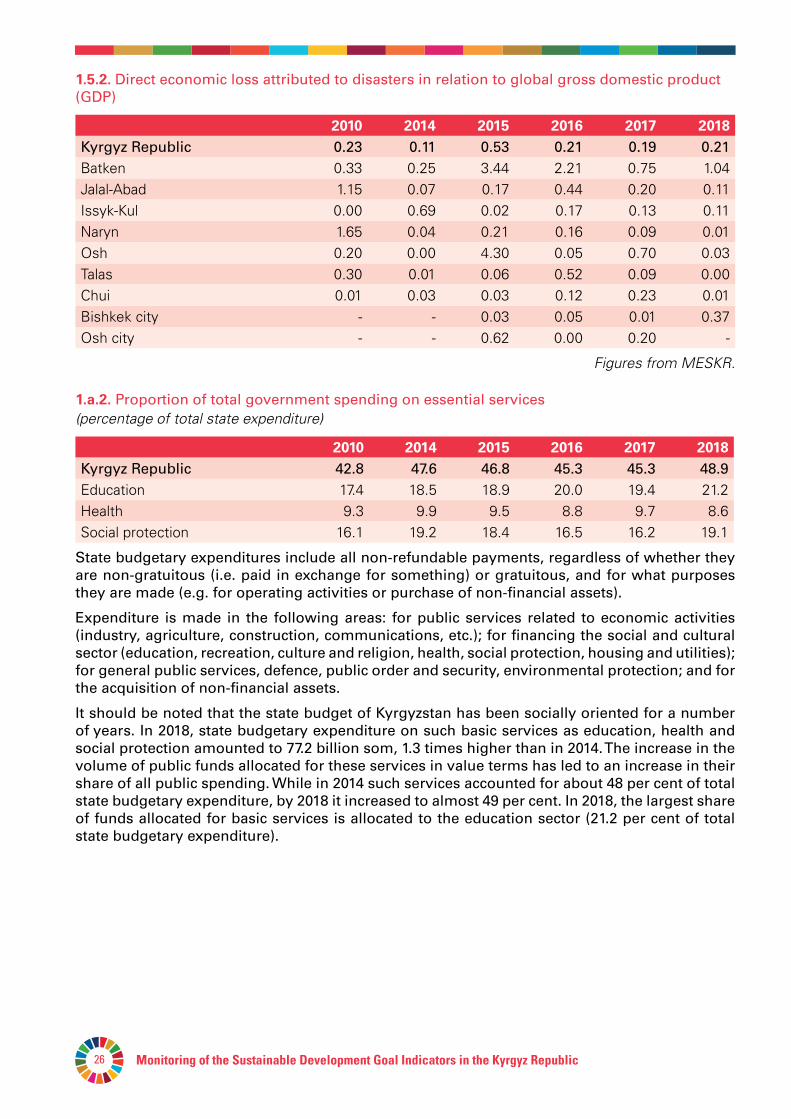
1.5.2.Direct economic loss attributed to disasters in relation to global gross domestic product (GDP)
2010 2014 2015 2016 2017 2018Kyrgyz Republic 0.23 0.11 0.53 0.21 0.19 0.21Batken 0.33 0.25 3.44 2.21 0.75 1.04Jalal-Abad 1.15 0.07 0.17 0.44 0.20 0.11Issyk-Kul 0.00 0.69 0.02 0.17 0.13 0.11Naryn 1.65 0.04 0.21 0.16 0.09 0.01Osh 0.20 0.00 4.30 0.05 0.70 0.03Talas 0.30 0.01 0.06 0.52 0.09 0.00Chui 0.01 0.03 0.03 0.12 0.23 0.01Bishkek city - - 0.03 0.05 0.01 0.37Osh city - - 0.62 0.00 0.20 -
Figures from MESKR.
1.a.2. Proportion of total government spending on essential services (percentage of total state expenditure)
2010 2014 2015 2016 2017 2018Kyrgyz Republic 42.8 47.6 46.8 45.3 45.3 48.9Education 17.4 18.5 18.9 20.0 19.4 21.2Health 9.3 9.9 9.5 8.8 9.7 8.6Social protection 16.1 19.2 18.4 16.5 16.2 19.1
State budgetary expenditures include all non-refundable payments, regardless of whether they are non-gratuitous (i.e. paid in exchange for something) or gratuitous, and for what purposes they are made (e.g. for operating activities or purchase of non-financial assets).
Expenditure is made in the following areas: for public services related to economic activities (industry, agriculture, construction, communications, etc.); for financing the social and cultural sector (education, recreation, culture and religion, health, social protection, housing and utilities); for general public services, defence, public order and security, environmental protection; and for the acquisition of non-financial assets.
It should be noted that the state budget of Kyrgyzstan has been socially oriented for a number of years. In 2018, state budgetary expenditure on such basic services as education, health and social protection amounted to 77.2 billion som, 1.3 times higher than in 2014. The increase in the volume of public funds allocated for these services in value terms has led to an increase in their share of all public spending. While in 2014 such services accounted for about 48 per cent of total state budgetary expenditure, by 2018 it increased to almost 49 per cent. In 2018, the largest share of funds allocated for basic services is allocated to the education sector (21.2 per cent of total state budgetary expenditure).
27Goal 2Monitoring of the Sustainable Development Goal Indicators in the Kyrgyz Republic
NSC figures for 2018
NUTRITION
END HUNGER, ACHIEVE FOOD SECURITY AND IMPROVED NUTRITION AND PROMOTE SUSTAINABLE AGRICULTURE
Facts and figures from the Kyrgyz Republic
ZEROHUNGER
46.4% of the population
Less than
is SHORT
PROPORTIONOF THE POPULATION
WITH INSUFFICIENTCALORIE INTAKE
PROPORTION OF CHILDREN
HIGHEST
Osh cityTalas region 70.1%
LOWEST
36.1%
2.0% 6.9%
Every 8th child
under 5 years of age
for the child’s
age
2,100 kcalper day
under5 years
of age
who are wasted who are overweight
Monitoring of the Sustainable Development Goal Indicators in the Kyrgyz Republic28
NSC figures for 2018
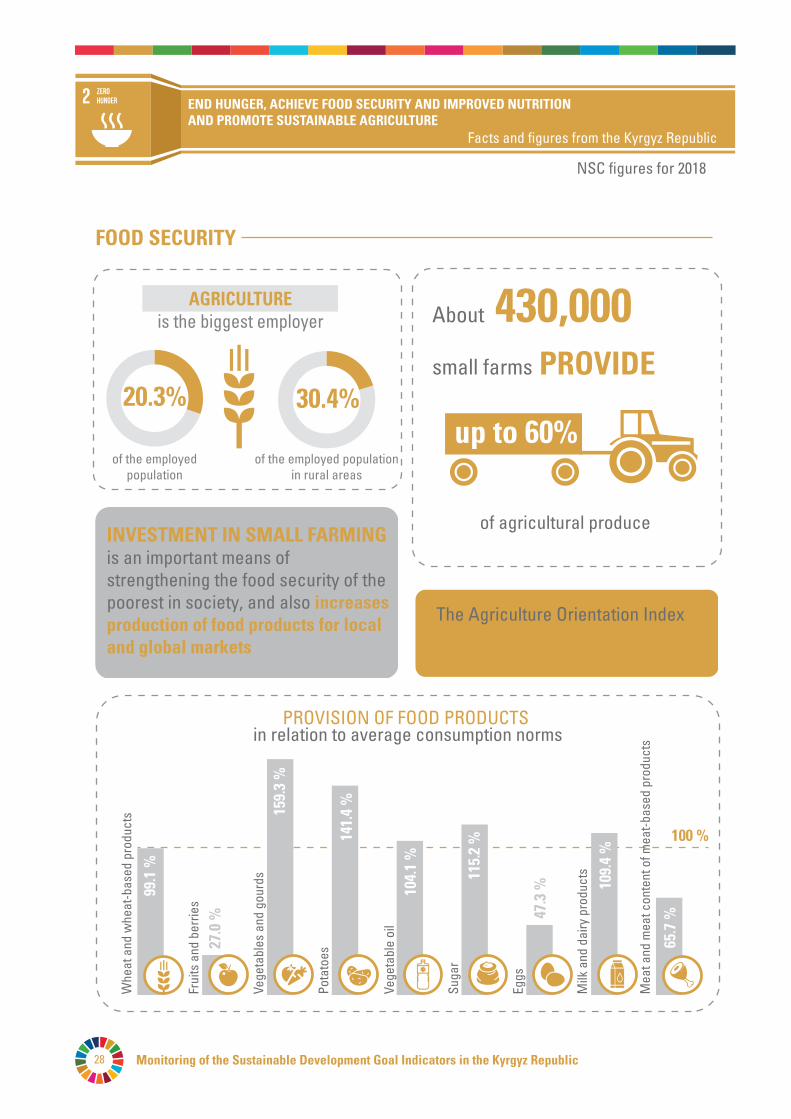
INVESTMENT IN SMALL FARMING is an important means of strengthening the food security of the poorest in society, and also increases production of food products for local and global markets
The Agriculture Orientation Index has remained low in Kyrgyzstan for the past decade
of agricultural produce
430,000 small farms
About
up to 60%
PROVIDE
AGRICULTUREis the biggest employer
of the employedpopulation
of the employed populationin rural areas
20.3% 30.4%
in relation to average consumption norms
FOOD SECURITY
PROVISION OF FOOD PRODUCTS
99.1
%
27.0
%
Whe
at a
nd w
heat
-bas
ed p
rodu
cts
Frui
ts a
nd b
errie
s
159.
3 %
Vege
tabl
es a
nd g
ourd
s
141.
4 %
Pota
toes
Vege
tabl
e oi
l
104.
1 %
115.
2 %
Suga
r
47.3
%
100 %
Eggs
109.
4 %
Milk
and
dai
ry p
rodu
cts
65.7
%
Mea
t and
mea
t con
tent
of m
eat-
base
d pr
oduc
ts
END HUNGER, ACHIEVE FOOD SECURITY AND IMPROVED NUTRITION AND PROMOTE SUSTAINABLE AGRICULTURE
Facts and figures from the Kyrgyz Republic
ZEROHUNGER
Monitoring of the Sustainable Development Goal Indicators in the Kyrgyz Republic 29Goal 2
GOAL2.ENDHUNGER,ACHIEVEFOODSECURITYANDIMPROVEDNUTRITIONANDPROMOTESUSTAINABLEAGRICULTURE
It is time to rethink our approaches to how we grow, distribute and consume food. Under ideal conditions, agriculture, forestry and fisheries can provide adequate nutrition for all and generate an adequate level of income, while supporting the interests of the population in a context of agricultural development and environmental protection measures.But at present, our land, freshwater resources, oceans, forests and biological diversity are rapidly being depleted and degraded. Climate change is putting increasing pressure on the resources on which we depend. The food production and agriculture sector offers key development solutions that are core factors in both the eradication of hunger and the fight against poverty.
Targets:2.1 By 2030, end hunger and ensure access by all people, in particular the poor and people in
vulnerable situations, including infants, to safe, nutritious and sufficient food all year round. 2.2 By 2030, end all forms of malnutrition, including achieving, by 2025, the internationally
agreed targets on stunting and wasting in children under 5 years of age, and address the nutritional needs of adolescent girls, pregnant and lactating women and older persons.
2.3 By 2030, double the agricultural productivity and incomes of small-scale food producers, in particular women, indigenous peoples, family farmers, pastoralists and fishers, including through secure and equal access to land, other productive resources and inputs, knowledge, financial services, markets and opportunities for value addition and farm employment.
2.4 By 2030, ensure sustainable food production systems and implement resilient agricultural practices that increase productivity and production, that help maintain ecosystems, that strengthen capacity for adaptation to climate change, extreme weather, drought, flooding and other disasters and that progressively improve land and soil quality.
2.5 By 2020, maintain the genetic diversity of seeds, cultivated plants and farmed and domesticated animals and their related wild species, including through soundly managed and diversified seed and plant banks at the national, regional and international levels, and promote access to and fair and equitable sharing of benefits arising from the utilization of genetic resources and associated traditional knowledge, as internationally agreed.
2.a. Increase investment, including through enhanced international cooperation, in rural infrastructure, agricultural research and extension services, technology development and plant and livestock gene banks in order to enhance agricultural productive capacity in developing countries, in particular least developed countries.
2.b. Correct and prevent trade restrictions and distortions in world agricultural markets, including through the parallel elimination of all forms of agricultural export subsidies and all export measures with equivalent effect, in accordance with the mandate of the Doha Development Round.
2.c Adopt measures to ensure the proper functioning of food commodity markets and their derivatives and facilitate timely access to market information, including on food reserves, in order to help limit extreme food price volatility.
Monitoring of the Sustainable Development Goal Indicators in the Kyrgyz Republic30
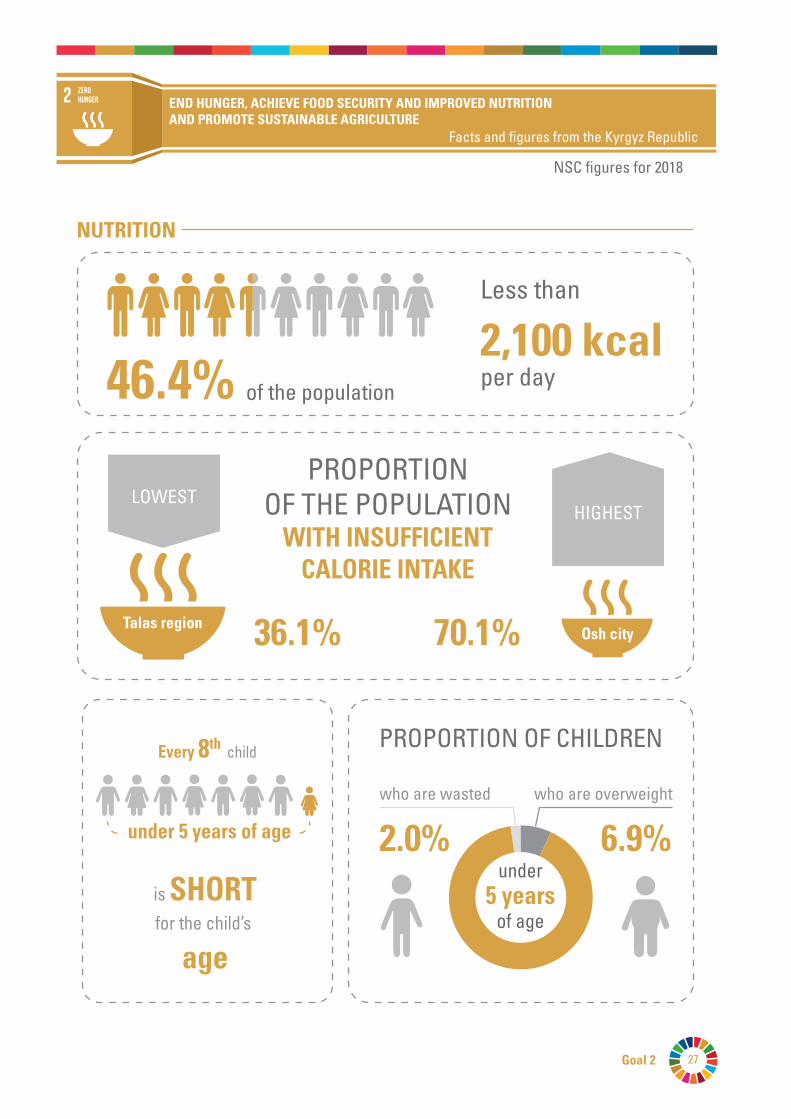
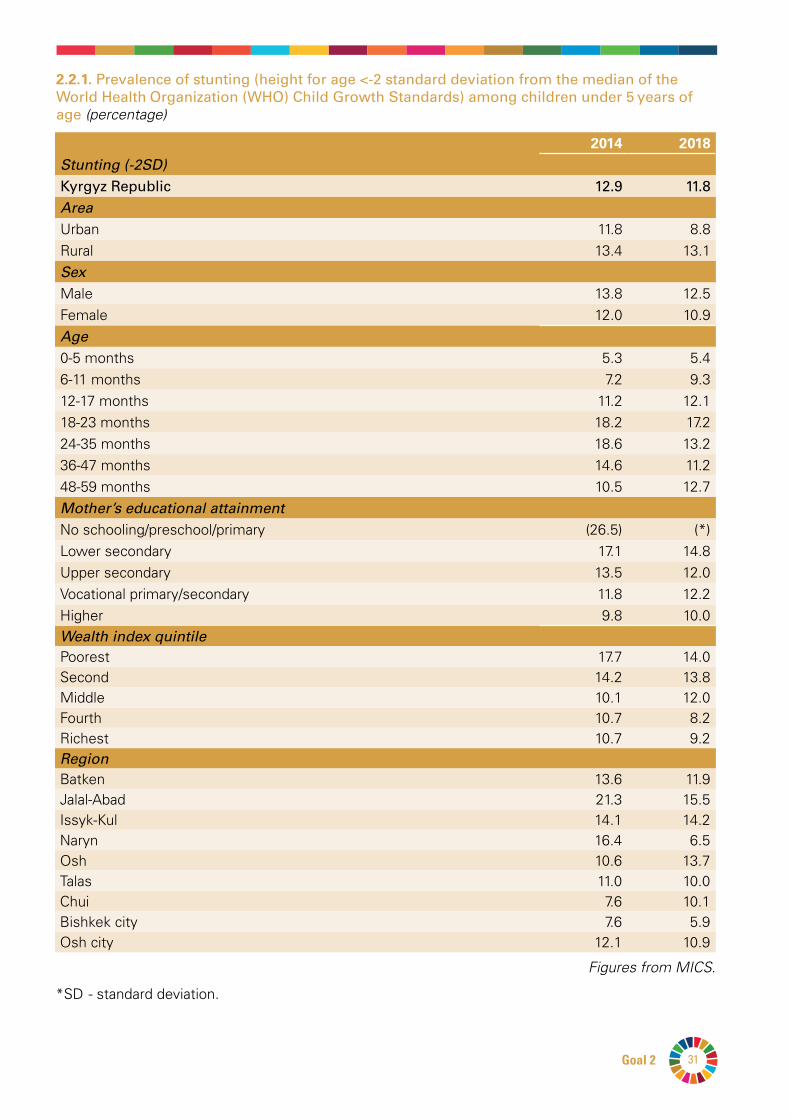
2.1.1. Prevalence of undernourishment (proportion of the population consuming less than 2,100 kcal per day, percentage)
2010 2014 2015 2016 2017 2018Kyrgyz Republic 42.3 47.9 51.0 45.6 50.0 46.4AreaUrban 44.5 53.0 58.5 48.7 55.5 51.6Rural 41.1 45.1 46.8 43.9 47.0 43.5Region Batken 42.7 53.6 49.8 53.0 52.5 54.6Jalal-Abad 45.6 54.8 55.9 48.2 41.2 44.0Issyk-Kul 43.5 42.6 46.3 45.0 51.8 49.4Naryn 54.0 54.1 50.0 52.6 41.3 42.5Osh 46.27 33.1 37.9 39.4 42.8 41.5Talas 38.1 27.4 28.7 27.4 34.9 36.1Chui 30.9 51.0 52.4 43.6 58.4 41.2Bishkek city 39.8 54.0 65.2 49.2 60.3 51.8Osh city … 67.2 67.7 54.4 72.2 70.1
Figures from KIHS.
The prevalence of undernourishment (PoU) is an estimate of the proportion of the population whose normal food intake is insufficient to meet the need for dietary energy needed to maintain a normal, active, and healthy life. Undernourishment is defined as a condition in which a person does not have regular access to an amount of food that is sufficient to provide him or her with the energy necessary to lead a normal, healthy and active life, taking into account his or her own needs for energy coming from food, which directly depend on the person's gender, age, employment, height and weight.
Kyrgyzstan, like many other countries, uses 2,100 kcal as a threshold value, which is the average minimum value in the world. FAO experts believe this is an inflated value for the population of Kyrgyzstan, and, consequently, indicator 2.1.1. describes the proportion of the population consuming less than 2,100 kcal per day rather than prevalence of undernourishment.
7 Including Osh city
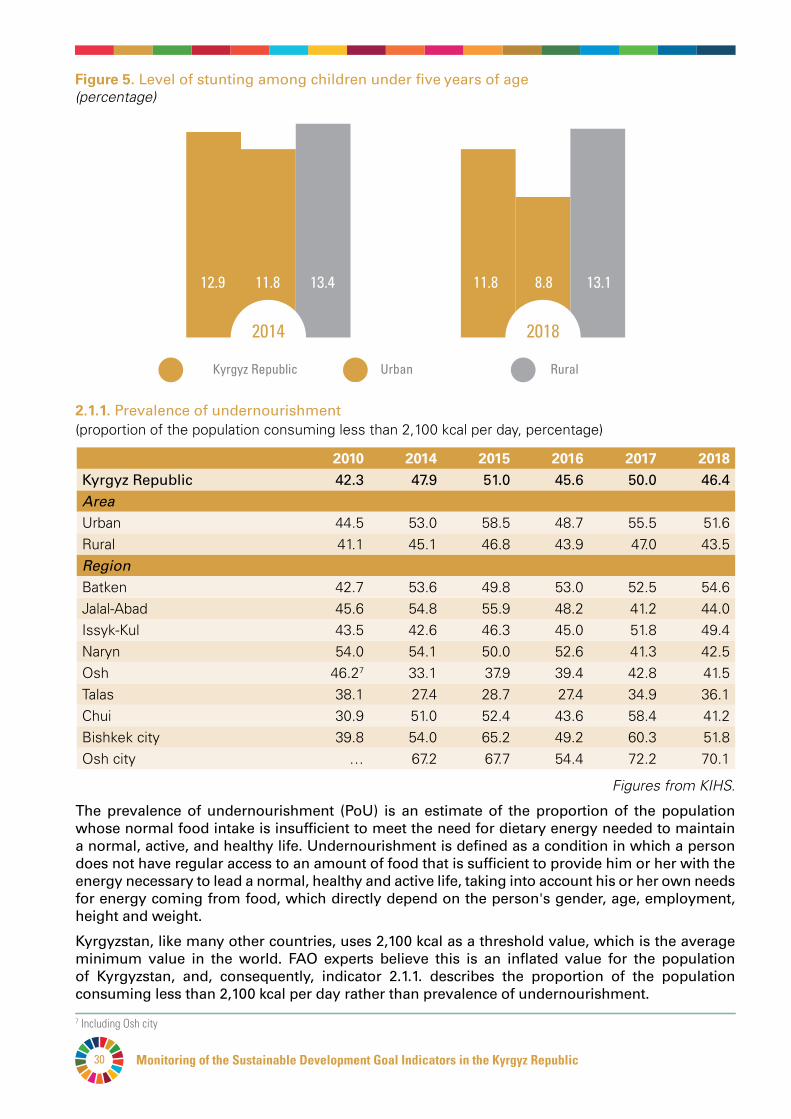
Figure5. Level of stunting among children under five years of age (percentage)
2014
12.9 11.811.8 8.813.4 13.1
2018
Urban RuralKyrgyz Republic
Monitoring of the Sustainable Development Goal Indicators in the Kyrgyz Republic 31Goal 2
2.2.1. Prevalence of stunting (height for age <-2 standard deviation from the median of the World Health Organization (WHO) Child Growth Standards) among children under 5 years of age (percentage)
2014 2018Stunting (-2SD)Kyrgyz Republic 12.9 11.8Area Urban 11.8 8.8Rural 13.4 13.1SexMale 13.8 12.5Female 12.0 10.9Age0-5 months 5.3 5.46-11 months 7.2 9.312-17 months 11.2 12.118-23 months 18.2 17.224-35 months 18.6 13.236-47 months 14.6 11.248-59 months 10.5 12.7Mother’s educational attainmentNo schooling/preschool/primary (26.5) (*)Lower secondary 17.1 14.8Upper secondary 13.5 12.0Vocational primary/secondary 11.8 12.2Higher 9.8 10.0Wealth index quintilePoorest 17.7 14.0Second 14.2 13.8Middle 10.1 12.0Fourth 10.7 8.2Richest 10.7 9.2Region Batken 13.6 11.9Jalal-Abad 21.3 15.5Issyk-Kul 14.1 14.2Naryn 16.4 6.5Osh 10.6 13.7Talas 11.0 10.0Chui 7.6 10.1Bishkek city 7.6 5.9Osh city 12.1 10.9
Figures from MICS.
*SD - standard deviation.
Monitoring of the Sustainable Development Goal Indicators in the Kyrgyz Republic32
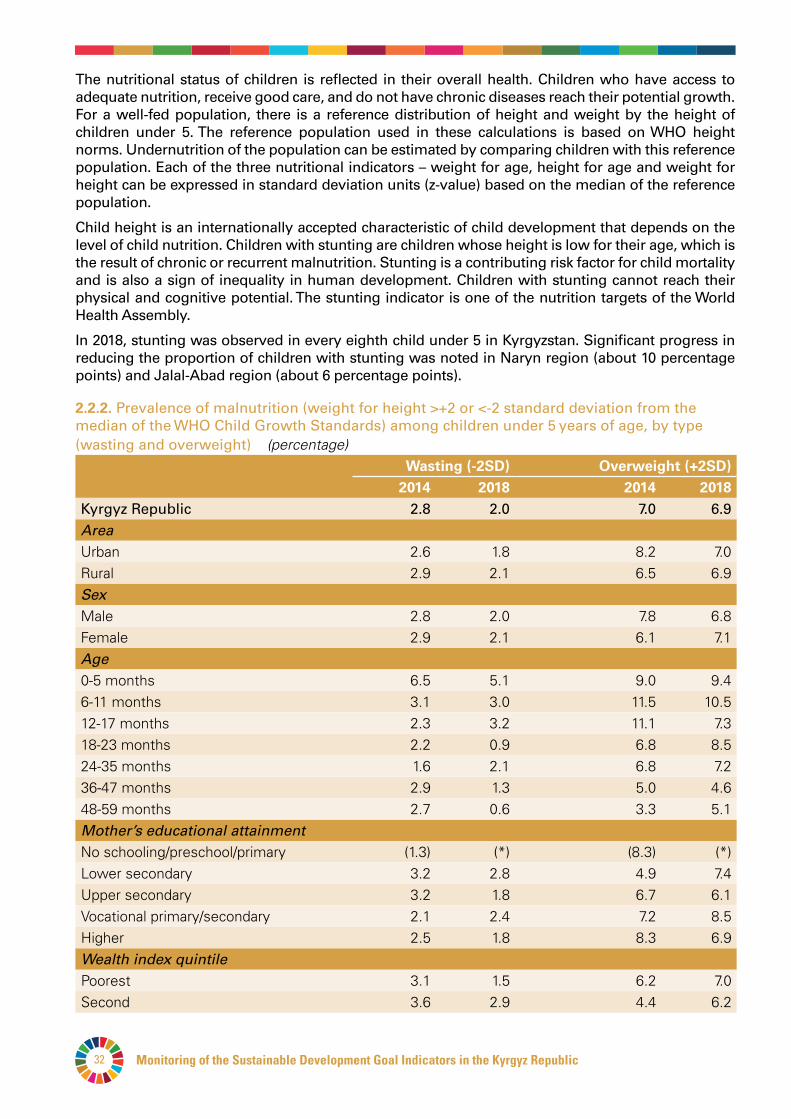
The nutritional status of children is reflected in their overall health. Children who have access to adequate nutrition, receive good care, and do not have chronic diseases reach their potential growth. For a well-fed population, there is a reference distribution of height and weight by the height of children under 5. The reference population used in these calculations is based on WHO height norms. Undernutrition of the population can be estimated by comparing children with this reference population. Each of the three nutritional indicators – weight for age, height for age and weight for height can be expressed in standard deviation units (z-value) based on the median of the reference population.
Child height is an internationally accepted characteristic of child development that depends on the level of child nutrition. Children with stunting are children whose height is low for their age, which is the result of chronic or recurrent malnutrition. Stunting is a contributing risk factor for child mortality and is also a sign of inequality in human development. Children with stunting cannot reach their physical and cognitive potential. The stunting indicator is one of the nutrition targets of the World Health Assembly.
In 2018, stunting was observed in every eighth child under 5 in Kyrgyzstan. Significant progress in reducing the proportion of children with stunting was noted in Naryn region (about 10 percentage points) and Jalal-Abad region (about 6 percentage points).
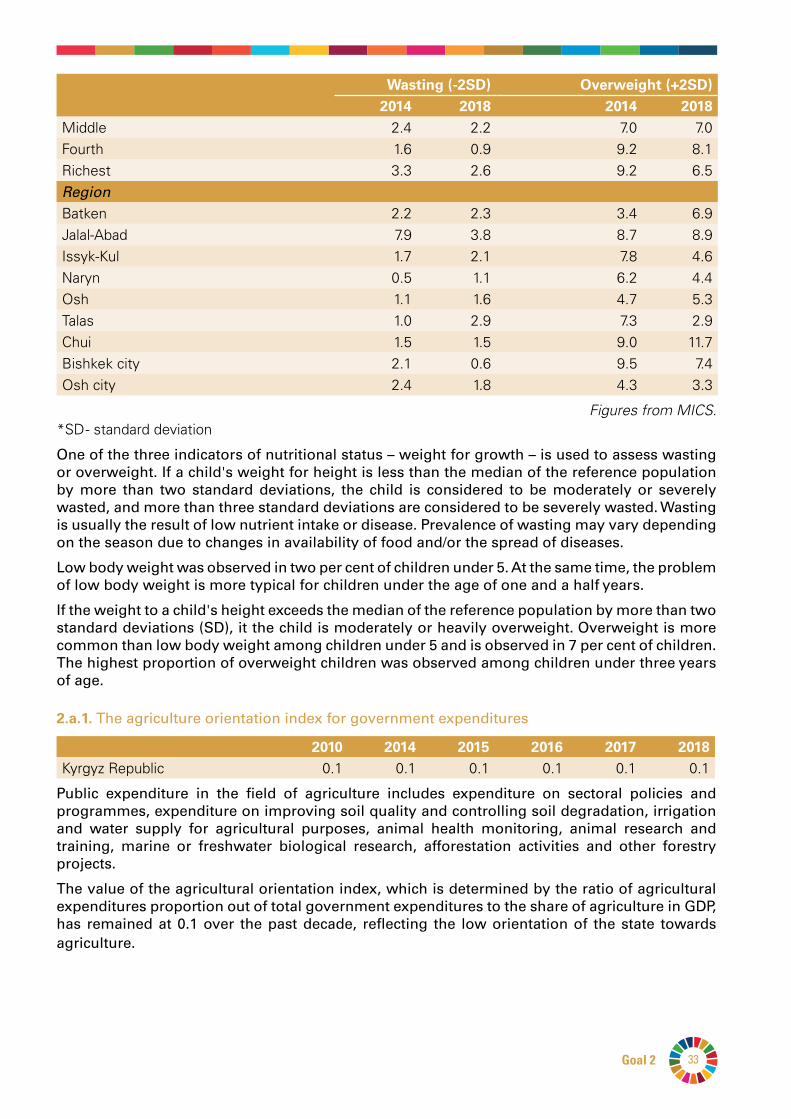
2.2.2. Prevalence of malnutrition (weight for height >+2 or <-2 standard deviation from the median of the WHO Child Growth Standards) among children under 5 years of age, by type (wasting and overweight) (percentage)
Wasting(-2SD) Overweight(+2SD)2014 2018 2014 2018
Kyrgyz Republic 2.8 2.0 7.0 6.9Area Urban 2.6 1.8 8.2 7.0Rural 2.9 2.1 6.5 6.9SexMale 2.8 2.0 7.8 6.8Female 2.9 2.1 6.1 7.1Age0-5 months 6.5 5.1 9.0 9.46-11 months 3.1 3.0 11.5 10.512-17 months 2.3 3.2 11.1 7.318-23 months 2.2 0.9 6.8 8.524-35 months 1.6 2.1 6.8 7.236-47 months 2.9 1.3 5.0 4.648-59 months 2.7 0.6 3.3 5.1Mother’s educational attainmentNo schooling/preschool/primary (1.3) (*) (8.3) (*)Lower secondary 3.2 2.8 4.9 7.4Upper secondary 3.2 1.8 6.7 6.1Vocational primary/secondary 2.1 2.4 7.2 8.5Higher 2.5 1.8 8.3 6.9Wealth index quintilePoorest 3.1 1.5 6.2 7.0Second 3.6 2.9 4.4 6.2
Monitoring of the Sustainable Development Goal Indicators in the Kyrgyz Republic 33Goal 2
Wasting(-2SD) Overweight(+2SD)2014 2018 2014 2018
Middle 2.4 2.2 7.0 7.0Fourth 1.6 0.9 9.2 8.1Richest 3.3 2.6 9.2 6.5Region Batken 2.2 2.3 3.4 6.9Jalal-Abad 7.9 3.8 8.7 8.9Issyk-Kul 1.7 2.1 7.8 4.6Naryn 0.5 1.1 6.2 4.4Osh 1.1 1.6 4.7 5.3Talas 1.0 2.9 7.3 2.9Chui 1.5 1.5 9.0 11.7Bishkek city 2.1 0.6 9.5 7.4Osh city 2.4 1.8 4.3 3.3
Figures from MICS.*SD - standard deviation One of the three indicators of nutritional status – weight for growth – is used to assess wasting or overweight. If a child's weight for height is less than the median of the reference population by more than two standard deviations, the child is considered to be moderately or severely wasted, and more than three standard deviations are considered to be severely wasted. Wasting is usually the result of low nutrient intake or disease. Prevalence of wasting may vary depending on the season due to changes in availability of food and/or the spread of diseases.
Low body weight was observed in two per cent of children under 5. At the same time, the problem of low body weight is more typical for children under the age of one and a half years.
If the weight to a child's height exceeds the median of the reference population by more than two standard deviations (SD), it the child is moderately or heavily overweight. Overweight is more common than low body weight among children under 5 and is observed in 7 per cent of children. The highest proportion of overweight children was observed among children under three years of age.
2.a.1.The agriculture orientation index for government expenditures
2010 2014 2015 2016 2017 2018Kyrgyz Republic 0.1 0.1 0.1 0.1 0.1 0.1
Public expenditure in the field of agriculture includes expenditure on sectoral policies and programmes, expenditure on improving soil quality and controlling soil degradation, irrigation and water supply for agricultural purposes, animal health monitoring, animal research and training, marine or freshwater biological research, afforestation activities and other forestry projects.
The value of the agricultural orientation index, which is determined by the ratio of agricultural expenditures proportion out of total government expenditures to the share of agriculture in GDP, has remained at 0.1 over the past decade, reflecting the low orientation of the state towards agriculture.
Monitoring of the Sustainable Development Goal Indicators in the Kyrgyz Republic34
NSC figures for 2018
ENSURE HEALTHY LIVES AND PROMOTE WELL-BEING FOR ALL AT ALL AGES
Facts and figures from the Kyrgyz Republic
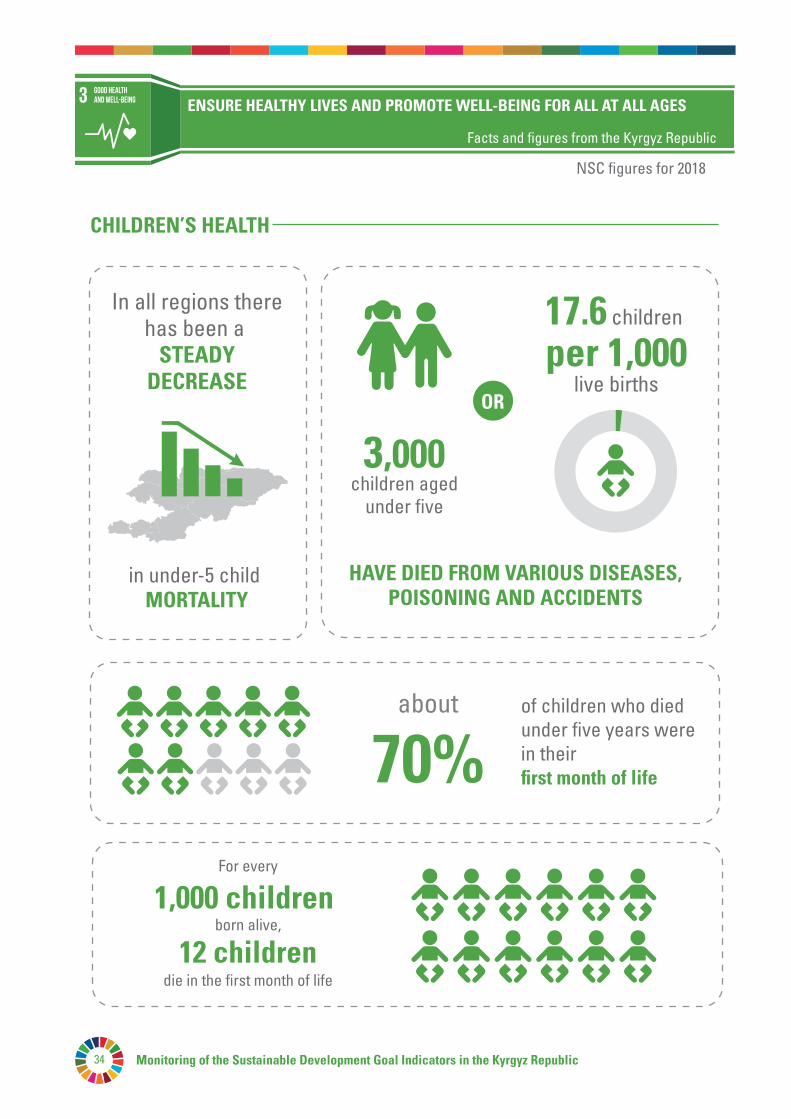
GOOD HEALTHAND WELL-BEING
CHILDREN’S HEALTH
For every
HAVE DIED FROM VARIOUS DISEASES,POISONING AND ACCIDENTS
of children who died under five years were in their first month of life
In all regions therehas been a
STEADYDECREASE
3,000children aged
under five
17.6 children
per 1,000live births
OR
about
70%
in under-5 child MORTALITY
die in the first month of life
1,000 childrenborn alive,
12 children

Monitoring of the Sustainable Development Goal Indicators in the Kyrgyz Republic 35Goal 3
NSC figures for 2018
MATERNAL HEALTH
for every 100,000 live births
MATERNAL MORTALITY
has fallen to
are attended by qualified specialists
99.3%of births
ANTENATAL CARE had 4 or more visits
HIV and AIDS, malaria and other diseases
820people
have beenidentified with HIV
among men are
twice as highas among women
new casesof HIV infection
Were at the fourth stage of HIV infection
At the end of 2018, there were
6,379 peopleRegistered with the Republican AIDS Centre
as living with HIV
of them
422 people
every day
14 people
IN THE LAST FIVE YEARS FERTILITY HAS FALLEN
newborns per 1,000 girls and women
28.6deaths 99.8% 94.3%
among mothers aged 15-19 years it has reduced
of whom
from43 to 36
TUBERCULOSIS MORBIDITYper 100,000 population
69 97
ENSURE HEALTHY LIVES AND PROMOTE WELL-BEING FOR ALL AT ALL AGES
Facts and figures from the Kyrgyz Republic
GOOD HEALTHAND WELL-BEING
contract tuberculosis
Monitoring of the Sustainable Development Goal Indicators in the Kyrgyz Republic36
GOAL3.ENSUREHEALTHYLIVESANDPROMOTEWELL-BEINGFORALLATALLAGES
Ensuring a healthy lifestyle and promoting wellbeing for all at all ages are important components of sustainable development.
Important measures have been taken to increase life expectancy and combat common causes of maternal and child mortality. However, to achieve the goal of reducing the global maternal mortality ratio to less than 70 cases per 100,000 live births, it will be necessary to improve the provision of health services in this area.
The goal of reducing premature deaths from non-communicable diseases by a third through prevention and treatment and maintaining mental health and wellbeing requires the introduction of technologies to reduce the use of harmful substances in cooking and strengthen tobacco control measures.
Much more effort is needed to fully eradicate a wide range of diseases and address the many and varied new and long-standing health problems. There is a need to strengthen funding for areas such as sanitation and hygiene, access to health services, education to combat air pollution, which will help save millions of lives.
Targets:3.1 By 2030, reduce the global maternal mortality ratio to less than 70 per 100,000 live births. 3.2 By 2030, end preventable deaths of newborns and children under 5 years of age, with all
countries aiming to reduce the neonatal mortality to at least as low as 12 per 1,000 live births and the under-5 mortality rate to at least as low as 25 per 1,000 live births.
3.3 By 2030, end the epidemics of AIDS, tuberculosis, malaria and neglected tropical diseases and combat hepatitis, water-borne diseases and other communicable diseases.
3.4 By 2030, reduce by one third premature mortality from non-communicable diseases through prevention and treatment, and promote mental health and well-being.
3.5 Strengthen the prevention and treatment of substance abuse, including narcotic drug abuse and the harmful use of alcohol.
3.6 By 2020, halve the number of global deaths and injuries from road traffic accidents. 3.7 By 2030, ensure universal access to sexual and reproductive health-care services, including
for family planning, information and education, and the integrate of reproductive health into national strategies and programmes.
3.8 Achieve universal health coverage, including financial risk protection, access to quality essential health-care services and access to safe, effective, quality and affordable essential medicines and vaccines for all.
3.9 By 2030, substantially reduce the number of deaths and illnesses from hazardous chemicals and air, water and soil pollution and contamination.
3.a. Strengthen the implementation of the World Health Organization Framework Convention on Tobacco Control in all countries, as appropriate.
3.b. Support the research and development of vaccines and medicines for the communicable and non-communicable diseases that primarily affect developing countries, and provide access to affordable essential medicines and vaccines, in accordance with the Doha Declaration
Monitoring of the Sustainable Development Goal Indicators in the Kyrgyz Republic 37Goal 3
on the TRIPS Agreement and Public Health, which affirms the right of developing countries to use, to the full, the provisions in the Agreement on Trade-Related Aspects of Intellectual Property Rights regarding flexibilities to protect public health, and, in particular, provide access to medicines for all.
3.c Substantially increase health financing and the recruitment, development, training and retention of the health workforce in developing countries, especially in least developed countries and small island developing States.
3.d Strengthen the capacity of all countries, in particular developing countries, for early warning, risk reduction and management of national and global health risks.
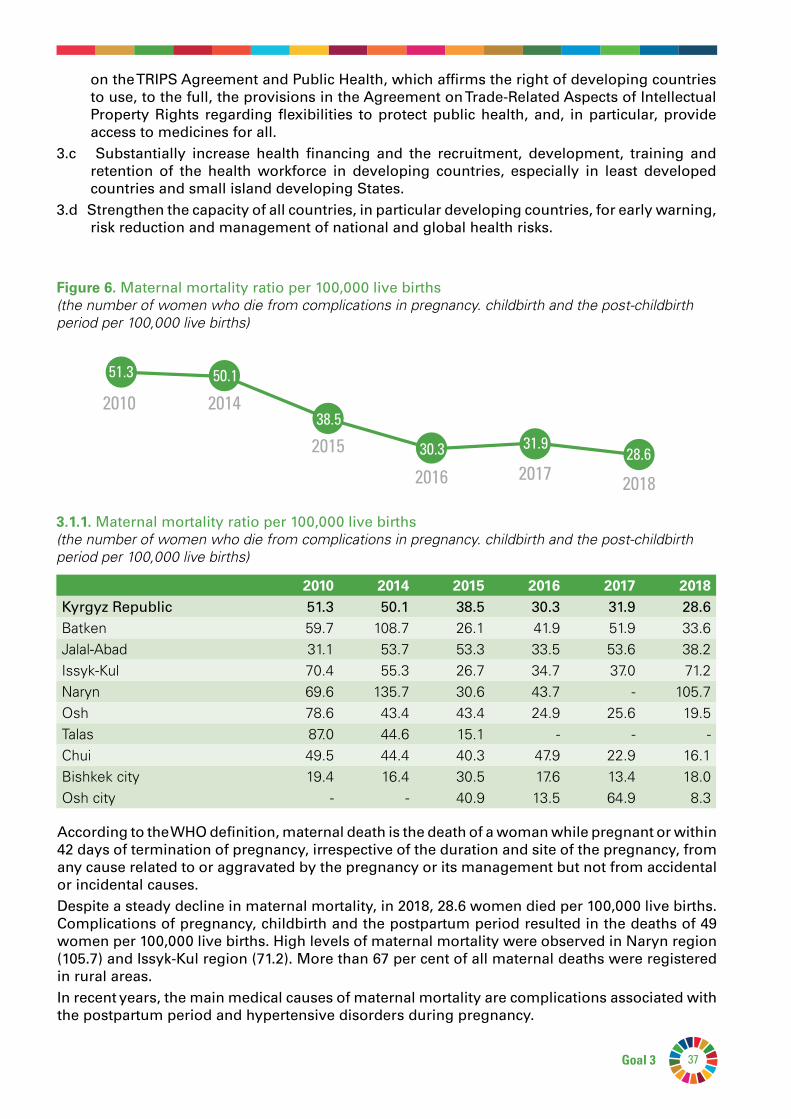
Figure6. Maternal mortality ratio per 100,000 live births(the number of women who die from complications in pregnancy. childbirth and the post-childbirth period per 100,000 live births)
2010 2014
2015
2016 2017 2018
51.3 50.1
38.5
30.3 31.928.6
3.1.1. Maternal mortality ratio per 100,000 live births(the number of women who die from complications in pregnancy. childbirth and the post-childbirth period per 100,000 live births)
2010 2014 2015 2016 2017 2018Kyrgyz Republic 51.3 50.1 38.5 30.3 31.9 28.6Batken 59.7 108.7 26.1 41.9 51.9 33.6Jalal-Abad 31.1 53.7 53.3 33.5 53.6 38.2Issyk-Kul 70.4 55.3 26.7 34.7 37.0 71.2Naryn 69.6 135.7 30.6 43.7 - 105.7Osh 78.6 43.4 43.4 24.9 25.6 19.5Talas 87.0 44.6 15.1 - - -Chui 49.5 44.4 40.3 47.9 22.9 16.1Bishkek city 19.4 16.4 30.5 17.6 13.4 18.0Osh city - - 40.9 13.5 64.9 8.3
According to the WHO definition, maternal death is the death of a woman while pregnant or within 42 days of termination of pregnancy, irrespective of the duration and site of the pregnancy, from any cause related to or aggravated by the pregnancy or its management but not from accidental or incidental causes.Despite a steady decline in maternal mortality, in 2018, 28.6 women died per 100,000 live births. Complications of pregnancy, childbirth and the postpartum period resulted in the deaths of 49 women per 100,000 live births. High levels of maternal mortality were observed in Naryn region (105.7) and Issyk-Kul region (71.2). More than 67 per cent of all maternal deaths were registered in rural areas.In recent years, the main medical causes of maternal mortality are complications associated with the postpartum period and hypertensive disorders during pregnancy.

Monitoring of the Sustainable Development Goal Indicators in the Kyrgyz Republic38
3.1.2.Proportion of births attended, by skilled health personnel (percentage)
2010 2014 2015 2016 2017 2018Kyrgyz Republic 98.3 99.2 99.2 99.2 99.3 99.3Batken 96.9 99.4 99.3 99.0 99.2 99.4Jalal-Abad 98.9 99.2 99.3 99.3 99.4 99.4Issyk-Kul 99.4 99.5 99.4 99.4 99.5 99.5Naryn 97.8 98.8 98.8 98.8 99.0 99.2Osh 96.5 98.9 99.1 99.1 99.1 99.1Talas 99.5 99.7 99.7 99.7 99.5 99.7Chui 99.2 99.2 99.2 99.2 99.2 99.2Bishkek city 99.6 99.6 99.5 99.5 99.5 99.6Osh city 97.4 99.4 99.3 99.3 99.5 99.7
Increasing the proportion of births in health care institutions is an important factor in reducing the risk to the health of both the mother and child. Proper medical care and sanitary conditions during childbirth reduce the risk of complications and infections that can cause illness and death in the mother or child.
In most cases (more than 99 per cent), assistance was provided in childbirth by qualified specialists (doctors and midwives) and this is typical for all regions of the country.
Figure7. Under-five mortality rate per 1,000 live births (number of deaths in children aged 0-4 per 1,000 live births)
26.5
23.121.5
19.818.5 17.6
2010 2014 2015 2016 2017 2018
3.2.1. Under-five mortality rate per 1,000 live births (number of deaths in children aged 0-4 per 1,000 live births)
2010 2014 2015 2016 2017 2018Kyrgyz Republic 26.5 23.1 21.5 19.8 18.5 17.6Female 23.6 21.2 19.6 18.4 16.6 15.6Male 29.2 24.9 23.2 21.1 20.3 19.4Batken 34.3 23.6 21.8 18.8 18.6 14.9Female 30.5 20.8 20.1 18.4 17.7 13.7Male 38.0 26.2 23.3 20.0 19.5 16.0Jalal-Abad 21.9 21.9 21.1 19.8 17.2 15.7Female 19.9 20.3 19.6 18.4 15.4 15.0Male 23.8 23.3 22.5 21.0 18.9 16.3

Monitoring of the Sustainable Development Goal Indicators in the Kyrgyz Republic 39Goal 3
2010 2014 2015 2016 2017 2018Issyk-Kul 22.3 16.9 18.8 17.8 15.2 14.3Female 18.3 13.1 16.7 16.8 12.0 12.3Male 26.2 20.6 20.7 12.8 18.1 16.3Naryn 25.0 22.6 16.8 17.9 18.2 15.1Female 22.3 23.0 12.1 15.5 16.5 13.5Male 27.3 22.2 21.2 20.2 19.8 16.6Osh 24.1 15.0 14.3 12.2 11.7 11.0Female 20.0 13.4 13.3 11.2 10.8 9.2Male 28.2 16.5 15.2 13.2 12.7 12.7Talas 29.5 24.1 17.8 19.7 17.1 22.8Female 27.0 20.1 11.8 19.3 16.7 17.9Male 32.0 27.8 23.3 20.0 17.5 27.5Chui 24.2 18.6 17.1 16.5 12.9 12.7Female 21.6 17.6 14.2 16.2 12.7 11.7Male 26.7 19.4 19.7 16.7 13.2 13.7Bishkek city 28.2 28.6 26.6 25.7 26.4 25.0Female 27.4 26.7 25.6 22.8 23.0 22.6Male 29.1 30.4 27.6 28.5 29.6 27.2Osh city 52.9 72.4 70.3 60.0 53.1 39.0Female 49.0 70.0 70.2 52.3 44.9 34.1Male 56.7 74.5 70.4 67.0 60.4 43.6
In line with the SDG target (3.2) on child mortality, the international community has maintained the overarching goal of reducing child mortality by ending preventable deaths of newborns and children under 5. The global goal is to reduce the mortality rate of children under the age of five to a maximum of 25 deaths per 1,000 live births. Reducing child mortality remains one of the most important goals of national plans and programmes in all countries.
Mortality rates for children under five are expressed as the number of deaths per 1,000 live births.
In recent years, all regions of the country have seen a steady decline in the mortality rate of children under 5. In 2018, 3,000 children under 5 died from various diseases, poisonings and injuries, or 17.6 children per 1,000 born alive. The child mortality rate includes infant mortality (mortality in the first year of life). Kyrgyzstan is among the countries that have reached Goal 4 of the Millennium Development Goals to reduce child mortality.
3.2.2. Neonatal mortality rate per 1,000 live births (number of deaths in children aged 0-27 days per 1,000 live births)
2010 2014 2015 2016 2017 2018Kyrgyz Republic 16.4 15.6 14.0 12.7 11.8 12.0Female 14.4 14.3 12.5 11.9 10.4 10.7Male 18.3 16.9 15.4 13.4 13.1 13.2Batken 17.9 12.5 11.2 10.6 10.6 9.3Female 16.3 10.1 10.3 10.8 9.4 8.2Male 19.5 14.7 12.1 10.4 11.7 10.4
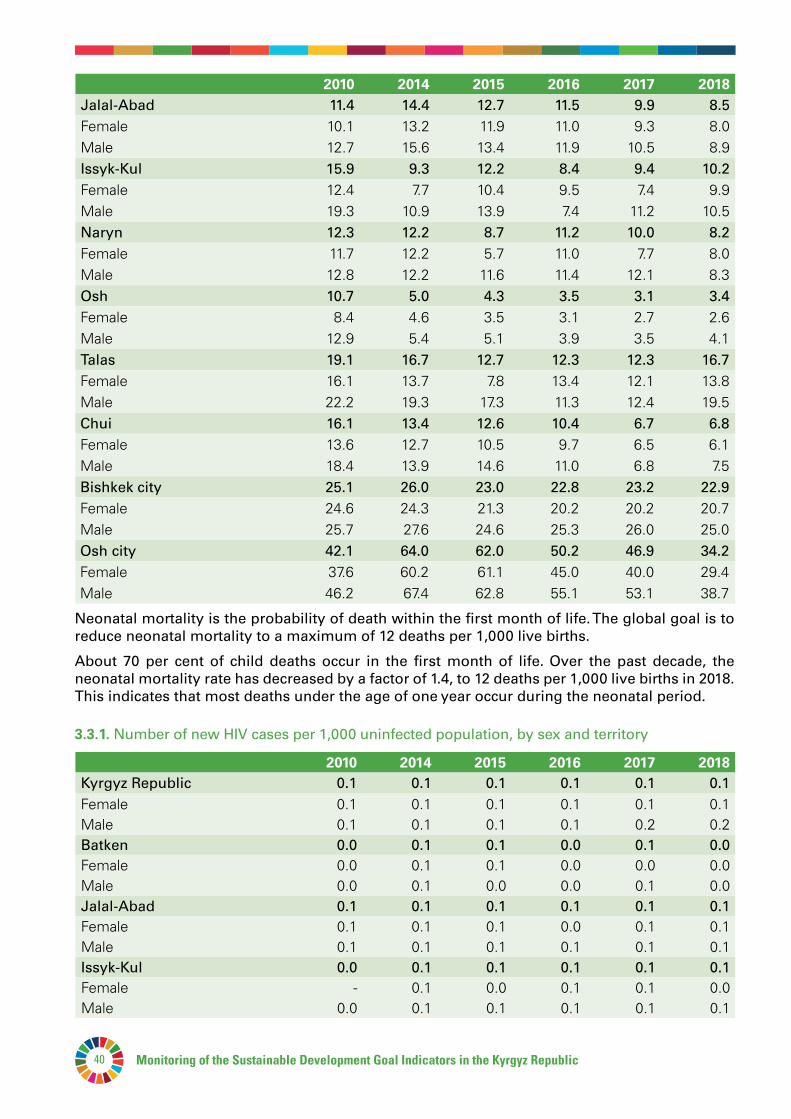
Monitoring of the Sustainable Development Goal Indicators in the Kyrgyz Republic40
2010 2014 2015 2016 2017 2018Jalal-Abad 11.4 14.4 12.7 11.5 9.9 8.5Female 10.1 13.2 11.9 11.0 9.3 8.0Male 12.7 15.6 13.4 11.9 10.5 8.9Issyk-Kul 15.9 9.3 12.2 8.4 9.4 10.2Female 12.4 7.7 10.4 9.5 7.4 9.9Male 19.3 10.9 13.9 7.4 11.2 10.5Naryn 12.3 12.2 8.7 11.2 10.0 8.2Female 11.7 12.2 5.7 11.0 7.7 8.0Male 12.8 12.2 11.6 11.4 12.1 8.3Osh 10.7 5.0 4.3 3.5 3.1 3.4Female 8.4 4.6 3.5 3.1 2.7 2.6Male 12.9 5.4 5.1 3.9 3.5 4.1Talas 19.1 16.7 12.7 12.3 12.3 16.7Female 16.1 13.7 7.8 13.4 12.1 13.8Male 22.2 19.3 17.3 11.3 12.4 19.5Chui 16.1 13.4 12.6 10.4 6.7 6.8Female 13.6 12.7 10.5 9.7 6.5 6.1Male 18.4 13.9 14.6 11.0 6.8 7.5Bishkek city 25.1 26.0 23.0 22.8 23.2 22.9Female 24.6 24.3 21.3 20.2 20.2 20.7Male 25.7 27.6 24.6 25.3 26.0 25.0Osh city 42.1 64.0 62.0 50.2 46.9 34.2Female 37.6 60.2 61.1 45.0 40.0 29.4Male 46.2 67.4 62.8 55.1 53.1 38.7
Neonatal mortality is the probability of death within the first month of life. The global goal is to reduce neonatal mortality to a maximum of 12 deaths per 1,000 live births.
About 70 per cent of child deaths occur in the first month of life. Over the past decade, the neonatal mortality rate has decreased by a factor of 1.4, to 12 deaths per 1,000 live births in 2018. This indicates that most deaths under the age of one year occur during the neonatal period.
3.3.1. Number of new HIV cases per 1,000 uninfected population, by sex and territory
2010 2014 2015 2016 2017 2018Kyrgyz Republic 0.1 0.1 0.1 0.1 0.1 0.1Female 0.1 0.1 0.1 0.1 0.1 0.1Male 0.1 0.1 0.1 0.1 0.2 0.2Batken 0.0 0.1 0.1 0.0 0.1 0.0Female 0.0 0.1 0.1 0.0 0.0 0.0Male 0.0 0.1 0.0 0.0 0.1 0.0Jalal-Abad 0.1 0.1 0.1 0.1 0.1 0.1Female 0.1 0.1 0.1 0.0 0.1 0.1Male 0.1 0.1 0.1 0.1 0.1 0.1Issyk-Kul 0.0 0.1 0.1 0.1 0.1 0.1Female - 0.1 0.0 0.1 0.1 0.0Male 0.0 0.1 0.1 0.1 0.1 0.1
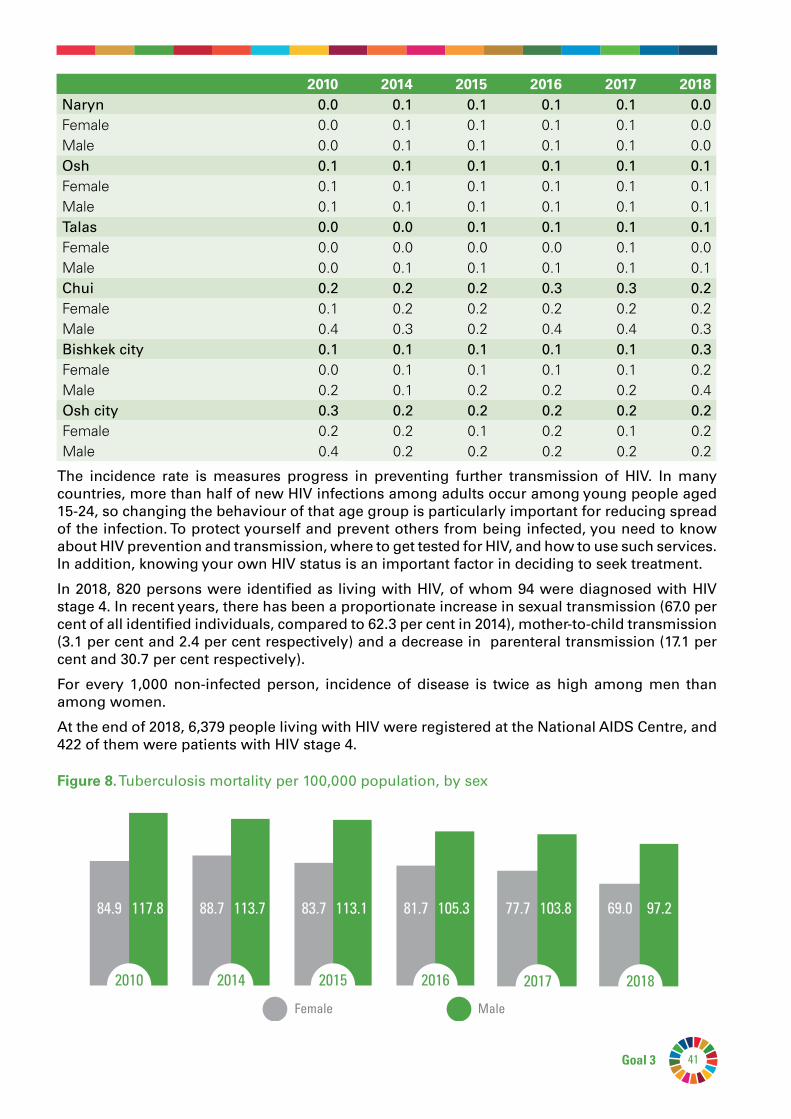
Monitoring of the Sustainable Development Goal Indicators in the Kyrgyz Republic 41Goal 3
2010 2014 2015 2016 2017 2018Naryn 0.0 0.1 0.1 0.1 0.1 0.0Female 0.0 0.1 0.1 0.1 0.1 0.0Male 0.0 0.1 0.1 0.1 0.1 0.0Osh 0.1 0.1 0.1 0.1 0.1 0.1Female 0.1 0.1 0.1 0.1 0.1 0.1Male 0.1 0.1 0.1 0.1 0.1 0.1Talas 0.0 0.0 0.1 0.1 0.1 0.1Female 0.0 0.0 0.0 0.0 0.1 0.0Male 0.0 0.1 0.1 0.1 0.1 0.1Chui 0.2 0.2 0.2 0.3 0.3 0.2Female 0.1 0.2 0.2 0.2 0.2 0.2Male 0.4 0.3 0.2 0.4 0.4 0.3Bishkek city 0.1 0.1 0.1 0.1 0.1 0.3Female 0.0 0.1 0.1 0.1 0.1 0.2Male 0.2 0.1 0.2 0.2 0.2 0.4Osh city 0.3 0.2 0.2 0.2 0.2 0.2Female 0.2 0.2 0.1 0.2 0.1 0.2Male 0.4 0.2 0.2 0.2 0.2 0.2
The incidence rate is measures progress in preventing further transmission of HIV. In many countries, more than half of new HIV infections among adults occur among young people aged 15-24, so changing the behaviour of that age group is particularly important for reducing spread of the infection. To protect yourself and prevent others from being infected, you need to know about HIV prevention and transmission, where to get tested for HIV, and how to use such services. In addition, knowing your own HIV status is an important factor in deciding to seek treatment.
In 2018, 820 persons were identified as living with HIV, of whom 94 were diagnosed with HIV stage 4. In recent years, there has been a proportionate increase in sexual transmission (67.0 per cent of all identified individuals, compared to 62.3 per cent in 2014), mother-to-child transmission (3.1 per cent and 2.4 per cent respectively) and a decrease in parenteral transmission (17.1 per cent and 30.7 per cent respectively).
For every 1,000 non-infected person, incidence of disease is twice as high among men than among women.
At the end of 2018, 6,379 people living with HIV were registered at the National AIDS Centre, and 422 of them were patients with HIV stage 4.
Figure8. Tuberculosis mortality per 100,000 population, by sex
84.9 88.7 83.7 81.7 77.7 69.0117.8 113.7 113.1 105.3 103.8 97.2
2010 2014 2015 2016 2017 2018
MaleFemale
84.9 88.7 83.7 81.7 77.7 69.0117.8 113.7 113.1 105.3 103.8 97.2
2010 2014 2015 2016 2017 2018
MaleFemale
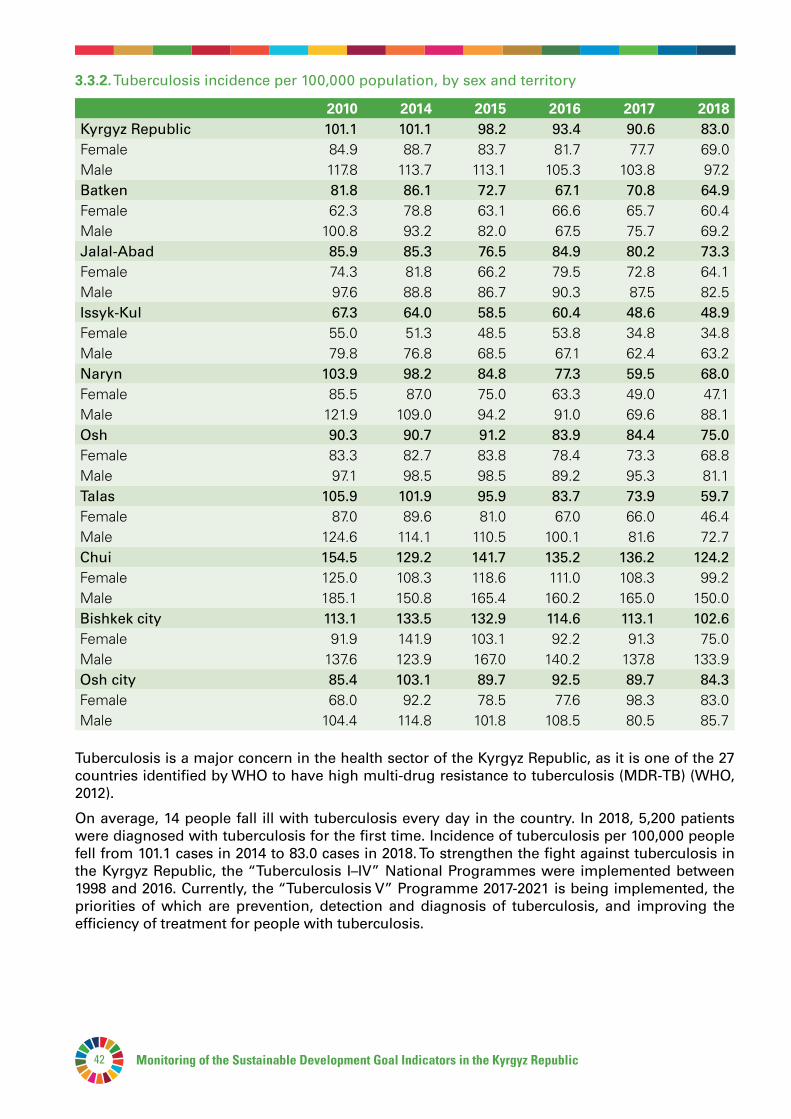
Monitoring of the Sustainable Development Goal Indicators in the Kyrgyz Republic42
3.3.2. Tuberculosis incidence per 100,000 population, by sex and territory
2010 2014 2015 2016 2017 2018Kyrgyz Republic 101.1 101.1 98.2 93.4 90.6 83.0Female 84.9 88.7 83.7 81.7 77.7 69.0Male 117.8 113.7 113.1 105.3 103.8 97.2Batken 81.8 86.1 72.7 67.1 70.8 64.9Female 62.3 78.8 63.1 66.6 65.7 60.4Male 100.8 93.2 82.0 67.5 75.7 69.2Jalal-Abad 85.9 85.3 76.5 84.9 80.2 73.3Female 74.3 81.8 66.2 79.5 72.8 64.1Male 97.6 88.8 86.7 90.3 87.5 82.5Issyk-Kul 67.3 64.0 58.5 60.4 48.6 48.9Female 55.0 51.3 48.5 53.8 34.8 34.8Male 79.8 76.8 68.5 67.1 62.4 63.2Naryn 103.9 98.2 84.8 77.3 59.5 68.0Female 85.5 87.0 75.0 63.3 49.0 47.1Male 121.9 109.0 94.2 91.0 69.6 88.1Osh 90.3 90.7 91.2 83.9 84.4 75.0Female 83.3 82.7 83.8 78.4 73.3 68.8Male 97.1 98.5 98.5 89.2 95.3 81.1Talas 105.9 101.9 95.9 83.7 73.9 59.7Female 87.0 89.6 81.0 67.0 66.0 46.4Male 124.6 114.1 110.5 100.1 81.6 72.7Chui 154.5 129.2 141.7 135.2 136.2 124.2Female 125.0 108.3 118.6 111.0 108.3 99.2Male 185.1 150.8 165.4 160.2 165.0 150.0Bishkek city 113.1 133.5 132.9 114.6 113.1 102.6Female 91.9 141.9 103.1 92.2 91.3 75.0Male 137.6 123.9 167.0 140.2 137.8 133.9Osh city 85.4 103.1 89.7 92.5 89.7 84.3Female 68.0 92.2 78.5 77.6 98.3 83.0Male 104.4 114.8 101.8 108.5 80.5 85.7
Tuberculosis is a major concern in the health sector of the Kyrgyz Republic, as it is one of the 27 countries identified by WHO to have high multi-drug resistance to tuberculosis (MDR-TB) (WHO, 2012).
On average, 14 people fall ill with tuberculosis every day in the country. In 2018, 5,200 patients were diagnosed with tuberculosis for the first time. Incidence of tuberculosis per 100,000 people fell from 101.1 cases in 2014 to 83.0 cases in 2018. To strengthen the fight against tuberculosis in the Kyrgyz Republic, the “Tuberculosis I–IV” National Programmes were implemented between 1998 and 2016. Currently, the “Tuberculosis V” Programme 2017-2021 is being implemented, the priorities of which are prevention, detection and diagnosis of tuberculosis, and improving the efficiency of treatment for people with tuberculosis.

Monitoring of the Sustainable Development Goal Indicators in the Kyrgyz Republic 43Goal 3
3.3.3.Malaria incidence per 1,000 population2010 2014 2015 2016 2017 2018
Kyrgyz Republic 0.0 - 0.0 0.0 0.0 0.0Batken - - - - - -Jalal-Abad 0.0 - - - - -Issyk-Kul - - - - - -Naryn - - - - - -Osh - - - - - -Talas - - - - - -Chui - - - 0.0 0.0 0.0Bishkek city - - 0.0 0.0 0.0 -Osh city - - - 0.0 0.0 -
Incidence of malaria is defined as the number of new cases of malaria per 1,000 persons at risk each year. A case of malaria is defined as the occurrence of a malarial infection in a person the presence of malarial parasites in whose blood has been confirmed by a diagnostic test.In Kyrgyzstan, the malaria situation remains stable, with only a few cases reported every year, and one case reported in 2018.
3.3.4.Hepatitis B incidence per 100,000 population, by sex and territory2010 2014 2015 2016 2017 2018
Kyrgyz Republic 9.2 7.5 5.9 6.0 5.3 5.1Female 6.6 5.5 4.2 4.5 4.3 3.5Male 11.8 9.5 7.5 7.5 6.2 6.8Batken 4.6 5.7 4.9 8.6 2.6 3.1Female 3.3 5.1 4.2 9.0 2.8 2.7Male 5.8 6.2 5.7 8.3 2.3 3.4Jalal-Abad 5.9 5.8 4.4 2.6 3.3 2.7Female 4.1 3.3 3.5 2.4 2.7 1.7Male 7.8 8.3 5.3 2.8 3.9 3.6Issyk-Kul 9.3 6.9 5.4 4.4 4.6 6.2Female 4.9 5.2 4.7 2.5 5.4 2.9Male 13.7 8.7 6.0 6.4 3.8 9.5Naryn 7.7 4.4 2.2 4.3 2.8 3.2Female 4.7 2.2 1.5 1.5 3.6 2.9Male 10.6 6.5 2.9 7.1 2.1 3.4Osh 8.4 6.3 3.5 4.6 5.9 4.4Female 6.5 5.0 2.6 2.4 5.3 3.0Male 10.2 7.7 4.5 6.8 6.5 5.8Talas 11.3 6.5 5.2 6.3 3.9 2.7Female 13.1 5.8 2.4 5.6 1.6 3.1Male 9.5 7.3 8.0 7.0 6.2 2.3Chui 6.5 6.5 5.8 5.4 4.8 6.3Female 6.1 3.9 4.7 4.2 2.6 4.9Male 7.0 9.2 6.9 6.6 7.1 7.8
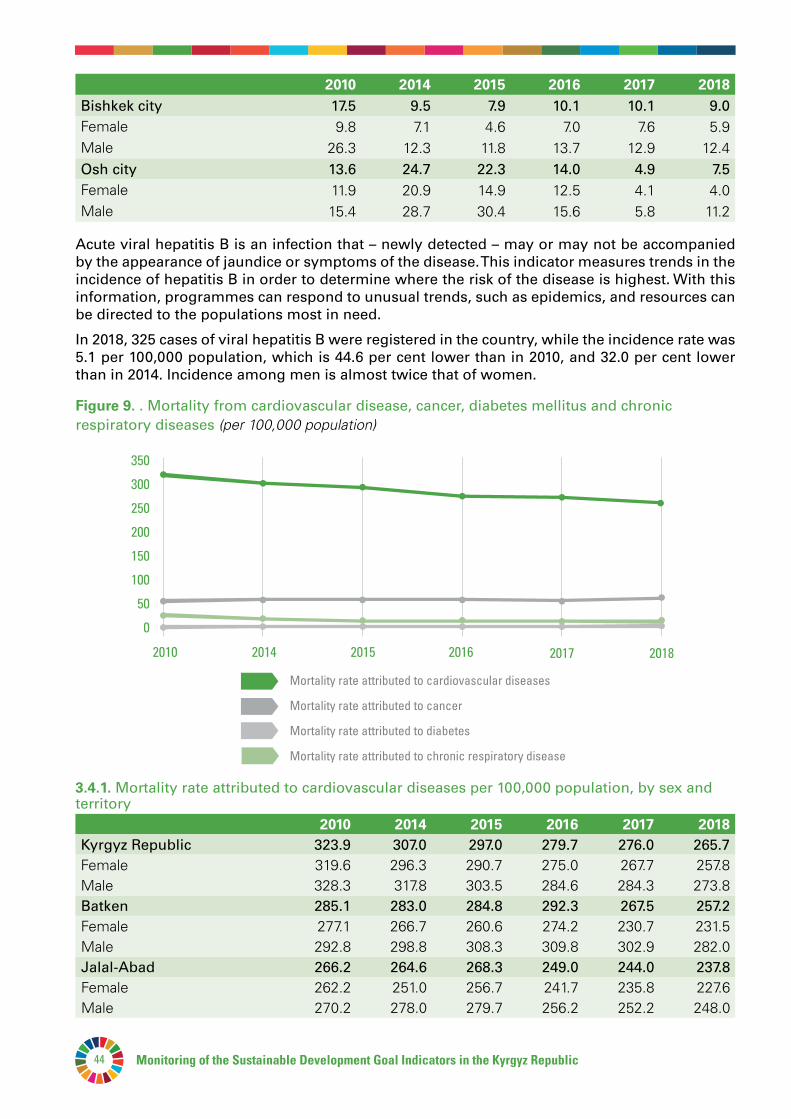
Monitoring of the Sustainable Development Goal Indicators in the Kyrgyz Republic44
2010 2014 2015 2016 2017 2018Bishkek city 17.5 9.5 7.9 10.1 10.1 9.0Female 9.8 7.1 4.6 7.0 7.6 5.9Male 26.3 12.3 11.8 13.7 12.9 12.4Osh city 13.6 24.7 22.3 14.0 4.9 7.5Female 11.9 20.9 14.9 12.5 4.1 4.0Male 15.4 28.7 30.4 15.6 5.8 11.2
Acute viral hepatitis B is an infection that – newly detected – may or may not be accompanied by the appearance of jaundice or symptoms of the disease. This indicator measures trends in the incidence of hepatitis B in order to determine where the risk of the disease is highest. With this information, programmes can respond to unusual trends, such as epidemics, and resources can be directed to the populations most in need.
In 2018, 325 cases of viral hepatitis B were registered in the country, while the incidence rate was 5.1 per 100,000 population, which is 44.6 per cent lower than in 2010, and 32.0 per cent lower than in 2014. Incidence among men is almost twice that of women.
Figure9. . Mortality from cardiovascular disease, cancer, diabetes mellitus and chronic respiratory diseases (per 100,000 population)
0
50
100
150
200
250
300
350
Mortality rate attributed to cardiovascular diseases
Mortality rate attributed to cancer
Mortality rate attributed to diabetes
Mortality rate attributed to chronic respiratory disease
2010 2014 2015 2016 2017 2018
3.4.1. Mortality rate attributed to cardiovascular diseases per 100,000 population, by sex and territory
2010 2014 2015 2016 2017 2018Kyrgyz Republic 323.9 307.0 297.0 279.7 276.0 265.7Female 319.6 296.3 290.7 275.0 267.7 257.8Male 328.3 317.8 303.5 284.6 284.3 273.8Batken 285.1 283.0 284.8 292.3 267.5 257.2Female 277.1 266.7 260.6 274.2 230.7 231.5Male 292.8 298.8 308.3 309.8 302.9 282.0Jalal-Abad 266.2 264.6 268.3 249.0 244.0 237.8Female 262.2 251.0 256.7 241.7 235.8 227.6Male 270.2 278.0 279.7 256.2 252.2 248.0
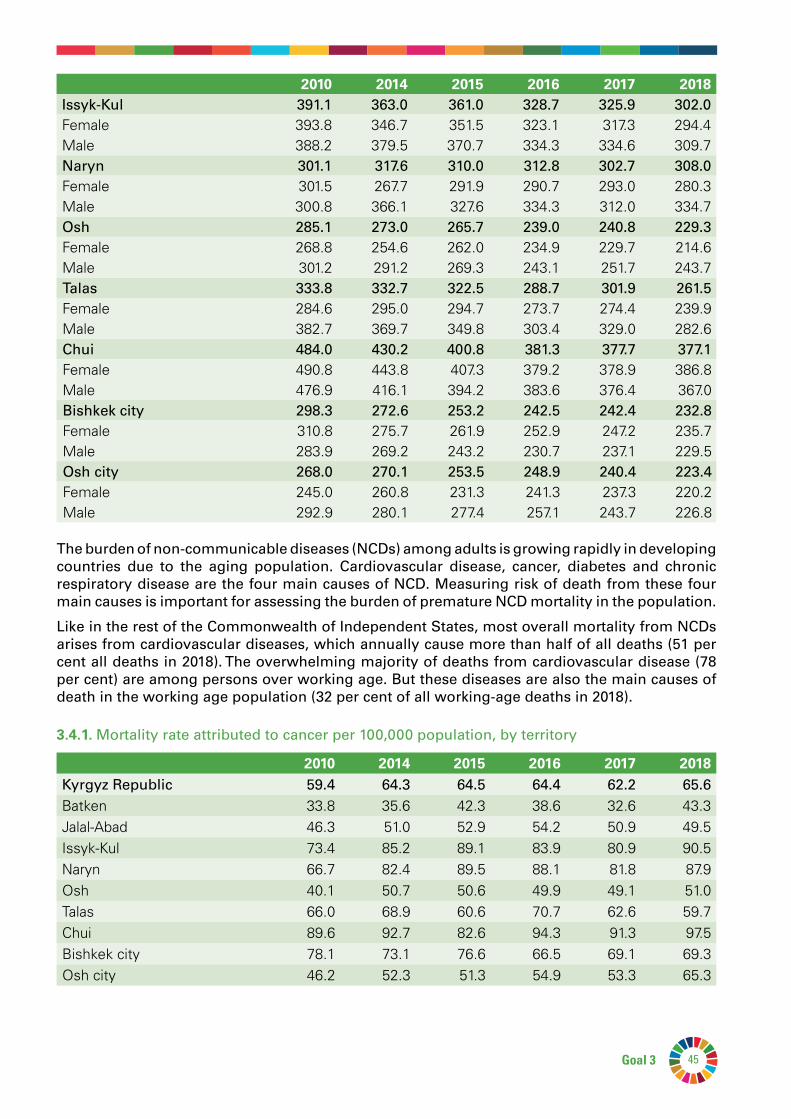
Monitoring of the Sustainable Development Goal Indicators in the Kyrgyz Republic 45Goal 3
The burden of non-communicable diseases (NCDs) among adults is growing rapidly in developing countries due to the aging population. Cardiovascular disease, cancer, diabetes and chronic respiratory disease are the four main causes of NCD. Measuring risk of death from these four main causes is important for assessing the burden of premature NCD mortality in the population.
Like in the rest of the Commonwealth of Independent States, most overall mortality from NCDs arises from cardiovascular diseases, which annually cause more than half of all deaths (51 per cent all deaths in 2018). The overwhelming majority of deaths from cardiovascular disease (78 per cent) are among persons over working age. But these diseases are also the main causes of death in the working age population (32 per cent of all working-age deaths in 2018).
3.4.1.Mortality rate attributed to cancer per 100,000 population, by territory
2010 2014 2015 2016 2017 2018Kyrgyz Republic 59.4 64.3 64.5 64.4 62.2 65.6Batken 33.8 35.6 42.3 38.6 32.6 43.3Jalal-Abad 46.3 51.0 52.9 54.2 50.9 49.5Issyk-Kul 73.4 85.2 89.1 83.9 80.9 90.5Naryn 66.7 82.4 89.5 88.1 81.8 87.9Osh 40.1 50.7 50.6 49.9 49.1 51.0Talas 66.0 68.9 60.6 70.7 62.6 59.7Chui 89.6 92.7 82.6 94.3 91.3 97.5Bishkek city 78.1 73.1 76.6 66.5 69.1 69.3Osh city 46.2 52.3 51.3 54.9 53.3 65.3
2010 2014 2015 2016 2017 2018Issyk-Kul 391.1 363.0 361.0 328.7 325.9 302.0Female 393.8 346.7 351.5 323.1 317.3 294.4Male 388.2 379.5 370.7 334.3 334.6 309.7Naryn 301.1 317.6 310.0 312.8 302.7 308.0Female 301.5 267.7 291.9 290.7 293.0 280.3Male 300.8 366.1 327.6 334.3 312.0 334.7Osh 285.1 273.0 265.7 239.0 240.8 229.3Female 268.8 254.6 262.0 234.9 229.7 214.6Male 301.2 291.2 269.3 243.1 251.7 243.7Talas 333.8 332.7 322.5 288.7 301.9 261.5Female 284.6 295.0 294.7 273.7 274.4 239.9Male 382.7 369.7 349.8 303.4 329.0 282.6Chui 484.0 430.2 400.8 381.3 377.7 377.1Female 490.8 443.8 407.3 379.2 378.9 386.8Male 476.9 416.1 394.2 383.6 376.4 367.0Bishkek city 298.3 272.6 253.2 242.5 242.4 232.8Female 310.8 275.7 261.9 252.9 247.2 235.7Male 283.9 269.2 243.2 230.7 237.1 229.5Osh city 268.0 270.1 253.5 248.9 240.4 223.4Female 245.0 260.8 231.3 241.3 237.3 220.2Male 292.9 280.1 277.4 257.1 243.7 226.8
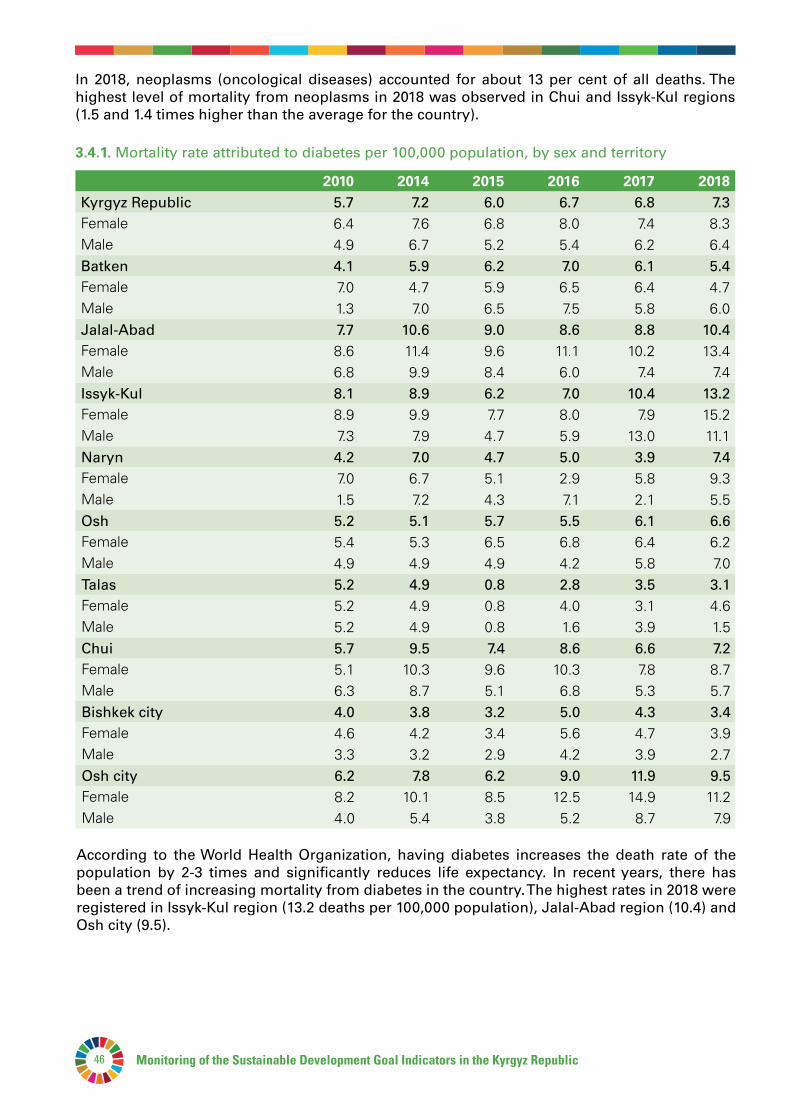
Monitoring of the Sustainable Development Goal Indicators in the Kyrgyz Republic46
In 2018, neoplasms (oncological diseases) accounted for about 13 per cent of all deaths. The highest level of mortality from neoplasms in 2018 was observed in Chui and Issyk-Kul regions (1.5 and 1.4 times higher than the average for the country).
3.4.1. Mortality rate attributed to diabetes per 100,000 population, by sex and territory
2010 2014 2015 2016 2017 2018Kyrgyz Republic 5.7 7.2 6.0 6.7 6.8 7.3Female 6.4 7.6 6.8 8.0 7.4 8.3Male 4.9 6.7 5.2 5.4 6.2 6.4Batken 4.1 5.9 6.2 7.0 6.1 5.4Female 7.0 4.7 5.9 6.5 6.4 4.7Male 1.3 7.0 6.5 7.5 5.8 6.0Jalal-Abad 7.7 10.6 9.0 8.6 8.8 10.4Female 8.6 11.4 9.6 11.1 10.2 13.4Male 6.8 9.9 8.4 6.0 7.4 7.4Issyk-Kul 8.1 8.9 6.2 7.0 10.4 13.2Female 8.9 9.9 7.7 8.0 7.9 15.2Male 7.3 7.9 4.7 5.9 13.0 11.1Naryn 4.2 7.0 4.7 5.0 3.9 7.4Female 7.0 6.7 5.1 2.9 5.8 9.3Male 1.5 7.2 4.3 7.1 2.1 5.5Osh 5.2 5.1 5.7 5.5 6.1 6.6Female 5.4 5.3 6.5 6.8 6.4 6.2Male 4.9 4.9 4.9 4.2 5.8 7.0Talas 5.2 4.9 0.8 2.8 3.5 3.1Female 5.2 4.9 0.8 4.0 3.1 4.6Male 5.2 4.9 0.8 1.6 3.9 1.5Chui 5.7 9.5 7.4 8.6 6.6 7.2Female 5.1 10.3 9.6 10.3 7.8 8.7Male 6.3 8.7 5.1 6.8 5.3 5.7Bishkek city 4.0 3.8 3.2 5.0 4.3 3.4Female 4.6 4.2 3.4 5.6 4.7 3.9Male 3.3 3.2 2.9 4.2 3.9 2.7Osh city 6.2 7.8 6.2 9.0 11.9 9.5Female 8.2 10.1 8.5 12.5 14.9 11.2Male 4.0 5.4 3.8 5.2 8.7 7.9
According to the World Health Organization, having diabetes increases the death rate of the population by 2-3 times and significantly reduces life expectancy. In recent years, there has been a trend of increasing mortality from diabetes in the country. The highest rates in 2018 were registered in Issyk-Kul region (13.2 deaths per 100,000 population), Jalal-Abad region (10.4) and Osh city (9.5).
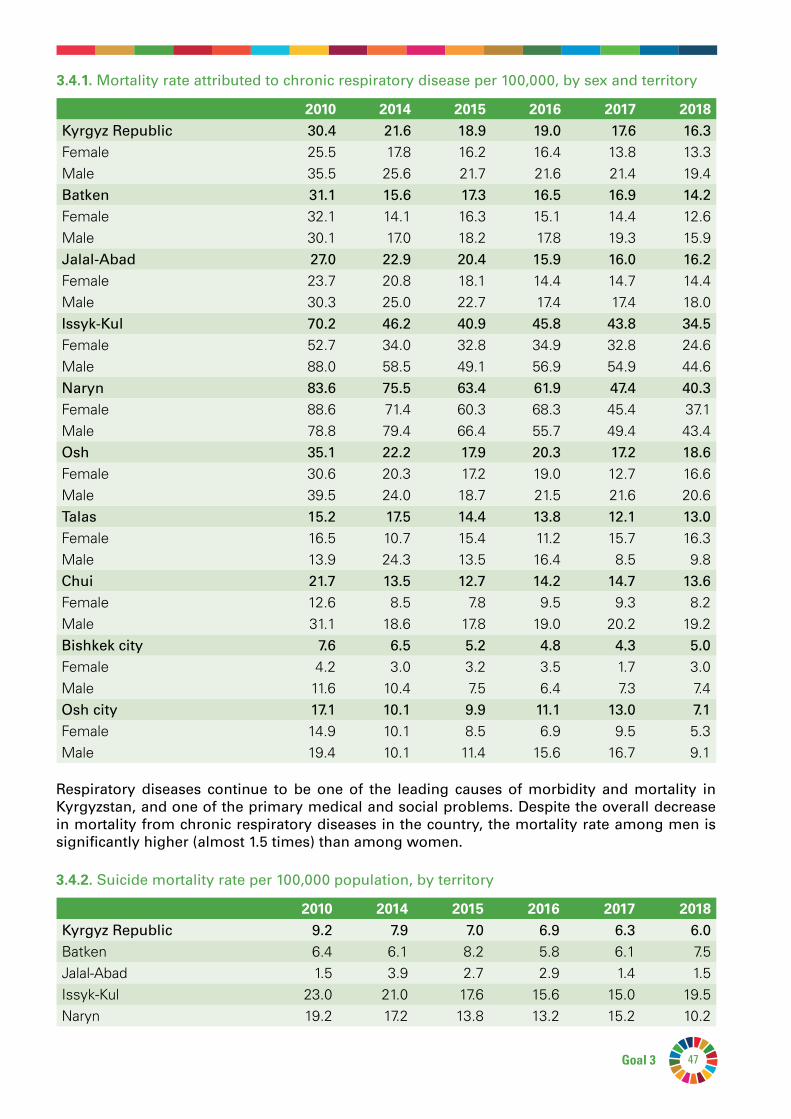
Monitoring of the Sustainable Development Goal Indicators in the Kyrgyz Republic 47Goal 3
3.4.1. Mortality rate attributed to chronic respiratory disease per 100,000, by sex and territory
2010 2014 2015 2016 2017 2018Kyrgyz Republic 30.4 21.6 18.9 19.0 17.6 16.3Female 25.5 17.8 16.2 16.4 13.8 13.3Male 35.5 25.6 21.7 21.6 21.4 19.4Batken 31.1 15.6 17.3 16.5 16.9 14.2Female 32.1 14.1 16.3 15.1 14.4 12.6Male 30.1 17.0 18.2 17.8 19.3 15.9Jalal-Abad 27.0 22.9 20.4 15.9 16.0 16.2Female 23.7 20.8 18.1 14.4 14.7 14.4Male 30.3 25.0 22.7 17.4 17.4 18.0Issyk-Kul 70.2 46.2 40.9 45.8 43.8 34.5Female 52.7 34.0 32.8 34.9 32.8 24.6Male 88.0 58.5 49.1 56.9 54.9 44.6Naryn 83.6 75.5 63.4 61.9 47.4 40.3Female 88.6 71.4 60.3 68.3 45.4 37.1Male 78.8 79.4 66.4 55.7 49.4 43.4Osh 35.1 22.2 17.9 20.3 17.2 18.6Female 30.6 20.3 17.2 19.0 12.7 16.6Male 39.5 24.0 18.7 21.5 21.6 20.6Talas 15.2 17.5 14.4 13.8 12.1 13.0Female 16.5 10.7 15.4 11.2 15.7 16.3Male 13.9 24.3 13.5 16.4 8.5 9.8Chui 21.7 13.5 12.7 14.2 14.7 13.6Female 12.6 8.5 7.8 9.5 9.3 8.2Male 31.1 18.6 17.8 19.0 20.2 19.2Bishkek city 7.6 6.5 5.2 4.8 4.3 5.0Female 4.2 3.0 3.2 3.5 1.7 3.0Male 11.6 10.4 7.5 6.4 7.3 7.4Osh city 17.1 10.1 9.9 11.1 13.0 7.1Female 14.9 10.1 8.5 6.9 9.5 5.3Male 19.4 10.1 11.4 15.6 16.7 9.1
Respiratory diseases continue to be one of the leading causes of morbidity and mortality in Kyrgyzstan, and one of the primary medical and social problems. Despite the overall decrease in mortality from chronic respiratory diseases in the country, the mortality rate among men is significantly higher (almost 1.5 times) than among women.
3.4.2. Suicide mortality rate per 100,000 population, by territory
2010 2014 2015 2016 2017 2018Kyrgyz Republic 9.2 7.9 7.0 6.9 6.3 6.0Batken 6.4 6.1 8.2 5.8 6.1 7.5Jalal-Abad 1.5 3.9 2.7 2.9 1.4 1.5Issyk-Kul 23.0 21.0 17.6 15.6 15.0 19.5Naryn 19.2 17.2 13.8 13.2 15.2 10.2
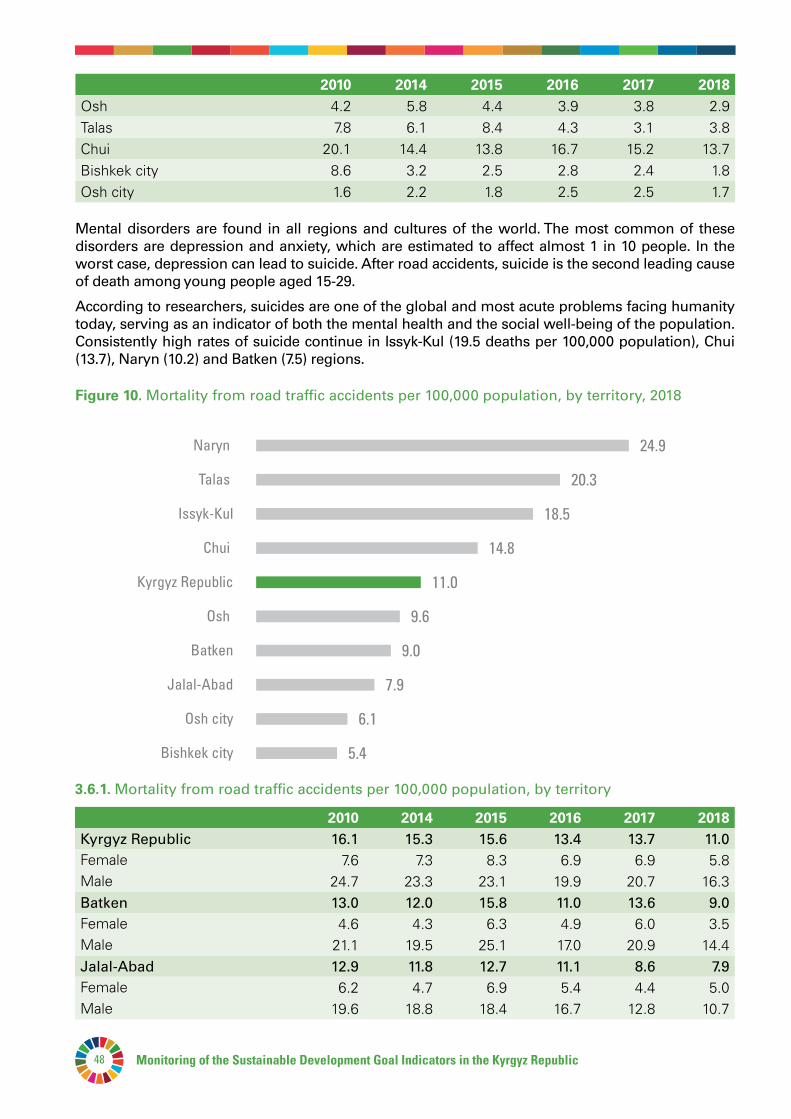
Monitoring of the Sustainable Development Goal Indicators in the Kyrgyz Republic48
2010 2014 2015 2016 2017 2018Osh 4.2 5.8 4.4 3.9 3.8 2.9Talas 7.8 6.1 8.4 4.3 3.1 3.8Chui 20.1 14.4 13.8 16.7 15.2 13.7Bishkek city 8.6 3.2 2.5 2.8 2.4 1.8Osh city 1.6 2.2 1.8 2.5 2.5 1.7
Mental disorders are found in all regions and cultures of the world. The most common of these disorders are depression and anxiety, which are estimated to affect almost 1 in 10 people. In the worst case, depression can lead to suicide. After road accidents, suicide is the second leading cause of death among young people aged 15-29.
According to researchers, suicides are one of the global and most acute problems facing humanity today, serving as an indicator of both the mental health and the social well-being of the population. Consistently high rates of suicide continue in Issyk-Kul (19.5 deaths per 100,000 population), Chui (13.7), Naryn (10.2) and Batken (7.5) regions.
Figure10.Mortality from road traffic accidents per 100,000 population, by territory, 2018
Naryn 24.9
Talas 20.3
Issyk-Kul 18.5
Chui 14.8
Kyrgyz Republic 11.0
Osh 9.6
Batken 9.0
Jalal-Abad 7.9
Osh city 6.1
Bishkek city 5.4
3.6.1.Mortality from road traffic accidents per 100,000 population, by territory
2010 2014 2015 2016 2017 2018Kyrgyz Republic 16.1 15.3 15.6 13.4 13.7 11.0Female 7.6 7.3 8.3 6.9 6.9 5.8Male 24.7 23.3 23.1 19.9 20.7 16.3Batken 13.0 12.0 15.8 11.0 13.6 9.0Female 4.6 4.3 6.3 4.9 6.0 3.5Male 21.1 19.5 25.1 17.0 20.9 14.4Jalal-Abad 12.9 11.8 12.7 11.1 8.6 7.9Female 6.2 4.7 6.9 5.4 4.4 5.0Male 19.6 18.8 18.4 16.7 12.8 10.7
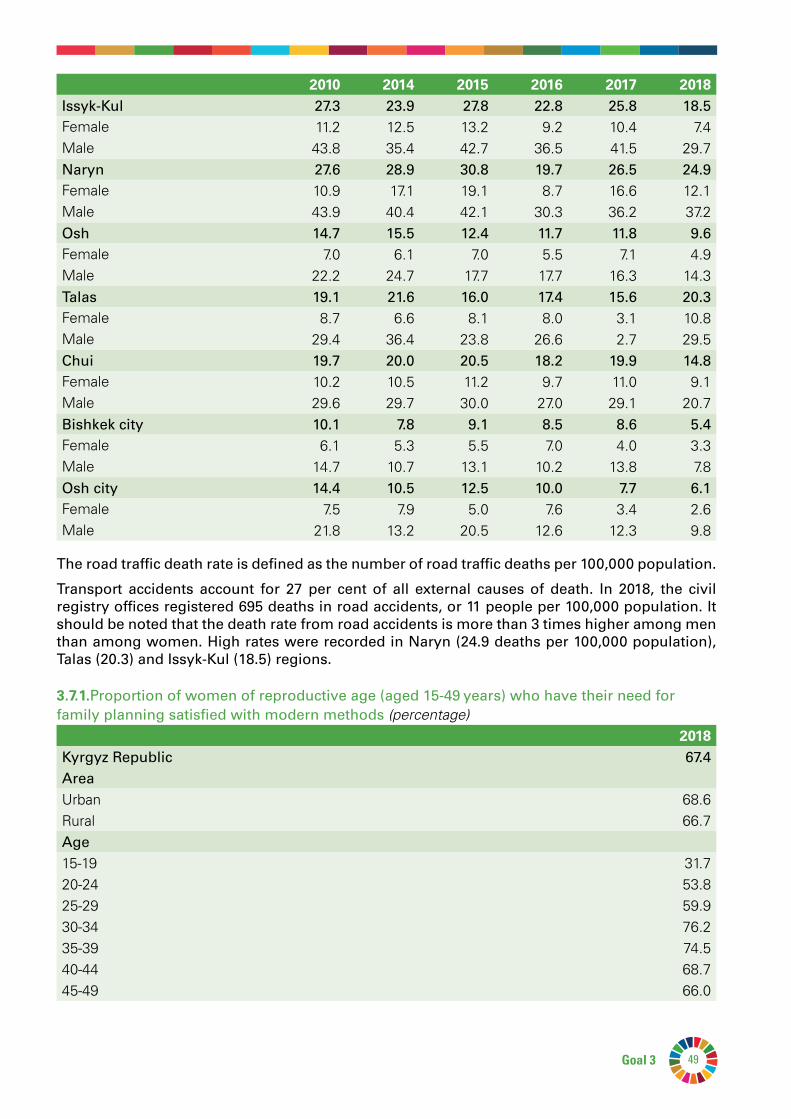
Monitoring of the Sustainable Development Goal Indicators in the Kyrgyz Republic 49Goal 3
The road traffic death rate is defined as the number of road traffic deaths per 100,000 population.
Transport accidents account for 27 per cent of all external causes of death. In 2018, the civil registry offices registered 695 deaths in road accidents, or 11 people per 100,000 population. It should be noted that the death rate from road accidents is more than 3 times higher among men than among women. High rates were recorded in Naryn (24.9 deaths per 100,000 population), Talas (20.3) and Issyk-Kul (18.5) regions.
3.7.1.Proportion of women of reproductive age (aged 15-49 years) who have their need for family planning satisfied with modern methods (percentage)
2018Kyrgyz Republic 67.4AreaUrban 68.6Rural 66.7Age15-19 31.720-24 53.825-29 59.930-34 76.235-39 74.540-44 68.745-49 66.0
2010 2014 2015 2016 2017 2018Issyk-Kul 27.3 23.9 27.8 22.8 25.8 18.5Female 11.2 12.5 13.2 9.2 10.4 7.4Male 43.8 35.4 42.7 36.5 41.5 29.7Naryn 27.6 28.9 30.8 19.7 26.5 24.9Female 10.9 17.1 19.1 8.7 16.6 12.1Male 43.9 40.4 42.1 30.3 36.2 37.2Osh 14.7 15.5 12.4 11.7 11.8 9.6Female 7.0 6.1 7.0 5.5 7.1 4.9Male 22.2 24.7 17.7 17.7 16.3 14.3Talas 19.1 21.6 16.0 17.4 15.6 20.3Female 8.7 6.6 8.1 8.0 3.1 10.8Male 29.4 36.4 23.8 26.6 2.7 29.5Chui 19.7 20.0 20.5 18.2 19.9 14.8Female 10.2 10.5 11.2 9.7 11.0 9.1Male 29.6 29.7 30.0 27.0 29.1 20.7Bishkek city 10.1 7.8 9.1 8.5 8.6 5.4Female 6.1 5.3 5.5 7.0 4.0 3.3Male 14.7 10.7 13.1 10.2 13.8 7.8Osh city 14.4 10.5 12.5 10.0 7.7 6.1Female 7.5 7.9 5.0 7.6 3.4 2.6Male 21.8 13.2 20.5 12.6 12.3 9.8
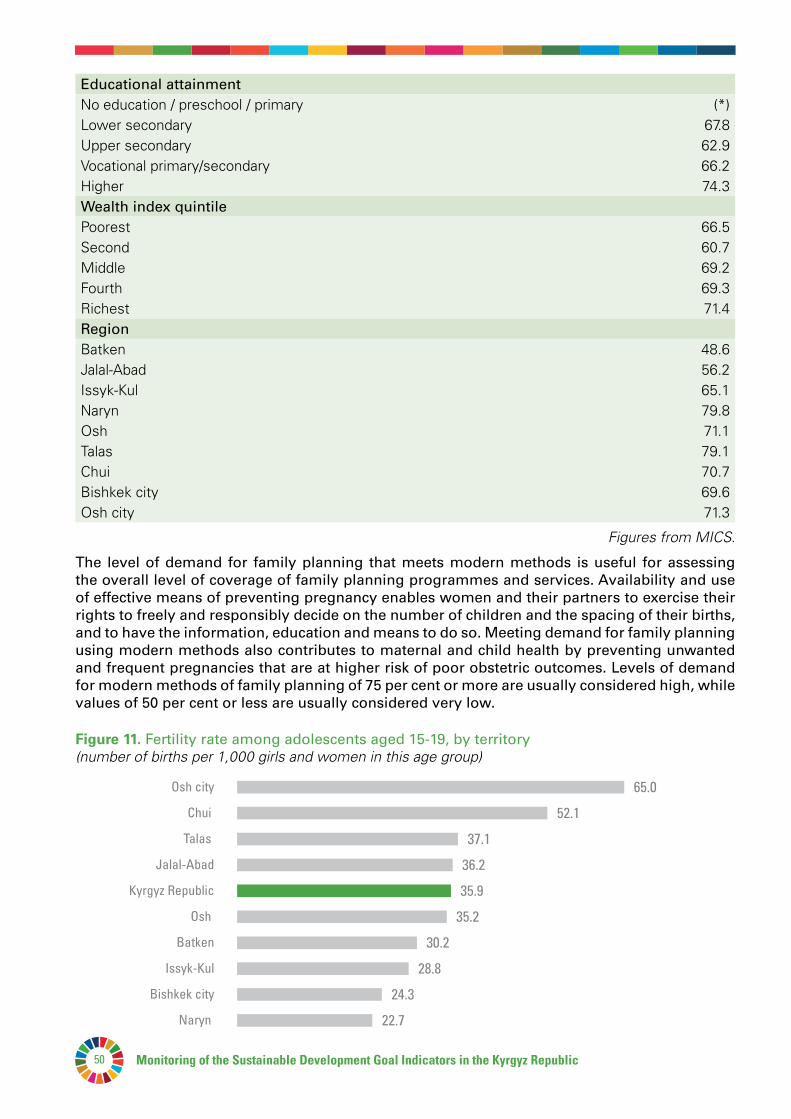
Monitoring of the Sustainable Development Goal Indicators in the Kyrgyz Republic50
Educational attainmentNo education / preschool / primary (*)Lower secondary 67.8Upper secondary 62.9Vocational primary/secondary 66.2Higher 74.3Wealth index quintilePoorest 66.5Second 60.7Middle 69.2Fourth 69.3Richest 71.4Region Batken 48.6Jalal-Abad 56.2Issyk-Kul 65.1Naryn 79.8Osh 71.1Talas 79.1Chui 70.7Bishkek city 69.6Osh city 71.3
Figures from MICS.
The level of demand for family planning that meets modern methods is useful for assessing the overall level of coverage of family planning programmes and services. Availability and use of effective means of preventing pregnancy enables women and their partners to exercise their rights to freely and responsibly decide on the number of children and the spacing of their births, and to have the information, education and means to do so. Meeting demand for family planning using modern methods also contributes to maternal and child health by preventing unwanted and frequent pregnancies that are at higher risk of poor obstetric outcomes. Levels of demand for modern methods of family planning of 75 per cent or more are usually considered high, while values of 50 per cent or less are usually considered very low.
Figure11. Fertility rate among adolescents aged 15-19, by territory (number of births per 1,000 girls and women in this age group)
65.0Osh city
52.1Chui
37.1Talas
36.2Jalal-Abad
35.9Kyrgyz Republic
35.2Osh
30.2Batken
28.8Issyk-Kul
24.3Bishkek city
22.7Naryn
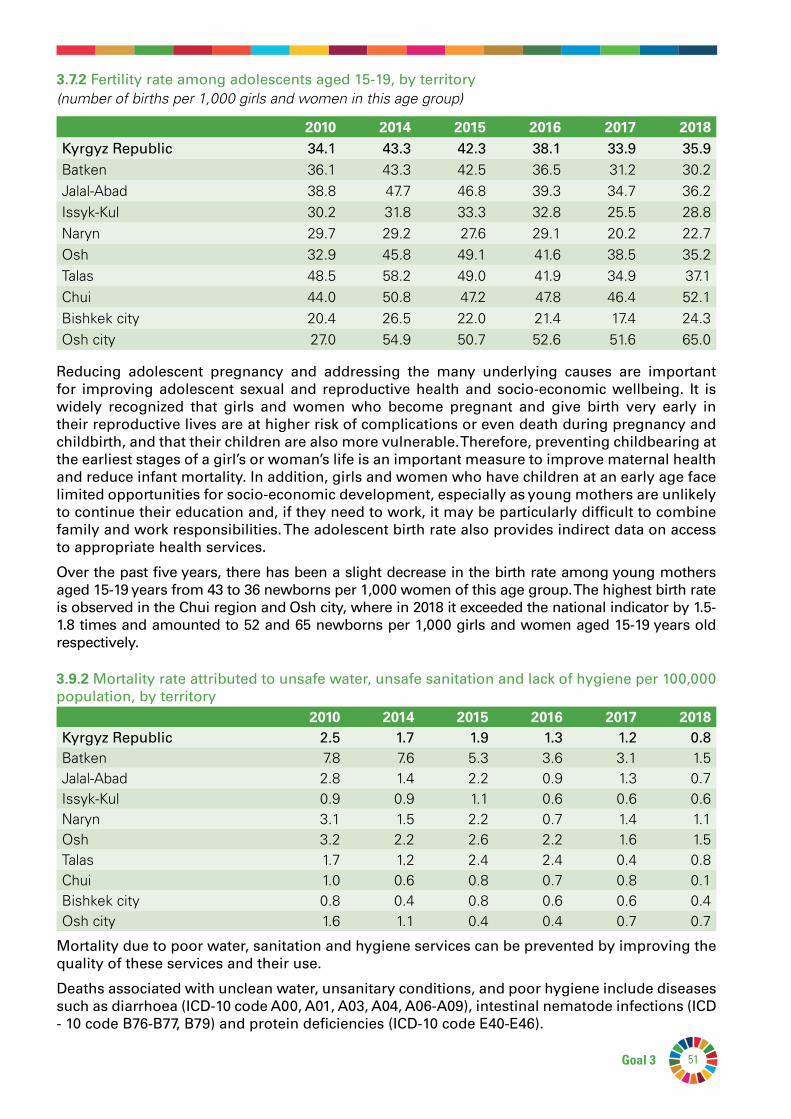
Monitoring of the Sustainable Development Goal Indicators in the Kyrgyz Republic 51Goal 3
3.7.2 Fertility rate among adolescents aged 15-19, by territory (number of births per 1,000 girls and women in this age group)
2010 2014 2015 2016 2017 2018Kyrgyz Republic 34.1 43.3 42.3 38.1 33.9 35.9Batken 36.1 43.3 42.5 36.5 31.2 30.2Jalal-Abad 38.8 47.7 46.8 39.3 34.7 36.2Issyk-Kul 30.2 31.8 33.3 32.8 25.5 28.8Naryn 29.7 29.2 27.6 29.1 20.2 22.7Osh 32.9 45.8 49.1 41.6 38.5 35.2Talas 48.5 58.2 49.0 41.9 34.9 37.1Chui 44.0 50.8 47.2 47.8 46.4 52.1Bishkek city 20.4 26.5 22.0 21.4 17.4 24.3Osh city 27.0 54.9 50.7 52.6 51.6 65.0
Reducing adolescent pregnancy and addressing the many underlying causes are important for improving adolescent sexual and reproductive health and socio-economic wellbeing. It is widely recognized that girls and women who become pregnant and give birth very early in their reproductive lives are at higher risk of complications or even death during pregnancy and childbirth, and that their children are also more vulnerable. Therefore, preventing childbearing at the earliest stages of a girl’s or woman’s life is an important measure to improve maternal health and reduce infant mortality. In addition, girls and women who have children at an early age face limited opportunities for socio-economic development, especially as young mothers are unlikely to continue their education and, if they need to work, it may be particularly difficult to combine family and work responsibilities. The adolescent birth rate also provides indirect data on access to appropriate health services.
Over the past five years, there has been a slight decrease in the birth rate among young mothers aged 15-19 years from 43 to 36 newborns per 1,000 women of this age group. The highest birth rate is observed in the Chui region and Osh city, where in 2018 it exceeded the national indicator by 1.5-1.8 times and amounted to 52 and 65 newborns per 1,000 girls and women aged 15-19 years old respectively.
3.9.2 Mortality rate attributed to unsafe water, unsafe sanitation and lack of hygiene per 100,000 population, by territory
2010 2014 2015 2016 2017 2018Kyrgyz Republic 2.5 1.7 1.9 1.3 1.2 0.8Batken 7.8 7.6 5.3 3.6 3.1 1.5Jalal-Abad 2.8 1.4 2.2 0.9 1.3 0.7Issyk-Kul 0.9 0.9 1.1 0.6 0.6 0.6Naryn 3.1 1.5 2.2 0.7 1.4 1.1Osh 3.2 2.2 2.6 2.2 1.6 1.5Talas 1.7 1.2 2.4 2.4 0.4 0.8Chui 1.0 0.6 0.8 0.7 0.8 0.1Bishkek city 0.8 0.4 0.8 0.6 0.6 0.4Osh city 1.6 1.1 0.4 0.4 0.7 0.7
Mortality due to poor water, sanitation and hygiene services can be prevented by improving the quality of these services and their use.
Deaths associated with unclean water, unsanitary conditions, and poor hygiene include diseases such as diarrhoea (ICD-10 code A00, A01, A03, A04, A06-A09), intestinal nematode infections (ICD - 10 code B76-B77, B79) and protein deficiencies (ICD-10 code E40-E46).

Monitoring of the Sustainable Development Goal Indicators in the Kyrgyz Republic52
3.9.3 Mortality rate attributed to unintentional poisoning and exposure to toxic substances per 100,000 population, by territory
2010 2014 2015 2016 2017 2018Kyrgyz Republic 9.0 6.8 7.0 6.0 5.9 6.3Batken 3.0 2.1 1.4 1.2 3.3 1.2Jalal-Abad 2.4 2.1 2.9 1.9 2.5 2.4Issyk-Kul 33.0 30.6 31.3 19.4 23.5 26.7Naryn 11.5 5.5 7.2 7.2 8.1 10.9Osh 2.5 2.7 4.0 3.4 2.3 3.4Talas 3.5 4.1 6.8 6.3 2.3 5.7Chui 11.1 7.9 6.3 7.9 7.9 7.1Bishkek city 16.3 10.0 8.1 8.1 6.6 6.5Osh city 3.9 1.9 4.4 6.1 3.5 2.7
The death rate from unintentional poisoning indicates the degree of insufficient management of dangerous chemicals and pollution, and also enables us to assess the effectiveness of measures to prevent deaths from accidental poisoning and exposure to toxic substances by the country's health system.
In recent years, there has been a downward trend in mortality from accidental poisoning and exposure to toxic substances. The highest rates are consistently observed in Issyk-Kul and Naryn regions. In 2018, the death rate from accidental poisoning and exposure to toxic substances in Issyk-Kul region was more than four times the indicator for the country as a whole.
3.b.1. Proportion of the target population covered by all vaccines included in their national programme (percentage of target group)
2010 2014 2015 2016 2017 2018
DTP vaccine coverage (for diphtheria, tetanus and pertussis) (3 doses)
Kyrgyz Republic 96.5 95.8 96.6 96.1 93.4 94.5Batken 96.8 98.9 98.6 98.1 96.7 96.6Jalal-Abad 95.9 94.8 96.1 95.8 93.8 96.1Issyk-Kul 97.2 91.3 98.0 95.9 96.1 95.0Naryn 96.8 97.6 97.2 96.8 97.0 94.8Osh 95.5 98.3 97.1 98.5 96.6 95.8Talas 96.8 93.4 96.8 95.2 93.1 95.3Chui 96.3 96.0 97.0 97.5 91.8 92.5Bishkek city 96.8 93.7 94.0 90.5 86.5 90.3Osh city 95.7 96.0 97.6 96.7 98.0 95.2
Measles vaccine coverage (MCV) (2-dose)
Kyrgyz Republic 98.3 95.6 99.1 97.0 94.7 96.2Batken 97.2 98.9 97.6 99.9 98.7 92.5Jalal-Abad 98.3 91.7 100.0 95.7 88.8 93.5Issyk-Kul 99.2 95.6 98.9 97.7 95.1 96.5Naryn 99.5 97.7 98.1 98.1 97.0 97.6Osh 99.7 96.1 99.0 99.2 96.8 98.1
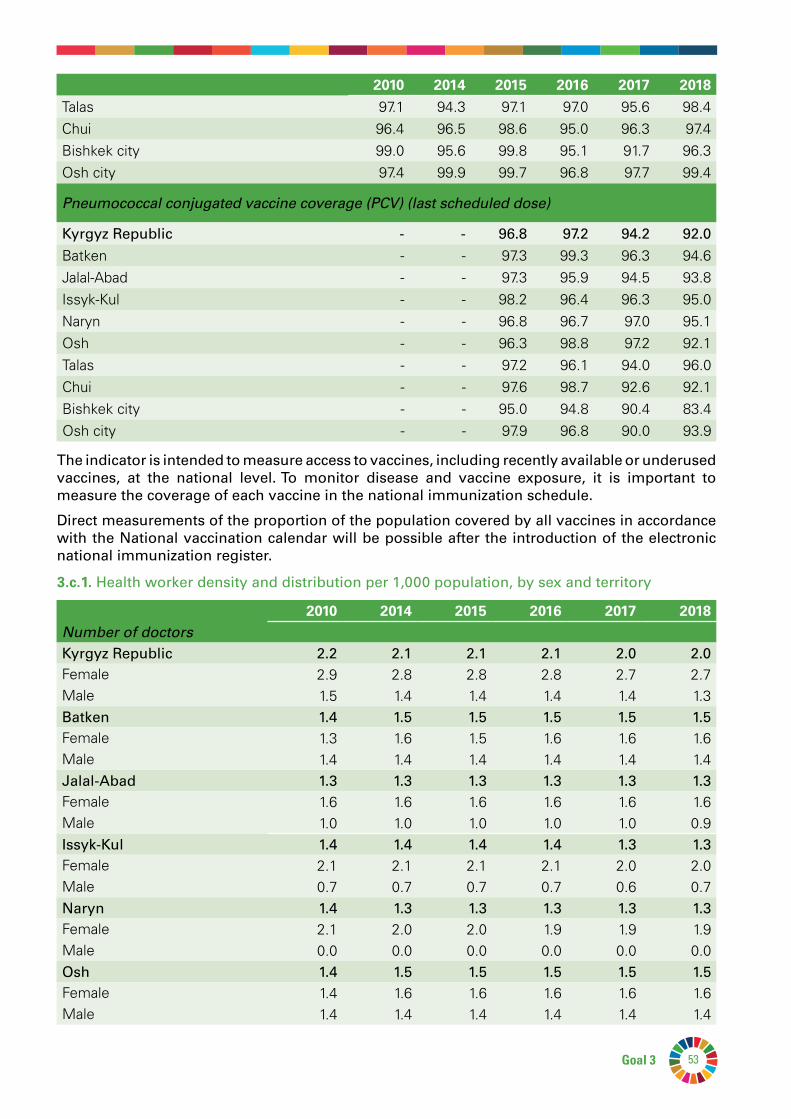
Monitoring of the Sustainable Development Goal Indicators in the Kyrgyz Republic 53Goal 3
The indicator is intended to measure access to vaccines, including recently available or underused vaccines, at the national level. To monitor disease and vaccine exposure, it is important to measure the coverage of each vaccine in the national immunization schedule.
Direct measurements of the proportion of the population covered by all vaccines in accordance with the National vaccination calendar will be possible after the introduction of the electronic national immunization register.
2010 2014 2015 2016 2017 2018Talas 97.1 94.3 97.1 97.0 95.6 98.4Chui 96.4 96.5 98.6 95.0 96.3 97.4Bishkek city 99.0 95.6 99.8 95.1 91.7 96.3Osh city 97.4 99.9 99.7 96.8 97.7 99.4
Pneumococcal conjugated vaccine coverage (PCV) (last scheduled dose)
Kyrgyz Republic - - 96.8 97.2 94.2 92.0Batken - - 97.3 99.3 96.3 94.6Jalal-Abad - - 97.3 95.9 94.5 93.8Issyk-Kul - - 98.2 96.4 96.3 95.0Naryn - - 96.8 96.7 97.0 95.1Osh - - 96.3 98.8 97.2 92.1Talas - - 97.2 96.1 94.0 96.0Chui - - 97.6 98.7 92.6 92.1Bishkek city - - 95.0 94.8 90.4 83.4Osh city - - 97.9 96.8 90.0 93.9
3.c.1. Health worker density and distribution per 1,000 population, by sex and territory
2010 2014 2015 2016 2017 2018Number of doctorsKyrgyz Republic 2.2 2.1 2.1 2.1 2.0 2.0Female 2.9 2.8 2.8 2.8 2.7 2.7Male 1.5 1.4 1.4 1.4 1.4 1.3Batken 1.4 1.5 1.5 1.5 1.5 1.5Female 1.3 1.6 1.5 1.6 1.6 1.6Male 1.4 1.4 1.4 1.4 1.4 1.4Jalal-Abad 1.3 1.3 1.3 1.3 1.3 1.3Female 1.6 1.6 1.6 1.6 1.6 1.6Male 1.0 1.0 1.0 1.0 1.0 0.9Issyk-Kul 1.4 1.4 1.4 1.4 1.3 1.3Female 2.1 2.1 2.1 2.1 2.0 2.0Male 0.7 0.7 0.7 0.7 0.6 0.7Naryn 1.4 1.3 1.3 1.3 1.3 1.3Female 2.1 2.0 2.0 1.9 1.9 1.9Male 0.0 0.0 0.0 0.0 0.0 0.0Osh 1.4 1.5 1.5 1.5 1.5 1.5Female 1.4 1.6 1.6 1.6 1.6 1.6Male 1.4 1.4 1.4 1.4 1.4 1.4

Monitoring of the Sustainable Development Goal Indicators in the Kyrgyz Republic54
2010 2014 2015 2016 2017 2018Talas 1.3 1.2 1.3 1.2 1.2 1.2Female 1.6 1.6 1.6 1.6 1.6 1.6Male 1.0 0.9 1.0 0.8 0.8 0.8Chui 1.4 1.4 1.4 1.4 1.3 1.3Female 2.1 1.9 1.9 1.9 1.9 1.9Male 0.8 0.8 0.8 0.8 0.7 0.7Bishkek city 3.0 2.6 2.6 2.5 2.5 2.4Female 4.4 3.9 3.8 3.7 3.7 3.6Male 1.3 1.2 1.2 1.2 1.1 1.1Osh city 2.4 2.7 2.7 2.5 2.5 2.5Female 3.1 3.6 3.5 3.3 3.2 3.2Male 1.6 1.8 1.8 1.7 1.8 1.7Number of dentistsKyrgyz Republic 0.3 0.3 0.3 0.3 0.3 0.3Female 0.2 0.2 0.2 0.2 0.2 0.2Male 0.4 0.4 0.4 0.5 0.5 0.5Batken 0.2 0.3 0.3 0.3 0.3 0.3Female 0.1 0.1 0.1 0.1 0.1 0.1Male 0.3 0.5 0.5 0.6 0.6 0.5Jalal-Abad 0.2 0.2 0.2 0.2 0.2 0.2Female 0.1 0.1 0.1 0.1 0.1 0.1Male 0.2 0.3 0.3 0.4 0.3 0.4Issyk-Kul 0.3 0.4 0.4 0.4 0.4 0.5Female 0.2 0.2 0.2 0.2 0.2 0.3Male 0.4 0.6 0.6 0.6 0.6 0.7Naryn 0.3 0.3 0.3 0.3 0.3 0.2Female 0.1 0.1 0.1 0.1 0.1 0.1Male 0.0 0.0 0.0 0.0 0.0 0.0Osh 0.2 0.3 0.3 0.3 0.3 0.3Female 0.1 0.1 0.1 0.1 0.1 0.1Male 0.4 0.5 0.6 0.6 0.6 0.6Talas 0.2 0.2 0.1 0.2 0.2 0.2Female 0.1 0.1 0.1 0.1 0.1 0.1Male 0.3 0.3 0.2 0.3 0.3 0.3Chui 0.3 0.3 0.3 0.3 0.3 0.3Female 0.2 0.2 0.2 0.2 0.2 0.2Male 0.4 0.4 0.4 0.4 0.4 0.5Bishkek city 0.3 0.2 0.2 0.2 0.2 0.2Female 0.4 0.2 0.2 0.2 0.2 0.2Male 0.3 0.2 0.2 0.2 0.2 0.2Osh city 0.4 0.5 0.4 0.5 0.6 0.6Female 0.3 0.3 0.4 0.4 0.3 0.4Male 0.6 0.7 0.5 0.7 0.8 0.8
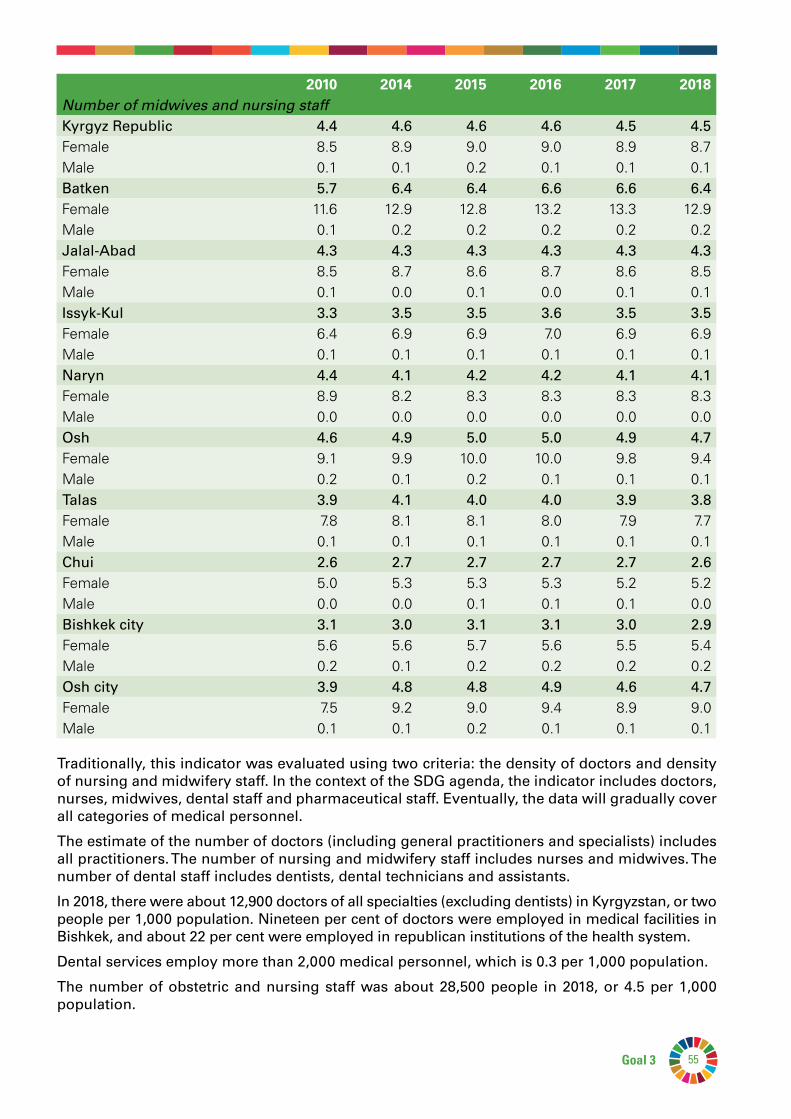
Monitoring of the Sustainable Development Goal Indicators in the Kyrgyz Republic 55Goal 3
2010 2014 2015 2016 2017 2018Number of midwives and nursing staffKyrgyz Republic 4.4 4.6 4.6 4.6 4.5 4.5Female 8.5 8.9 9.0 9.0 8.9 8.7Male 0.1 0.1 0.2 0.1 0.1 0.1Batken 5.7 6.4 6.4 6.6 6.6 6.4Female 11.6 12.9 12.8 13.2 13.3 12.9Male 0.1 0.2 0.2 0.2 0.2 0.2Jalal-Abad 4.3 4.3 4.3 4.3 4.3 4.3Female 8.5 8.7 8.6 8.7 8.6 8.5Male 0.1 0.0 0.1 0.0 0.1 0.1Issyk-Kul 3.3 3.5 3.5 3.6 3.5 3.5Female 6.4 6.9 6.9 7.0 6.9 6.9Male 0.1 0.1 0.1 0.1 0.1 0.1Naryn 4.4 4.1 4.2 4.2 4.1 4.1Female 8.9 8.2 8.3 8.3 8.3 8.3Male 0.0 0.0 0.0 0.0 0.0 0.0Osh 4.6 4.9 5.0 5.0 4.9 4.7Female 9.1 9.9 10.0 10.0 9.8 9.4Male 0.2 0.1 0.2 0.1 0.1 0.1Talas 3.9 4.1 4.0 4.0 3.9 3.8Female 7.8 8.1 8.1 8.0 7.9 7.7Male 0.1 0.1 0.1 0.1 0.1 0.1Chui 2.6 2.7 2.7 2.7 2.7 2.6Female 5.0 5.3 5.3 5.3 5.2 5.2Male 0.0 0.0 0.1 0.1 0.1 0.0Bishkek city 3.1 3.0 3.1 3.1 3.0 2.9Female 5.6 5.6 5.7 5.6 5.5 5.4Male 0.2 0.1 0.2 0.2 0.2 0.2Osh city 3.9 4.8 4.8 4.9 4.6 4.7Female 7.5 9.2 9.0 9.4 8.9 9.0Male 0.1 0.1 0.2 0.1 0.1 0.1
Traditionally, this indicator was evaluated using two criteria: the density of doctors and density of nursing and midwifery staff. In the context of the SDG agenda, the indicator includes doctors, nurses, midwives, dental staff and pharmaceutical staff. Eventually, the data will gradually cover all categories of medical personnel.
The estimate of the number of doctors (including general practitioners and specialists) includes all practitioners. The number of nursing and midwifery staff includes nurses and midwives. The number of dental staff includes dentists, dental technicians and assistants.
In 2018, there were about 12,900 doctors of all specialties (excluding dentists) in Kyrgyzstan, or two people per 1,000 population. Nineteen per cent of doctors were employed in medical facilities in Bishkek, and about 22 per cent were employed in republican institutions of the health system.
Dental services employ more than 2,000 medical personnel, which is 0.3 per 1,000 population.
The number of obstetric and nursing staff was about 28,500 people in 2018, or 4.5 per 1,000 population.
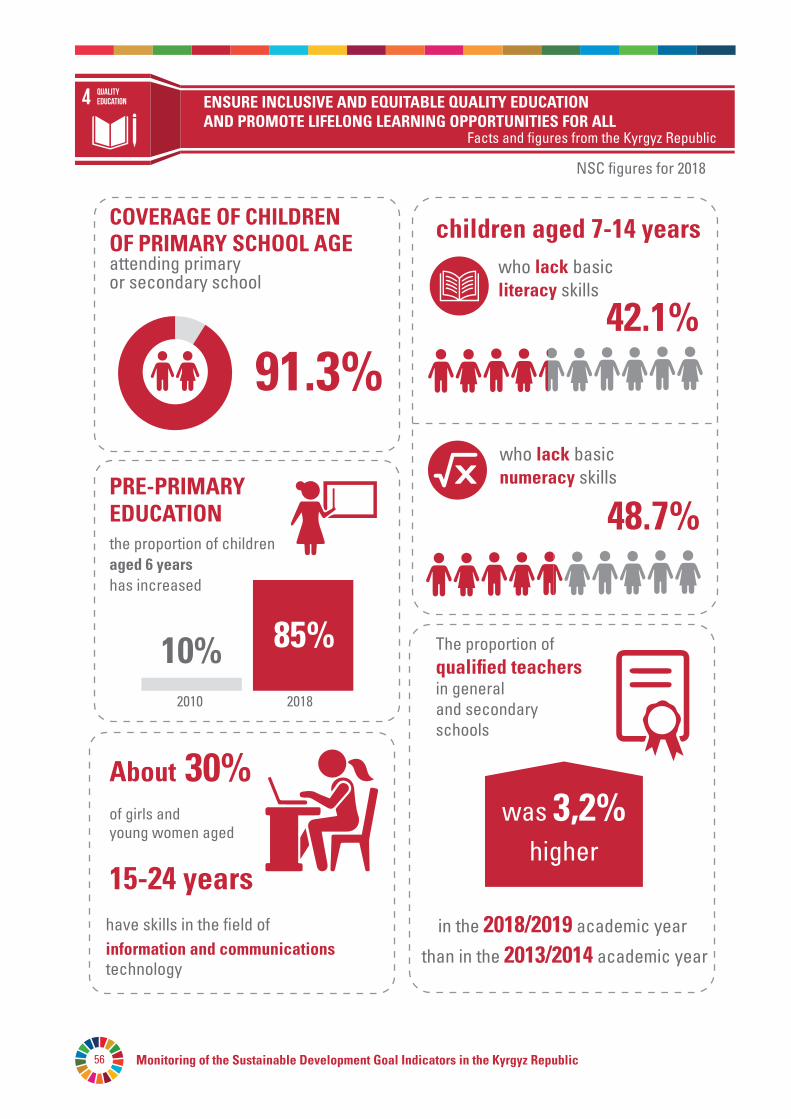
Monitoring of the Sustainable Development Goal Indicators in the Kyrgyz Republic56
ENSURE INCLUSIVE AND EQUITABLE QUALITY EDUCATION AND PROMOTE LIFELONG LEARNING OPPORTUNITIES FOR ALL
Facts and figures from the Kyrgyz Republic
NSC figures for 2018
Quality education
COVERAGE OF CHILDREN OF PRIMARY SCHOOL AGE attending primary or secondary school
91.3%42.1%
48.7%
About 30%
children aged 7-14 yearswho lack basic literacy skills
who lack basic numeracy skillsPRE-PRIMARY
EDUCATIONthe proportion of children aged 6 years has increased
2010 2018
10% 85%
have skills in the field of information and communications technology
The proportion of qualified teachersin general and secondary schools
of girls and young women aged
15-24 years
than in the 2013/2014 academic year
in the 2018/2019 academic year
was 3,2%higher
Monitoring of the Sustainable Development Goal Indicators in the Kyrgyz Republic 57Goal 4
GOAL4.ENSUREINCLUSIVEANDEQUITABLEQUALITYEDUCATIONANDPROMOTELIFELONGLEARNINGOPPORTUNITIESFORALL
A quality education lays the foundation for improving people's living conditions and ensuring sustainable development. Progress has been made in improving access to education at all levels and in increasing school enrolment, particularly for women and girls.
Despite this, more than 265 million children do not go to school, including 22 per cent of those of primary school age. There has been a increase in basic literacy, but stronger measures are needed to meet the goals of universal education. For example, the world has created equal conditions for boys and girls for primary education, but only a few countries have been able to achieve this at all levels of education.
A lack of qualified teachers and access to adequate educational institutions hinder the provision of education. Investment is needed in providing scholarships for rural schoolchildren, improving the skills of teachers, building modern educational institutions, and improving the water supply and electrification of schools.
Targets:
4.1 By 2030, ensure that all girls and boys complete free, equitable and quality primary and secondary education that leads to relevant and effective learning outcomes.
4.2 By 2030, ensure that all girls and boys have access to quality early childhood development, care and pre-primary education so that they are ready for primary education.
4.3 By 2030, ensure equal access for all women and men to affordable and quality technical, vocational and tertiary education, including university.
4.4 By 2030, substantially increase the number of youth and adults who have relevant skills, including technical and vocational skills, for employment, decent jobs and entrepreneurships.
4.5 By 2030, eliminate gender disparities in education and ensure equal access to all levels of education and vocational training for the vulnerable, including persons with disabilities, indigenous peoples and children in vulnerable situations.
4.6 By 2030, ensure that all youth and a substantial proportion of adults, both men and women, achieve literacy and numeracy skills.
4.7 By 2030, ensure that all learners acquire the knowledge and skills needed to promote sustainable development, including, among others, through education for sustainable development and sustainable lifestyles, human rights, gender equality, promotion of a culture of peace and non-violence, global citizenship and appreciation of cultural diversity and of culture’s contribution to sustainable development.
4.a Build and upgrade education facilities that are child, disability and gender sensitive and provide safe, non-violent, inclusive and effective learning environments for all.
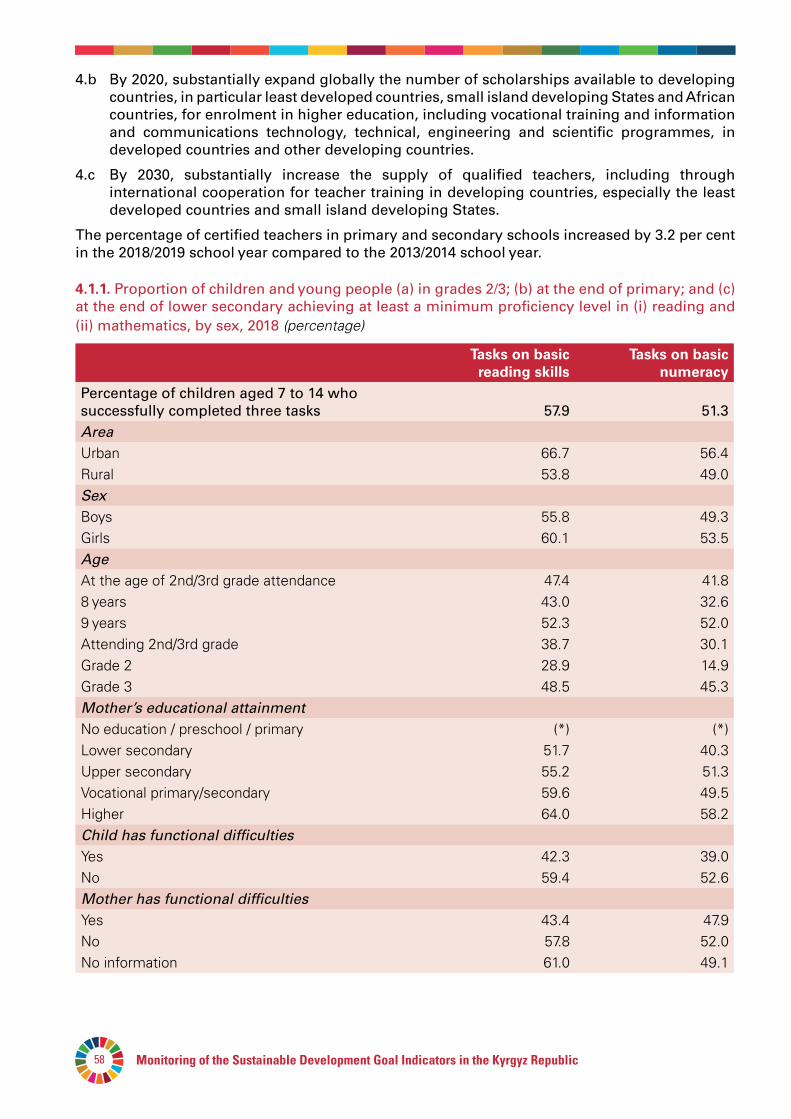
Monitoring of the Sustainable Development Goal Indicators in the Kyrgyz Republic58
4.b By 2020, substantially expand globally the number of scholarships available to developing countries, in particular least developed countries, small island developing States and African countries, for enrolment in higher education, including vocational training and information and communications technology, technical, engineering and scientific programmes, in developed countries and other developing countries.
4.c By 2030, substantially increase the supply of qualified teachers, including through international cooperation for teacher training in developing countries, especially the least developed countries and small island developing States.
The percentage of certified teachers in primary and secondary schools increased by 3.2 per cent in the 2018/2019 school year compared to the 2013/2014 school year.
4.1.1. Proportion of children and young people (a) in grades 2/3; (b) at the end of primary; and (c) at the end of lower secondary achieving at least a minimum proficiency level in (i) reading and (ii) mathematics, by sex, 2018 (percentage)
Tasksonbasicreadingskills
Tasksonbasicnumeracy
Percentage of children aged 7 to 14 who successfully completed three tasks 57.9 51.3AreaUrban 66.7 56.4Rural 53.8 49.0Sex Boys 55.8 49.3Girls 60.1 53.5Age At the age of 2nd/3rd grade attendance 47.4 41.88 years 43.0 32.69 years 52.3 52.0Attending 2nd/3rd grade 38.7 30.1Grade 2 28.9 14.9Grade 3 48.5 45.3Mother’s educational attainmentNo education / preschool / primary (*) (*)Lower secondary 51.7 40.3Upper secondary 55.2 51.3Vocational primary/secondary 59.6 49.5Higher 64.0 58.2Child has functional difficultiesYes 42.3 39.0No 59.4 52.6Mother has functional difficultiesYes 43.4 47.9No 57.8 52.0No information 61.0 49.1
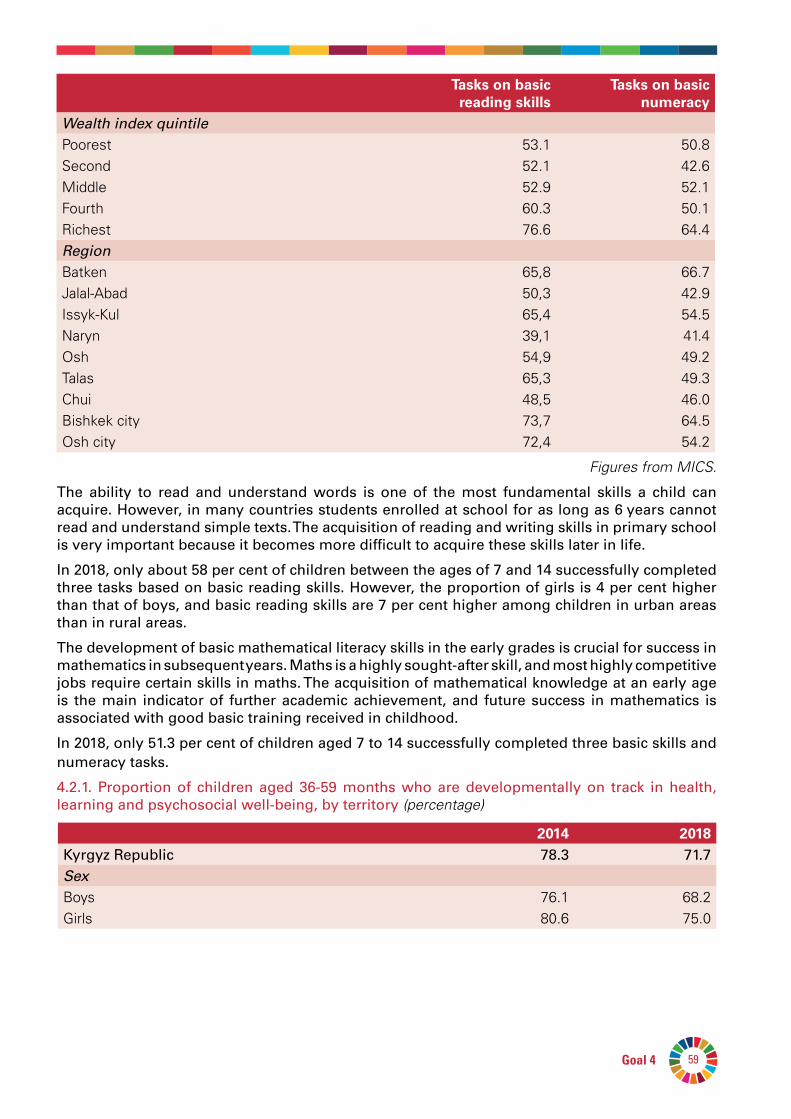
Monitoring of the Sustainable Development Goal Indicators in the Kyrgyz Republic 59Goal 4
Tasksonbasicreadingskills
Tasksonbasicnumeracy
Wealth index quintilePoorest 53.1 50.8Second 52.1 42.6Middle 52.9 52.1Fourth 60.3 50.1Richest 76.6 64.4Region Batken 65,8 66.7Jalal-Abad 50,3 42.9Issyk-Kul 65,4 54.5Naryn 39,1 41.4Osh 54,9 49.2Talas 65,3 49.3Chui 48,5 46.0Bishkek city 73,7 64.5Osh city 72,4 54.2
Figures from MICS.
The ability to read and understand words is one of the most fundamental skills a child can acquire. However, in many countries students enrolled at school for as long as 6 years cannot read and understand simple texts. The acquisition of reading and writing skills in primary school is very important because it becomes more difficult to acquire these skills later in life.
In 2018, only about 58 per cent of children between the ages of 7 and 14 successfully completed three tasks based on basic reading skills. However, the proportion of girls is 4 per cent higher than that of boys, and basic reading skills are 7 per cent higher among children in urban areas than in rural areas.
The development of basic mathematical literacy skills in the early grades is crucial for success in mathematics in subsequent years. Maths is a highly sought-after skill, and most highly competitive jobs require certain skills in maths. The acquisition of mathematical knowledge at an early age is the main indicator of further academic achievement, and future success in mathematics is associated with good basic training received in childhood.
In 2018, only 51.3 per cent of children aged 7 to 14 successfully completed three basic skills and numeracy tasks.
4.2.1. Proportion of children aged 36-59 months who are developmentally on track in health, learning and psychosocial well-being, by territory (percentage)
2014 2018Kyrgyz Republic 78.3 71.7Sex Boys 76.1 68.2Girls 80.6 75.0
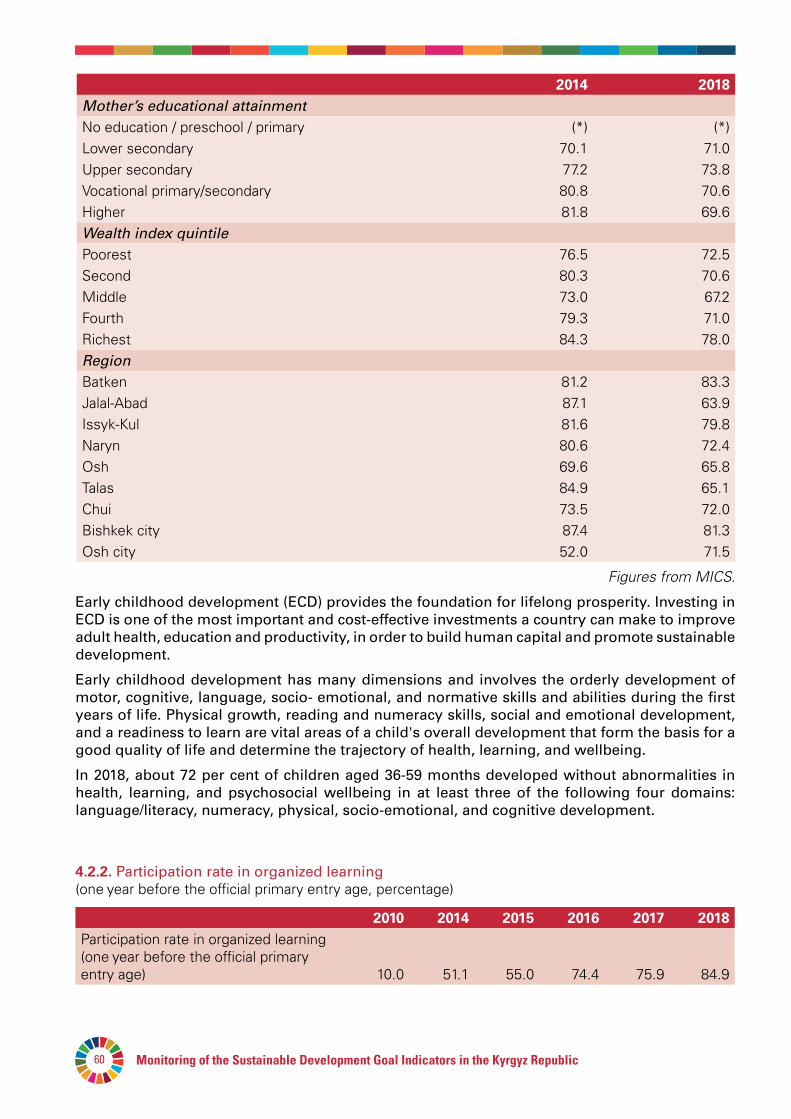
Monitoring of the Sustainable Development Goal Indicators in the Kyrgyz Republic60
2014 2018Mother’s educational attainmentNo education / preschool / primary (*) (*)Lower secondary 70.1 71.0Upper secondary 77.2 73.8Vocational primary/secondary 80.8 70.6Higher 81.8 69.6Wealth index quintilePoorest 76.5 72.5Second 80.3 70.6Middle 73.0 67.2Fourth 79.3 71.0Richest 84.3 78.0Region Batken 81.2 83.3Jalal-Abad 87.1 63.9Issyk-Kul 81.6 79.8Naryn 80.6 72.4Osh 69.6 65.8Talas 84.9 65.1Chui 73.5 72.0Bishkek city 87.4 81.3Osh city 52.0 71.5
Figures from MICS.
Early childhood development (ECD) provides the foundation for lifelong prosperity. Investing in ECD is one of the most important and cost-effective investments a country can make to improve adult health, education and productivity, in order to build human capital and promote sustainable development.
Early childhood development has many dimensions and involves the orderly development of motor, cognitive, language, socio- emotional, and normative skills and abilities during the first years of life. Physical growth, reading and numeracy skills, social and emotional development, and a readiness to learn are vital areas of a child's overall development that form the basis for a good quality of life and determine the trajectory of health, learning, and wellbeing.
In 2018, about 72 per cent of children aged 36-59 months developed without abnormalities in health, learning, and psychosocial wellbeing in at least three of the following four domains: language/literacy, numeracy, physical, socio-emotional, and cognitive development.
4.2.2. Participation rate in organized learning (one year before the official primary entry age, percentage)
2010 2014 2015 2016 2017 2018Participation rate in organized learning (one year before the official primary entry age) 10.0 51.1 55.0 74.4 75.9 84.9
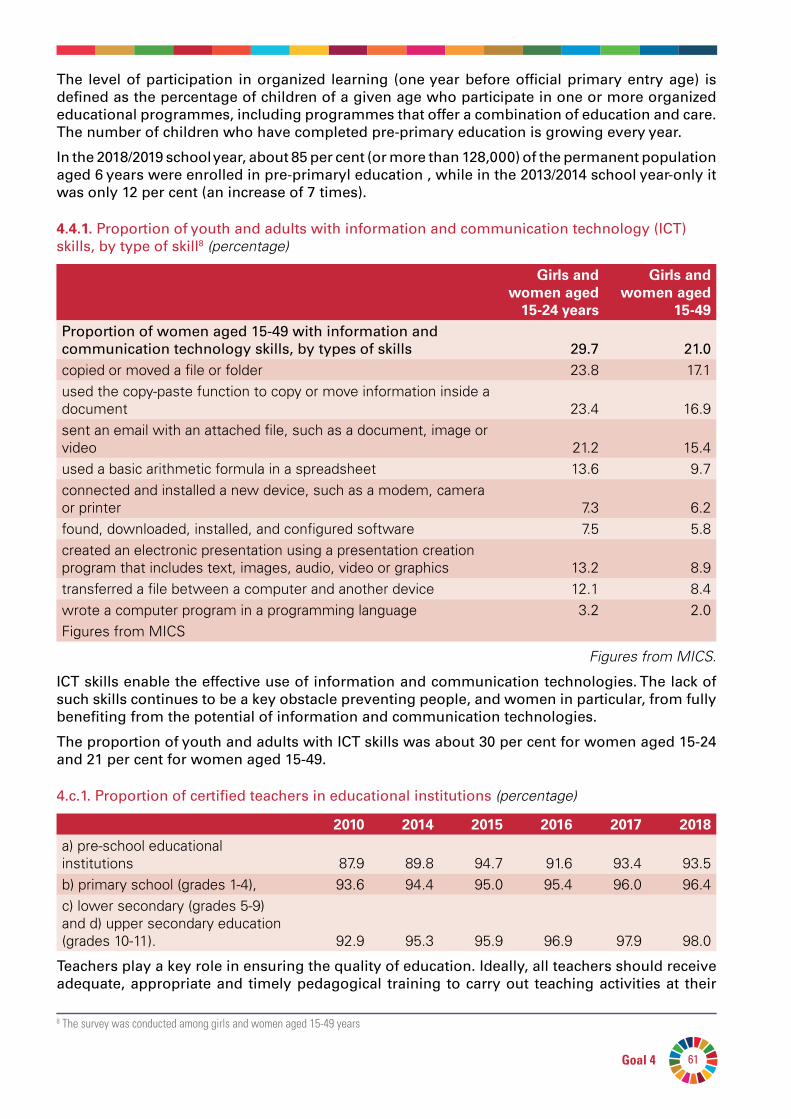
Monitoring of the Sustainable Development Goal Indicators in the Kyrgyz Republic 61Goal 4
The level of participation in organized learning (one year before official primary entry age) is defined as the percentage of children of a given age who participate in one or more organized educational programmes, including programmes that offer a combination of education and care. The number of children who have completed pre-primary education is growing every year.
In the 2018/2019 school year, about 85 per cent (or more than 128,000) of the permanent population aged 6 years were enrolled in pre-primaryl education , while in the 2013/2014 school year-only it was only 12 per cent (an increase of 7 times).
4.4.1. Proportion of youth and adults with information and communication technology (ICT) skills, by type of skill8 (percentage)
Girlsandwomenaged15-24years
Girlsandwomenaged
15-49Proportion of women aged 15-49 with information and communication technology skills, by types of skills 29.7 21.0copied or moved a file or folder 23.8 17.1used the copy-paste function to copy or move information inside a document 23.4 16.9sent an email with an attached file, such as a document, image or video 21.2 15.4used a basic arithmetic formula in a spreadsheet 13.6 9.7connected and installed a new device, such as a modem, camera or printer 7.3 6.2found, downloaded, installed, and configured software 7.5 5.8created an electronic presentation using a presentation creation program that includes text, images, audio, video or graphics 13.2 8.9transferred a file between a computer and another device 12.1 8.4wrote a computer program in a programming language 3.2 2.0Figures from MICS
Figures from MICS.
ICT skills enable the effective use of information and communication technologies. The lack of such skills continues to be a key obstacle preventing people, and women in particular, from fully benefiting from the potential of information and communication technologies.
The proportion of youth and adults with ICT skills was about 30 per cent for women aged 15-24 and 21 per cent for women aged 15-49.
4.c.1. Proportion of certified teachers in educational institutions (percentage)
2010 2014 2015 2016 2017 2018a) pre-school educational institutions 87.9 89.8 94.7 91.6 93.4 93.5b) primary school (grades 1-4), 93.6 94.4 95.0 95.4 96.0 96.4c) lower secondary (grades 5-9) and d) upper secondary education (grades 10-11). 92.9 95.3 95.9 96.9 97.9 98.0
Teachers play a key role in ensuring the quality of education. Ideally, all teachers should receive adequate, appropriate and timely pedagogical training to carry out teaching activities at their
8 The survey was conducted among girls and women aged 15-49 years
Monitoring of the Sustainable Development Goal Indicators in the Kyrgyz Republic62
chosen level of education and be highly qualified specialists in the subject(s) they teach. This indicator measures the proportion of the teaching workforce that is pedagogically well-prepared.
The indicator describes the percentage of teachers, grouped according to their own level of education (pre-school, primary, secondary and vocational), who have received at least a minimum of organized pedagogical training before starting their activities and meet the minimum set of requirements necessary for carrying out pedagogical activities.
At the end of 2018, more than 11,000 teachers worked in preschool institutions in the country, including managers, methodologists, educators, music teachers, speech pathologists, speech therapists and other teachers. More than 66 per cent of them had a higher education, and more than 27 per cent had a secondary vocational education. The proportion of certified teachers in pre-school educational organizations had increased by 5.6 percentage points between 2010 and 2018, and by 4.7 percentage points between 2013 and 2018.
One of the most common and popular professions is teaching. The professional level of teaching staff is quite high. At the beginning of the 2018/2019 school year, more than 96 per cent of all primary school teachers (grades 1-4) and 98 per cent of all secondary school teachers (grades 5-110 had a higher or secondary special education. The percentage of certified teachers in primary and secondary schools had increased by 3.2 per cent compared to the 2013/2014 school year.
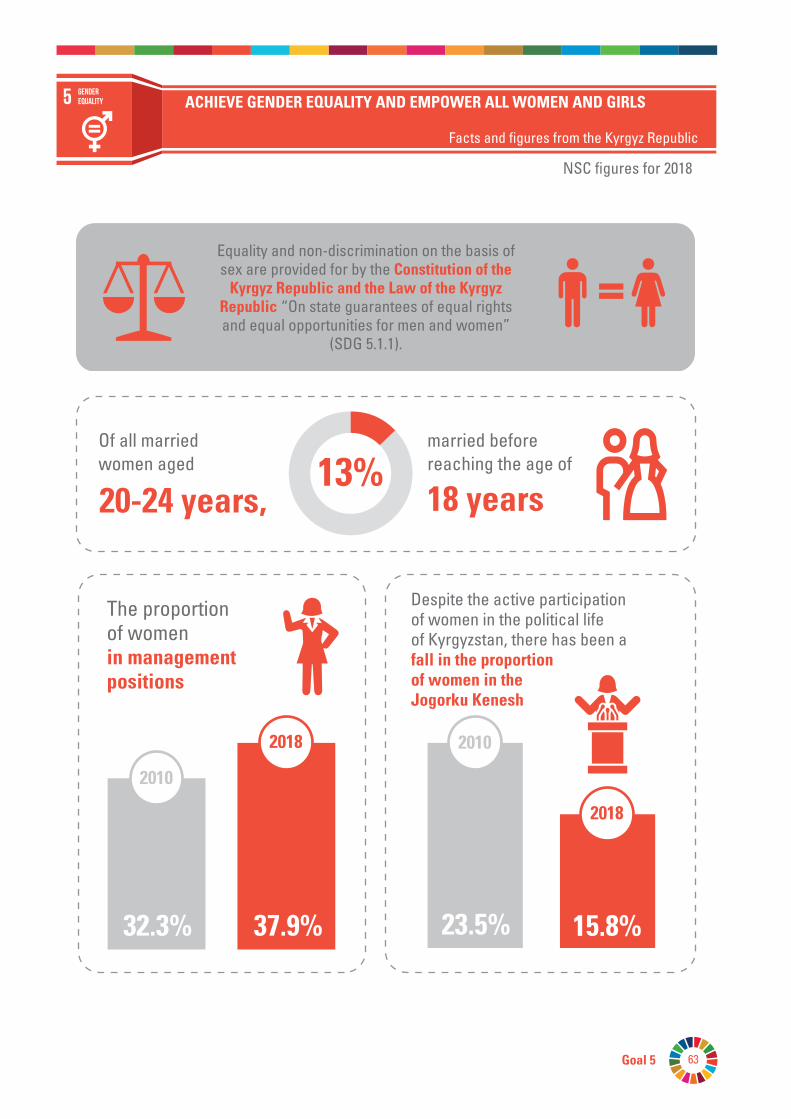
63Goal 5Monitoring of the Sustainable Development Goal Indicators in the Kyrgyz Republic
NSC figures for 2018
ACHIEVE GENDER EQUALITY AND EMPOWER ALL WOMEN AND GIRLS
Facts and figures from the Kyrgyz Republic
Genderequality
Of all married women aged
Despite the active participation of women in the political life of Kyrgyzstan, there has been a fall in the proportion of women in the Jogorku Kenesh
The proportion of women in management positions
18 years20-24 years,
married before reaching the age of
23.5%
2018
2018
15.8%32.3% 37.9%
Equality and non-discrimination on the basis of sex are provided for by the Constitution of the
Kyrgyz Republic and the Law of the Kyrgyz Republic “On state guarantees of equal rights and equal opportunities for men and women”
(SDG 5.1.1).
13%
2010
2010

Monitoring of the Sustainable Development Goal Indicators in the Kyrgyz Republic64
NSC figures for 2018
In 2018of all the population aged
15 years and older
had their own mobile telephones
91%93%
more time on it than men
they continue to perform unpaid housework
Despite the growing participation
of women in public life
spending
3 times
and facilities providing social and psychological support to the population in cases of violence
THE NUMBER OF PEOPLE SEEKING ASSISTANCE FROM CRISIS CENTRES
domes
tic violence
other
forced marriage, kidnapping for purpose of marriage, child marriage, polygamy
forced marriage, kidnapping for purpose of marriage, child marriage, polygamy:
sexual violence
human traffickingdivorce, division of property
divorce, division of property
377human trafficking
95
35
12
133 4,644
4,066
other4,633
1 526
domestic violence896
a tota
l of 1
0,79
3 wom
ena total of 5,964 men
340
ACHIEVE GENDER EQUALITY AND EMPOWER ALL WOMEN AND GIRLS
Facts and figures from the Kyrgyz Republic
Genderequality
Monitoring of the Sustainable Development Goal Indicators in the Kyrgyz Republic 65Goal 5
GOAL5.ACHIEVEGENDEREQUALITYANDEMPOWERALLWOMENANDGIRLS
The Millennium Development Goals facilitated some progress in achieving gender equality (including equal access to primary education for both boys and girls), but women and girls around the world continue to suffer from discrimination and violence.
Gender equality is not only a fundamental human right, but is also a necessary foundation for achieving peace, prosperity and sustainable development. Unfortunately, according to some estimates one in five women and girls aged 15-49 experience physical or sexual violence at least once in their lives. Forty-nine countries still do not have legislation criminalizing domestic violence. Globally, the number of cases of female genital mutilation has decreased by 30 per cent, but there is still a lot of work to do.
Providing women and girls with equal access to education, health care, decent work and participation in political and economic decision-making processes will contribute to achieving economic sustainability and benefit society and humanity as a whole. Gender equality and the empowerment of women and girls will require increased efforts, including strengthening the legal framework, to combat the deep-rooted practice of gender discrimination, which is often the result of patriarchal attitudes and related social norms.
Targets:
5.1 End all forms of discrimination against all women and girls everywhere.
5.2 Eliminate all forms of violence against all women and girls in the public and private spheres, including trafficking, and sexual and other types of exploitation.
5.3 Eliminate all harmful practices, such as child, early and forced marriage and female genital mutilation.
5.4 Recognize and value unpaid care and domestic work through the provision of public services, infrastructure and social protection policies and the promotion of shared responsibility within the household and the family as nationally appropriate.
5.5 Ensure women’s full and effective participation and equal opportunities for leadership at all levels of decision-making in political, economic and public life.
5.6 Ensure universal access to sexual and reproductive health and reproductive rights as agreed in accordance with the Program of Action of the International Conference on Population and Development and the Beijing Platform for Action and the outcome documents of their review conferences.
5.a Undertake reforms to give women equal rights to economic resources, as well as access to ownership and control over land and other forms of property, financial services, inheritance and natural resources, in accordance with national laws.
5.b Enhance the use of enabling technology, in particular information and communications technology, to promote the empowerment of women.
5.c Adopt and strengthen sound policies and enforceable legislation for the promotion of gender equality and the empowerment of all women and girls at all levels.
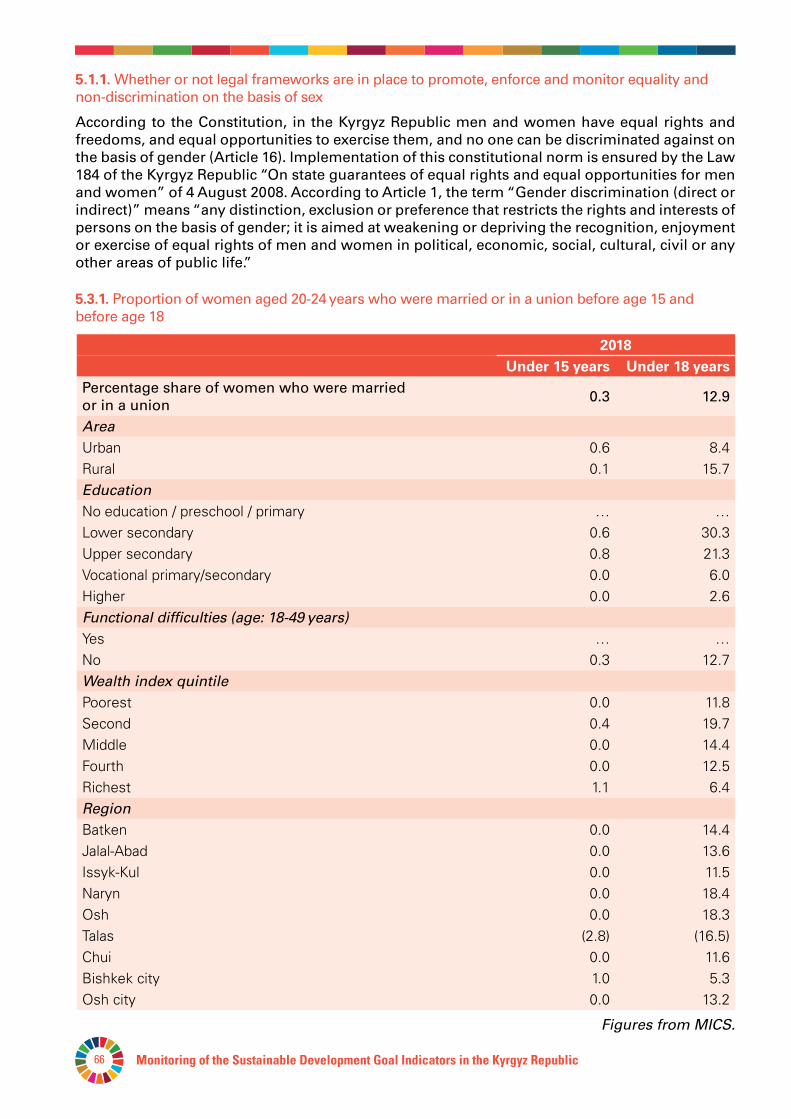
Monitoring of the Sustainable Development Goal Indicators in the Kyrgyz Republic66
5.1.1.Whether or not legal frameworks are in place to promote, enforce and monitor equality and non-discrimination on the basis of sex
According to the Constitution, in the Kyrgyz Republic men and women have equal rights and freedoms, and equal opportunities to exercise them, and no one can be discriminated against on the basis of gender (Article 16). Implementation of this constitutional norm is ensured by the Law 184 of the Kyrgyz Republic “On state guarantees of equal rights and equal opportunities for men and women” of 4 August 2008. According to Article 1, the term “Gender discrimination (direct or indirect)” means “any distinction, exclusion or preference that restricts the rights and interests of persons on the basis of gender; it is aimed at weakening or depriving the recognition, enjoyment or exercise of equal rights of men and women in political, economic, social, cultural, civil or any other areas of public life.”
5.3.1. Proportion of women aged 20-24 years who were married or in a union before age 15 and before age 18
2018Under15years Under18years
Percentage share of women who were married or in a union 0.3 12.9
AreaUrban 0.6 8.4Rural 0.1 15.7Education No education / preschool / primary … …Lower secondary 0.6 30.3Upper secondary 0.8 21.3Vocational primary/secondary 0.0 6.0Higher 0.0 2.6Functional difficulties (age: 18-49 years)Yes … …No 0.3 12.7Wealth index quintilePoorest 0.0 11.8Second 0.4 19.7Middle 0.0 14.4Fourth 0.0 12.5Richest 1.1 6.4Region Batken 0.0 14.4Jalal-Abad 0.0 13.6Issyk-Kul 0.0 11.5Naryn 0.0 18.4Osh 0.0 18.3Talas (2.8) (16.5)Chui 0.0 11.6Bishkek city 1.0 5.3Osh city 0.0 13.2
Figures from MICS.
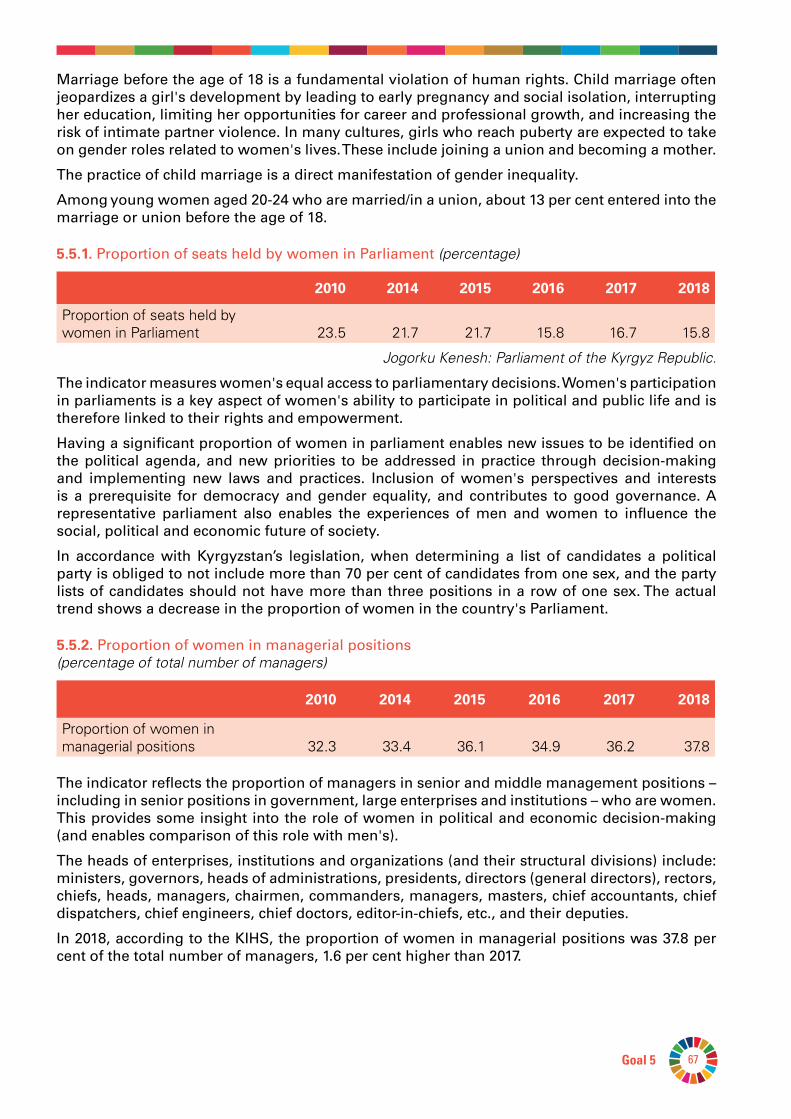
Monitoring of the Sustainable Development Goal Indicators in the Kyrgyz Republic 67Goal 5
Marriage before the age of 18 is a fundamental violation of human rights. Child marriage often jeopardizes a girl's development by leading to early pregnancy and social isolation, interrupting her education, limiting her opportunities for career and professional growth, and increasing the risk of intimate partner violence. In many cultures, girls who reach puberty are expected to take on gender roles related to women's lives. These include joining a union and becoming a mother.
The practice of child marriage is a direct manifestation of gender inequality.
Among young women aged 20-24 who are married/in a union, about 13 per cent entered into the marriage or union before the age of 18.
5.5.1. Proportion of seats held by women in Parliament (percentage)
2010 2014 2015 2016 2017 2018
Proportion of seats held by women in Parliament 23.5 21.7 21.7 15.8 16.7 15.8
Jogorku Kenesh: Parliament of the Kyrgyz Republic.
The indicator measures women's equal access to parliamentary decisions. Women's participation in parliaments is a key aspect of women's ability to participate in political and public life and is therefore linked to their rights and empowerment.
Having a significant proportion of women in parliament enables new issues to be identified on the political agenda, and new priorities to be addressed in practice through decision-making and implementing new laws and practices. Inclusion of women's perspectives and interests is a prerequisite for democracy and gender equality, and contributes to good governance. A representative parliament also enables the experiences of men and women to influence the social, political and economic future of society.
In accordance with Kyrgyzstan’s legislation, when determining a list of candidates a political party is obliged to not include more than 70 per cent of candidates from one sex, and the party lists of candidates should not have more than three positions in a row of one sex. The actual trend shows a decrease in the proportion of women in the country's Parliament.
5.5.2. Proportion of women in managerial positions (percentage of total number of managers)
2010 2014 2015 2016 2017 2018
Proportion of women in managerial positions 32.3 33.4 36.1 34.9 36.2 37.8
The indicator reflects the proportion of managers in senior and middle management positions – including in senior positions in government, large enterprises and institutions – who are women. This provides some insight into the role of women in political and economic decision-making (and enables comparison of this role with men's).
The heads of enterprises, institutions and organizations (and their structural divisions) include: ministers, governors, heads of administrations, presidents, directors (general directors), rectors, chiefs, heads, managers, chairmen, commanders, managers, masters, chief accountants, chief dispatchers, chief engineers, chief doctors, editor-in-chiefs, etc., and their deputies.
In 2018, according to the KIHS, the proportion of women in managerial positions was 37.8 per cent of the total number of managers, 1.6 per cent higher than 2017.
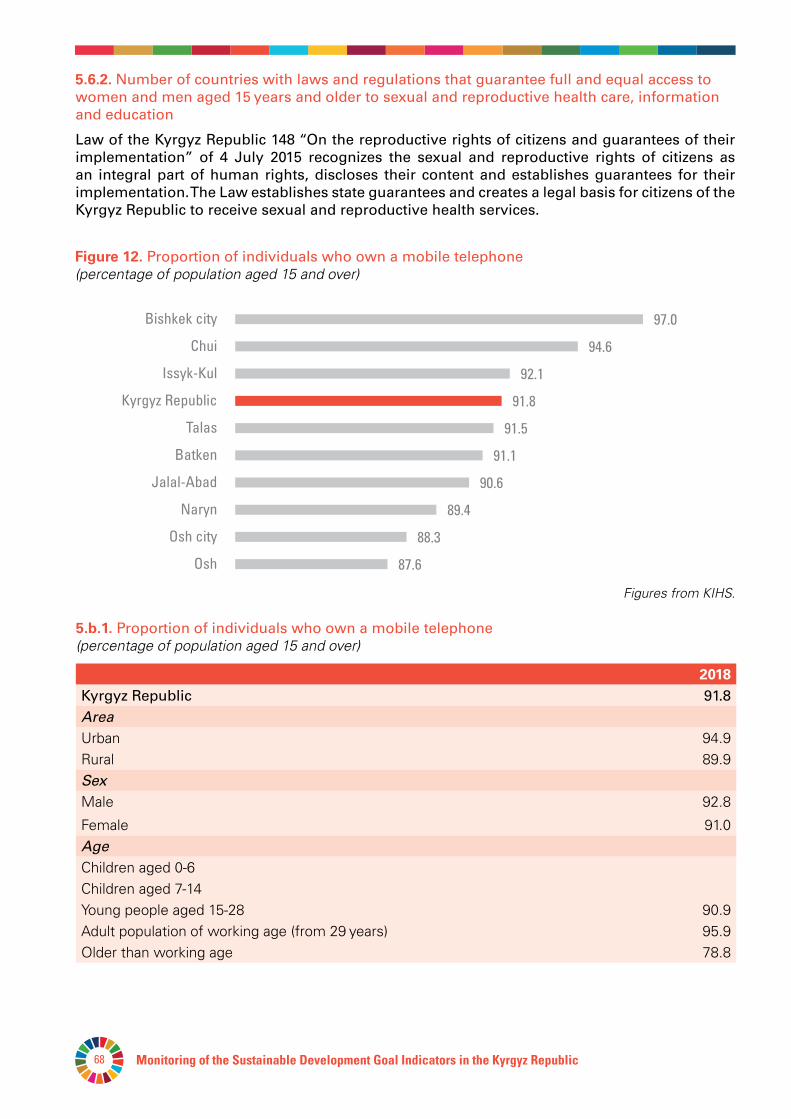
Monitoring of the Sustainable Development Goal Indicators in the Kyrgyz Republic68
5.6.2.Number of countries with laws and regulations that guarantee full and equal access to women and men aged 15 years and older to sexual and reproductive health care, information and education
Law of the Kyrgyz Republic 148 “On the reproductive rights of citizens and guarantees of their implementation” of 4 July 2015 recognizes the sexual and reproductive rights of citizens as an integral part of human rights, discloses their content and establishes guarantees for their implementation. The Law establishes state guarantees and creates a legal basis for citizens of the Kyrgyz Republic to receive sexual and reproductive health services.
5.b.1. Proportion of individuals who own a mobile telephone (percentage of population aged 15 and over)
2018Kyrgyz Republic 91.8AreaUrban 94.9Rural 89.9Sex Male 92.8
Female 91.0AgeChildren aged 0-6 Children aged 7-14Young people aged 15-28 90.9Adult population of working age (from 29 years) 95.9Older than working age 78.8
97.0Bishkek city
94.6Chui
92.1Issyk-Kul
91.8Kyrgyz Republic
91.5Talas
91.1Batken
90.6Jalal-Abad
89.4Naryn
88.3Osh city
87.6Osh
82. 0 84. 0 86. 0 88. 0 90. 0 92. 0
Figure12. Proportion of individuals who own a mobile telephone(percentage of population aged 15 and over)
Figures from KIHS.
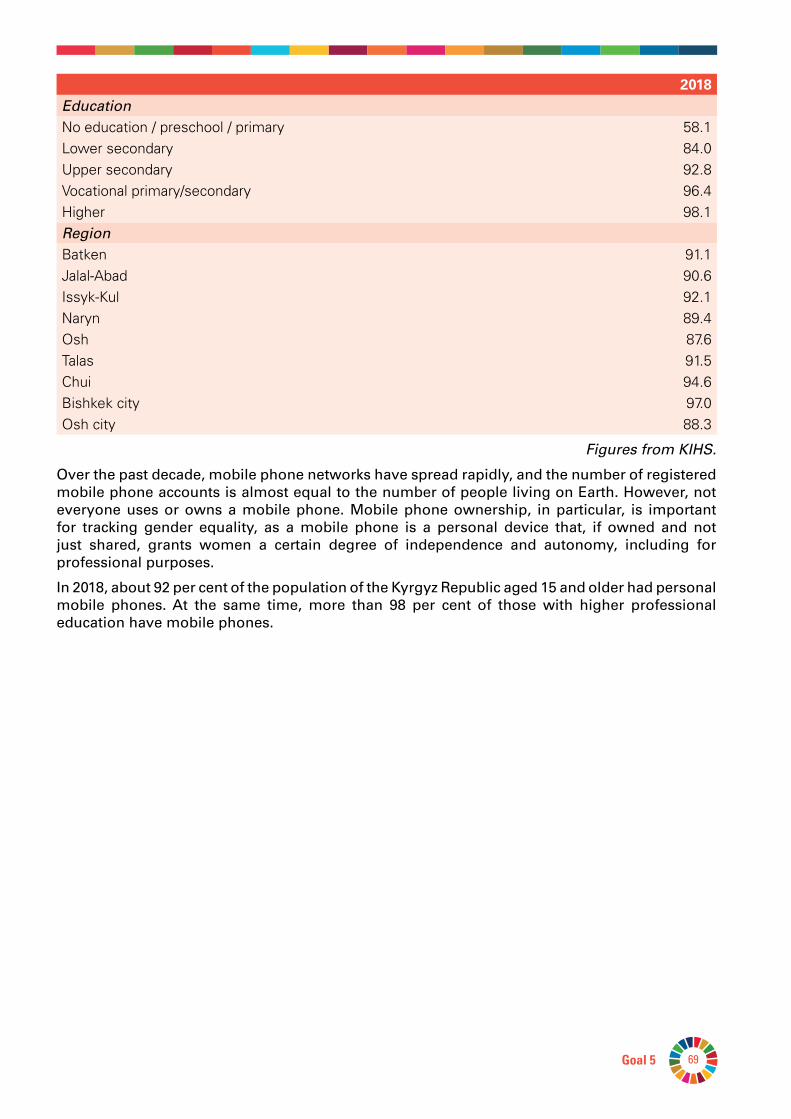
Monitoring of the Sustainable Development Goal Indicators in the Kyrgyz Republic 69Goal 5
2018EducationNo education / preschool / primary 58.1Lower secondary 84.0Upper secondary 92.8Vocational primary/secondary 96.4Higher 98.1Region Batken 91.1Jalal-Abad 90.6Issyk-Kul 92.1Naryn 89.4Osh 87.6Talas 91.5Chui 94.6Bishkek city 97.0Osh city 88.3
Figures from KIHS.
Over the past decade, mobile phone networks have spread rapidly, and the number of registered mobile phone accounts is almost equal to the number of people living on Earth. However, not everyone uses or owns a mobile phone. Mobile phone ownership, in particular, is important for tracking gender equality, as a mobile phone is a personal device that, if owned and not just shared, grants women a certain degree of independence and autonomy, including for professional purposes.
In 2018, about 92 per cent of the population of the Kyrgyz Republic aged 15 and older had personal mobile phones. At the same time, more than 98 per cent of those with higher professional education have mobile phones.
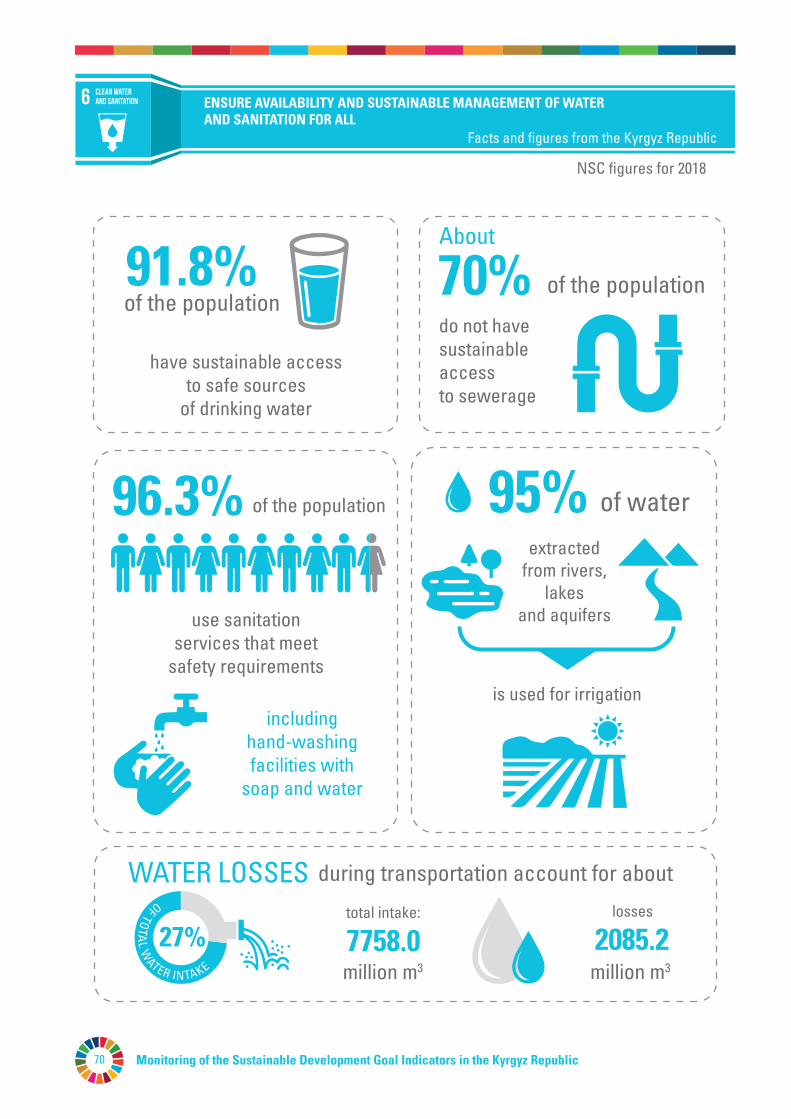
Monitoring of the Sustainable Development Goal Indicators in the Kyrgyz Republic70
96.3% 95%of the population
ENSURE AVAILABILITY AND SUSTAINABLE MANAGEMENT OF WATER AND SANITATION FOR ALL
Facts and figures from the Kyrgyz Republic
NSC figures for 2018
Clean water and sanitation
includinghand-washingfacilities with
soap and water
use sanitationservices that meet
safety requirements
of water
extractedfrom rivers,
lakesand aquifers
is used for irrigation
WATER LOSSES during transportation account for about
have sustainable accessto safe sources
of drinking water
do not have sustainable access to sewerage
About
91.8%of the population
70% of the population
27%
OF TOTA
L WATER INTAKE
total intake:
7758.0million m3 million m3
losses
2085.2
Monitoring of the Sustainable Development Goal Indicators in the Kyrgyz Republic 71Goal 6
GOAL6.ENSUREAVAILABILITYANDSUSTAINABLEMANAGEMENTOFWATERANDSANITATIONFORALL
Clean and accessible water resources for all are an integral part of the world we would like to live in. There is enough fresh water on the planet to achieve this goal. But, because of an ill-conceived economy and weak infrastructure, millions of people, most of them children, die every year from diseases linked to inadequate water, sanitation and hygiene.
Water scarcity, poor water quality and inadequate sanitation negatively affect food security, livelihood choices and educational opportunities for poor families around the world. Drought is affecting some of the world's poorest countries, worsening hunger and malnutrition. Today, two million people in the world do not have adequate access to clean drinking water. By 2050, almost one in four people on the planet is likely to live in a country experiencing chronic or periodic freshwater shortages.
In order to improve the situation, investments are needed in water resource management, especially in developing countries.
Targets:
6.1 By 2030, achieve universal and equitable access to safe and affordable drinking water for all.
6.2 By 2030, achieve access to adequate and equitable sanitation and hygiene for all and end open defecation, paying special attention to the needs of women and girls and those in vulnerable situations.
6.3 By 2030, improve water quality by reducing pollution, eliminating dumping and minimizing release of hazardous chemicals and materials, halving the proportion of untreated wastewater and substantially increasing recycling and safe reuse globally.
6.4 By 2030, substantially increase water-use efficiency across all sectors and ensure sustainable withdrawals and supply of freshwater to address water scarcity and substantially reduce the number of people suffering from water scarcity.
6.5 By 2030, implement integrated water resources management at all levels, including through transboundary cooperation as appropriate.
6.6 By 2020, protect and restore water-related ecosystems, including mountains, forests, wetlands, rivers, aquifers and lakes.
6.a By 2030, expand international cooperation and capacity-building support to developing countries in water- and sanitation-related activities and programmes, including water harvesting, desalination, water efficiency, wastewater treatment, recycling and reuse technologies.
6.b Support and strengthen the participation of local communities in improving water and sanitation management.
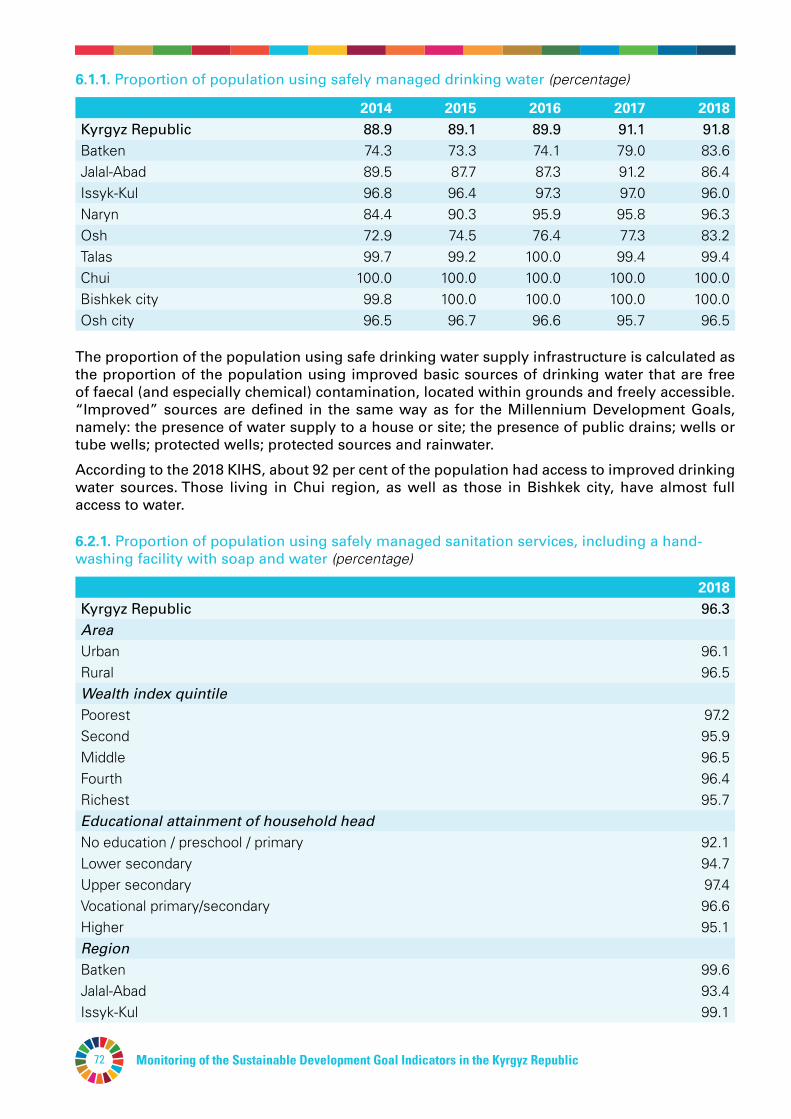
Monitoring of the Sustainable Development Goal Indicators in the Kyrgyz Republic72
6.1.1. Proportion of population using safely managed drinking water (percentage)
2014 2015 2016 2017 2018Kyrgyz Republic 88.9 89.1 89.9 91.1 91.8Batken 74.3 73.3 74.1 79.0 83.6Jalal-Abad 89.5 87.7 87.3 91.2 86.4Issyk-Kul 96.8 96.4 97.3 97.0 96.0Naryn 84.4 90.3 95.9 95.8 96.3Osh 72.9 74.5 76.4 77.3 83.2Talas 99.7 99.2 100.0 99.4 99.4Chui 100.0 100.0 100.0 100.0 100.0Bishkek city 99.8 100.0 100.0 100.0 100.0Osh city 96.5 96.7 96.6 95.7 96.5
The proportion of the population using safe drinking water supply infrastructure is calculated as the proportion of the population using improved basic sources of drinking water that are free of faecal (and especially chemical) contamination, located within grounds and freely accessible. “Improved” sources are defined in the same way as for the Millennium Development Goals, namely: the presence of water supply to a house or site; the presence of public drains; wells or tube wells; protected wells; protected sources and rainwater.
According to the 2018 KIHS, about 92 per cent of the population had access to improved drinking water sources. Those living in Chui region, as well as those in Bishkek city, have almost full access to water.
6.2.1. Proportion of population using safely managed sanitation services, including a hand-washing facility with soap and water (percentage)
2018Kyrgyz Republic 96.3AreaUrban 96.1Rural 96.5Wealth index quintilePoorest 97.2Second 95.9Middle 96.5Fourth 96.4Richest 95.7Educational attainment of household headNo education / preschool / primary 92.1Lower secondary 94.7Upper secondary 97.4Vocational primary/secondary 96.6Higher 95.1Region Batken 99.6Jalal-Abad 93.4Issyk-Kul 99.1
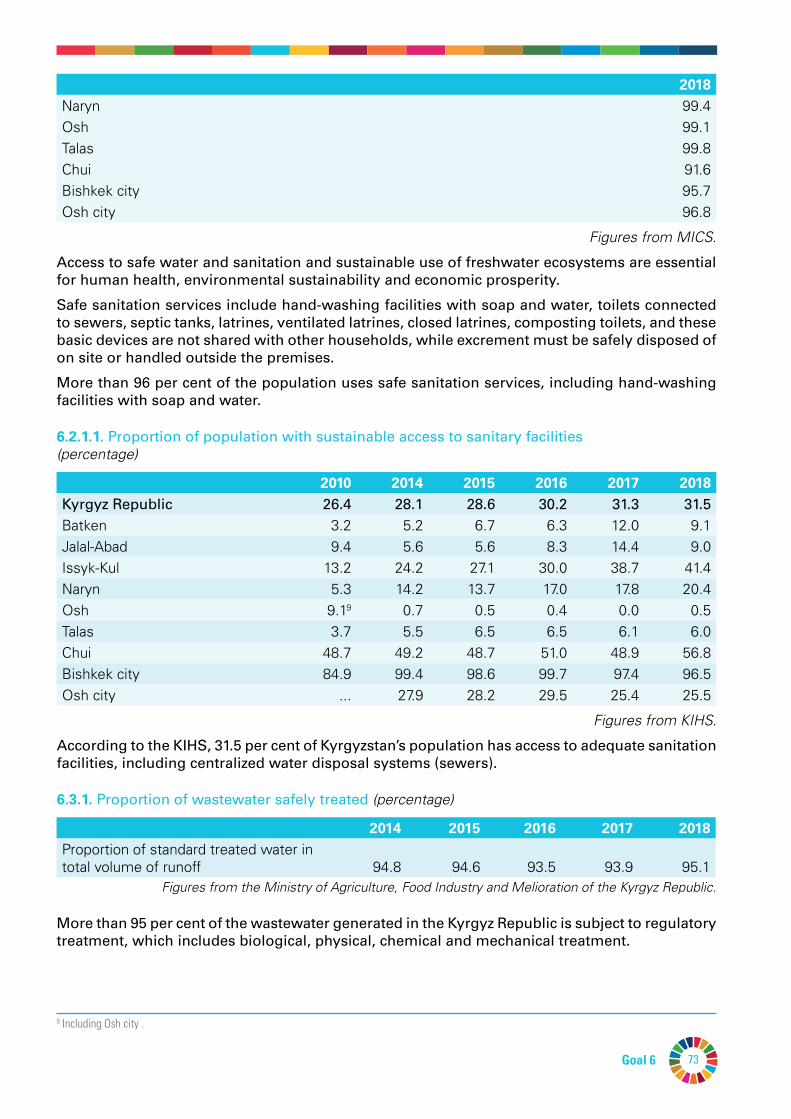
73Goal 6
2018Naryn 99.4Osh 99.1Talas 99.8Chui 91.6Bishkek city 95.7Osh city 96.8
Figures from MICS.
Access to safe water and sanitation and sustainable use of freshwater ecosystems are essential for human health, environmental sustainability and economic prosperity.
Safe sanitation services include hand-washing facilities with soap and water, toilets connected to sewers, septic tanks, latrines, ventilated latrines, closed latrines, composting toilets, and these basic devices are not shared with other households, while excrement must be safely disposed of on site or handled outside the premises.
More than 96 per cent of the population uses safe sanitation services, including hand-washing facilities with soap and water.
6.2.1.1. Proportion of population with sustainable access to sanitary facilities (percentage)
2010 2014 2015 2016 2017 2018Kyrgyz Republic 26.4 28.1 28.6 30.2 31.3 31.5Batken 3.2 5.2 6.7 6.3 12.0 9.1Jalal-Abad 9.4 5.6 5.6 8.3 14.4 9.0Issyk-Kul 13.2 24.2 27.1 30.0 38.7 41.4Naryn 5.3 14.2 13.7 17.0 17.8 20.4Osh 9.19 0.7 0.5 0.4 0.0 0.5Talas 3.7 5.5 6.5 6.5 6.1 6.0Chui 48.7 49.2 48.7 51.0 48.9 56.8Bishkek city 84.9 99.4 98.6 99.7 97.4 96.5Osh city ... 27.9 28.2 29.5 25.4 25.5
Figures from KIHS.
According to the KIHS, 31.5 per cent of Kyrgyzstan’s population has access to adequate sanitation facilities, including centralized water disposal systems (sewers).
6.3.1. Proportion of wastewater safely treated (percentage)
2014 2015 2016 2017 2018Proportion of standard treated water in total volume of runoff 94.8 94.6 93.5 93.9 95.1
Figures from the Ministry of Agriculture, Food Industry and Melioration of the Kyrgyz Republic.
More than 95 per cent of the wastewater generated in the Kyrgyz Republic is subject to regulatory treatment, which includes biological, physical, chemical and mechanical treatment.
9 Including Osh city .
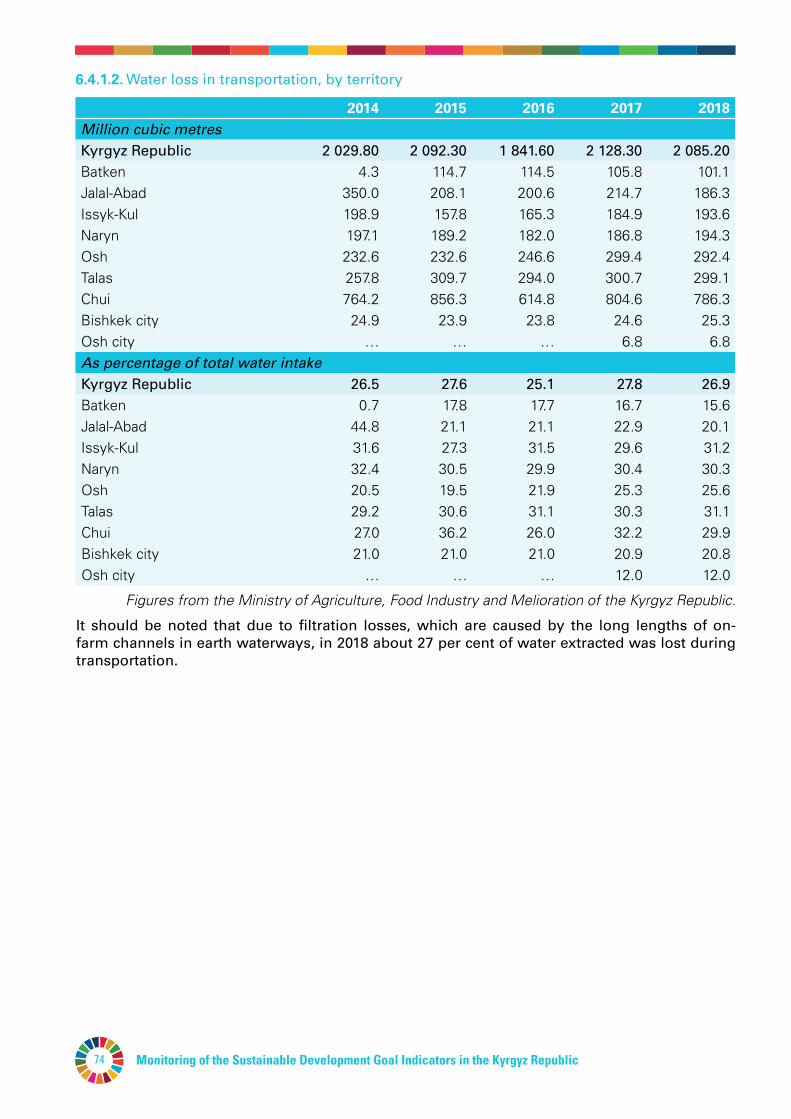
Monitoring of the Sustainable Development Goal Indicators in the Kyrgyz Republic74
6.4.1.2. Water loss in transportation, by territory
2014 2015 2016 2017 2018Million cubic metresKyrgyz Republic 2 029.80 2 092.30 1 841.60 2 128.30 2 085.20Batken 4.3 114.7 114.5 105.8 101.1Jalal-Abad 350.0 208.1 200.6 214.7 186.3Issyk-Kul 198.9 157.8 165.3 184.9 193.6Naryn 197.1 189.2 182.0 186.8 194.3Osh 232.6 232.6 246.6 299.4 292.4Talas 257.8 309.7 294.0 300.7 299.1Chui 764.2 856.3 614.8 804.6 786.3Bishkek city 24.9 23.9 23.8 24.6 25.3Osh city … … … 6.8 6.8As percentage of total water intakeKyrgyz Republic 26.5 27.6 25.1 27.8 26.9Batken 0.7 17.8 17.7 16.7 15.6Jalal-Abad 44.8 21.1 21.1 22.9 20.1Issyk-Kul 31.6 27.3 31.5 29.6 31.2Naryn 32.4 30.5 29.9 30.4 30.3Osh 20.5 19.5 21.9 25.3 25.6Talas 29.2 30.6 31.1 30.3 31.1Chui 27.0 36.2 26.0 32.2 29.9Bishkek city 21.0 21.0 21.0 20.9 20.8Osh city … … … 12.0 12.0
Figures from the Ministry of Agriculture, Food Industry and Melioration of the Kyrgyz Republic.
It should be noted that due to filtration losses, which are caused by the long lengths of on-farm channels in earth waterways, in 2018 about 27 per cent of water extracted was lost during transportation.
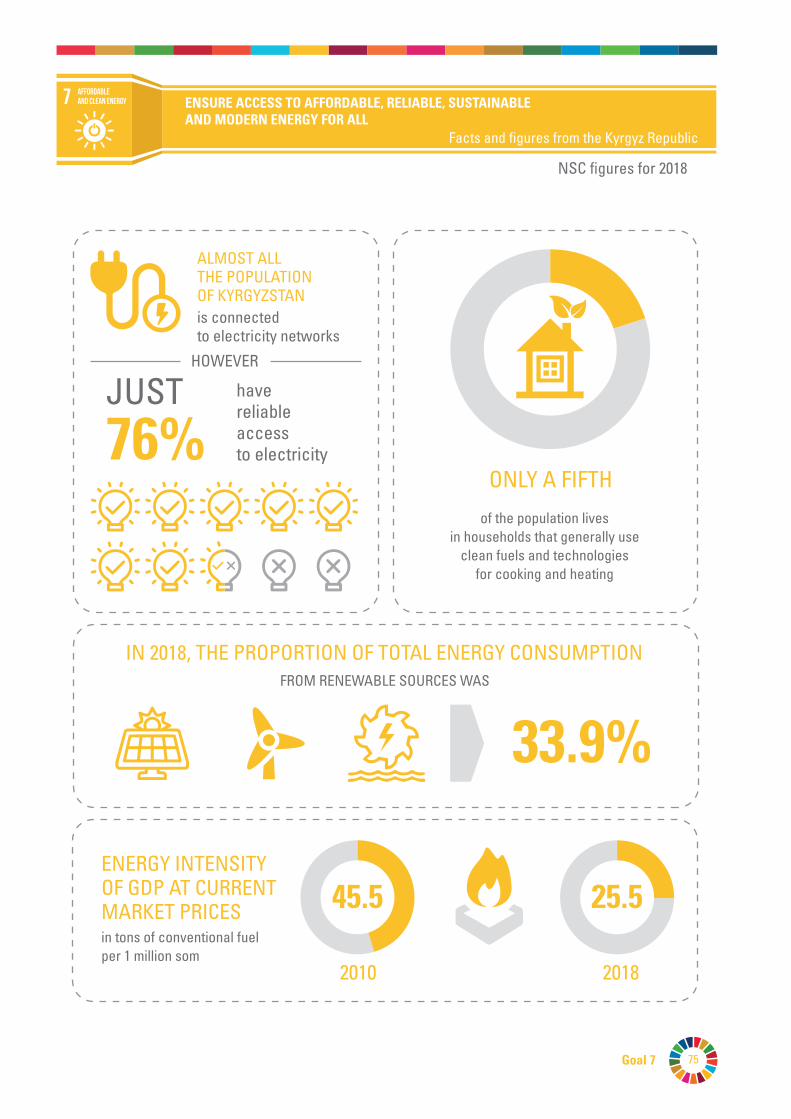
75Goal 7
76%
33.9%
ENSURE ACCESS TO AFFORDABLE, RELIABLE, SUSTAINABLE AND MODERN ENERGY FOR ALL
Facts and figures from the Kyrgyz Republic
NSC figures for 2018
Affordable and clean energy
is connected to electricity networks
of the population livesin households that generally use
clean fuels and technologiesfor cooking and heating
FROM RENEWABLE SOURCES WAS
ALMOST ALL THE POPULATION OF KYRGYZSTAN
have reliable access to electricity
HOWEVER
JUST
ONLY A FIFTH
IN 2018, THE PROPORTION OF TOTAL ENERGY CONSUMPTION
in tons of conventional fuel per 1 million som
ENERGY INTENSITY OF GDP AT CURRENT MARKET PRICES
2010 2018
45.5 25.5

Monitoring of the Sustainable Development Goal Indicators in the Kyrgyz Republic76
GOAL7.ENSUREACCESSTOAFFORDABLE,RELIABLE,SUSTAINABLEANDMODERNENERGYFORALL
Energy is central to almost every major challenge and opportunity the world faces today. Whether jobs, security, climate change, food production or increased income, access to energy for all is a determining factor. Sustainable energy is necessary to strengthen the economy, protect ecosystems, and achieve equity.
The progress made in each area of sustainable energy supply is insufficient to ensure access to energy for all and to meet the challenges of using renewable energy and improving energy efficiency. Significant improvements will require increased funding and greater political commitment, and countries will need to be prepared to apply new technologies on a larger scale.
Targets:
7.1 By 2030, ensure universal access to affordable, reliable and modern energy services.
7.2 By 2030, increase substantially the share of renewable energy in the global energy mix.
7.3 By 2030, double the global rate of improvement in energy efficiency.
7.a By 2030, enhance international cooperation to facilitate access to clean energy research and technology, including renewable energy, energy efficiency and advanced and cleaner fossil-fuel technology, and promote investment in energy infrastructure and clean energy technology.
7.b By 2030, expand infrastructure and upgrade technology for supplying modern and sustainable energy services for all in developing countries, in particular the least developed countries, small island developing states, and land-locked developing countries, in accordance with their respective programmes of support.
54.0Talas
64.4Jalal-Abad
66.6Osh
67.0Issyk-Kul
71.8Batken
75.7Kyrgyz Republic
79.0Naryn
88.4Chui
93.9Bishkek city
100.0Osh city
0.0 20.0 40.0 60.0 80.0 100.0 120.0
Figure13. Proportion of population with access to electricity (percentage)
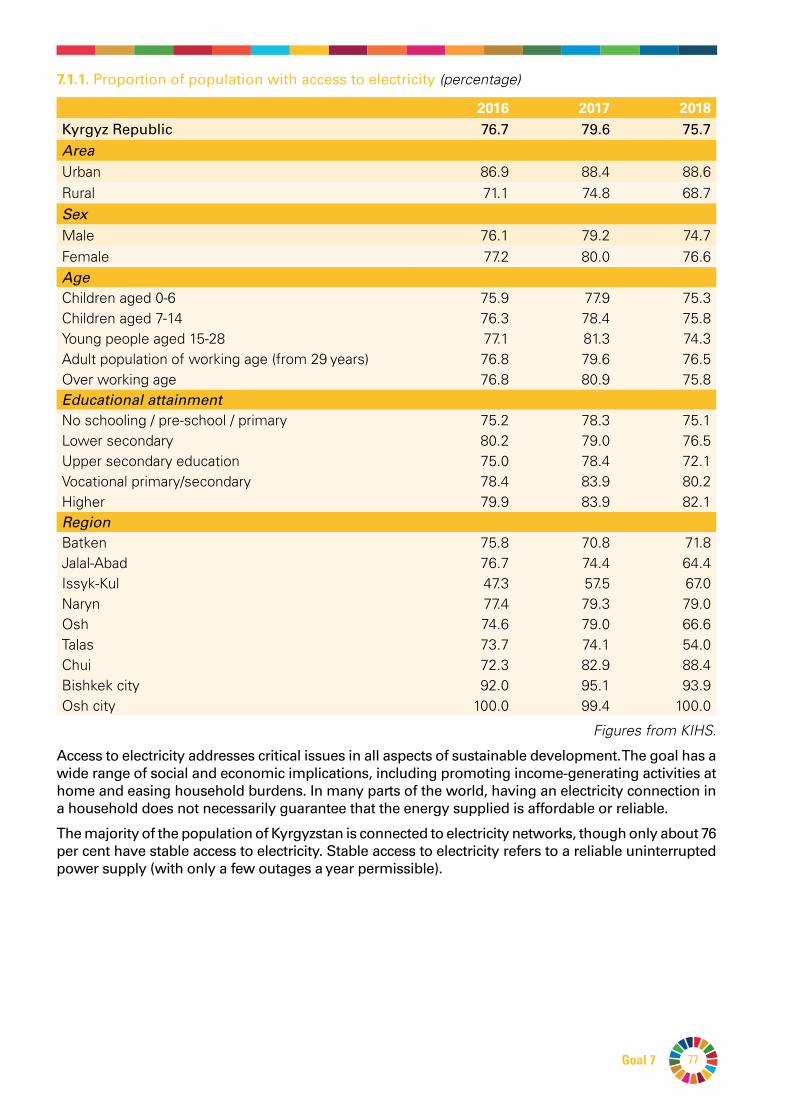
77Goal 7
7.1.1. Proportion of population with access to electricity (percentage)
2016 2017 2018Kyrgyz Republic 76.7 79.6 75.7AreaUrban 86.9 88.4 88.6Rural 71.1 74.8 68.7SexMale 76.1 79.2 74.7Female 77.2 80.0 76.6AgeChildren aged 0-6 75.9 77.9 75.3Children aged 7-14 76.3 78.4 75.8Young people aged 15-28 77.1 81.3 74.3Adult population of working age (from 29 years) 76.8 79.6 76.5Over working age 76.8 80.9 75.8Educational attainmentNo schooling / pre-school / primary 75.2 78.3 75.1Lower secondary 80.2 79.0 76.5Upper secondary education 75.0 78.4 72.1Vocational primary/secondary 78.4 83.9 80.2Higher 79.9 83.9 82.1Region Batken 75.8 70.8 71.8Jalal-Abad 76.7 74.4 64.4Issyk-Kul 47.3 57.5 67.0Naryn 77.4 79.3 79.0Osh 74.6 79.0 66.6Talas 73.7 74.1 54.0Chui 72.3 82.9 88.4Bishkek city 92.0 95.1 93.9Osh city 100.0 99.4 100.0
Figures from KIHS.
Access to electricity addresses critical issues in all aspects of sustainable development. The goal has a wide range of social and economic implications, including promoting income-generating activities at home and easing household burdens. In many parts of the world, having an electricity connection in a household does not necessarily guarantee that the energy supplied is affordable or reliable.
The majority of the population of Kyrgyzstan is connected to electricity networks, though only about 76 per cent have stable access to electricity. Stable access to electricity refers to a reliable uninterrupted power supply (with only a few outages a year permissible).

Monitoring of the Sustainable Development Goal Indicators in the Kyrgyz Republic78
7.1.2. Proportion of population with primary reliance on clean fuels and technology (percentage)
2018Total 19.2Area Urban 47.5Rural 3.2Educational attainment of household headNo schooling / pre-school / primary 6.8Lower secondary 10.5Upper secondary education 11.4Vocational primary/secondary 19.7Higher 38.9Wealth index quintilePoorest 1.0Second 2.6Middle 6.1Fourth 9.3Richest 76.9Region Batken 2.8Jalal-Abad 15.9Issyk-Kul 13.6Naryn 7.1Osh 1.3Talas 8.8Chui 11.1Bishkek city 59.9Osh city 32.1
Figures from MICS.
Guidelines for indoor air quality (combustion of fuel at home) emphasize the importance of attention to both fuel and technology for the proper protection of public health. These guidelines provide technical recommendations in the form of emission targets for which combinations of fuel and technology (stove, lamp, etc. ) in a home relate to clean energy. These guidelines also recommend against using untreated coal and discourage the use of kerosene ( a highly polluting fuel) at home. They also recommend that all major household energy sources (such as cooking, heating, lighting) use efficient fuels and combinations of technologies to provide health benefits. For this reason, according to the technical recommendations in the WHO guidelines, access to a modern solution for home cooking purposes will be defined as "access to clean fuels and technologies".
Only a fifth of the country's population lives in households that use mainly clean fuels and technologies for cooking and heating.

79Goal 7
7.2.1.1.Renewable energy share in the total energy consumption
2010 2014 2015 2016 2017 2018Renewable energy share in the total energy consumption, as a percentage 38.7 36.7 30.6 31.6 36.5 33.9Production of electricity by hydroelectric power plants, million kWh 11 254.7 13 297.6 11 092.7 11 497.8 14 191.2 14 318.3
Renewable energy technologies are one of the main elements of the strategy for greening economies around the world and solving the most important global problem of climate change. There are a number of definitions of renewable energy sources; a common fact is that all the forms of energy, despite being consumed, will be available in the future. These include solar energy, wind, ocean, hydropower, geothermal resources, and bioenergy (in the case of bioenergy this may be depleted but bioenergy sources can be replaced in the short and medium term). It is important to note that this indicator focuses on the amount of renewable energy actually consumed, rather than on the capacity of a country to produce renewable energy.
Renewable energy consumption includes the consumption of energy derived from: hydropower, solid biofuels, wind, solar, liquid biofuels, biogas, geothermal gas and other sources.
The share of total energy consumption from renewable sources decreased from 38.7 per cent in 2010 to 33.9 per cent in 2018, due to an increase in energy consumption. In 2018, hydroelectric power plants produced 14.3 billion kilowatt-hours of electricity, which is 27.2 per cent more than in 2010.
7.3.1.1. Energy intensity of GDP at current market prices (tons of conventional fuel per 1 million som)
2010 2014 2015 2016 2017 2018Energy intensity of GDP at current market prices 45.5 26.1 26.7 22.0 25.3 25.5
The energy intensity indicator is a general relationship between energy consumption and economic development, and provides a basis for assessing energy consumption. The rate of decrease in energy intensity of GDP testifies to the effectiveness of the state’s energy-saving policy. Energy intensity indicators of GDP in individual sectors indicate the degree of sustainability of development of the sectors, and the general relationship between energy consumption and economic development in this sector of the economy.
7.3.1.2. Electricity intensity of GDP 2010 2014 2015 2016 2017 2018
Electricity intensity of GDP (kWh/ million som) 47.7 36.9 31.5 27.9 26.9 26.3
The electricity intensity of GDP is an indicator of the efficiency of electricity consumption in the country. The electricity intensity indicator indicates the overall relationship between electricity consumption and the country's economic development. In the Kyrgyz Republic, more than 90 per cent of all generated electricity is produced at hydroelectric power plants, using energy from water, and as a result of economic growth, the elecricity intensity indicator is in practice minimal.
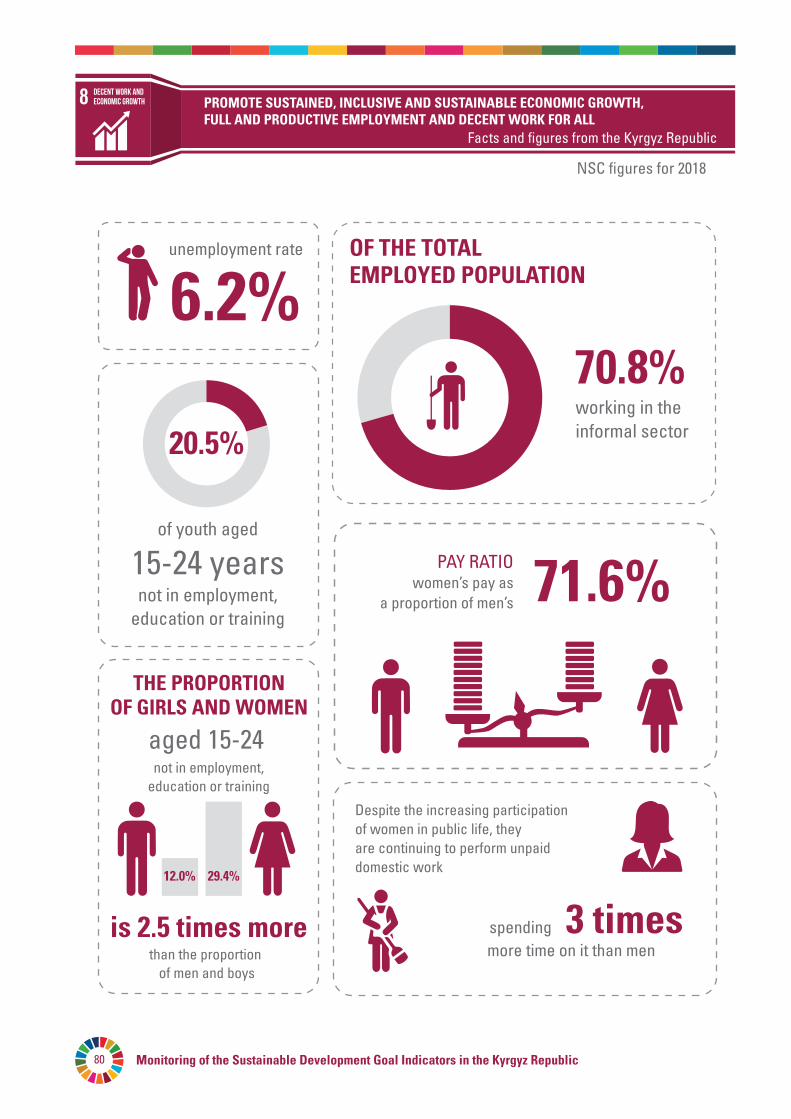
Monitoring of the Sustainable Development Goal Indicators in the Kyrgyz Republic80
6.2%70.8%
PROMOTE SUSTAINED, INCLUSIVE AND SUSTAINABLE ECONOMIC GROWTH, FULL AND PRODUCTIVE EMPLOYMENT AND DECENT WORK FOR ALL
Facts and figures from the Kyrgyz Republic
NSC figures for 2018
DECENT WORK AND ECONOMIC GROWTH
unemployment rate OF THE TOTALEMPLOYED POPULATION
working in theinformal sector
than the proportion of men and boys
of youth aged
PAY RATIOwomen’s pay as
a proportion of men’s
more time on it than men
71.6%
Despite the increasing participation of women in public life, they are continuing to perform unpaid domestic work
3 times spending
THE PROPORTION OF GIRLS AND WOMEN
aged 15-24not in employment,
education or training
is 2.5 times more
12.0% 29.4%
20.5%
15-24 yearsnot in employment,
education or training
81Goal 8
GOAL8.PROMOTESUSTAINED,INCLUSIVEANDSUSTAINABLEECONOMICGROWTH,FULLANDPRODUCTIVEEMPLOYMENTANDDECENTWORKFORALL
Approximately half of the world's population still lives on the equivalent of about US$2 a day. The global unemployment rate is 5.7 per cent. In many places, having a job does not guarantee an escape from poverty. This slow and uneven progress towards the goal means we have to rethink and re-equip our socio-economic policies aimed at eradicating poverty.
The continued lack of decent employment opportunities, lack of investment and lack of consumption are eroding the basic social contract that underpins all democratic societies and involves shared participation in progress. For almost all economies, creating quality jobs will remain a challenge for a long time, and achieving GDP growth of at least 7 per cent a year in the least developed countries will require serious measures.
To ensure sustainable economic growth, societies will have to create conditions for people to have quality jobs that stimulate economic development without harm to the environment. To do this, employment opportunities and decent working conditions need to be provided for all working age people. Improving productivity, reducing unemployment, especially among young people, and increasing access to financial services and benefits are essential components of sustained and inclusive economic growth.
Targets:
8.1 Sustain per capita economic growth in accordance with national circumstances and, in particular, at least 7 per cent gross domestic product growth per annum in the least developed countries.
8.2 Achieve higher levels of economic productivity through diversification, technological upgrading and innovation, including through a focus on high-value added and labour-intensive sectors.
8.3 Promote development-oriented policies that support productive activities, decent job creation, entrepreneurship, creativity and innovation, and encourage the formalization and growth of micro-, small- and medium-sized enterprises, including through access to financial services.
8.4 Improve progressively, through 2030, global resource efficiency in consumption and production and endeavour to decouple economic growth from environmental degradation, in accordance with the 10-year framework of programmes on sustainable consumption and production, with developed countries taking the lead.
8.5 By 2030, achieve full and productive employment and decent work for all women and men, including for young people and persons with disabilities, and equal pay for work of equal value.
8.6 By 2020, substantially reduce the proportion of youth not in employment, education or training.
8.7 Take immediate and effective measures to eradicate forced labour, end modern slavery and human trafficking and secure the prohibition and elimination of the worst forms of child labour, including recruitment and use of child soldiers, and by 2025 end child labour in all its forms.
8.8 Protect labour rights and promote safe and secure working environments for all workers, including migrant workers, in particular women migrants, and those in precarious employment.
8.9 By 2030, devise and implement policies to promote sustainable tourism that creates jobs and promotes local culture and product.
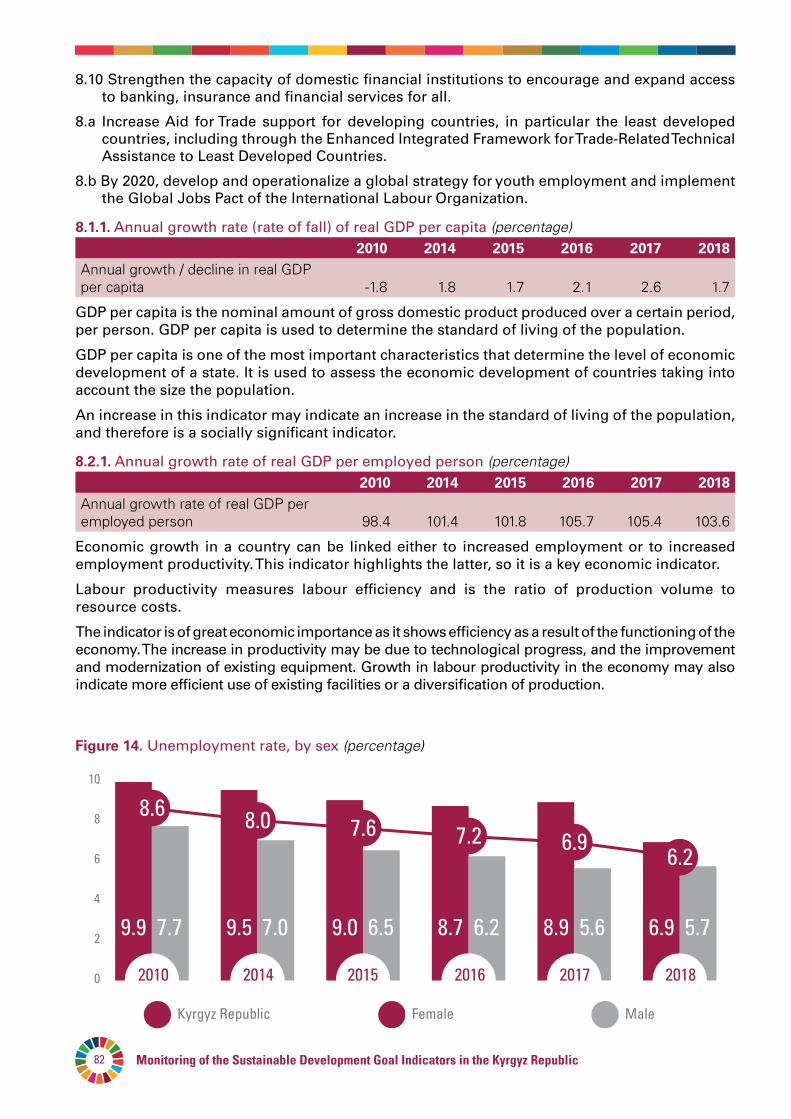
Monitoring of the Sustainable Development Goal Indicators in the Kyrgyz Republic82
8.10 Strengthen the capacity of domestic financial institutions to encourage and expand access to banking, insurance and financial services for all.
8.a Increase Aid for Trade support for developing countries, in particular the least developed countries, including through the Enhanced Integrated Framework for Trade-Related Technical Assistance to Least Developed Countries.
8.b By 2020, develop and operationalize a global strategy for youth employment and implement the Global Jobs Pact of the International Labour Organization.
8.1.1. Annual growth rate (rate of fall) of real GDP per capita (percentage)2010 2014 2015 2016 2017 2018
Annual growth / decline in real GDP per capita -1.8 1.8 1.7 2.1 2.6 1.7
GDP per capita is the nominal amount of gross domestic product produced over a certain period, per person. GDP per capita is used to determine the standard of living of the population.
GDP per capita is one of the most important characteristics that determine the level of economic development of a state. It is used to assess the economic development of countries taking into account the size the population.
An increase in this indicator may indicate an increase in the standard of living of the population, and therefore is a socially significant indicator.
8.2.1. Annual growth rate of real GDP per employed person (percentage)2010 2014 2015 2016 2017 2018
Annual growth rate of real GDP per employed person 98.4 101.4 101.8 105.7 105.4 103.6
Economic growth in a country can be linked either to increased employment or to increased employment productivity. This indicator highlights the latter, so it is a key economic indicator.
Labour productivity measures labour efficiency and is the ratio of production volume to resource costs.
The indicator is of great economic importance as it shows efficiency as a result of the functioning of the economy. The increase in productivity may be due to technological progress, and the improvement and modernization of existing equipment. Growth in labour productivity in the economy may also indicate more efficient use of existing facilities or a diversification of production.
10
8
6
4
2
0
9.9 7.7 9.5 7.0 9.0 6.5 8.7 6.2 8.9 5.6 6.9 5.7
8.6 8.0 7.6 7.2 6.96.2
2010 2014 2015 2016 2017 2018
Female MaleKyrgyz Republic
Figure14. Unemployment rate, by sex (percentage)
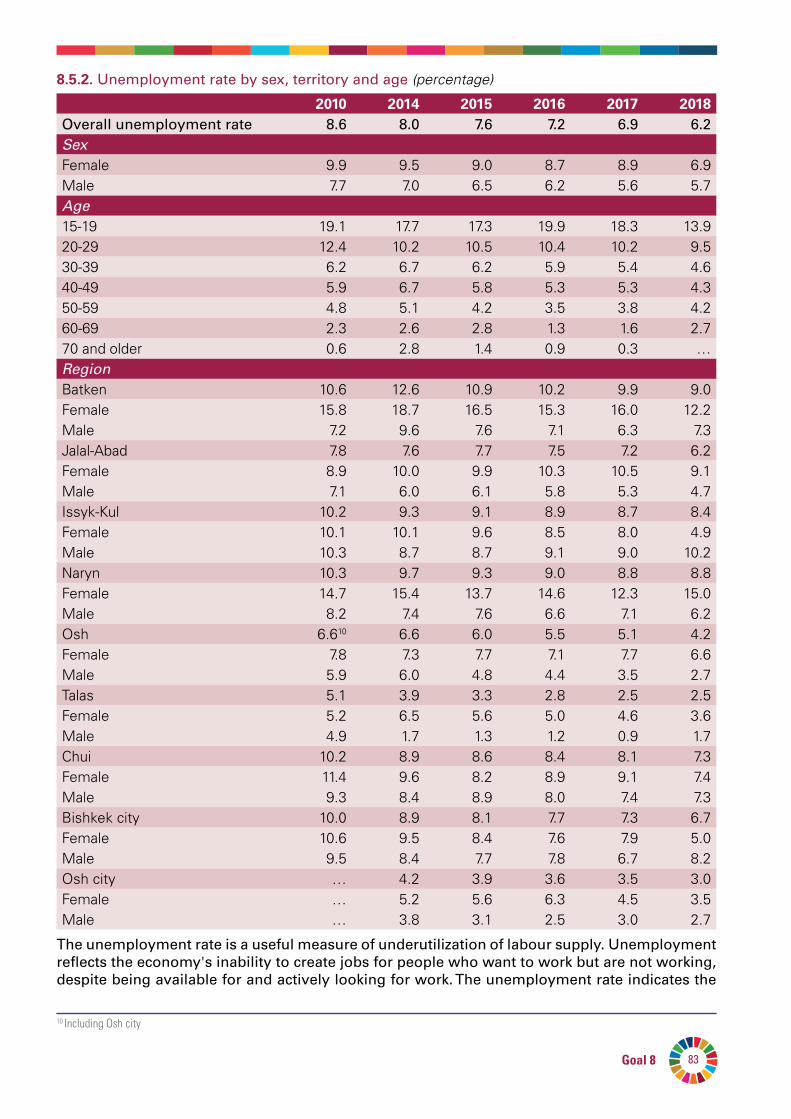
83Goal 8
8.5.2. Unemployment rate by sex, territory and age (percentage)
2010 2014 2015 2016 2017 2018Overall unemployment rate 8.6 8.0 7.6 7.2 6.9 6.2SexFemale 9.9 9.5 9.0 8.7 8.9 6.9Male 7.7 7.0 6.5 6.2 5.6 5.7Age 15-19 19.1 17.7 17.3 19.9 18.3 13.920-29 12.4 10.2 10.5 10.4 10.2 9.530-39 6.2 6.7 6.2 5.9 5.4 4.640-49 5.9 6.7 5.8 5.3 5.3 4.350-59 4.8 5.1 4.2 3.5 3.8 4.260-69 2.3 2.6 2.8 1.3 1.6 2.770 and older 0.6 2.8 1.4 0.9 0.3 …Region Batken 10.6 12.6 10.9 10.2 9.9 9.0Female 15.8 18.7 16.5 15.3 16.0 12.2Male 7.2 9.6 7.6 7.1 6.3 7.3Jalal-Abad 7.8 7.6 7.7 7.5 7.2 6.2Female 8.9 10.0 9.9 10.3 10.5 9.1Male 7.1 6.0 6.1 5.8 5.3 4.7Issyk-Kul 10.2 9.3 9.1 8.9 8.7 8.4Female 10.1 10.1 9.6 8.5 8.0 4.9Male 10.3 8.7 8.7 9.1 9.0 10.2Naryn 10.3 9.7 9.3 9.0 8.8 8.8Female 14.7 15.4 13.7 14.6 12.3 15.0Male 8.2 7.4 7.6 6.6 7.1 6.2Osh 6.610 6.6 6.0 5.5 5.1 4.2Female 7.8 7.3 7.7 7.1 7.7 6.6Male 5.9 6.0 4.8 4.4 3.5 2.7Talas 5.1 3.9 3.3 2.8 2.5 2.5Female 5.2 6.5 5.6 5.0 4.6 3.6Male 4.9 1.7 1.3 1.2 0.9 1.7Chui 10.2 8.9 8.6 8.4 8.1 7.3Female 11.4 9.6 8.2 8.9 9.1 7.4Male 9.3 8.4 8.9 8.0 7.4 7.3Bishkek city 10.0 8.9 8.1 7.7 7.3 6.7Female 10.6 9.5 8.4 7.6 7.9 5.0Male 9.5 8.4 7.7 7.8 6.7 8.2Osh city … 4.2 3.9 3.6 3.5 3.0Female … 5.2 5.6 6.3 4.5 3.5Male … 3.8 3.1 2.5 3.0 2.7
The unemployment rate is a useful measure of underutilization of labour supply. Unemployment reflects the economy's inability to create jobs for people who want to work but are not working, despite being available for and actively looking for work. The unemployment rate indicates the
10 Including Osh city
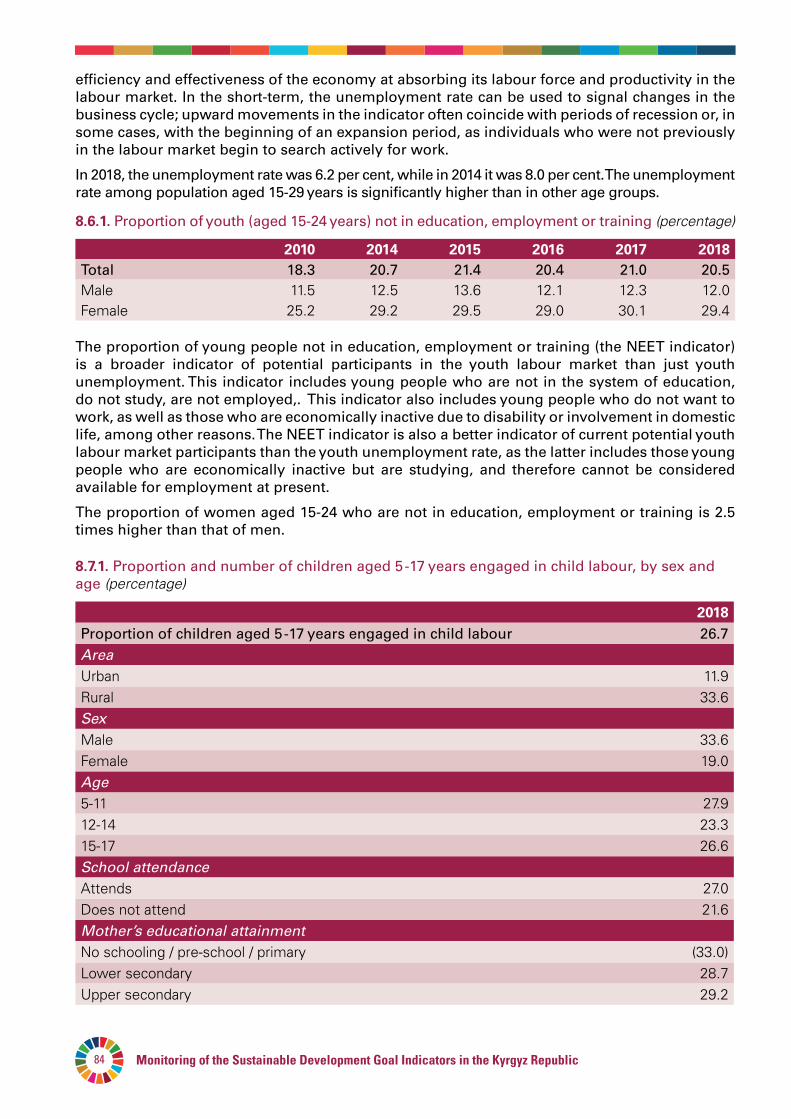
Monitoring of the Sustainable Development Goal Indicators in the Kyrgyz Republic84
efficiency and effectiveness of the economy at absorbing its labour force and productivity in the labour market. In the short-term, the unemployment rate can be used to signal changes in the business cycle; upward movements in the indicator often coincide with periods of recession or, in some cases, with the beginning of an expansion period, as individuals who were not previously in the labour market begin to search actively for work.
In 2018, the unemployment rate was 6.2 per cent, while in 2014 it was 8.0 per cent. The unemployment rate among population aged 15-29 years is significantly higher than in other age groups.
8.6.1. Proportion of youth (aged 15-24 years) not in education, employment or training (percentage)
2010 2014 2015 2016 2017 2018Total 18.3 20.7 21.4 20.4 21.0 20.5Male 11.5 12.5 13.6 12.1 12.3 12.0Female 25.2 29.2 29.5 29.0 30.1 29.4
The proportion of young people not in education, employment or training (the NEET indicator) is a broader indicator of potential participants in the youth labour market than just youth unemployment. This indicator includes young people who are not in the system of education, do not study, are not employed,. This indicator also includes young people who do not want to work, as well as those who are economically inactive due to disability or involvement in domestic life, among other reasons. The NEET indicator is also a better indicator of current potential youth labour market participants than the youth unemployment rate, as the latter includes those young people who are economically inactive but are studying, and therefore cannot be considered available for employment at present.
The proportion of women aged 15-24 who are not in education, employment or training is 2.5 times higher than that of men.
8.7.1. Proportion and number of children aged 5 -17 years engaged in child labour, by sex and age (percentage)
2018Proportion of children aged 5 -17 years engaged in child labour 26.7Area Urban 11.9Rural 33.6SexMale 33.6Female 19.0Age5-11 27.912-14 23.315-17 26.6School attendanceAttends 27.0Does not attend 21.6Mother’s educational attainmentNo schooling / pre-school / primary (33.0)Lower secondary 28.7Upper secondary 29.2

85Goal 8
2018Vocational primary/secondary 24.4Higher 23.1Child has functional difficultiesYes 34.9No 25.9Wealth index quintilePoorest 32.1Second 30.6Middle 31.8Fourth 28.0Richest 6.1Region Batken 27.7Jalal-Abad 34.0Issyk-Kul 27.0Naryn 40.5Osh 33.3Talas 35.1Chui 24.5Bishkek city 7.3Osh city 6.1
The term “child labour” refers to a subset of children's activities that are harmful, negative or undesirable to children and that it would be desirable to eliminate. Child labour is a legal concept rather than a statistical one, and therefore the international legal standards that define it are a necessary basis for child labour statistics. The three main international conventions on child labour - ILO Convention No. 138 (minimum age) (C138), ILO Convention No. 182 (worst forms) (C182) and the United Nations Convention on the Rights of the Child (CRC) together set the legal boundaries for child labour and provide the legal framework for action to combat it at the national and international levels.
8.8.1. Frequency rates of fatal and non-fatal occupational injuries, by territory and sex (per 100,000 workers of each sex)
2010 2014 2015 2016 2017 2018Occupational injuriesKyrgyz Republic 90.1 29.2 22.1 24.5 17.0 25.0Female 19.8 15.5 8.4 16.4 13.6 14.9Male 164.3 44.6 37.9 33.7 20.9 36.6Batken 67.0 60.2 5.9 11.8 16.9 14.2Female 8.9 - - 5.6 - -Male 112.7 131.4 12.9 18.8 37.2 32.4Jalal-Abad 41.3 22.7 20.8 26.5 14.6 46.1Female 3.2 5.6 2.5 10.2 2.4 10.0Male 82.9 42.6 43.0 46.3 29.0 86.1
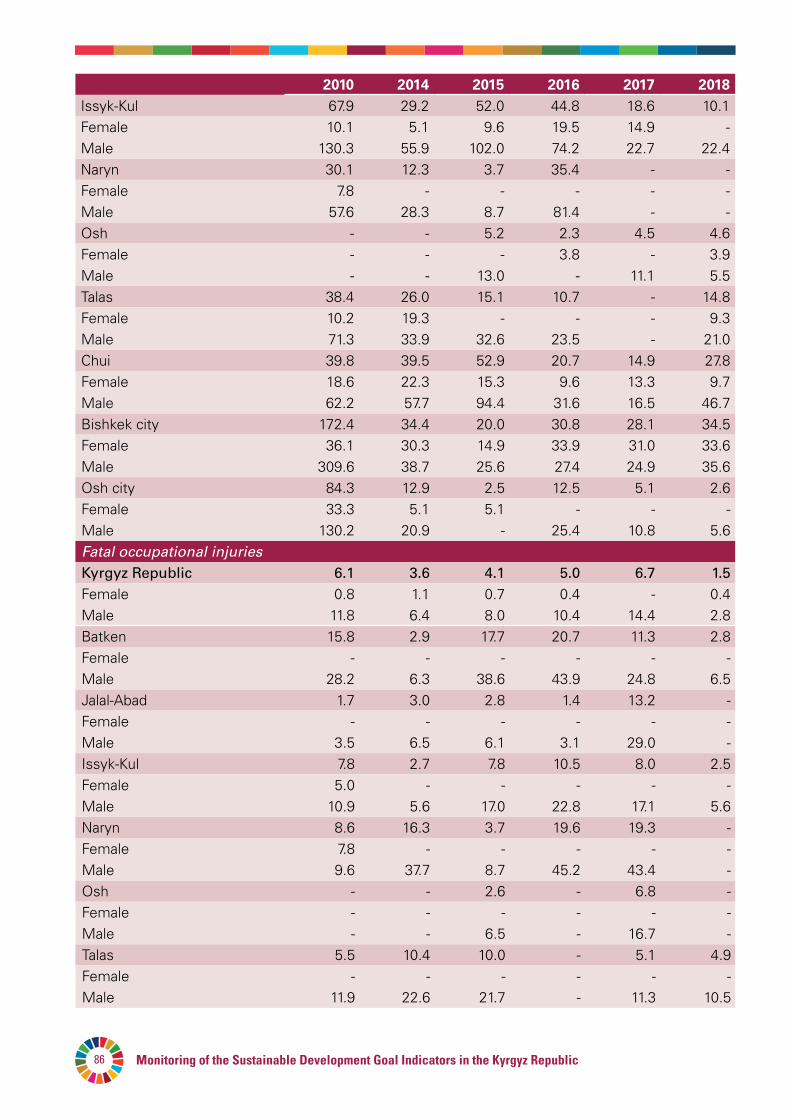
Monitoring of the Sustainable Development Goal Indicators in the Kyrgyz Republic86
2010 2014 2015 2016 2017 2018Issyk-Kul 67.9 29.2 52.0 44.8 18.6 10.1Female 10.1 5.1 9.6 19.5 14.9 -Male 130.3 55.9 102.0 74.2 22.7 22.4Naryn 30.1 12.3 3.7 35.4 - -Female 7.8 - - - - -Male 57.6 28.3 8.7 81.4 - -Osh - - 5.2 2.3 4.5 4.6Female - - - 3.8 - 3.9Male - - 13.0 - 11.1 5.5Talas 38.4 26.0 15.1 10.7 - 14.8Female 10.2 19.3 - - - 9.3Male 71.3 33.9 32.6 23.5 - 21.0Chui 39.8 39.5 52.9 20.7 14.9 27.8Female 18.6 22.3 15.3 9.6 13.3 9.7Male 62.2 57.7 94.4 31.6 16.5 46.7Bishkek city 172.4 34.4 20.0 30.8 28.1 34.5Female 36.1 30.3 14.9 33.9 31.0 33.6Male 309.6 38.7 25.6 27.4 24.9 35.6Osh city 84.3 12.9 2.5 12.5 5.1 2.6Female 33.3 5.1 5.1 - - -Male 130.2 20.9 - 25.4 10.8 5.6Fatal occupational injuriesKyrgyz Republic 6.1 3.6 4.1 5.0 6.7 1.5Female 0.8 1.1 0.7 0.4 - 0.4Male 11.8 6.4 8.0 10.4 14.4 2.8Batken 15.8 2.9 17.7 20.7 11.3 2.8Female - - - - - -Male 28.2 6.3 38.6 43.9 24.8 6.5Jalal-Abad 1.7 3.0 2.8 1.4 13.2 -Female - - - - - -Male 3.5 6.5 6.1 3.1 29.0 -Issyk-Kul 7.8 2.7 7.8 10.5 8.0 2.5Female 5.0 - - - - -Male 10.9 5.6 17.0 22.8 17.1 5.6Naryn 8.6 16.3 3.7 19.6 19.3 -Female 7.8 - - - - -Male 9.6 37.7 8.7 45.2 43.4 -Osh - - 2.6 - 6.8 -Female - - - - - -Male - - 6.5 - 16.7 -Talas 5.5 10.4 10.0 - 5.1 4.9Female - - - - - -Male 11.9 22.6 21.7 - 11.3 10.5
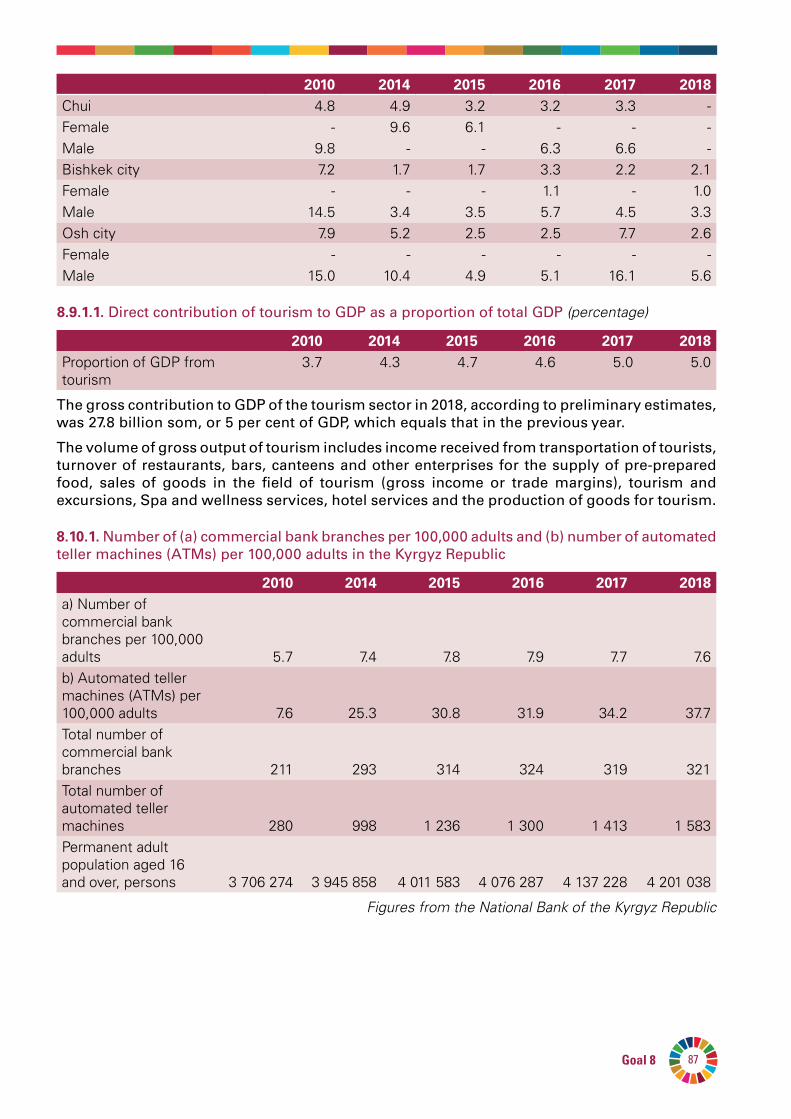
87Goal 8
2010 2014 2015 2016 2017 2018Chui 4.8 4.9 3.2 3.2 3.3 -Female - 9.6 6.1 - - -Male 9.8 - - 6.3 6.6 -Bishkek city 7.2 1.7 1.7 3.3 2.2 2.1Female - - - 1.1 - 1.0Male 14.5 3.4 3.5 5.7 4.5 3.3Osh city 7.9 5.2 2.5 2.5 7.7 2.6Female - - - - - -Male 15.0 10.4 4.9 5.1 16.1 5.6
8.9.1.1. Direct contribution of tourism to GDP as a proportion of total GDP (percentage)
2010 2014 2015 2016 2017 2018Proportion of GDP from tourism
3.7 4.3 4.7 4.6 5.0 5.0
The gross contribution to GDP of the tourism sector in 2018, according to preliminary estimates, was 27.8 billion som, or 5 per cent of GDP, which equals that in the previous year.
The volume of gross output of tourism includes income received from transportation of tourists, turnover of restaurants, bars, canteens and other enterprises for the supply of pre-prepared food, sales of goods in the field of tourism (gross income or trade margins), tourism and excursions, Spa and wellness services, hotel services and the production of goods for tourism.
8.10.1. Number of (а) commercial bank branches per 100,000 adults and (b) number of automated teller machines (ATMs) per 100,000 adults in the Kyrgyz Republic
2010 2014 2015 2016 2017 2018а) Number of commercial bank branches per 100,000 adults 5.7 7.4 7.8 7.9 7.7 7.6b) Automated teller machines (ATMs) per 100,000 adults 7.6 25.3 30.8 31.9 34.2 37.7Total number of commercial bank branches 211 293 314 324 319 321Total number of automated teller machines 280 998 1 236 1 300 1 413 1 583Permanent adult population aged 16 and over, persons 3 706 274 3 945 858 4 011 583 4 076 287 4 137 228 4 201 038
Figures from the National Bank of the Kyrgyz Republic
Monitoring of the Sustainable Development Goal Indicators in the Kyrgyz Republic88
The availability of financial services and their use is an integral part of modern society. Services include savings, insurance, cash payments and transfers, and loans allow people to manage their lives, plan and pay expenses, grow their businesses, and improve their overall wellbeing. As banks remain one of the key institutions for accessing formal financial services, the availability of an accessible banking infrastructure is an important starting point for accessing and therefore using financial services. Bank branches are supplemented by other important access points, such as ATMs, which offer financial services in remote locations.
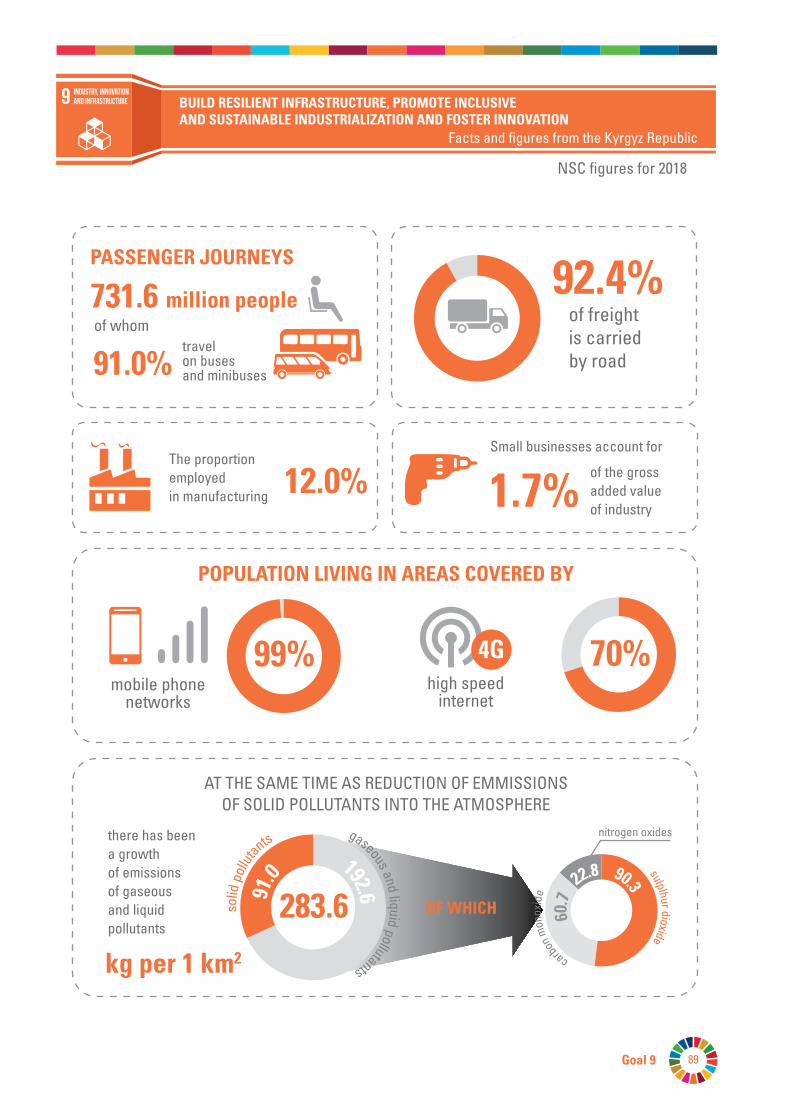
89Goal 9
91.0%
1.7%12.0%
92.4%
64.4%
BUILD RESILIENT INFRASTRUCTURE, PROMOTE INCLUSIVE AND SUSTAINABLE INDUSTRIALIZATION AND FOSTER INNOVATION
Facts and figures from the Kyrgyz Republic
NSC figures for 2018
IndustrY, innovation and infrastructure
travel on buses and minibuses
The proportion employed in manufacturing
Small businesses account for
of the gross added value of industry
AT THE SAME TIME AS REDUCTION OF EMMISSIONSOF SOLID POLLUTANTS INTO THE ATMOSPHERE
PASSENGER JOURNEYS
731.6 million peopleof whom
of freightis carried by road
there has been a growth of emissions of gaseous and liquid pollutants
kg per 1 km2
POPULATION LIVING IN AREAS COVERED BY
OF WHICH
mobile phonenetworks
high speedinternet
4G99% 70%
283.691.0
192.6
solid
pol
lutants gaseous and li quid pollutants
sulplhur dioxide
carbon
mon
oxid
e
90.3
60.7
22.8
nitrogen oxides
Monitoring of the Sustainable Development Goal Indicators in the Kyrgyz Republic90
GOAL9.BUILDRESILIENTINFRASTRUCTURE,PROMOTEINCLUSIVEANDSUSTAINABLEINDUSTRIALIZATIONANDFOSTERINNOVATION
Investment in infrastructure – transport, irrigation, energy, information and communication technologies – is essential for achieving sustainable development and empowering communities in many countries. It has long been recognized that infrastructure investment is necessary to ensure productivity and income growth, as well as to improve the delivery of health and education services.
The main driver of economic development, employment and social stability is the manufacturing industry. However, the volume of notional net manufacturing output per capita in highly developed countries is US$4,500, and in the least developed countries about US$100. At the current rate of growth and urbanization, there is a need for additional investment in building sustainable infrastructure that will enable cities to respond more effectively to climate change, and that can contribute to economic growth and social stability. Support for countries in need of financial, technological and technical resources is encouraged not only from state budgets and official development assistance but also from private sources. Despite steady improvements in industrial production and employment, new investment will be required to build the necessary infrastructure in the least developed countries and double the share of industry in GDP by 2030.
Targets:
9.1 Develop quality, reliable, sustainable and resilient infrastructure, including regional and transborder infrastructure, to support economic development and human well-being, with a focus on affordable and equitable access for all.
9.2 Promote inclusive and sustainable industrialization and, by 2030, significantly raise industry’s share of employment and gross domestic product, in line with national circumstances, and double its share in least developed countries.
9.3 Increase the access of small-scale industrial and other enterprises, in particular in developing countries, to financial services, including affordable credit, and their integration into value chains and markets.
9.4 By 2030, upgrade infrastructure and retrofit industries to make them sustainable, with increased resource-use efficiency and greater adoption of clean and environmentally sound technologies and industrial processes, with all countries taking action in accordance with their respective capabilities.
9.5 Enhance scientific research, upgrade the technological capabilities of industrial sectors in all countries, in particular developing countries, including, by 2030, encouraging innovation and substantially increasing the number of research and development workers per one million people and public and private research and development spending.
9.a Facilitate sustainable and resilient infrastructure development in developing countries through enhanced financial, technological and technical support to African countries, least developed countries, landlocked developing countries and small island developing States.
9.b Support domestic technology development, research and innovation in developing countries, including by ensuring a conducive policy environment for, inter alia, industrial diversification and value addition to commodities.
9.c Significantly increase access to information and communications technology and strive to provide universal and affordable access to the Internet in least developed countries by 2020.
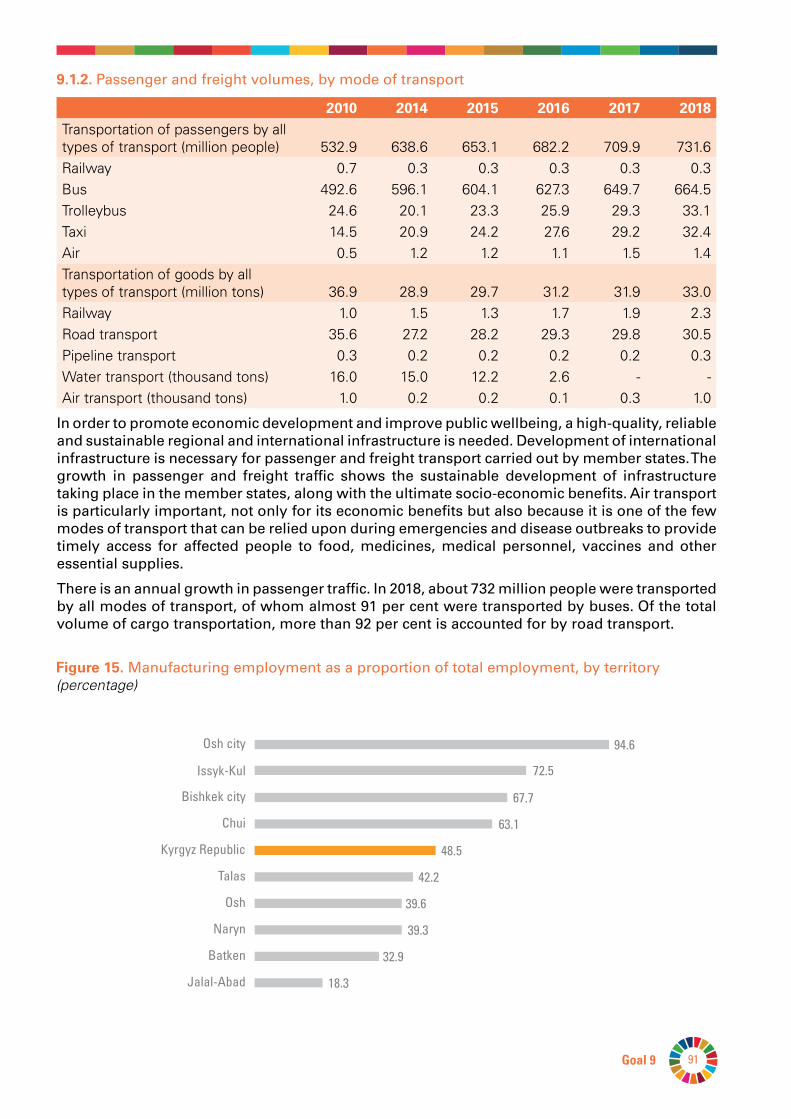
91Goal 9
9.1.2.Passenger and freight volumes, by mode of transport
2010 2014 2015 2016 2017 2018Transportation of passengers by all types of transport (million people) 532.9 638.6 653.1 682.2 709.9 731.6Railway 0.7 0.3 0.3 0.3 0.3 0.3Bus 492.6 596.1 604.1 627.3 649.7 664.5Trolleybus 24.6 20.1 23.3 25.9 29.3 33.1Taxi 14.5 20.9 24.2 27.6 29.2 32.4Air 0.5 1.2 1.2 1.1 1.5 1.4Transportation of goods by all types of transport (million tons) 36.9 28.9 29.7 31.2 31.9 33.0Railway 1.0 1.5 1.3 1.7 1.9 2.3Road transport 35.6 27.2 28.2 29.3 29.8 30.5Pipeline transport 0.3 0.2 0.2 0.2 0.2 0.3Water transport (thousand tons) 16.0 15.0 12.2 2.6 - -Air transport (thousand tons) 1.0 0.2 0.2 0.1 0.3 1.0
In order to promote economic development and improve public wellbeing, a high-quality, reliable and sustainable regional and international infrastructure is needed. Development of international infrastructure is necessary for passenger and freight transport carried out by member states. The growth in passenger and freight traffic shows the sustainable development of infrastructure taking place in the member states, along with the ultimate socio-economic benefits. Air transport is particularly important, not only for its economic benefits but also because it is one of the few modes of transport that can be relied upon during emergencies and disease outbreaks to provide timely access for affected people to food, medicines, medical personnel, vaccines and other essential supplies.
There is an annual growth in passenger traffic. In 2018, about 732 million people were transported by all modes of transport, of whom almost 91 per cent were transported by buses. Of the total volume of cargo transportation, more than 92 per cent is accounted for by road transport.
Batken 32.9
Jalal-Abad 18.3
Kyrgyz Republic 48.5
Chui 63.1
Issyk-Kul 72.5
Osh city 94.6
Naryn 39.3
Talas 42.2
Bishkek city 67.7
Osh 39.6
Figure15. Manufacturing employment as a proportion of total employment, by territory (percentage)
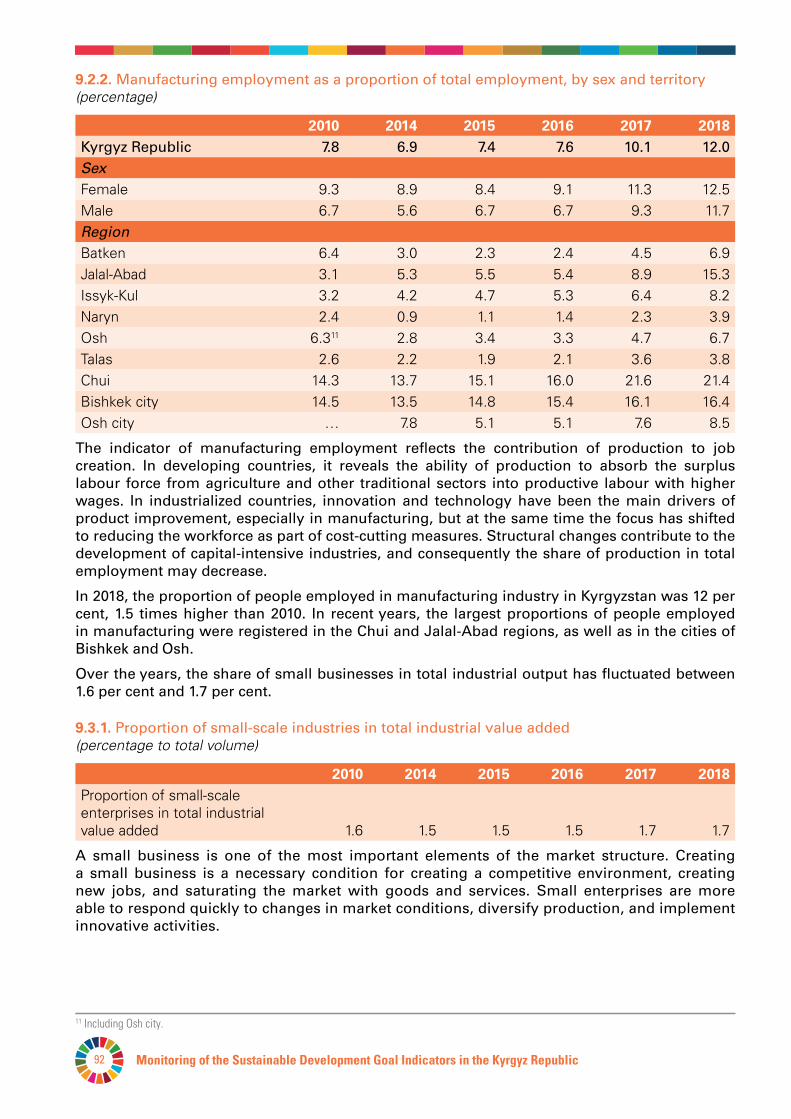
Monitoring of the Sustainable Development Goal Indicators in the Kyrgyz Republic92
9.2.2. Manufacturing employment as a proportion of total employment, by sex and territory (percentage)
2010 2014 2015 2016 2017 2018Kyrgyz Republic 7.8 6.9 7.4 7.6 10.1 12.0SexFemale 9.3 8.9 8.4 9.1 11.3 12.5Male 6.7 5.6 6.7 6.7 9.3 11.7Region Batken 6.4 3.0 2.3 2.4 4.5 6.9Jalal-Abad 3.1 5.3 5.5 5.4 8.9 15.3Issyk-Kul 3.2 4.2 4.7 5.3 6.4 8.2Naryn 2.4 0.9 1.1 1.4 2.3 3.9Osh 6.311 2.8 3.4 3.3 4.7 6.7Talas 2.6 2.2 1.9 2.1 3.6 3.8Chui 14.3 13.7 15.1 16.0 21.6 21.4Bishkek city 14.5 13.5 14.8 15.4 16.1 16.4Osh city … 7.8 5.1 5.1 7.6 8.5
The indicator of manufacturing employment reflects the contribution of production to job creation. In developing countries, it reveals the ability of production to absorb the surplus labour force from agriculture and other traditional sectors into productive labour with higher wages. In industrialized countries, innovation and technology have been the main drivers of product improvement, especially in manufacturing, but at the same time the focus has shifted to reducing the workforce as part of cost-cutting measures. Structural changes contribute to the development of capital-intensive industries, and consequently the share of production in total employment may decrease.
In 2018, the proportion of people employed in manufacturing industry in Kyrgyzstan was 12 per cent, 1.5 times higher than 2010. In recent years, the largest proportions of people employed in manufacturing were registered in the Chui and Jalal-Abad regions, as well as in the cities of Bishkek and Osh.
Over the years, the share of small businesses in total industrial output has fluctuated between 1.6 per cent and 1.7 per cent.
9.3.1. Proportion of small-scale industries in total industrial value added(percentage to total volume)
2010 2014 2015 2016 2017 2018Proportion of small-scale enterprises in total industrial value added 1.6 1.5 1.5 1.5 1.7 1.7
A small business is one of the most important elements of the market structure. Creating a small business is a necessary condition for creating a competitive environment, creating new jobs, and saturating the market with goods and services. Small enterprises are more able to respond quickly to changes in market conditions, diversify production, and implement innovative activities.
11 Including Osh city.
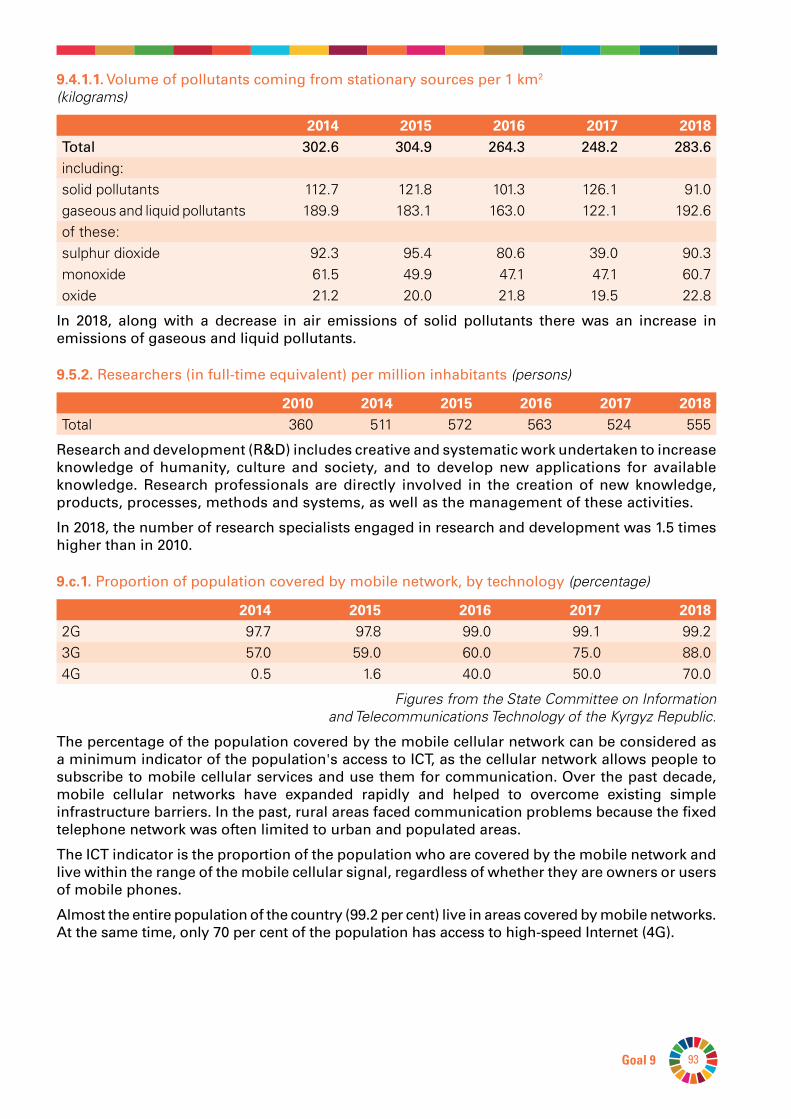
93Goal 9
9.4.1.1. Volume of pollutants coming from stationary sources per 1 km2 (kilograms)
2014 2015 2016 2017 2018Total 302.6 304.9 264.3 248.2 283.6including:solid pollutants 112.7 121.8 101.3 126.1 91.0gaseous and liquid pollutants 189.9 183.1 163.0 122.1 192.6of these:sulphur dioxide 92.3 95.4 80.6 39.0 90.3monoxide 61.5 49.9 47.1 47.1 60.7oxide 21.2 20.0 21.8 19.5 22.8
In 2018, along with a decrease in air emissions of solid pollutants there was an increase in emissions of gaseous and liquid pollutants.
9.5.2. Researchers (in full-time equivalent) per million inhabitants (persons)
2010 2014 2015 2016 2017 2018Total 360 511 572 563 524 555
Research and development (R&D) includes creative and systematic work undertaken to increase knowledge of humanity, culture and society, and to develop new applications for available knowledge. Research professionals are directly involved in the creation of new knowledge, products, processes, methods and systems, as well as the management of these activities.
In 2018, the number of research specialists engaged in research and development was 1.5 times higher than in 2010.
9.c.1. Proportion of population covered by mobile network, by technology (percentage)
2014 2015 2016 2017 20182G 97.7 97.8 99.0 99.1 99.23G 57.0 59.0 60.0 75.0 88.04G 0.5 1.6 40.0 50.0 70.0
Figures from the State Committee on Information and Telecommunications Technology of the Kyrgyz Republic.
The percentage of the population covered by the mobile cellular network can be considered as a minimum indicator of the population's access to ICT, as the cellular network allows people to subscribe to mobile cellular services and use them for communication. Over the past decade, mobile cellular networks have expanded rapidly and helped to overcome existing simple infrastructure barriers. In the past, rural areas faced communication problems because the fixed telephone network was often limited to urban and populated areas.
The ICT indicator is the proportion of the population who are covered by the mobile network and live within the range of the mobile cellular signal, regardless of whether they are owners or users of mobile phones.
Almost the entire population of the country (99.2 per cent) live in areas covered by mobile networks. At the same time, only 70 per cent of the population has access to high-speed Internet (4G).

Monitoring of the Sustainable Development Goal Indicators in the Kyrgyz Republic94
REDUCE INEQUALITY WITHIN AND AMONG COUNTRIESFacts and figures from the Kyrgyz Republic
NSC figures for 2018
110% 50%2.6%
ReduceD inequalitIES
of girls and women aged 15-49 facedDISCRIMINATION OR HARASSMENTon grounds forbidden by international law
THE GROWTH IN AVERAGE PER CAPITA INCOME of the least affluent 40% of the population
was
which is
lower than the average for the entire population
12%
of the population
had incomesof less than
of medianincome
8%
of the population, in soms per month per capitaMEDIAN INCOME
2015 2016 2017 20183390.2 3572.5 3991.9 4466.4
95Goal 10
GOAL10.REDUCEINEQUALITYWITHINANDAMONGCOUNTRIES
The international community has done much to lift people out of poverty. The most vulnerable states – the least developed countries, landlocked developing countries and small island developing states – are continuing to take measures to reduce poverty. However, the problem of inequality still persists: there are large differences in the level of access to medical and educational services.
While the income gap between countries appears to have narrowed, the problem of inequality within countries has worsened. There is a growing perception that economic growth alone cannot reduce poverty if it is not inclusive and based on all three dimensions of sustainable development: the economic, social and environmental.
To reduce inequality, a policy based on the principles of universality, but taking into account the needs of disadvantaged and marginalized groups, is recommended. In this regard, it is still necessary to strengthen the role of developing countries in the forums of international economic and financial institutions. In addition, remittances can be of vital importance to the families and communities of international migrant workers in their countries of origin, but the high cost of transferring these funds continues to reduce their real benefits.
Targets:
10.1 By 2030, progressively achieve and sustain income growth of the bottom 40 per cent of the population at a rate higher than the national average.
10.2 By 2030, empower and promote the social, economic and political inclusion of all, irrespective of age, sex, disability, race, ethnicity, origin, religion or economic or other status.
10.3 Ensure equal opportunity and reduce inequalities of outcome, including by eliminating discriminatory laws, policies and practices and promoting appropriate legislation, policies and action in this regard.
10.4 Adopt policies, especially fiscal, wage and social protection policies, and progressively achieve greater equality.
10.5 Improve the regulation and monitoring of global financial markets and institutions and strengthen the implementation of such regulations.
10.6 Ensure there is an enhanced representation and voice for developing countries in decision-making in global international economic and financial institutions in order to deliver more effective, credible, accountable and legitimate institutions.
10.7 Facilitate orderly, safe, regular and responsible migration and mobility of people, including through the implementation of planned and well-managed migration policies.
10.a Implement the principle of special and differential treatment for developing countries, in particular for the least developed countries, in accordance with World Trade Organization agreements.
10.b Encourage official development assistance and financial flows, including foreign direct investment, to states where the need is greatest, in particular to least developed countries,

Monitoring of the Sustainable Development Goal Indicators in the Kyrgyz Republic96
African countries, small island developing States and landlocked developing countries, in accordance with their national plans and programmes.
10.c By 2030, reduce to less than 3 per cent the transaction costs of migrant remittances and eliminate remittance corridors with costs higher than 5 per cent.
10.1.1. Growth rates of average income per capita, income per capita among the bottom 40 per cent of the population and the total population (percentage of previous year)
2010 2014 2015 2016 2017 2018Growth rates of income per capita among the bottom 40 per cent of the population 106.2 123.7 102.2 106.2 113.0 110.0Growth rate of income per capita of the total population 107.9 121.2 103.0 104.5 111.3 112.6
Figures from KIHS.
Improving overall well-being requires both economic growth and equity. Promoting shared prosperity is defined as stimulating income growth in the bottom 40 per cent of wealth distribution in each country and is measured by calculating average annual growth in average real income per capita. Choosing the bottom 40 per cent as the target population is one of the practical trade-offs. The bottom 40 per cent varies across countries depending on the distribution of wealth, and can change over time within a country. Since the improving of general welfare is country-specific goal, there is no globally defined numerical goal.
The growth rate of total wealth of the poorest 40 per cent is calculated as the average annual growth rate of real per capita income of the bottom 40 per cent of the country's income distribution, based on household surveys over a period of approximately five years. The average national growth rate of aggregate wealth is calculated as the average annual growth rate of real income per capita based on household surveys.
In recent years, the average per capita income of the least well-off 40 per cent of the country's population has been growing. At the same time, the growth in average per capita income of the least well-off 40 per cent of the population in 2018 was 110 per cent, 2.6 per cent lower than the average for the entire population.
2015 2016 2017 2018
Urban Rural
8.214.1 8.513.3 7.912.7 8.114.0
Figure16. Proportion of people living below 50 per cent of median income (percentage)
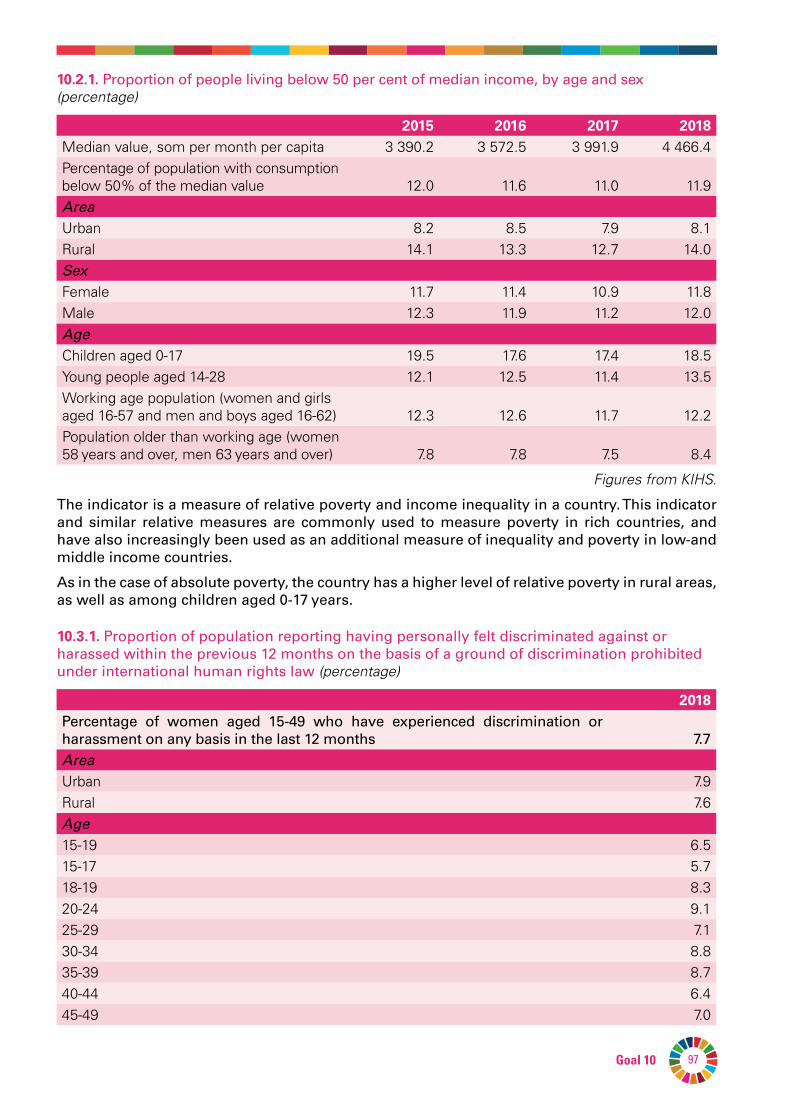
97Goal 10
10.2.1. Proportion of people living below 50 per cent of median income, by age and sex (percentage)
2015 2016 2017 2018Median value, som per month per capita 3 390.2 3 572.5 3 991.9 4 466.4Percentage of population with consumption below 50% of the median value 12.0 11.6 11.0 11.9AreaUrban 8.2 8.5 7.9 8.1Rural 14.1 13.3 12.7 14.0SexFemale 11.7 11.4 10.9 11.8Male 12.3 11.9 11.2 12.0AgeChildren aged 0-17 19.5 17.6 17.4 18.5Young people aged 14-28 12.1 12.5 11.4 13.5Working age population (women and girls aged 16-57 and men and boys aged 16-62) 12.3 12.6 11.7 12.2Population older than working age (women 58 years and over, men 63 years and over) 7.8 7.8 7.5 8.4
Figures from KIHS.
The indicator is a measure of relative poverty and income inequality in a country. This indicator and similar relative measures are commonly used to measure poverty in rich countries, and have also increasingly been used as an additional measure of inequality and poverty in low-and middle income countries.
As in the case of absolute poverty, the country has a higher level of relative poverty in rural areas, as well as among children aged 0-17 years.
10.3.1.Proportion of population reporting having personally felt discriminated against or harassed within the previous 12 months on the basis of a ground of discrimination prohibited under international human rights law (percentage)
2018Percentage of women aged 15-49 who have experienced discrimination or harassment on any basis in the last 12 months 7.7AreaUrban 7.9Rural 7.6Age15-19 6.515-17 5.718-19 8.320-24 9.125-29 7.130-34 8.835-39 8.740-44 6.445-49 7.0
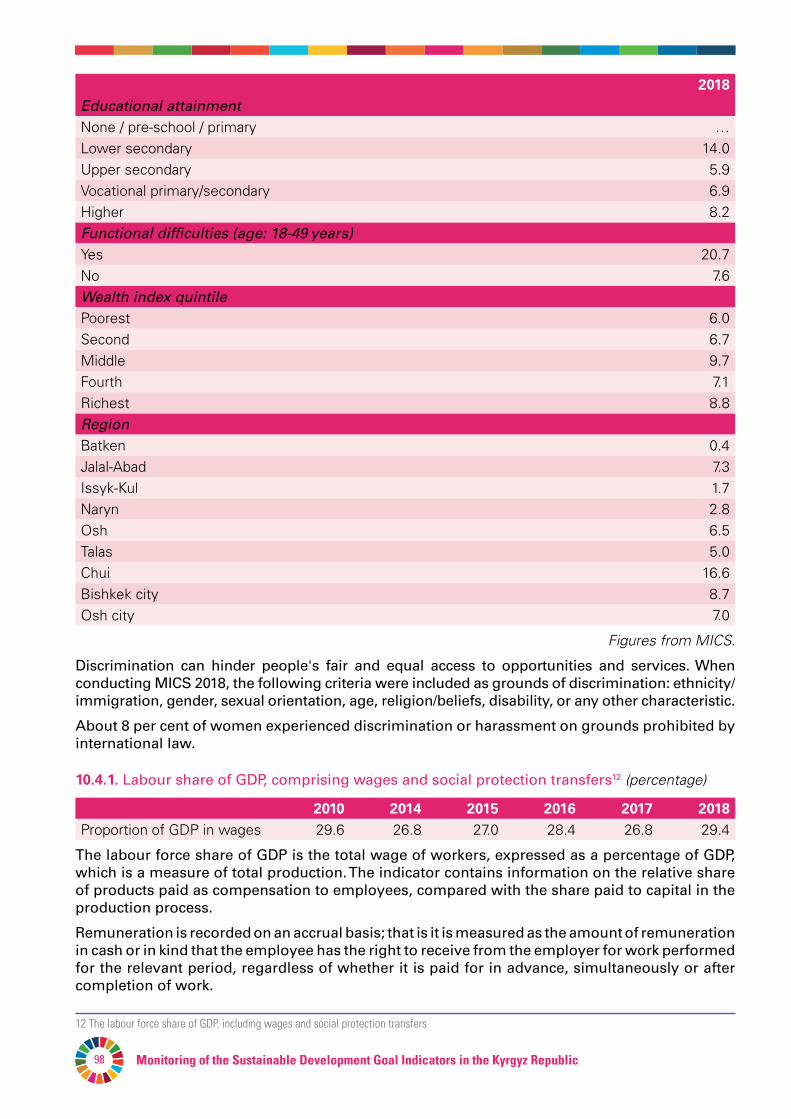
Monitoring of the Sustainable Development Goal Indicators in the Kyrgyz Republic98
2018Educational attainmentNone / pre-school / primary …Lower secondary 14.0Upper secondary 5.9Vocational primary/secondary 6.9Higher 8.2Functional difficulties (age: 18-49 years)Yes 20.7No 7.6Wealth index quintilePoorest 6.0Second 6.7Middle 9.7Fourth 7.1Richest 8.8Region Batken 0.4Jalal-Abad 7.3Issyk-Kul 1.7Naryn 2.8Osh 6.5Talas 5.0Chui 16.6Bishkek city 8.7Osh city 7.0
Figures from MICS.
Discrimination can hinder people's fair and equal access to opportunities and services. When conducting MICS 2018, the following criteria were included as grounds of discrimination: ethnicity/immigration, gender, sexual orientation, age, religion/beliefs, disability, or any other characteristic.
About 8 per cent of women experienced discrimination or harassment on grounds prohibited by international law.
10.4.1. Labour share of GDP, comprising wages and social protection transfers12 (percentage)
2010 2014 2015 2016 2017 2018Proportion of GDP in wages 29.6 26.8 27.0 28.4 26.8 29.4
The labour force share of GDP is the total wage of workers, expressed as a percentage of GDP, which is a measure of total production. The indicator contains information on the relative share of products paid as compensation to employees, compared with the share paid to capital in the production process.
Remuneration is recorded on an accrual basis; that is it is measured as the amount of remuneration in cash or in kind that the employee has the right to receive from the employer for work performed for the relevant period, regardless of whether it is paid for in advance, simultaneously or after completion of work.
12 The labour force share of GDP, including wages and social protection transfers
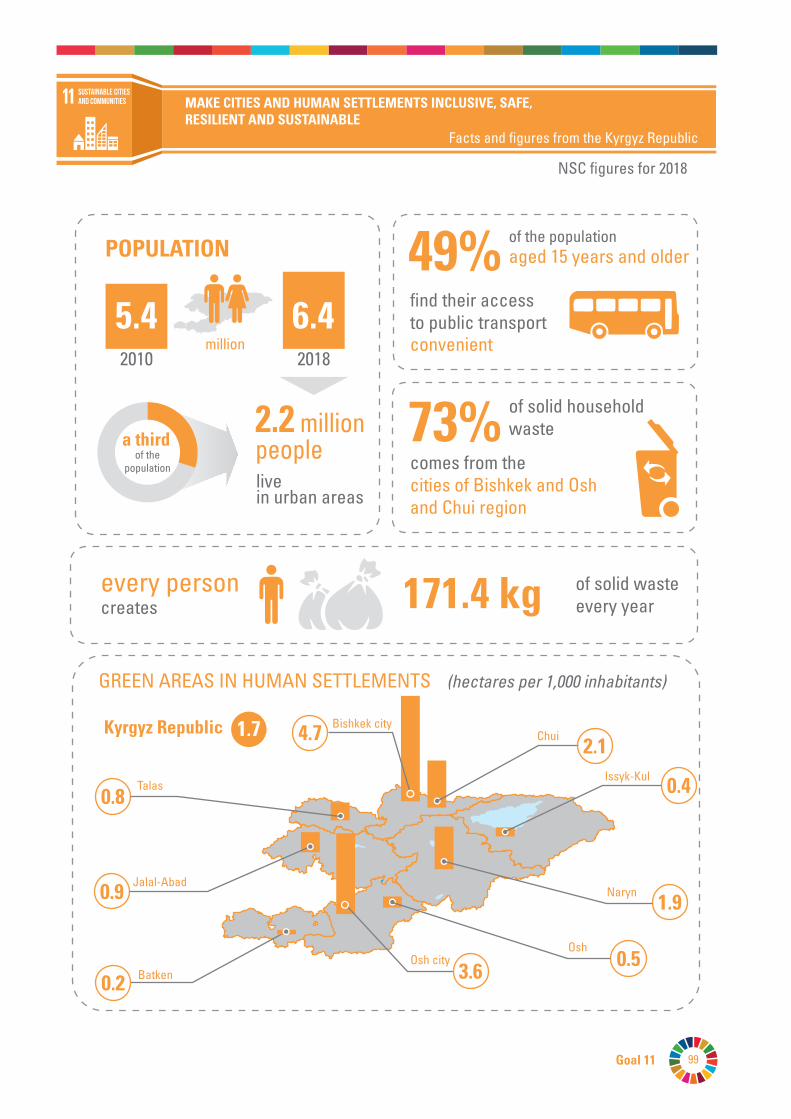
99Goal 11
49%
73%
MAKE CITIES AND HUMAN SETTLEMENTS INCLUSIVE, SAFE, RESILIENT AND SUSTAINABLE
Facts and figures from the Kyrgyz Republic
NSC figures for 2018
Sustainable cities and communities
POPULATION
million
live in urban areas
2010 2018
a thirdof the
population
2.2 million people
of the populationaged 15 years and older
find their accessto public transport convenient
of solid household waste
comes from the cities of Bishkek and Osh and Chui region
every personcreates
5.4 6.4
171.4 kg of solid wasteevery year
Chui
Talas
Jalal-Abad
OshOsh city
Naryn
Batken
GREEN AREAS IN HUMAN SETTLEMENTS
1.7
0.2
0.9
0.8
4.7
3.6 0.5
0.4
2.1
1.9
Kyrgyz Republic
Issyk-Kul
Bishkek city
(hectares per 1,000 inhabitants)
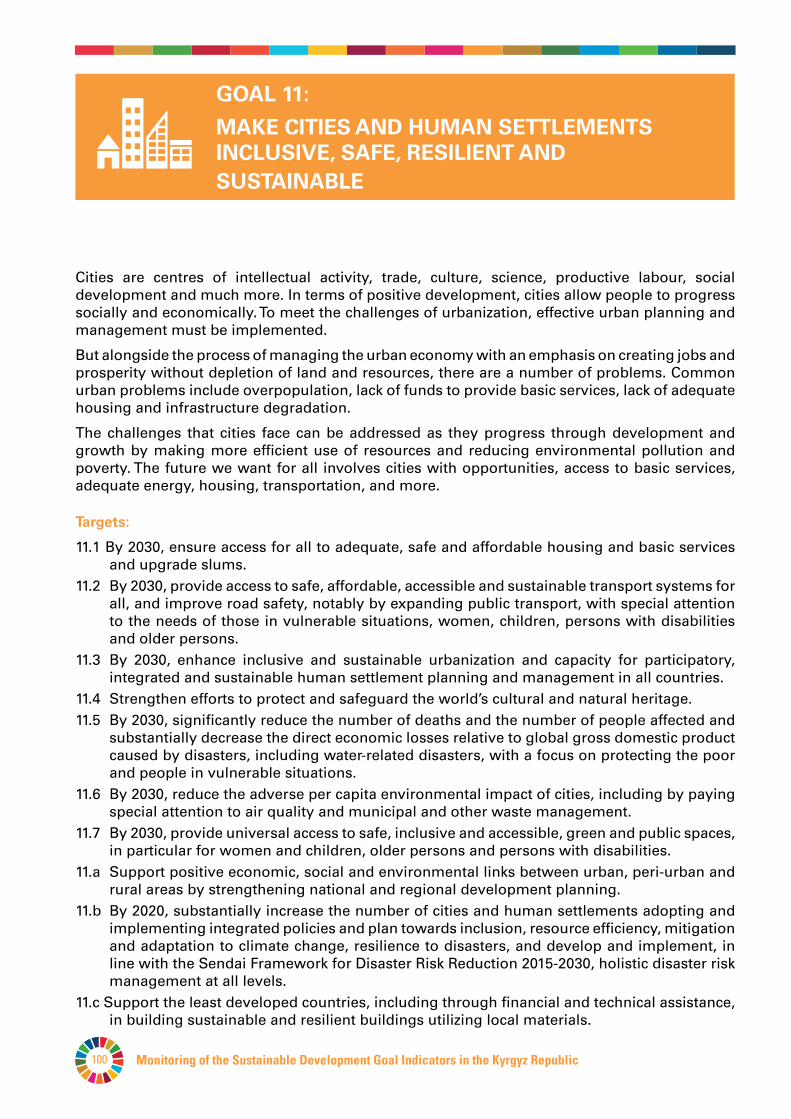
Monitoring of the Sustainable Development Goal Indicators in the Kyrgyz Republic100
GOAL11:MAKECITIESANDHUMANSETTLEMENTSINCLUSIVE,SAFE,RESILIENTANDSUSTAINABLE
Cities are centres of intellectual activity, trade, culture, science, productive labour, social development and much more. In terms of positive development, cities allow people to progress socially and economically. To meet the challenges of urbanization, effective urban planning and management must be implemented.
But alongside the process of managing the urban economy with an emphasis on creating jobs and prosperity without depletion of land and resources, there are a number of problems. Common urban problems include overpopulation, lack of funds to provide basic services, lack of adequate housing and infrastructure degradation.
The challenges that cities face can be addressed as they progress through development and growth by making more efficient use of resources and reducing environmental pollution and poverty. The future we want for all involves cities with opportunities, access to basic services, adequate energy, housing, transportation, and more.
Targets:
11.1 By 2030, ensure access for all to adequate, safe and affordable housing and basic services and upgrade slums.
11.2 By 2030, provide access to safe, affordable, accessible and sustainable transport systems for all, and improve road safety, notably by expanding public transport, with special attention to the needs of those in vulnerable situations, women, children, persons with disabilities and older persons.
11.3 By 2030, enhance inclusive and sustainable urbanization and capacity for participatory, integrated and sustainable human settlement planning and management in all countries.
11.4 Strengthen efforts to protect and safeguard the world’s cultural and natural heritage.11.5 By 2030, significantly reduce the number of deaths and the number of people affected and
substantially decrease the direct economic losses relative to global gross domestic product caused by disasters, including water-related disasters, with a focus on protecting the poor and people in vulnerable situations.
11.6 By 2030, reduce the adverse per capita environmental impact of cities, including by paying special attention to air quality and municipal and other waste management.
11.7 By 2030, provide universal access to safe, inclusive and accessible, green and public spaces, in particular for women and children, older persons and persons with disabilities.
11.a Support positive economic, social and environmental links between urban, peri-urban and rural areas by strengthening national and regional development planning.
11.b By 2020, substantially increase the number of cities and human settlements adopting and implementing integrated policies and plan towards inclusion, resource efficiency, mitigation and adaptation to climate change, resilience to disasters, and develop and implement, in line with the Sendai Framework for Disaster Risk Reduction 2015-2030, holistic disaster risk management at all levels.
11.c Support the least developed countries, including through financial and technical assistance, in building sustainable and resilient buildings utilizing local materials.
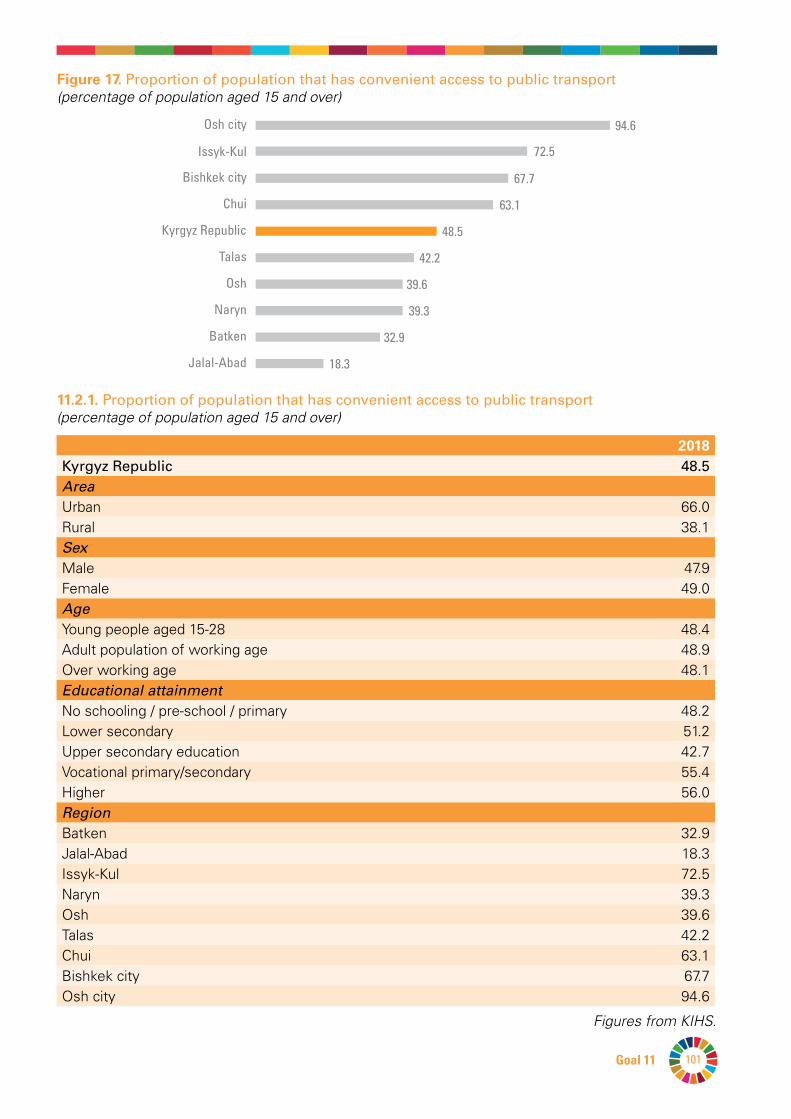
101Goal 11
11.2.1. Proportion of population that has convenient access to public transport (percentage of population aged 15 and over)
2018Kyrgyz Republic 48.5AreaUrban 66.0Rural 38.1Sex Male 47.9Female 49.0Age Young people aged 15-28 48.4Adult population of working age 48.9Over working age 48.1Educational attainment No schooling / pre-school / primary 48.2Lower secondary 51.2Upper secondary education 42.7Vocational primary/secondary 55.4Higher 56.0Region Batken 32.9Jalal-Abad 18.3Issyk-Kul 72.5Naryn 39.3Osh 39.6Talas 42.2Chui 63.1Bishkek city 67.7Osh city 94.6
Figures from KIHS.
Batken 32.9
Jalal-Abad 18.3
Kyrgyz Republic 48.5
Chui 63.1
Issyk-Kul 72.5
Osh city 94.6
Naryn 39.3
Talas 42.2
Bishkek city 67.7
Osh 39.6
Figure17.Proportion of population that has convenient access to public transport (percentage of population aged 15 and over)
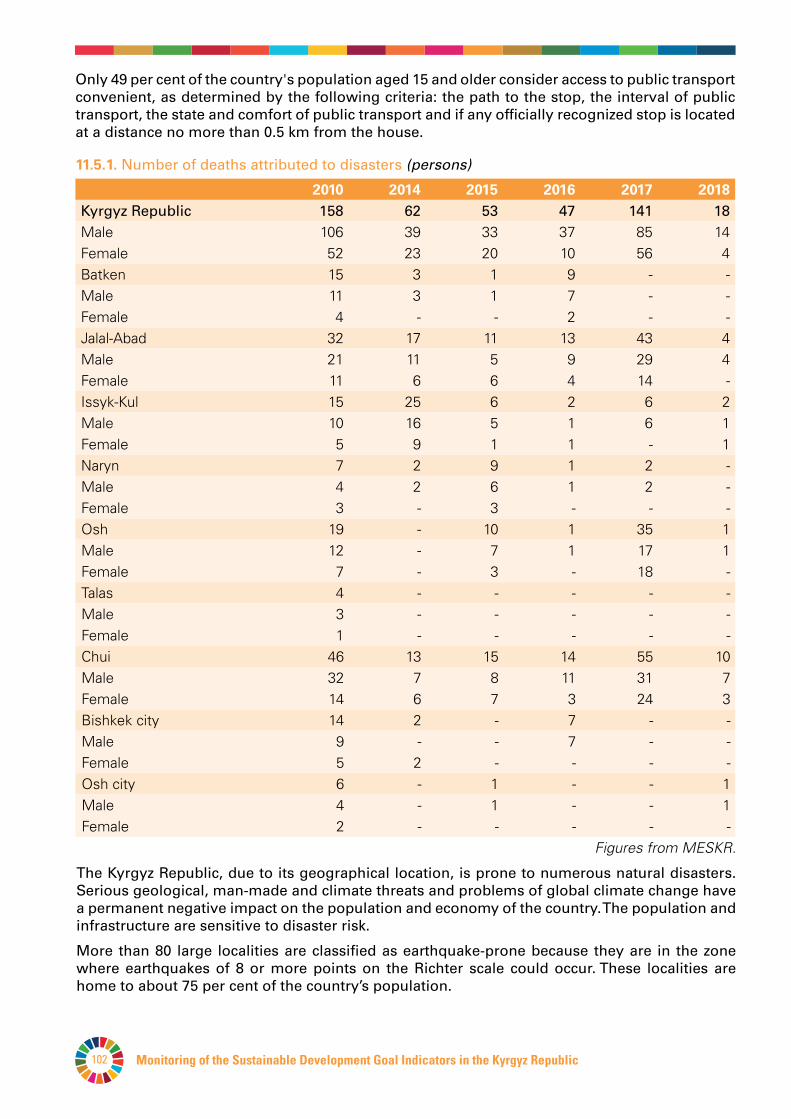
Monitoring of the Sustainable Development Goal Indicators in the Kyrgyz Republic102
Only 49 per cent of the country's population aged 15 and older consider access to public transport convenient, as determined by the following criteria: the path to the stop, the interval of public transport, the state and comfort of public transport and if any officially recognized stop is located at a distance no more than 0.5 km from the house.
11.5.1. Number of deaths attributed to disasters (persons)
2010 2014 2015 2016 2017 2018Kyrgyz Republic 158 62 53 47 141 18Male 106 39 33 37 85 14Female 52 23 20 10 56 4Batken 15 3 1 9 - -Male 11 3 1 7 - -Female 4 - - 2 - -Jalal-Abad 32 17 11 13 43 4Male 21 11 5 9 29 4Female 11 6 6 4 14 -Issyk-Kul 15 25 6 2 6 2Male 10 16 5 1 6 1Female 5 9 1 1 - 1Naryn 7 2 9 1 2 -Male 4 2 6 1 2 -Female 3 - 3 - - -Osh 19 - 10 1 35 1Male 12 - 7 1 17 1Female 7 - 3 - 18 -Talas 4 - - - - -Male 3 - - - - -Female 1 - - - - -Chui 46 13 15 14 55 10Male 32 7 8 11 31 7Female 14 6 7 3 24 3Bishkek city 14 2 - 7 - -Male 9 - - 7 - -Female 5 2 - - - -Osh city 6 - 1 - - 1Male 4 - 1 - - 1Female 2 - - - - -
Figures from MESKR.
The Kyrgyz Republic, due to its geographical location, is prone to numerous natural disasters. Serious geological, man-made and climate threats and problems of global climate change have a permanent negative impact on the population and economy of the country. The population and infrastructure are sensitive to disaster risk.
More than 80 large localities are classified as earthquake-prone because they are in the zone where earthquakes of 8 or more points on the Richter scale could occur. These localities are home to about 75 per cent of the country’s population.

103Goal 11
11.5.2. Direct economic loss attributed to disasters in relation to national GDP
2010 2014 2015 2016 2017 2018Kyrgyz Republic 0.23 0.11 0.53 0.21 0.19 0.21Batken 0.33 0.25 3.44 2.21 0.75 1.04Jalal-Abad 1.15 0.07 0.17 0.44 0.20 0.11Issyk-Kul 0.00 0.69 0.02 0.17 0.13 0.11Naryn 1.65 0.04 0.21 0.16 0.09 0.01Osh 0.20 0.00 4.30 0.05 0.70 0.03Talas 0.30 0.01 0.06 0.52 0.09 0.00Chui 0.01 0.03 0.03 0.12 0.23 0.01Bishkek city - - 0.03 0.05 0.01 0.37Osh city - - 0.62 0.00 0.20 -
Figures from MESKR.
11.6.1.1. Volume of solid waste disposed of (kilograms per person)
2010 2014 2015 2016 2017 2018Solid waste disposed of per person 214.6 178.3 195.2 170.9 165.1 171.4
An increase in the intensity of waste generation per capita characterizes an absence of positive changes in social attitudes and production cycles and requires the adoption of additional social measures for the population, economic incentives for industry and strengthening of environmental controls by the state.
About 73 per cent of exported solid household waste in 2018 came from the cities of Bishkek and Osh and Chui region.
11.7.1.1a. Area of green spaces and tracts of land in residential areas (hectares per 1,000 people)
2014 2015 2016 2017 2018Kyrgyz Republic 1.8 1.7 1.8 1.7 1.7Batken 0.3 0.1 0.1 0.1 0.2Jalal-Abad 0.8 0.8 0.9 0.9 0.9Issyk-Kul 1.4 1.3 1.4 0.4 0.4Naryn 1.4 1.5 1.6 1.7 1.9Osh 0.3 0.3 0.4 0.4 0.5Талаская область 0.8 0.8 0.8 0.8 0.8Chui 2.2 2.1 2.1 2.1 2.1Bishkek city 5.3 5.1 5.1 5.0 4.7Osh city 3.8 3.6 3.6 3.5 3.6
Green spaces are of great importance for environmental health and societal well-being. Green spaces modulate thermal and radiation conditions and create a microclimate that provides comfortable environmental conditions. Green spaces protect populated areas from dust, gases, wind and noise. In addition, they have been proven to improve mental well-being.
Green spaces mitigate the temperature regime of open spaces on summer days in two important ways. First, green spaces, when properly placed, protect the surfaces of walls, soil and artificial coverings from direct solar radiation. Second, green cover, because of significant reflection of
Monitoring of the Sustainable Development Goal Indicators in the Kyrgyz Republic104
sunlight and large evaporation of moisture, does not reach as high temperatures as open soil, artificial coverings and stone walls.
On average, there are 1.7 hectares of green space per 1,000 people in the country. While the level in stable in most of the country, in Bishkek city and Issyk-Kul region it has been falling.
As a result, in industrial districts of Bishkek in 2018, the proportion of cases (based on tests) exceeding the maximum permissible concentration (MPC) of nitrogen dioxide increased to 61 per cent.
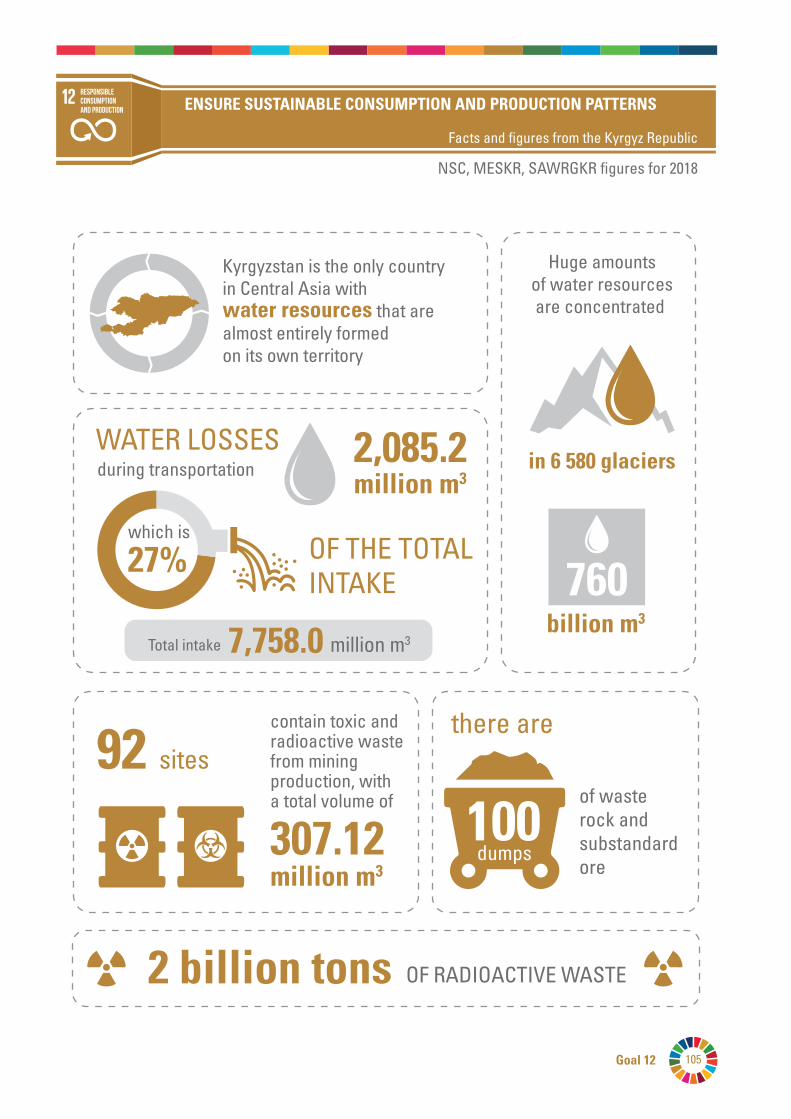
105Goal 12
ENSURE SUSTAINABLE CONSUMPTION AND PRODUCTION PATTERNS
Facts and figures from the Kyrgyz Republic
NSC, MESKR, SAWRGKR figures for 2018
OF THE TOTAL INTAKE
WATER LOSSES during transportation
Responsible consumption and production
Kyrgyzstan is the only country in Central Asia with water resources that are almost entirely formed on its own territory
Huge amountsof water resourcesare concentrated
in 6 580 glaciers
billion m3
760
2,085.2million m3
307.12million m3
92 sites
contain toxic and radioactive waste from mining production, with a total volume of 100
of waste rock and substandard ore
dumps
OF RADIOACTIVE WASTE2 billion tons
27%
Total intake 7,758.0 million m3
which is
there are
Monitoring of the Sustainable Development Goal Indicators in the Kyrgyz Republic106
GOAL12:ENSURESUSTAINABLECONSUMPTIONANDPRODUCTIONPATTERNS
Sustainable consumption and production involve promoting resource and energy efficiency; building sustainable infrastructure; providing access to basic social services; and providing green and decent jobs and a better quality of life for all. The implementation of such a programme will help overall development plans, reduce future economic, environmental and social costs, increase economic competitiveness and reduce poverty.
Today, the rate of consumption of natural resources is growing, especially in East Asian countries. Many states face challenges connected with air, water and soil pollution.
Sustainable consumption and production aim to “do more and better with less”, increasing the net benefits of economic activity to maintain the level of well-being by reducing resource use, reducing degradation and pollution throughout the life cycle, and at the same time improving the quality of life. This also requires a systematic approach and collaboration between supply chain participants – from the manufacturer to the end user. This involves engaging consumers through education and training initiatives on sustainable consumption and lifestyle issues; providing consumers with sufficient information through standardization and labelling; and organizing public procurement based on sustainability principles.
Targets:
12.1 Implement the 10-year framework of programmes on sustainable consumption and production, all countries taking action, with developed countries taking the lead, taking into account the development and capabilities of developing countries.
12.2 By 2030, achieve the sustainable management and efficient use of natural resources.
12.3 By 2030, halve per capita global food waste at the retail and consumer levels and reduce food losses along production and supply chains, including post-harvest losses.
12.4 By 2020, achieve the environmentally sound management of chemicals and all wastes throughout their life cycle in accordance with agreed international frameworks, and significantly reduce the release of pollutants to air, water and soil in order to minimize their adverse impacts on human health and the environment.
12.5 By 2030, substantially reduce waste generation through prevention, reduction, recycling and reuse.
12.6 Encourage companies, especially large and transnational companies, to adopt sustainable practices and to integrate sustainability information into their reporting cycle.
12.7 Promote public procurement practices that are sustainable, in accordance with national policies and priorities.
12.8 By 2030, ensure that people everywhere have the relevant information and awareness for sustainable development and lifestyles in harmony with nature.
12.a Support developing countries to strengthen their scientific and technological capacity to move towards more sustainable patterns of consumption and production.
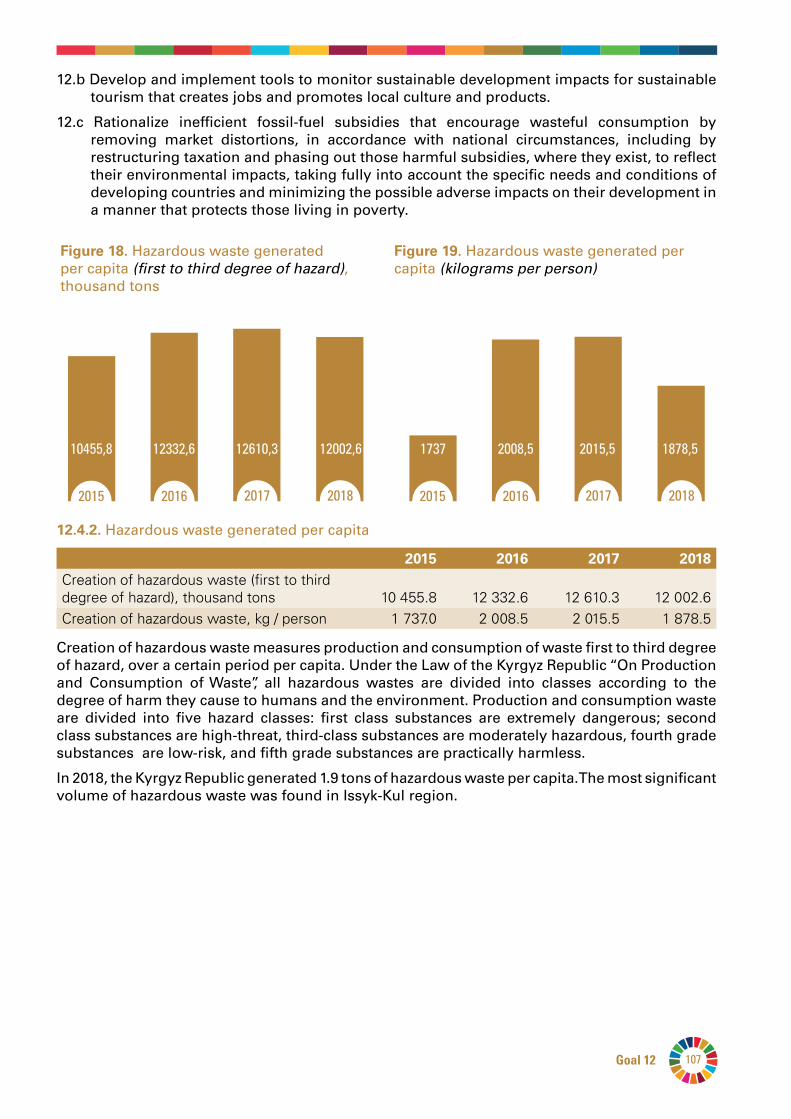
107Goal 12
12.b Develop and implement tools to monitor sustainable development impacts for sustainable tourism that creates jobs and promotes local culture and products.
12.c Rationalize inefficient fossil-fuel subsidies that encourage wasteful consumption by removing market distortions, in accordance with national circumstances, including by restructuring taxation and phasing out those harmful subsidies, where they exist, to reflect their environmental impacts, taking fully into account the specific needs and conditions of developing countries and minimizing the possible adverse impacts on their development in a manner that protects those living in poverty.
10455,8 12332,6 12610,3 12002,6
2015 2016 2017 2018
12.4.2. Hazardous waste generated per capita
2015 2016 2017 2018Creation of hazardous waste (first to third degree of hazard), thousand tons 10 455.8 12 332.6 12 610.3 12 002.6Creation of hazardous waste, kg / person 1 737.0 2 008.5 2 015.5 1 878.5
Creation of hazardous waste measures production and consumption of waste first to third degree of hazard, over a certain period per capita. Under the Law of the Kyrgyz Republic “On Production and Consumption of Waste”, all hazardous wastes are divided into classes according to the degree of harm they cause to humans and the environment. Production and consumption waste are divided into five hazard classes: first class substances are extremely dangerous; second class substances are high-threat, third-class substances are moderately hazardous, fourth grade substances are low-risk, and fifth grade substances are practically harmless.
In 2018, the Kyrgyz Republic generated 1.9 tons of hazardous waste per capita. The most significant volume of hazardous waste was found in Issyk-Kul region.
Figure18. Hazardous waste generated per capita (first to third degree of hazard), thousand tons
Figure19. Hazardous waste generated per capita (kilograms per person)
1737 2008,5 2015,5 1878,5
2015 2016 2017 2018
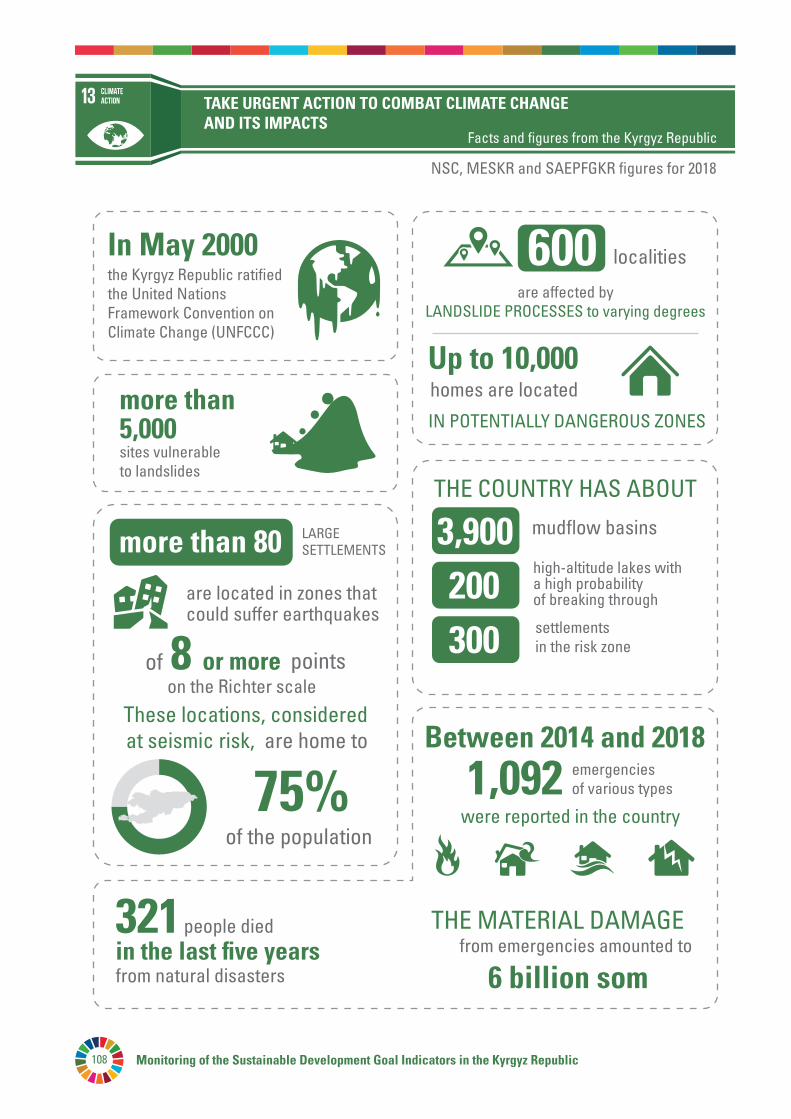
Monitoring of the Sustainable Development Goal Indicators in the Kyrgyz Republic108
TAKE URGENT ACTION TO COMBAT CLIMATE CHANGE AND ITS IMPACTS
Facts and figures from the Kyrgyz Republic
NSC, MESKR and SAEPFGKR figures for 2018
Climate action
the Kyrgyz Republic ratified the United Nations Framework Convention on Climate Change (UNFCCC)
In May 2000
321 people diedin the last five yearsfrom natural disasters
more than 5,000 sites vulnerable to landslides
are affected by LANDSLIDE PROCESSES to varying degrees
settlements in the risk zone
of the population
Up to 10,000
more than 80
IN POTENTIALLY DANGEROUS ZONES
localities600
homes are located
LARGESETTLEMENTS
are located in zones that could suffer earthquakes
of points8 or more
75%
THE COUNTRY HAS ABOUT
mudflow basins3,900200300
high-altitude lakes with a high probability of breaking through
Between 2014 and 2018
1,092 emergencies of various types
THE MATERIAL DAMAGEfrom emergencies amounted to
6 billion som
on the Richter scale
These locations, consideredat seismic risk, are home to
were reported in the country
109Goal 13
GOAL13:TAKEURGENTACTIONTOCOMBATCLIMATECHANGEANDITSIMPACTS
Climate change, driven by economic growth and population growth, has a broad impact on people and on natural systems in every country on every continent. As the air and ocean temperatures have increased, the amount of snow and ice has decreased, and the sea levels have risen. According to available forecasts, the earth's surface temperature will continue to increase during the 21st century .
As climate change has a significant impact on economic development, natural resources and the fight against poverty, overcoming this problem has become an integral part of achieving sustainable development. Developing low-cost and scalable solutions to climate change will prevent destabilization of the achievements of recent decades by climate change, and will enable countries to make a future transition to a low-carbon economy.
Targets:
13.1 Strengthen resilience and adaptive capacity to climate-related hazards and natural disasters in all countries.
13.2 Integrate climate change measures into national policies, strategies and planning.
13.3 Improve education, awareness-raising and human and institutional capacity on climate change mitigation, adaptation, impact reduction, and early warning systems.
13.A Implement the commitment undertaken by developed countries to the United Nations Framework Convention on Climate Change, mobilizing jointly $100 billion annually by 2020 from all sources to address the needs of developing countries in the context of meaningful mitigation, actions and transparency, and fully operationalize the Green Climate Fund through capitalization.
13.B Promote mechanisms for raising capacity for effective climate change-related planning and management in least developed countries and small island developing states, including focusing on women, youth, and local and marginalized communities.
There are more than 5,000 landslide-hazardous areas in the country. Six hundred localities are affected by landslide processes to varying degrees. Up to 10,000 residential buildings are located in potentially dangerous areas. There are about 3,900 mudflow basins in the country, 200 high-altitude lakes have a high probability of breaking through, and 300 localities are at risk. Of the eight types of slowly developing danger and threat, six occur on the territory of the country. This includes land degradation and forest diseases, rising temperatures, shifts in river flow, reductions in the area of glaciers, changes in biodiversity, and some indications of drought.
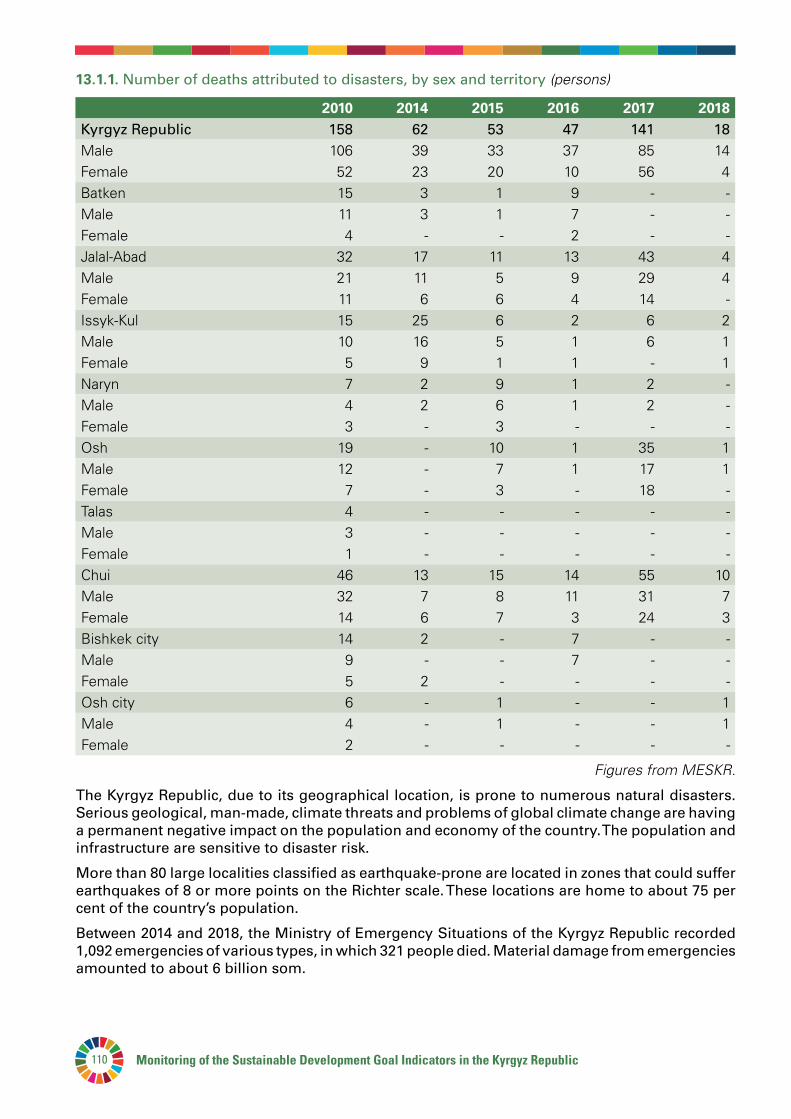
Monitoring of the Sustainable Development Goal Indicators in the Kyrgyz Republic110
13.1.1. Number of deaths attributed to disasters, by sex and territory (persons)
2010 2014 2015 2016 2017 2018Kyrgyz Republic 158 62 53 47 141 18Male 106 39 33 37 85 14Female 52 23 20 10 56 4Batken 15 3 1 9 - -Male 11 3 1 7 - -Female 4 - - 2 - -Jalal-Abad 32 17 11 13 43 4Male 21 11 5 9 29 4Female 11 6 6 4 14 -Issyk-Kul 15 25 6 2 6 2Male 10 16 5 1 6 1Female 5 9 1 1 - 1Naryn 7 2 9 1 2 -Male 4 2 6 1 2 -Female 3 - 3 - - -Osh 19 - 10 1 35 1Male 12 - 7 1 17 1Female 7 - 3 - 18 -Talas 4 - - - - -Male 3 - - - - -Female 1 - - - - -Chui 46 13 15 14 55 10Male 32 7 8 11 31 7Female 14 6 7 3 24 3Bishkek city 14 2 - 7 - -Male 9 - - 7 - -Female 5 2 - - - -Osh city 6 - 1 - - 1Male 4 - 1 - - 1Female 2 - - - - -
Figures from MESKR.
The Kyrgyz Republic, due to its geographical location, is prone to numerous natural disasters. Serious geological, man-made, climate threats and problems of global climate change are having a permanent negative impact on the population and economy of the country. The population and infrastructure are sensitive to disaster risk.
More than 80 large localities classified as earthquake-prone are located in zones that could suffer earthquakes of 8 or more points on the Richter scale. These locations are home to about 75 per cent of the country’s population.
Between 2014 and 2018, the Ministry of Emergency Situations of the Kyrgyz Republic recorded 1,092 emergencies of various types, in which 321 people died. Material damage from emergencies amounted to about 6 billion som.
111Goal 13
In descending order, the types of emergency registered are as follows: mudflows and floods, avalanches, major fires, strong winds, major road accidents, earthquakes, landslides, and flooding associated with rising ground water levels.
13.1.2 Number of countries that adopt and implement national disaster risk reduction strategies in line with the Sendai Framework for Disaster Risk Reduction 2015-2030
In March 2015, the Kyrgyz Republic committed itself to following the main priorities of the Sendai Framework Programme for Disaster Risk Reduction, and adopted the Concept of Comprehensive Protection of the Population and Territories of the Kyrgyz Republic from Emergencies for 2018-2030. The Implementation Plan for 2018-2022 was developed and approved by Government Resolution 58 of 29 January 2018.
Monitoring of the Sustainable Development Goal Indicators in the Kyrgyz Republic112
GOAL14:CONSERVEANDSUSTAINABLYUSETHEOCEANS,SEASANDMARINERESOURCESFORSUSTAINABLEDEVELOPMENT
The world's oceans – their temperature, chemical processes, currents, and life – determine the action of global systems that make the Earth habitable for humanity. Rain and drinking water, weather, climate, coastlines, most of our food, and even the oxygen in the air we breathe are all ultimately provided and regulated by the sea. Throughout history, the oceans and seas have been vital trade and cargo routes. Rational use of this most important global resource is the key to a sustainable future.
The increasing adverse effects of climate change (including ocean acidification), overfishing of commercial fish species and marine pollution threaten recent advances in the protection of the world's oceans.
Ocean acidification is closely related to changes in the carbonate content of water, which can lead to significant thinning of the shells and skeletons of many marine species (for example, reef-forming corals and shell-bearing shellfish). Research on the acidity of the marine environment in the open ocean and coastal areas around the world shows that current levels of acidity are often higher than pre-industrial levels.
Targets:
14.1 By 2025, prevent and significantly reduce marine pollution of all kinds, in particular from land-based activities, including marine debris and nutrient pollution.
14.2 By 2020, sustainably manage and protect marine and coastal ecosystems to avoid significant adverse impacts, including by strengthening their resilience, and take action for their restoration in order to achieve healthy and productive oceans.
14.3 Minimize and address the impacts of ocean acidification, including through enhanced scientific cooperation at all levels.
14.4 By 2020, effectively regulate harvesting and end overfishing, illegal, unreported and unregulated fishing and destructive fishing practices and implement science-based management plans, in order to restore fish stocks in the shortest time feasible, at least to levels that can produce maximum sustainable yield as determined by their biological characteristics.
14.5 By 2020, conserve at least 10 per cent of coastal and marine areas, consistent with national and international law and based on the best available scientific information.
14.6 By 2020, prohibit certain forms of fisheries subsidies which contribute to overcapacity and overfishing, eliminate subsidies that contribute to illegal, unreported and unregulated fishing and refrain from introducing new such subsidies, recognizing that appropriate and effective special and differential treatment for developing and least developed countries should be an integral part of the World Trade Organization fisheries subsidies negotiation.
14.7 By 2030, increase the economic benefits to Small Island developing States and least developed countries from the sustainable use of marine resources, including through sustainable management of fisheries, aquaculture and tourism.
113Goal 14
14.а Increase scientific knowledge, develop research capacity and transfer marine technology, taking into account the Intergovernmental Oceanographic Commission Criteria and Guidelines on the Transfer of Marine Technology, in order to improve ocean health and to enhance the contribution of marine biodiversity to the development of developing countries, in particular small island developing States and least developed countries.
14.b Provide access for small-scale artisanal fishers to marine resources and markets.
14.с Enhance the conservation and sustainable use of oceans and their resources by implementing international law as reflected in UNCLOS, which provides the legal framework for the conservation and sustainable use of oceans and their resources, as recalled in paragraph 158 of The Future We Want.
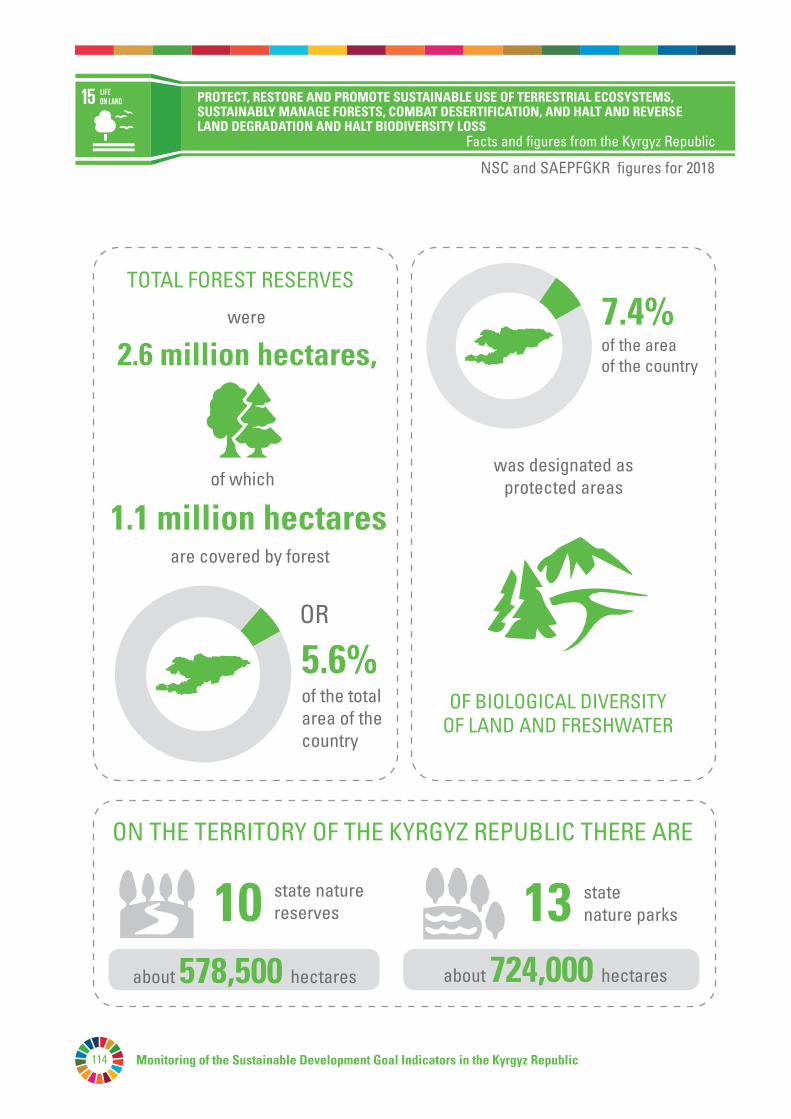
Monitoring of the Sustainable Development Goal Indicators in the Kyrgyz Republic114
Life on land PROTECT, RESTORE AND PROMOTE SUSTAINABLE USE OF TERRESTRIAL ECOSYSTEMS,
SUSTAINABLY MANAGE FORESTS, COMBAT DESERTIFICATION, AND HALT AND REVERSE LAND DEGRADATION AND HALT BIODIVERSITY LOSS
Facts and figures from the Kyrgyz Republic
NSC and SAEPFGKR figures for 2018
was designated as protected areas
TOTAL FOREST RESERVES
2.6 million hectares,
13
5.6%
of the area of the country
of which
are covered by forest
were
OR
1.1 million hectares
ON THE TERRITORY OF THE KYRGYZ REPUBLIC THERE ARE
state naturereserves
state nature parks
OF BIOLOGICAL DIVERSITYOF LAND AND FRESHWATER
7.4%
10about 578,500 hectares about 724,000 hectares
of the total area of the country
115Goal 15
GOAL15:PROTECT,RESTOREANDPROMOTESUSTAINABLEUSEOFTERRESTRIALECOSYSTEMS,SUSTAINABLYMANAGEFORESTS,COMBATDESERTIFICATION,ANDHALTANDREVERSELANDDEGRADATIONANDHALTBIODIVERSITYLOSS
Forests not only provide food security and shelter, but also play a key role in the fight against climate change, help preserve biological diversity, and are home to indigenous peoples.
Deforestation and desertification caused by human activities and climate change are serious obstacles to achieving sustainable development and have a negative impact on the lives and livelihoods of millions of people fighting poverty. Measures are being taken to manage forests and combat desertification.
Targets:
15.1 By 2020, ensure the conservation, restoration and sustainable use of terrestrial and inland freshwater ecosystems and their services, in particular forests, wetlands, mountains and drylands, in line with obligations under international agreements.
15.2 By 2020, promote the implementation of sustainable management of all types of forests, halt deforestation, restore degraded forests and substantially increase afforestation and reforestation globally.
15.3 By 2030, combat desertification, restore degraded land and soil, including land affected by desertification, drought and floods, and strive to achieve a land degradation-neutral world.
15.4 By 2030, ensure the conservation of mountain ecosystems, including their biodiversity, in order to enhance their capacity to provide benefits that are essential for sustainable development.
15.5 Take urgent and significant action to reduce the degradation of natural habitats, halt the loss of biodiversity and, by 2020, protect and prevent the extinction of threatened species.
15.6 Promote fair and equitable sharing of the benefits arising from the utilization of genetic resources and promote appropriate access to such resources, as internationally agreed.
15.7 Take urgent action to end poaching and trafficking of protected species of flora and fauna and address both demand and supply of illegal wildlife products.
15.8 By 2020, introduce measures to prevent the introduction and significantly reduce the impact of invasive alien species on land and water ecosystems and control or eradicate the priority species.
15.9 By 2020, integrate ecosystem and biodiversity values into national and local planning, development processes, poverty reduction strategies and accounts.
15.а Mobilize and significantly increase financial resources from all sources to conserve and sustainably use biodiversity and ecosystems.
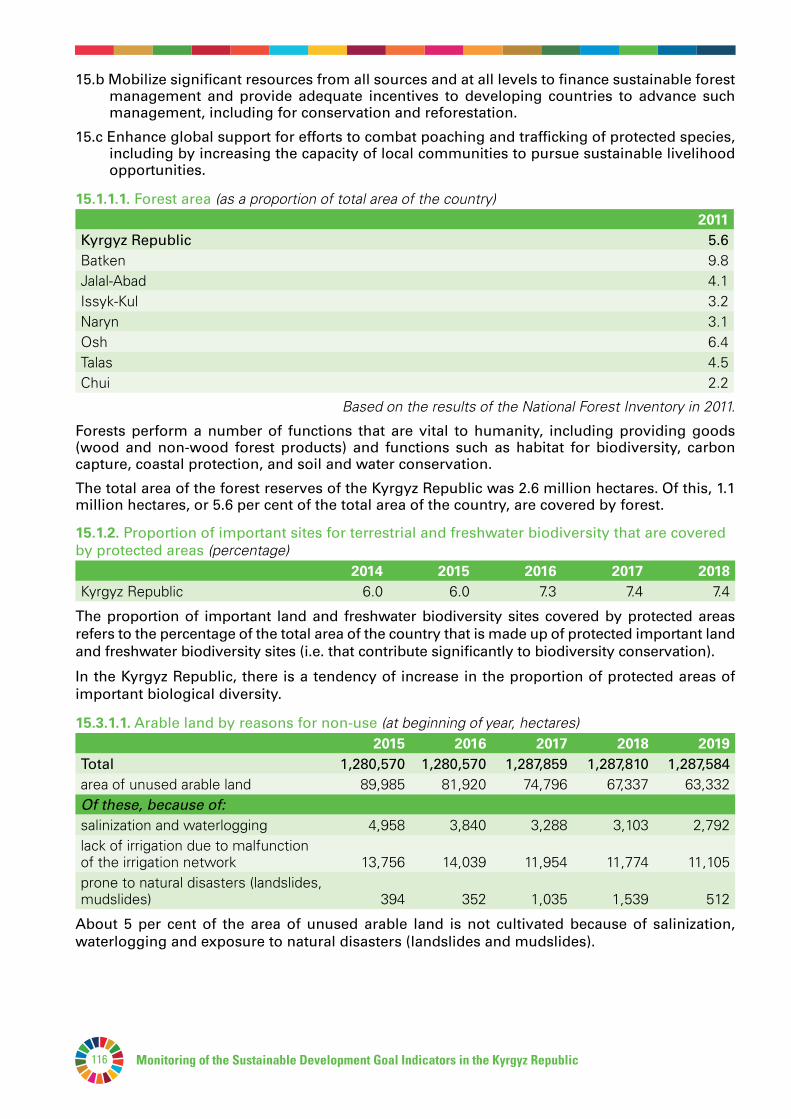
Monitoring of the Sustainable Development Goal Indicators in the Kyrgyz Republic116
15.b Mobilize significant resources from all sources and at all levels to finance sustainable forest management and provide adequate incentives to developing countries to advance such management, including for conservation and reforestation.
15.с Enhance global support for efforts to combat poaching and trafficking of protected species, including by increasing the capacity of local communities to pursue sustainable livelihood opportunities.
15.1.1.1. Forest area (as a proportion of total area of the country)2011
Kyrgyz Republic 5.6Batken 9.8Jalal-Abad 4.1Issyk-Kul 3.2Naryn 3.1Osh 6.4Talas 4.5Chui 2.2
Based on the results of the National Forest Inventory in 2011.
Forests perform a number of functions that are vital to humanity, including providing goods (wood and non-wood forest products) and functions such as habitat for biodiversity, carbon capture, coastal protection, and soil and water conservation.
The total area of the forest reserves of the Kyrgyz Republic was 2.6 million hectares. Of this, 1.1 million hectares, or 5.6 per cent of the total area of the country, are covered by forest.
15.1.2. Proportion of important sites for terrestrial and freshwater biodiversity that are covered by protected areas (percentage) 2014 2015 2016 2017 2018Kyrgyz Republic 6.0 6.0 7.3 7.4 7.4
The proportion of important land and freshwater biodiversity sites covered by protected areas refers to the percentage of the total area of the country that is made up of protected important land and freshwater biodiversity sites (i.e. that contribute significantly to biodiversity conservation).
In the Kyrgyz Republic, there is a tendency of increase in the proportion of protected areas of important biological diversity.
15.3.1.1. Arable land by reasons for non-use (at beginning of year, hectares) 2015 2016 2017 2018 2019Total 1,280,570 1,280,570 1,287,859 1,287,810 1,287,584area of unused arable land 89,985 81,920 74,796 67,337 63,332Of these, because of:salinization and waterlogging 4,958 3,840 3,288 3,103 2,792lack of irrigation due to malfunction of the irrigation network 13,756 14,039 11,954 11,774 11,105prone to natural disasters (landslides, mudslides) 394 352 1,035 1,539 512
About 5 per cent of the area of unused arable land is not cultivated because of salinization, waterlogging and exposure to natural disasters (landslides and mudslides).
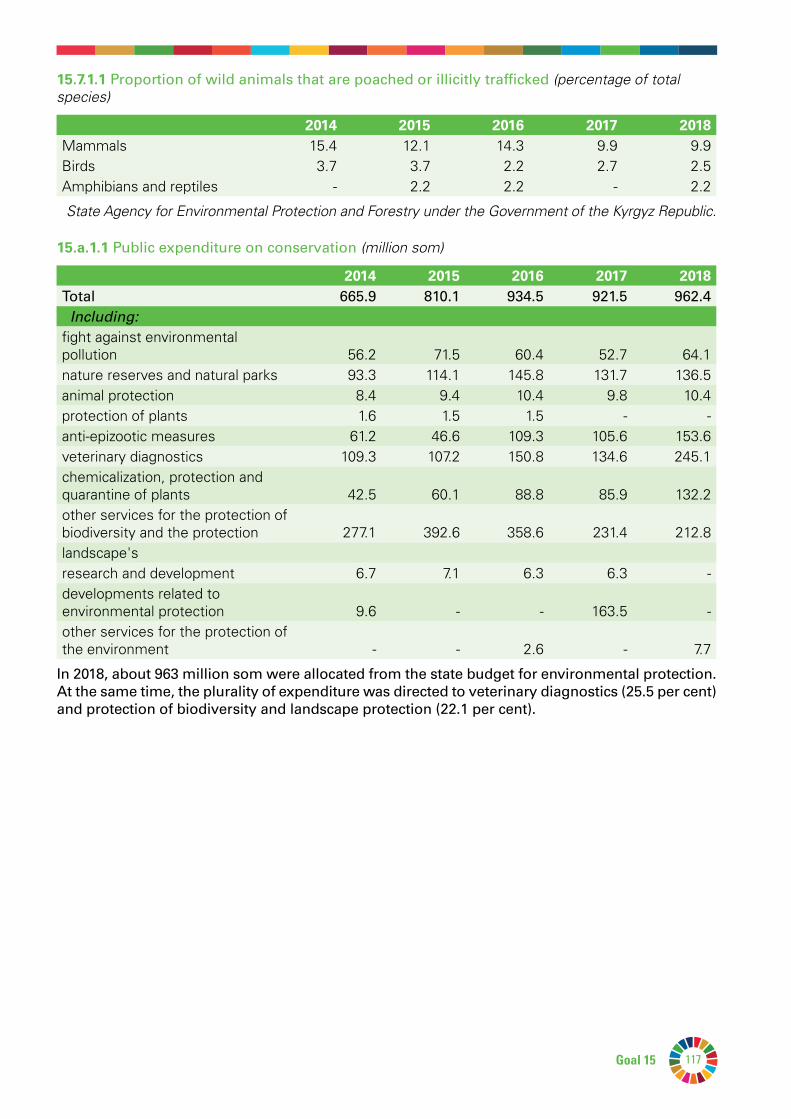
117Goal 15
15.7.1.1 Proportion of wild animals that are poached or illicitly trafficked (percentage of total species)
2014 2015 2016 2017 2018Mammals 15.4 12.1 14.3 9.9 9.9Birds 3.7 3.7 2.2 2.7 2.5Amphibians and reptiles - 2.2 2.2 - 2.2
State Agency for Environmental Protection and Forestry under the Government of the Kyrgyz Republic.
15.a.1.1 Public expenditure on conservation (million som)
2014 2015 2016 2017 2018Total 665.9 810.1 934.5 921.5 962.4 Including:fight against environmental pollution 56.2 71.5 60.4 52.7 64.1nature reserves and natural parks 93.3 114.1 145.8 131.7 136.5animal protection 8.4 9.4 10.4 9.8 10.4protection of plants 1.6 1.5 1.5 - -anti-epizootic measures 61.2 46.6 109.3 105.6 153.6veterinary diagnostics 109.3 107.2 150.8 134.6 245.1chemicalization, protection and quarantine of plants 42.5 60.1 88.8 85.9 132.2other services for the protection of biodiversity and the protection 277.1 392.6 358.6 231.4 212.8landscape'sresearch and development 6.7 7.1 6.3 6.3 -developments related to environmental protection 9.6 - - 163.5 -other services for the protection of the environment - - 2.6 - 7.7
In 2018, about 963 million som were allocated from the state budget for environmental protection. At the same time, the plurality of expenditure was directed to veterinary diagnostics (25.5 per cent) and protection of biodiversity and landscape protection (22.1 per cent).
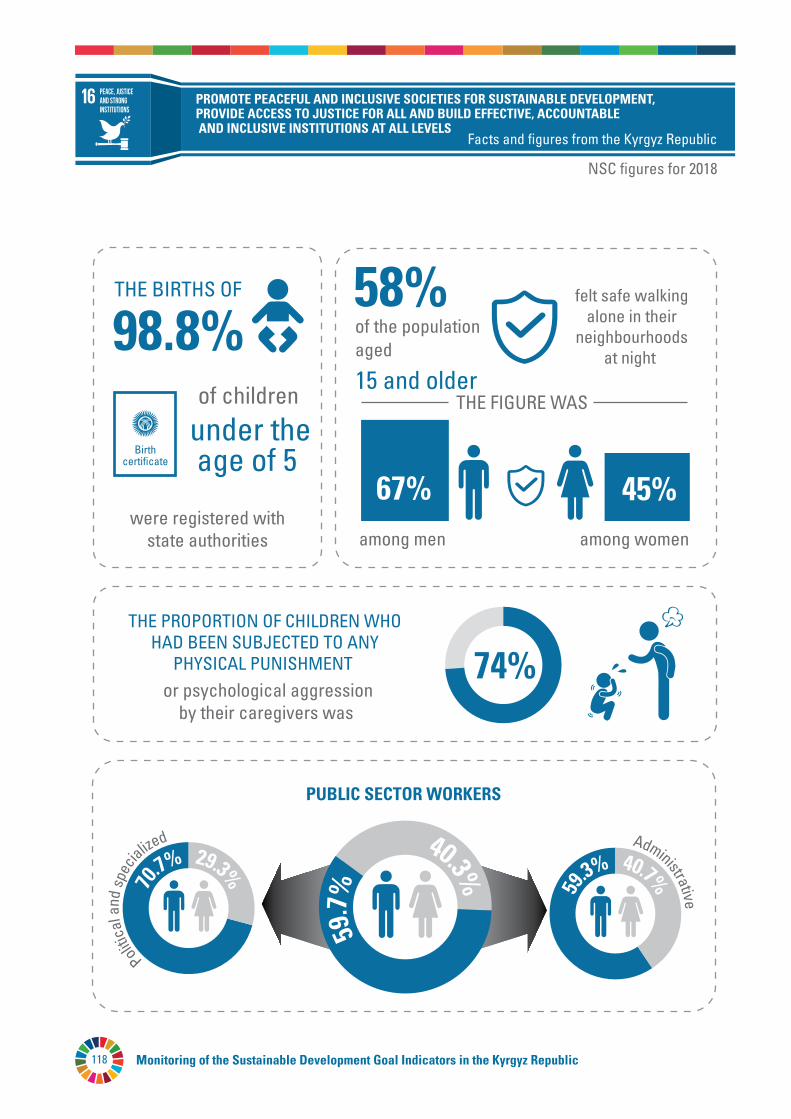
Monitoring of the Sustainable Development Goal Indicators in the Kyrgyz Republic118
98.8%58%
PROMOTE PEACEFUL AND INCLUSIVE SOCIETIES FOR SUSTAINABLE DEVELOPMENT, PROVIDE ACCESS TO JUSTICE FOR ALL AND BUILD EFFECTIVE, ACCOUNTABLE AND INCLUSIVE INSTITUTIONS AT ALL LEVELS
Facts and figures from the Kyrgyz Republic
NSC figures for 2018
Peace, justice and strong institutions
THE BIRTHS OF
of children
under theage of 5
15 and older
were registered withstate authorities
of the populationaged
felt safe walkingalone in their
neighbourhoodsat night
THE FIGURE WAS
among womenamong men
THE PROPORTION OF CHILDREN WHOHAD BEEN SUBJECTED TO ANY
PHYSICAL PUNISHMENT or psychological aggression
by their caregivers was
Birthcertificate
45%67%
PUBLIC SECTOR WORKERS
59.7
%
40.3%
70
.7% 29.3%
Politic
al a
nd s
pecia
lized Administrative59
.3% 40.7%
74%
119Goal 16
GOAL16.PROMOTEPEACEFULANDINCLUSIVESOCIETIESFORSUSTAINABLEDEVELOPMENT,PROVIDEACCESSTOJUSTICEFORALLANDBUILDEFFECTIVE,ACCOUNTABLEANDINCLUSIVEINSTITUTIONSATALLLEVELS
Building peaceful and inclusive societies involves tackling murder, violence against children, human trafficking and sexual violence. Only by addressing these challenges is it possible to pave the way to ensuring access to justice for all and effectively creating accountable institutions at all levels.
Although the number of cases of murder and human trafficking has decreased significantly over the past ten years, thousands of people are at risk of premeditated murder. Violations of children's rights as a result of aggression and sexual violence continue to occur in many countries of the world, as a result of impunity and lack of data, which seriously exacerbates the problem.
Targets:
16.1 Significantly reduce all forms of violence and related death rates everywhere.
16.2 End abuse, exploitation, trafficking and all forms of violence against and torture of children.
16.3 Promote the rule of law at the national and international levels and ensure equal access to justice for all.
16.4 By 2030, significantly reduce illicit financial and arms flows, strengthen the recovery and return of stolen assets and combat all forms of organized crime.
16.5 Substantially reduce corruption and bribery in all their forms.
16.6 Develop effective, accountable and transparent institutions at all levels.
16.7 Ensure responsive, inclusive, participatory and representative decision-making at all levels.
16.8 Broaden and strengthen the participation of developing countries in the institutions of global governance.
16.9 By 2030, provide legal identity for all, including birth registration.
16.10 Ensure public access to information and protect fundamental freedoms, in accordance with national legislation and international agreements.
16.а Strengthen relevant national institutions, including through international cooperation, for building capacity at all levels, in particular in developing countries, to prevent violence and combat terrorism and crime.
16.b Promote and enforce non-discriminatory laws and policies for sustainable development.

Monitoring of the Sustainable Development Goal Indicators in the Kyrgyz Republic120
16.1.4. Proportion of population that feel safe walking alone around the area they live (percentage)
2018Kyrgyz Republic 57.9AreaUrban 50.7Rural 62.8SexMale 67.4Female 44.7Age Young people aged 15-28 56.6Adult population of working age 59.4Over working age 54.1Educational attainmentNo education, pre-school or primary 58.8Lower secondary 63.3Upper secondary 57.7Vocational primary/secondary 59.7Higher 53.7Region Batken 63.7Jalal-Abad 46.2Issyk-Kul 69.3Naryn 71.9Osh 70.4Talas 73.3Chui 69.3Bishkek city 31.2Osh city 86.7
Figures from KIHS.
Bishkek city 31.2
Jalal-Abad 46.2
Kyrgyz Republic 57.9
Batken 63.7
Chui 69.3
Issyk-Kul 69.3
Osh 70.4
Naryn 71.9
Talas 73.3
Osh city 86.7
0 10 20 30 40 50 60 70 80 90 100
Figure20.Proportion of population that feel safe walking alone around the area they live (percentage)
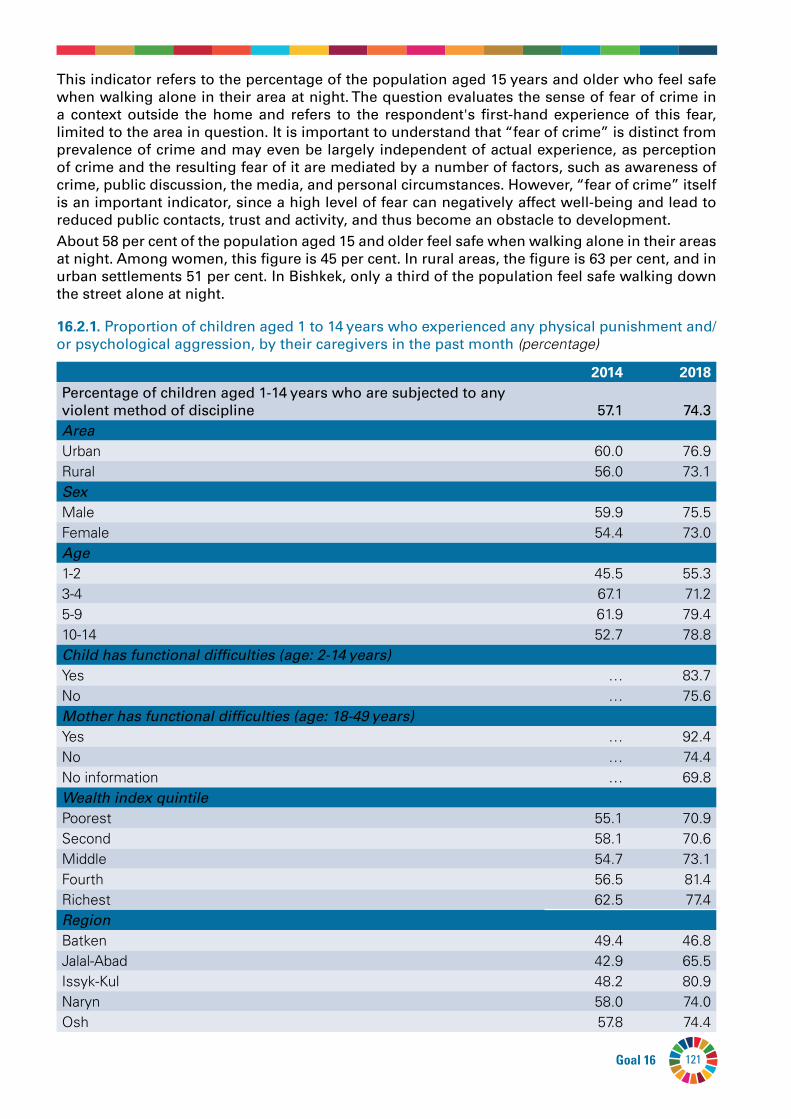
121Goal 16
This indicator refers to the percentage of the population aged 15 years and older who feel safe when walking alone in their area at night. The question evaluates the sense of fear of crime in a context outside the home and refers to the respondent's first-hand experience of this fear, limited to the area in question. It is important to understand that “fear of crime” is distinct from prevalence of crime and may even be largely independent of actual experience, as perception of crime and the resulting fear of it are mediated by a number of factors, such as awareness of crime, public discussion, the media, and personal circumstances. However, “fear of crime” itself is an important indicator, since a high level of fear can negatively affect well-being and lead to reduced public contacts, trust and activity, and thus become an obstacle to development.About 58 per cent of the population aged 15 and older feel safe when walking alone in their areas at night. Among women, this figure is 45 per cent. In rural areas, the figure is 63 per cent, and in urban settlements 51 per cent. In Bishkek, only a third of the population feel safe walking down the street alone at night.
16.2.1. Proportion of children aged 1 to 14 years who experienced any physical punishment and/or psychological aggression, by their caregivers in the past month (percentage)
2014 2018Percentage of children aged 1-14 years who are subjected to any violent method of discipline 57.1 74.3AreaUrban 60.0 76.9Rural 56.0 73.1SexMale 59.9 75.5Female 54.4 73.0Age1-2 45.5 55.33-4 67.1 71.25-9 61.9 79.410-14 52.7 78.8Child has functional difficulties (age: 2-14 years)Yes … 83.7No … 75.6Mother has functional difficulties (age: 18-49 years)Yes … 92.4No … 74.4No information … 69.8Wealth index quintilePoorest 55.1 70.9Second 58.1 70.6Middle 54.7 73.1Fourth 56.5 81.4Richest 62.5 77.4Region Batken 49.4 46.8Jalal-Abad 42.9 65.5Issyk-Kul 48.2 80.9Naryn 58.0 74.0Osh 57.8 74.4
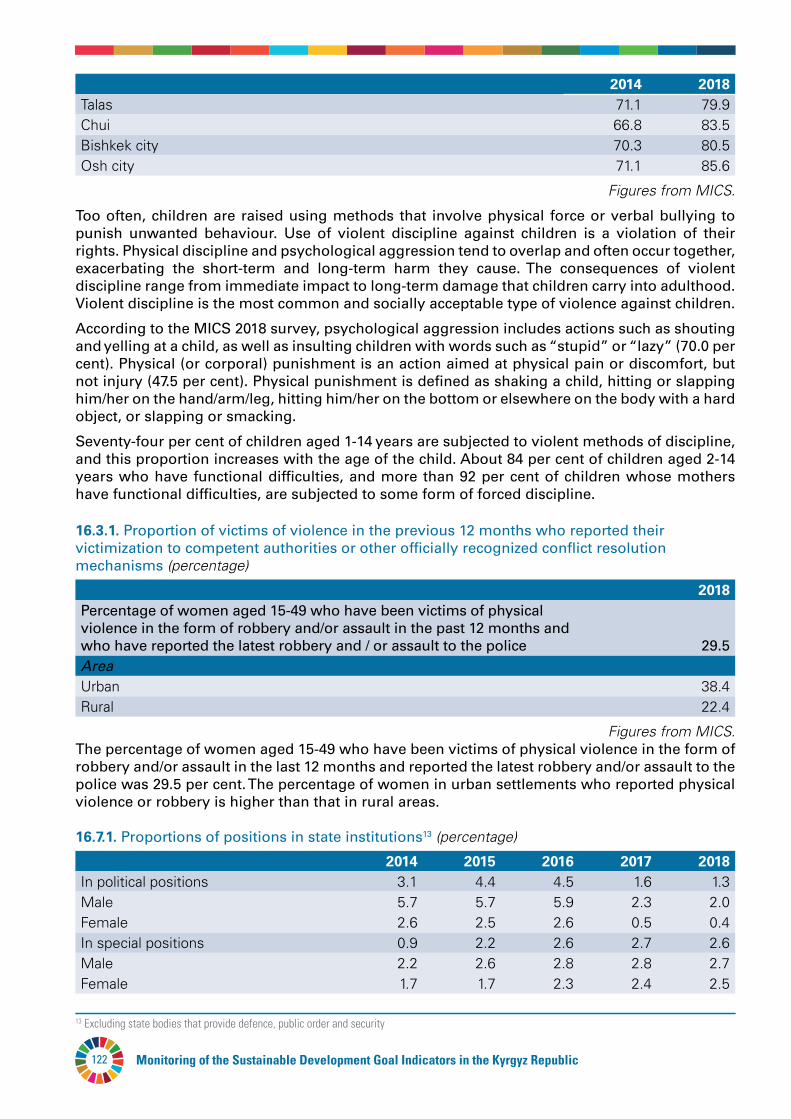
Monitoring of the Sustainable Development Goal Indicators in the Kyrgyz Republic122
2014 2018Talas 71.1 79.9Chui 66.8 83.5Bishkek city 70.3 80.5Osh city 71.1 85.6
Figures from MICS.
Too often, children are raised using methods that involve physical force or verbal bullying to punish unwanted behaviour. Use of violent discipline against children is a violation of their rights. Physical discipline and psychological aggression tend to overlap and often occur together, exacerbating the short-term and long-term harm they cause. The consequences of violent discipline range from immediate impact to long-term damage that children carry into adulthood. Violent discipline is the most common and socially acceptable type of violence against children.
According to the MICS 2018 survey, psychological aggression includes actions such as shouting and yelling at a child, as well as insulting children with words such as “stupid” or “lazy” (70.0 per cent). Physical (or corporal) punishment is an action aimed at physical pain or discomfort, but not injury (47.5 per cent). Physical punishment is defined as shaking a child, hitting or slapping him/her on the hand/arm/leg, hitting him/her on the bottom or elsewhere on the body with a hard object, or slapping or smacking.
Seventy-four per cent of children aged 1-14 years are subjected to violent methods of discipline, and this proportion increases with the age of the child. About 84 per cent of children aged 2-14 years who have functional difficulties, and more than 92 per cent of children whose mothers have functional difficulties, are subjected to some form of forced discipline.
16.3.1. Proportion of victims of violence in the previous 12 months who reported their victimization to competent authorities or other officially recognized conflict resolution mechanisms (percentage)
2018Percentage of women aged 15-49 who have been victims of physical violence in the form of robbery and/or assault in the past 12 months and who have reported the latest robbery and / or assault to the police 29.5Area Urban 38.4Rural 22.4
Figures from MICS.The percentage of women aged 15-49 who have been victims of physical violence in the form of robbery and/or assault in the last 12 months and reported the latest robbery and/or assault to the police was 29.5 per cent. The percentage of women in urban settlements who reported physical violence or robbery is higher than that in rural areas.
16.7.1. Proportions of positions in state institutions13 (percentage)
2014 2015 2016 2017 2018In political positions 3.1 4.4 4.5 1.6 1.3Male 5.7 5.7 5.9 2.3 2.0Female 2.6 2.5 2.6 0.5 0.4In special positions 0.9 2.2 2.6 2.7 2.6Male 2.2 2.6 2.8 2.8 2.7Female 1.7 1.7 2.3 2.4 2.5
13 Excluding state bodies that provide defence, public order and security
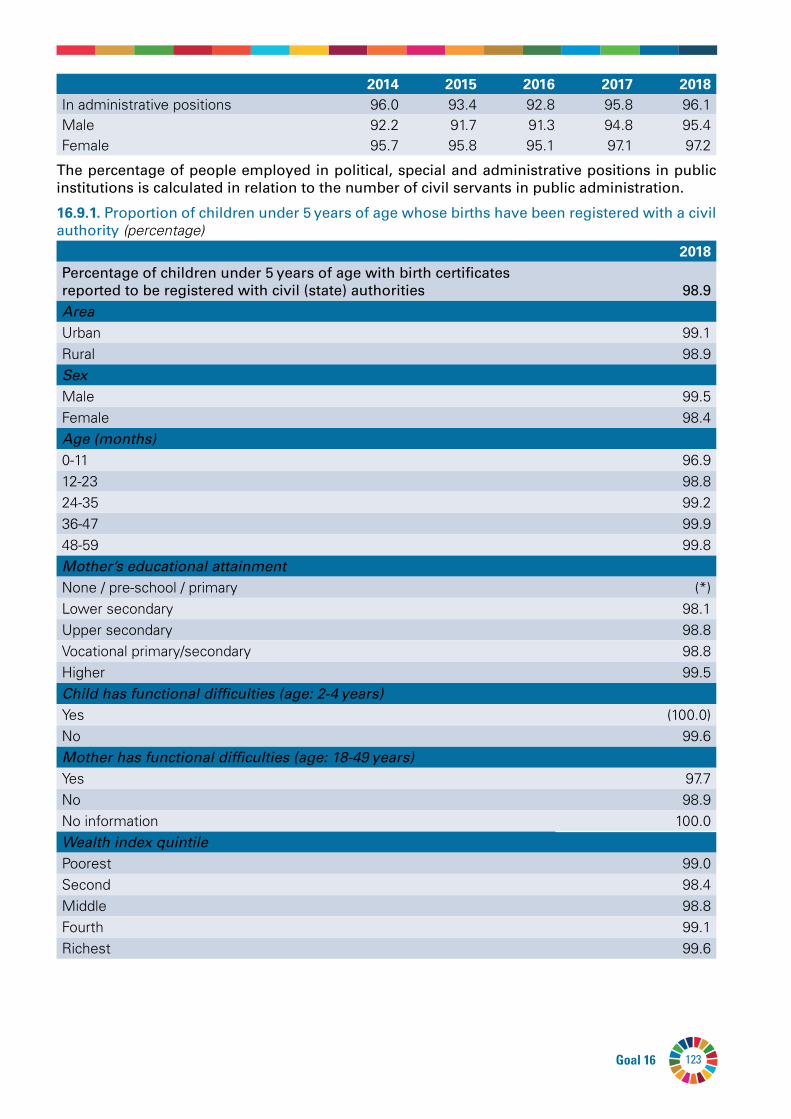
123Goal 16
2014 2015 2016 2017 2018In administrative positions 96.0 93.4 92.8 95.8 96.1Male 92.2 91.7 91.3 94.8 95.4Female 95.7 95.8 95.1 97.1 97.2
The percentage of people employed in political, special and administrative positions in public institutions is calculated in relation to the number of civil servants in public administration.
16.9.1. Proportion of children under 5 years of age whose births have been registered with a civil authority (percentage)
2018Percentage of children under 5 years of age with birth certificates reported to be registered with civil (state) authorities 98.9AreaUrban 99.1Rural 98.9SexMale 99.5Female 98.4Age (months)0-11 96.912-23 98.824-35 99.236-47 99.948-59 99.8Mother’s educational attainmentNone / pre-school / primary (*)Lower secondary 98.1Upper secondary 98.8Vocational primary/secondary 98.8Higher 99.5Child has functional difficulties (age: 2-4 years)Yes (100.0)No 99.6Mother has functional difficulties (age: 18-49 years)Yes 97.7No 98.9No information 100.0Wealth index quintilePoorest 99.0Second 98.4Middle 98.8Fourth 99.1Richest 99.6
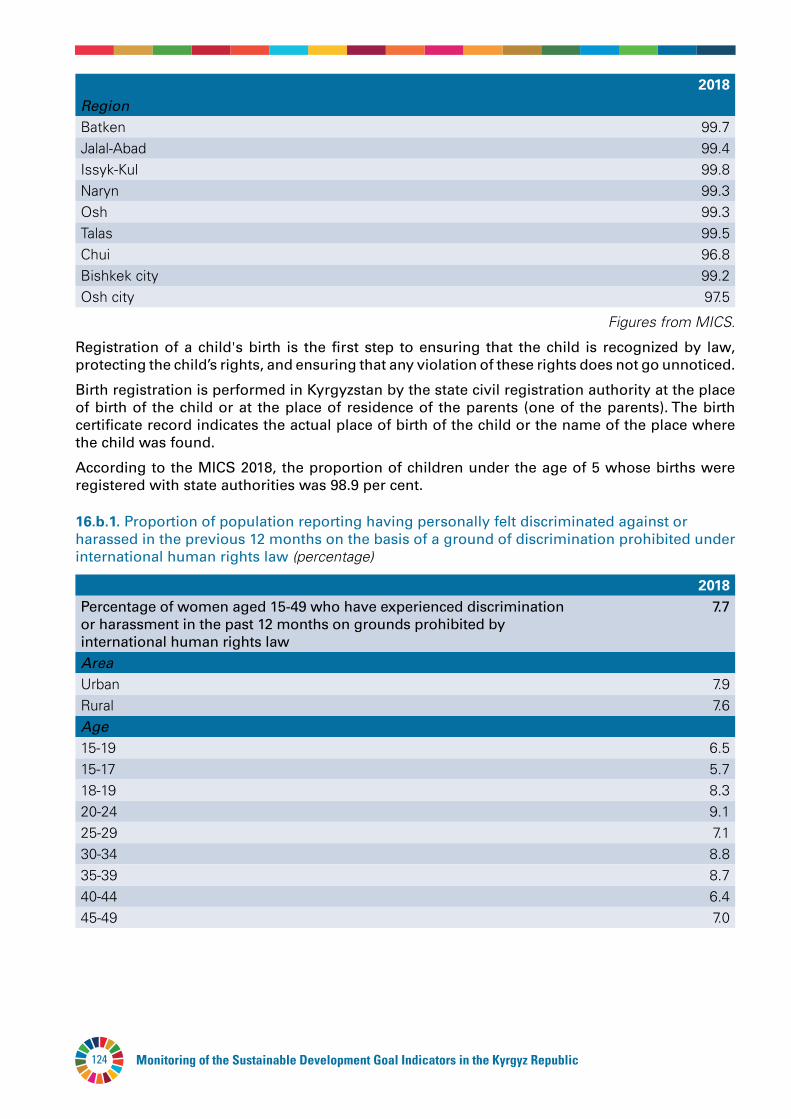
Monitoring of the Sustainable Development Goal Indicators in the Kyrgyz Republic124
2018Region Batken 99.7Jalal-Abad 99.4Issyk-Kul 99.8Naryn 99.3Osh 99.3Talas 99.5Chui 96.8Bishkek city 99.2Osh city 97.5
Figures from MICS.
Registration of a child's birth is the first step to ensuring that the child is recognized by law, protecting the child’s rights, and ensuring that any violation of these rights does not go unnoticed.
Birth registration is performed in Kyrgyzstan by the state civil registration authority at the place of birth of the child or at the place of residence of the parents (one of the parents). The birth certificate record indicates the actual place of birth of the child or the name of the place where the child was found.
According to the MICS 2018, the proportion of children under the age of 5 whose births were registered with state authorities was 98.9 per cent.
16.b.1. Proportion of population reporting having personally felt discriminated against or harassed in the previous 12 months on the basis of a ground of discrimination prohibited under international human rights law (percentage)
2018Percentage of women aged 15-49 who have experienced discrimination or harassment in the past 12 months on grounds prohibited by international human rights law
7.7
Area Urban 7.9Rural 7.6Age15-19 6.515-17 5.718-19 8.320-24 9.125-29 7.130-34 8.835-39 8.740-44 6.445-49 7.0
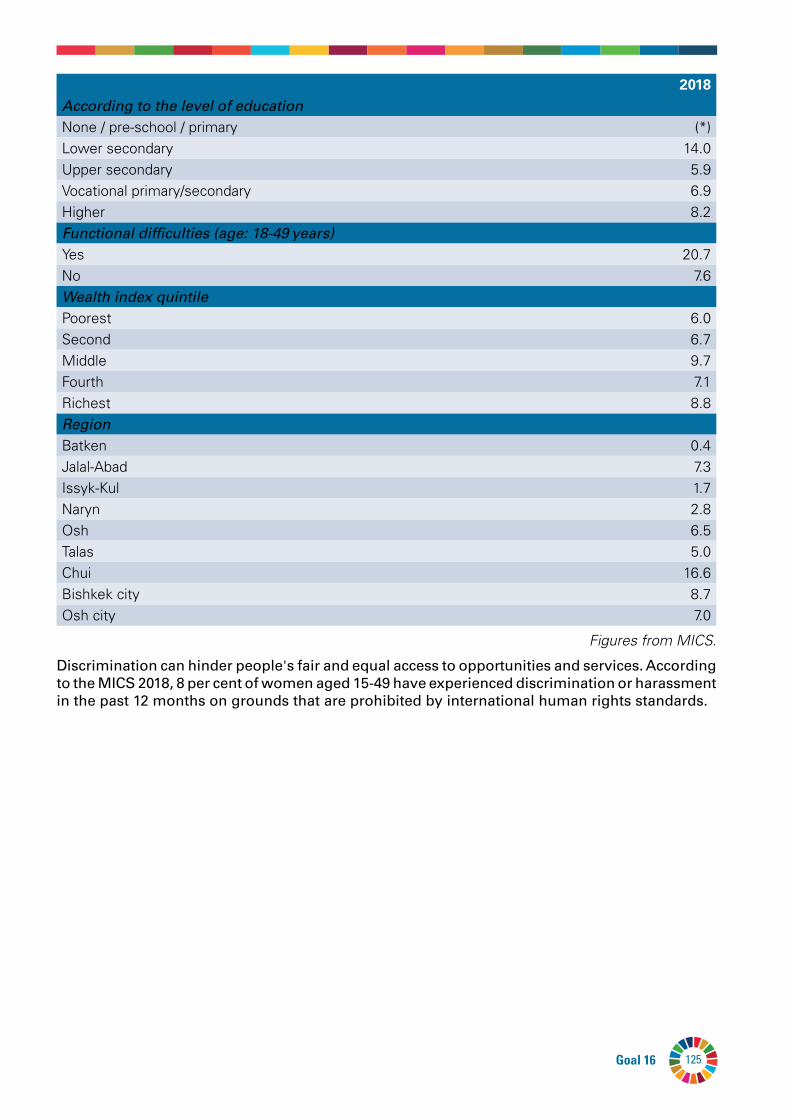
125Goal 16
2018According to the level of education None / pre-school / primary (*)Lower secondary 14.0Upper secondary 5.9Vocational primary/secondary 6.9Higher 8.2Functional difficulties (age: 18-49 years)Yes 20.7No 7.6Wealth index quintilePoorest 6.0Second 6.7Middle 9.7Fourth 7.1Richest 8.8Region Batken 0.4Jalal-Abad 7.3Issyk-Kul 1.7Naryn 2.8Osh 6.5Talas 5.0Chui 16.6Bishkek city 8.7Osh city 7.0
Figures from MICS.
Discrimination can hinder people's fair and equal access to opportunities and services. According to the MICS 2018, 8 per cent of women aged 15-49 have experienced discrimination or harassment in the past 12 months on grounds that are prohibited by international human rights standards.
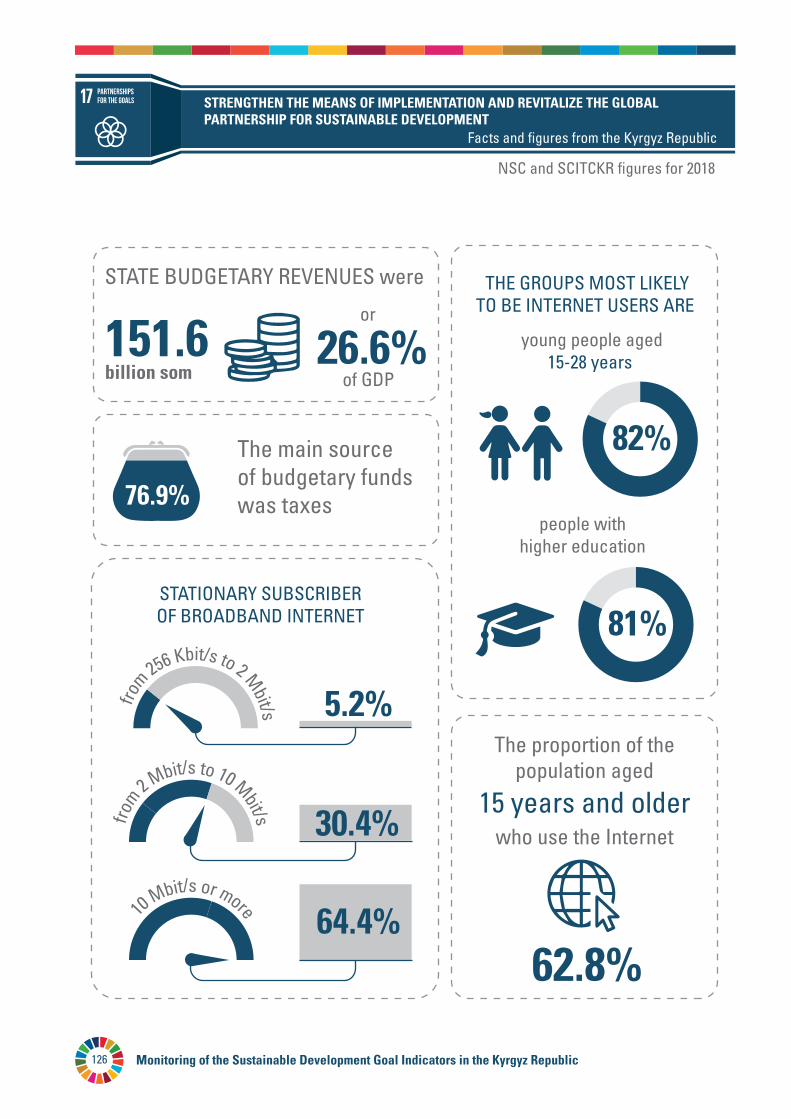
Monitoring of the Sustainable Development Goal Indicators in the Kyrgyz Republic126
62.8%
STRENGTHEN THE MEANS OF IMPLEMENTATION AND REVITALIZE THE GLOBAL PARTNERSHIP FOR SUSTAINABLE DEVELOPMENT
Facts and figures from the Kyrgyz Republic
NSC and SCITCKR figures for 2018
Partnerships for the Goals
The main source of budgetary funds was taxes
26.6%
5.2%
STATE BUDGETARY REVENUES were
151.6 billion som of GDP
or
The proportion of thepopulation aged
15 years and olderwho use the Internet
THE GROUPS MOST LIKELYTO BE INTERNET USERS ARE
STATIONARY SUBSCRIBEROF BROADBAND INTERNET
young people aged15-28 years
people withhigher education
82%
81%
76.9%
from 256 Kbit/s to 2 M
bit/s
30.4%from 2 M
bit/s to 10 Mbit/s
64.4%10 Mbit/s or more
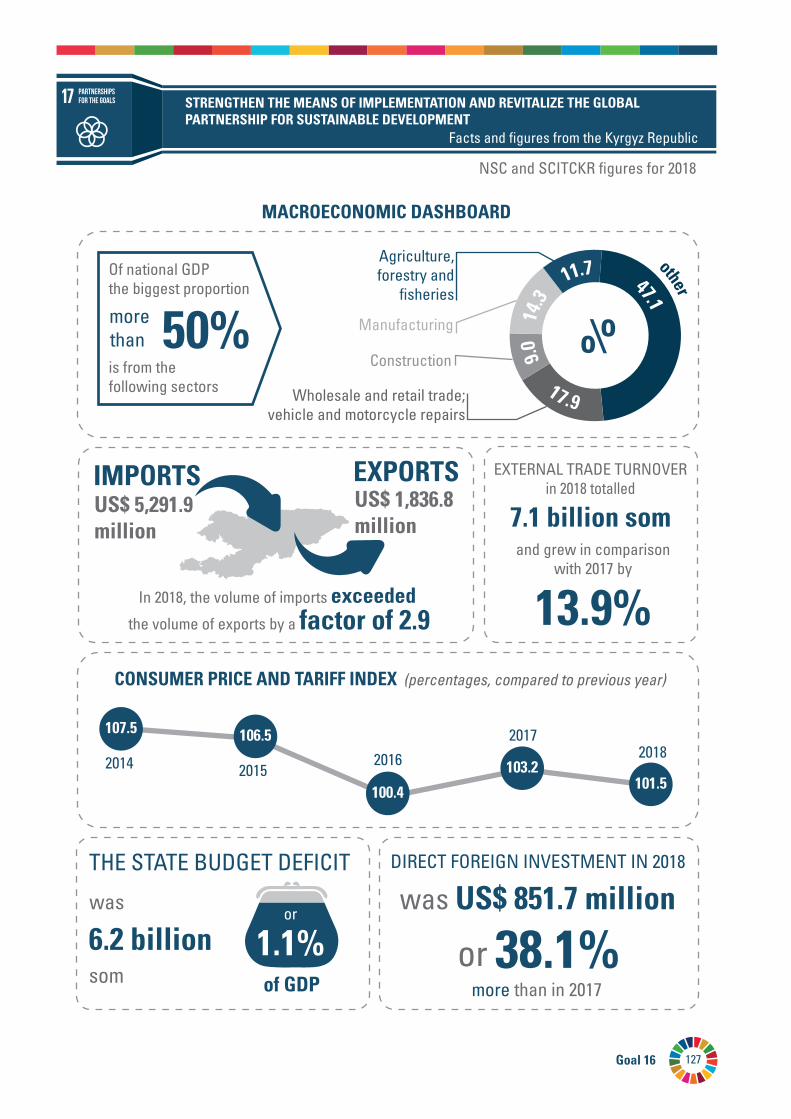
127Goal 16
MACROECONOMIC DASHBOARD
Of national GDPthe biggest proportion
50% %morethan is from thefollowing sectors
47.1
11.7
14.3
17.9
9.0
other
Agriculture,forestry and
fisheries
Manufacturing
Construction
Wholesale and retail trade;vehicle and motorcycle repairs
US$ 1,836.8million
IMPORTS EXPORTSUS$ 5,291.9 million
In 2018, the volume of imports exceeded
the volume of exports by a factor of 2.9
EXTERNAL TRADE TURNOVERin 2018 totalled
7.1 billion somand grew in comparison
with 2017 by
13.9%CONSUMER PRICE AND TARIFF INDEX (percentages, compared to previous year)
107.5
2014 20152016
20172018
106.5
100.4
103.2101.5
THE STATE BUDGET DEFICIT
was
6.2 billionsom
or
1.1%of GDP
DIRECT FOREIGN INVESTMENT IN 2018
was US$ 851.7 million
more than in 201738.1%or
STRENGTHEN THE MEANS OF IMPLEMENTATION AND REVITALIZE THE GLOBAL PARTNERSHIP FOR SUSTAINABLE DEVELOPMENT
Facts and figures from the Kyrgyz Republic
NSC and SCITCKR figures for 2018
Partnerships for the Goals
Monitoring of the Sustainable Development Goal Indicators in the Kyrgyz Republic128
GOAL17:STRENGTHENTHEMEANSOFIMPLEMENTATIONANDREVITALIZETHEGLOBALPARTNERSHIPFORSUSTAINABLEDEVELOPMENT
Successful implementation of the Sustainable Development Agenda is not possible without an inclusive partnership between governments, the private sector and civil society at the global, regional and local levels, based on principles and values, a shared vision and shared goals that serve the interests of humanity and the planet.
Targets:
Finance
17.1 Strengthen domestic resource mobilization, including through international support to developing countries, to improve domestic capacity for tax and other revenue collection.
17.2 Developed countries to implement fully their official development assistance commitments, including the commitment by many developed countries to achieve the target of 0.7 per cent of ODA/GNI to developing countries and 0.15 to 0.20 per cent of ODA/GNI to least developed countries; ODA providers are encouraged to consider setting a target to provide at least 0.20 per cent of ODA/GNI to least developed countries.
17.3 Mobilize additional financial resources for developing countries from multiple sources.
17.4 Assist developing countries in attaining long-term debt sustainability through coordinated policies aimed at fostering debt financing, debt relief and debt restructuring, as appropriate, and addressing the external debt of highly indebted poor countries to reduce debt distress.
17.5 Adopt and implement investment promotion regimes for the least developed countries.
Technology
17.6 Enhance North-South, South-South and triangular regional and international cooperation on and access to science, technology and innovation and enhance knowledge sharing on mutually agreed terms, including through improved coordination among existing mechanisms, in particular at the United Nations level, and through a global technology facilitation mechanism.
17.7 Promote the development, transfer, dissemination and diffusion of environmentally sound technologies to developing countries on favourable terms, including on concessional and preferential terms, as mutually agreed.
17.8 Fully operationalize the technology bank and science, technology and innovation capacity-building mechanism for least developed countries by 2017 and enhance the use of enabling technology, in particular information and communications technology.
Capacity-building
17.9 Enhance international support for implementing effective and targeted capacity-building in developing countries to support national plans to implement all the sustainable development goals, including through North-South, South-South and triangular cooperation.
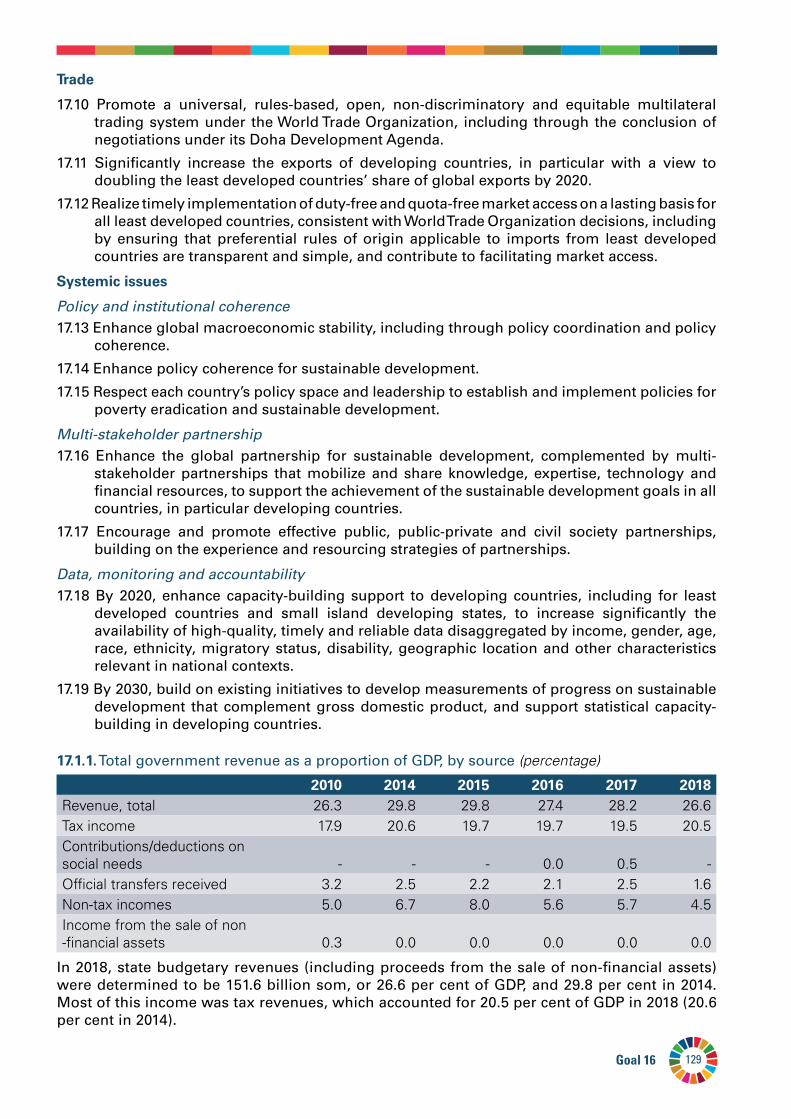
129Goal 16
Trade
17.10 Promote a universal, rules-based, open, non-discriminatory and equitable multilateral trading system under the World Trade Organization, including through the conclusion of negotiations under its Doha Development Agenda.
17.11 Significantly increase the exports of developing countries, in particular with a view to doubling the least developed countries’ share of global exports by 2020.
17.12 Realize timely implementation of duty-free and quota-free market access on a lasting basis for all least developed countries, consistent with World Trade Organization decisions, including by ensuring that preferential rules of origin applicable to imports from least developed countries are transparent and simple, and contribute to facilitating market access.
Systemicissues
Policy and institutional coherence 17.13 Enhance global macroeconomic stability, including through policy coordination and policy
coherence.17.14 Enhance policy coherence for sustainable development. 17.15 Respect each country’s policy space and leadership to establish and implement policies for
poverty eradication and sustainable development.
Multi-stakeholder partnership 17.16 Enhance the global partnership for sustainable development, complemented by multi-
stakeholder partnerships that mobilize and share knowledge, expertise, technology and financial resources, to support the achievement of the sustainable development goals in all countries, in particular developing countries.
17.17 Encourage and promote effective public, public-private and civil society partnerships, building on the experience and resourcing strategies of partnerships.
Data, monitoring and accountability17.18 By 2020, enhance capacity-building support to developing countries, including for least
developed countries and small island developing states, to increase significantly the availability of high-quality, timely and reliable data disaggregated by income, gender, age, race, ethnicity, migratory status, disability, geographic location and other characteristics relevant in national contexts.
17.19 By 2030, build on existing initiatives to develop measurements of progress on sustainable development that complement gross domestic product, and support statistical capacity-building in developing countries.
17.1.1. Total government revenue as a proportion of GDP, by source (percentage)
2010 2014 2015 2016 2017 2018Revenue, total 26.3 29.8 29.8 27.4 28.2 26.6Tax income 17.9 20.6 19.7 19.7 19.5 20.5Contributions/deductions on social needs - - - 0.0 0.5 -Official transfers received 3.2 2.5 2.2 2.1 2.5 1.6Non-tax incomes 5.0 6.7 8.0 5.6 5.7 4.5Income from the sale of non -financial assets 0.3 0.0 0.0 0.0 0.0 0.0
In 2018, state budgetary revenues (including proceeds from the sale of non-financial assets) were determined to be 151.6 billion som, or 26.6 per cent of GDP, and 29.8 per cent in 2014. Most of this income was tax revenues, which accounted for 20.5 per cent of GDP in 2018 (20.6 per cent in 2014).
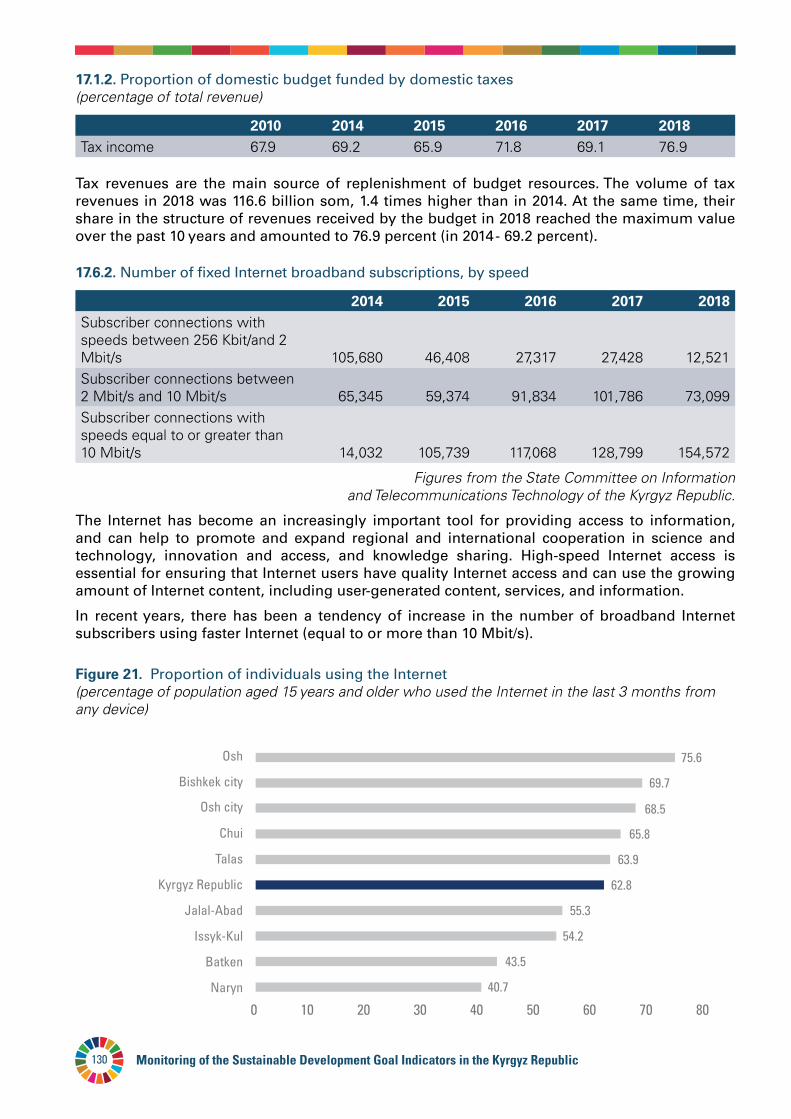
Monitoring of the Sustainable Development Goal Indicators in the Kyrgyz Republic130
17.1.2.Proportion of domestic budget funded by domestic taxes (percentage of total revenue)
2010 2014 2015 2016 2017 2018Tax income 67.9 69.2 65.9 71.8 69.1 76.9
Tax revenues are the main source of replenishment of budget resources. The volume of tax revenues in 2018 was 116.6 billion som, 1.4 times higher than in 2014. At the same time, their share in the structure of revenues received by the budget in 2018 reached the maximum value over the past 10 years and amounted to 76.9 percent (in 2014 - 69.2 percent).
17.6.2. Number of fixed Internet broadband subscriptions, by speed
2014 2015 2016 2017 2018Subscriber connections with speeds between 256 Kbit/and 2 Mbit/s 105,680 46,408 27,317 27,428 12,521 Subscriber connections between 2 Mbit/s and 10 Mbit/s 65,345 59,374 91,834 101,786 73,099 Subscriber connections with speeds equal to or greater than 10 Mbit/s 14,032 105,739 117,068 128,799 154,572
Figures from the State Committee on Information and Telecommunications Technology of the Kyrgyz Republic.
The Internet has become an increasingly important tool for providing access to information, and can help to promote and expand regional and international cooperation in science and technology, innovation and access, and knowledge sharing. High-speed Internet access is essential for ensuring that Internet users have quality Internet access and can use the growing amount of Internet content, including user-generated content, services, and information.
In recent years, there has been a tendency of increase in the number of broadband Internet subscribers using faster Internet (equal to or more than 10 Mbit/s).
Naryn 40.7
Batken 43.5
Issyk-Kul 54.2
Jalal-Abad 55.3
Kyrgyz Republic 62.8
Talas 63.9
Chui 65.8
Osh city 68.5
Bishkek city 69.7
Osh 75.6
0 10 20 30 40 50 60 70 80
Figure21. Proportion of individuals using the Internet (percentage of population aged 15 years and older who used the Internet in the last 3 months from any device)
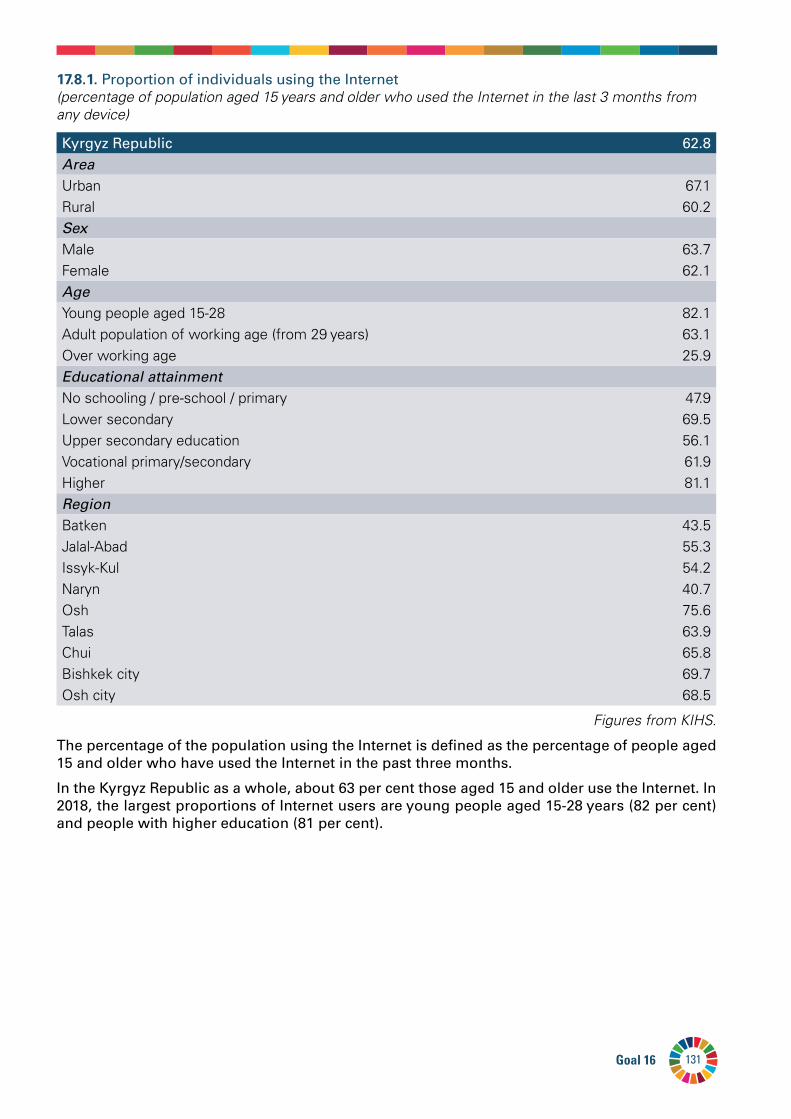
131Goal 16
17.8.1. Proportion of individuals using the Internet (percentage of population aged 15 years and older who used the Internet in the last 3 months from any device)
Kyrgyz Republic 62.8AreaUrban 67.1Rural 60.2SexMale 63.7Female 62.1Age Young people aged 15-28 82.1Adult population of working age (from 29 years) 63.1Over working age 25.9Educational attainmentNo schooling / pre-school / primary 47.9Lower secondary 69.5Upper secondary education 56.1Vocational primary/secondary 61.9Higher 81.1Region Batken 43.5Jalal-Abad 55.3Issyk-Kul 54.2Naryn 40.7Osh 75.6Talas 63.9Chui 65.8Bishkek city 69.7Osh city 68.5
Figures from KIHS.
The percentage of the population using the Internet is defined as the percentage of people aged 15 and older who have used the Internet in the past three months.
In the Kyrgyz Republic as a whole, about 63 per cent those aged 15 and older use the Internet. In 2018, the largest proportions of Internet users are young people aged 15-28 years (82 per cent) and people with higher education (81 per cent).
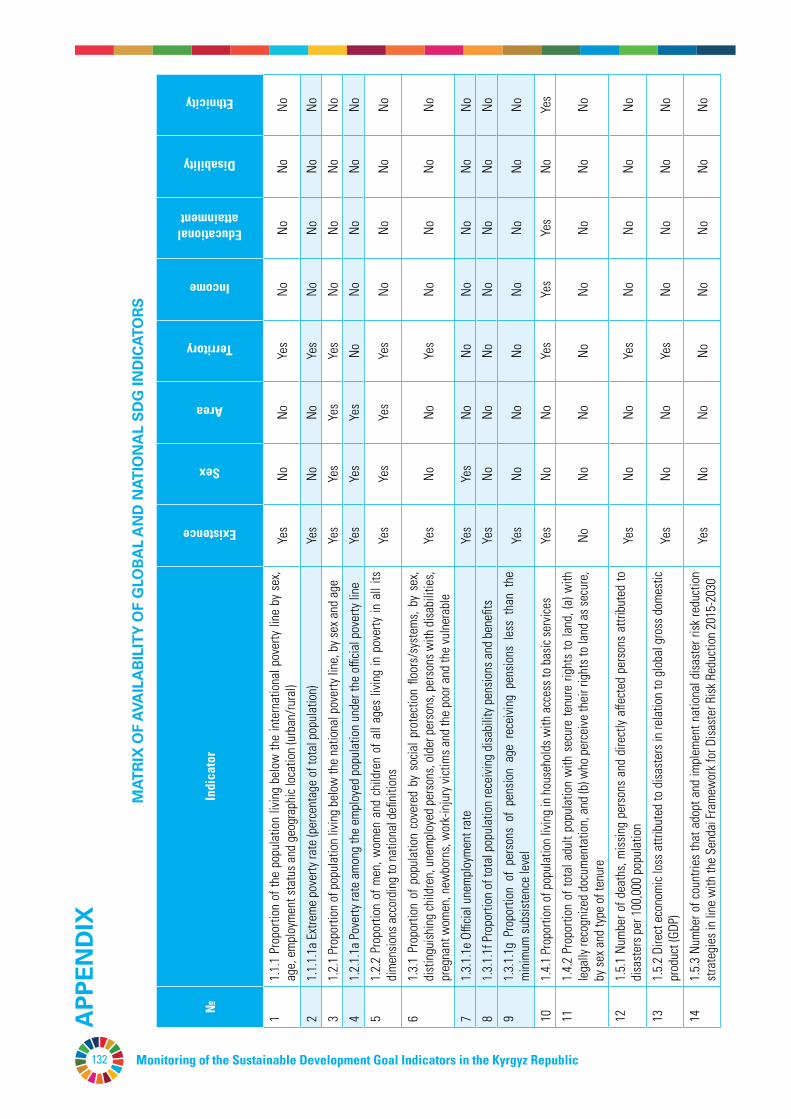
Monitoring of the Sustainable Development Goal Indicators in the Kyrgyz Republic132
APP
ENDIX
MAT
RIXOFAV
AILABILITYOFGLO
BALANDNAT
IONALSDGIN
DICAT
ORS
№In
dica
tor
Existence
Sex
Агеa
Territory
Income
Educational attainment
Disability
Ethnicity
11.
1.1
Prop
ortio
n of
the
popu
latio
n liv
ing
belo
w th
e in
tern
atio
nal p
over
ty li
ne b
y se
x, ag
e, e
mpl
oym
ent s
tatu
s and
geo
grap
hic l
ocat
ion
(urb
an/ru
ral)
Yes
NoNo
Yes
NoNo
NoNo
21.
1.1.
1а E
xtre
me
pove
rty ra
te (p
erce
ntag
e of
tota
l pop
ulat
ion)
Ye
sNo
NoYe
sNo
NoNo
No
31.
2.1
Prop
ortio
n of
pop
ulat
ion
livin
g be
low
the
natio
nal p
over
ty li
ne, b
y sex
and
age
Yes
Yes
Yes
Yes
NoNo
NoNo
41.
2.1.
1а P
over
ty ra
te a
mon
g th
e em
ploy
ed p
opul
atio
n un
der t
he o
fficia
l pov
erty
line
Yes
Yes
Yes
NoNo
NoNo
No
51.
2.2
Prop
ortio
n of
men
, wom
en a
nd c
hild
ren
of a
ll ag
es li
ving
in p
over
ty in
all
its
dim
ensio
ns a
ccor
ding
to n
atio
nal d
efini
tions
Yes
Yes
Yes
Yes
NoNo
NoNo
61.
3.1
Prop
ortio
n of
pop
ulat
ion
cove
red
by s
ocia
l pro
tect
ion
floor
s/sy
stem
s, by
sex
, di
stin
guish
ing
child
ren,
une
mpl
oyed
per
sons
, old
er p
erso
ns, p
erso
ns w
ith d
isabi
litie
s, pr
egna
nt w
omen
, new
born
s, w
ork-
inju
ry vi
ctim
s and
the
poor
and
the
vuln
erab
leYe
sNo
NoYe
sNo
NoNo
No
71.
3.1.
1е O
fficia
l une
mpl
oym
ent r
ate
Yes
Yes
NoNo
NoNo
NoNo
81.
3.1.
1f P
ropo
rtion
of t
otal
pop
ulat
ion
rece
iving
disa
bilit
y pen
sions
and
ben
efits
Yes
NoNo
NoNo
NoNo
No
91.
3.1.
1g P
ropo
rtion
of
pers
ons
of p
ensio
n ag
e re
ceivi
ng p
ensio
ns l
ess
than
the
m
inim
um su
bsist
ence
leve
lYe
sNo
NoNo
NoNo
NoNo
101.
4.1
Prop
ortio
n of
pop
ulat
ion
livin
g in
hou
seho
lds w
ith a
cces
s to
basic
serv
ices
Yes
NoNo
Yes
Yes
Yes
NoYe
s
111.
4.2
Prop
ortio
n of
tota
l adu
lt po
pula
tion
with
sec
ure
tenu
re ri
ghts
to la
nd, (
a) w
ith
lega
lly re
cogn
ized
docu
men
tatio
n, a
nd (b
) who
per
ceive
thei
r rig
hts t
o la
nd a
s sec
ure,
by
sex a
nd ty
pe o
f ten
ure
NoNo
NoNo
NoNo
NoNo
121.
5.1
Num
ber o
f dea
ths,
miss
ing
pers
ons
and
dire
ctly
affec
ted
pers
ons
attri
bute
d to
di
sast
ers p
er 1
00,0
00 p
opul
atio
nYe
sNo
NoYe
sNo
NoNo
No
131.
5.2
Dire
ct e
cono
mic
loss
attr
ibut
ed to
disa
ster
s in
rela
tion
to g
loba
l gro
ss d
omes
tic
prod
uct (
GDP)
Yes
NoNo
Yes
NoNo
NoNo
141.
5.3
Num
ber o
f cou
ntrie
s th
at a
dopt
and
impl
emen
t nat
iona
l disa
ster
risk
redu
ctio
n st
rate
gies
in li
ne w
ith th
e Se
ndai
Fram
ewor
k for
Disa
ster
Risk
Red
uctio
n 20
15-2
030
Yes
NoNo
NoNo
NoNo
No
151.
5.4
Prop
ortio
n of
loca
l gov
ernm
ents
that
ado
pt a
nd im
plem
ent l
ocal
disa
ster
risk
re
duct
ion
stra
tegi
es in
line
with
nat
iona
l disa
ster
risk
redu
ctio
n st
rate
gies
NoNo
NoNo
NoNo
NoNo
161.
a.1
Pro
porti
on o
f dom
estic
ally
gene
rate
d re
sour
ces
allo
cate
d by
the
gove
rnm
ent
dire
ctly
to p
over
ty re
duct
ion
prog
ram
mes
NoNo
NoNo
NoNo
NoNo
171.
a.2
Prop
ortio
n of
tota
l gov
ernm
ent s
pend
ing
on e
ssen
tial s
ervic
es (e
duca
tion,
hea
lth
and
socia
l pro
tect
ion)
Yes
NoNo
NoNo
NoNo
No
181.
b.1
Prop
ortio
n of
gov
ernm
ent
recu
rrent
and
cap
ital
spen
ding
to
sect
ors
that
di
spro
porti
onat
ely b
enefi
t wom
en, t
he p
oor a
nd vu
lner
able
gro
ups
no,
repl
aced
by
na
tiona
l
1.b.
1.1
NoNo
NoNo
NoNo
No
191.
b.1.
1 Pr
opor
tions
of c
urre
nt g
over
nmen
t spe
ndin
g by
sect
ors
Yes
NoNo
NoNo
NoNo
No
202.
1.1
Prev
alen
ce o
f und
erno
urish
men
tYe
sYe
sYe
sYe
sNo
NoNo
No
212.
1.1.
1е A
vera
ge p
er c
apita
con
sum
ptio
n of
bas
ic fo
odst
uffs
in re
latio
n to
ave
rage
ph
ysio
logi
cal c
onsu
mpt
ion
stan
dard
s Ye
sNo
NoYe
sNo
NoNo
No
222.
1.2
Prev
alen
ce o
f mod
erat
e or
seve
re fo
od in
secu
rity i
n th
e po
pula
tion,
bas
ed o
n th
e Fo
od In
secu
rity E
xper
ienc
e Sc
ale
(FIES
)No
NoNo
NoNo
NoNo
No
232.
2.1
Prev
alen
ce o
f stu
ntin
g (h
eigh
t for
age
<-2
stan
dard
dev
iatio
n fro
m th
e m
edia
n of
th
e W
orld
Hea
lth O
rgan
izatio
n (W
HO) C
hild
Gro
wth
Sta
ndar
ds) a
mon
g ch
ildre
n un
der
5 ye
ars o
f age
Yes
Yes
Yes
Yes
Yes
Yes
NoYe
s
242.
2.2
Prev
alen
ce o
f mal
nutri
tion
(wei
ght f
or h
eigh
t >+2
or <
-2 st
anda
rd d
evia
tion
from
th
e m
edia
n of
the
WHO
Chi
ld G
row
th S
tand
ards
) am
ong
child
ren
unde
r 5 ye
ars o
f age
, by
type
(was
ting
and
over
wei
ght)
Yes
Yes
Yes
Yes
Yes
Yes
NoYe
s
252.
3.1
Volu
me
of p
rodu
ctio
n pe
r la
bour
uni
t by
cla
sses
of
farm
ing/
past
oral
/fore
stry
en
terp
rise
size
NoNo
NoNo
NoNo
NoNo
262.
3.2
Aver
age
inco
me
of sm
all-s
cale
food
pro
duce
rs, b
y sex
and
indi
geno
us st
atus
NoNo
NoNo
NoNo
NoNo
272.
4.1
Prop
ortio
n of
agr
icultu
ral a
rea
unde
r pro
duct
ive a
nd su
stai
nabl
e ag
ricul
ture
NoNo
NoNo
NoNo
NoNo
282.
5.1
Num
ber o
f pla
nt a
nd a
nim
al g
enet
ic re
sour
ces
for f
ood
and
agric
ultu
re s
ecur
ed
in e
ither
med
ium
or l
ong-
term
cons
erva
tion
facil
ities
NoNo
NoNo
NoNo
NoNo
292.
5.2
Prop
ortio
n of
loca
l bre
eds
class
ified
as
bein
g at
risk
, not
-at-r
isk o
r at u
nkno
wn
leve
l of r
isk o
f ext
inct
ion
NoNo
NoNo
NoNo
NoNo
302.
a.1
The
agric
ultu
re o
rient
atio
n in
dex f
or g
over
nmen
t exp
endi
ture
sYe
sNo
NoNo
NoNo
NoNo
312.
a.2
Tota
l offi
cial fl
ows
(offi
cial d
evel
opm
ent a
ssist
ance
plu
s ot
her o
fficia
l flow
s) to
th
e ag
ricul
ture
sect
orNo
NoNo
NoNo
NoNo
No
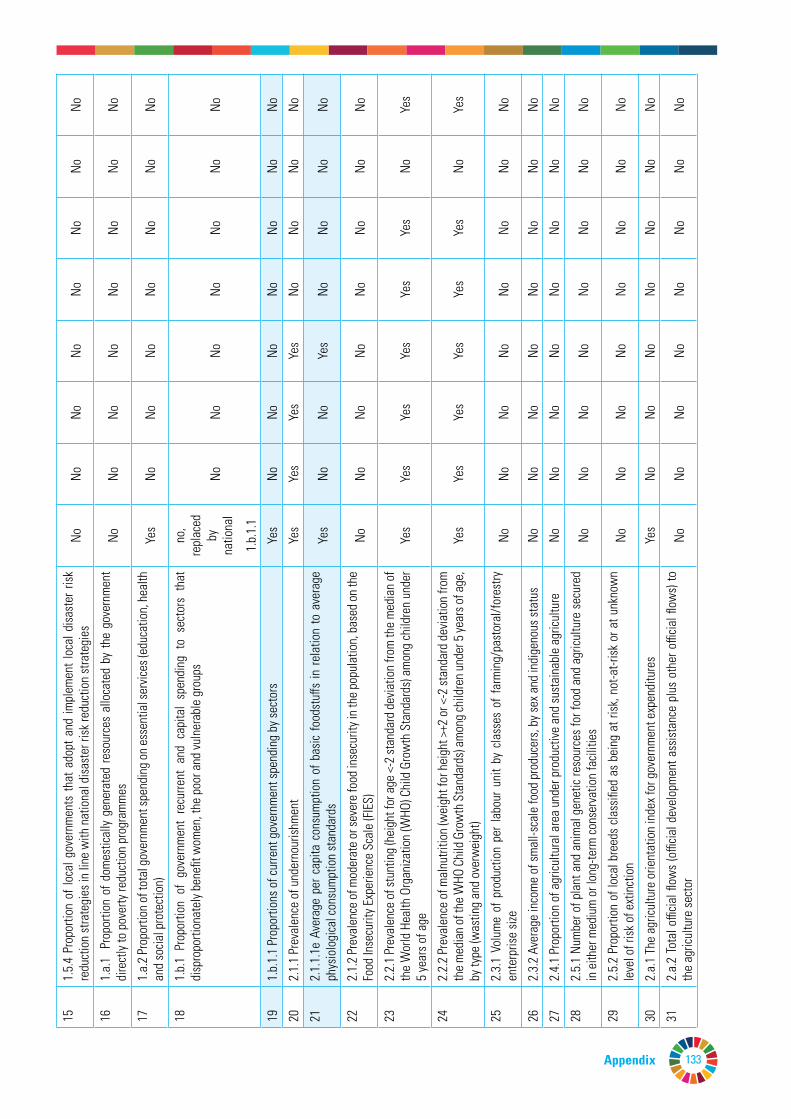
133Appendix
APP
ENDIX
MAT
RIXOFAV
AILABILITYOFGLO
BALANDNAT
IONALSDGIN
DICAT
ORS
№In
dica
tor
Existence
Sex
Агеa
Territory
Income
Educational attainment
Disability
Ethnicity
11.
1.1
Prop
ortio
n of
the
popu
latio
n liv
ing
belo
w th
e in
tern
atio
nal p
over
ty li
ne b
y se
x, ag
e, e
mpl
oym
ent s
tatu
s and
geo
grap
hic l
ocat
ion
(urb
an/ru
ral)
Yes
NoNo
Yes
NoNo
NoNo
21.
1.1.
1а E
xtre
me
pove
rty ra
te (p
erce
ntag
e of
tota
l pop
ulat
ion)
Ye
sNo
NoYe
sNo
NoNo
No
31.
2.1
Prop
ortio
n of
pop
ulat
ion
livin
g be
low
the
natio
nal p
over
ty li
ne, b
y sex
and
age
Yes
Yes
Yes
Yes
NoNo
NoNo
41.
2.1.
1а P
over
ty ra
te a
mon
g th
e em
ploy
ed p
opul
atio
n un
der t
he o
fficia
l pov
erty
line
Yes
Yes
Yes
NoNo
NoNo
No
51.
2.2
Prop
ortio
n of
men
, wom
en a
nd c
hild
ren
of a
ll ag
es li
ving
in p
over
ty in
all
its
dim
ensio
ns a
ccor
ding
to n
atio
nal d
efini
tions
Yes
Yes
Yes
Yes
NoNo
NoNo
61.
3.1
Prop
ortio
n of
pop
ulat
ion
cove
red
by s
ocia
l pro
tect
ion
floor
s/sy
stem
s, by
sex
, di
stin
guish
ing
child
ren,
une
mpl
oyed
per
sons
, old
er p
erso
ns, p
erso
ns w
ith d
isabi
litie
s, pr
egna
nt w
omen
, new
born
s, w
ork-
inju
ry vi
ctim
s and
the
poor
and
the
vuln
erab
leYe
sNo
NoYe
sNo
NoNo
No
71.
3.1.
1е O
fficia
l une
mpl
oym
ent r
ate
Yes
Yes
NoNo
NoNo
NoNo
81.
3.1.
1f P
ropo
rtion
of t
otal
pop
ulat
ion
rece
iving
disa
bilit
y pen
sions
and
ben
efits
Yes
NoNo
NoNo
NoNo
No
91.
3.1.
1g P
ropo
rtion
of
pers
ons
of p
ensio
n ag
e re
ceivi
ng p
ensio
ns l
ess
than
the
m
inim
um su
bsist
ence
leve
lYe
sNo
NoNo
NoNo
NoNo
101.
4.1
Prop
ortio
n of
pop
ulat
ion
livin
g in
hou
seho
lds w
ith a
cces
s to
basic
serv
ices
Yes
NoNo
Yes
Yes
Yes
NoYe
s
111.
4.2
Prop
ortio
n of
tota
l adu
lt po
pula
tion
with
sec
ure
tenu
re ri
ghts
to la
nd, (
a) w
ith
lega
lly re
cogn
ized
docu
men
tatio
n, a
nd (b
) who
per
ceive
thei
r rig
hts t
o la
nd a
s sec
ure,
by
sex a
nd ty
pe o
f ten
ure
NoNo
NoNo
NoNo
NoNo
121.
5.1
Num
ber o
f dea
ths,
miss
ing
pers
ons
and
dire
ctly
affec
ted
pers
ons
attri
bute
d to
di
sast
ers p
er 1
00,0
00 p
opul
atio
nYe
sNo
NoYe
sNo
NoNo
No
131.
5.2
Dire
ct e
cono
mic
loss
attr
ibut
ed to
disa
ster
s in
rela
tion
to g
loba
l gro
ss d
omes
tic
prod
uct (
GDP)
Yes
NoNo
Yes
NoNo
NoNo
141.
5.3
Num
ber o
f cou
ntrie
s th
at a
dopt
and
impl
emen
t nat
iona
l disa
ster
risk
redu
ctio
n st
rate
gies
in li
ne w
ith th
e Se
ndai
Fram
ewor
k for
Disa
ster
Risk
Red
uctio
n 20
15-2
030
Yes
NoNo
NoNo
NoNo
No
151.
5.4
Prop
ortio
n of
loca
l gov
ernm
ents
that
ado
pt a
nd im
plem
ent l
ocal
disa
ster
risk
re
duct
ion
stra
tegi
es in
line
with
nat
iona
l disa
ster
risk
redu
ctio
n st
rate
gies
NoNo
NoNo
NoNo
NoNo
161.
a.1
Pro
porti
on o
f dom
estic
ally
gene
rate
d re
sour
ces
allo
cate
d by
the
gove
rnm
ent
dire
ctly
to p
over
ty re
duct
ion
prog
ram
mes
NoNo
NoNo
NoNo
NoNo
171.
a.2
Prop
ortio
n of
tota
l gov
ernm
ent s
pend
ing
on e
ssen
tial s
ervic
es (e
duca
tion,
hea
lth
and
socia
l pro
tect
ion)
Yes
NoNo
NoNo
NoNo
No
181.
b.1
Prop
ortio
n of
gov
ernm
ent
recu
rrent
and
cap
ital
spen
ding
to
sect
ors
that
di
spro
porti
onat
ely b
enefi
t wom
en, t
he p
oor a
nd vu
lner
able
gro
ups
no,
repl
aced
by
na
tiona
l
1.b.
1.1
NoNo
NoNo
NoNo
No
191.
b.1.
1 Pr
opor
tions
of c
urre
nt g
over
nmen
t spe
ndin
g by
sect
ors
Yes
NoNo
NoNo
NoNo
No
202.
1.1
Prev
alen
ce o
f und
erno
urish
men
tYe
sYe
sYe
sYe
sNo
NoNo
No
212.
1.1.
1е A
vera
ge p
er c
apita
con
sum
ptio
n of
bas
ic fo
odst
uffs
in re
latio
n to
ave
rage
ph
ysio
logi
cal c
onsu
mpt
ion
stan
dard
s Ye
sNo
NoYe
sNo
NoNo
No
222.
1.2
Prev
alen
ce o
f mod
erat
e or
seve
re fo
od in
secu
rity i
n th
e po
pula
tion,
bas
ed o
n th
e Fo
od In
secu
rity E
xper
ienc
e Sc
ale
(FIES
)No
NoNo
NoNo
NoNo
No
232.
2.1
Prev
alen
ce o
f stu
ntin
g (h
eigh
t for
age
<-2
stan
dard
dev
iatio
n fro
m th
e m
edia
n of
th
e W
orld
Hea
lth O
rgan
izatio
n (W
HO) C
hild
Gro
wth
Sta
ndar
ds) a
mon
g ch
ildre
n un
der
5 ye
ars o
f age
Yes
Yes
Yes
Yes
Yes
Yes
NoYe
s
242.
2.2
Prev
alen
ce o
f mal
nutri
tion
(wei
ght f
or h
eigh
t >+2
or <
-2 st
anda
rd d
evia
tion
from
th
e m
edia
n of
the
WHO
Chi
ld G
row
th S
tand
ards
) am
ong
child
ren
unde
r 5 ye
ars o
f age
, by
type
(was
ting
and
over
wei
ght)
Yes
Yes
Yes
Yes
Yes
Yes
NoYe
s
252.
3.1
Volu
me
of p
rodu
ctio
n pe
r la
bour
uni
t by
cla
sses
of
farm
ing/
past
oral
/fore
stry
en
terp
rise
size
NoNo
NoNo
NoNo
NoNo
262.
3.2
Aver
age
inco
me
of sm
all-s
cale
food
pro
duce
rs, b
y sex
and
indi
geno
us st
atus
NoNo
NoNo
NoNo
NoNo
272.
4.1
Prop
ortio
n of
agr
icultu
ral a
rea
unde
r pro
duct
ive a
nd su
stai
nabl
e ag
ricul
ture
NoNo
NoNo
NoNo
NoNo
282.
5.1
Num
ber o
f pla
nt a
nd a
nim
al g
enet
ic re
sour
ces
for f
ood
and
agric
ultu
re s
ecur
ed
in e
ither
med
ium
or l
ong-
term
cons
erva
tion
facil
ities
NoNo
NoNo
NoNo
NoNo
292.
5.2
Prop
ortio
n of
loca
l bre
eds
class
ified
as
bein
g at
risk
, not
-at-r
isk o
r at u
nkno
wn
leve
l of r
isk o
f ext
inct
ion
NoNo
NoNo
NoNo
NoNo
302.
a.1
The
agric
ultu
re o
rient
atio
n in
dex f
or g
over
nmen
t exp
endi
ture
sYe
sNo
NoNo
NoNo
NoNo
312.
a.2
Tota
l offi
cial fl
ows
(offi
cial d
evel
opm
ent a
ssist
ance
plu
s ot
her o
fficia
l flow
s) to
th
e ag
ricul
ture
sect
orNo
NoNo
NoNo
NoNo
No
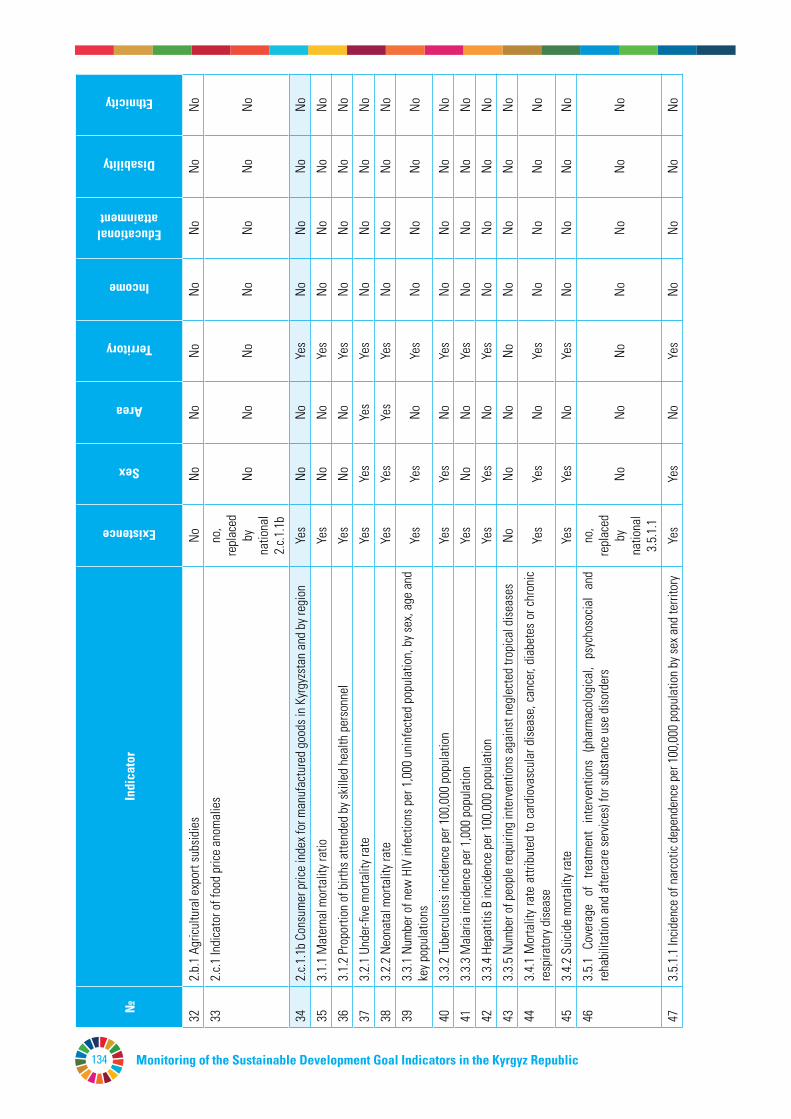
Monitoring of the Sustainable Development Goal Indicators in the Kyrgyz Republic134
№In
dica
tor
Existence
Sex
Агеa
Territory
Income
Educational attainment
Disability
Ethnicity
322.
b.1
Agric
ultu
ral e
xpor
t sub
sidie
sNo
NoNo
NoNo
NoNo
No
332.
c.1 In
dica
tor o
f foo
d pr
ice a
nom
alie
sno
, re
plac
ed
by
natio
nal
2.c.1
.1b
NoNo
NoNo
NoNo
No
342.
c.1.1
b Co
nsum
er p
rice
inde
x for
man
ufac
ture
d go
ods i
n Ky
rgyz
stan
and
by r
egio
nYe
sNo
NoYe
sNo
NoNo
No
353.
1.1
Mat
erna
l mor
talit
y rat
ioYe
sNo
NoYe
sNo
NoNo
No
363.
1.2
Prop
ortio
n of
birt
hs a
ttend
ed b
y skil
led
heal
th p
erso
nnel
Yes
NoNo
Yes
NoNo
NoNo
373.
2.1
Unde
r-five
mor
talit
y rat
eYe
sYe
sYe
sYe
sNo
NoNo
No
383.
2.2
Neon
atal
mor
talit
y rat
eYe
sYe
sYe
sYe
sNo
NoNo
No
393.
3.1
Num
ber o
f new
HIV
infe
ctio
ns p
er 1
,000
uni
nfec
ted
popu
latio
n, b
y sex
, age
and
ke
y pop
ulat
ions
Yes
Yes
NoYe
sNo
NoNo
No
403.
3.2
Tube
rcul
osis
incid
ence
per
100
,000
pop
ulat
ion
Yes
Yes
NoYe
sNo
NoNo
No
413.
3.3
Mal
aria
incid
ence
per
1,0
00 p
opul
atio
nYe
sNo
NoYe
sNo
NoNo
No
423.
3.4
Hepa
titis
B in
ciden
ce p
er 1
00,0
00 p
opul
atio
nYe
sYe
sNo
Yes
NoNo
NoNo
433.
3.5
Num
ber o
f peo
ple
requ
iring
inte
rven
tions
aga
inst
neg
lect
ed tr
opica
l dise
ases
NoNo
NoNo
NoNo
NoNo
443.
4.1
Mor
talit
y ra
te a
ttrib
uted
to c
ardi
ovas
cula
r dise
ase,
can
cer,
diab
etes
or c
hron
ic re
spira
tory
dise
ase
Yes
Yes
NoYe
sNo
NoNo
No
453.
4.2
Suici
de m
orta
lity r
ate
Yes
Yes
NoYe
sNo
NoNo
No
463.
5.1
Cove
rage
of
treat
men
t in
terv
entio
ns (
phar
mac
olog
ical,
psyc
hoso
cial
and
reha
bilit
atio
n an
d af
terc
are
serv
ices)
for s
ubst
ance
use
diso
rder
sno
, re
plac
ed
by
natio
nal
3.5.
1.1
NoNo
NoNo
NoNo
No
473.
5.1.
1 In
ciden
ce o
f nar
cotic
dep
ende
nce
per 1
00,0
00 p
opul
atio
n by
sex a
nd te
rrito
ryYe
sYe
sNo
Yes
NoNo
NoNo
483.
5.2
Harm
ful u
se o
f alco
hol,
defin
ed a
ccor
ding
to th
e na
tiona
l con
text
as a
lcoho
l per
ca
pita
con
sum
ptio
n (a
ged
15 y
ears
and
old
er) w
ithin
a c
alen
dar y
ear i
n lit
res
of p
ure
alco
hol
no,
repl
aced
by
na
tiona
l 3.
5.1.
2
NoNo
NoNo
NoNo
No
493.
5.2.
1 In
ciden
ce o
f alco
hol d
epen
denc
e pe
r 100
,000
pop
ulat
ion
by se
x and
terri
tory
Yes
Yes
NoYe
sNo
NoNo
No
503.
6.1
Deat
h ra
te d
ue to
road
traffi
c inj
urie
sYe
sYe
sNo
Yes
NoNo
NoNo
513.
7.1
Prop
ortio
n of
wom
en o
f rep
rodu
ctive
age
(age
d 15
-49
year
s) w
ho h
ave
thei
r nee
d fo
r fam
ily p
lann
ing
satis
fied
with
mod
ern
met
hods
Yes
NoYe
sYe
sYe
sYe
sYe
sYe
s
523.
7.2
Ado
lesc
ent b
irth
rate
(age
d 10
-14
year
s; ag
ed 1
5-19
year
s) pe
r 1,0
00 w
omen
in
that
age
gro
upYe
sNo
Yes
Yes
NoNo
NoNo
533.
8.1
Cov
erag
e of
ess
entia
l hea
lth s
ervic
es (d
efine
d as
the
ave
rage
cov
erag
e of
es
sent
ial s
ervic
es b
ased
on
trace
r int
erve
ntio
ns th
at in
clude
repr
oduc
tive,
mat
erna
l, ne
wbo
rn an
d chi
ld he
alth
, infe
ctio
us di
seas
es, n
on-c
omm
unica
ble d
iseas
es an
d ser
vice
capa
city a
nd a
cces
s, am
ong
the
gene
ral a
nd th
e m
ost d
isadv
anta
ged
popu
latio
n)
NoNo
NoNo
NoNo
NoNo
543.
8.2
Prop
ortio
n of
pop
ulat
ion
with
larg
e ho
useh
old
expe
nditu
res o
n he
alth
as a
shar
e of
tota
l hou
seho
ld e
xpen
ditu
re o
r inc
ome
NoNo
NoNo
NoNo
NoNo
553.
9.1
Mor
talit
y rat
e at
tribu
ted
to h
ouse
hold
and
am
bien
t air
pollu
tion
no,
repl
aced
by
na
tiona
l 3.
9.1.
1
NoNo
NoNo
NoNo
No
563.
9.1.
1 M
orta
lity f
rom
toxic
effe
cts o
f car
bon
mon
oxid
e pe
r 100
,000
pop
ulat
ion
Yes
Yes
NoYe
sNo
NoNo
No
573.
9.2
Mor
talit
y ra
te a
ttrib
uted
to u
nsaf
e w
ater
, uns
afe
sani
tatio
n an
d la
ck o
f hyg
iene
(e
xpos
ure
to u
nsaf
e W
ater
, San
itatio
n an
d Hy
gien
e fo
r All
(WAS
H) se
rvice
s)Ye
sYe
sNo
Yes
NoNo
NoNo
583.
9.3
Mor
talit
y rat
e at
tribu
ted
to u
nint
entio
nal p
oiso
ning
Yes
Yes
NoYe
sNo
NoNo
No
593.
a.1
Age-
stan
dard
ized
prev
alen
ce o
f cur
rent
toba
cco
use
amon
g pe
rson
s ag
ed 1
5 ye
ars a
nd o
lder
NoNo
NoNo
NoNo
NoNo
603.
b.1
Prop
ortio
n of
the
tar
get
popu
latio
n co
vere
d by
all
vacc
ines
inclu
ded
in t
heir
natio
nal p
rogr
amm
eYe
sNo
NoYe
sNo
NoNo
No
613.
b.2
Tota
l net
offi
cial d
evel
opm
ent a
ssist
ance
to m
edica
l res
earc
h an
d ba
sic h
ealth
se
ctor
sNo
NoNo
NoNo
NoNo
No
623.
b.3 P
ropo
rtion
of he
alth
facil
ities
that
have
a co
re se
t of r
elev
ant e
ssen
tial m
edici
nes
avai
labl
e an
d aff
orda
ble
on a
sust
aina
ble
basis
Yes
Yes
NoYe
sNo
NoNo
No
633.
c.1 H
ealth
wor
ker d
ensit
y and
dist
ribut
ion
NoNo
NoNo
NoNo
NoNo
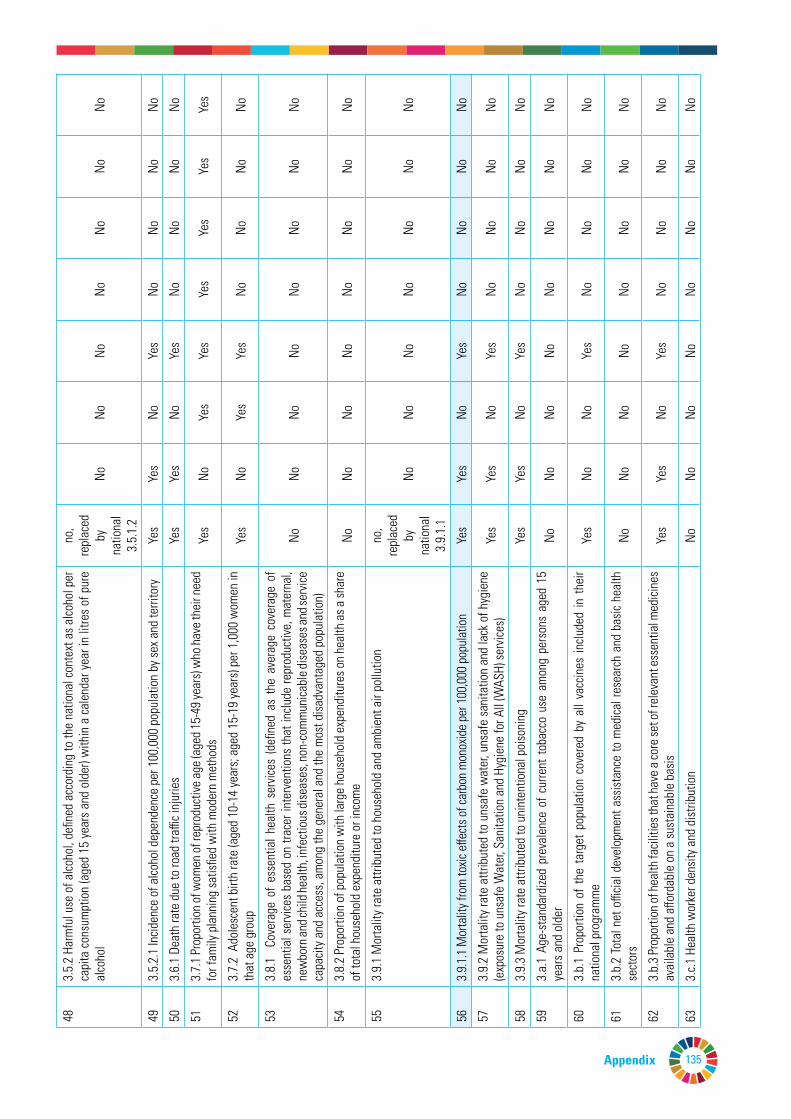
135
№In
dica
tor
Existence
Sex
Агеa
Territory
Income
Educational attainment
Disability
Ethnicity
322.
b.1
Agric
ultu
ral e
xpor
t sub
sidie
sNo
NoNo
NoNo
NoNo
No
332.
c.1 In
dica
tor o
f foo
d pr
ice a
nom
alie
sno
, re
plac
ed
by
natio
nal
2.c.1
.1b
NoNo
NoNo
NoNo
No
342.
c.1.1
b Co
nsum
er p
rice
inde
x for
man
ufac
ture
d go
ods i
n Ky
rgyz
stan
and
by r
egio
nYe
sNo
NoYe
sNo
NoNo
No
353.
1.1
Mat
erna
l mor
talit
y rat
ioYe
sNo
NoYe
sNo
NoNo
No
363.
1.2
Prop
ortio
n of
birt
hs a
ttend
ed b
y skil
led
heal
th p
erso
nnel
Yes
NoNo
Yes
NoNo
NoNo
373.
2.1
Unde
r-five
mor
talit
y rat
eYe
sYe
sYe
sYe
sNo
NoNo
No
383.
2.2
Neon
atal
mor
talit
y rat
eYe
sYe
sYe
sYe
sNo
NoNo
No
393.
3.1
Num
ber o
f new
HIV
infe
ctio
ns p
er 1
,000
uni
nfec
ted
popu
latio
n, b
y sex
, age
and
ke
y pop
ulat
ions
Yes
Yes
NoYe
sNo
NoNo
No
403.
3.2
Tube
rcul
osis
incid
ence
per
100
,000
pop
ulat
ion
Yes
Yes
NoYe
sNo
NoNo
No
413.
3.3
Mal
aria
incid
ence
per
1,0
00 p
opul
atio
nYe
sNo
NoYe
sNo
NoNo
No
423.
3.4
Hepa
titis
B in
ciden
ce p
er 1
00,0
00 p
opul
atio
nYe
sYe
sNo
Yes
NoNo
NoNo
433.
3.5
Num
ber o
f peo
ple
requ
iring
inte
rven
tions
aga
inst
neg
lect
ed tr
opica
l dise
ases
NoNo
NoNo
NoNo
NoNo
443.
4.1
Mor
talit
y ra
te a
ttrib
uted
to c
ardi
ovas
cula
r dise
ase,
can
cer,
diab
etes
or c
hron
ic re
spira
tory
dise
ase
Yes
Yes
NoYe
sNo
NoNo
No
453.
4.2
Suici
de m
orta
lity r
ate
Yes
Yes
NoYe
sNo
NoNo
No
463.
5.1
Cove
rage
of
treat
men
t in
terv
entio
ns (
phar
mac
olog
ical,
psyc
hoso
cial
and
reha
bilit
atio
n an
d af
terc
are
serv
ices)
for s
ubst
ance
use
diso
rder
sno
, re
plac
ed
by
natio
nal
3.5.
1.1
NoNo
NoNo
NoNo
No
473.
5.1.
1 In
ciden
ce o
f nar
cotic
dep
ende
nce
per 1
00,0
00 p
opul
atio
n by
sex a
nd te
rrito
ryYe
sYe
sNo
Yes
NoNo
NoNo
483.
5.2
Harm
ful u
se o
f alco
hol,
defin
ed a
ccor
ding
to th
e na
tiona
l con
text
as a
lcoho
l per
ca
pita
con
sum
ptio
n (a
ged
15 y
ears
and
old
er) w
ithin
a c
alen
dar y
ear i
n lit
res
of p
ure
alco
hol
no,
repl
aced
by
na
tiona
l 3.
5.1.
2
NoNo
NoNo
NoNo
No
493.
5.2.
1 In
ciden
ce o
f alco
hol d
epen
denc
e pe
r 100
,000
pop
ulat
ion
by se
x and
terri
tory
Yes
Yes
NoYe
sNo
NoNo
No
503.
6.1
Deat
h ra
te d
ue to
road
traffi
c inj
urie
sYe
sYe
sNo
Yes
NoNo
NoNo
513.
7.1
Prop
ortio
n of
wom
en o
f rep
rodu
ctive
age
(age
d 15
-49
year
s) w
ho h
ave
thei
r nee
d fo
r fam
ily p
lann
ing
satis
fied
with
mod
ern
met
hods
Yes
NoYe
sYe
sYe
sYe
sYe
sYe
s
523.
7.2
Ado
lesc
ent b
irth
rate
(age
d 10
-14
year
s; ag
ed 1
5-19
year
s) pe
r 1,0
00 w
omen
in
that
age
gro
upYe
sNo
Yes
Yes
NoNo
NoNo
533.
8.1
Cov
erag
e of
ess
entia
l hea
lth s
ervic
es (d
efine
d as
the
ave
rage
cov
erag
e of
es
sent
ial s
ervic
es b
ased
on
trace
r int
erve
ntio
ns th
at in
clude
repr
oduc
tive,
mat
erna
l, ne
wbo
rn an
d chi
ld he
alth
, infe
ctio
us di
seas
es, n
on-c
omm
unica
ble d
iseas
es an
d ser
vice
capa
city a
nd a
cces
s, am
ong
the
gene
ral a
nd th
e m
ost d
isadv
anta
ged
popu
latio
n)
NoNo
NoNo
NoNo
NoNo
543.
8.2
Prop
ortio
n of
pop
ulat
ion
with
larg
e ho
useh
old
expe
nditu
res o
n he
alth
as a
shar
e of
tota
l hou
seho
ld e
xpen
ditu
re o
r inc
ome
NoNo
NoNo
NoNo
NoNo
553.
9.1
Mor
talit
y rat
e at
tribu
ted
to h
ouse
hold
and
am
bien
t air
pollu
tion
no,
repl
aced
by
na
tiona
l 3.
9.1.
1
NoNo
NoNo
NoNo
No
563.
9.1.
1 M
orta
lity f
rom
toxic
effe
cts o
f car
bon
mon
oxid
e pe
r 100
,000
pop
ulat
ion
Yes
Yes
NoYe
sNo
NoNo
No
573.
9.2
Mor
talit
y ra
te a
ttrib
uted
to u
nsaf
e w
ater
, uns
afe
sani
tatio
n an
d la
ck o
f hyg
iene
(e
xpos
ure
to u
nsaf
e W
ater
, San
itatio
n an
d Hy
gien
e fo
r All
(WAS
H) se
rvice
s)Ye
sYe
sNo
Yes
NoNo
NoNo
583.
9.3
Mor
talit
y rat
e at
tribu
ted
to u
nint
entio
nal p
oiso
ning
Yes
Yes
NoYe
sNo
NoNo
No
593.
a.1
Age-
stan
dard
ized
prev
alen
ce o
f cur
rent
toba
cco
use
amon
g pe
rson
s ag
ed 1
5 ye
ars a
nd o
lder
NoNo
NoNo
NoNo
NoNo
603.
b.1
Prop
ortio
n of
the
tar
get
popu
latio
n co
vere
d by
all
vacc
ines
inclu
ded
in t
heir
natio
nal p
rogr
amm
eYe
sNo
NoYe
sNo
NoNo
No
613.
b.2
Tota
l net
offi
cial d
evel
opm
ent a
ssist
ance
to m
edica
l res
earc
h an
d ba
sic h
ealth
se
ctor
sNo
NoNo
NoNo
NoNo
No
623.
b.3 P
ropo
rtion
of he
alth
facil
ities
that
have
a co
re se
t of r
elev
ant e
ssen
tial m
edici
nes
avai
labl
e an
d aff
orda
ble
on a
sust
aina
ble
basis
Yes
Yes
NoYe
sNo
NoNo
No
633.
c.1 H
ealth
wor
ker d
ensit
y and
dist
ribut
ion
NoNo
NoNo
NoNo
NoNo
Appendix
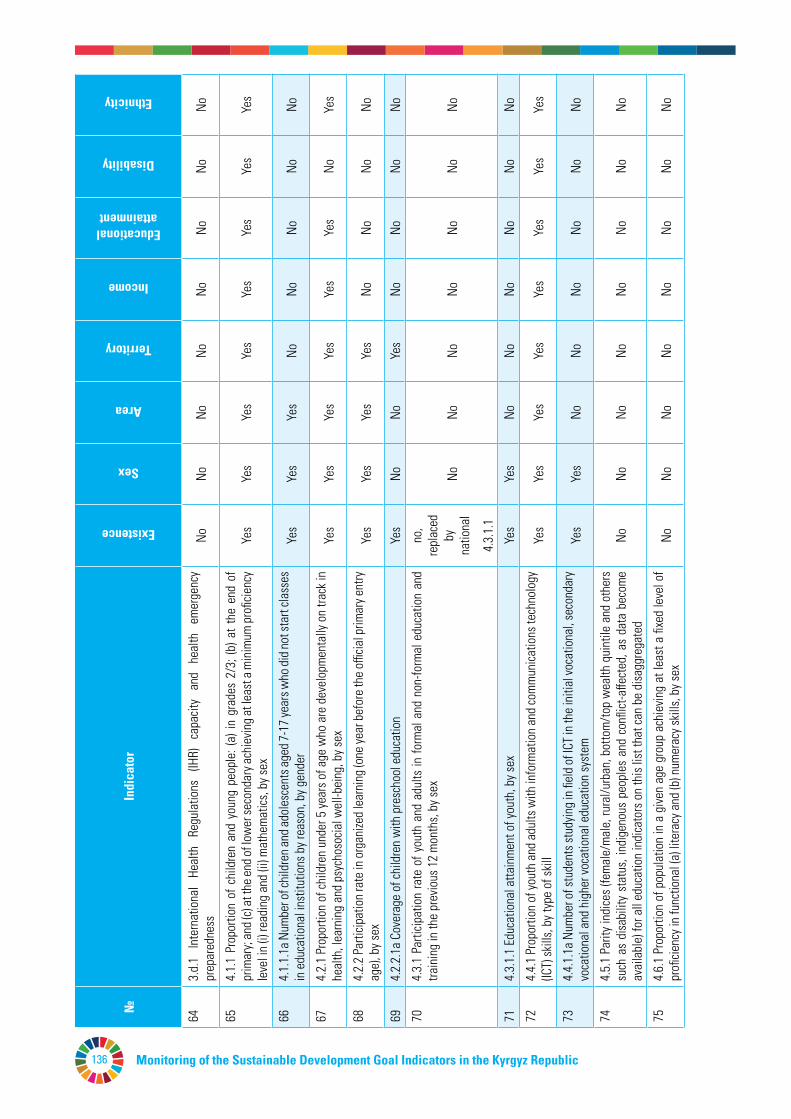
Monitoring of the Sustainable Development Goal Indicators in the Kyrgyz Republic136
№In
dica
tor
Existence
Sex
Агеa
Territory
Income
Educational attainment
Disability
Ethnicity
643.
d.1
Inte
rnat
iona
l He
alth
Re
gula
tions
(IH
R)
capa
city
and
heal
th
emer
genc
y pr
epar
edne
ssNo
NoNo
NoNo
NoNo
No
654.
1.1
Prop
ortio
n of
chi
ldre
n an
d yo
ung
peop
le: (
a) in
gra
des
2/3;
(b) a
t th
e en
d of
pr
imar
y; an
d (c)
at th
e end
of lo
wer
seco
ndar
y ach
ievin
g at l
east
a m
inim
um pr
oficie
ncy
leve
l in
(i) re
adin
g an
d (ii
) mat
hem
atics
, by s
exYe
sYe
sYe
sYe
sYe
sYe
sYe
sYe
s
664.
1.1.
1а N
umbe
r of c
hild
ren a
nd ad
oles
cent
s age
d 7-1
7 yea
rs w
ho di
d not
star
t cla
sses
in
edu
catio
nal i
nstit
utio
ns b
y rea
son,
by g
ende
rYe
sYe
sYe
sNo
NoNo
NoNo
674.
2.1
Prop
ortio
n of
child
ren
unde
r 5 ye
ars o
f age
who
are
dev
elop
men
tally
on
track
in
heal
th, l
earn
ing
and
psyc
hoso
cial w
ell-b
eing
, by s
exYe
sYe
sYe
sYe
sYe
sYe
sNo
Yes
684.
2.2
Parti
cipat
ion
rate
in o
rgan
ized
lear
ning
(one
year
bef
ore
the
officia
l prim
ary e
ntry
ag
e), b
y sex
Yes
Yes
Yes
Yes
NoNo
NoNo
694.
2.2.
1а C
over
age
of ch
ildre
n w
ith p
resc
hool
edu
catio
nYe
sNo
NoYe
sNo
NoNo
No
704.
3.1
Parti
cipat
ion
rate
of y
outh
and
adu
lts in
form
al a
nd n
on-fo
rmal
edu
catio
n an
d tra
inin
g in
the
prev
ious
12
mon
ths,
by se
xno
, re
plac
ed
by
natio
nal
4.3.
1.1
NoNo
NoNo
NoNo
No
714.
3.1.
1 Ed
ucat
iona
l atta
inm
ent o
f you
th, b
y sex
Yes
Yes
NoNo
NoNo
NoNo
724.
4.1
Prop
ortio
n of
yout
h an
d ad
ults
with
info
rmat
ion
and
com
mun
icatio
ns te
chno
logy
(IC
T) sk
ills,
by ty
pe o
f skil
lYe
sYe
sYe
sYe
sYe
sYe
sYe
sYe
s
734.
4.1.
1а N
umbe
r of s
tude
nts s
tudy
ing
in fi
eld
of IC
T in
the
initi
al vo
catio
nal,
seco
ndar
y vo
catio
nal a
nd h
ighe
r voc
atio
nal e
duca
tion
syst
emYe
sYe
sNo
NoNo
NoNo
No
744.
5.1
Parit
y in
dice
s (fe
mal
e/m
ale,
rura
l/urb
an, b
otto
m/to
p w
ealth
qui
ntile
and
oth
ers
such
as
disa
bilit
y st
atus
, ind
igen
ous
peop
les
and
confl
ict-a
ffect
ed, a
s da
ta b
ecom
e av
aila
ble)
for a
ll ed
ucat
ion
indi
cato
rs o
n th
is lis
t tha
t can
be
disa
ggre
gate
dNo
NoNo
NoNo
NoNo
No
754.
6.1
Prop
ortio
n of
pop
ulat
ion
in a
give
n ag
e gr
oup
achi
evin
g at
leas
t a fi
xed
leve
l of
profi
cienc
y in
func
tiona
l (a)
lite
racy
and
(b) n
umer
acy s
kills,
by s
exNo
NoNo
NoNo
NoNo
No
764.
7.1
Exte
nt to
whi
ch (i
) glo
bal c
itize
nshi
p ed
ucat
ion
and
(ii) e
duca
tion
for s
usta
inab
le
deve
lopm
ent,
inclu
ding
gen
der e
qual
ity a
nd h
uman
righ
ts, a
re m
ains
tream
ed a
t all
leve
ls in
: (a)
nat
iona
l edu
catio
n po
licie
s; (b
) cur
ricul
a; (c
) tea
cher
edu
catio
n; a
nd (d
) st
uden
t ass
essm
ent
Yes
NoNo
NoNo
NoNo
No
774.
a.1 P
ropo
rtion
of sc
hool
s with
acce
ss to
: (a) e
lect
ricity
; (b) t
he In
tern
et fo
r ped
agog
ical
purp
oses
; (c)
com
pute
rs f
or p
edag
ogica
l pu
rpos
es;
(d)
adap
ted
infra
stru
ctur
e an
d m
ater
ials
for s
tude
nts
with
disa
bilit
ies;
(e) b
asic
drin
king
wat
er; (
f) sin
gle-
sex
basic
sa
nita
tion
facil
ities
; and
(g) b
asic
hand
was
hing
facil
ities
(as
per t
he W
ASH
indi
cato
r de
finiti
ons)
NoNo
NoNo
NoNo
NoNo
784.
b.1
Volu
me
of o
fficia
l dev
elop
men
t ass
istan
ce fl
ows
for s
chol
arsh
ips
by s
ecto
r and
ty
pe o
f stu
dyno
, re
plac
ed
by
natio
nal
4.b.
1.1
NoNo
NoNo
NoNo
No
794.
b.1.
1 Nu
mbe
r of p
lace
s pr
ovid
ed to
Kyr
gyzs
tan
for t
rain
ing
pers
onne
l abr
oad
at th
e ex
pens
e of
the
host
cou
ntry
und
er o
fficia
l int
ergo
vern
men
tal a
nd in
ters
tate
trea
ties
and
agre
emen
tsYe
sNo
NoNo
NoNo
NoNo
804.
c.1 P
ropo
rtion
of t
each
ers i
n: (a
) pre
-prim
ary;
(b) p
rimar
y; (c)
low
er se
cond
ary;
and
(d)
uppe
r sec
onda
ry ed
ucat
ion w
ho ha
ve re
ceive
d at l
east
the m
inim
um or
gani
zed t
each
er
train
ing
(e.g
. ped
agog
ical t
rain
ing)
pre
-ser
vice
or in
-ser
vice
requ
ired
for t
each
ing
at
the
rele
vant
leve
l in
a gi
ven
coun
try
No,
repl
aced
by
na
tiona
l 4.
с.1.1
NoNo
NoNo
NoNo
No
814.
с.1.1
Pro
porti
on o
f cer
tified
teac
hers
in e
duca
tiona
l ins
titut
ions
Yes
NoNo
NoNo
NoNo
No
825.
1.1
Whe
ther
or n
ot le
gal f
ram
ewor
ks a
re in
pla
ce to
pro
mot
e, e
nfor
ce a
nd m
onito
r eq
ualit
y and
non
disc
rimin
atio
n on
the
basis
of s
exYe
sNo
NoNo
NoNo
NoNo
835.
2.1
Prop
ortio
n of
eve
r-par
tner
ed w
omen
and
girl
s age
d 15
year
s and
old
er su
bjec
ted
to p
hysic
al, s
exua
l or p
sych
olog
ical v
iole
nce
by a
curre
nt o
r for
mer
intim
ate
partn
er in
th
e pr
evio
us 1
2 m
onth
s, by
form
of v
iole
nce
and
by a
ge
No,
repl
aced
by
na
tiona
l 5.
2.1.
1а и
5.
2.1.
1b
NoNo
NoNo
NoNo
No
845.
2.1.
1а N
umbe
r of w
omen
see
king
assis
tanc
e at
hea
lth c
are
facil
ities
con
cern
ing
dom
estic
viol
ence
Yes
Yes
NoNo
NoNo
NoNo
855.
2.1.
1b N
umbe
r of
vict
ims
of d
omes
tic v
iole
nce,
by
sex,
age
grou
p, e
duca
tiona
l at
tain
men
t and
occ
upat
ion
Yes
Yes
Yes
NoNo
Yes
NoNo
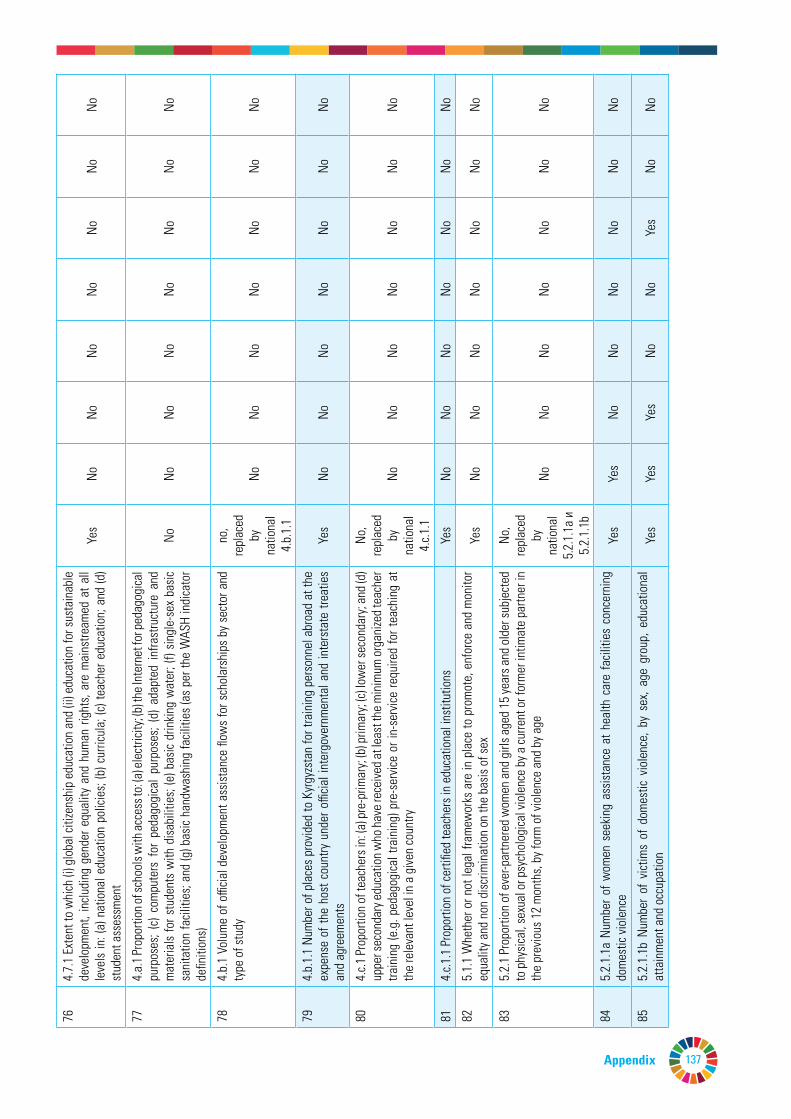
137
№In
dica
tor
Existence
Sex
Агеa
Territory
Income
Educational attainment
Disability
Ethnicity
643.
d.1
Inte
rnat
iona
l He
alth
Re
gula
tions
(IH
R)
capa
city
and
heal
th
emer
genc
y pr
epar
edne
ssNo
NoNo
NoNo
NoNo
No
654.
1.1
Prop
ortio
n of
chi
ldre
n an
d yo
ung
peop
le: (
a) in
gra
des
2/3;
(b) a
t th
e en
d of
pr
imar
y; an
d (c)
at th
e end
of lo
wer
seco
ndar
y ach
ievin
g at l
east
a m
inim
um pr
oficie
ncy
leve
l in
(i) re
adin
g an
d (ii
) mat
hem
atics
, by s
exYe
sYe
sYe
sYe
sYe
sYe
sYe
sYe
s
664.
1.1.
1а N
umbe
r of c
hild
ren a
nd ad
oles
cent
s age
d 7-1
7 yea
rs w
ho di
d not
star
t cla
sses
in
edu
catio
nal i
nstit
utio
ns b
y rea
son,
by g
ende
rYe
sYe
sYe
sNo
NoNo
NoNo
674.
2.1
Prop
ortio
n of
child
ren
unde
r 5 ye
ars o
f age
who
are
dev
elop
men
tally
on
track
in
heal
th, l
earn
ing
and
psyc
hoso
cial w
ell-b
eing
, by s
exYe
sYe
sYe
sYe
sYe
sYe
sNo
Yes
684.
2.2
Parti
cipat
ion
rate
in o
rgan
ized
lear
ning
(one
year
bef
ore
the
officia
l prim
ary e
ntry
ag
e), b
y sex
Yes
Yes
Yes
Yes
NoNo
NoNo
694.
2.2.
1а C
over
age
of ch
ildre
n w
ith p
resc
hool
edu
catio
nYe
sNo
NoYe
sNo
NoNo
No
704.
3.1
Parti
cipat
ion
rate
of y
outh
and
adu
lts in
form
al a
nd n
on-fo
rmal
edu
catio
n an
d tra
inin
g in
the
prev
ious
12
mon
ths,
by se
xno
, re
plac
ed
by
natio
nal
4.3.
1.1
NoNo
NoNo
NoNo
No
714.
3.1.
1 Ed
ucat
iona
l atta
inm
ent o
f you
th, b
y sex
Yes
Yes
NoNo
NoNo
NoNo
724.
4.1
Prop
ortio
n of
yout
h an
d ad
ults
with
info
rmat
ion
and
com
mun
icatio
ns te
chno
logy
(IC
T) sk
ills,
by ty
pe o
f skil
lYe
sYe
sYe
sYe
sYe
sYe
sYe
sYe
s
734.
4.1.
1а N
umbe
r of s
tude
nts s
tudy
ing
in fi
eld
of IC
T in
the
initi
al vo
catio
nal,
seco
ndar
y vo
catio
nal a
nd h
ighe
r voc
atio
nal e
duca
tion
syst
emYe
sYe
sNo
NoNo
NoNo
No
744.
5.1
Parit
y in
dice
s (fe
mal
e/m
ale,
rura
l/urb
an, b
otto
m/to
p w
ealth
qui
ntile
and
oth
ers
such
as
disa
bilit
y st
atus
, ind
igen
ous
peop
les
and
confl
ict-a
ffect
ed, a
s da
ta b
ecom
e av
aila
ble)
for a
ll ed
ucat
ion
indi
cato
rs o
n th
is lis
t tha
t can
be
disa
ggre
gate
dNo
NoNo
NoNo
NoNo
No
754.
6.1
Prop
ortio
n of
pop
ulat
ion
in a
give
n ag
e gr
oup
achi
evin
g at
leas
t a fi
xed
leve
l of
profi
cienc
y in
func
tiona
l (a)
lite
racy
and
(b) n
umer
acy s
kills,
by s
exNo
NoNo
NoNo
NoNo
No
764.
7.1
Exte
nt to
whi
ch (i
) glo
bal c
itize
nshi
p ed
ucat
ion
and
(ii) e
duca
tion
for s
usta
inab
le
deve
lopm
ent,
inclu
ding
gen
der e
qual
ity a
nd h
uman
righ
ts, a
re m
ains
tream
ed a
t all
leve
ls in
: (a)
nat
iona
l edu
catio
n po
licie
s; (b
) cur
ricul
a; (c
) tea
cher
edu
catio
n; a
nd (d
) st
uden
t ass
essm
ent
Yes
NoNo
NoNo
NoNo
No
774.
a.1 P
ropo
rtion
of sc
hool
s with
acce
ss to
: (a) e
lect
ricity
; (b) t
he In
tern
et fo
r ped
agog
ical
purp
oses
; (c)
com
pute
rs f
or p
edag
ogica
l pu
rpos
es;
(d)
adap
ted
infra
stru
ctur
e an
d m
ater
ials
for s
tude
nts
with
disa
bilit
ies;
(e) b
asic
drin
king
wat
er; (
f) sin
gle-
sex
basic
sa
nita
tion
facil
ities
; and
(g) b
asic
hand
was
hing
facil
ities
(as
per t
he W
ASH
indi
cato
r de
finiti
ons)
NoNo
NoNo
NoNo
NoNo
784.
b.1
Volu
me
of o
fficia
l dev
elop
men
t ass
istan
ce fl
ows
for s
chol
arsh
ips
by s
ecto
r and
ty
pe o
f stu
dyno
, re
plac
ed
by
natio
nal
4.b.
1.1
NoNo
NoNo
NoNo
No
794.
b.1.
1 Nu
mbe
r of p
lace
s pr
ovid
ed to
Kyr
gyzs
tan
for t
rain
ing
pers
onne
l abr
oad
at th
e ex
pens
e of
the
host
cou
ntry
und
er o
fficia
l int
ergo
vern
men
tal a
nd in
ters
tate
trea
ties
and
agre
emen
tsYe
sNo
NoNo
NoNo
NoNo
804.
c.1 P
ropo
rtion
of t
each
ers i
n: (a
) pre
-prim
ary;
(b) p
rimar
y; (c)
low
er se
cond
ary;
and
(d)
uppe
r sec
onda
ry ed
ucat
ion w
ho ha
ve re
ceive
d at l
east
the m
inim
um or
gani
zed t
each
er
train
ing
(e.g
. ped
agog
ical t
rain
ing)
pre
-ser
vice
or in
-ser
vice
requ
ired
for t
each
ing
at
the
rele
vant
leve
l in
a gi
ven
coun
try
No,
repl
aced
by
na
tiona
l 4.
с.1.1
NoNo
NoNo
NoNo
No
814.
с.1.1
Pro
porti
on o
f cer
tified
teac
hers
in e
duca
tiona
l ins
titut
ions
Yes
NoNo
NoNo
NoNo
No
825.
1.1
Whe
ther
or n
ot le
gal f
ram
ewor
ks a
re in
pla
ce to
pro
mot
e, e
nfor
ce a
nd m
onito
r eq
ualit
y and
non
disc
rimin
atio
n on
the
basis
of s
exYe
sNo
NoNo
NoNo
NoNo
835.
2.1
Prop
ortio
n of
eve
r-par
tner
ed w
omen
and
girl
s age
d 15
year
s and
old
er su
bjec
ted
to p
hysic
al, s
exua
l or p
sych
olog
ical v
iole
nce
by a
curre
nt o
r for
mer
intim
ate
partn
er in
th
e pr
evio
us 1
2 m
onth
s, by
form
of v
iole
nce
and
by a
ge
No,
repl
aced
by
na
tiona
l 5.
2.1.
1а и
5.
2.1.
1b
NoNo
NoNo
NoNo
No
845.
2.1.
1а N
umbe
r of w
omen
see
king
assis
tanc
e at
hea
lth c
are
facil
ities
con
cern
ing
dom
estic
viol
ence
Yes
Yes
NoNo
NoNo
NoNo
855.
2.1.
1b N
umbe
r of
vict
ims
of d
omes
tic v
iole
nce,
by
sex,
age
grou
p, e
duca
tiona
l at
tain
men
t and
occ
upat
ion
Yes
Yes
Yes
NoNo
Yes
NoNo
Appendix
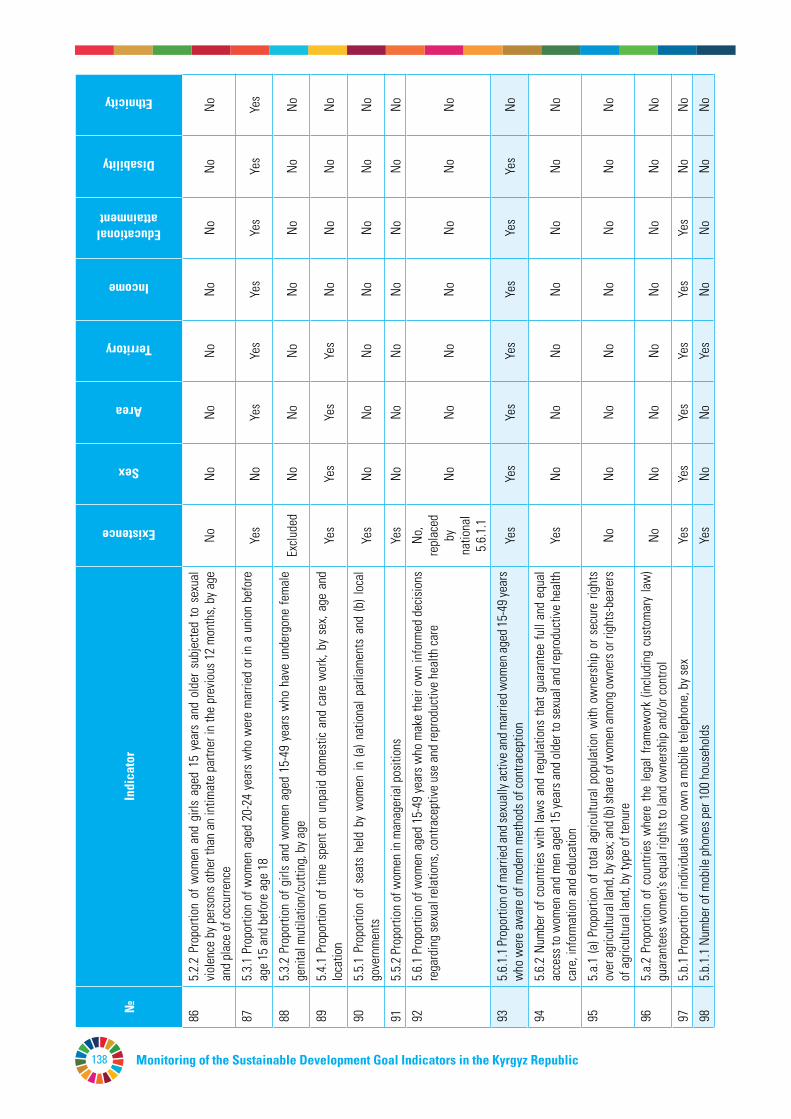
Monitoring of the Sustainable Development Goal Indicators in the Kyrgyz Republic138
№In
dica
tor
Existence
Sex
Агеa
Territory
Income
Educational attainment
Disability
Ethnicity
865.
2.2
Prop
ortio
n of
wom
en a
nd g
irls
aged
15
year
s an
d ol
der
subj
ecte
d to
sex
ual
viole
nce
by p
erso
ns o
ther
than
an
intim
ate
partn
er in
the
prev
ious
12
mon
ths,
by a
ge
and
plac
e of
occ
urre
nce
NoNo
NoNo
NoNo
NoNo
875.
3.1
Prop
ortio
n of
wom
en a
ged
20-2
4 ye
ars
who
wer
e m
arrie
d or
in a
uni
on b
efor
e ag
e 15
and
bef
ore
age
18Ye
sNo
Yes
Yes
Yes
Yes
Yes
Yes
885.
3.2
Prop
ortio
n of
girl
s an
d w
omen
age
d 15
-49
year
s w
ho h
ave
unde
rgon
e fe
mal
e ge
nita
l mut
ilatio
n/cu
tting
, by a
geEx
clude
dNo
NoNo
NoNo
NoNo
895.
4.1
Prop
ortio
n of
tim
e sp
ent o
n un
paid
dom
estic
and
car
e w
ork,
by s
ex, a
ge a
nd
loca
tion
Yes
Yes
Yes
Yes
NoNo
NoNo
905.
5.1
Prop
ortio
n of
sea
ts h
eld
by w
omen
in (a
) nat
iona
l par
liam
ents
and
(b) l
ocal
go
vern
men
tsYe
sNo
NoNo
NoNo
NoNo
915.
5.2
Prop
ortio
n of
wom
en in
man
ager
ial p
ositi
ons
Yes
NoNo
NoNo
NoNo
No
925.
6.1
Prop
ortio
n of
wom
en a
ged
15-4
9 ye
ars w
ho m
ake
thei
r ow
n in
form
ed d
ecisi
ons
rega
rdin
g se
xual
rela
tions
, con
trace
ptive
use
and
repr
oduc
tive
heal
th ca
reNo
, re
plac
ed
by
natio
nal
5.6.
1.1
NoNo
NoNo
NoNo
No
935.
6.1.
1 Pro
porti
on of
mar
ried a
nd se
xual
ly ac
tive a
nd m
arrie
d wom
en ag
ed 15
-49 y
ears
w
ho w
ere
awar
e of
mod
ern
met
hods
of c
ontra
cept
ion
Yes
Yes
Yes
Yes
Yes
Yes
Yes
No
945.
6.2
Num
ber o
f cou
ntrie
s w
ith la
ws
and
regu
latio
ns th
at g
uara
ntee
full
and
equa
l ac
cess
to w
omen
and
men
age
d 15
year
s and
old
er to
sexu
al a
nd re
prod
uctiv
e he
alth
ca
re, i
nfor
mat
ion
and
educ
atio
nYe
sNo
NoNo
NoNo
NoNo
955.
a.1
(a) P
ropo
rtion
of t
otal
agr
icultu
ral p
opul
atio
n w
ith o
wne
rshi
p or
sec
ure
right
s ov
er a
gricu
ltura
l lan
d, b
y sex
; and
(b) s
hare
of w
omen
am
ong
owne
rs o
r rig
hts-
bear
ers
of a
gricu
ltura
l lan
d, b
y typ
e of
tenu
reNo
NoNo
NoNo
NoNo
No
965.
a.2
Prop
ortio
n of
cou
ntrie
s w
here
the
lega
l fra
mew
ork
(inclu
ding
cus
tom
ary
law
) gu
aran
tees
wom
en’s
equa
l rig
hts t
o la
nd o
wne
rshi
p an
d/or
cont
rol
NoNo
NoNo
NoNo
NoNo
975.
b.1
Prop
ortio
n of
indi
vidua
ls w
ho o
wn
a m
obile
tele
phon
e, b
y sex
Yes
Yes
Yes
Yes
Yes
Yes
NoNo
985.
b.1.
1 Nu
mbe
r of m
obile
pho
nes p
er 1
00 h
ouse
hold
sYe
sNo
NoYe
sNo
NoNo
No
995.
c.1 P
ropo
rtion
of c
ount
ries
with
sys
tem
s to
trac
k an
d m
ake
publ
ic al
loca
tions
for
gend
er e
qual
ity a
nd w
omen
’s em
pow
erm
ent
NoNo
NoNo
NoNo
NoNo
100
6.1.
1 Pr
opor
tion
of p
opul
atio
n us
ing
safe
ly m
anag
ed d
rinkin
g w
ater
serv
ices
Yes
NoNo
Yes
NoNo
NoNo
101
6.1.
1.2b
Pro
porti
on o
f wat
er sa
mpl
es th
at d
o no
t com
ply w
ith h
ygie
ne st
anda
rds
Yes
NoNo
NoNo
NoNo
No
102
6.2.
1 Pr
opor
tion
of p
opul
atio
n us
ing
(a) s
afel
y m
anag
ed s
anita
tion
serv
ices
and
(b) a
ha
nd-w
ashi
ng fa
cility
with
soap
and
wat
erYe
sNo
NoYe
sYe
sYe
sNo
Yes
103
6.2.
1.1
Prop
ortio
n of
pop
ulat
ion
with
sust
aina
ble
acce
ss to
bas
ic sa
nita
tion
Yes
NoNo
Yes
NoYe
sNo
No
104
6.3.
1 Pr
opor
tion
of w
aste
wat
er sa
fely
treat
edYe
sNo
NoNo
NoNo
NoNo
105
6.3.
2 Pr
opor
tion
of b
odie
s of w
ater
with
goo
d am
bien
t wat
er q
ualit
yNo
NoNo
NoNo
NoNo
No
106
6.4.
1 Ch
ange
in w
ater
-use
effi
cienc
y ove
r tim
eNo
, re
plac
ed
by
natio
nal
6.4.
1.2
NoNo
NoNo
NoNo
No
107
6.4.
1.2
Wat
er lo
sses
in tr
ansp
orta
tion
by te
rrito
ryYe
sNo
NoYe
sNo
NoNo
No
108
6.4.
2 Le
vel
of w
ater
stre
ss:
fresh
wat
er w
ithdr
awal
as
a pr
opor
tion
of a
vaila
ble
fresh
wat
er re
sour
ces
No,
repl
aced
by
na
tiona
l 6.
4.2.
1
NoNo
NoNo
NoNo
No
109
Yes
NoNo
Yes
NoNo
NoNo
110
6.4.
2.1
Tota
l wat
er in
take
NoNo
NoNo
NoNo
NoNo
111
6.5.
1 De
gree
of i
nteg
rate
d w
ater
reso
urce
s man
agem
ent i
mpl
emen
tatio
n (0
-100
)No
NoNo
NoNo
NoNo
No
112
6.5.
2 Pr
opor
tion
of t
rans
boun
dary
bas
in a
rea
with
an
oper
atio
nal a
rrang
emen
t fo
r w
ater
coop
erat
ion
NoNo
NoNo
NoNo
NoNo
113
6.6.
1 Ch
ange
in th
e ex
tent
of w
ater
-rela
ted
ecos
yste
ms o
ver t
ime
No,
repl
aced
by
na
tiona
l 6.
а1.1
NoNo
NoNo
NoNo
No
114
6.a.
1 Am
ount
of w
ater
- and
san
itatio
n-re
late
d offi
cial d
evel
opm
ent a
ssist
ance
that
is
part
of a
gov
ernm
ent-c
oord
inat
ed sp
endi
ng p
lan
Yes
NoNo
NoNo
NoNo
No
115
6.а.
1.1
Volu
me
of o
fficia
l de
velo
pmen
t as
sista
nce
allo
cate
d to
wat
er s
uppl
y an
d sa
nita
tion
unde
r a co
ordi
nate
d st
ate
spen
ding
pro
gram
me,
acc
ordi
ng to
nat
iona
l dat
aNo
NoNo
NoNo
NoNo
No

139Appendix
№In
dica
tor
Existence
Sex
Агеa
Territory
Income
Educational attainment
Disability
Ethnicity
865.
2.2
Prop
ortio
n of
wom
en a
nd g
irls
aged
15
year
s an
d ol
der
subj
ecte
d to
sex
ual
viole
nce
by p
erso
ns o
ther
than
an
intim
ate
partn
er in
the
prev
ious
12
mon
ths,
by a
ge
and
plac
e of
occ
urre
nce
NoNo
NoNo
NoNo
NoNo
875.
3.1
Prop
ortio
n of
wom
en a
ged
20-2
4 ye
ars
who
wer
e m
arrie
d or
in a
uni
on b
efor
e ag
e 15
and
bef
ore
age
18Ye
sNo
Yes
Yes
Yes
Yes
Yes
Yes
885.
3.2
Prop
ortio
n of
girl
s an
d w
omen
age
d 15
-49
year
s w
ho h
ave
unde
rgon
e fe
mal
e ge
nita
l mut
ilatio
n/cu
tting
, by a
geEx
clude
dNo
NoNo
NoNo
NoNo
895.
4.1
Prop
ortio
n of
tim
e sp
ent o
n un
paid
dom
estic
and
car
e w
ork,
by s
ex, a
ge a
nd
loca
tion
Yes
Yes
Yes
Yes
NoNo
NoNo
905.
5.1
Prop
ortio
n of
sea
ts h
eld
by w
omen
in (a
) nat
iona
l par
liam
ents
and
(b) l
ocal
go
vern
men
tsYe
sNo
NoNo
NoNo
NoNo
915.
5.2
Prop
ortio
n of
wom
en in
man
ager
ial p
ositi
ons
Yes
NoNo
NoNo
NoNo
No
925.
6.1
Prop
ortio
n of
wom
en a
ged
15-4
9 ye
ars w
ho m
ake
thei
r ow
n in
form
ed d
ecisi
ons
rega
rdin
g se
xual
rela
tions
, con
trace
ptive
use
and
repr
oduc
tive
heal
th ca
reNo
, re
plac
ed
by
natio
nal
5.6.
1.1
NoNo
NoNo
NoNo
No
935.
6.1.
1 Pro
porti
on of
mar
ried a
nd se
xual
ly ac
tive a
nd m
arrie
d wom
en ag
ed 15
-49 y
ears
w
ho w
ere
awar
e of
mod
ern
met
hods
of c
ontra
cept
ion
Yes
Yes
Yes
Yes
Yes
Yes
Yes
No
945.
6.2
Num
ber o
f cou
ntrie
s w
ith la
ws
and
regu
latio
ns th
at g
uara
ntee
full
and
equa
l ac
cess
to w
omen
and
men
age
d 15
year
s and
old
er to
sexu
al a
nd re
prod
uctiv
e he
alth
ca
re, i
nfor
mat
ion
and
educ
atio
nYe
sNo
NoNo
NoNo
NoNo
955.
a.1
(a) P
ropo
rtion
of t
otal
agr
icultu
ral p
opul
atio
n w
ith o
wne
rshi
p or
sec
ure
right
s ov
er a
gricu
ltura
l lan
d, b
y sex
; and
(b) s
hare
of w
omen
am
ong
owne
rs o
r rig
hts-
bear
ers
of a
gricu
ltura
l lan
d, b
y typ
e of
tenu
reNo
NoNo
NoNo
NoNo
No
965.
a.2
Prop
ortio
n of
cou
ntrie
s w
here
the
lega
l fra
mew
ork
(inclu
ding
cus
tom
ary
law
) gu
aran
tees
wom
en’s
equa
l rig
hts t
o la
nd o
wne
rshi
p an
d/or
cont
rol
NoNo
NoNo
NoNo
NoNo
975.
b.1
Prop
ortio
n of
indi
vidua
ls w
ho o
wn
a m
obile
tele
phon
e, b
y sex
Yes
Yes
Yes
Yes
Yes
Yes
NoNo
985.
b.1.
1 Nu
mbe
r of m
obile
pho
nes p
er 1
00 h
ouse
hold
sYe
sNo
NoYe
sNo
NoNo
No
995.
c.1 P
ropo
rtion
of c
ount
ries
with
sys
tem
s to
trac
k an
d m
ake
publ
ic al
loca
tions
for
gend
er e
qual
ity a
nd w
omen
’s em
pow
erm
ent
NoNo
NoNo
NoNo
NoNo
100
6.1.
1 Pr
opor
tion
of p
opul
atio
n us
ing
safe
ly m
anag
ed d
rinkin
g w
ater
serv
ices
Yes
NoNo
Yes
NoNo
NoNo
101
6.1.
1.2b
Pro
porti
on o
f wat
er sa
mpl
es th
at d
o no
t com
ply w
ith h
ygie
ne st
anda
rds
Yes
NoNo
NoNo
NoNo
No
102
6.2.
1 Pr
opor
tion
of p
opul
atio
n us
ing
(a) s
afel
y m
anag
ed s
anita
tion
serv
ices
and
(b) a
ha
nd-w
ashi
ng fa
cility
with
soap
and
wat
erYe
sNo
NoYe
sYe
sYe
sNo
Yes
103
6.2.
1.1
Prop
ortio
n of
pop
ulat
ion
with
sust
aina
ble
acce
ss to
bas
ic sa
nita
tion
Yes
NoNo
Yes
NoYe
sNo
No
104
6.3.
1 Pr
opor
tion
of w
aste
wat
er sa
fely
treat
edYe
sNo
NoNo
NoNo
NoNo
105
6.3.
2 Pr
opor
tion
of b
odie
s of w
ater
with
goo
d am
bien
t wat
er q
ualit
yNo
NoNo
NoNo
NoNo
No
106
6.4.
1 Ch
ange
in w
ater
-use
effi
cienc
y ove
r tim
eNo
, re
plac
ed
by
natio
nal
6.4.
1.2
NoNo
NoNo
NoNo
No
107
6.4.
1.2
Wat
er lo
sses
in tr
ansp
orta
tion
by te
rrito
ryYe
sNo
NoYe
sNo
NoNo
No
108
6.4.
2 Le
vel
of w
ater
stre
ss:
fresh
wat
er w
ithdr
awal
as
a pr
opor
tion
of a
vaila
ble
fresh
wat
er re
sour
ces
No,
repl
aced
by
na
tiona
l 6.
4.2.
1
NoNo
NoNo
NoNo
No
109
Yes
NoNo
Yes
NoNo
NoNo
110
6.4.
2.1
Tota
l wat
er in
take
NoNo
NoNo
NoNo
NoNo
111
6.5.
1 De
gree
of i
nteg
rate
d w
ater
reso
urce
s man
agem
ent i
mpl
emen
tatio
n (0
-100
)No
NoNo
NoNo
NoNo
No
112
6.5.
2 Pr
opor
tion
of t
rans
boun
dary
bas
in a
rea
with
an
oper
atio
nal a
rrang
emen
t fo
r w
ater
coop
erat
ion
NoNo
NoNo
NoNo
NoNo
113
6.6.
1 Ch
ange
in th
e ex
tent
of w
ater
-rela
ted
ecos
yste
ms o
ver t
ime
No,
repl
aced
by
na
tiona
l 6.
а1.1
NoNo
NoNo
NoNo
No
114
6.a.
1 Am
ount
of w
ater
- and
san
itatio
n-re
late
d offi
cial d
evel
opm
ent a
ssist
ance
that
is
part
of a
gov
ernm
ent-c
oord
inat
ed sp
endi
ng p
lan
Yes
NoNo
NoNo
NoNo
No
115
6.а.
1.1
Volu
me
of o
fficia
l de
velo
pmen
t as
sista
nce
allo
cate
d to
wat
er s
uppl
y an
d sa
nita
tion
unde
r a co
ordi
nate
d st
ate
spen
ding
pro
gram
me,
acc
ordi
ng to
nat
iona
l dat
aNo
NoNo
NoNo
NoNo
No
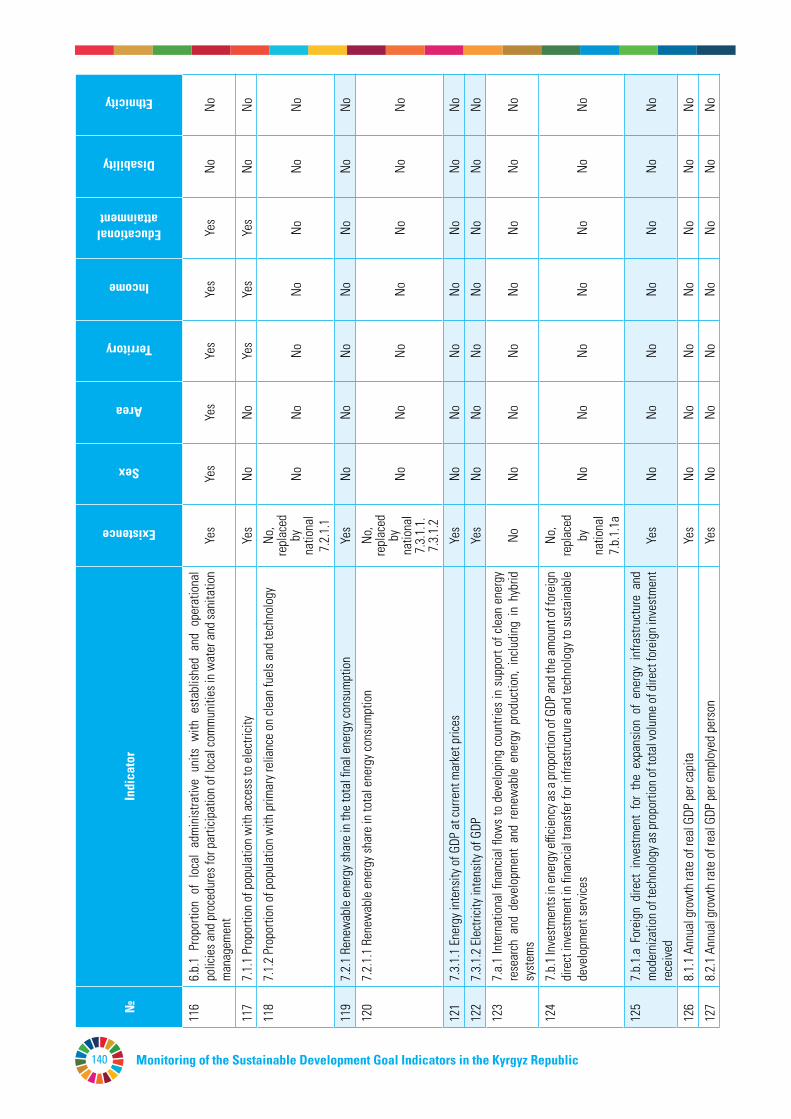
Monitoring of the Sustainable Development Goal Indicators in the Kyrgyz Republic140
№In
dica
tor
Existence
Sex
Агеa
Territory
Income
Educational attainment
Disability
Ethnicity
116
6.b.
1 Pr
opor
tion
of l
ocal
adm
inist
rativ
e un
its w
ith e
stab
lishe
d an
d op
erat
iona
l po
licie
s and
pro
cedu
res f
or p
artic
ipat
ion
of lo
cal c
omm
uniti
es in
wat
er a
nd sa
nita
tion
man
agem
ent
Yes
Yes
Yes
Yes
Yes
Yes
NoNo
117
7.1.
1 Pr
opor
tion
of p
opul
atio
n w
ith a
cces
s to
elec
tricit
yYe
sNo
NoYe
sYe
sYe
sNo
No
118
7.1.
2 Pr
opor
tion
of p
opul
atio
n w
ith p
rimar
y rel
ianc
e on
clea
n fu
els a
nd te
chno
logy
No,
repl
aced
by
na
tiona
l 7.
2.1.
1
NoNo
NoNo
NoNo
No
119
7.2.
1 Re
new
able
ene
rgy s
hare
in th
e to
tal fi
nal e
nerg
y con
sum
ptio
nYe
sNo
NoNo
NoNo
NoNo
120
7.2.
1.1
Rene
wab
le e
nerg
y sha
re in
tota
l ene
rgy c
onsu
mpt
ion
No,
repl
aced
by
na
tiona
l 7.
3.1.
1.
7.3.
1.2
NoNo
NoNo
NoNo
No
121
7.3.
1.1
Ener
gy in
tens
ity o
f GDP
at c
urre
nt m
arke
t pric
esYe
sNo
NoNo
NoNo
NoNo
122
7.3.
1.2
Elec
tricit
y int
ensit
y of G
DPYe
sNo
NoNo
NoNo
NoNo
123
7.a.
1 In
tern
atio
nal fi
nanc
ial fl
ows
to d
evel
opin
g co
untri
es in
sup
port
of c
lean
ene
rgy
rese
arch
and
dev
elop
men
t an
d re
new
able
ene
rgy
prod
uctio
n, i
nclu
ding
in
hybr
id
syst
ems
NoNo
NoNo
NoNo
NoNo
124
7.b.
1 Inv
estm
ents
in en
ergy
efficie
ncy a
s a pr
opor
tion o
f GDP
and t
he am
ount
of fo
reig
n di
rect
inve
stm
ent i
n fin
ancia
l tra
nsfe
r for
infra
stru
ctur
e an
d te
chno
logy
to su
stai
nabl
e de
velo
pmen
t ser
vices
No,
repl
aced
by
na
tiona
l 7.
b.1.
1a
NoNo
NoNo
NoNo
No
125
7.b.
1.a
Fore
ign
dire
ct i
nves
tmen
t fo
r th
e ex
pans
ion
of e
nerg
y in
frast
ruct
ure
and
mod
erni
zatio
n of
tech
nolo
gy a
s pro
porti
on o
f tot
al vo
lum
e of
dire
ct fo
reig
n in
vest
men
t re
ceive
d Ye
sNo
NoNo
NoNo
NoNo
126
8.1.
1 An
nual
gro
wth
rate
of r
eal G
DP p
er ca
pita
Yes
NoNo
NoNo
NoNo
No
127
8.2.
1 An
nual
gro
wth
rate
of r
eal G
DP p
er e
mpl
oyed
per
son
Yes
NoNo
NoNo
NoNo
No
128
8.3.
1 Pr
opor
tion
of in
form
al e
mpl
oym
ent i
n no
n ag
ricul
ture
em
ploy
men
t, by
sex
No,
repl
aced
by
na
tiona
l 8.
3.1.
1 и
8.3.
1.2
NoNo
NoNo
NoNo
No
129
8.3.
1.1
Info
rmal
em
ploy
men
t di
sagg
rega
ted
by s
ex,
age,
urb
an/ru
ral
setti
ng,
and
sect
ors o
f the
eco
nom
y, in
cludi
ng a
gricu
lture
Yes
Yes
Yes
NoNo
NoNo
No
130
8.3.
1.2
Prop
ortio
n of
tot
al e
mpl
oyed
pop
ulat
ion
empl
oyed
in
smal
l an
d m
ediu
m
ente
rpris
esYe
sNo
NoNo
NoNo
NoNo
131
8.4.
1 M
ater
ial f
ootp
rint,
mat
eria
l foo
tprin
t per
capi
ta, a
nd m
ater
ial f
ootp
rint p
er G
DPNo
NoNo
NoNo
NoNo
No
132
8.4.
2 Do
mes
tic m
ater
ial c
onsu
mpt
ion,
dom
estic
mat
eria
l con
sum
ptio
n pe
r cap
ita, a
nd
dom
estic
mat
eria
l con
sum
ptio
n pe
r GDP
NoNo
NoNo
NoNo
NoNo
133
8.5.
1 Av
erag
e ho
urly
earn
ings
of f
emal
e an
d m
ale
empl
oyee
s, by
occ
upat
ion,
age
and
pe
rson
s with
disa
bilit
ies
No,
repl
aced
by
na
tiona
l 8.
5.1.
1
Yes
NoNo
NoNo
NoNo
134
8.5.
1.1
Aver
age
mon
thly
earn
ings
of w
omen
and
men
by o
ccup
atio
nYe
sYe
sNo
NoNo
NoNo
No
135
8.5.
2 Un
empl
oym
ent r
ate,
by s
ex, a
ge a
nd p
erso
ns w
ith d
isabi
litie
sYe
sYe
sYe
sYe
sNo
NoNo
No
136
8.6.
1 Pr
opor
tion
of yo
uth
(age
d 15
-24
year
s) no
t in
educ
atio
n, e
mpl
oym
ent o
r tra
inin
gYe
sYe
sYe
sNo
NoNo
NoNo
137
8.7.
1 Pr
opor
tion
and
num
ber o
f chi
ldre
n ag
ed 5
17
year
s en
gage
d in
chi
ld la
bour
, by
sex a
nd a
geYe
sYe
sYe
sYe
sYe
sYe
sYe
sYe
s
138
8.8.
1 Fr
eque
ncy
rate
s of
fata
l and
non
-fata
l occ
upat
iona
l inj
urie
s, by
sex
and
mig
rant
st
atus
Yes
Yes
NoYe
sNo
NoNo
No
139
8.8.
2 Le
vel
of n
atio
nal
com
plia
nce
of l
abou
r rig
hts
(free
dom
of
asso
ciatio
n an
d co
llect
ive b
arga
inin
g) b
ased
on
Inte
rnat
iona
l Lab
our O
rgan
izatio
n (IL
O) te
xtua
l sou
rces
an
d na
tiona
l leg
islat
ion,
by s
ex a
nd m
igra
nt st
atus
NoNo
NoNo
NoNo
NoNo
140
8.9.
1 To
urism
dire
ct G
DP a
s a p
ropo
rtion
of t
otal
GDP
and
in g
row
th ra
teNo
, re
plac
ed
by
natio
nal
8.9.
1.1
NoNo
NoNo
NoNo
No
141
8.9.
1.1
Dire
ct co
ntrib
utio
n of
tour
ism to
GDP
as a
pro
porti
on o
f tot
al G
DPYe
s No
NoNo
NoNo
NoNo
142
NoNo
NoNo
NoNo
NoNo
143
8.9.
2 Nu
mbe
r of j
obs i
n su
stai
nabl
e to
urism
indu
strie
s out
of t
otal
tour
ism jo
bsYe
sNo
NoNo
NoNo
NoNo
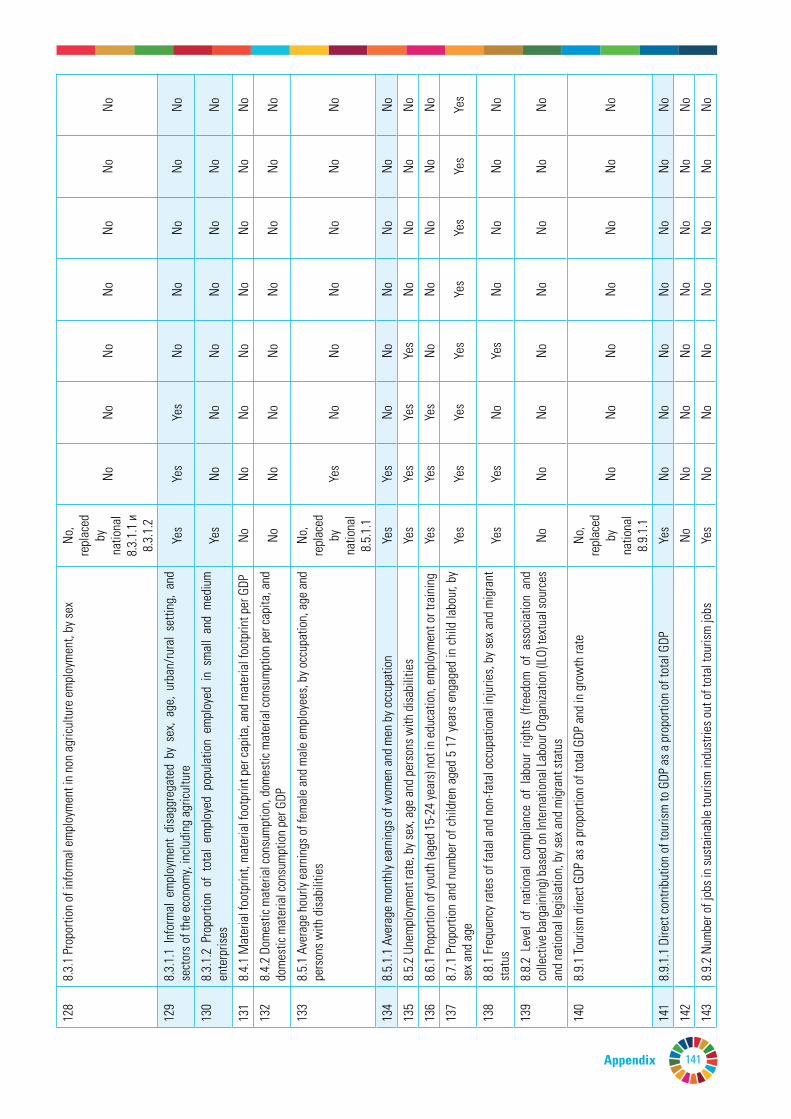
141
№In
dica
tor
Existence
Sex
Агеa
Territory
Income
Educational attainment
Disability
Ethnicity
116
6.b.
1 Pr
opor
tion
of l
ocal
adm
inist
rativ
e un
its w
ith e
stab
lishe
d an
d op
erat
iona
l po
licie
s and
pro
cedu
res f
or p
artic
ipat
ion
of lo
cal c
omm
uniti
es in
wat
er a
nd sa
nita
tion
man
agem
ent
Yes
Yes
Yes
Yes
Yes
Yes
NoNo
117
7.1.
1 Pr
opor
tion
of p
opul
atio
n w
ith a
cces
s to
elec
tricit
yYe
sNo
NoYe
sYe
sYe
sNo
No
118
7.1.
2 Pr
opor
tion
of p
opul
atio
n w
ith p
rimar
y rel
ianc
e on
clea
n fu
els a
nd te
chno
logy
No,
repl
aced
by
na
tiona
l 7.
2.1.
1
NoNo
NoNo
NoNo
No
119
7.2.
1 Re
new
able
ene
rgy s
hare
in th
e to
tal fi
nal e
nerg
y con
sum
ptio
nYe
sNo
NoNo
NoNo
NoNo
120
7.2.
1.1
Rene
wab
le e
nerg
y sha
re in
tota
l ene
rgy c
onsu
mpt
ion
No,
repl
aced
by
na
tiona
l 7.
3.1.
1.
7.3.
1.2
NoNo
NoNo
NoNo
No
121
7.3.
1.1
Ener
gy in
tens
ity o
f GDP
at c
urre
nt m
arke
t pric
esYe
sNo
NoNo
NoNo
NoNo
122
7.3.
1.2
Elec
tricit
y int
ensit
y of G
DPYe
sNo
NoNo
NoNo
NoNo
123
7.a.
1 In
tern
atio
nal fi
nanc
ial fl
ows
to d
evel
opin
g co
untri
es in
sup
port
of c
lean
ene
rgy
rese
arch
and
dev
elop
men
t an
d re
new
able
ene
rgy
prod
uctio
n, i
nclu
ding
in
hybr
id
syst
ems
NoNo
NoNo
NoNo
NoNo
124
7.b.
1 Inv
estm
ents
in en
ergy
efficie
ncy a
s a pr
opor
tion o
f GDP
and t
he am
ount
of fo
reig
n di
rect
inve
stm
ent i
n fin
ancia
l tra
nsfe
r for
infra
stru
ctur
e an
d te
chno
logy
to su
stai
nabl
e de
velo
pmen
t ser
vices
No,
repl
aced
by
na
tiona
l 7.
b.1.
1a
NoNo
NoNo
NoNo
No
125
7.b.
1.a
Fore
ign
dire
ct i
nves
tmen
t fo
r th
e ex
pans
ion
of e
nerg
y in
frast
ruct
ure
and
mod
erni
zatio
n of
tech
nolo
gy a
s pro
porti
on o
f tot
al vo
lum
e of
dire
ct fo
reig
n in
vest
men
t re
ceive
d Ye
sNo
NoNo
NoNo
NoNo
126
8.1.
1 An
nual
gro
wth
rate
of r
eal G
DP p
er ca
pita
Yes
NoNo
NoNo
NoNo
No
127
8.2.
1 An
nual
gro
wth
rate
of r
eal G
DP p
er e
mpl
oyed
per
son
Yes
NoNo
NoNo
NoNo
No
128
8.3.
1 Pr
opor
tion
of in
form
al e
mpl
oym
ent i
n no
n ag
ricul
ture
em
ploy
men
t, by
sex
No,
repl
aced
by
na
tiona
l 8.
3.1.
1 и
8.3.
1.2
NoNo
NoNo
NoNo
No
129
8.3.
1.1
Info
rmal
em
ploy
men
t di
sagg
rega
ted
by s
ex,
age,
urb
an/ru
ral
setti
ng,
and
sect
ors o
f the
eco
nom
y, in
cludi
ng a
gricu
lture
Yes
Yes
Yes
NoNo
NoNo
No
130
8.3.
1.2
Prop
ortio
n of
tot
al e
mpl
oyed
pop
ulat
ion
empl
oyed
in
smal
l an
d m
ediu
m
ente
rpris
esYe
sNo
NoNo
NoNo
NoNo
131
8.4.
1 M
ater
ial f
ootp
rint,
mat
eria
l foo
tprin
t per
capi
ta, a
nd m
ater
ial f
ootp
rint p
er G
DPNo
NoNo
NoNo
NoNo
No
132
8.4.
2 Do
mes
tic m
ater
ial c
onsu
mpt
ion,
dom
estic
mat
eria
l con
sum
ptio
n pe
r cap
ita, a
nd
dom
estic
mat
eria
l con
sum
ptio
n pe
r GDP
NoNo
NoNo
NoNo
NoNo
133
8.5.
1 Av
erag
e ho
urly
earn
ings
of f
emal
e an
d m
ale
empl
oyee
s, by
occ
upat
ion,
age
and
pe
rson
s with
disa
bilit
ies
No,
repl
aced
by
na
tiona
l 8.
5.1.
1
Yes
NoNo
NoNo
NoNo
134
8.5.
1.1
Aver
age
mon
thly
earn
ings
of w
omen
and
men
by o
ccup
atio
nYe
sYe
sNo
NoNo
NoNo
No
135
8.5.
2 Un
empl
oym
ent r
ate,
by s
ex, a
ge a
nd p
erso
ns w
ith d
isabi
litie
sYe
sYe
sYe
sYe
sNo
NoNo
No
136
8.6.
1 Pr
opor
tion
of yo
uth
(age
d 15
-24
year
s) no
t in
educ
atio
n, e
mpl
oym
ent o
r tra
inin
gYe
sYe
sYe
sNo
NoNo
NoNo
137
8.7.
1 Pr
opor
tion
and
num
ber o
f chi
ldre
n ag
ed 5
17
year
s en
gage
d in
chi
ld la
bour
, by
sex a
nd a
geYe
sYe
sYe
sYe
sYe
sYe
sYe
sYe
s
138
8.8.
1 Fr
eque
ncy
rate
s of
fata
l and
non
-fata
l occ
upat
iona
l inj
urie
s, by
sex
and
mig
rant
st
atus
Yes
Yes
NoYe
sNo
NoNo
No
139
8.8.
2 Le
vel
of n
atio
nal
com
plia
nce
of l
abou
r rig
hts
(free
dom
of
asso
ciatio
n an
d co
llect
ive b
arga
inin
g) b
ased
on
Inte
rnat
iona
l Lab
our O
rgan
izatio
n (IL
O) te
xtua
l sou
rces
an
d na
tiona
l leg
islat
ion,
by s
ex a
nd m
igra
nt st
atus
NoNo
NoNo
NoNo
NoNo
140
8.9.
1 To
urism
dire
ct G
DP a
s a p
ropo
rtion
of t
otal
GDP
and
in g
row
th ra
teNo
, re
plac
ed
by
natio
nal
8.9.
1.1
NoNo
NoNo
NoNo
No
141
8.9.
1.1
Dire
ct co
ntrib
utio
n of
tour
ism to
GDP
as a
pro
porti
on o
f tot
al G
DPYe
s No
NoNo
NoNo
NoNo
142
NoNo
NoNo
NoNo
NoNo
143
8.9.
2 Nu
mbe
r of j
obs i
n su
stai
nabl
e to
urism
indu
strie
s out
of t
otal
tour
ism jo
bsYe
sNo
NoNo
NoNo
NoNo
Appendix
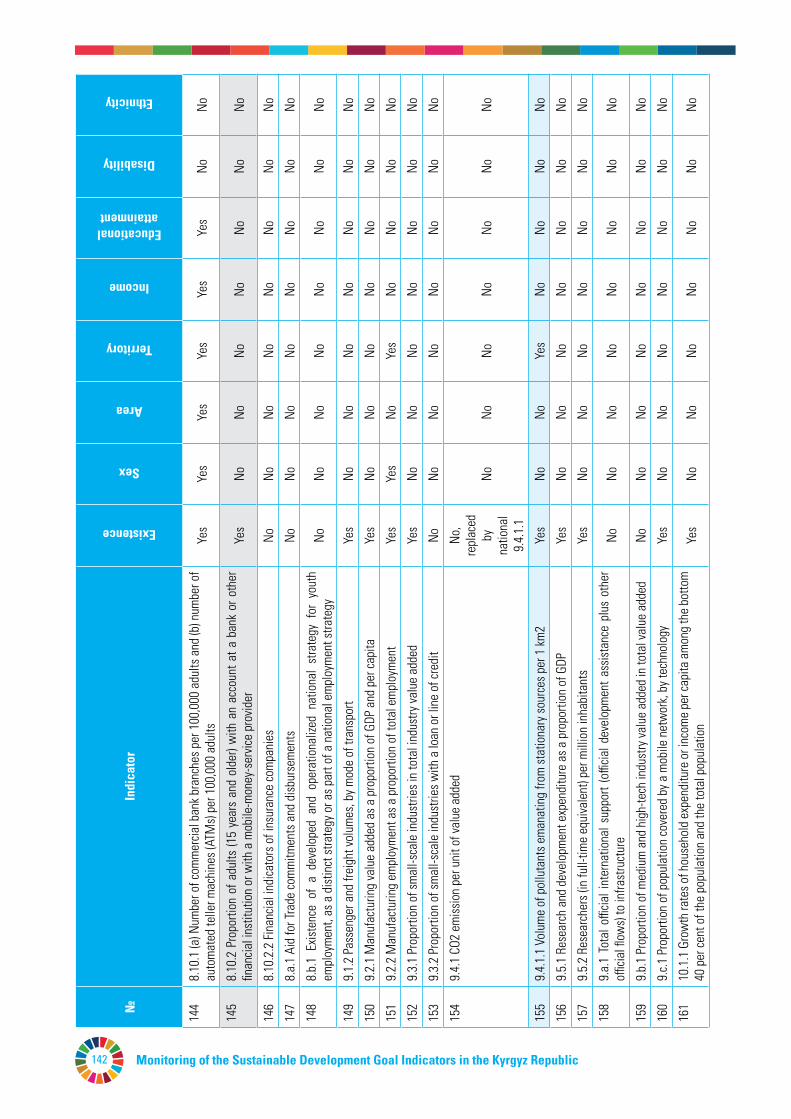
Monitoring of the Sustainable Development Goal Indicators in the Kyrgyz Republic142
№In
dica
tor
Existence
Sex
Агеa
Territory
Income
Educational attainment
Disability
Ethnicity
144
8.10
.1 (a
) Num
ber o
f com
mer
cial b
ank b
ranc
hes p
er 1
00,0
00 a
dults
and
(b) n
umbe
r of
auto
mat
ed te
ller m
achi
nes (
ATM
s) pe
r 100
,000
adu
ltsYe
sYe
sYe
sYe
sYe
sYe
sNo
No
145
8.10
.2 P
ropo
rtion
of a
dults
(15
year
s an
d ol
der)
with
an
acco
unt a
t a b
ank
or o
ther
fin
ancia
l ins
titut
ion
or w
ith a
mob
ile-m
oney
-ser
vice
prov
ider
Yes
NoNo
NoNo
NoNo
No
146
8.10
.2.2
Fina
ncia
l ind
icato
rs o
f ins
uran
ce co
mpa
nies
NoNo
NoNo
NoNo
NoNo
147
8.a.
1 Ai
d fo
r Tra
de co
mm
itmen
ts a
nd d
isbur
sem
ents
NoNo
NoNo
NoNo
NoNo
148
8.b.
1 Ex
isten
ce o
f a
deve
lope
d an
d op
erat
iona
lized
nat
iona
l st
rate
gy f
or y
outh
em
ploy
men
t, as
a d
istin
ct st
rate
gy o
r as p
art o
f a n
atio
nal e
mpl
oym
ent s
trate
gyNo
NoNo
NoNo
NoNo
No
149
9.1.
2 Pa
ssen
ger a
nd fr
eigh
t vol
umes
, by m
ode
of tr
ansp
ort
Yes
NoNo
NoNo
NoNo
No
150
9.2.
1 M
anuf
actu
ring
valu
e ad
ded
as a
pro
porti
on o
f GDP
and
per
capi
taYe
sNo
NoNo
NoNo
NoNo
151
9.2.
2 M
anuf
actu
ring
empl
oym
ent a
s a p
ropo
rtion
of t
otal
em
ploy
men
tYe
sYe
sNo
Yes
NoNo
NoNo
152
9.3.
1 Pr
opor
tion
of sm
all-s
cale
indu
strie
s in
tota
l ind
ustry
valu
e ad
ded
Yes
NoNo
NoNo
NoNo
No
153
9.3.
2 Pr
opor
tion
of sm
all-s
cale
indu
strie
s with
a lo
an o
r lin
e of
cred
itNo
NoNo
NoNo
NoNo
No
154
9.4.
1 CO
2 em
issio
n pe
r uni
t of v
alue
add
edNo
, re
plac
ed
by
natio
nal
9.4.
1.1
NoNo
NoNo
NoNo
No
155
9.4.
1.1
Volu
me
of p
ollu
tant
s em
anat
ing
from
stat
iona
ry so
urce
s per
1 km
2Ye
s No
NoYe
sNo
NoNo
No
156
9.5.
1 Re
sear
ch a
nd d
evel
opm
ent e
xpen
ditu
re a
s a p
ropo
rtion
of G
DPYe
sNo
NoNo
NoNo
NoNo
157
9.5.
2 Re
sear
cher
s (in
full-
time
equi
vale
nt) p
er m
illio
n in
habi
tant
sYe
sNo
NoNo
NoNo
NoNo
158
9.a.
1 To
tal o
fficia
l int
erna
tiona
l sup
port
(offi
cial d
evel
opm
ent a
ssist
ance
plu
s ot
her
officia
l flow
s) to
infra
stru
ctur
eNo
NoNo
NoNo
NoNo
No
159
9.b.
1 Pr
opor
tion
of m
ediu
m a
nd h
igh-
tech
indu
stry
valu
e ad
ded
in to
tal v
alue
add
edNo
NoNo
NoNo
NoNo
No
160
9.c.1
Pro
porti
on o
f pop
ulat
ion
cove
red
by a
mob
ile n
etw
ork,
by te
chno
logy
Yes
NoNo
NoNo
NoNo
No
161
10.1
.1 G
row
th ra
tes o
f hou
seho
ld e
xpen
ditu
re o
r inc
ome
per c
apita
am
ong
the
botto
m
40 p
er ce
nt o
f the
pop
ulat
ion
and
the
tota
l pop
ulat
ion
Yes
NoNo
NoNo
NoNo
No
162
10.2
.1 P
ropo
rtion
of p
eopl
e liv
ing
belo
w 5
0 pe
r cen
t of m
edia
n in
com
e, b
y sex
, age
and
pe
rson
s with
disa
bilit
ies
Yes
Yes
Yes
Yes
NoNo
NoNo
163
10.3
.1 P
ropo
rtion
of p
opul
atio
n re
porti
ng h
avin
g pe
rson
ally
felt
disc
rimin
ated
aga
inst
or
har
asse
d in
the
pre
vious
12
mon
ths
on t
he b
asis
of a
gro
und
of d
iscrim
inat
ion
proh
ibite
d un
der i
nter
natio
nal h
uman
righ
ts la
wYe
sYe
sYe
sYe
sYe
sYe
sYe
sYe
s
164
10.3
.1.1
а Nu
mbe
r of
app
eals
to t
he O
mbu
dsm
an, o
f th
ese
num
ber
revie
wed
and
sa
tisfie
dYe
sNo
NoNo
NoNo
NoNo
165
10.4
.1 La
bour
shar
e of
GDP
, com
prisi
ng w
ages
and
socia
l pro
tect
ion
trans
fers
Yes
NoNo
NoNo
NoNo
No
166
10.5
.1 Fi
nanc
ial S
ound
ness
Indi
cato
rsNo
, re
plac
ed
by
natio
nal
10.5
.1.1
NoNo
NoNo
NoNo
No
167
10.5
.1.1
Fina
ncia
l Sou
ndne
ss In
dica
tors
Yes
NoNo
NoNo
NoNo
No
168
10.6
.1 Pr
opor
tion o
f mem
bers
and v
otin
g rig
hts o
f dev
elop
ing c
ount
ries i
n int
erna
tiona
l or
gani
zatio
nsNo
NoNo
NoNo
NoNo
No
169
10.7
.1 R
ecru
itmen
t cos
t bor
ne b
y em
ploy
ee a
s a p
ropo
rtion
of m
onth
ly in
com
e ea
rned
in
coun
try o
f des
tinat
ion
NoNo
NoNo
NoNo
NoNo
170
10.7
.2 N
umbe
r of c
ount
ries w
ith m
igra
tion
polic
ies t
hat f
acili
tate
ord
erly,
safe
, reg
ular
an
d re
spon
sible
mig
ratio
n an
d m
obili
ty o
f peo
ple
NoNo
NoNo
NoNo
NoNo
171
10.a
.1 P
ropo
rtion
of t
ariff
line
s app
lied
to im
ports
from
leas
t dev
elop
ed co
untri
es a
nd
deve
lopi
ng co
untri
es w
ith ze
ro-ta
riffNo
NoNo
NoNo
NoNo
No
172
10.b
.1 T
otal
res
ourc
e flo
ws
for
deve
lopm
ent,
by r
ecip
ient
and
don
or c
ount
ries
and
type
of fl
ow (e
.g. o
fficia
l dev
elop
men
t ass
istan
ce, f
orei
gn d
irect
inve
stm
ent a
nd o
ther
flo
ws)
Yes
NoNo
NoNo
NoNo
No
173
10.c.
1 Re
mitt
ance
cost
s as a
pro
porti
on o
f the
am
ount
rem
itted
NoNo
NoNo
NoNo
NoNo
174
11.1
.1 P
ropo
rtion
of
urba
n po
pula
tion
livin
g in
slu
ms,
info
rmal
set
tlem
ents
or
inad
equa
te h
ousin
gNo
NoNo
NoNo
NoNo
No
175
11.2
.1 P
ropo
rtion
of p
opul
atio
n th
at h
as co
nven
ient
acc
ess t
o pu
blic
trans
port,
by s
ex,
age
and
pers
ons w
ith d
isabi
litie
sYe
sYe
sYe
sYe
sYe
sYe
sNo
No
176
11.3
.1 R
atio
of l
and
cons
umpt
ion
rate
to p
opul
atio
n gr
owth
rate
NoNo
NoNo
NoNo
NoNo
177
11.3
.2 P
ropo
rtion
of c
ities
with
a d
irect
par
ticip
atio
n st
ruct
ure
of ci
vil so
ciety
in u
rban
pl
anni
ng a
nd m
anag
emen
t tha
t ope
rate
regu
larly
and
dem
ocra
tical
lyNo
NoNo
NoNo
NoNo
No
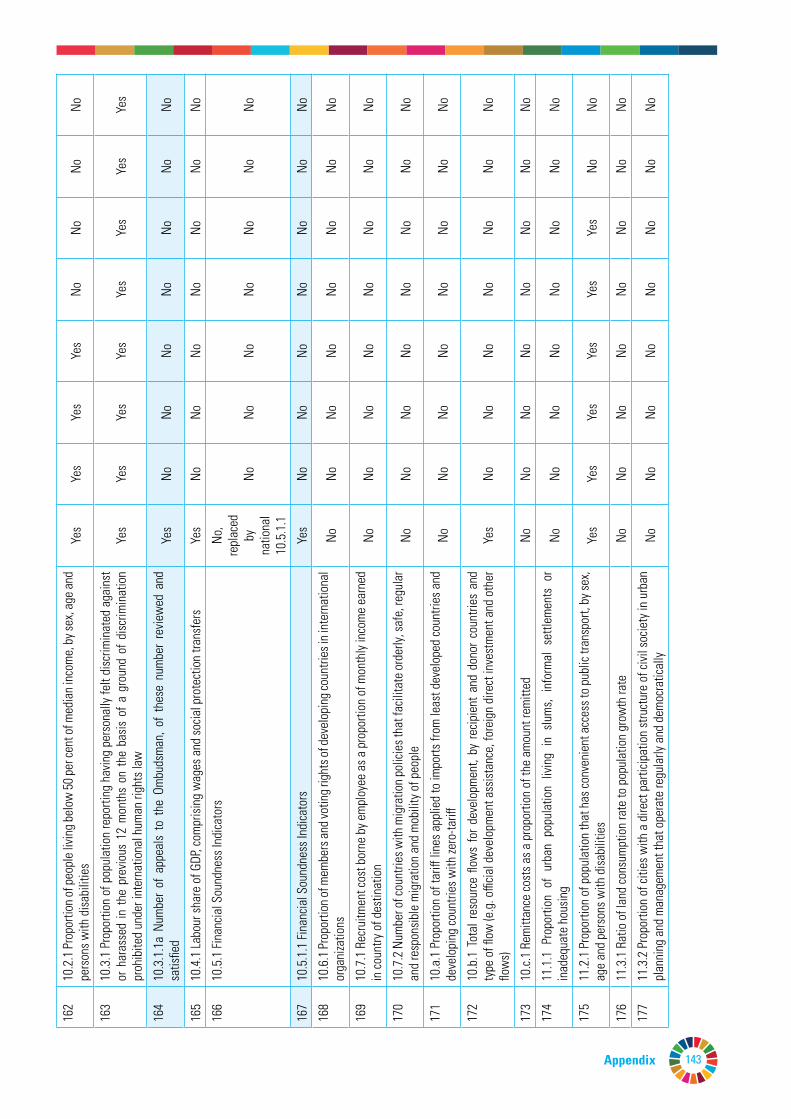
143
№In
dica
tor
Existence
Sex
Агеa
Territory
Income
Educational attainment
Disability
Ethnicity
144
8.10
.1 (a
) Num
ber o
f com
mer
cial b
ank b
ranc
hes p
er 1
00,0
00 a
dults
and
(b) n
umbe
r of
auto
mat
ed te
ller m
achi
nes (
ATM
s) pe
r 100
,000
adu
ltsYe
sYe
sYe
sYe
sYe
sYe
sNo
No
145
8.10
.2 P
ropo
rtion
of a
dults
(15
year
s an
d ol
der)
with
an
acco
unt a
t a b
ank
or o
ther
fin
ancia
l ins
titut
ion
or w
ith a
mob
ile-m
oney
-ser
vice
prov
ider
Yes
NoNo
NoNo
NoNo
No
146
8.10
.2.2
Fina
ncia
l ind
icato
rs o
f ins
uran
ce co
mpa
nies
NoNo
NoNo
NoNo
NoNo
147
8.a.
1 Ai
d fo
r Tra
de co
mm
itmen
ts a
nd d
isbur
sem
ents
NoNo
NoNo
NoNo
NoNo
148
8.b.
1 Ex
isten
ce o
f a
deve
lope
d an
d op
erat
iona
lized
nat
iona
l st
rate
gy f
or y
outh
em
ploy
men
t, as
a d
istin
ct st
rate
gy o
r as p
art o
f a n
atio
nal e
mpl
oym
ent s
trate
gyNo
NoNo
NoNo
NoNo
No
149
9.1.
2 Pa
ssen
ger a
nd fr
eigh
t vol
umes
, by m
ode
of tr
ansp
ort
Yes
NoNo
NoNo
NoNo
No
150
9.2.
1 M
anuf
actu
ring
valu
e ad
ded
as a
pro
porti
on o
f GDP
and
per
capi
taYe
sNo
NoNo
NoNo
NoNo
151
9.2.
2 M
anuf
actu
ring
empl
oym
ent a
s a p
ropo
rtion
of t
otal
em
ploy
men
tYe
sYe
sNo
Yes
NoNo
NoNo
152
9.3.
1 Pr
opor
tion
of sm
all-s
cale
indu
strie
s in
tota
l ind
ustry
valu
e ad
ded
Yes
NoNo
NoNo
NoNo
No
153
9.3.
2 Pr
opor
tion
of sm
all-s
cale
indu
strie
s with
a lo
an o
r lin
e of
cred
itNo
NoNo
NoNo
NoNo
No
154
9.4.
1 CO
2 em
issio
n pe
r uni
t of v
alue
add
edNo
, re
plac
ed
by
natio
nal
9.4.
1.1
NoNo
NoNo
NoNo
No
155
9.4.
1.1
Volu
me
of p
ollu
tant
s em
anat
ing
from
stat
iona
ry so
urce
s per
1 km
2Ye
s No
NoYe
sNo
NoNo
No
156
9.5.
1 Re
sear
ch a
nd d
evel
opm
ent e
xpen
ditu
re a
s a p
ropo
rtion
of G
DPYe
sNo
NoNo
NoNo
NoNo
157
9.5.
2 Re
sear
cher
s (in
full-
time
equi
vale
nt) p
er m
illio
n in
habi
tant
sYe
sNo
NoNo
NoNo
NoNo
158
9.a.
1 To
tal o
fficia
l int
erna
tiona
l sup
port
(offi
cial d
evel
opm
ent a
ssist
ance
plu
s ot
her
officia
l flow
s) to
infra
stru
ctur
eNo
NoNo
NoNo
NoNo
No
159
9.b.
1 Pr
opor
tion
of m
ediu
m a
nd h
igh-
tech
indu
stry
valu
e ad
ded
in to
tal v
alue
add
edNo
NoNo
NoNo
NoNo
No
160
9.c.1
Pro
porti
on o
f pop
ulat
ion
cove
red
by a
mob
ile n
etw
ork,
by te
chno
logy
Yes
NoNo
NoNo
NoNo
No
161
10.1
.1 G
row
th ra
tes o
f hou
seho
ld e
xpen
ditu
re o
r inc
ome
per c
apita
am
ong
the
botto
m
40 p
er ce
nt o
f the
pop
ulat
ion
and
the
tota
l pop
ulat
ion
Yes
NoNo
NoNo
NoNo
No
162
10.2
.1 P
ropo
rtion
of p
eopl
e liv
ing
belo
w 5
0 pe
r cen
t of m
edia
n in
com
e, b
y sex
, age
and
pe
rson
s with
disa
bilit
ies
Yes
Yes
Yes
Yes
NoNo
NoNo
163
10.3
.1 P
ropo
rtion
of p
opul
atio
n re
porti
ng h
avin
g pe
rson
ally
felt
disc
rimin
ated
aga
inst
or
har
asse
d in
the
pre
vious
12
mon
ths
on t
he b
asis
of a
gro
und
of d
iscrim
inat
ion
proh
ibite
d un
der i
nter
natio
nal h
uman
righ
ts la
wYe
sYe
sYe
sYe
sYe
sYe
sYe
sYe
s
164
10.3
.1.1
а Nu
mbe
r of
app
eals
to t
he O
mbu
dsm
an, o
f th
ese
num
ber
revie
wed
and
sa
tisfie
dYe
sNo
NoNo
NoNo
NoNo
165
10.4
.1 La
bour
shar
e of
GDP
, com
prisi
ng w
ages
and
socia
l pro
tect
ion
trans
fers
Yes
NoNo
NoNo
NoNo
No
166
10.5
.1 Fi
nanc
ial S
ound
ness
Indi
cato
rsNo
, re
plac
ed
by
natio
nal
10.5
.1.1
NoNo
NoNo
NoNo
No
167
10.5
.1.1
Fina
ncia
l Sou
ndne
ss In
dica
tors
Yes
NoNo
NoNo
NoNo
No
168
10.6
.1 Pr
opor
tion o
f mem
bers
and v
otin
g rig
hts o
f dev
elop
ing c
ount
ries i
n int
erna
tiona
l or
gani
zatio
nsNo
NoNo
NoNo
NoNo
No
169
10.7
.1 R
ecru
itmen
t cos
t bor
ne b
y em
ploy
ee a
s a p
ropo
rtion
of m
onth
ly in
com
e ea
rned
in
coun
try o
f des
tinat
ion
NoNo
NoNo
NoNo
NoNo
170
10.7
.2 N
umbe
r of c
ount
ries w
ith m
igra
tion
polic
ies t
hat f
acili
tate
ord
erly,
safe
, reg
ular
an
d re
spon
sible
mig
ratio
n an
d m
obili
ty o
f peo
ple
NoNo
NoNo
NoNo
NoNo
171
10.a
.1 P
ropo
rtion
of t
ariff
line
s app
lied
to im
ports
from
leas
t dev
elop
ed co
untri
es a
nd
deve
lopi
ng co
untri
es w
ith ze
ro-ta
riffNo
NoNo
NoNo
NoNo
No
172
10.b
.1 T
otal
res
ourc
e flo
ws
for
deve
lopm
ent,
by r
ecip
ient
and
don
or c
ount
ries
and
type
of fl
ow (e
.g. o
fficia
l dev
elop
men
t ass
istan
ce, f
orei
gn d
irect
inve
stm
ent a
nd o
ther
flo
ws)
Yes
NoNo
NoNo
NoNo
No
173
10.c.
1 Re
mitt
ance
cost
s as a
pro
porti
on o
f the
am
ount
rem
itted
NoNo
NoNo
NoNo
NoNo
174
11.1
.1 P
ropo
rtion
of
urba
n po
pula
tion
livin
g in
slu
ms,
info
rmal
set
tlem
ents
or
inad
equa
te h
ousin
gNo
NoNo
NoNo
NoNo
No
175
11.2
.1 P
ropo
rtion
of p
opul
atio
n th
at h
as co
nven
ient
acc
ess t
o pu
blic
trans
port,
by s
ex,
age
and
pers
ons w
ith d
isabi
litie
sYe
sYe
sYe
sYe
sYe
sYe
sNo
No
176
11.3
.1 R
atio
of l
and
cons
umpt
ion
rate
to p
opul
atio
n gr
owth
rate
NoNo
NoNo
NoNo
NoNo
177
11.3
.2 P
ropo
rtion
of c
ities
with
a d
irect
par
ticip
atio
n st
ruct
ure
of ci
vil so
ciety
in u
rban
pl
anni
ng a
nd m
anag
emen
t tha
t ope
rate
regu
larly
and
dem
ocra
tical
lyNo
NoNo
NoNo
NoNo
No
Appendix

Monitoring of the Sustainable Development Goal Indicators in the Kyrgyz Republic144
№In
dica
tor
Existence
Sex
Агеa
Territory
Income
Educational attainment
Disability
Ethnicity
178
11.4
.1 T
otal
exp
endi
ture
(pub
lic a
nd p
rivat
e) p
er c
apita
spe
nt o
n th
e pr
eser
vatio
n,
prot
ectio
n an
d co
nser
vatio
n of
all
cultu
ral a
nd n
atur
al h
erita
ge, b
y ty
pe o
f her
itage
(cu
ltura
l, na
tura
l, m
ixed
and
Wor
ld H
erita
ge C
entre
des
igna
tion)
, lev
el o
f gov
ernm
ent
(nat
iona
l, re
gion
al a
nd lo
cal/m
unici
pal),
type
of e
xpen
ditu
re (o
pera
ting
expe
nditu
re/
inve
stm
ent)
and
type
of p
rivat
e fu
ndin
g (d
onat
ions
in k
ind,
priv
ate
non-
profi
t sec
tor
and
spon
sors
hip)
NoNo
NoNo
NoNo
NoNo
179
11.5
.1 N
umbe
r of d
eath
s, m
issin
g pe
rson
s an
d di
rect
ly aff
ecte
d pe
rson
s at
tribu
ted
to
disa
ster
s per
100
,000
pop
ulat
ion
Yes
Yes
NoYe
sNo
NoNo
No
180
11.5
.2 D
irect
eco
nom
ic lo
ss in
rela
tion
to g
loba
l GDP
, dam
age
to cr
itica
l inf
rast
ruct
ure
and
num
ber o
f disr
uptio
ns to
bas
ic se
rvice
s, at
tribu
ted
to d
isast
ers
Yes
NoNo
Yes
NoNo
NoNo
181
11.6
.1 P
ropo
rtion
of u
rban
sol
id w
aste
regu
larly
col
lect
ed a
nd w
ith a
dequ
ate
final
di
scha
rge
out o
f tot
al u
rban
solid
was
te g
ener
ated
, by c
ities
No,
repl
aced
by
na
tiona
l 11
.6.1
.1 и
11
.6.1
.1а
NoNo
NoNo
NoNo
No
182
11.6
.1.1
Vol
ume
of so
lid w
aste
disp
osed
of
Yes
NoNo
Yes
NoNo
NoNo
183
11.6
.1.1
а Di
spos
al o
f mun
icipa
l sol
id w
aste
by
hous
ehol
ds b
y ty
pe (r
ubbi
sh c
hute
; co
llect
ion
by tr
uck,
cont
aine
r; du
mpi
ng o
n ru
bbish
hea
ps; i
ncin
erat
ion;
land
fill)
Yes
NoNo
Yes
NoNo
NoNo
184
11.6
.2 A
nnua
l mea
n le
vels
of fi
ne p
artic
ulat
e m
atte
r (e.
g. P
M2.
5 an
d PM
10) i
n cit
ies
(pop
ulat
ion
wei
ghte
d)No
NoNo
NoNo
NoNo
No
185
11.7
.1 A
vera
ge sh
are
of th
e bu
ilt-u
p ar
ea o
f citi
es th
at is
ope
n sp
ace
for p
ublic
use
for
all,
by se
x, ag
e an
d pe
rson
s with
disa
bilit
ies
No,
repl
aced
by
na
tiona
l 11
.7.1
.1а
NoNo
NoNo
NoNo
No
186
11.7
.1.1
а Ar
ea o
f gre
en s
pace
and
trac
ts o
f lan
d in
set
tlem
ents
per
1,0
00 p
eopl
e pe
r he
ctar
eYe
sNo
NoYe
sNo
NoNo
No
187
11.7
.2 P
ropo
rtion
of p
erso
ns v
ictim
of p
hysic
al o
r sex
ual h
aras
smen
t, by
sex
, age
, di
sabi
lity s
tatu
s and
pla
ce o
f occ
urre
nce,
in th
e pr
evio
us 1
2 m
onth
sNo
NoNo
NoNo
NoNo
No
188
11.a
.1 P
ropo
rtion
of
popu
latio
n liv
ing
in c
ities
tha
t im
plem
ent
urba
n an
d re
gion
al
deve
lopm
ent p
lans
inte
grat
ing
popu
latio
n pr
ojec
tions
and
reso
urce
nee
ds, b
y siz
e of
cit
yNo
NoNo
NoNo
NoNo
No
189
11.b
.1 N
umbe
r of c
ount
ries t
hat a
dopt
and
impl
emen
t nat
iona
l disa
ster
risk
redu
ctio
n st
rate
gies
in li
ne w
ith th
e Se
ndai
Fram
ewor
k for
Disa
ster
Risk
Red
uctio
n 20
15-2
030
Yes
NoNo
NoNo
NoNo
No
190
11.b
.2 P
ropo
rtion
of l
ocal
gov
ernm
ents
that
ado
pt a
nd im
plem
ent l
ocal
disa
ster
risk
re
duct
ion
stra
tegi
es in
line
with
nat
iona
l disa
ster
risk
redu
ctio
n st
rate
gies
NoNo
NoNo
NoNo
NoNo
191
11.c.
1 Pr
opor
tion
of fi
nanc
ial s
uppo
rt to
the
leas
t dev
elop
ed co
untri
es th
at is
allo
cate
d to
the
con
stru
ctio
n an
d re
trofit
ting
of s
usta
inab
le,
resil
ient
and
res
ourc
e-effi
cient
bu
ildin
gs u
tilizi
ng lo
cal m
ater
ials
NoNo
NoNo
NoNo
NoNo
192
12.1
.1 N
umbe
r of
cou
ntrie
s w
ith s
usta
inab
le c
onsu
mpt
ion
and
prod
uctio
n (S
CP)
natio
nal a
ctio
n pl
ans
or S
CP m
ains
tream
ed a
s a
prio
rity
or a
tar
get
into
nat
iona
l po
licie
sYe
sNo
NoNo
NoNo
NoNo
193
12.2
.1 M
ater
ial f
ootp
rint,
mat
eria
l foo
tprin
t per
capi
ta, a
nd m
ater
ial f
ootp
rint p
er G
DPNo
NoNo
NoNo
NoNo
No
194
12.2
.2 D
omes
tic m
ater
ial c
onsu
mpt
ion,
dom
estic
mat
eria
l con
sum
ptio
n pe
r ca
pita
, an
d do
mes
tic m
ater
ial c
onsu
mpt
ion
per G
DPNo
NoNo
NoNo
NoNo
No
195
12.3
.1 (a
) Foo
d lo
ss in
dex a
nd (b
) foo
d w
aste
inde
xNo
NoNo
NoNo
NoNo
No
196
12.4
.1 N
umbe
r of p
artie
s to
inte
rnat
iona
l mul
tilat
eral
env
ironm
enta
l agr
eem
ents
on
haza
rdou
s w
aste
, and
oth
er c
hem
icals
that
mee
t the
ir co
mm
itmen
ts a
nd o
blig
atio
ns
in tr
ansm
ittin
g in
form
atio
n as
requ
ired
by e
ach
rele
vant
agr
eem
ent
Yes
NoNo
NoNo
NoNo
No
197
12.4
.2 H
azar
dous
was
te g
ener
ated
per
cap
ita a
nd p
ropo
rtion
of
haza
rdou
s w
aste
tre
ated
, by t
ype
of tr
eatm
ent
Yes
NoNo
NoNo
NoNo
No
198
12.5
.1 N
atio
nal r
ecyc
ling
rate
, ton
s of m
ater
ial r
ecyc
led
NoNo
NoNo
NoNo
NoNo
199
12.6
.1 N
umbe
r of c
ompa
nies
pub
lishi
ng su
stai
nabi
lity r
epor
tsNo
NoNo
NoNo
NoNo
No
200
12.7
.1 N
umbe
r of c
ount
ries i
mpl
emen
ting
sust
aina
ble
publ
ic pr
ocur
emen
t pol
icies
and
ac
tion
plan
sNo
NoNo
NoNo
NoNo
No
201
12.8
.1 E
xten
t to
whi
ch (i
) glo
bal c
itize
nshi
p ed
ucat
ion
and
(ii) e
duca
tion
for s
usta
inab
le
deve
lopm
ent (
inclu
ding
clim
ate
chan
ge e
duca
tion)
are
mai
nstre
amed
in (a
) nat
iona
l ed
ucat
ion
polic
ies;
(b) c
urric
ula;
(c) t
each
er e
duca
tion;
and
(d) s
tude
nt a
sses
smen
tYe
sNo
NoNo
NoNo
NoNo
202
12.a
.1 A
mou
nt o
f sup
port
to d
evel
opin
g co
untri
es o
n re
sear
ch a
nd d
evel
opm
ent f
or
sust
aina
ble
cons
umpt
ion
and
prod
uctio
n an
d en
viron
men
tally
soun
d te
chno
logi
esNo
NoNo
NoNo
NoNo
No
203
12.b
.1 N
umbe
r of s
usta
inab
le to
urism
stra
tegi
es o
r pol
icies
and
impl
emen
ted
actio
n pl
ans w
ith a
gree
d m
onito
ring
and
eval
uatio
n to
ols
Yes
NoNo
NoNo
NoNo
No
204
12.c.
1 Am
ount
of f
ossil
-fuel
subs
idie
s per
uni
t of G
DP (p
rodu
ctio
n an
d co
nsum
ptio
n) a
nd
as a
pro
porti
on o
f tot
al n
atio
nal e
xpen
ditu
re o
n fo
ssil
fuel
sNo
NoNo
NoNo
NoNo
No
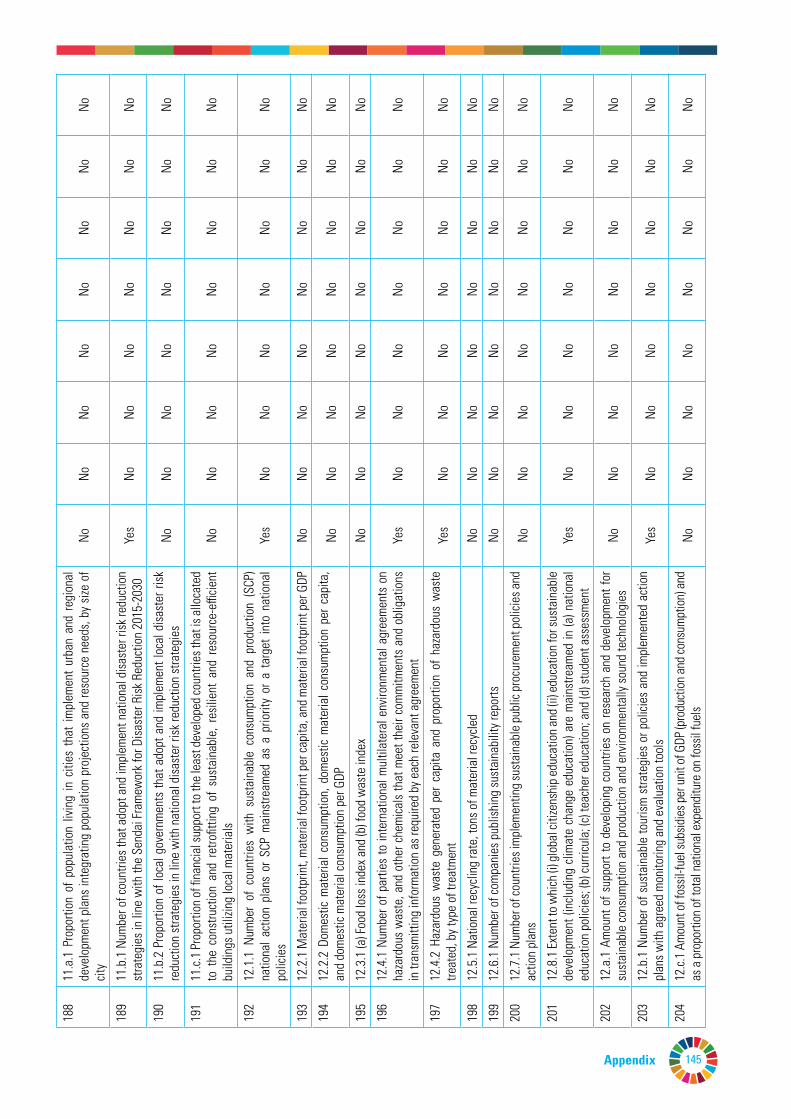
145
№In
dica
tor
Existence
Sex
Агеa
Territory
Income
Educational attainment
Disability
Ethnicity
178
11.4
.1 T
otal
exp
endi
ture
(pub
lic a
nd p
rivat
e) p
er c
apita
spe
nt o
n th
e pr
eser
vatio
n,
prot
ectio
n an
d co
nser
vatio
n of
all
cultu
ral a
nd n
atur
al h
erita
ge, b
y ty
pe o
f her
itage
(cu
ltura
l, na
tura
l, m
ixed
and
Wor
ld H
erita
ge C
entre
des
igna
tion)
, lev
el o
f gov
ernm
ent
(nat
iona
l, re
gion
al a
nd lo
cal/m
unici
pal),
type
of e
xpen
ditu
re (o
pera
ting
expe
nditu
re/
inve
stm
ent)
and
type
of p
rivat
e fu
ndin
g (d
onat
ions
in k
ind,
priv
ate
non-
profi
t sec
tor
and
spon
sors
hip)
NoNo
NoNo
NoNo
NoNo
179
11.5
.1 N
umbe
r of d
eath
s, m
issin
g pe
rson
s an
d di
rect
ly aff
ecte
d pe
rson
s at
tribu
ted
to
disa
ster
s per
100
,000
pop
ulat
ion
Yes
Yes
NoYe
sNo
NoNo
No
180
11.5
.2 D
irect
eco
nom
ic lo
ss in
rela
tion
to g
loba
l GDP
, dam
age
to cr
itica
l inf
rast
ruct
ure
and
num
ber o
f disr
uptio
ns to
bas
ic se
rvice
s, at
tribu
ted
to d
isast
ers
Yes
NoNo
Yes
NoNo
NoNo
181
11.6
.1 P
ropo
rtion
of u
rban
sol
id w
aste
regu
larly
col
lect
ed a
nd w
ith a
dequ
ate
final
di
scha
rge
out o
f tot
al u
rban
solid
was
te g
ener
ated
, by c
ities
No,
repl
aced
by
na
tiona
l 11
.6.1
.1 и
11
.6.1
.1а
NoNo
NoNo
NoNo
No
182
11.6
.1.1
Vol
ume
of so
lid w
aste
disp
osed
of
Yes
NoNo
Yes
NoNo
NoNo
183
11.6
.1.1
а Di
spos
al o
f mun
icipa
l sol
id w
aste
by
hous
ehol
ds b
y ty
pe (r
ubbi
sh c
hute
; co
llect
ion
by tr
uck,
cont
aine
r; du
mpi
ng o
n ru
bbish
hea
ps; i
ncin
erat
ion;
land
fill)
Yes
NoNo
Yes
NoNo
NoNo
184
11.6
.2 A
nnua
l mea
n le
vels
of fi
ne p
artic
ulat
e m
atte
r (e.
g. P
M2.
5 an
d PM
10) i
n cit
ies
(pop
ulat
ion
wei
ghte
d)No
NoNo
NoNo
NoNo
No
185
11.7
.1 A
vera
ge sh
are
of th
e bu
ilt-u
p ar
ea o
f citi
es th
at is
ope
n sp
ace
for p
ublic
use
for
all,
by se
x, ag
e an
d pe
rson
s with
disa
bilit
ies
No,
repl
aced
by
na
tiona
l 11
.7.1
.1а
NoNo
NoNo
NoNo
No
186
11.7
.1.1
а Ar
ea o
f gre
en s
pace
and
trac
ts o
f lan
d in
set
tlem
ents
per
1,0
00 p
eopl
e pe
r he
ctar
eYe
sNo
NoYe
sNo
NoNo
No
187
11.7
.2 P
ropo
rtion
of p
erso
ns v
ictim
of p
hysic
al o
r sex
ual h
aras
smen
t, by
sex
, age
, di
sabi
lity s
tatu
s and
pla
ce o
f occ
urre
nce,
in th
e pr
evio
us 1
2 m
onth
sNo
NoNo
NoNo
NoNo
No
188
11.a
.1 P
ropo
rtion
of
popu
latio
n liv
ing
in c
ities
tha
t im
plem
ent
urba
n an
d re
gion
al
deve
lopm
ent p
lans
inte
grat
ing
popu
latio
n pr
ojec
tions
and
reso
urce
nee
ds, b
y siz
e of
cit
yNo
NoNo
NoNo
NoNo
No
189
11.b
.1 N
umbe
r of c
ount
ries t
hat a
dopt
and
impl
emen
t nat
iona
l disa
ster
risk
redu
ctio
n st
rate
gies
in li
ne w
ith th
e Se
ndai
Fram
ewor
k for
Disa
ster
Risk
Red
uctio
n 20
15-2
030
Yes
NoNo
NoNo
NoNo
No
190
11.b
.2 P
ropo
rtion
of l
ocal
gov
ernm
ents
that
ado
pt a
nd im
plem
ent l
ocal
disa
ster
risk
re
duct
ion
stra
tegi
es in
line
with
nat
iona
l disa
ster
risk
redu
ctio
n st
rate
gies
NoNo
NoNo
NoNo
NoNo
191
11.c.
1 Pr
opor
tion
of fi
nanc
ial s
uppo
rt to
the
leas
t dev
elop
ed co
untri
es th
at is
allo
cate
d to
the
con
stru
ctio
n an
d re
trofit
ting
of s
usta
inab
le,
resil
ient
and
res
ourc
e-effi
cient
bu
ildin
gs u
tilizi
ng lo
cal m
ater
ials
NoNo
NoNo
NoNo
NoNo
192
12.1
.1 N
umbe
r of
cou
ntrie
s w
ith s
usta
inab
le c
onsu
mpt
ion
and
prod
uctio
n (S
CP)
natio
nal a
ctio
n pl
ans
or S
CP m
ains
tream
ed a
s a
prio
rity
or a
tar
get
into
nat
iona
l po
licie
sYe
sNo
NoNo
NoNo
NoNo
193
12.2
.1 M
ater
ial f
ootp
rint,
mat
eria
l foo
tprin
t per
capi
ta, a
nd m
ater
ial f
ootp
rint p
er G
DPNo
NoNo
NoNo
NoNo
No
194
12.2
.2 D
omes
tic m
ater
ial c
onsu
mpt
ion,
dom
estic
mat
eria
l con
sum
ptio
n pe
r ca
pita
, an
d do
mes
tic m
ater
ial c
onsu
mpt
ion
per G
DPNo
NoNo
NoNo
NoNo
No
195
12.3
.1 (a
) Foo
d lo
ss in
dex a
nd (b
) foo
d w
aste
inde
xNo
NoNo
NoNo
NoNo
No
196
12.4
.1 N
umbe
r of p
artie
s to
inte
rnat
iona
l mul
tilat
eral
env
ironm
enta
l agr
eem
ents
on
haza
rdou
s w
aste
, and
oth
er c
hem
icals
that
mee
t the
ir co
mm
itmen
ts a
nd o
blig
atio
ns
in tr
ansm
ittin
g in
form
atio
n as
requ
ired
by e
ach
rele
vant
agr
eem
ent
Yes
NoNo
NoNo
NoNo
No
197
12.4
.2 H
azar
dous
was
te g
ener
ated
per
cap
ita a
nd p
ropo
rtion
of
haza
rdou
s w
aste
tre
ated
, by t
ype
of tr
eatm
ent
Yes
NoNo
NoNo
NoNo
No
198
12.5
.1 N
atio
nal r
ecyc
ling
rate
, ton
s of m
ater
ial r
ecyc
led
NoNo
NoNo
NoNo
NoNo
199
12.6
.1 N
umbe
r of c
ompa
nies
pub
lishi
ng su
stai
nabi
lity r
epor
tsNo
NoNo
NoNo
NoNo
No
200
12.7
.1 N
umbe
r of c
ount
ries i
mpl
emen
ting
sust
aina
ble
publ
ic pr
ocur
emen
t pol
icies
and
ac
tion
plan
sNo
NoNo
NoNo
NoNo
No
201
12.8
.1 E
xten
t to
whi
ch (i
) glo
bal c
itize
nshi
p ed
ucat
ion
and
(ii) e
duca
tion
for s
usta
inab
le
deve
lopm
ent (
inclu
ding
clim
ate
chan
ge e
duca
tion)
are
mai
nstre
amed
in (a
) nat
iona
l ed
ucat
ion
polic
ies;
(b) c
urric
ula;
(c) t
each
er e
duca
tion;
and
(d) s
tude
nt a
sses
smen
tYe
sNo
NoNo
NoNo
NoNo
202
12.a
.1 A
mou
nt o
f sup
port
to d
evel
opin
g co
untri
es o
n re
sear
ch a
nd d
evel
opm
ent f
or
sust
aina
ble
cons
umpt
ion
and
prod
uctio
n an
d en
viron
men
tally
soun
d te
chno
logi
esNo
NoNo
NoNo
NoNo
No
203
12.b
.1 N
umbe
r of s
usta
inab
le to
urism
stra
tegi
es o
r pol
icies
and
impl
emen
ted
actio
n pl
ans w
ith a
gree
d m
onito
ring
and
eval
uatio
n to
ols
Yes
NoNo
NoNo
NoNo
No
204
12.c.
1 Am
ount
of f
ossil
-fuel
subs
idie
s per
uni
t of G
DP (p
rodu
ctio
n an
d co
nsum
ptio
n) a
nd
as a
pro
porti
on o
f tot
al n
atio
nal e
xpen
ditu
re o
n fo
ssil
fuel
sNo
NoNo
NoNo
NoNo
No
Appendix
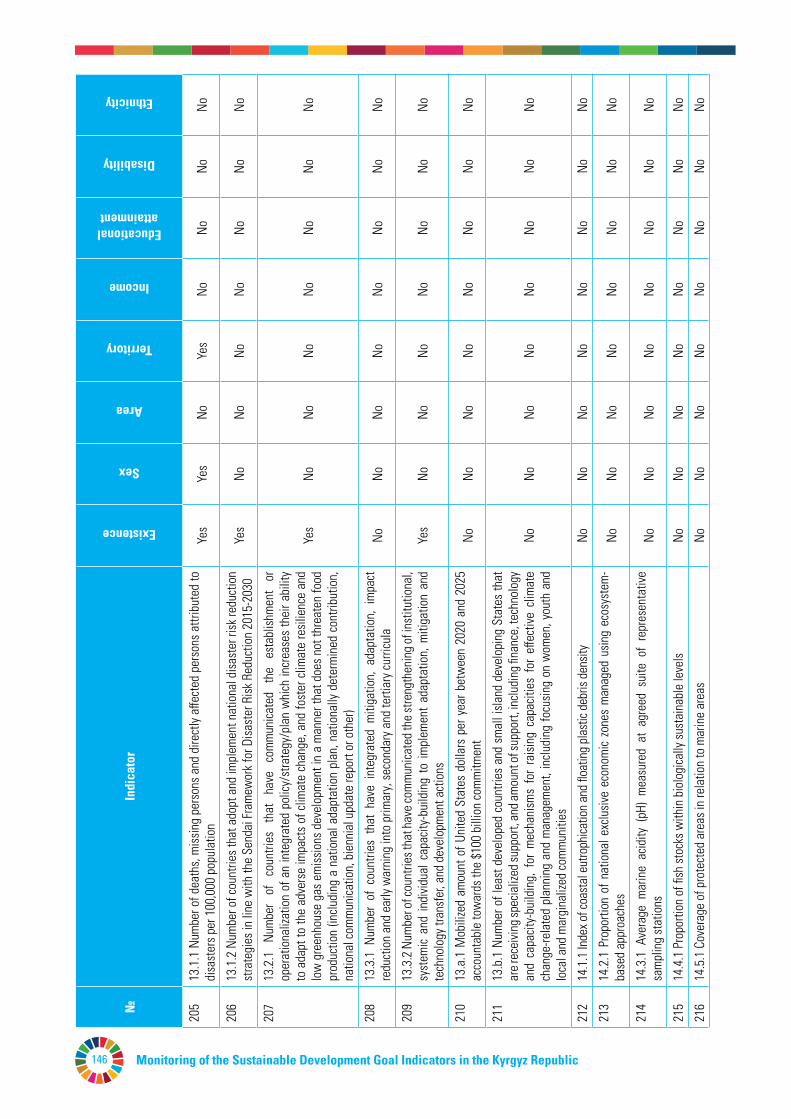
Monitoring of the Sustainable Development Goal Indicators in the Kyrgyz Republic146
№In
dica
tor
Existence
Sex
Агеa
Territory
Income
Educational attainment
Disability
Ethnicity
205
13.1
.1 N
umbe
r of d
eath
s, m
issin
g pe
rson
s an
d di
rect
ly aff
ecte
d pe
rson
s at
tribu
ted
to
disa
ster
s per
100
,000
pop
ulat
ion
Yes
Yes
NoYe
sNo
NoNo
No
206
13.1
.2 N
umbe
r of c
ount
ries t
hat a
dopt
and
impl
emen
t nat
iona
l disa
ster
risk
redu
ctio
n st
rate
gies
in li
ne w
ith th
e Se
ndai
Fram
ewor
k for
Disa
ster
Risk
Red
uctio
n 20
15-2
030
Yes
NoNo
NoNo
NoNo
No
207
13.2
.1
Num
ber
of
coun
tries
th
at
have
co
mm
unica
ted
the
esta
blish
men
t or
op
erat
iona
lizat
ion
of a
n in
tegr
ated
pol
icy/s
trate
gy/p
lan
whi
ch in
crea
ses
thei
r abi
lity
to a
dapt
to th
e ad
vers
e im
pact
s of
clim
ate
chan
ge, a
nd fo
ster
clim
ate
resil
ienc
e an
d lo
w g
reen
hous
e ga
s em
issio
ns d
evel
opm
ent i
n a
man
ner t
hat d
oes
not t
hrea
ten
food
pr
oduc
tion
(inclu
ding
a n
atio
nal a
dapt
atio
n pl
an, n
atio
nally
det
erm
ined
con
tribu
tion,
na
tiona
l com
mun
icatio
n, b
ienn
ial u
pdat
e re
port
or o
ther
)
Yes
NoNo
NoNo
NoNo
No
208
13.3
.1 N
umbe
r of
cou
ntrie
s th
at h
ave
inte
grat
ed m
itiga
tion,
ada
ptat
ion,
im
pact
re
duct
ion
and
early
war
ning
into
prim
ary,
seco
ndar
y and
terti
ary c
urric
ula
NoNo
NoNo
NoNo
NoNo
209
13.3
.2 N
umbe
r of c
ount
ries t
hat h
ave c
omm
unica
ted t
he st
reng
then
ing o
f ins
titut
iona
l, sy
stem
ic an
d in
divid
ual c
apac
ity-b
uild
ing
to im
plem
ent
adap
tatio
n, m
itiga
tion
and
tech
nolo
gy tr
ansf
er, a
nd d
evel
opm
ent a
ctio
nsYe
sNo
NoNo
NoNo
NoNo
210
13.a
.1 M
obili
zed
amou
nt o
f Uni
ted
Stat
es d
olla
rs p
er y
ear b
etw
een
2020
and
202
5 ac
coun
tabl
e to
war
ds th
e $1
00 b
illio
n co
mm
itmen
tNo
NoNo
NoNo
NoNo
No
211
13.b
.1 N
umbe
r of l
east
dev
elop
ed c
ount
ries
and
smal
l isla
nd d
evel
opin
g St
ates
that
ar
e rec
eivin
g spe
cializ
ed su
ppor
t, an
d am
ount
of su
ppor
t, in
cludi
ng fin
ance
, tec
hnol
ogy
and
capa
city-
build
ing,
for
mec
hani
sms
for
raisi
ng c
apac
ities
for
effe
ctive
clim
ate
chan
ge-re
late
d pl
anni
ng a
nd m
anag
emen
t, in
cludi
ng fo
cusin
g on
wom
en, y
outh
and
lo
cal a
nd m
argi
naliz
ed co
mm
uniti
es
NoNo
NoNo
NoNo
NoNo
212
14.1
.1 In
dex o
f coa
stal
eut
roph
icatio
n an
d flo
atin
g pl
astic
deb
ris d
ensit
yNo
NoNo
NoNo
NoNo
No
213
14.2
.1 P
ropo
rtion
of n
atio
nal e
xclu
sive
econ
omic
zone
s m
anag
ed u
sing
ecos
yste
m-
base
d ap
proa
ches
NoNo
NoNo
NoNo
NoNo
214
14.3
.1 A
vera
ge m
arin
e ac
idity
(pH
) m
easu
red
at a
gree
d su
ite o
f re
pres
enta
tive
sam
plin
g st
atio
nsNo
NoNo
NoNo
NoNo
No
215
14.4
.1 P
ropo
rtion
of fi
sh st
ocks
with
in b
iolo
gica
lly su
stai
nabl
e le
vels
NoNo
NoNo
NoNo
NoNo
216
14.5
.1 C
over
age
of p
rote
cted
are
as in
rela
tion
to m
arin
e ar
eas
NoNo
NoNo
NoNo
NoNo
217
14.6
.1 D
egre
e of
im
plem
enta
tion
of i
nter
natio
nal
inst
rum
ents
aim
ing
to c
omba
t ill
egal
, unr
epor
ted
and
unre
gula
ted
fishi
ngNo
NoNo
NoNo
NoNo
No
218
14.7
.1 S
usta
inab
le fi
sher
ies a
s a p
ropo
rtion
of G
DP in
smal
l isla
nd d
evel
opin
g St
ates
, le
ast d
evel
oped
coun
tries
and
all
coun
tries
NoNo
NoNo
NoNo
NoNo
219
14.a
.1 P
ropo
rtion
of t
otal
rese
arch
bud
get a
lloca
ted
to re
sear
ch in
the
field
of m
arin
e te
chno
logy
NoNo
NoNo
NoNo
NoNo
220
14.b
.1 D
egre
e of
app
licat
ion
of a
leg
al/re
gula
tory
/ po
licy/
inst
itutio
nal
fram
ewor
k w
hich
reco
gnize
s and
pro
tect
s acc
ess r
ight
s for
smal
l-sca
le fi
sher
ies
NoNo
NoNo
NoNo
NoNo
221
14.c.
1 Nu
mbe
r of c
ount
ries m
akin
g pr
ogre
ss in
ratif
ying,
acc
eptin
g an
d im
plem
entin
g th
roug
h le
gal,
polic
y an
d in
stitu
tiona
l fra
mew
orks
, oce
an-re
late
d in
stru
men
ts t
hat
impl
emen
t int
erna
tiona
l law
, as r
eflec
ted
in th
e Un
ited
Natio
n Co
nven
tion
on th
e La
w
of th
e Se
a, fo
r the
cons
erva
tion
and
sust
aina
ble
use
of th
e oc
eans
and
thei
r res
ourc
es
NoNo
NoNo
NoNo
NoNo
222
15.1
.1 Fo
rest
are
a as
a p
ropo
rtion
of t
otal
land
are
aNo
, re
plac
ed
by
natio
nal
15.1
.1.1
NoNo
NoNo
NoNo
No
223
15.1
.1.1
Fore
st a
rea
as a
pro
porti
on o
f tot
al la
nd a
rea
Yes
NoNo
Yes
NoNo
NoNo
224
15.1
.2 P
ropo
rtion
of i
mpo
rtant
site
s for
terre
stria
l and
fres
hwat
er b
iodi
vers
ity th
at a
re
cove
red
by p
rote
cted
are
as, b
y eco
syst
em ty
peYe
sNo
NoNo
NoNo
NoNo
225
15.1
.2.1
Size
of p
rote
cted
are
as (n
atio
nal n
atur
e re
serv
es a
nd p
arks
) out
of t
he e
ntire
co
untry
’s ar
eaYe
sNo
NoYe
sNo
NoNo
No
226
15.2
.1 P
rogr
ess t
owar
ds su
stai
nabl
e fo
rest
man
agem
ent
Yes
NoNo
NoNo
NoNo
No
227
15.3
.1 P
ropo
rtion
of l
and
that
is d
egra
ded
over
tota
l lan
d ar
eaNo
, re
plac
ed
by
natio
nal
15.3
.1.1
NoNo
NoNo
NoNo
No
228
15.3
.1.1
Ara
ble
land
by r
easo
ns fo
r non
-use
Yes
NoNo
NoNo
NoNo
No
229
15.4
.1 C
over
age
by p
rote
cted
are
as o
f im
porta
nt si
tes f
or m
ount
ain
biod
ivers
ityYe
sNo
NoNo
NoNo
NoNo
230
15.4
.2 M
ount
ain
Gree
n Co
ver I
ndex
NoNo
NoNo
NoNo
NoNo
231
15.5
.1 R
ed Li
st In
dex
No,
repl
aced
by
na
tiona
l 15
.5.1
.1
NoNo
NoNo
NoNo
No
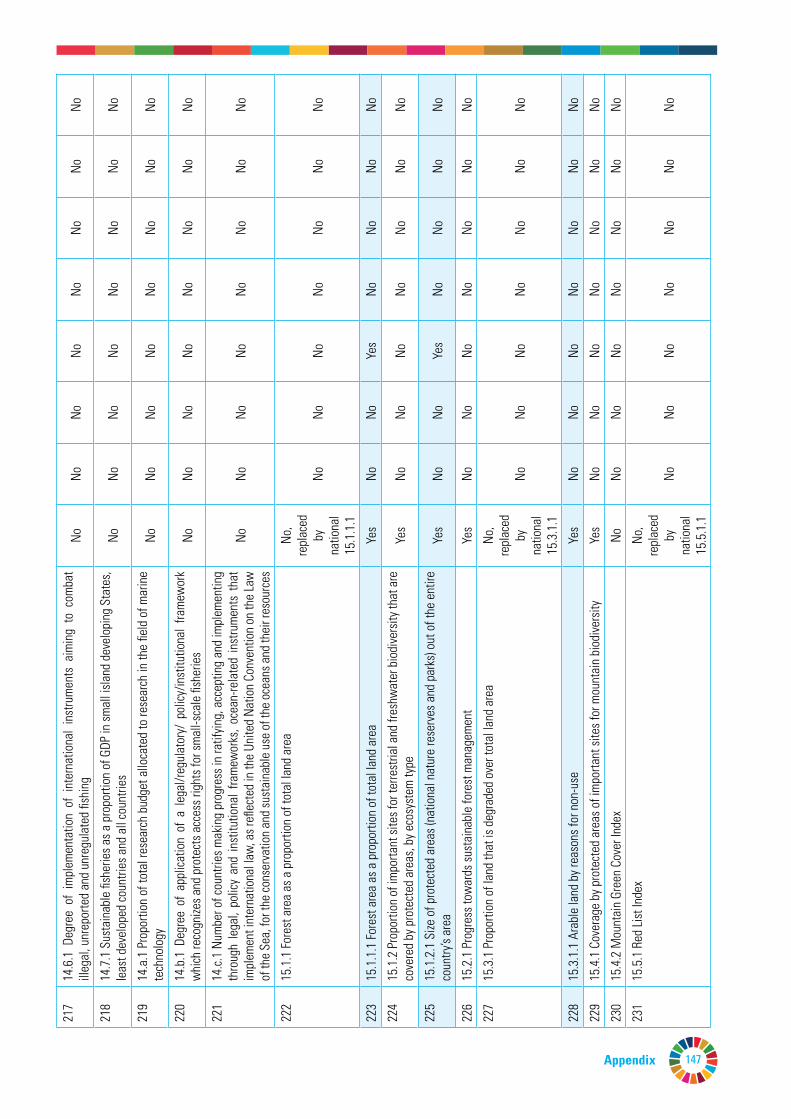
147Appendix
№In
dica
tor
Existence
Sex
Агеa
Territory
Income
Educational attainment
Disability
Ethnicity
205
13.1
.1 N
umbe
r of d
eath
s, m
issin
g pe
rson
s an
d di
rect
ly aff
ecte
d pe
rson
s at
tribu
ted
to
disa
ster
s per
100
,000
pop
ulat
ion
Yes
Yes
NoYe
sNo
NoNo
No
206
13.1
.2 N
umbe
r of c
ount
ries t
hat a
dopt
and
impl
emen
t nat
iona
l disa
ster
risk
redu
ctio
n st
rate
gies
in li
ne w
ith th
e Se
ndai
Fram
ewor
k for
Disa
ster
Risk
Red
uctio
n 20
15-2
030
Yes
NoNo
NoNo
NoNo
No
207
13.2
.1
Num
ber
of
coun
tries
th
at
have
co
mm
unica
ted
the
esta
blish
men
t or
op
erat
iona
lizat
ion
of a
n in
tegr
ated
pol
icy/s
trate
gy/p
lan
whi
ch in
crea
ses
thei
r abi
lity
to a
dapt
to th
e ad
vers
e im
pact
s of
clim
ate
chan
ge, a
nd fo
ster
clim
ate
resil
ienc
e an
d lo
w g
reen
hous
e ga
s em
issio
ns d
evel
opm
ent i
n a
man
ner t
hat d
oes
not t
hrea
ten
food
pr
oduc
tion
(inclu
ding
a n
atio
nal a
dapt
atio
n pl
an, n
atio
nally
det
erm
ined
con
tribu
tion,
na
tiona
l com
mun
icatio
n, b
ienn
ial u
pdat
e re
port
or o
ther
)
Yes
NoNo
NoNo
NoNo
No
208
13.3
.1 N
umbe
r of
cou
ntrie
s th
at h
ave
inte
grat
ed m
itiga
tion,
ada
ptat
ion,
im
pact
re
duct
ion
and
early
war
ning
into
prim
ary,
seco
ndar
y and
terti
ary c
urric
ula
NoNo
NoNo
NoNo
NoNo
209
13.3
.2 N
umbe
r of c
ount
ries t
hat h
ave c
omm
unica
ted t
he st
reng
then
ing o
f ins
titut
iona
l, sy
stem
ic an
d in
divid
ual c
apac
ity-b
uild
ing
to im
plem
ent
adap
tatio
n, m
itiga
tion
and
tech
nolo
gy tr
ansf
er, a
nd d
evel
opm
ent a
ctio
nsYe
sNo
NoNo
NoNo
NoNo
210
13.a
.1 M
obili
zed
amou
nt o
f Uni
ted
Stat
es d
olla
rs p
er y
ear b
etw
een
2020
and
202
5 ac
coun
tabl
e to
war
ds th
e $1
00 b
illio
n co
mm
itmen
tNo
NoNo
NoNo
NoNo
No
211
13.b
.1 N
umbe
r of l
east
dev
elop
ed c
ount
ries
and
smal
l isla
nd d
evel
opin
g St
ates
that
ar
e rec
eivin
g spe
cializ
ed su
ppor
t, an
d am
ount
of su
ppor
t, in
cludi
ng fin
ance
, tec
hnol
ogy
and
capa
city-
build
ing,
for
mec
hani
sms
for
raisi
ng c
apac
ities
for
effe
ctive
clim
ate
chan
ge-re
late
d pl
anni
ng a
nd m
anag
emen
t, in
cludi
ng fo
cusin
g on
wom
en, y
outh
and
lo
cal a
nd m
argi
naliz
ed co
mm
uniti
es
NoNo
NoNo
NoNo
NoNo
212
14.1
.1 In
dex o
f coa
stal
eut
roph
icatio
n an
d flo
atin
g pl
astic
deb
ris d
ensit
yNo
NoNo
NoNo
NoNo
No
213
14.2
.1 P
ropo
rtion
of n
atio
nal e
xclu
sive
econ
omic
zone
s m
anag
ed u
sing
ecos
yste
m-
base
d ap
proa
ches
NoNo
NoNo
NoNo
NoNo
214
14.3
.1 A
vera
ge m
arin
e ac
idity
(pH
) m
easu
red
at a
gree
d su
ite o
f re
pres
enta
tive
sam
plin
g st
atio
nsNo
NoNo
NoNo
NoNo
No
215
14.4
.1 P
ropo
rtion
of fi
sh st
ocks
with
in b
iolo
gica
lly su
stai
nabl
e le
vels
NoNo
NoNo
NoNo
NoNo
216
14.5
.1 C
over
age
of p
rote
cted
are
as in
rela
tion
to m
arin
e ar
eas
NoNo
NoNo
NoNo
NoNo
217
14.6
.1 D
egre
e of
im
plem
enta
tion
of i
nter
natio
nal
inst
rum
ents
aim
ing
to c
omba
t ill
egal
, unr
epor
ted
and
unre
gula
ted
fishi
ngNo
NoNo
NoNo
NoNo
No
218
14.7
.1 S
usta
inab
le fi
sher
ies a
s a p
ropo
rtion
of G
DP in
smal
l isla
nd d
evel
opin
g St
ates
, le
ast d
evel
oped
coun
tries
and
all
coun
tries
NoNo
NoNo
NoNo
NoNo
219
14.a
.1 P
ropo
rtion
of t
otal
rese
arch
bud
get a
lloca
ted
to re
sear
ch in
the
field
of m
arin
e te
chno
logy
NoNo
NoNo
NoNo
NoNo
220
14.b
.1 D
egre
e of
app
licat
ion
of a
leg
al/re
gula
tory
/ po
licy/
inst
itutio
nal
fram
ewor
k w
hich
reco
gnize
s and
pro
tect
s acc
ess r
ight
s for
smal
l-sca
le fi
sher
ies
NoNo
NoNo
NoNo
NoNo
221
14.c.
1 Nu
mbe
r of c
ount
ries m
akin
g pr
ogre
ss in
ratif
ying,
acc
eptin
g an
d im
plem
entin
g th
roug
h le
gal,
polic
y an
d in
stitu
tiona
l fra
mew
orks
, oce
an-re
late
d in
stru
men
ts t
hat
impl
emen
t int
erna
tiona
l law
, as r
eflec
ted
in th
e Un
ited
Natio
n Co
nven
tion
on th
e La
w
of th
e Se
a, fo
r the
cons
erva
tion
and
sust
aina
ble
use
of th
e oc
eans
and
thei
r res
ourc
es
NoNo
NoNo
NoNo
NoNo
222
15.1
.1 Fo
rest
are
a as
a p
ropo
rtion
of t
otal
land
are
aNo
, re
plac
ed
by
natio
nal
15.1
.1.1
NoNo
NoNo
NoNo
No
223
15.1
.1.1
Fore
st a
rea
as a
pro
porti
on o
f tot
al la
nd a
rea
Yes
NoNo
Yes
NoNo
NoNo
224
15.1
.2 P
ropo
rtion
of i
mpo
rtant
site
s for
terre
stria
l and
fres
hwat
er b
iodi
vers
ity th
at a
re
cove
red
by p
rote
cted
are
as, b
y eco
syst
em ty
peYe
sNo
NoNo
NoNo
NoNo
225
15.1
.2.1
Size
of p
rote
cted
are
as (n
atio
nal n
atur
e re
serv
es a
nd p
arks
) out
of t
he e
ntire
co
untry
’s ar
eaYe
sNo
NoYe
sNo
NoNo
No
226
15.2
.1 P
rogr
ess t
owar
ds su
stai
nabl
e fo
rest
man
agem
ent
Yes
NoNo
NoNo
NoNo
No
227
15.3
.1 P
ropo
rtion
of l
and
that
is d
egra
ded
over
tota
l lan
d ar
eaNo
, re
plac
ed
by
natio
nal
15.3
.1.1
NoNo
NoNo
NoNo
No
228
15.3
.1.1
Ara
ble
land
by r
easo
ns fo
r non
-use
Yes
NoNo
NoNo
NoNo
No
229
15.4
.1 C
over
age
by p
rote
cted
are
as o
f im
porta
nt si
tes f
or m
ount
ain
biod
ivers
ityYe
sNo
NoNo
NoNo
NoNo
230
15.4
.2 M
ount
ain
Gree
n Co
ver I
ndex
NoNo
NoNo
NoNo
NoNo
231
15.5
.1 R
ed Li
st In
dex
No,
repl
aced
by
na
tiona
l 15
.5.1
.1
NoNo
NoNo
NoNo
No
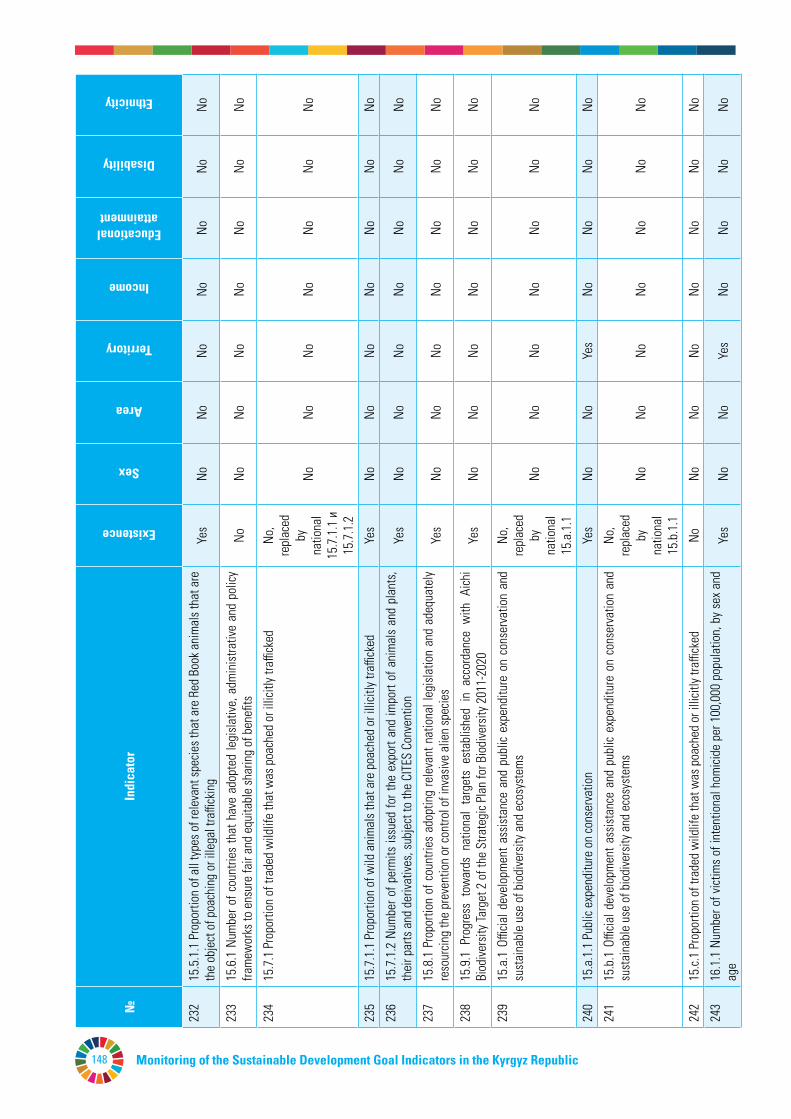
Monitoring of the Sustainable Development Goal Indicators in the Kyrgyz Republic148
№In
dica
tor
Existence
Sex
Агеa
Territory
Income
Educational attainment
Disability
Ethnicity
232
15.5
.1.1
Pro
porti
on o
f all
type
s of r
elev
ant s
pecie
s tha
t are
Red
Boo
k ani
mal
s tha
t are
th
e ob
ject
of p
oach
ing
or il
lega
l tra
ffick
ing
Yes
NoNo
NoNo
NoNo
No
233
15.6
.1 N
umbe
r of c
ount
ries
that
hav
e ad
opte
d le
gisla
tive,
adm
inist
rativ
e an
d po
licy
fram
ewor
ks to
ens
ure
fair
and
equi
tabl
e sh
arin
g of
ben
efits
NoNo
NoNo
NoNo
NoNo
234
15.7
.1 P
ropo
rtion
of t
rade
d w
ildlif
e th
at w
as p
oach
ed o
r illi
citly
traffi
cked
No,
repl
aced
by
na
tiona
l 15
.7.1
.1 и
15
.7.1
.2
NoNo
NoNo
NoNo
No
235
15.7
.1.1
Pro
porti
on o
f wild
ani
mal
s tha
t are
poa
ched
or i
llicit
ly tra
ffick
edYe
sNo
NoNo
NoNo
NoNo
236
15.7
.1.2
Num
ber o
f per
mits
issu
ed fo
r the
exp
ort a
nd im
port
of a
nim
als
and
plan
ts,
thei
r par
ts a
nd d
eriva
tives
, sub
ject
to th
e CI
TES
Conv
entio
nYe
sNo
NoNo
NoNo
NoNo
237
15.8
.1 P
ropo
rtion
of c
ount
ries
adop
ting
rele
vant
nat
iona
l leg
islat
ion
and
adeq
uate
ly re
sour
cing
the
prev
entio
n or
cont
rol o
f inv
asive
alie
n sp
ecie
sYe
sNo
NoNo
NoNo
NoNo
238
15.9
.1 P
rogr
ess
tow
ards
nat
iona
l ta
rget
s es
tabl
ished
in
acco
rdan
ce w
ith A
ichi
Biod
ivers
ity Ta
rget
2 o
f the
Stra
tegi
c Pla
n fo
r Bio
dive
rsity
201
1-20
20Ye
sNo
NoNo
NoNo
NoNo
239
15.a
.1 O
fficia
l dev
elop
men
t ass
istan
ce a
nd p
ublic
exp
endi
ture
on
cons
erva
tion
and
sust
aina
ble
use
of b
iodi
vers
ity a
nd e
cosy
stem
sNo
, re
plac
ed
by
natio
nal
15.а
.1.1
NoNo
NoNo
NoNo
No
240
15.а
.1.1
Pub
lic e
xpen
ditu
re o
n co
nser
vatio
nYe
sNo
NoYe
sNo
NoNo
No
241
15.b
.1 O
fficia
l dev
elop
men
t ass
istan
ce a
nd p
ublic
exp
endi
ture
on
cons
erva
tion
and
sust
aina
ble
use
of b
iodi
vers
ity a
nd e
cosy
stem
sNo
, re
plac
ed
by
natio
nal
15.b
.1.1
NoNo
NoNo
NoNo
No
242
15.c.
1 Pr
opor
tion
of tr
aded
wild
life
that
was
poa
ched
or i
llicit
ly tra
ffick
edNo
NoNo
NoNo
NoNo
No
243
16.1
.1 N
umbe
r of v
ictim
s of
inte
ntio
nal h
omici
de p
er 1
00,0
00 p
opul
atio
n, b
y se
x an
d ag
eYe
sNo
NoYe
sNo
NoNo
No
244
16.1
.1.1
а M
orta
lity f
rom
ass
ault
per 1
00,0
00 p
eopl
e, b
y sex
and
age
Yes
NoNo
Yes
NoNo
NoNo
245
16.1
.1.4
а Pr
opor
tion
of a
ll re
cord
ed c
rimes
com
mitt
ed in
pub
lic p
lace
s an
d on
the
st
reet
sYe
sNo
NoYe
sNo
NoNo
No
246
16.1
.2 C
onfli
ct-re
late
d de
aths
per
100
,000
pop
ulat
ion,
by s
ex, a
ge a
nd ca
use
NoNo
NoNo
NoNo
NoNo
247
16.1
.3 P
ropo
rtion
of p
opul
atio
n su
bjec
ted
to (a
) phy
sical
vio
lenc
e, (b
) psy
chol
ogica
l vio
lenc
e an
d (c)
sexu
al vi
olen
ce in
the
prev
ious
12
mon
ths
No,
repl
aced
by
na
tiona
l 16
.1.3
.1
NoNo
NoNo
NoNo
No
248
16.1
.3.1
Pro
porti
on o
f w
omen
age
d 15
-49
year
s, in
the
last
12
mon
ths
who
hav
e ex
perie
nced
phy
sical
viol
ence
: rob
bery
or a
ssau
ltYe
sYe
sYe
sYe
sNo
Yes
NoNo
249
16.1
.4 P
ropo
rtion
of p
opul
atio
n th
at fe
el sa
fe w
alkin
g al
one
arou
nd th
e ar
ea th
ey li
veYe
sYe
sYe
sYe
sYe
sYe
sNo
Yes
250
16.2
.1 Pr
opor
tion o
f chi
ldre
n age
d 1-1
7 yea
rs w
ho ex
perie
nced
any p
hysic
al pu
nish
men
t an
d/or
psy
chol
ogica
l agg
ress
ion
by ca
regi
vers
in th
e pa
st m
onth
Yes
Yes
Yes
Yes
Yes
NoYe
sYe
s
251
16.2
.2 N
umbe
r of v
ictim
s of h
uman
traffi
ckin
g pe
r 100
,000
pop
ulat
ion,
by s
ex, a
ge a
nd
form
of e
xplo
itatio
nNo
NoNo
NoNo
NoNo
No
252
16.2
.3 P
ropo
rtion
of y
oung
wom
en a
nd m
en a
ged
18 2
9 ye
ars w
ho e
xper
ienc
ed se
xual
vio
lenc
e by
age
18
NoNo
NoNo
NoNo
NoNo
253
16.3
.1 P
ropo
rtion
of v
ictim
s of v
iole
nce
in th
e pr
evio
us 1
2 m
onth
s who
repo
rted
thei
r vic
timiza
tion
to co
mpe
tent
aut
horit
ies o
r oth
er o
fficia
lly re
cogn
ized
confl
ict re
solu
tion
mec
hani
sms
Yes
NoYe
sNo
NoNo
NoNo
254
16.3
.2 U
nsen
tenc
ed d
etai
nees
as a
pro
porti
on o
f ove
rall
priso
n po
pula
tion
NoNo
NoNo
NoNo
NoNo
255
16.4
.1 To
tal v
alue
of i
nwar
d an
d ou
twar
d ill
icit fi
nanc
ial fl
ows (
in cu
rrent
Uni
ted
Stat
es
dolla
rs)
NoNo
NoNo
NoNo
NoNo
256
16.4
.2 P
ropo
rtion
of s
eize
d, fo
und
or s
urre
nder
ed a
rms
who
se il
licit
orig
in o
r con
text
ha
s be
en tr
aced
or e
stab
lishe
d by
a c
ompe
tent
aut
horit
y in
line
with
inte
rnat
iona
l in
stru
men
ts
No,
repl
aced
by
na
tiona
l 16
.4.2
.1
NoNo
NoNo
NoNo
No
257
16.4
.2.1
Num
ber o
f sei
zed
or su
rrend
ered
arm
sYe
sNo
NoNo
NoNo
NoNo
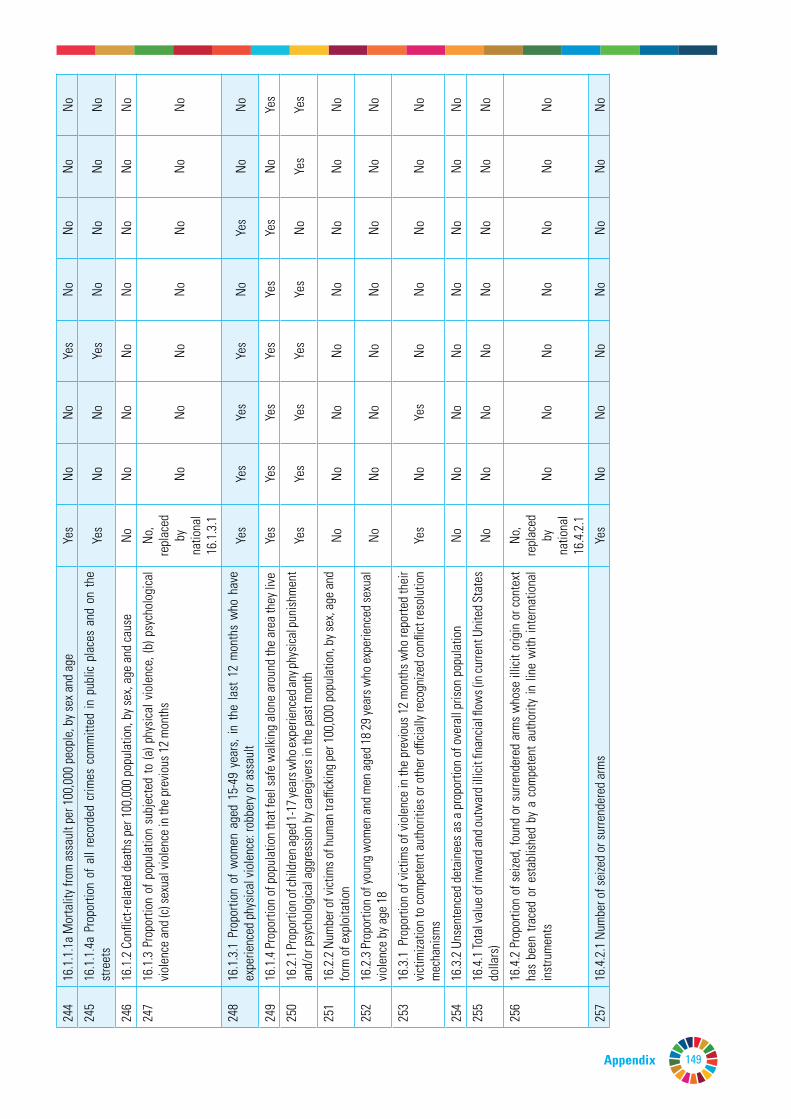
149
№In
dica
tor
Existence
Sex
Агеa
Territory
Income
Educational attainment
Disability
Ethnicity
232
15.5
.1.1
Pro
porti
on o
f all
type
s of r
elev
ant s
pecie
s tha
t are
Red
Boo
k ani
mal
s tha
t are
th
e ob
ject
of p
oach
ing
or il
lega
l tra
ffick
ing
Yes
NoNo
NoNo
NoNo
No
233
15.6
.1 N
umbe
r of c
ount
ries
that
hav
e ad
opte
d le
gisla
tive,
adm
inist
rativ
e an
d po
licy
fram
ewor
ks to
ens
ure
fair
and
equi
tabl
e sh
arin
g of
ben
efits
NoNo
NoNo
NoNo
NoNo
234
15.7
.1 P
ropo
rtion
of t
rade
d w
ildlif
e th
at w
as p
oach
ed o
r illi
citly
traffi
cked
No,
repl
aced
by
na
tiona
l 15
.7.1
.1 и
15
.7.1
.2
NoNo
NoNo
NoNo
No
235
15.7
.1.1
Pro
porti
on o
f wild
ani
mal
s tha
t are
poa
ched
or i
llicit
ly tra
ffick
edYe
sNo
NoNo
NoNo
NoNo
236
15.7
.1.2
Num
ber o
f per
mits
issu
ed fo
r the
exp
ort a
nd im
port
of a
nim
als
and
plan
ts,
thei
r par
ts a
nd d
eriva
tives
, sub
ject
to th
e CI
TES
Conv
entio
nYe
sNo
NoNo
NoNo
NoNo
237
15.8
.1 P
ropo
rtion
of c
ount
ries
adop
ting
rele
vant
nat
iona
l leg
islat
ion
and
adeq
uate
ly re
sour
cing
the
prev
entio
n or
cont
rol o
f inv
asive
alie
n sp
ecie
sYe
sNo
NoNo
NoNo
NoNo
238
15.9
.1 P
rogr
ess
tow
ards
nat
iona
l ta
rget
s es
tabl
ished
in
acco
rdan
ce w
ith A
ichi
Biod
ivers
ity Ta
rget
2 o
f the
Stra
tegi
c Pla
n fo
r Bio
dive
rsity
201
1-20
20Ye
sNo
NoNo
NoNo
NoNo
239
15.a
.1 O
fficia
l dev
elop
men
t ass
istan
ce a
nd p
ublic
exp
endi
ture
on
cons
erva
tion
and
sust
aina
ble
use
of b
iodi
vers
ity a
nd e
cosy
stem
sNo
, re
plac
ed
by
natio
nal
15.а
.1.1
NoNo
NoNo
NoNo
No
240
15.а
.1.1
Pub
lic e
xpen
ditu
re o
n co
nser
vatio
nYe
sNo
NoYe
sNo
NoNo
No
241
15.b
.1 O
fficia
l dev
elop
men
t ass
istan
ce a
nd p
ublic
exp
endi
ture
on
cons
erva
tion
and
sust
aina
ble
use
of b
iodi
vers
ity a
nd e
cosy
stem
sNo
, re
plac
ed
by
natio
nal
15.b
.1.1
NoNo
NoNo
NoNo
No
242
15.c.
1 Pr
opor
tion
of tr
aded
wild
life
that
was
poa
ched
or i
llicit
ly tra
ffick
edNo
NoNo
NoNo
NoNo
No
243
16.1
.1 N
umbe
r of v
ictim
s of
inte
ntio
nal h
omici
de p
er 1
00,0
00 p
opul
atio
n, b
y se
x an
d ag
eYe
sNo
NoYe
sNo
NoNo
No
244
16.1
.1.1
а M
orta
lity f
rom
ass
ault
per 1
00,0
00 p
eopl
e, b
y sex
and
age
Yes
NoNo
Yes
NoNo
NoNo
245
16.1
.1.4
а Pr
opor
tion
of a
ll re
cord
ed c
rimes
com
mitt
ed in
pub
lic p
lace
s an
d on
the
st
reet
sYe
sNo
NoYe
sNo
NoNo
No
246
16.1
.2 C
onfli
ct-re
late
d de
aths
per
100
,000
pop
ulat
ion,
by s
ex, a
ge a
nd ca
use
NoNo
NoNo
NoNo
NoNo
247
16.1
.3 P
ropo
rtion
of p
opul
atio
n su
bjec
ted
to (a
) phy
sical
vio
lenc
e, (b
) psy
chol
ogica
l vio
lenc
e an
d (c)
sexu
al vi
olen
ce in
the
prev
ious
12
mon
ths
No,
repl
aced
by
na
tiona
l 16
.1.3
.1
NoNo
NoNo
NoNo
No
248
16.1
.3.1
Pro
porti
on o
f w
omen
age
d 15
-49
year
s, in
the
last
12
mon
ths
who
hav
e ex
perie
nced
phy
sical
viol
ence
: rob
bery
or a
ssau
ltYe
sYe
sYe
sYe
sNo
Yes
NoNo
249
16.1
.4 P
ropo
rtion
of p
opul
atio
n th
at fe
el sa
fe w
alkin
g al
one
arou
nd th
e ar
ea th
ey li
veYe
sYe
sYe
sYe
sYe
sYe
sNo
Yes
250
16.2
.1 Pr
opor
tion o
f chi
ldre
n age
d 1-1
7 yea
rs w
ho ex
perie
nced
any p
hysic
al pu
nish
men
t an
d/or
psy
chol
ogica
l agg
ress
ion
by ca
regi
vers
in th
e pa
st m
onth
Yes
Yes
Yes
Yes
Yes
NoYe
sYe
s
251
16.2
.2 N
umbe
r of v
ictim
s of h
uman
traffi
ckin
g pe
r 100
,000
pop
ulat
ion,
by s
ex, a
ge a
nd
form
of e
xplo
itatio
nNo
NoNo
NoNo
NoNo
No
252
16.2
.3 P
ropo
rtion
of y
oung
wom
en a
nd m
en a
ged
18 2
9 ye
ars w
ho e
xper
ienc
ed se
xual
vio
lenc
e by
age
18
NoNo
NoNo
NoNo
NoNo
253
16.3
.1 P
ropo
rtion
of v
ictim
s of v
iole
nce
in th
e pr
evio
us 1
2 m
onth
s who
repo
rted
thei
r vic
timiza
tion
to co
mpe
tent
aut
horit
ies o
r oth
er o
fficia
lly re
cogn
ized
confl
ict re
solu
tion
mec
hani
sms
Yes
NoYe
sNo
NoNo
NoNo
254
16.3
.2 U
nsen
tenc
ed d
etai
nees
as a
pro
porti
on o
f ove
rall
priso
n po
pula
tion
NoNo
NoNo
NoNo
NoNo
255
16.4
.1 To
tal v
alue
of i
nwar
d an
d ou
twar
d ill
icit fi
nanc
ial fl
ows (
in cu
rrent
Uni
ted
Stat
es
dolla
rs)
NoNo
NoNo
NoNo
NoNo
256
16.4
.2 P
ropo
rtion
of s
eize
d, fo
und
or s
urre
nder
ed a
rms
who
se il
licit
orig
in o
r con
text
ha
s be
en tr
aced
or e
stab
lishe
d by
a c
ompe
tent
aut
horit
y in
line
with
inte
rnat
iona
l in
stru
men
ts
No,
repl
aced
by
na
tiona
l 16
.4.2
.1
NoNo
NoNo
NoNo
No
257
16.4
.2.1
Num
ber o
f sei
zed
or su
rrend
ered
arm
sYe
sNo
NoNo
NoNo
NoNo
Appendix
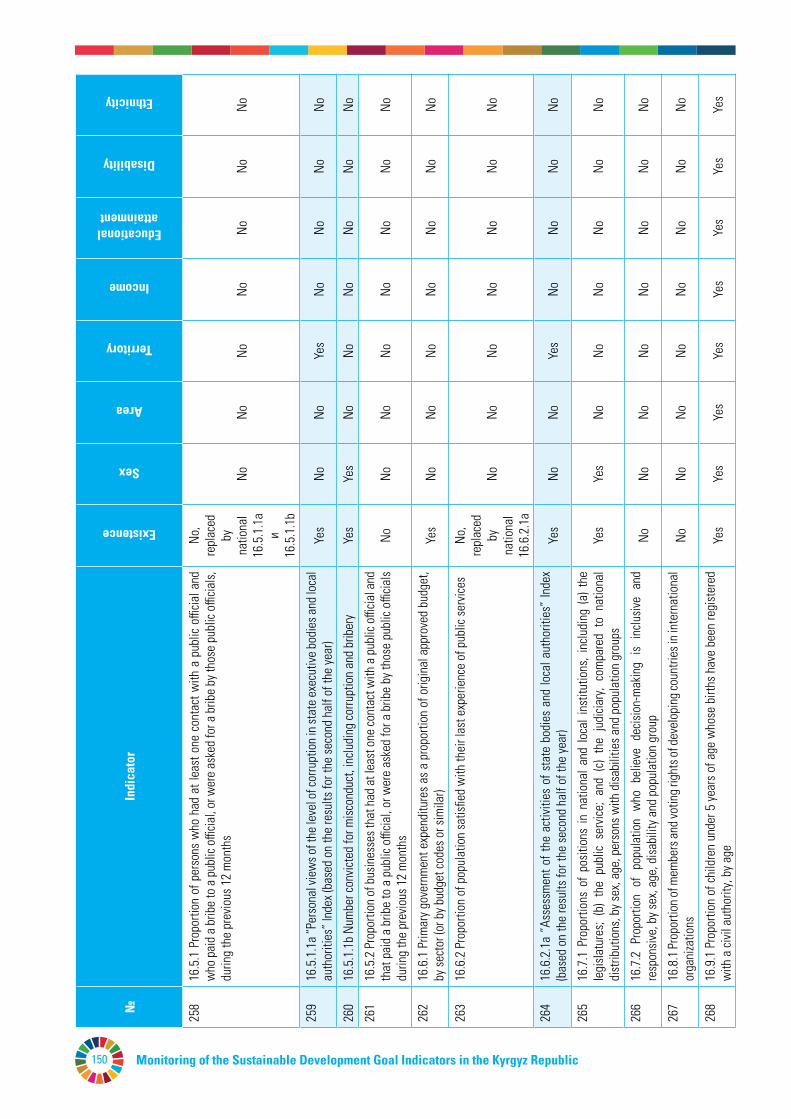
Monitoring of the Sustainable Development Goal Indicators in the Kyrgyz Republic150
№In
dica
tor
Existence
Sex
Агеa
Territory
Income
Educational attainment
Disability
Ethnicity
258
16.5
.1 P
ropo
rtion
of p
erso
ns w
ho h
ad a
t lea
st o
ne c
onta
ct w
ith a
pub
lic o
fficia
l and
w
ho p
aid
a br
ibe
to a
pub
lic o
fficia
l, or
wer
e as
ked
for a
brib
e by
thos
e pu
blic
officia
ls,
durin
g th
e pr
evio
us 1
2 m
onth
s
No,
repl
aced
by
na
tiona
l 16
.5.1
.1а
и 16
.5.1
.1b
NoNo
NoNo
NoNo
No
259
16.5
.1.1
а “P
erso
nal v
iew
s of t
he le
vel o
f cor
rupt
ion
in st
ate
exec
utive
bod
ies a
nd lo
cal
auth
oriti
es” I
ndex
(bas
ed o
n th
e re
sults
for t
he se
cond
hal
f of t
he ye
ar)
Yes
NoNo
Yes
NoNo
NoNo
260
16.5
.1.1
b Nu
mbe
r con
victe
d fo
r misc
ondu
ct, i
nclu
ding
corru
ptio
n an
d br
iber
yYe
sYe
sNo
NoNo
NoNo
No
261
16.5
.2 P
ropo
rtion
of b
usin
esse
s tha
t had
at l
east
one
cont
act w
ith a
pub
lic o
fficia
l and
th
at p
aid
a br
ibe
to a
pub
lic o
fficia
l, or
wer
e as
ked
for a
brib
e by
thos
e pu
blic
officia
ls du
ring
the
prev
ious
12
mon
ths
NoNo
NoNo
NoNo
NoNo
262
16.6
.1 P
rimar
y go
vern
men
t exp
endi
ture
s as
a p
ropo
rtion
of o
rigin
al a
ppro
ved
budg
et,
by se
ctor
(or b
y bud
get c
odes
or s
imila
r)Ye
sNo
NoNo
NoNo
NoNo
263
16.6
.2 P
ropo
rtion
of p
opul
atio
n sa
tisfie
d w
ith th
eir l
ast e
xper
ienc
e of
pub
lic se
rvice
sNo
, re
plac
ed
by
natio
nal
16.6
.2.1
а
NoNo
NoNo
NoNo
No
264
16.6
.2.1
а “A
sses
smen
t of t
he a
ctivi
ties
of s
tate
bod
ies
and
loca
l aut
horit
ies”
Inde
x (b
ased
on
the
resu
lts fo
r the
seco
nd h
alf o
f the
year
)Ye
sNo
NoYe
sNo
NoNo
No
265
16.7
.1 P
ropo
rtion
s of
pos
ition
s in
nat
iona
l and
loca
l ins
titut
ions
, inc
ludi
ng (a
) the
le
gisla
ture
s; (b
) th
e pu
blic
serv
ice;
and
(c) t
he j
udici
ary,
com
pare
d to
nat
iona
l di
strib
utio
ns, b
y sex
, age
, per
sons
with
disa
bilit
ies a
nd p
opul
atio
n gr
oups
Yes
Yes
NoNo
NoNo
NoNo
266
16.7
.2 P
ropo
rtion
of
popu
latio
n w
ho b
elie
ve d
ecisi
on-m
akin
g is
inclu
sive
and
resp
onsiv
e, b
y sex
, age
, disa
bilit
y and
pop
ulat
ion
grou
pNo
NoNo
NoNo
NoNo
No
267
16.8
.1 Pr
opor
tion o
f mem
bers
and v
otin
g rig
hts o
f dev
elop
ing c
ount
ries i
n int
erna
tiona
l or
gani
zatio
nsNo
NoNo
NoNo
NoNo
No
268
16.9
.1 P
ropo
rtion
of c
hild
ren
unde
r 5 y
ears
of a
ge w
hose
birt
hs h
ave
been
regi
ster
ed
with
a ci
vil a
utho
rity,
by a
geYe
sYe
sYe
sYe
sYe
sYe
sYe
sYe
s
269
16.1
0.1
Num
ber
of v
erifi
ed c
ases
of
killin
g, k
idna
ppin
g, e
nfor
ced
disa
ppea
ranc
e,
arbi
trary
det
entio
n an
d to
rture
of
jour
nalis
ts,
asso
ciate
d m
edia
per
sonn
el,
trade
un
ioni
sts a
nd h
uman
righ
ts a
dvoc
ates
in th
e pr
evio
us 1
2 m
onth
sNo
NoNo
NoNo
NoNo
No
270
16.1
0.2
Num
ber o
f cou
ntrie
s th
at a
dopt
and
impl
emen
t con
stitu
tiona
l, st
atut
ory
and/
or p
olicy
gua
rant
ees f
or p
ublic
acc
ess t
o in
form
atio
nYe
sNo
NoNo
NoNo
NoNo
271
16.a
.1 E
xiste
nce
of in
depe
nden
t nat
iona
l hum
an ri
ghts
inst
itutio
ns in
com
plia
nce
with
th
e Pa
ris P
rincip
les
NoNo
NoNo
NoNo
NoNo
272
16.b
.1 P
ropo
rtion
of p
opul
atio
n re
porti
ng h
avin
g pe
rson
ally
felt
disc
rimin
ated
aga
inst
or
har
asse
d in
the
pre
vious
12
mon
ths
on t
he b
asis
of a
gro
und
of d
iscrim
inat
ion
proh
ibite
d un
der i
nter
natio
nal h
uman
righ
ts la
w
No,
repl
aced
by
na
tiona
l 16
.b.1
.1
NoNo
NoNo
NoNo
No
273
16.b
.1.1
Per
cent
age
of w
omen
age
d 15
-49
repo
rting
disc
rimin
atio
n or
har
assm
ent
agai
nst t
hem
selve
s in
the
past
12
mon
ths o
n a
basis
that
is p
rohi
bite
d by
inte
rnat
iona
l hu
man
righ
ts la
wYe
sYe
sYe
sYe
sYe
sYe
sYe
sNo
274
17.1
.1 To
tal g
over
nmen
t rev
enue
as a
pro
porti
on o
f GDP
, by s
ourc
eYe
sNo
NoNo
NoNo
NoNo
275
17.1
.2 P
ropo
rtion
of d
omes
tic b
udge
t fun
ded
by d
omes
tic ta
xes
Yes
NoNo
NoNo
NoNo
No
276
17.2
.1 N
et o
fficia
l dev
elop
men
t ass
istan
ce, t
otal
and
to le
ast d
evel
oped
coun
tries
, as
a pr
opor
tion
of th
e Or
gani
zatio
n fo
r Eco
nom
ic Co
oper
atio
n an
d De
velo
pmen
t (OE
CD)
Deve
lopm
ent A
ssist
ance
Com
mitt
ee d
onor
s’ gr
oss n
atio
nal i
ncom
e (G
NI)
NoNo
NoNo
NoNo
NoNo
277
17.3
.1 F
orei
gn d
irect
inve
stm
ents
(FDI
), offi
cial d
evel
opm
ent a
ssist
ance
and
Sou
th-
Sout
h Co
oper
atio
n as
a p
ropo
rtion
of t
otal
dom
estic
bud
get
No,
repl
aced
by
na
tiona
l 17
.3.1
.1
NoNo
NoNo
NoNo
No
278
17.3
.1.1
Fore
ign
dire
ct in
vest
men
t fro
m a
broa
d by
type
of e
cono
mic
activ
ityYe
sNo
NoYe
sNo
NoNo
No
279
17.3
.2 V
olum
e of
rem
ittan
ces (
in U
nite
d St
ates
dol
lars
) as a
pro
porti
on o
f tot
al G
DPNo
NoNo
NoNo
NoNo
No
280
17.4
.1 D
ebt s
ervic
e as
a p
ropo
rtion
of e
xpor
ts o
f goo
ds a
nd se
rvice
sYe
sNo
NoNo
NoNo
NoNo
281
17.5
.1 N
umbe
r of c
ount
ries
that
ado
pt a
nd im
plem
ent i
nves
tmen
t pro
mot
ion
regi
mes
fo
r lea
st d
evel
oped
coun
tries
Yes
NoNo
NoNo
NoNo
No
282
17.6
.1 N
umbe
r of s
cienc
e and
/or t
echn
olog
y coo
pera
tion a
gree
men
ts an
d pro
gram
mes
be
twee
n co
untri
es, b
y typ
e of
coop
erat
ion
Yes
NoNo
NoNo
NoNo
No
283
17.6
.2 Fi
xed
Inte
rnet
bro
adba
nd su
bscr
iptio
ns p
er 1
00 in
habi
tant
s, by
spee
dYe
sNo
NoNo
NoNo
NoNo
284
17.7
.1 T
otal
am
ount
of
appr
oved
fun
ding
for
dev
elop
ing
coun
tries
to
prom
ote
the
deve
lopm
ent,
trans
fer,
diss
emin
atio
n an
d di
ffusio
n of
env
ironm
enta
lly s
ound
te
chno
logi
esNo
NoNo
NoNo
NoNo
No
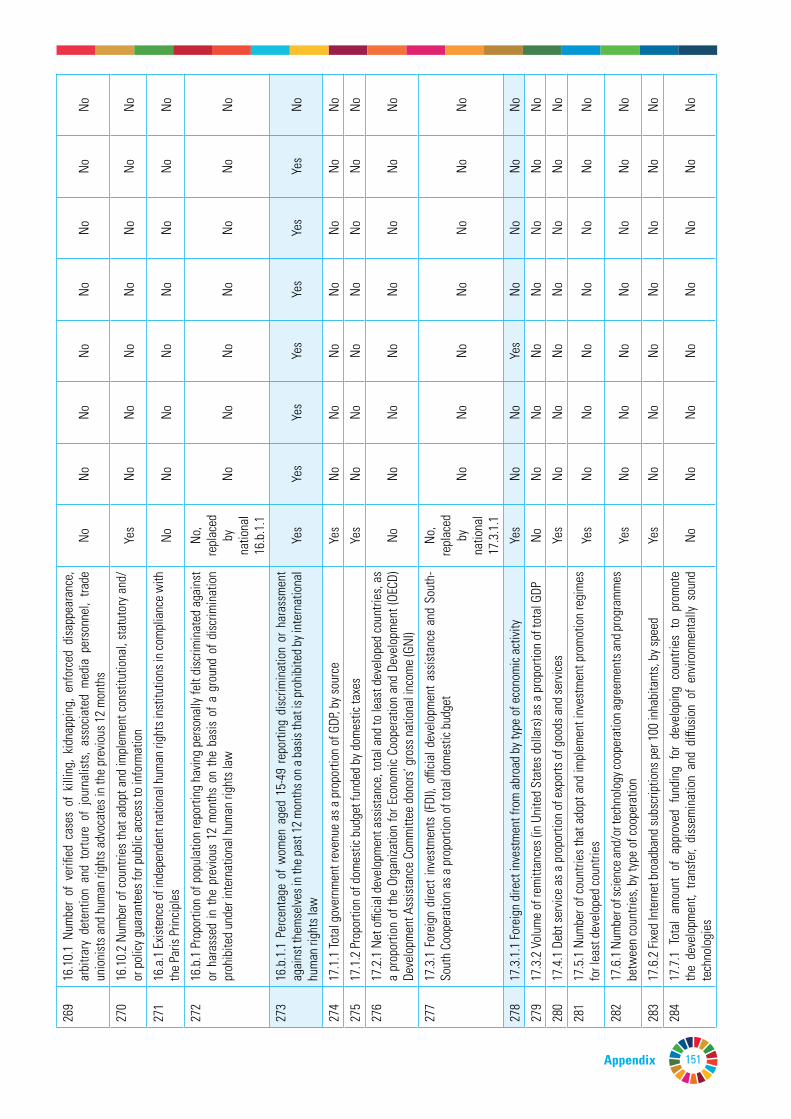
151
№In
dica
tor
Existence
Sex
Агеa
Territory
Income
Educational attainment
Disability
Ethnicity
258
16.5
.1 P
ropo
rtion
of p
erso
ns w
ho h
ad a
t lea
st o
ne c
onta
ct w
ith a
pub
lic o
fficia
l and
w
ho p
aid
a br
ibe
to a
pub
lic o
fficia
l, or
wer
e as
ked
for a
brib
e by
thos
e pu
blic
officia
ls,
durin
g th
e pr
evio
us 1
2 m
onth
s
No,
repl
aced
by
na
tiona
l 16
.5.1
.1а
и 16
.5.1
.1b
NoNo
NoNo
NoNo
No
259
16.5
.1.1
а “P
erso
nal v
iew
s of t
he le
vel o
f cor
rupt
ion
in st
ate
exec
utive
bod
ies a
nd lo
cal
auth
oriti
es” I
ndex
(bas
ed o
n th
e re
sults
for t
he se
cond
hal
f of t
he ye
ar)
Yes
NoNo
Yes
NoNo
NoNo
260
16.5
.1.1
b Nu
mbe
r con
victe
d fo
r misc
ondu
ct, i
nclu
ding
corru
ptio
n an
d br
iber
yYe
sYe
sNo
NoNo
NoNo
No
261
16.5
.2 P
ropo
rtion
of b
usin
esse
s tha
t had
at l
east
one
cont
act w
ith a
pub
lic o
fficia
l and
th
at p
aid
a br
ibe
to a
pub
lic o
fficia
l, or
wer
e as
ked
for a
brib
e by
thos
e pu
blic
officia
ls du
ring
the
prev
ious
12
mon
ths
NoNo
NoNo
NoNo
NoNo
262
16.6
.1 P
rimar
y go
vern
men
t exp
endi
ture
s as
a p
ropo
rtion
of o
rigin
al a
ppro
ved
budg
et,
by se
ctor
(or b
y bud
get c
odes
or s
imila
r)Ye
sNo
NoNo
NoNo
NoNo
263
16.6
.2 P
ropo
rtion
of p
opul
atio
n sa
tisfie
d w
ith th
eir l
ast e
xper
ienc
e of
pub
lic se
rvice
sNo
, re
plac
ed
by
natio
nal
16.6
.2.1
а
NoNo
NoNo
NoNo
No
264
16.6
.2.1
а “A
sses
smen
t of t
he a
ctivi
ties
of s
tate
bod
ies
and
loca
l aut
horit
ies”
Inde
x (b
ased
on
the
resu
lts fo
r the
seco
nd h
alf o
f the
year
)Ye
sNo
NoYe
sNo
NoNo
No
265
16.7
.1 P
ropo
rtion
s of
pos
ition
s in
nat
iona
l and
loca
l ins
titut
ions
, inc
ludi
ng (a
) the
le
gisla
ture
s; (b
) th
e pu
blic
serv
ice;
and
(c) t
he j
udici
ary,
com
pare
d to
nat
iona
l di
strib
utio
ns, b
y sex
, age
, per
sons
with
disa
bilit
ies a
nd p
opul
atio
n gr
oups
Yes
Yes
NoNo
NoNo
NoNo
266
16.7
.2 P
ropo
rtion
of
popu
latio
n w
ho b
elie
ve d
ecisi
on-m
akin
g is
inclu
sive
and
resp
onsiv
e, b
y sex
, age
, disa
bilit
y and
pop
ulat
ion
grou
pNo
NoNo
NoNo
NoNo
No
267
16.8
.1 Pr
opor
tion o
f mem
bers
and v
otin
g rig
hts o
f dev
elop
ing c
ount
ries i
n int
erna
tiona
l or
gani
zatio
nsNo
NoNo
NoNo
NoNo
No
268
16.9
.1 P
ropo
rtion
of c
hild
ren
unde
r 5 y
ears
of a
ge w
hose
birt
hs h
ave
been
regi
ster
ed
with
a ci
vil a
utho
rity,
by a
geYe
sYe
sYe
sYe
sYe
sYe
sYe
sYe
s
269
16.1
0.1
Num
ber
of v
erifi
ed c
ases
of
killin
g, k
idna
ppin
g, e
nfor
ced
disa
ppea
ranc
e,
arbi
trary
det
entio
n an
d to
rture
of
jour
nalis
ts,
asso
ciate
d m
edia
per
sonn
el,
trade
un
ioni
sts a
nd h
uman
righ
ts a
dvoc
ates
in th
e pr
evio
us 1
2 m
onth
sNo
NoNo
NoNo
NoNo
No
270
16.1
0.2
Num
ber o
f cou
ntrie
s th
at a
dopt
and
impl
emen
t con
stitu
tiona
l, st
atut
ory
and/
or p
olicy
gua
rant
ees f
or p
ublic
acc
ess t
o in
form
atio
nYe
sNo
NoNo
NoNo
NoNo
271
16.a
.1 E
xiste
nce
of in
depe
nden
t nat
iona
l hum
an ri
ghts
inst
itutio
ns in
com
plia
nce
with
th
e Pa
ris P
rincip
les
NoNo
NoNo
NoNo
NoNo
272
16.b
.1 P
ropo
rtion
of p
opul
atio
n re
porti
ng h
avin
g pe
rson
ally
felt
disc
rimin
ated
aga
inst
or
har
asse
d in
the
pre
vious
12
mon
ths
on t
he b
asis
of a
gro
und
of d
iscrim
inat
ion
proh
ibite
d un
der i
nter
natio
nal h
uman
righ
ts la
w
No,
repl
aced
by
na
tiona
l 16
.b.1
.1
NoNo
NoNo
NoNo
No
273
16.b
.1.1
Per
cent
age
of w
omen
age
d 15
-49
repo
rting
disc
rimin
atio
n or
har
assm
ent
agai
nst t
hem
selve
s in
the
past
12
mon
ths o
n a
basis
that
is p
rohi
bite
d by
inte
rnat
iona
l hu
man
righ
ts la
wYe
sYe
sYe
sYe
sYe
sYe
sYe
sNo
274
17.1
.1 To
tal g
over
nmen
t rev
enue
as a
pro
porti
on o
f GDP
, by s
ourc
eYe
sNo
NoNo
NoNo
NoNo
275
17.1
.2 P
ropo
rtion
of d
omes
tic b
udge
t fun
ded
by d
omes
tic ta
xes
Yes
NoNo
NoNo
NoNo
No
276
17.2
.1 N
et o
fficia
l dev
elop
men
t ass
istan
ce, t
otal
and
to le
ast d
evel
oped
coun
tries
, as
a pr
opor
tion
of th
e Or
gani
zatio
n fo
r Eco
nom
ic Co
oper
atio
n an
d De
velo
pmen
t (OE
CD)
Deve
lopm
ent A
ssist
ance
Com
mitt
ee d
onor
s’ gr
oss n
atio
nal i
ncom
e (G
NI)
NoNo
NoNo
NoNo
NoNo
277
17.3
.1 F
orei
gn d
irect
inve
stm
ents
(FDI
), offi
cial d
evel
opm
ent a
ssist
ance
and
Sou
th-
Sout
h Co
oper
atio
n as
a p
ropo
rtion
of t
otal
dom
estic
bud
get
No,
repl
aced
by
na
tiona
l 17
.3.1
.1
NoNo
NoNo
NoNo
No
278
17.3
.1.1
Fore
ign
dire
ct in
vest
men
t fro
m a
broa
d by
type
of e
cono
mic
activ
ityYe
sNo
NoYe
sNo
NoNo
No
279
17.3
.2 V
olum
e of
rem
ittan
ces (
in U
nite
d St
ates
dol
lars
) as a
pro
porti
on o
f tot
al G
DPNo
NoNo
NoNo
NoNo
No
280
17.4
.1 D
ebt s
ervic
e as
a p
ropo
rtion
of e
xpor
ts o
f goo
ds a
nd se
rvice
sYe
sNo
NoNo
NoNo
NoNo
281
17.5
.1 N
umbe
r of c
ount
ries
that
ado
pt a
nd im
plem
ent i
nves
tmen
t pro
mot
ion
regi
mes
fo
r lea
st d
evel
oped
coun
tries
Yes
NoNo
NoNo
NoNo
No
282
17.6
.1 N
umbe
r of s
cienc
e and
/or t
echn
olog
y coo
pera
tion a
gree
men
ts an
d pro
gram
mes
be
twee
n co
untri
es, b
y typ
e of
coop
erat
ion
Yes
NoNo
NoNo
NoNo
No
283
17.6
.2 Fi
xed
Inte
rnet
bro
adba
nd su
bscr
iptio
ns p
er 1
00 in
habi
tant
s, by
spee
dYe
sNo
NoNo
NoNo
NoNo
284
17.7
.1 T
otal
am
ount
of
appr
oved
fun
ding
for
dev
elop
ing
coun
tries
to
prom
ote
the
deve
lopm
ent,
trans
fer,
diss
emin
atio
n an
d di
ffusio
n of
env
ironm
enta
lly s
ound
te
chno
logi
esNo
NoNo
NoNo
NoNo
No
Appendix
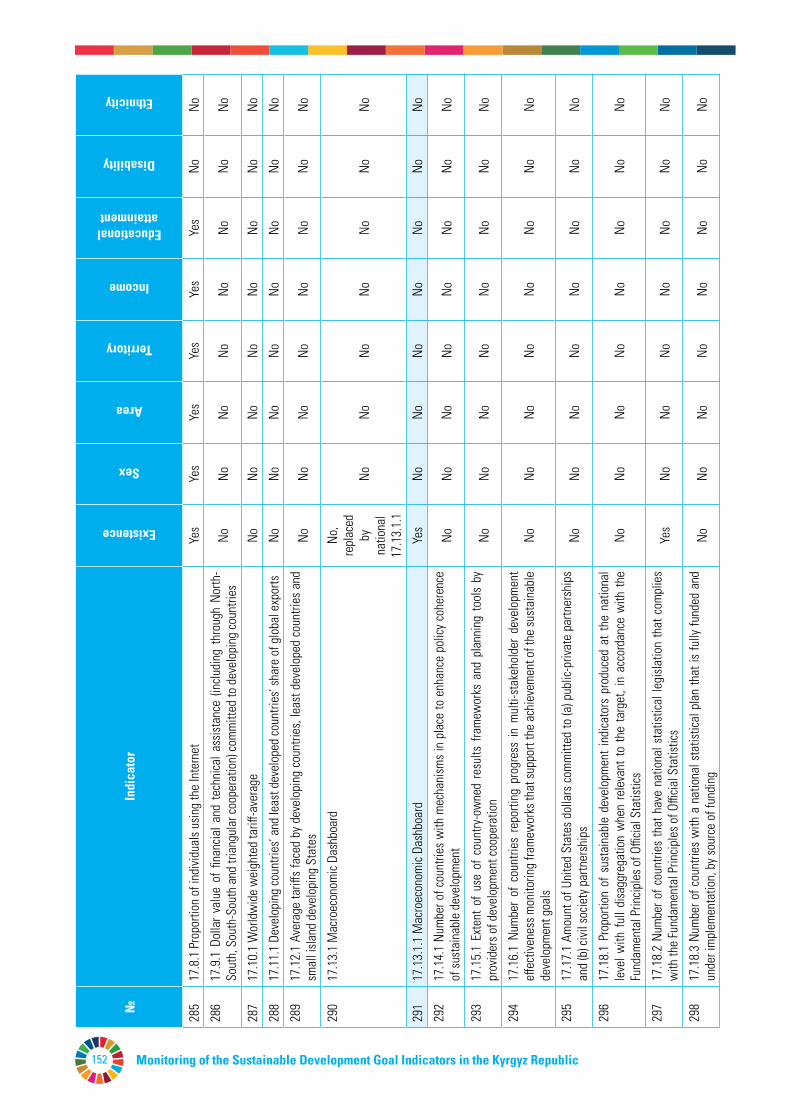
Monitoring of the Sustainable Development Goal Indicators in the Kyrgyz Republic152
№In
dica
tor
Existence
Sex
Агеa
Territory
Income
Educational attainment
Disability
Ethnicity
285
17.8
.1 P
ropo
rtion
of i
ndivi
dual
s usin
g th
e In
tern
etYe
sYe
sYe
sYe
sYe
sYe
sNo
No
286
17.9
.1 D
olla
r va
lue
of fi
nanc
ial a
nd t
echn
ical a
ssist
ance
(inc
ludi
ng t
hrou
gh N
orth
-So
uth,
Sou
th-S
outh
and
tria
ngul
ar co
oper
atio
n) co
mm
itted
to d
evel
opin
g co
untri
esNo
NoNo
NoNo
NoNo
No
287
17.1
0.1
Wor
ldw
ide
wei
ghte
d ta
riff-a
vera
geNo
NoNo
NoNo
NoNo
No
288
17.1
1.1
Deve
lopi
ng co
untri
es’ a
nd le
ast d
evel
oped
coun
tries
’ sha
re o
f glo
bal e
xpor
tsNo
NoNo
NoNo
NoNo
No
289
17.1
2.1
Aver
age
tariff
s fa
ced
by d
evel
opin
g co
untri
es, l
east
dev
elop
ed c
ount
ries
and
smal
l isla
nd d
evel
opin
g St
ates
NoNo
NoNo
NoNo
NoNo
290
17.1
3.1
Mac
roec
onom
ic Da
shbo
ard
No,
repl
aced
by
na
tiona
l 17
.13.
1.1
NoNo
NoNo
NoNo
No
291
17.1
3.1.
1 M
acro
econ
omic
Dash
boar
dYe
sNo
NoNo
NoNo
NoNo
292
17.1
4.1
Num
ber o
f cou
ntrie
s w
ith m
echa
nism
s in
pla
ce to
enh
ance
pol
icy c
oher
ence
of
sust
aina
ble
deve
lopm
ent
NoNo
NoNo
NoNo
NoNo
293
17.1
5.1
Exte
nt o
f us
e of
cou
ntry
-ow
ned
resu
lts f
ram
ewor
ks a
nd p
lann
ing
tool
s by
pr
ovid
ers o
f dev
elop
men
t coo
pera
tion
NoNo
NoNo
NoNo
NoNo
294
17.1
6.1
Num
ber
of c
ount
ries
repo
rting
pro
gres
s in
mul
ti-st
akeh
olde
r de
velo
pmen
t eff
ectiv
enes
s mon
itorin
g fra
mew
orks
that
supp
ort t
he a
chie
vem
ent o
f the
sust
aina
ble
deve
lopm
ent g
oals
NoNo
NoNo
NoNo
NoNo
295
17.1
7.1
Amou
nt o
f Uni
ted
Stat
es d
olla
rs c
omm
itted
to (a
) pub
lic-p
rivat
e pa
rtner
ship
s an
d (b
) civi
l soc
iety
par
tner
ship
sNo
NoNo
NoNo
NoNo
No
296
17.1
8.1
Prop
ortio
n of
sus
tain
able
dev
elop
men
t in
dica
tors
pro
duce
d at
the
nat
iona
l le
vel w
ith fu
ll di
sagg
rega
tion
whe
n re
leva
nt to
the
targ
et, i
n ac
cord
ance
with
the
Fund
amen
tal P
rincip
les o
f Offi
cial S
tatis
tics
NoNo
NoNo
NoNo
NoNo
297
17.1
8.2
Num
ber o
f cou
ntrie
s th
at h
ave
natio
nal s
tatis
tical
legi
slatio
n th
at c
ompl
ies
with
the
Fund
amen
tal P
rincip
les o
f Offi
cial S
tatis
tics
Yes
NoNo
NoNo
NoNo
No
298
17.1
8.3
Num
ber o
f cou
ntrie
s w
ith a
nat
iona
l sta
tistic
al p
lan
that
is fu
lly fu
nded
and
un
der i
mpl
emen
tatio
n, b
y sou
rce
of fu
ndin
gNo
NoNo
NoNo
NoNo
No
299
17.1
9.1
Dolla
r val
ue o
f all
reso
urce
s mad
e av
aila
ble
to st
reng
then
stat
istica
l cap
acity
in
dev
elop
ing
coun
tries
NoNo
NoNo
NoNo
NoNo
300
17.1
9.2
Prop
ortio
n of
cou
ntrie
s th
at (
a) h
ave
cond
ucte
d at
lea
st o
ne p
opul
atio
n an
d ho
usin
g ce
nsus
in th
e la
st 1
0 ye
ars;
and
(b) h
ave
achi
eved
100
per
cen
t birt
h re
gist
ratio
n an
d 80
per
cent
dea
th re
gist
ratio
nNo
NoNo
NoNo
NoNo
No
Tota
l num
ber o
f ind
icat
ors
as o
f 1st
of J
uly
2020
15
956
3680
2224
1013
Of w
hich
:
G
loba
l10
242
2955
2019
813
N
atio
nal
5714
725
25
20
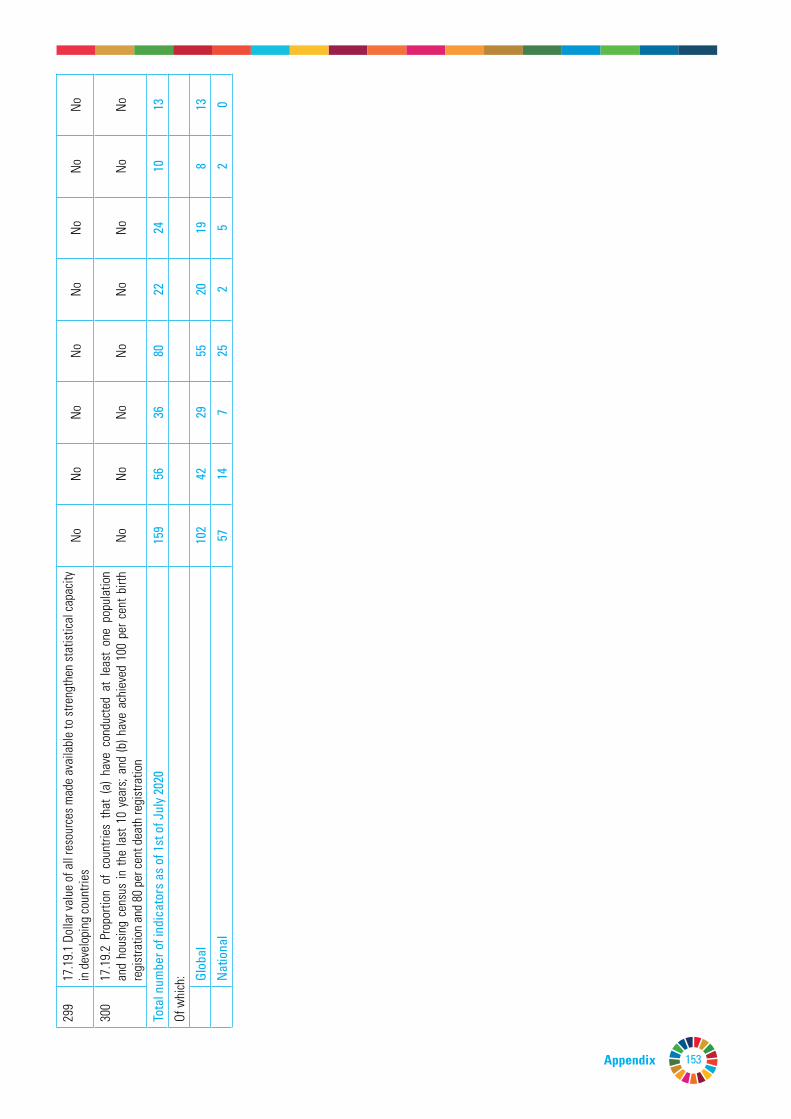
153
№In
dica
tor
Existence
Sex
Агеa
Territory
Income
Educational attainment
Disability
Ethnicity
285
17.8
.1 P
ropo
rtion
of i
ndivi
dual
s usin
g th
e In
tern
etYe
sYe
sYe
sYe
sYe
sYe
sNo
No
286
17.9
.1 D
olla
r va
lue
of fi
nanc
ial a
nd t
echn
ical a
ssist
ance
(inc
ludi
ng t
hrou
gh N
orth
-So
uth,
Sou
th-S
outh
and
tria
ngul
ar co
oper
atio
n) co
mm
itted
to d
evel
opin
g co
untri
esNo
NoNo
NoNo
NoNo
No
287
17.1
0.1
Wor
ldw
ide
wei
ghte
d ta
riff-a
vera
geNo
NoNo
NoNo
NoNo
No
288
17.1
1.1
Deve
lopi
ng co
untri
es’ a
nd le
ast d
evel
oped
coun
tries
’ sha
re o
f glo
bal e
xpor
tsNo
NoNo
NoNo
NoNo
No
289
17.1
2.1
Aver
age
tariff
s fa
ced
by d
evel
opin
g co
untri
es, l
east
dev
elop
ed c
ount
ries
and
smal
l isla
nd d
evel
opin
g St
ates
NoNo
NoNo
NoNo
NoNo
290
17.1
3.1
Mac
roec
onom
ic Da
shbo
ard
No,
repl
aced
by
na
tiona
l 17
.13.
1.1
NoNo
NoNo
NoNo
No
291
17.1
3.1.
1 M
acro
econ
omic
Dash
boar
dYe
sNo
NoNo
NoNo
NoNo
292
17.1
4.1
Num
ber o
f cou
ntrie
s w
ith m
echa
nism
s in
pla
ce to
enh
ance
pol
icy c
oher
ence
of
sust
aina
ble
deve
lopm
ent
NoNo
NoNo
NoNo
NoNo
293
17.1
5.1
Exte
nt o
f us
e of
cou
ntry
-ow
ned
resu
lts f
ram
ewor
ks a
nd p
lann
ing
tool
s by
pr
ovid
ers o
f dev
elop
men
t coo
pera
tion
NoNo
NoNo
NoNo
NoNo
294
17.1
6.1
Num
ber
of c
ount
ries
repo
rting
pro
gres
s in
mul
ti-st
akeh
olde
r de
velo
pmen
t eff
ectiv
enes
s mon
itorin
g fra
mew
orks
that
supp
ort t
he a
chie
vem
ent o
f the
sust
aina
ble
deve
lopm
ent g
oals
NoNo
NoNo
NoNo
NoNo
295
17.1
7.1
Amou
nt o
f Uni
ted
Stat
es d
olla
rs c
omm
itted
to (a
) pub
lic-p
rivat
e pa
rtner
ship
s an
d (b
) civi
l soc
iety
par
tner
ship
sNo
NoNo
NoNo
NoNo
No
296
17.1
8.1
Prop
ortio
n of
sus
tain
able
dev
elop
men
t in
dica
tors
pro
duce
d at
the
nat
iona
l le
vel w
ith fu
ll di
sagg
rega
tion
whe
n re
leva
nt to
the
targ
et, i
n ac
cord
ance
with
the
Fund
amen
tal P
rincip
les o
f Offi
cial S
tatis
tics
NoNo
NoNo
NoNo
NoNo
297
17.1
8.2
Num
ber o
f cou
ntrie
s th
at h
ave
natio
nal s
tatis
tical
legi
slatio
n th
at c
ompl
ies
with
the
Fund
amen
tal P
rincip
les o
f Offi
cial S
tatis
tics
Yes
NoNo
NoNo
NoNo
No
298
17.1
8.3
Num
ber o
f cou
ntrie
s w
ith a
nat
iona
l sta
tistic
al p
lan
that
is fu
lly fu
nded
and
un
der i
mpl
emen
tatio
n, b
y sou
rce
of fu
ndin
gNo
NoNo
NoNo
NoNo
No
299
17.1
9.1
Dolla
r val
ue o
f all
reso
urce
s mad
e av
aila
ble
to st
reng
then
stat
istica
l cap
acity
in
dev
elop
ing
coun
tries
NoNo
NoNo
NoNo
NoNo
300
17.1
9.2
Prop
ortio
n of
cou
ntrie
s th
at (
a) h
ave
cond
ucte
d at
lea
st o
ne p
opul
atio
n an
d ho
usin
g ce
nsus
in th
e la
st 1
0 ye
ars;
and
(b) h
ave
achi
eved
100
per
cen
t birt
h re
gist
ratio
n an
d 80
per
cent
dea
th re
gist
ratio
nNo
NoNo
NoNo
NoNo
No
Tota
l num
ber o
f ind
icat
ors
as o
f 1st
of J
uly
2020
15
956
3680
2224
1013
Of w
hich
:
G
loba
l10
242
2955
2019
813
N
atio
nal
5714
725
25
20
Appendix
Monitoring of the Sustainable Development Goal Indicators in the Kyrgyz Republic154
MonitoringoftheSustainableDevelopmentGoalIndicatorsintheKyrgyzRepublic
A Statistical Compendium
Responsible for publication:N.KerimalievaG.Samohleb
Y.KalymbetovaN.BaikhanovaT.Berdikeyeva
Editor:
N.Vlasova
Computer design:N.Pizan
Signed for printing: July 2020