Embed Size (px)
Citation preview
1
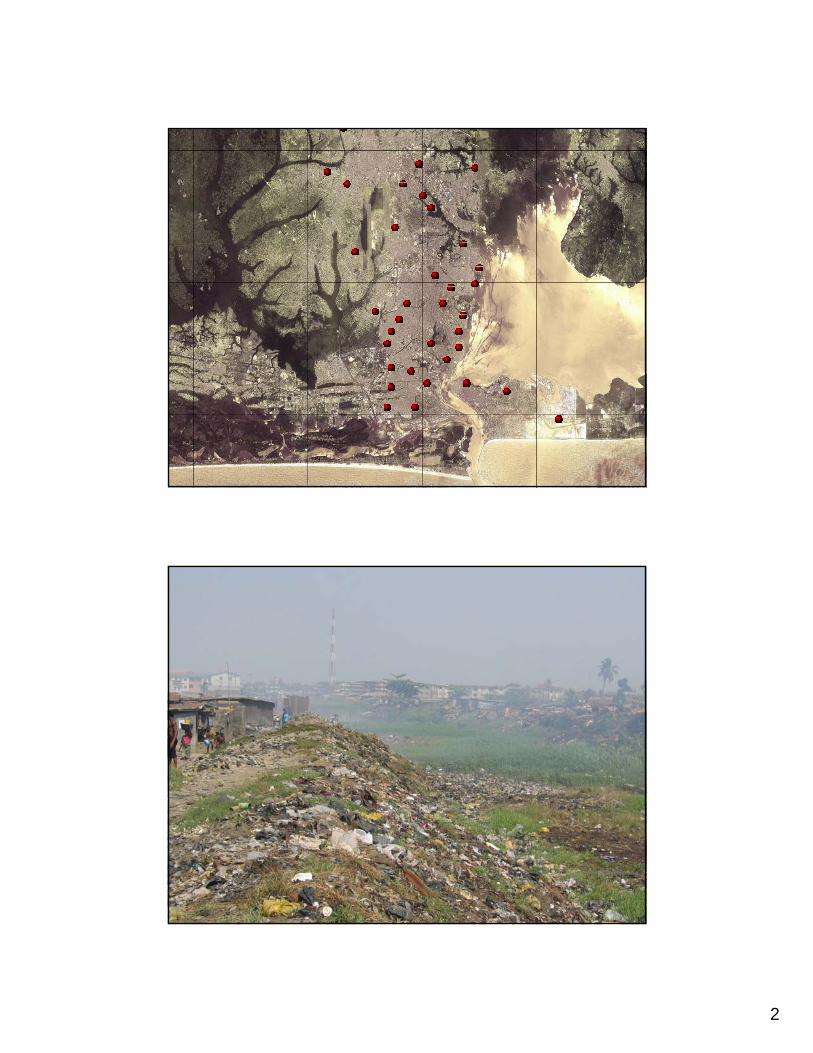
Monitoring service delivery in Lagos: solid waste
Deepali Tewari (AFTU2)Urban Learning Week
Solid Waste, March 23, 2006
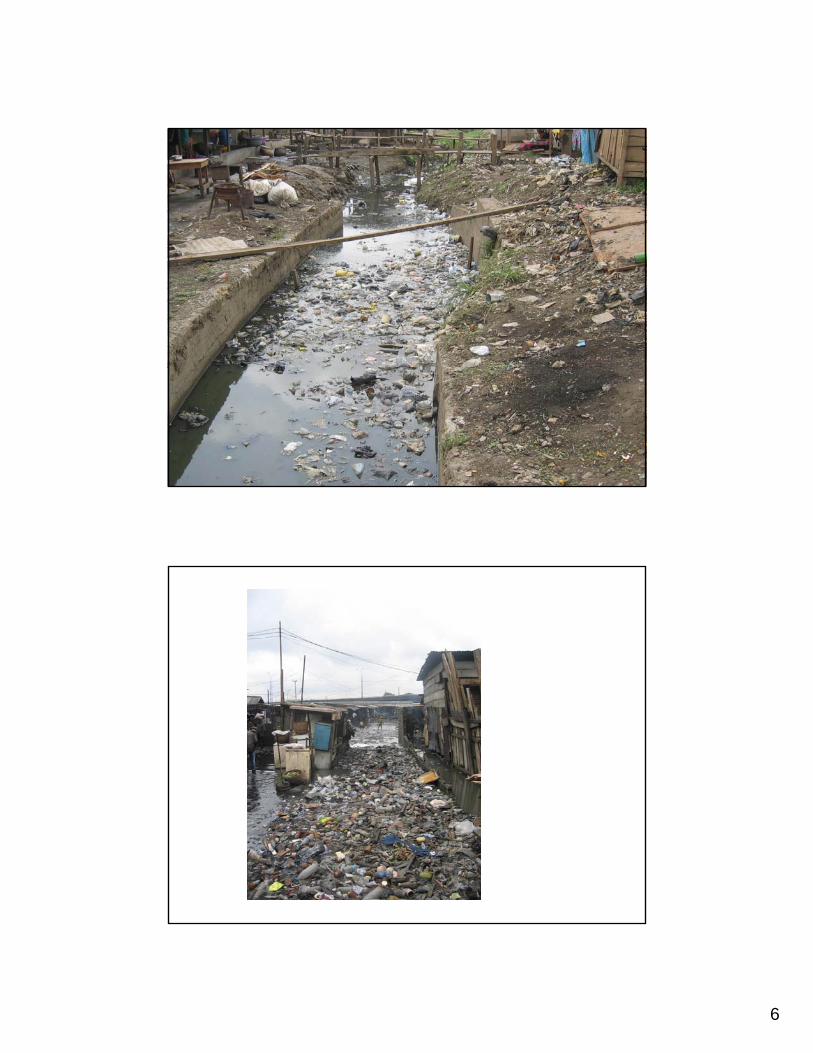
Lagos: big, important & complex
• Population larger than 37 African countries• Premier manufacturing; Largest port in W.
Africa, most inefficient in the world• “Poor” State with 20 LGs: complex political
and institutional environment• Legacy of poor governance during military
years.• Cost recovery, sustainability difficult with
basic tax and user charge systems in state of collapse after 30 years of military rule
2
3
4
5
6

7
8
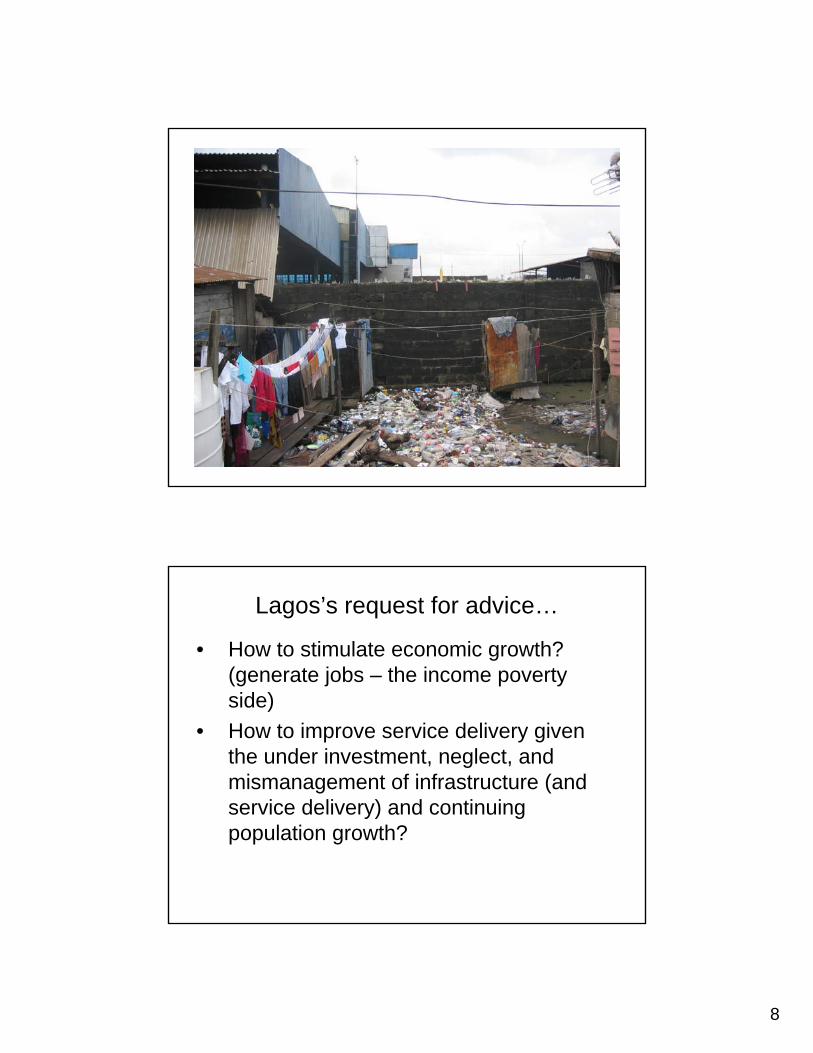
Lagos’s request for advice…
• How to stimulate economic growth? (generate jobs – the income poverty side)
• How to improve service delivery given the under investment, neglect, and mismanagement of infrastructure (and service delivery) and continuing population growth?
9
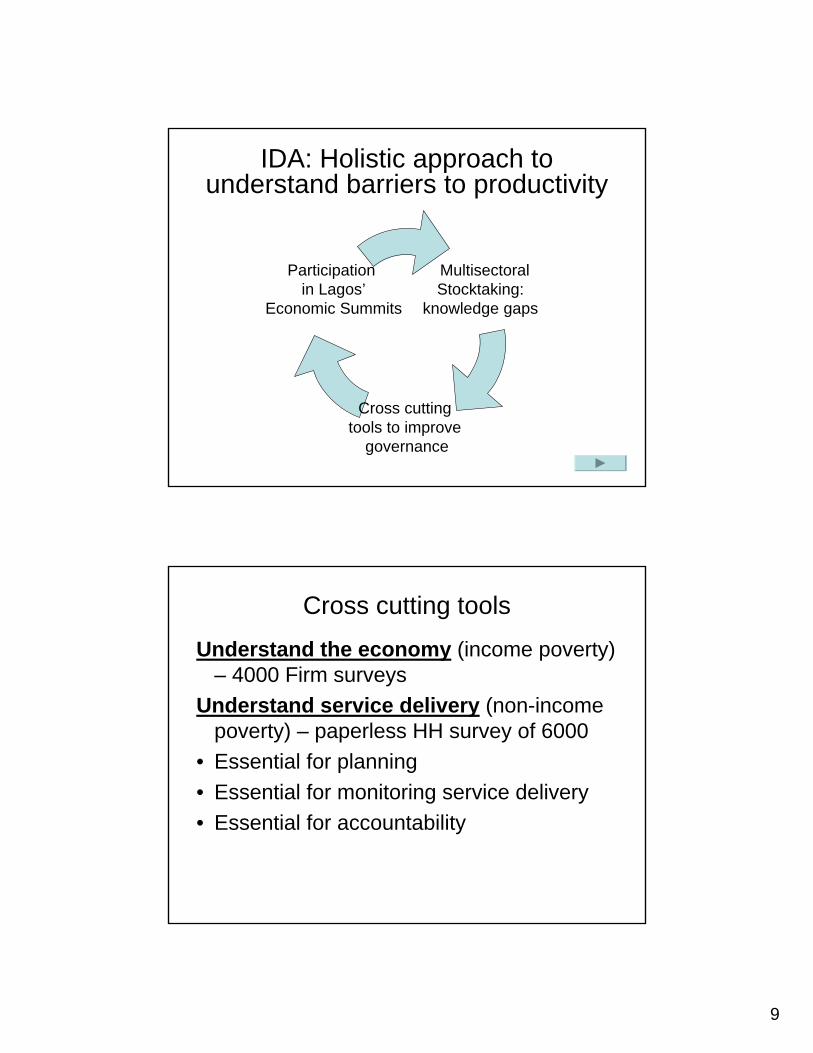
IDA: Holistic approach to understand barriers to productivity
MultisectoralStocktaking:
knowledge gaps
Cross cutting tools to improve
governance
Participation in Lagos’
Economic Summits
Cross cutting tools
Understand the economy (income poverty) – 4000 Firm surveys
Understand service delivery (non-income poverty) – paperless HH survey of 6000
• Essential for planning• Essential for monitoring service delivery• Essential for accountability
10
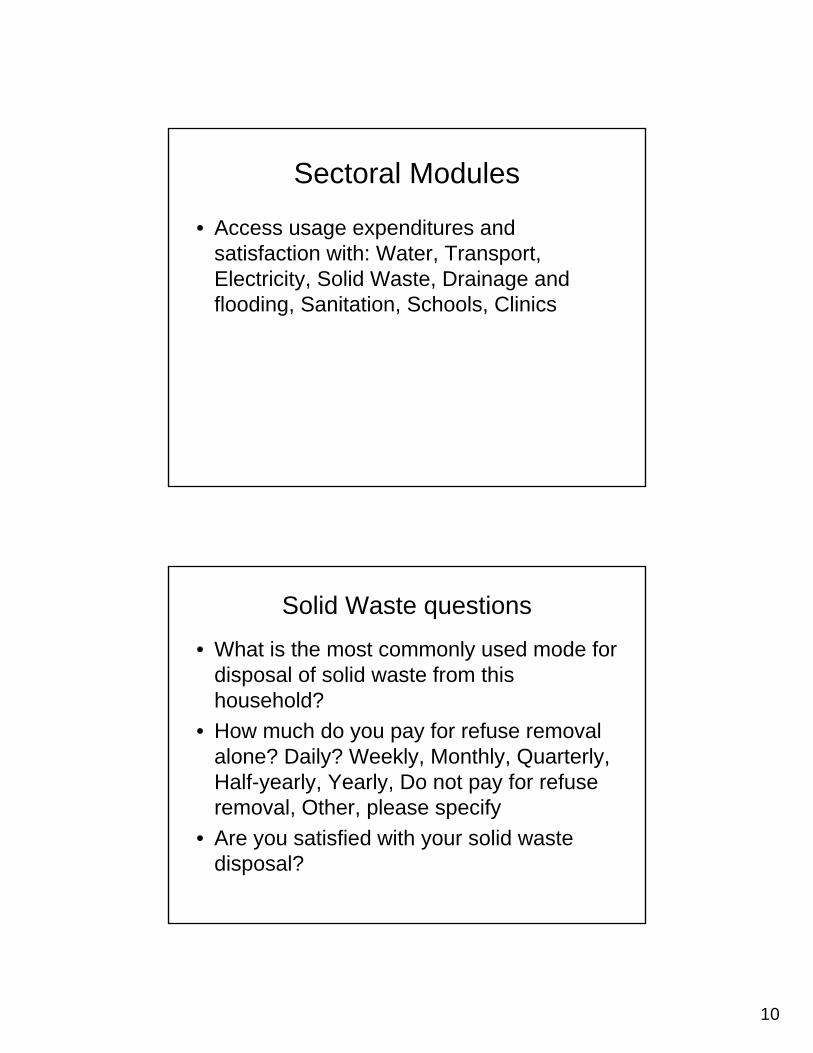
Sectoral Modules
• Access usage expenditures and satisfaction with: Water, Transport, Electricity, Solid Waste, Drainage and flooding, Sanitation, Schools, Clinics
Solid Waste questions
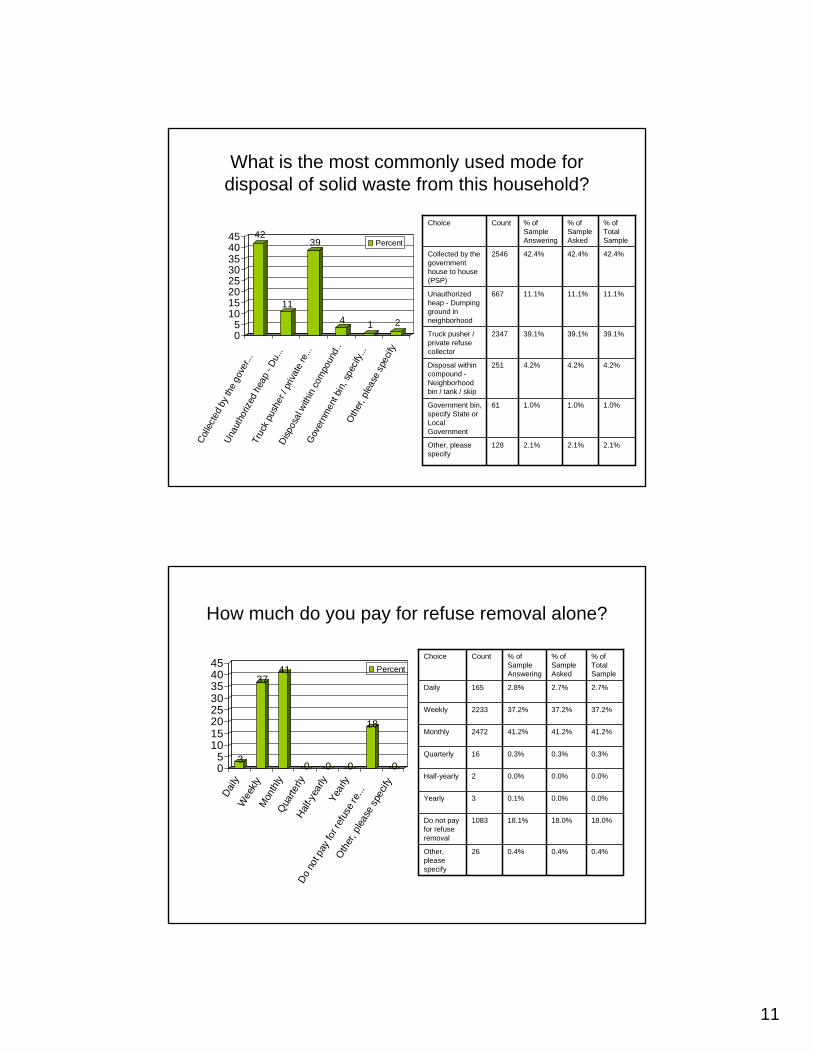
• What is the most commonly used mode for disposal of solid waste from this household?
• How much do you pay for refuse removal alone? Daily? Weekly, Monthly, Quarterly, Half-yearly, Yearly, Do not pay for refuse removal, Other, please specify
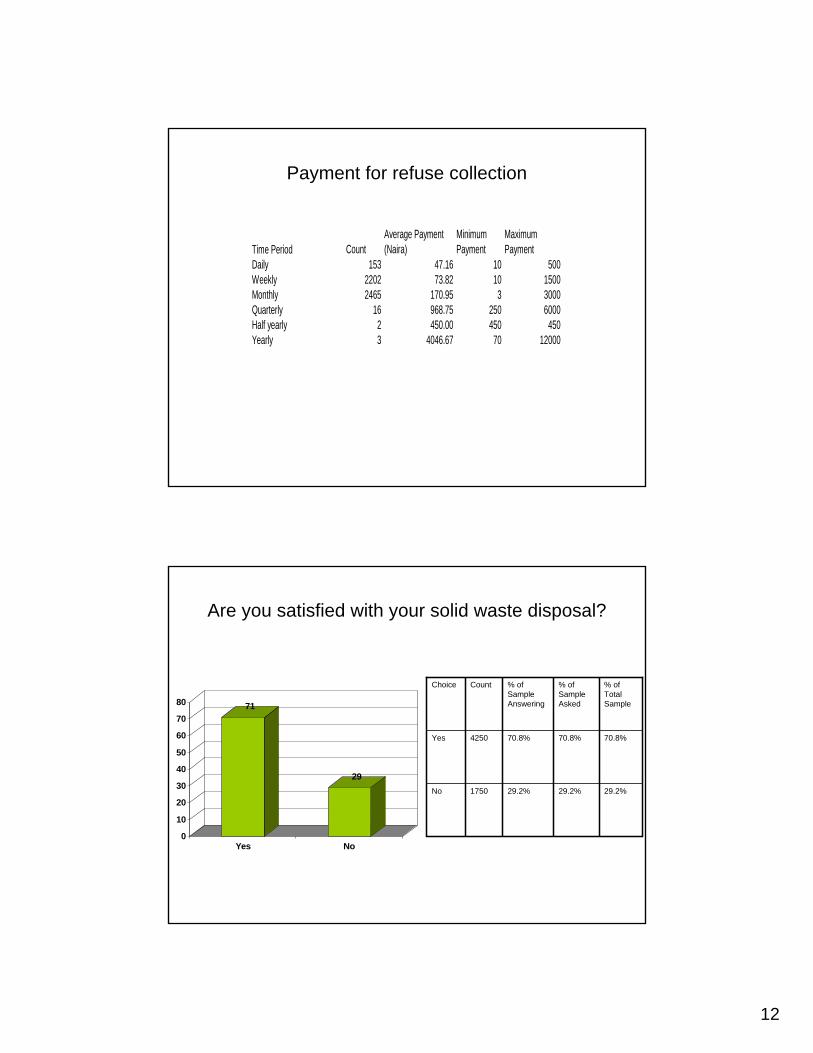
• Are you satisfied with your solid waste disposal?
11
What is the most commonly used mode for disposal of solid waste from this household?
2.1%
1.0%
4.2%
39.1%
11.1%
42.4%
% of Sample Asked
2.1%
1.0%
4.2%
39.1%
11.1%
42.4%
% of Sample Answering
128
61
251
2347
667
2546
Count
Other, please specify
Government bin, specify State or Local Government
Disposal within compound -Neighborhood bin / tank / skip
Truck pusher / private refuse collector
Unauthorized heap - Dumping ground in neighborhood
Collected by the government house to house (PSP)
Choice
2.1%
1.0%
4.2%
39.1%
11.1%
42.4%
% of Total Sample
42
11
39
4 1 205
1015202530354045
Colle
cted
by
the
gove
r...
Unau
thor
ized
heap
- Du
...
Truc
k pu
sher
/ pr
ivate
re...
Disp
osal
with
in co
mpo
und.
.
Gov
ernm
ent b
in, s
pecif
y...
Oth
er, p
lease
spe
cify
Percent
How much do you pay for refuse removal alone?
0.4%
18.0%
0.0%
0.0%
0.3%
41.2%
37.2%
2.7%
% of Sample Asked
0.4%
18.1%
0.1%
0.0%
0.3%
41.2%
37.2%
2.8%
% of Sample Answering
26
1083
3
2
16
2472
2233
165
Count
Other, please specify
Do not pay for refuse removal
Yearly
Half-yearly
Quarterly
Monthly
Weekly
Daily
Choice
0.4%
18.0%
0.0%
0.0%
0.3%
41.2%
37.2%
2.7%
% of Total Sample
3
3741
0 0 0
18
005
1015202530354045
Daily
Wee
klyM
onth
lyQua
rterly
Half-
year
lyYe
arly
Do n
ot p
ay fo
r ref
use r
e...
Other
, plea
se sp
ecify
Percent
12
Payment for refuse collection
Time Period CountAverage Payment (Naira)
Minimum Payment
Maximum Payment
Daily 153 47.16 10 500Weekly 2202 73.82 10 1500Monthly 2465 170.95 3 3000Quarterly 16 968.75 250 6000Half yearly 2 450.00 450 450Yearly 3 4046.67 70 12000
Are you satisfied with your solid waste disposal?
71
29
0
10
20
30
40
50
60
70
80
Yes No
29.2%
70.8%
% of Sample Asked
29.2%
70.8%
% of Sample Answering
1750
4250
Count
No
Yes
Choice
29.2%
70.8%
% of Total Sample
13
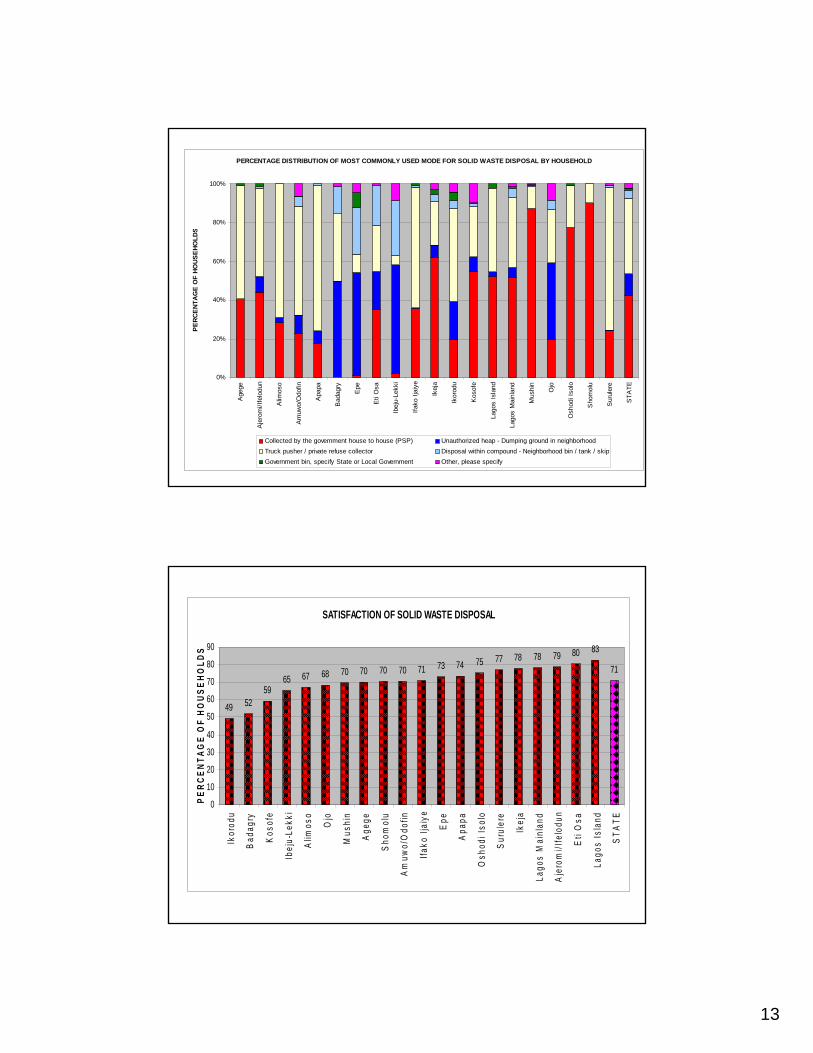
PERCENTAGE DISTRIBUTION OF MOST COMMONLY USED MODE FOR SOLID WASTE DISPOSAL BY HOUSEHOLD
0%
20%
40%
60%
80%
100%
Age
ge
Aje
rom
i/Ife
lodu
n
Alim
oso
Am
uwo/
Odo
fin
Apa
pa
Bad
agry
Epe
Eti
Osa
Ibej
u-Le
kki
Ifako
Ijai
ye
Ikej
a
Ikor
odu
Kos
ofe
Lago
s Is
land
Lago
s M
ainl
and
Mus
hin
Ojo
Osh
odi I
solo
Sho
mol
u
Sur
uler
e
STA
TE
PERC
ENT
AG
E O
F HO
USE
HOLD
S
Collected by the government house to house (PSP) Unauthorized heap - Dumping ground in neighborhoodTruck pusher / private refuse collector Disposal within compound - Neighborhood bin / tank / skipGovernment bin, specify State or Local Government Other, please specify
SATISFACTION OF SOLID WASTE DISPOSAL
49 5259
65 67 68 70 70 70 70 71 73 74 75 77 78 78 79 80 83
71
0
10
20
30
40
50
60
70
80
90
Ikor
odu
Bad
agry
Kos
ofe
Ibej
u-Le
kki
Alim
oso
Ojo
Mus
hin
Age
ge
Sho
mol
u
Am
uwo/
Odo
fin
Ifako
Ijai
ye
Epe
Apa
pa
Osh
odi I
solo
Sur
uler
e
Ikej
a
Lago
s M
ainl
and
Aje
rom
i/Ife
lodu
n
Eti
Osa
Lago
s Is
land
STA
TE
PER
CEN
TAG
E O
F H
OUS
EHO
LDS
14
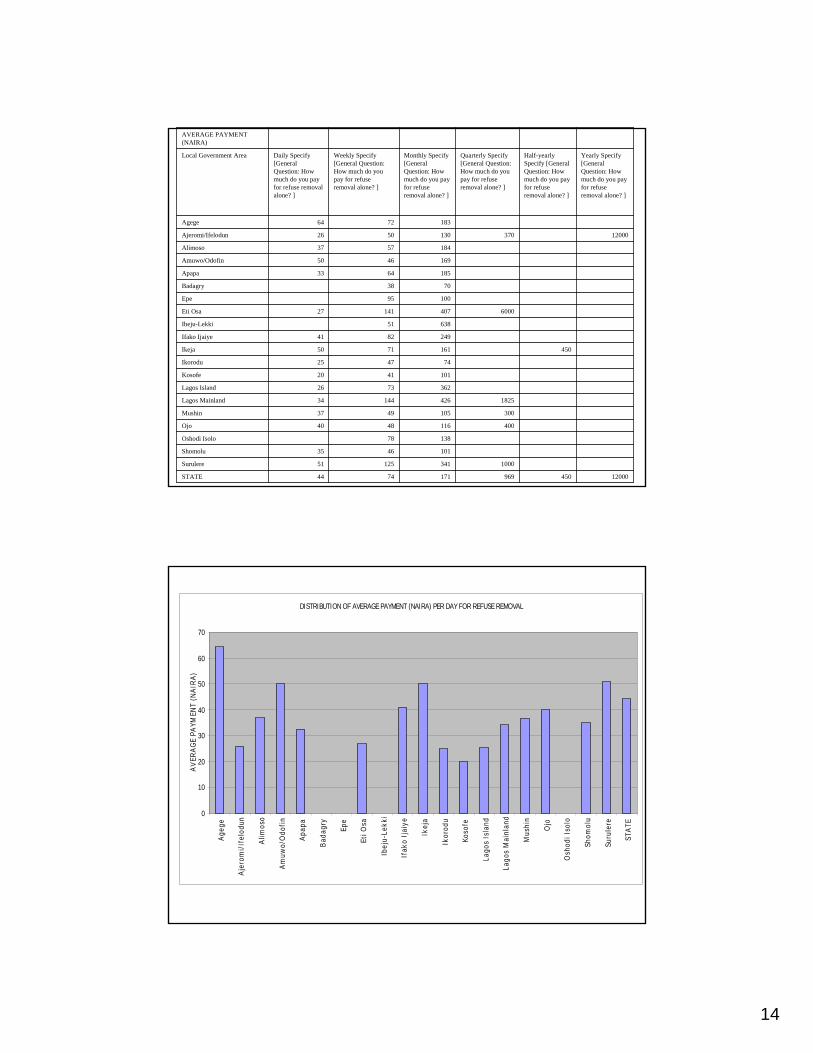
120004509691717444STATE
100034112551Surulere
1014635Shomolu
13878Oshodi Isolo
4001164840Ojo
3001054937Mushin
182542614434Lagos Mainland
3627326Lagos Island
1014120Kosofe
744725Ikorodu
4501617150Ikeja
2498241Ifako Ijaiye
63851Ibeju-Lekki
600040714127Eti Osa
10095Epe
7038Badagry
1856433Apapa
1694650Amuwo/Odofin
1845737Alimoso
120003701305026Ajeromi/Ifelodun
1837264Agege
Yearly Specify [General Question: How much do you pay for refuse removal alone? ]
Half-yearly Specify [General Question: How much do you pay for refuse removal alone? ]
Quarterly Specify [General Question: How much do you pay for refuse removal alone? ]
Monthly Specify [General Question: How much do you pay for refuse removal alone? ]
Weekly Specify [General Question: How much do you pay for refuse removal alone? ]
Daily Specify [General Question: How much do you pay for refuse removal alone? ]
Local Government Area
AVERAGE PAYMENT (NAIRA)
DISTRIBUTION OF AVERAGE PAYMENT (NAIRA) PER DAY FOR REFUSE REMOVAL
0
10
20
30
40
50
60
70
Age
ge
Aje
rom
i/If
elod
un
Alim
oso
Am
uwo/
Odo
fin
Apa
pa
Bad
agry
Epe
Eti O
sa
Ibej
u-Le
kki
Ifak
o Ij
aiye
Ikej
a
Ikor
odu
Koso
fe
Lago
s Is
land
Lago
s M
ainl
and
Mus
hin
Ojo
Osh
odi I
solo
Shom
olu
Suru
lere
STA
TE
AV
ERA
GE
PAYM
ENT
(NA
IRA
)
15
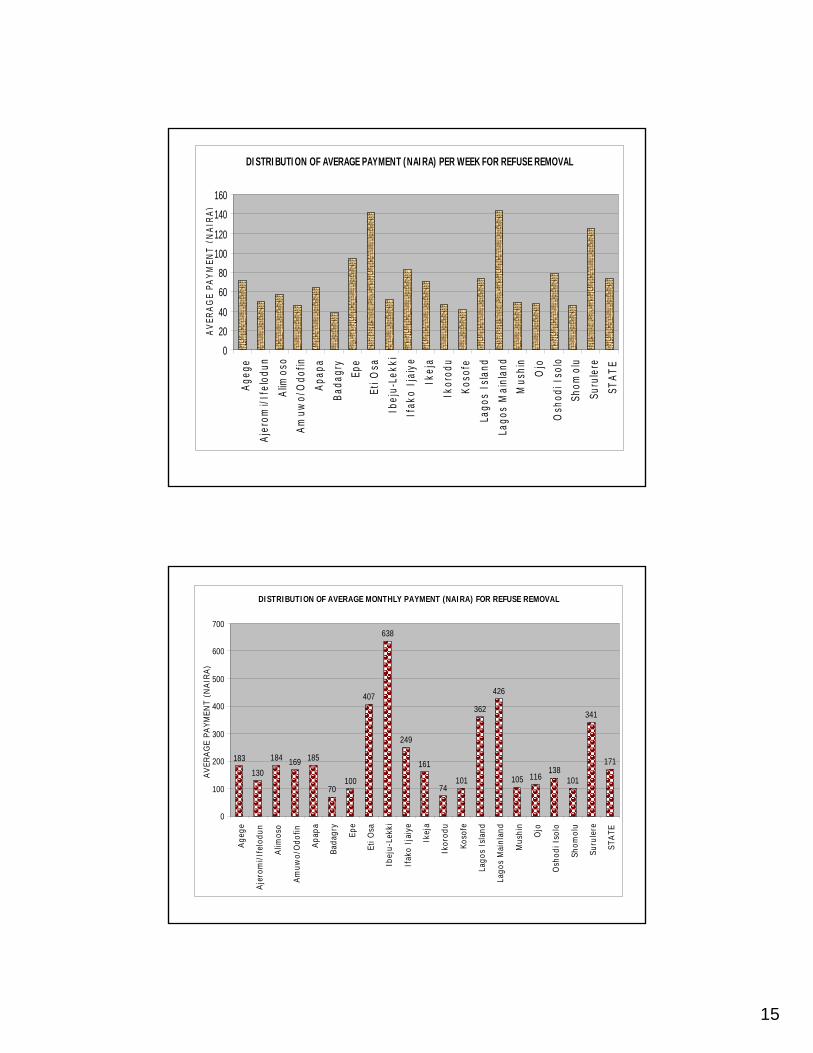
DISTRIBUTION OF AVERAGE PAYMENT (NAIRA) PER WEEK FOR REFUSE REMOVAL
0
20
40
60
80
100
120
140
160
Ageg
e
Ajer
omi/I
felo
dun
Alim
oso
Amuw
o/O
dofin
Apap
a
Bada
gry
Epe
Eti O
sa
Ibej
u-Le
kki
Ifak
o Ij
aiye
Ikej
a
Ikor
odu
Koso
fe
Lago
s Is
land
Lago
s M
ainl
and
Mus
hin
Ojo
Osh
odi I
solo
Shom
olu
Suru
lere
STAT
E
AVER
AGE
PAYM
ENT
(NAI
RA)
DISTRIBUTION OF AVERAGE MONTHLY PAYMENT (NAIRA) FOR REFUSE REMOVAL
183
130
184 169 185
70100
407
638
249
161
74101
362
426
105 116138
101
341
171
0
100
200
300
400
500
600
700
Age
ge
Aje
rom
i/If
elod
un
Alim
oso
Am
uwo/
Odo
fin
Apa
pa
Bada
gry
Epe
Eti O
sa
Ibej
u-Le
kki
Ifak
o Ij
aiye
Ikej
a
Ikor
odu
Koso
fe
Lago
s Is
land
Lago
s M
ainl
and
Mus
hin
Ojo
Osh
odi I
solo
Shom
olu
Suru
lere
STA
TE
AV
ERA
GE
PAYM
ENT
(NA
IRA
)

16
DISTRIBUTION OF AVERAGE QUARTERLY PAYMENT (NAIRA) FOR REFUSE REMOVAL
370
6000
1825
400 10
00
969
300
0
1000
2000
3000
4000
5000
6000
7000
Ageg
e
Ajer
omi/I
felo
dun
Alim
oso
Amuw
o/O
dofin
Apap
a
Bada
gry
Epe
Eti O
sa
Ibej
u-Le
kki
Ifak
o Ij
aiye
Ikej
a
Ikor
odu
Koso
fe
Lago
s Is
land
Lago
s M
ainl
and
Mus
hin
Ojo
Osh
odi I
solo
Shom
olu
Suru
lere
STAT
E
AVER
AGE
PAYM
ENT
(NAI
RA)
DISTRIBUTION OF AVERAGE HALF YEARLY PAYMENT (NAIRA) FOR REFUSE REMOVAL
050
100150200250300350400450500
Age
ge
Aje
rom
i/If
elod
un
Alim
oso
Am
uwo/
Odo
fin
Apa
pa
Bada
gry
Epe
Eti O
sa
Ibej
u-Le
kki
Ifak
o Ij
aiye
Ikej
a
Ikor
odu
Koso
fe
Lago
s Is
land
Lago
s M
ainl
and
Mus
hin
Ojo
Osh
odi I
solo
Shom
olu
Suru
lere
STA
TE
AV
ERA
GE
PAYM
ENT
(NA
IRA
)
17
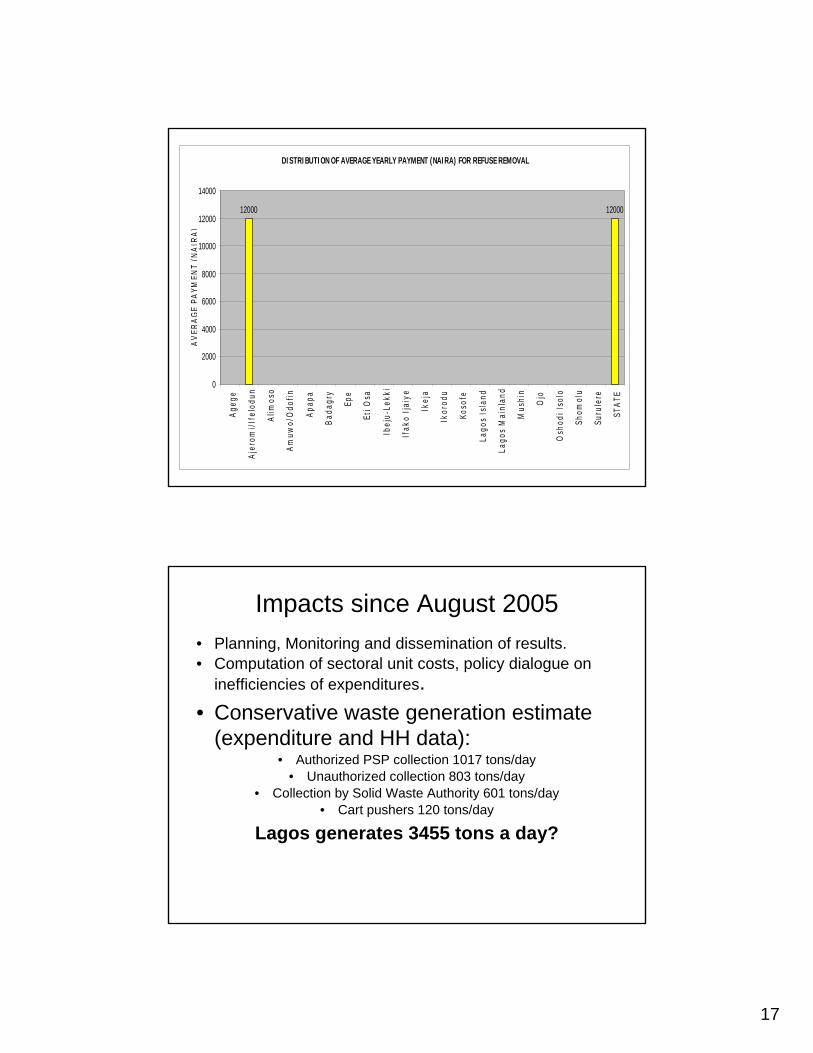
DISTRIBUTION OF AVERAGE YEARLY PAYMENT (NAIRA) FOR REFUSE REMOVAL
12000 12000
0
2000
4000
6000
8000
10000
12000
14000
Age
ge
Aje
rom
i/If
elod
un
Alim
oso
Am
uwo/
Odo
fin
Apa
pa
Bad
agry
Epe
Eti O
sa
Ibej
u-Le
kki
Ifak
o Ij
aiye
Ikej
a
Ikor
odu
Koso
fe
Lago
s Is
land
Lago
s M
ainl
and
Mus
hin
Ojo
Osh
odi I
solo
Shom
olu
Suru
lere
STA
TE
AV
ERA
GE
PAYM
ENT
(NA
IRA
)
Impacts since August 2005• Planning, Monitoring and dissemination of results.• Computation of sectoral unit costs, policy dialogue on
inefficiencies of expenditures.• Conservative waste generation estimate
(expenditure and HH data):• Authorized PSP collection 1017 tons/day
• Unauthorized collection 803 tons/day• Collection by Solid Waste Authority 601 tons/day
• Cart pushers 120 tons/day
Lagos generates 3455 tons a day?
18
19
20
With respect to poverty..…..there was not much on Lagos, what existed
provided little operational guidance and did not support credible monitoring.
____________________________To fill the knowledge gaps:
• Need a non-income poverty assessment to target basic service delivery (welfare enhancement to poor households)
• A baseline to monitor impacts of sectoralexpenditures
Little understanding of the structure of Lagos’ economy..
…..to facilitate informed policy making for poverty reduction through job creation, and for removing constraints to growth, including location specific
constraints. Need to understand the linkages between firm size and sector and their relationship to employment creation.
______________________________What was needed: a comprehensive survey of
businesses (large, medium, micro, household) to understand the structure of
the economy.