Embed Size (px)
Citation preview
Available online at www.sciencedirect.com
Energy Procedia 00 (2010) 000–000
����������� ��
www.elsevier.com/locate/XXX
GHGT-10
Monitoring the CO2 injection site: K12-B
Vincent Vandeweijer1, Bert van der Meer
1, Cor Hofstee
1,
Frans Mulders2, Daan D’Hoore
2 and Hilbrand Graven
2
1 TNO Geological Survey of the Netherlands
2 GDF SUEZ E&P Nederland B.V.
Elsevier use only: Received date here; revised date here; accepted date here
Abstract
The K12-B gas field is located in the Dutch sector of the North Sea. The top of the reservoir lies approximately 3800 meters
below sea level, and the ambient temperature of the reservoir is over 127 ºC. The K12-B gas field has been producing natural gas
from 1987 onwards and is currently operated by GDF SUEZ E&P Nederland B.V. The natural gas has an initial CO2 content of
13%, which is relatively high. Since the start of the gas production the CO2 component has been separated from the natural gas
stream on-site and since 2004 part of the separated CO2 is re-injected into the gas field.
In 2004 a demonstration project commenced where CO2 was re-injected into K12-B. The goal was to investigate the feasibility of
CO2 injection and storage in depleted natural gas fields. More than 6 years later CO2 injection is still taking place and numerous
monitoring techniques have been applied in order to get a better understanding of various aspects of underground CO2 storage in
nearly depleted gas fields. Over the years monitoring activities have mainly focused on the well integrity and on the behavior of
the CO2 in the well and reservoir.
The cap rock present at K12-B consists of hundreds of meters of rock salts from the Zechstein Super Group. The most likely
migration pathway for any gas, should migration occur at all is therefore along the well bores. Establishing the conditions of
wells is of great importance for safety issues. Some of the tools which have been used will be discussed.
Another goal for the various monitoring activities is to gain a better understanding of the behavior of the CO2 in the injection
wells and the migration of the CO2 in the reservoir. How the CO2 migrates in the reservoir is important as regards the assessment
of the potential for enhanced gas recovery (EGR) by CO2 injection.
© 2010 Elsevier Ltd. All rights reserved
Keywords: K12-B; CO2 storage; depleted gas field; North Sea; Monitoring; Well integrity; Reservoir engineering
c⃝ 2011 Published by Elsevier Ltd.
Energy Procedia 4 (2011) 5471–5478
www.elsevier.com/locate/procedia
doi:10.1016/j.egypro.2011.02.532
Open access under CC BY-NC-ND license.
2 V.P. Vandeweijer/ Energy Procedia 00 (2010) 000–000
1. Introduction
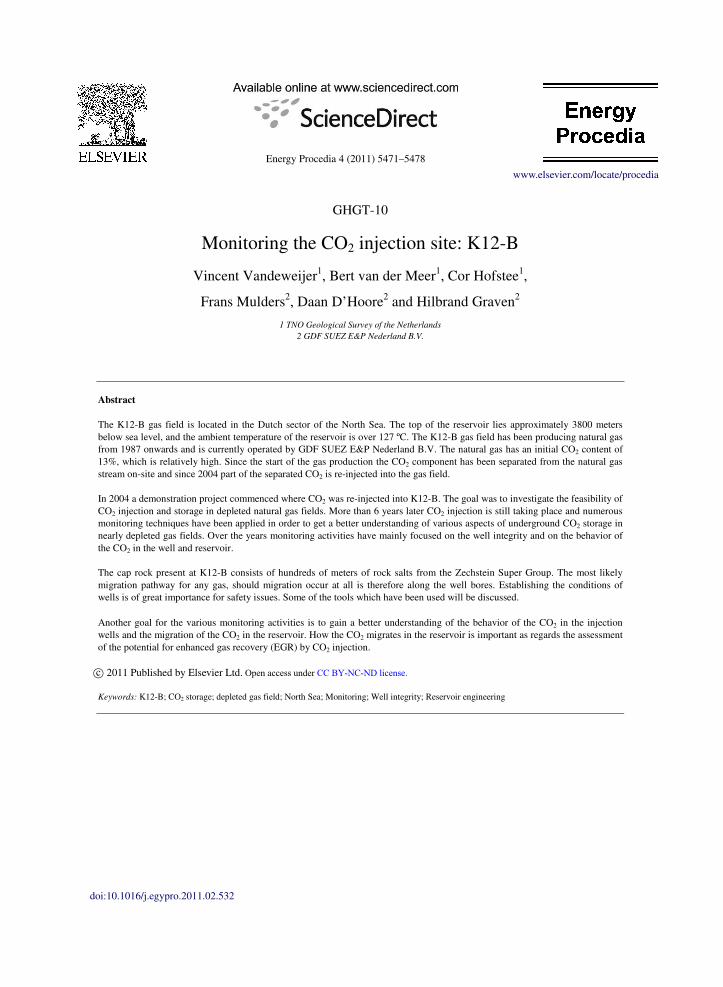
K12-B is the first site in the world where CO2 is being injected into the same reservoir from which it was
produced as part of the natural gas. The K12-B gas field is located in the Dutch sector of the North Sea (Figure 1). It
has been producing gas from 1987 onwards and is operated by GDF SUEZ E&P Nederland B.V.
The K12-B structure was discovered in 1982 and the gas is produced since 1987 from the Upper Slochteren
Formation. The top of the reservoir lies approximately 3800 meters below sea level, and the ambient temperature of
the reservoir is over 127 ºC. To date, the K12-B field has produced more than 12 billion cubic meters (BCM) of gas,
which corresponds to about 90% of the initial gas in place (IGIP). The initial reservoir pressure of 400 bar has
dropped to the current value of roughly 40 bar.
Because the natural gas initially contained 13% of CO2 the latter is separated from the gas stream on-site. This
has happened since the beginning of gas production, but since 2004 part of the separated CO2 is re-injected into the
gas field, first via injection well K12-B8 into compartment 4, and since 2005 via injection well K12-B6 into
compartment 3, where two producing wells are located (Figure 1). In order to investigate various aspects regarding
offshore underground storage of CO2 in nearly depleted gas fields numerous tests have been performed at the site.
Figure 1. Location, 3D impression and overview of relevant wells and compartments of the K12-B gas field [1].
This publication will explain how a number of monitoring techniques have contributed to our knowledge about
CO2 injection in K12-B and in nearly depleted gas fields in general.
2. Well Integrity
The primary seal of the K12-B gas field consists of several hundreds of meters of deposits of the Zechstein Super
Group. These deposits mainly consist of rock salts and other evaporites with possibly some minor intercalations of
carbonates and claystones. These deposits are regarded as the best possible seal for any kind of gas reservoir.
Performance assessment has indicated that if migration of CO2 to shallower strata should occur at all, the most likely
migration pathway would be along the well bores.
Due to the acidic nature of CO2 in water and the uncertainties about the actual down-hole conditions, establishing
and monitoring any change in the integrity of the (injection) wells is of great importance. Various types of tools
have been used at K12-B for this purpose, and we will present some of them now.
2.1. Multi-finger imaging tools
Since the start of the CO2 injection in multi-well compartment 3 tubing integrity surveys have been performed in
time lapse. The goal of these surveys was to image and monitor the inner tubing of CO2 injection well K12-B6
5472 V. Vandeweijer et al. / Energy Procedia 4 (2011) 5471–5478
V.P. Vandeweijer/ Energy Procedia 00 (2010) 000–000 3
during prolonged exposure to CO2. Multi-finger imaging/caliper tools, like the Kinley Caliper and the PMIT,
provide high resolution, multiple internal tubing radii measurements using mechanical calipers.
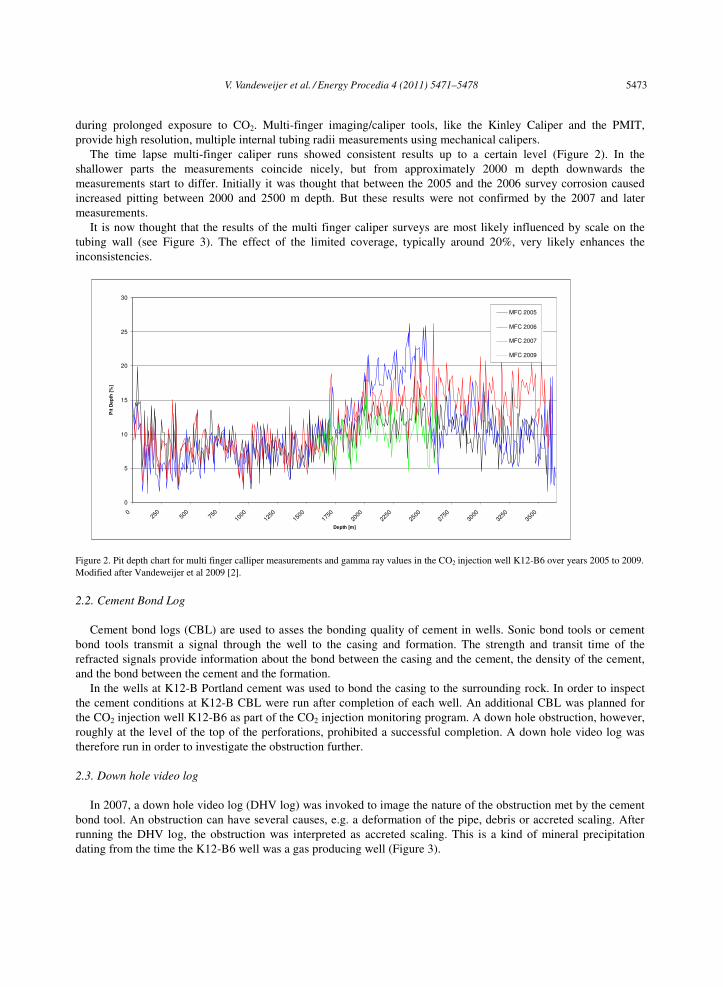
The time lapse multi-finger caliper runs showed consistent results up to a certain level (Figure 2). In the
shallower parts the measurements coincide nicely, but from approximately 2000 m depth downwards the
measurements start to differ. Initially it was thought that between the 2005 and the 2006 survey corrosion caused
increased pitting between 2000 and 2500 m depth. But these results were not confirmed by the 2007 and later
measurements.
It is now thought that the results of the multi finger caliper surveys are most likely influenced by scale on the
tubing wall (see Figure 3). The effect of the limited coverage, typically around 20%, very likely enhances the
inconsistencies.
0
5
10
15
20
25
30
025
050
075
0
1000
1250
1500
1750
2000
2250
2500
2750
3000
3250
3500
Depth [m]
Pit
Dep
th [
%]
MFC 2005
MFC 2006
MFC 2007
MFC 2009
Figure 2. Pit depth chart for multi finger calliper measurements and gamma ray values in the CO2 injection well K12-B6 over years 2005 to 2009.
Modified after Vandeweijer et al 2009 [2].
2.2. Cement Bond Log
Cement bond logs (CBL) are used to asses the bonding quality of cement in wells. Sonic bond tools or cement
bond tools transmit a signal through the well to the casing and formation. The strength and transit time of the
refracted signals provide information about the bond between the casing and the cement, the density of the cement,
and the bond between the cement and the formation.
In the wells at K12-B Portland cement was used to bond the casing to the surrounding rock. In order to inspect
the cement conditions at K12-B CBL were run after completion of each well. An additional CBL was planned for
the CO2 injection well K12-B6 as part of the CO2 injection monitoring program. A down hole obstruction, however,
roughly at the level of the top of the perforations, prohibited a successful completion. A down hole video log was
therefore run in order to investigate the obstruction further.
2.3. Down hole video log
In 2007, a down hole video log (DHV log) was invoked to image the nature of the obstruction met by the cement
bond tool. An obstruction can have several causes, e.g. a deformation of the pipe, debris or accreted scaling. After
running the DHV log, the obstruction was interpreted as accreted scaling. This is a kind of mineral precipitation
dating from the time the K12-B6 well was a gas producing well (Figure 3).
V. Vandeweijer et al. / Energy Procedia 4 (2011) 5471–5478 5473

4 V.P. Vandeweijer/ Energy Procedia 00 (2010) 000–000
Figure 3. Left DHV image of the obstruction in well K12-B6 hampering the CBL. Right: DHV image from K12-B6 at approximately 3700 m
depth (AH WLM). Bright, cloudy structured scale on the liner walls is clearly visible. The straight feature in the scale is probably a drag mark of
centralizer arms of logging tools.
The DHV log also revealed scaling over the rest of the imaged trajectory. It is thought that the deep scrape marks,
probably caused by tool centralizer arms and cables, are partly responsible for the differences observed over the
various multi finger caliper surveys. Here the earlier described short coming of the limited coverage of multi finger
caliper tools become obvious. The fact that the multi-finger caliper did not measure the inner radius of the pipe but
moreover the inner radius of the scale, caused us to look for alternatives for establishing pipe and well integrity.
2.4. Electromagnetic imaging tool (EMIT)
An alternative was found by using a (then) experimental electromagnetic imaging tool by Schlumberger, the
EMIT. The EMIT was used, because the interpretation of the multi-finger caliper tool results was impeded by the
scale buildup inside the tubing. The EMIT is insensitive to most of the common minerals precipitated in well bores,
and as long the distance between the sensors and the pipe wall is not too large an EMIT should be able to provide
proper readings. Therefore the EMIT should be suited for imaging the pipe integrity through layers of scaling.
Moreover, by design the EMIT gives 100% coverage of the tubing.
By taking advantage of both the skin-effect and the difference in signal between the near and remote regions the
EMIT is able to make four distinct measurements [3]. The first determines the casing’s electrical and magnetic
properties. The second measures the average thickness of the metal, and the final two measurements record images
of the pipe using 18 pad sensors pressed against the inner wall of the pipe. One image uses low frequencies and the
other image uses high frequencies. This is done in order to discriminate inner wall features from those elsewhere. A
combination of these measurements provides the means for a detailed analysis on pipe integrity.
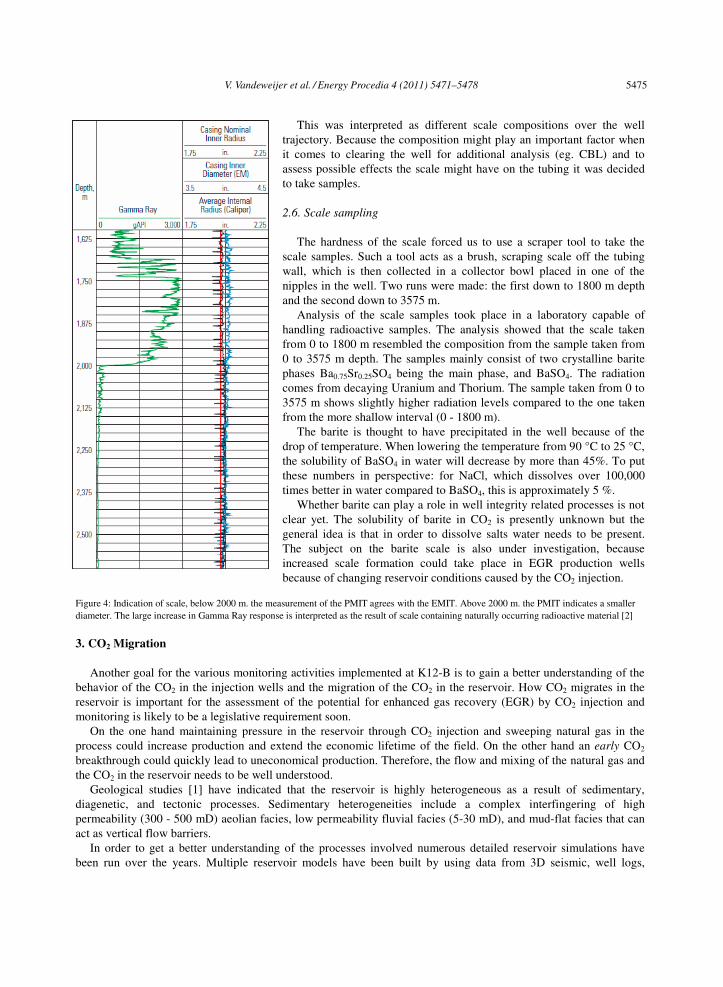
An EMIT was deployed in 2009 to establish the pipe integrity of the CO2 injection well K12-B6. Contrary to the
earlier readings from the multi finger imaging tools the EMIT results showed very consistent pipe integrity over the
measured interval (Figure 4). Current plans are to realize further runs with the EMIT in order to create a time-lapse
series.
2.5. Gamma ray
In combination with the EMIT survey a gamma ray (GR) tool was run. The GR tool provided data on the
radiation intensity of the material inside and nearby the well. These measurements, although not directly linked to
well integrity, could provide insight in the mineral composition of the scaling. Figure 4 shows various levels of
gamma radiation over the measured well trajectory. It starts of with a value of approximately 700 gAPI, rises
quickly to values over 2000 gAPI, and then drops to low values which can be considered back ground radiation.
5474 V. Vandeweijer et al. / Energy Procedia 4 (2011) 5471–5478
V.P. Vandeweijer/ Energy Procedia 00 (2010) 000–000 5
This was interpreted as different scale compositions over the well
trajectory. Because the composition might play an important factor when
it comes to clearing the well for additional analysis (eg. CBL) and to
assess possible effects the scale might have on the tubing it was decided
to take samples.
2.6. Scale sampling
The hardness of the scale forced us to use a scraper tool to take the
scale samples. Such a tool acts as a brush, scraping scale off the tubing
wall, which is then collected in a collector bowl placed in one of the
nipples in the well. Two runs were made: the first down to 1800 m depth
and the second down to 3575 m.
Analysis of the scale samples took place in a laboratory capable of
handling radioactive samples. The analysis showed that the scale taken
from 0 to 1800 m resembled the composition from the sample taken from
0 to 3575 m depth. The samples mainly consist of two crystalline barite
phases Ba0.75Sr0.25SO4 being the main phase, and BaSO4. The radiation
comes from decaying Uranium and Thorium. The sample taken from 0 to
3575 m shows slightly higher radiation levels compared to the one taken
from the more shallow interval (0 - 1800 m).
The barite is thought to have precipitated in the well because of the
drop of temperature. When lowering the temperature from 90 °C to 25 °C,
the solubility of BaSO4 in water will decrease by more than 45%. To put
these numbers in perspective: for NaCl, which dissolves over 100,000
times better in water compared to BaSO4, this is approximately 5 %.
Whether barite can play a role in well integrity related processes is not
clear yet. The solubility of barite in CO2 is presently unknown but the
general idea is that in order to dissolve salts water needs to be present.
The subject on the barite scale is also under investigation, because
increased scale formation could take place in EGR production wells
because of changing reservoir conditions caused by the CO2 injection.
Figure 4: Indication of scale, below 2000 m. the measurement of the PMIT agrees with the EMIT. Above 2000 m. the PMIT indicates a smaller
diameter. The large increase in Gamma Ray response is interpreted as the result of scale containing naturally occurring radioactive material [2]
3. CO2 Migration
Another goal for the various monitoring activities implemented at K12-B is to gain a better understanding of the
behavior of the CO2 in the injection wells and the migration of the CO2 in the reservoir. How CO2 migrates in the
reservoir is important for the assessment of the potential for enhanced gas recovery (EGR) by CO2 injection and
monitoring is likely to be a legislative requirement soon.
On the one hand maintaining pressure in the reservoir through CO2 injection and sweeping natural gas in the
process could increase production and extend the economic lifetime of the field. On the other hand an early CO2
breakthrough could quickly lead to uneconomical production. Therefore, the flow and mixing of the natural gas and
the CO2 in the reservoir needs to be well understood.
Geological studies [1] have indicated that the reservoir is highly heterogeneous as a result of sedimentary,
diagenetic, and tectonic processes. Sedimentary heterogeneities include a complex interfingering of high
permeability (300 - 500 mD) aeolian facies, low permeability fluvial facies (5-30 mD), and mud-flat facies that can
act as vertical flow barriers.
In order to get a better understanding of the processes involved numerous detailed reservoir simulations have
been run over the years. Multiple reservoir models have been built by using data from 3D seismic, well logs,
V. Vandeweijer et al. / Energy Procedia 4 (2011) 5471–5478 5475
6 V.P. Vandeweijer/ Energy Procedia 00 (2010) 000–000
production logs, pressure fall off measurements, etc. Over the years the reservoir models have been updated and fine
tuned using additional measurements like down hole pressure and temperature measurements, gas analyses and
production water analyses, tracer analyses, etc. In the next section we give an overview.
3.1. Well head production and injection measurements
Well head temperature, pressure and flow rates of the producing and injecting wells are an absolute minimum
when it comes to input data for reservoir simulations. This data is easily available through the production database
of GDF SUEZ. Without essential data like these building a robust reservoir model would almost be impossible.
3.2. Production and injection gas analysis
Samples were taken from the production gas stream at regular intervals. Multiple gas samples have also been
taken from the CO2 gas stream of the injection wells. Most of the samples were tested in accordance with ISO 6974.
This was done in order to assess the composition of the gases. This is important input for both reservoir modeling
work and well integrity studies.
The composition of the production gas stream varies, as was expected from reservoir simulations. Whereas well
K12-B5 shows a very consistent gas composition (with 13% CO2), well K12-B1, which is located in the same
compartment shows a steady increase in CO2 concentration, starting at 13% in 2005 rising to over 25% in 2010. It is
interpreted that this is due to heterogeneities of the reservoir which create preferential pathways for the CO2 and
cause uneven CO2 spread through the reservoir.
K12-B8 was producing from a different, smaller compartment in which CO2 was injected for roughly half a year
in 2004, after most of the natural gas had been produced. In 2007 and 2008 production of the CO2 and natural gas
mixture commenced and analysis showed rapidly changing CO2 concentration values.. The rise and later fall of the
CO2 concentration has led us to believe that the CO2 might move away from the well driven by gravity. New
reservoir simulations will hopefully underpin this hypothesis.
The injected gas composition is quite stable and consists mainly of CO2 (92%) and CH4 (6%). The samples
contained no traces of water or water vapor and thus should not be corrosive.
3.3. Down hole P and T measurements
The bottom hole pressure and temperature have been monitored regularly in various wells by means of down hole
memory gauges. Accurate down hole pressure and temperature data are very important because of the large density
variations CO2 can go through during injection. For instance at well K12-B6 the CO2 is subcritical at the wellhead
and becomes supercritical at a depth of approximately 2000 meters. Once in the reservoir, the CO2 becomes
subcritical again due to the lower pressure. These changes go hand in hand with substantial volumetric changes and
are critical factors in order to create accurate reservoir simulations.
3.4. Chemical tracers
Since the injected CO2 originates from the same reservoir into which it is being re-injected, it cannot be
chemically distinguished from the naturally occurring CO2 in the reservoir. A tracer substance was therefore
injected, enabling the investigation of the migration of CO2, the partitioning behavior of the CO2 and CH4, the
associated sweep efficiency and indirectly the EGR potential of the reservoir.
On the 1st of March 2005, when well K12-B6 was commencing CO2 injection, two types of perfluorocarbon
tracers were injected into the CO2 injection stream of well K12-B6. The nature of both tracers mimics the behavior
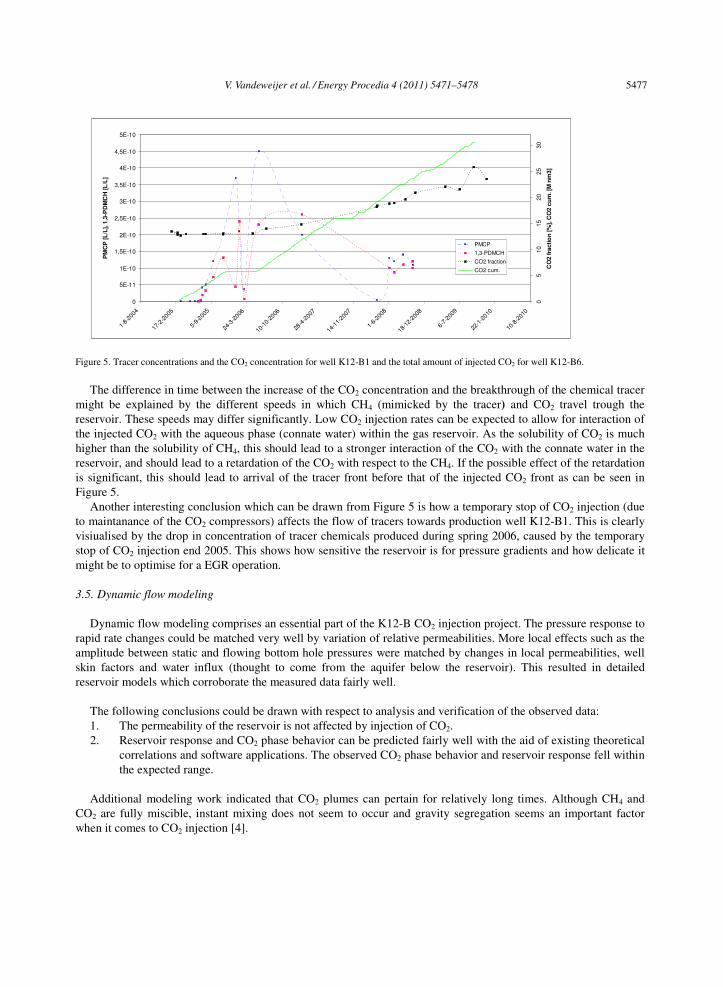
of CH4. Regular sampling and analysis took place at the gas production wells K12-B1 and -B5.
Tracer concentration data of both tracers at K12-B1 and -B5 show tracer breakthrough after 130 days (August
2005) and 463 days (June 2006), respectively (Figure 5).
5476 V. Vandeweijer et al. / Energy Procedia 4 (2011) 5471–5478
V.P. Vandeweijer/ Energy Procedia 00 (2010) 000–000 7
0
5E-11
1E-10
1,5E-10
2E-10
2,5E-10
3E-10
3,5E-10
4E-10
4,5E-10
5E-10
1-8-
2004
17-2
-200
5
5-9-
2005
24-3
-200
6
10-1
0-20
06
28-4
-200
7
14-1
1-20
07
1-6-
2008
18-1
2-20
08
6-7-
2009
22-1
-201
0
10-8
-201
0
PM
CP
[L
/L],
1,3
-PD
MC
H [
L/L
]
05
10
15
20
25
30
CO
2 f
rac
tio
n [
%],
CO
2 c
um
. [M
nm
3]
PMCP
1,3-PDMCH
CO2 fraction
CO2 cum.
Figure 5. Tracer concentrations and the CO2 concentration for well K12-B1 and the total amount of injected CO2 for well K12-B6.
The difference in time between the increase of the CO2 concentration and the breakthrough of the chemical tracer
might be explained by the different speeds in which CH4 (mimicked by the tracer) and CO2 travel trough the
reservoir. These speeds may differ significantly. Low CO2 injection rates can be expected to allow for interaction of
the injected CO2 with the aqueous phase (connate water) within the gas reservoir. As the solubility of CO2 is much
higher than the solubility of CH4, this should lead to a stronger interaction of the CO2 with the connate water in the
reservoir, and should lead to a retardation of the CO2 with respect to the CH4. If the possible effect of the retardation
is significant, this should lead to arrival of the tracer front before that of the injected CO2 front as can be seen in
Figure 5.
Another interesting conclusion which can be drawn from Figure 5 is how a temporary stop of CO2 injection (due
to maintanance of the CO2 compressors) affects the flow of tracers towards production well K12-B1. This is clearly
visiualised by the drop in concentration of tracer chemicals produced during spring 2006, caused by the temporary
stop of CO2 injection end 2005. This shows how sensitive the reservoir is for pressure gradients and how delicate it
might be to optimise for a EGR operation.
3.5. Dynamic flow modeling
Dynamic flow modeling comprises an essential part of the K12-B CO2 injection project. The pressure response to
rapid rate changes could be matched very well by variation of relative permeabilities. More local effects such as the
amplitude between static and flowing bottom hole pressures were matched by changes in local permeabilities, well
skin factors and water influx (thought to come from the aquifer below the reservoir). This resulted in detailed
reservoir models which corroborate the measured data fairly well.
The following conclusions could be drawn with respect to analysis and verification of the observed data:
1. The permeability of the reservoir is not affected by injection of CO2.
2. Reservoir response and CO2 phase behavior can be predicted fairly well with the aid of existing theoretical
correlations and software applications. The observed CO2 phase behavior and reservoir response fell within
the expected range.
Additional modeling work indicated that CO2 plumes can pertain for relatively long times. Although CH4 and
CO2 are fully miscible, instant mixing does not seem to occur and gravity segregation seems an important factor
when it comes to CO2 injection [4].
V. Vandeweijer et al. / Energy Procedia 4 (2011) 5471–5478 5477
8 V.P. Vandeweijer/ Energy Procedia 00 (2010) 000–000
4. Conclusion
The monitoring activities at the K12-B CO2 injection site are focused on two objectives: well integrity and the
analysis of the migration of the CO2 in the reservoir. The followed monitoring suite seems adequate to fulfill both
goals.
The suite of tools used until now provide confidence that well integrity can be assured for more years of CO2
injection to come. The ideal properties of the primary seal, the salts from the Zechstein Super Group, certainly
contribute to that. The limitations of the multi-finger caliper tools have been overcome by the use of an
electromagnetic imaging tool, and down hole video data and samples have shed light on the conditions of the CO2
injection well K12-B6.
Monitoring at the production wells provided valuable information on gas composition, and chemical tracers made
it possible to detect breakthroughs and investigate other issues relevant for understanding how the CO2 migrates in
nearly depleted gas fields. It also proved vital for a good understanding to have sufficient down hole pressure and
temperature data, as the CO2 can be subjected to large density variations. Overall it can be concluded that the
measured data is corroborated fairly well by the various detailed reservoir models.
5. References
[1] Geel, C., Duin, E., and van Eijs, R., 2005, Improved geological model of the K12-B Gas Field
(CATO_WP3.1_D1.1 & CATO_WP5_D1.4). TNO Restricted Report: NITG05-179-B1209
[2] Vandeweijer, V.P., Van der Meer, L.G.H., Hofstee, C., D'Hoore, D., Mulders, F., 2009, CO2 Storage and
Enhanced Gas Recovery at K12-B, 71st EAGE Conference & Exhibition, Amsterdam
[3] Acu�a, I.A., Monsegue, A., Brill, T.M., Graven, H., Mulders, F., Le Calvez, J., Nichols, E.A., Bermudez,
F.Z., Notoadinegoro, D.M., Sofronov, I., 2010, Scanning for Downhole Corrosion, Oilfield Review - Spring 2010
edition, Schlumberger; www.slb.com/oilfieldreview
[4] Van der Meer, L. G. H., Arts, R. J.,Geel, C. R., Hofstee, C., Winthaegen, P., Hartman, J., D’Hoore, D., 2009,
K12-B: Carbon dioxide injection in a nearly depleted gas field offshore the Netherlands, in M. Grobe, J. C. Pashin,
and R. L. Dodge, eds., Carbon dioxide sequestration in geological media—State of the science: AAPG Studies in
Geology 59, p. 379–390.
5478 V. Vandeweijer et al. / Energy Procedia 4 (2011) 5471–5478