Embed Size (px)
Citation preview
Vol. 16(4), pp. 158-169, October-December, 2021
DOI: 10.5897/IJPS2021.4966
Article Number: D0275B768133
ISSN 1992-1950
Copyright©2021
Author(s) retain the copyright of this article
http://www.academicjournals.org/IJPS
International Journal of Physical
Sciences
Full Length Research Paper
Monitoring the loss of mass or the volume recessed into a waveguide by resonant signal principle:
Nano-inscribed slots in DUV210 micro-resonators
Arthur Doliveira1, Lucas Garnier2, Fabrice Mahé1, Hervé Lhermite2, Etienne Gaviot3 and Bruno Bêche2*
1Institut de Recherche Mathématique de Rennes, Université de Rennes, 6625, F-35000 Rennes, France.
2Institut d'Électronique et des Technologies du numéRiques, Université de Rennes, 6164,
F-35000 Rennes, France. 3Laboratoire d'Acoustique de l'Université du Maine, Université du Maine, 6613, F-72000 Le Mans, France.
Received 14 September, 2021; Accepted 19 October, 2021
The goal of this paper is to study the impact of a differential mass loss or a lack of material (void) directly located into the core structure of matter together with the possibility of measuring its effect by a resonant signal surface at optical frequencies. To this end, the focus has been on the evolution of effective indices or eigenvalues of micro-resonators as relevant models. Specific lack of mass was measured by way of a resonant optical signal principle. Then, specific families of resonators have been designed and shaped with several slits nano-inscribed upon them. The signal resonant light is then characterized by its pseudo-period while considering the whole geometry, taking account of the void; thus, it contains the information regarding the pre-defined recessed volume. The study was carried out first by controlling the deep UV technology onto an organic so as to fabricate the family of slotted micro-resonators before assessing the evolution of the effective index of the system that is inversely proportional to the free spectral range. Experimentally, the design of the measurement platform made it possible to measure the impact of a given lack of material within the cyclic resonators. Experimental measurements have been carried out so as to confirm previous simulations demonstrating a convergence ranging from 0.09 to 0.39%. Accordingly, the relevant results allow us to validate a quantified description regarding the hollowed out volume (or mass recessed within the core waveguide) with regard to the spatial resonant optical signal.
Key words: Deep UV210 polymer, nano-inscribed slots, micro-resonators, optical resonance monitoring, lack of material, void characterizations.
INTRODUCTION Historically and then currently on the market, integrated devices measuring or detecting differential variations in
micro-mass are based on the propagation of tunable piezo-elastic or acoustoelectric waves (bulk acoustic
Doliveira et al. 159 wave, BAW and surface acoustic wave, SAW) (Royer and Dieulesaint, 1999). The principle may be reduced to an equivalent piezoelectric resonator structure that is shifted in tune (Benetti et al., 2005). In such piezo-elastic physics, the general resolution amounts to solving a problem of eigenvalues (velocity of the acoustic wave into the solid) and eigenvectors (displacements and associated stress) (Farnell, 1970; Fahmy and Adler, 1973). Nowadays and over the past two decades, integrated photonics based on optical micro-resonators has been developed with different materials and processes (Rabus, 2007; Monte et al., 2010; Isci et al., 2004). The latter are mainly defined by a looping back of the optical wave on itself by way of 2D or 3D geometries (Scheuer and Yariv, 2006; Zebda et al., 2008; Delezoide et al., 2012; Sanogo et al., 2013; Pluchon et al., 2013) entailing then a quantization of the modes characterizing the resonant mechanisms. One could wonder about an analogy or approach to be considered between these devices, even if obviously their physics is based on waves of different nature. In the case of a quartz crystal microbalance, resonance wavelengths are shifted by a small addition or removal of mass, and are related to the viscoelastic properties of the sample, whereas in the case of photonic micro resonators, resonance shifts are related to the optical properties of the studied sample. In a recent study, we were able to dynamically follow the evaporation of matter located in contact and therefore above a resonant source of electromagnetic signal (Garnier et al., 2020). In such a case, the differential mass loss or lack of matter (water evaporation) was probed by investigating the evanescent tail and part of the global mode. Such a previous dynamic differential mass process may be considered as an upper cladding disappearing from the photonic resonant structure and can also be compared with the detection of its evaporation on a quartz balance. The extension of this parallel and further study concerns the case regarding the differential lack of matter reaching the guiding part or core of the structure (namely recessed of volume of matter inscribed directly into the guide), still with a resonant probe and same principle. Then, following the study of a differential mass loss clearly established in the part of the evanescent tail of the mode, we aim at studying the entailed behavior when such a loss of mass (or less matter) reaches directly the inner core of the eigenmode. In recent years, concerning the morphology of structures with air nanogap inscribed in the core of the guide, guiding structures have been developed incorporating subwavelength air slits. In particular, Almeida et al. (2004) and Xu et al. (2004) proposed such
designs to obtain a class of specific modes with a strong designs to obtain a class of specific modes with a strong localization of energy in the air gap featuring the lowest optical index of the layers constituting the complete structure. This paved the way for the production of structures arranged on silicon-based semiconductors (Barios, 2006; Lo et al., 2004; Eti and Kurt, 2016; Campopiano et al., 2004; Chao et al., 2006), particularly fitted to the incorporation of air nano-gaps owing to their technological manufacturing processes. In order to create nano-slits within the core of the structure to model the loss of intrinsic matter, we investigated a polymer called resin UV210 to be flashed in deep UV and its associated lithography processes allowing an apt shaping of such nanogaps or air recessed volumes (Duval et al., 2010; https://kayakuam.com/products/uv-210gs-positive-duv-photoresist/).
The aim of this work is then to study a given evolution of a lack of material that models a given mass loss (medium distributed in air slits) within the core of an optical waveguide (or hollow waveguide), and its impact on resonance, considering its pseudo-period. Context and basis with photonics
Concerning the physics of this problem with eigen-vector and -values, let us introduce the basics of resonant electromagnetism. At first, in guided electromagnetism (Collin, 1991) and integrated photonics (Adams, 1981; Snyder and Love, 2000), the calculation of the solutions regarding the propagation equations modes (upstream of the equations of J. C. Maxwell) may be summed up as a problem with eigenvalues and eigenvectors to be solved. When classes of solutions exist mathematically (guided modes, leaky modes, and radiated modes) their relevant eigenvalues stand for effective propagations constants
= ko. = (2). (related to the fixed wave
vector k0 and the fixed wavelength 0 in wave physics) or
their effectives phase indices considering the light
in the whole system or the overall photonic structure at a fixed wavelength (Bêche and Gaviot, 2016). Such eigenvalues are solutions of opto-geometric equations called eigenvalue equations; each eigenvalue may be associated with a mode unfolded in the complete structure, whose modulus stands for the optical intensity and its specific spatial distribution (Bêche et al., 2010). In a micro-resonator configuration, the cyclical and re-looped quantification is naturally highlighted through the
relation Lopt = mm, with Lopt = .Lgeo considering the
*Corresponding author. E-mail: [email protected]
Author(s) agree that this article remain permanently open access under the terms of the Creative Commons Attribution
License 4.0 International License
160 Int. J. Phys. Sci. optical/geometrical lengths (or optical/geometrical perimeters) of the specific micro-resonator (m is an
integer and m the successive resonant wavelengths).
Only some specific wavelengths m will satisfy successively this perimeter phase matching relationship. In the following, the resonances with a broad spectrum source were tested and therefore have access to the
effective group index of the considered structures;
then the eigenvalue of the whole system which is probed by way of several wavelengths at the same time can
respectively be represented by . Resonance is
obtained when the light returns to the starting point in phase:
=
(1)
A 1st order expansion of Taylor of gives:
(2)
Such an effective group index is markedly higher
than the effective phase index of the structure at a
fixed wavelength because two dispersive contributions are superimposed; at first the physical dispersion of the
UV210 material (representing by ) plus the modal
dispersion contribution that is specific with the non-linear dispersion curves of the overall resonant structure; then one can acknowledge the notion of effective index or eigenvalue of the electromagnetic circuit (that as such may be either related to the phase or to the group depending on whether one has considered the indices of phase or of group for all the materials). Thus, experimentally or by simulations in optics, if you operate with a tunable source so as to probe an optical property (such as the resonances) then the system will present its so-called phase response; on the other hand, the use of a wide-spectrum laser source, simultaneously probing the circuit with all the wavelengths, will present a group response because such a light have previously revealed the notion of the group index of materials.
In order to determine a lack of matter or recessed volume by a resonant principle, a suitable purpose to be put forth is therefore to use slot-waveguides (re-looped in micro-resonators structures) so as to measure the evolution of the eigenvalue while assessing the free spectral range:
FSR (group or phase)
= (3) (3)
The intrinsic loss of mass located within the core guiding (air recessed volume fixed by the nano-slits) will bring about a displacement on the curves of dispersion of the eigenvalue. In this study, a broad spectrum source was used: then, relation (3) will be validated with the
eigenvalue . Such an effective group index
takes account respectively of all the dispersions including those of the effective eigenvalue equation regarding all
the opto-geometry of the structure. In addition, so as to be able to compare the simulations
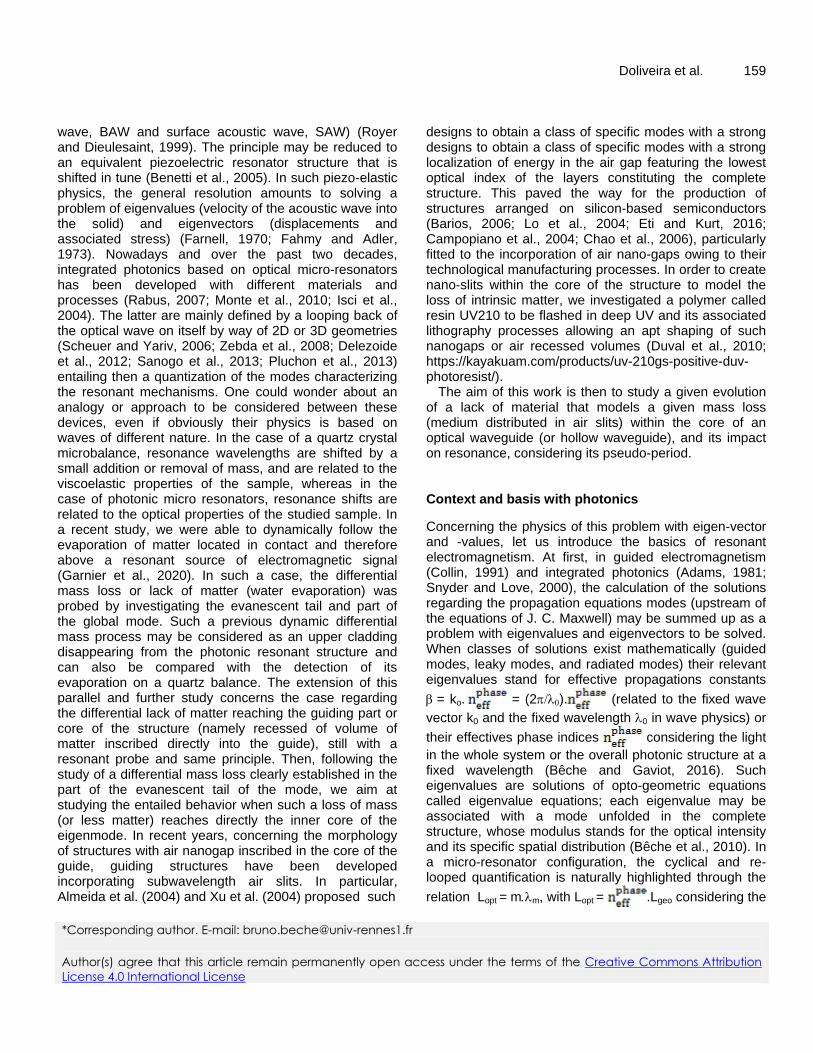
with our measurements, it is first necessary to estimate the group index of the UV210 material used to shape the nano-slits. Figure 1 represents the dispersion curves of the UV210 material: ellipsometric measurements (Uvisel, Jobin Yvon-Horiba) were carried out in the range of 300 to 1800 nm so as to determine the dispersion of the
optical phase indices of the material and to
deduce the mathematical extrapolation
=1.575+ + (Cauchy's law). The
extrapolation of the group index regarding the
UV210 material is then obtained directly by the classical
optical definition related to with a gradient.
Therefore, the simulations take advantage of such a plot (in black, Figure 1), given that the resonance measurements are carried out experimentally by a broadband laser source. Thus, the value retained for the
simulations has been = 1.65 around 0=800 nm.
Simulations Electromagnetic simulations were driven with a view to estimating the proportion or percentage defining the included lack of matter (or inscribed nano-slits) within a cyclic resonator considering the impact on the eigenvalue
: then through the parameter FSRgroup
(Equation 3),
one can assess the minimum value to be detectable on a statistic of spectral measurements. Simulations have been carried out by way of the COMSOL Multiphysics software (https://www.comsol.com/comsol-multiphysics), as a most efficient solving technique based on the finite element method. Figure 2 represents the geometries of the structures that are modeled prior their associated
Doliveira et al. 161
Figure 1. Dispersion curves of the UV210 material: optical phase index of
the material measured by ellipsometry plus mathematical extrapolation; the result of
Cauchy's law is then estimated as =1.575+ + ). The
extrapolation of the group index of the UV210 material is obtained by the
classical optical definition that links with a gradient.
realizations (top view and cross-sectional view). All the opto-geometrical parameters are depicted and detailed in Figure 2, with dimensions (width, height, lengths, radius of curvature plus various optical indices). Since the
spectral quantity FSRgroup
( ) is directly
proportional to the inverse of the effective group index (Equation 3), a first direct simulation method (I_2D) have been achieved with regard to the initial condition value of
UV210 group index = 1.65 at a wavelength 800
nm. Cross-sectional structures are considered in 2D, as depicted in Figure 2b, so as to calculate the eigenvalue
attached to the guided mode presenting naturally
the highest effective group index close to that of the material making up the core waveguide); here, the related waveguides are single-mode (quasi-TE00) at the
simulation wavelength taken = 800 nm. Then,
considering a compact domain in the present case, the finite element method (COMSOL) allows us to solve the
following partial differential problem: (find
), with given boundary conditions on a
distant (with outer normal at the border , k0 the
wave vector module and n the index):
(4)
Considering the open domain is the Sobolev space;
then, H2() stands for the set of integrable square
functions whose second order derivatives feature also integrable square values. Figure 2b displays the relevant schematic diagrams (as cross-sectional views) for the three families of rib-waveguides structures, respectively fitted with none, one and two nano-inscribed slots. Such structures represent the future devices that will be produced by way of clean room processes. Such rib-waveguides are 3 μm wide (lg), 1 μm thick (hg) and feature a common 400 nm width (g) for each nano-slot. Considering the 800 nm wavelength, the optical indices of the materials were fixed with the following values as regard simulations: na = 1.00 (air, upper-clading), no =
1.65 = (polymer UV210, core waveguide) and ns
= 1.45 (Silica, lower-cladding). Then the eigenvectors calculations can be achieved, featuring the effective

162 Int. J. Phys. Sci.
Figure 2. COMSOL Multiphysics: Geometry of the resonant structures. (a) Upper-view of the resonant structures. Such racetrack micro-resonators (MRs) present a radius of curvature R = 5 µm and a 5 µm coupling length, L:
Both waveguides have a same width lg = 3 µm (MR with one slot in such example). Beyond the structure, PML L
represents an area called ‘Perfectly Matched Layer’ avoiding untoward reflections for simulations. The indices of the structure for the study in propagation and spectral resonances will be fixed to the values of the effective indices of the structures; (b) Schematic diagram of the cross-sectional view of the three family waveguides structures
respectively made of a rib with no slot and ribs with 1 and 2_ slots nano-inscribed. At a wavelength of 00 = 800
nm, optical indices of the materials are fixed for the simulations at na = 1.00 (air, upper-clading), no = 1.65 (group index of the polymer UV210, core waveguide) and ns = 1.45 (Silica, lower-cladding). The other parameters describe the geometric dimensions with: lg = 3 μm as the width of the global rib waveguide, its thickness hg = 1 μm, and g = 400 nm the common width of each nano-slot.
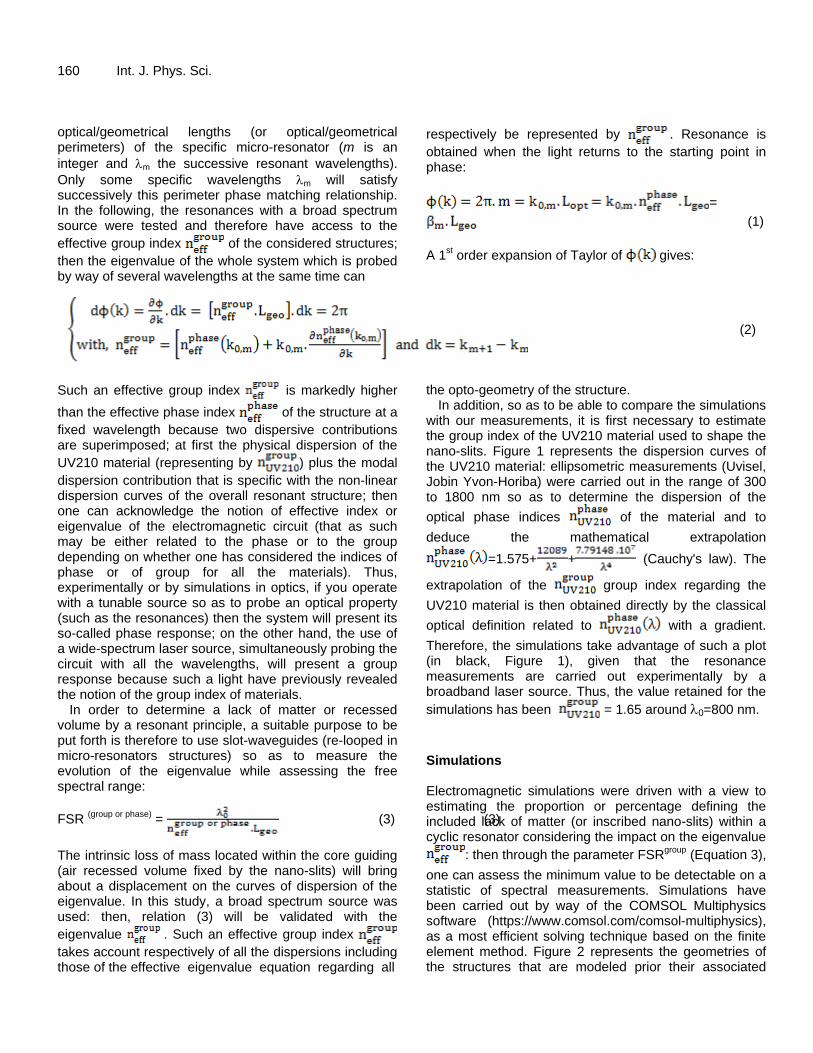
index into the light cone (spatial distributions of the single
mode quasi-TE) together with the eigenvalues
associated to each family of waveguides (with respectively 0, 1 and 2 inscribed nano-slots) as depicted in Figure 3. With this central cyclic and geometric resonant principle, group effective indices are inversely proportional to the aforementioned FSR parameter
(FSRgroup
).
Thus, with the highest studied dynamic considering no slot and two nano-slots, the relevant COMSOL
simulations provide the quantity ( ) =
( / ) = (1.6028/1.5714), evaluated at
1.019 (Table 1, simulation I_2D). Moreover, by way of Equation 3 with Lgeo=41.5 µm (MR described in Figure 5)
and 0=800 nm, it is also possible to estimate
( ) = =
0.19 nm (Table 1, simulation I_2D). Due to the specific
dependence of the parameter FSRgroup
, previously defined, which is inversely proportional to the eigenvalue, the first simulations in two dimensions (I_2D) thus appear to be an educational and simple first step estimate.
On the other hand, a second and final-simulation II_3D approach with COMSOL was initiated by a propagation method covering the whole studied structures (complete guides/micro-resonators). Such simulations are intended to investigate the propagation, the coupling and then the
resonances for various successive wavelengths m so as to first find optimal conditions and directly assess the relevant FSR
groupspectral quantities by outlining the
global theoretical spectral responses. Figure 4 shows the
type of complete structures simulated in the full domain
= PML, with PML an ideal layer called Perfectly
Matched (absorbent) Layer. The purpose of PML layers is to change the operator of the system in the layer to force the solution to decay inside such a PML layer who
belongs to the domain. The solution being zero on the edge, we have moreover imposed such a condition of
Doliveira et al. 163
Figure 3. COMSOL Multiphysics: Simulations I_2D; COMSOL simulations: calculations of the eigenvectors (spatial
distributions of the single mode quasi-TE) plus the eigenvalues as the so-called effective group indices
associated to each family of waveguides with respectively; 0, 1 and 2 inscribed nano-slots. With such a cyclic and geometric resonant principle, effective indices are inversely proportional to the above-mentioned FSR
measurements ( , see equation (3).
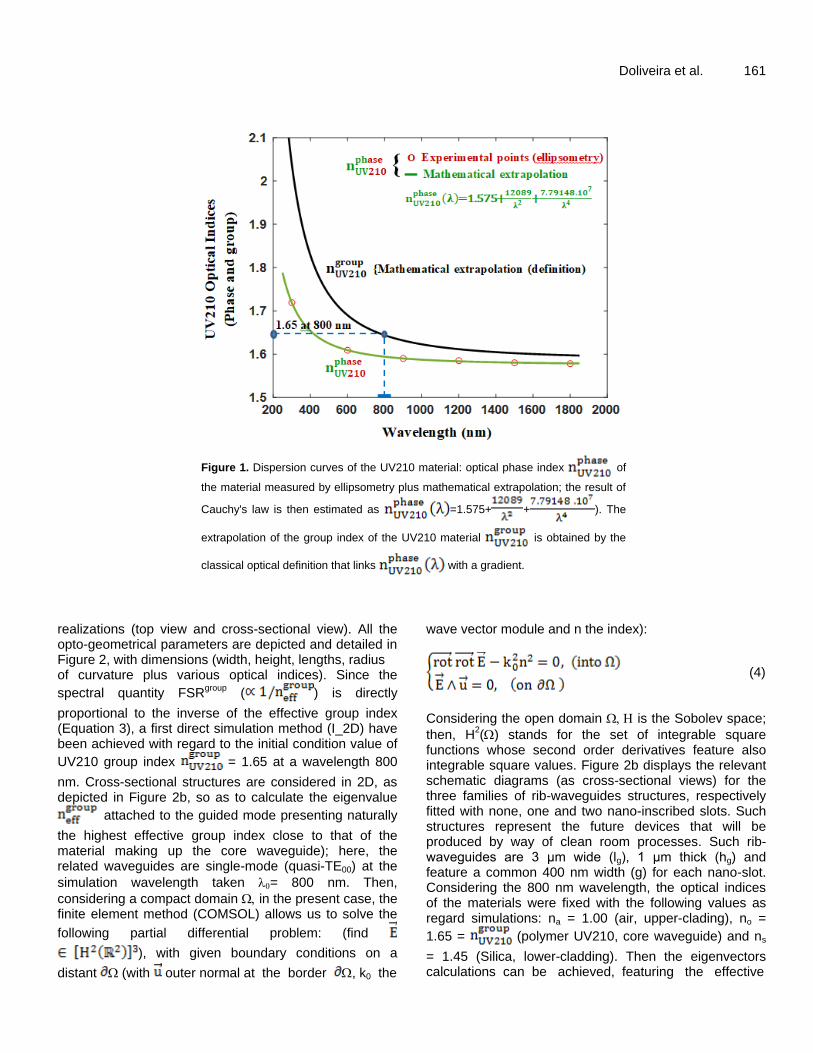
Table 1. Comparison regarding relative ( ) and absolute average ( ) values linked to
the principle of resonance for monitoring a loss of material (the polymer substance) within a resonator (inscription of air nano-gap): comparison between COMSOL modeling I_2D and II_3D and the experimental method.
Method Simulations I_2D Simulations II_3D Experimental
( ) 1.019 = (1.6028/1.5714) 1.014 = (9.47/9.34) 1.015
( ) 0.19 nm 0.13 nm 0.16 nm
For the simulation I_2D the average of ( ) geo =
41.5 µm of the MRs (Figure 5), using equation (3). The impact of the lack of material with the optical surface resonance principle results in
a same increase in the relative ratio ( ) on the measurement range (experiment compared to simulations). Deviations
from the ratio ( ) measured by experimental method and simulations I_2D and II_3D are respectively close to 0.39 and
0.09%.
perfect electrical conductor which corresponds to a
homogeneous Dirichlet condition at the border/limit 𝜕of the domain; this condition is fitted with the formulation in electric fields of the Maxwell system. Taking advantage of the second equation of the system (Equation 4), this perfect conductor condition is additionally applied on the
boundary denoted cp as depicted in Figure 1a. Globally,
this enables to ‘digitally’ avoid any untoward reflection due to the electromagnetic modes at the interface of said layer (or to prevent edge effects). The regions making up the access guide and the micro-resonator fitted with slits have as effective group indices (Figure 3),
considering guided mode of the light cone; this specific
field acts as the source on S, triggering off the
propagation, the coupling entailing then potential generated resonances at specific wavelengths. In fact, for
successive given wavelengths close to a laser 0 = 800
nm, the amplitude of the field in resonance into the
looped or resonator part is considered. The rest of the domain consists of ambient air, the other geometric parameters of the structures being those previously defined in Figure 2a. Figure 4 summarizes the determination of each resonance value within a spectral range, entailing FSR
group values for both the 0-slot and
the 2-slot structures. In addition, both electromagnetic propagation maps, together with their associated wavelengths regarding coupling and resonance mechanisms are depicted in Figure 4. Such a specific set
164 Int. J. Phys. Sci.
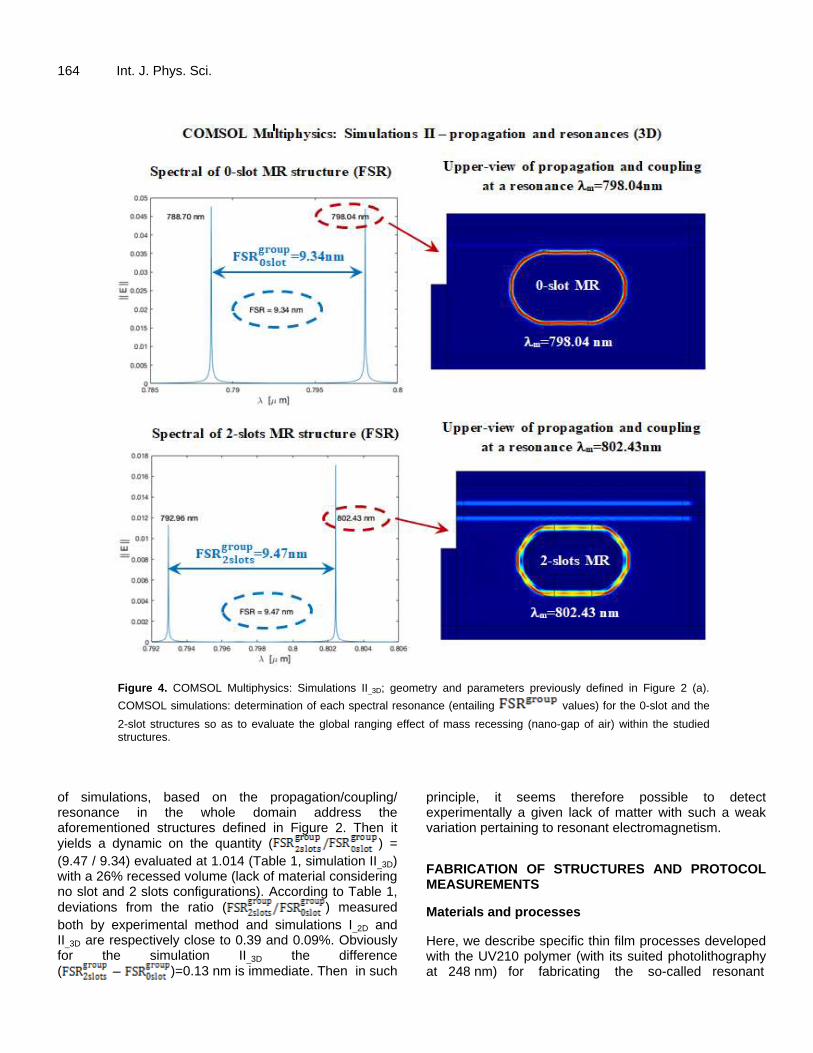
Figure 4. COMSOL Multiphysics: Simulations II_3D; geometry and parameters previously defined in Figure 2 (a).
COMSOL simulations: determination of each spectral resonance (entailing values) for the 0-slot and the
2-slot structures so as to evaluate the global ranging effect of mass recessing (nano-gap of air) within the studied structures.
of simulations, based on the propagation/coupling/ resonance in the whole domain address the aforementioned structures defined in Figure 2. Then it
yields a dynamic on the quantity ( ) =
(9.47 / 9.34) evaluated at 1.014 (Table 1, simulation II_3D) with a 26% recessed volume (lack of material considering no slot and 2 slots configurations). According to Table 1,
deviations from the ratio ( ) measured
both by experimental method and simulations I_2D and II_3D are respectively close to 0.39 and 0.09%. Obviously for the simulation II_3D the difference ( )=0.13 nm is immediate. Then in such
principle, it seems therefore possible to detect experimentally a given lack of matter with such a weak variation pertaining to resonant electromagnetism.
FABRICATION OF STRUCTURES AND PROTOCOL MEASUREMENTS
Materials and processes
Here, we describe specific thin film processes developed with the UV210 polymer (with its suited photolithography at 248 nm) for fabricating the so-called resonant
Doliveira et al. 165
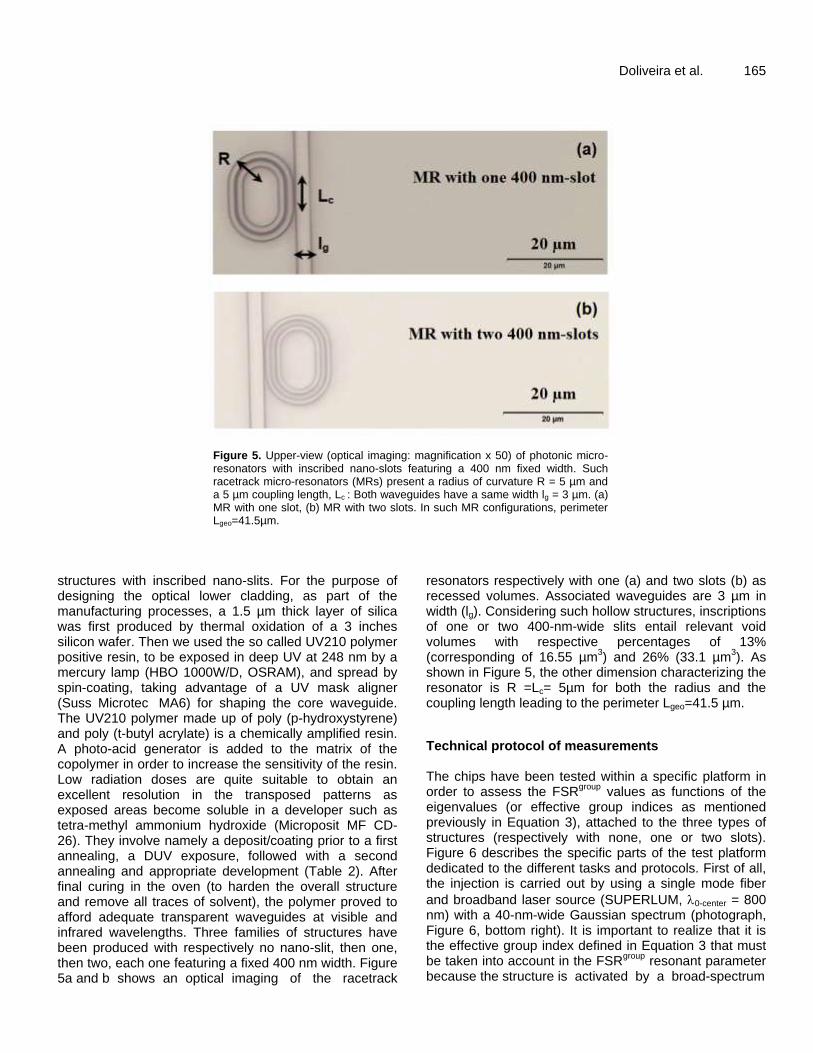
Figure 5. Upper-view (optical imaging: magnification x 50) of photonic micro-resonators with inscribed nano-slots featuring a 400 nm fixed width. Such racetrack micro-resonators (MRs) present a radius of curvature R = 5 µm and a 5 µm coupling length, Lc : Both waveguides have a same width lg = 3 µm. (a) MR with one slot, (b) MR with two slots. In such MR configurations, perimeter Lgeo=41.5µm.
structures with inscribed nano-slits. For the purpose of designing the optical lower cladding, as part of the manufacturing processes, a 1.5 µm thick layer of silica was first produced by thermal oxidation of a 3 inches silicon wafer. Then we used the so called UV210 polymer positive resin, to be exposed in deep UV at 248 nm by a mercury lamp (HBO 1000W/D, OSRAM), and spread by spin-coating, taking advantage of a UV mask aligner (Suss Microtec MA6) for shaping the core waveguide. The UV210 polymer made up of poly (p-hydroxystyrene) and poly (t-butyl acrylate) is a chemically amplified resin. A photo-acid generator is added to the matrix of the copolymer in order to increase the sensitivity of the resin. Low radiation doses are quite suitable to obtain an excellent resolution in the transposed patterns as exposed areas become soluble in a developer such as tetra-methyl ammonium hydroxide (Microposit MF CD-26). They involve namely a deposit/coating prior to a first annealing, a DUV exposure, followed with a second annealing and appropriate development (Table 2). After final curing in the oven (to harden the overall structure and remove all traces of solvent), the polymer proved to afford adequate transparent waveguides at visible and infrared wavelengths. Three families of structures have been produced with respectively no nano-slit, then one, then two, each one featuring a fixed 400 nm width. Figure 5a and b shows an optical imaging of the racetrack
resonators respectively with one (a) and two slots (b) as recessed volumes. Associated waveguides are 3 µm in width (lg). Considering such hollow structures, inscriptions of one or two 400-nm-wide slits entail relevant void volumes with respective percentages of 13% (corresponding of 16.55 µm
3) and 26% (33.1 µm
3). As
shown in Figure 5, the other dimension characterizing the resonator is R =Lc= 5µm for both the radius and the coupling length leading to the perimeter Lgeo=41.5 µm.
Technical protocol of measurements The chips have been tested within a specific platform in order to assess the FSR
group values as functions of the
eigenvalues (or effective group indices as mentioned previously in Equation 3), attached to the three types of structures (respectively with none, one or two slots). Figure 6 describes the specific parts of the test platform dedicated to the different tasks and protocols. First of all, the injection is carried out by using a single mode fiber
and broadband laser source (SUPERLUM, 0-center = 800 nm) with a 40-nm-wide Gaussian spectrum (photograph, Figure 6, bottom right). It is important to realize that it is the effective group index defined in Equation 3 that must be taken into account in the FSR
group resonant parameter
because the structure is activated by a broad-spectrum

166 Int. J. Phys. Sci.
Figure 6. Principles and photographs of various part of the experimental setup. A broadband laser source is
used to excite the slot MRs structures (0-center = 800 nm). The quantified light is then sent to an Optical Spectrum Analyzer (OSA). The surface of the chip is highlighted due to imaging from above. A specific software controls the whole set of data acquisitions together with the signal processing of spectra in real time.
source of light. Then, all the aforementioned dispersion aspects will be integrated into the measurements. This appliance allows us to visualize the resonances over the optical wavelength range of 780 to 820] nm. The central part of the figure is dedicated to the optical injection involving piezoelectric positioners (PI), microscope objectives plus an imaging device in top view (MBP Newport and CCD camera): the latter allows us to visualize the propagation and the coupling into the resonators without and with slots (Figure 6, bottom middle). Finally, a third part (with the dashed box) summarizes the spectral detection protocol: a specific Matlab code allows us to control the Optical Spectral Analyser (OSA) as well as the data acquisition, together with the resonance signal processing performed in real time for the FSR
group calculation (Figure 6, left).
EXPERIMENTAL RESULTS AND DISCUSSION
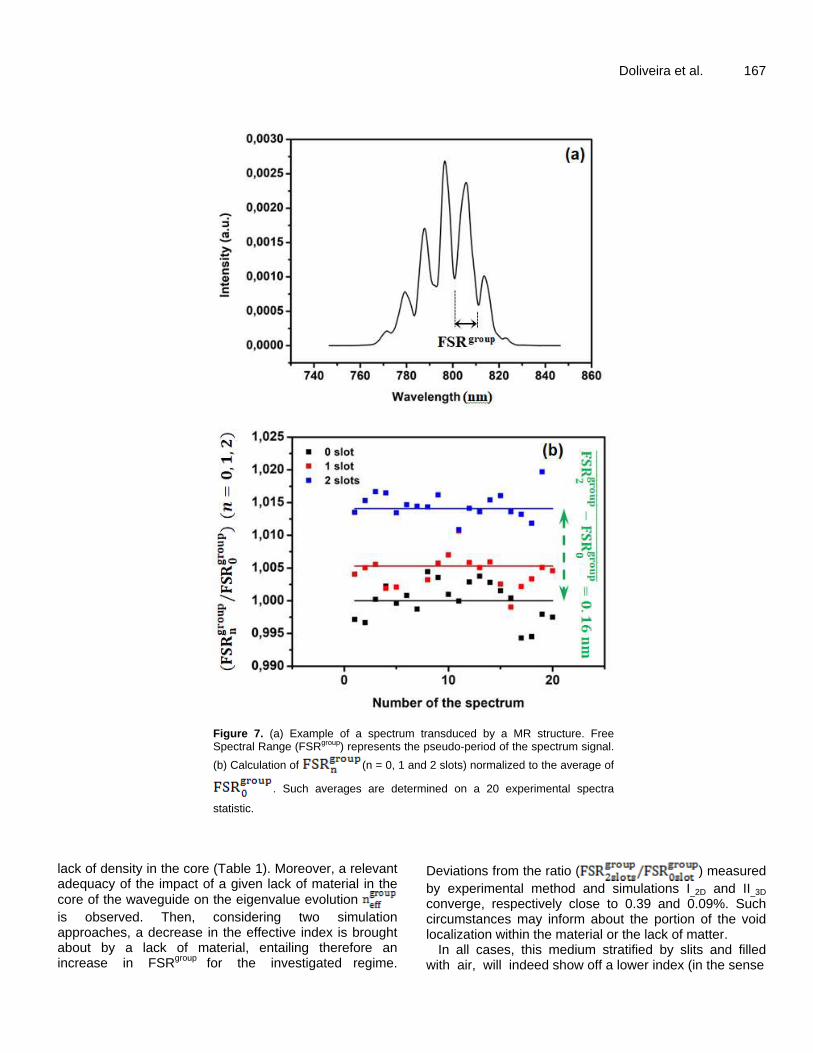
Relevant measurements carried out on the three types of investigated structures are depicted in Figure 7, with a given resonance spectrum, by way of example. Each set of resonances, resulting from the condition and cyclic circulation of light within the resonator, are inscribed in the Gaussian envelope of the source. The FSR
group
stands for the pseudo-period of the signal that can be quantitatively inferred from a fast Fourier tranform (FFT). Then, we proceed with a statistic on 20 spectra to
calculate each value (n = 0, 1, 2), considering
respectively the structures without slit (n=0), then with one and two slits (n=1 and 2). Figure 7b specifies measured values being normalized to the average
. We thus notice that such a normalized quantity
( , which is equal to ( / )
as mentioned previously, is markedly increased with the number of slots (without, one, then two). Hence, this optical quantity, validating the resonant principle measurement, displays a dynamic evolution from 1 to 1.015 as shown in Figure 7b, with a change close to 1.5%, corresponding to a 33.1 µm
3 recessed volume
(lack of matter) considering the two inscribed nano-slots. According to the previous simulations, it may be noted that as a first slit is shaped into the structure (13% of the volume of the guide), a detection mechanism is already made possible by a surface resonant principle, the previous normalized quantity varying from 1 to 1,005 (on a statistical average of 20 acquired spectra). As detected in Figure 7 and Table 1 (experimental with notion of
effective group index due to the broadband laser),
a resonant signal of surface light is susceptible to measure a preformed lack of material. If we consider the ratio of increase or the relative fraction
( ) the spectral statistics
measurements carried out with such organic structures evolve in the same direction with the lack of matter or
Doliveira et al. 167
Figure 7. (a) Example of a spectrum transduced by a MR structure. Free Spectral Range (FSR
group) represents the pseudo-period of the spectrum signal.
(b) Calculation of (n = 0, 1 and 2 slots) normalized to the average of
. Such averages are determined on a 20 experimental spectra
statistic.
lack of density in the core (Table 1). Moreover, a relevant adequacy of the impact of a given lack of material in the
core of the waveguide on the eigenvalue evolution
is observed. Then, considering two simulation approaches, a decrease in the effective index is brought about by a lack of material, entailing therefore an increase in FSR
group for the investigated regime.
Deviations from the ratio ( ) measured
by experimental method and simulations I_2D and II_3D converge, respectively close to 0.39 and 0.09%. Such circumstances may inform about the portion of the void localization within the material or the lack of matter.
In all cases, this medium stratified by slits and filled with air, will indeed show off a lower index (in the sense

168 Int. J. Phys. Sci. Table 2. Fabrication of global integrated circuits; parameters (speed v, acceleration a, time t, temperature "teta", energy E) used to shape one or two slots with 400 nm width inscribed.
Step 1 Step 2 Step 3 Step 4
Spin-coating (UV210 polymer, 1 µm): v = 900 rpm, a = 5000 rpm/s, t = 30 s
Softbake: t = 3
min, = 140°C
Exposure (Deep UV, 248 nm): T = 30 s, E = 20 mJ/cm
2
Softbake&Development (Microposit MF
CD-26): t = 1 min, = 120°C, t = 30 s
of approximations of the effective medium theory (EMT)), and therefore an increased FSR
group parameter. It is clear
that such behaviors (measured then simulated) on this media with air slots also follow an empirical Gladstone
law, namely: = constant. Then, the effective
medium being aerated and less dense, its optical index is decreased while the ratio remains constant. Conclusion Such approach put forth a possible kind of 'photonic balance' based on a resonant principle allowing measurements of a mass differential (including mass loss). Thus, this work reports the study of the impact of a given lack of pre-formed material into a core waveguide. In order to estimate an appropriate range of dimensions characterizing the presence of vacuum (or lack of nano-slits material) that could be detectable, we implement simulations of relevant resonant structures, thanks to the COMSOL software. These simulations and theoretical approach made it possible to consider an effective detection of specific recessed volume starting at relevant void volumes with respective percentages close to 10% of the MR volume. To this end we have taken advantage of nanotechnology processes based on deep UV lithography (248 nm) applied to organic materials. The UV 210 polymer was thus processed so as to shape specific slots within a set of waveguides. Then, the latter have been re-looped as micro-resonators circuits with a view to first creating the resonant signal prior measurements of the relevant variations of the pseudo-period FSR
group. Observed changes are associated to the
resonances directly linked (inversely proportional) to the
eigenvalue characterizing the electromagnetism
propagation. Experiments allowed us to highlight such changes in effective indices as clearly correlated to the amount of void. With the realized organic devices, specific resonant experimental measurements have been compared with relevant electromagnetic simulations; then, results proved to corroborate the expected evolution on the eigenvalue of the system. As the lack of material reaches 10% (imprinted within space and extended to the re-circulating light field), a noticeable variation may be observed.
Such measurements allowed us to confirm the
measured evolution in agreement with the associated simulations (COMSOL software, respectively I_2D and II_3D) to the nearest 0.09-039% regarding the relative
ratio ( ). In conclusion, considering a
given lack of material, either above or within the guide, the resonant signal is clearly altered, as a consequent
modification of the eigenvalue and its relevant
FSRgroup
resonant quantity; this study provides a way to evaluate the global dynamic ranging effect due to a given mass hollowed out (nano-gap of air) from the considered looped structures by way of assessing the entailed spectral signature. CONFLICT OF INTERESTS The authors have not declared any conflict of interests. ACKNOWLEDGEMENTS The authors thank the ‘Direction de l’Innovation et des Relations avec les Entreprises’ (DIRE) of the CNRS plus Rennes Metropolis for partly financially supporting this work plus the NanoRennes platform for DUV process (https://www.ietr.fr/en/nr-nanorennes-platform). This study is also a part of a PASS_programm ‘Pour une Ambition Scolaire Scientifique’ (For a Scientific School Ambition) with the Brittany center (Sir Cyril Le-Corre and Madame Valérie Mesnet at Lycée Fulgence Bienvenüe, and Collèges Louis Guilloux, Paul Eluard, Romain Rolland, https://spm.univ-rennes1.fr/les-cordees-de-la-reussite). REFERENCES
Adams MJ (1981). Introduction to Optical Waveguides. John Wiley &
Sons, New-York. Almeida VR, Xu Q, Barrios CA, Lipson M (2004). Guiding and confining
light in void nanostructure. Optics Letters 29(11):1209-1211. doi:10.1364/OL.29.001209.
Barios CA (2006). Ultrasensitive Nanomechanical Photonic Sensor Based on Horizontal Slot-Waveguide Resonator. Photonics Technology Letters 18:2419-2421. doi: 10.1109/LPT.2006.886824.
Bêche B, Gaviot E (2016). About the Heisenberg's uncertainty principle and the determination of effective optical indices in integrated photonics at high sub-wavelength regime. Optik 127(7):3643-3645. doi:10.1016/j.ijleo.2015.12.168.
Bêche B, Gaviot E, Renault A, Zyss J, Artzner F (2010). Another way to
shape the comprehensive analytical approach describing electromagnetic energy distribution through four-slab-layer structures. Optik 12(2):188-194. doi:10.1016/j.ijleo.2008.06.006.
Benetti M, Cannata D, Di Pietrantonio F, Foglietti V, Verona E (2005). Microbalance chemical sensor based on thin-film bulk acoustic wave resonators. Applied Physics Letters 87:173504.1-173504.3. doi:10.1063/1.2112187.
Campopiano S, Bernini R, Zeni L, Sarro PM (2004). Microfluidic sensor based on integrated optical hollow waveguides. Optics Letters 29:1894-1896. doi:10.1364/OL.29.001894.
Chao CY, Fung W, Guo LJ (2006). Polymer Microring Resonators for Biochemical Sensing Applications. Journal of Selected Topics in Quantum Electronics 12:134-142. doi:10.1109/JSTQE.2005.862945.
Collin RE (1991). Field theory of guided waves, 2d Ed. (IEEE Press, New-York).
Delezoide C, Salsac M, Lautru J, Leh H, Nogues C, Zyss J, Buckle M, Ledoux-Rak I, Nguyen CT (2012). Vertically coupled polymer microracetrack resonators for label-free biochemical sensors. Photonics Technology Letters 24(4):270-272. doi:10.1109/LPT.2011.2177518.
Duval D, Lhermite H, Godet C, Huby N, Bêche B (2010). Fabrication and optical characterization of sub-micronic waveguide structures on UV210 polymer. Journal of Optics 12(5):55501 doi:10.1088/2040-8978/12/5/055501.
Eti N, Kurt H (2016). Model Analysis of Ridge and Rib Types of Silicon Waveguides With Void Compositions. Journal of Quantum Electronics 52(10):1-7. doi:10.1109/JQE.2016.2598082.
Fahmy AH, Adler EL (1973). Propagation of acoustic surface waves in multilayers: A matrix description. Applied Physics Letters 22(10):495-497. doi:10.1063/1.1654482.
Farnell GW (1970). Physical Acoustics, Principles and Methods (Edited by Mason WP and Hurston RN, vol. VI). 1st Ed. (New York: Academic Press).
Garnier L, Lhermite H, Vié V, Pin O, Liddel Q, Cormerais H, Gaviot E, Bêche B (2020). Monitoring the evaporation of a sessile water droplet by means of integrated photonic resonator. Journal of Physics D: Applied Physics 53(12):125107. doi:10.1088/1361-6463/ab651d.
Isci S, Bilici T, Kurt A, Serpengüzel A (2004). Morphology-dependent resonances of optical microsphere resonators for the realization of passive wavelength-division multiplexing components. Optical Engineering 43(5):1051-1055. doi:10.1117/1.1689332.
Lo SS, Wang MS, Chen CC (2004). Semiconductor hollow optical waveguides formed by omni-directional reflectors. Optics Express 12:6589-6593. doi:10.1364/OPEX.12.006589.
Monte AFG, Rabelo D, Morais PC (2010). Optical properties of CdS nanoparticles embedded in polymeric microspheres. Journal of Alloys and Compounds 495(2):436-438. doi:10.1016/j.jallcom.2009.11.040.
Doliveira et al. 169 Pluchon D, Huby N, Frein L, Moréac A, Panizza P, Bêche B (2013).
Flexible beam-waist technique for whispering gallery modes excitation in polymeric 3D micro-resonators. Optik 124(15):2085-2088. doi:10.1016/j.ijleo.2012.06.058.
Rabus DG (2007). Integrated Ring Resonators: the Compendium. Springer-Verlag, New-York.
Royer D, Dieulesaint E (1999). Elastic waves in solids I and II: free and guided propagation. 1st Ed. (Springer).
Sanogo Y, Obaton AF, Delezoide C, Lautru J, Lièvre M, Dubard J, Ledoux-Rak I, Nguyen CT (2013). Phase sensitive-optical low coherence interferometer: a new protocol to evaluate the performance of optical micro-resonators. Journal of Lightwave Technology 31(1):111-117. doi:10.1109/JLT.2012.2225408.
Scheuer J, Yariv A (2006). Fabrication and characterization of low-loss polymeric waveguides and micro-resonators. Journal of the European Optical Society 1:06007.1-06007.5. doi:10.2971/jeos.2006.06007.
Snyder AW, Love JD (2000). Optical waveguide theory. 2d ed. (Kluwer Academic Publishers).
Xu Q, Almeida VR, Panepucci RR, Lipson M (2004). Experimental demonstration of guiding and confining light in nanometer-size low-refractive-index material. Optics Letters 29(14):1626-1628. doi:10.1364/OL.29.001626.
Zebda A, Camberlein L, Bêche B, Gaviot E, Bêche E, Duval D, Zyss J, Jézéquel G, Solal F, Godet C (2008). Spin coating and plasma process for 2.5D integrated photonics on multilayer polymers. Thin Solid Films 516(23):8668-8674. doi:10.1016/j.tsf.2008.04.095.