Embed Size (px)
Citation preview
1
Monitoring the structural behaviour variation of a flexible pavement
structure during freeze and thaw
Junyan Yi, Ph.D.
Post-doc researcher, Department of civil engineering, Laval University
Guy Doré, ing. Ph.D. Professor, Department of civil engineering, Laval University
Jean-Pascal Bilodeau, ing., Ph.D.
Research engineer, Department of civil engineering, Laval University
Fritz Prophète, ing. Service des chaussées, Ministère des Transports du Québec
Paper prepared for presentation at the ________________Session
of the 2014 Conference of the Transportation Association of Canada
Montreal, Quebec Abstract: This paper presents the results of a study carried out to monitor the structural behaviour of a flexible pavement in cold regions, which is significantly affected by the environmental factors and traffic loads. In this study, a heavy vehicle simulator is used to simulate the traffic load and provide the necessary cooling and heat energy required to create the freeze-thaw environment. The mechanical response of the typical Quebec flexible pavement structure during freeze and thaw was investigated using this research tool. The results show that the changes of moisture content and matric suction for unbound materials have a good correlation with the frost state of surrounding materials. The mechanical responses, including strains, stress and surface deflection, experience a regular variation along with the increase of frost penetration and thaw depth.
2
Monitoring the structural behaviour variation of a flexible pavement
structure during freeze and thaw
Junyan Yi, Ph.D.
Guy Doré, ing. Ph.D. Jean-Pascal Bilodeau, ing., Ph.D.
Fritz Prophète, ing. 1. Introduction Canada is one of the coldest countries in the world. The pavement structures in Canada experience severe seasonal climatic conditions through a yearly cycle. In cold regions, it is widely accepted that both environmental factors and traffic load can affect the flexible pavement performance [1,2]. Especially during freeze-thaw, the change of moisture and temperature play a significant role in the pavement behaviour variations. The freezing temperatures progression in the pavement structure combined with the existence of unfrozen water in a freezing soil create thermodynamic conditions favourable to upward free water migration leading to ice lens formation. During spring thaw periods, the accumulated ice in the pavement structure melts which contributes to the increase of the water content in soils and unbound layers. This excess water content causes a reduction of the resilient modulus and increases the potential of permanent strains and fatigue cracking for flexible pavement under traffic loads [3,4]. All these effects accelerate the deterioration of pavement in cold regions.
Many researchers have discussed the significant influence of freeze-thaw on the
structural behaviour of flexible pavement [5-7-8]. A study by Salour et al. showed with backcalculation of FWD measurements that a loss of stiffness of 63% and 48% can occur in the subgrade and the granular layers during the spring thaw compared to summer values [5]. In addition, the seasonal load restriction policies in cold climate areas were studied and proposed in many countries by investigating the pavement behaviour in one year [7]. This type of policy is helpful in managing the road condition during the spring thaw weakening and winter frost periods. To establish a policy, the enhanced understanding of the structural behaviour variation of a flexible pavement structure during freeze thaw is necessary.
Therefore, the objective of this paper is to investigate the structural behaviour variations
of flexible pavement during freeze thaw. A test pit at Laval University was utilized to build the typical flexible pavement structure in Quebec. Different kinds of sensors were installed in each pavement layer to monitor the mechanical and environmental factor variations in the pavement structure. The accelerated transportation loading system (ATLAS 22) manufactured
3
by ARA was used to simulate the traffic load and apply the cooling air temperature on the surface of the pavement. 2. Test site and sensors
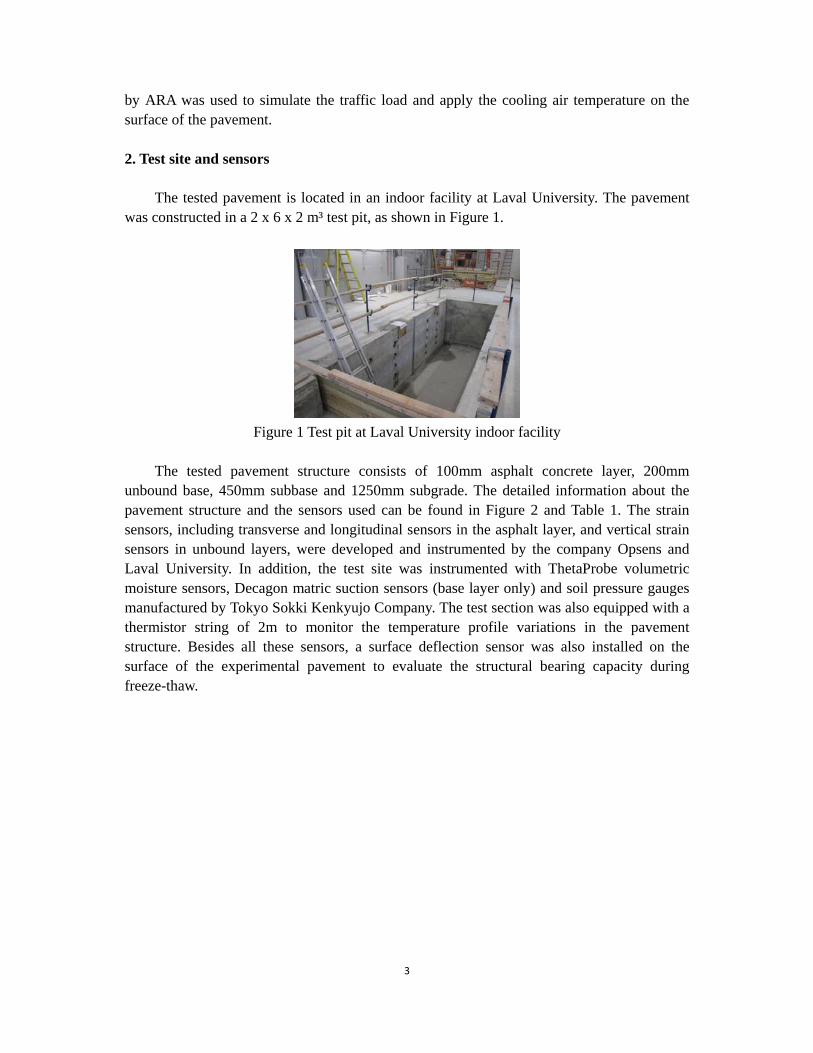
The tested pavement is located in an indoor facility at Laval University. The pavement
was constructed in a 2 x 6 x 2 m³ test pit, as shown in Figure 1.
Figure 1 Test pit at Laval University indoor facility
The tested pavement structure consists of 100mm asphalt concrete layer, 200mm
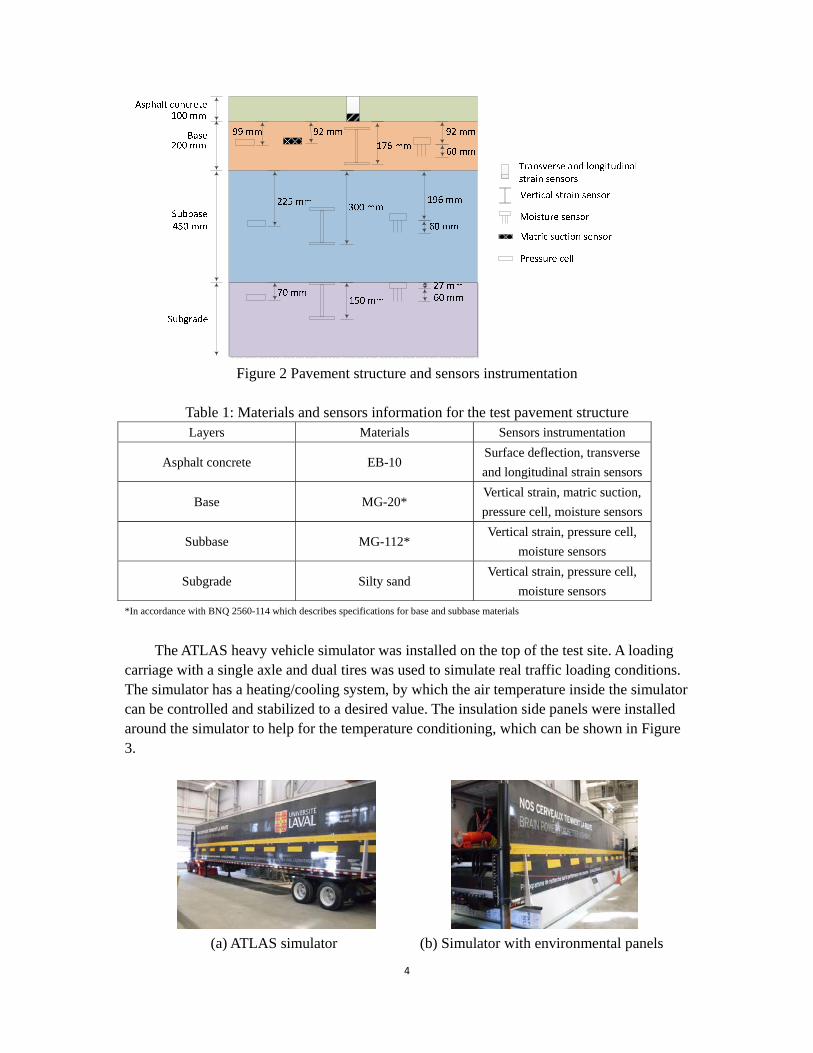
unbound base, 450mm subbase and 1250mm subgrade. The detailed information about the pavement structure and the sensors used can be found in Figure 2 and Table 1. The strain sensors, including transverse and longitudinal sensors in the asphalt layer, and vertical strain sensors in unbound layers, were developed and instrumented by the company Opsens and Laval University. In addition, the test site was instrumented with ThetaProbe volumetric moisture sensors, Decagon matric suction sensors (base layer only) and soil pressure gauges manufactured by Tokyo Sokki Kenkyujo Company. The test section was also equipped with a thermistor string of 2m to monitor the temperature profile variations in the pavement structure. Besides all these sensors, a surface deflection sensor was also installed on the surface of the experimental pavement to evaluate the structural bearing capacity during freeze-thaw.
4
Figure 2 Pavement structure and sensors instrumentation
Table 1: Materials and sensors information for the test pavement structure Layers Materials Sensors instrumentation
Asphalt concrete EB-10 Surface deflection, transverse
and longitudinal strain sensors
Base MG-20* Vertical strain, matric suction,
pressure cell, moisture sensors
Subbase MG-112* Vertical strain, pressure cell,
moisture sensors
Subgrade Silty sand Vertical strain, pressure cell,
moisture sensors
*In accordance with BNQ 2560-114 which describes specifications for base and subbase materials
The ATLAS heavy vehicle simulator was installed on the top of the test site. A loading carriage with a single axle and dual tires was used to simulate real traffic loading conditions. The simulator has a heating/cooling system, by which the air temperature inside the simulator can be controlled and stabilized to a desired value. The insulation side panels were installed around the simulator to help for the temperature conditioning, which can be shown in Figure 3.
(a) ATLAS simulator (b) Simulator with environmental panels

5
(c) Loading carriage for simulator
Figure 3 Environmental chamber and loading carriage for simulator 3. Test plan
During the freeze procedure, -10℃ was applied on the surface of the pavement using
the cooling system of the simulator. Meanwhile, to represent the real thermal condition in the field, a temperature of 2℃ was maintained at the bottom of the tested pavement structure using a closed circuit cooling glycol system embedded in the bottom of the concrete slab.
In order to obtain moderate frost heaving, the groundwater level was adjusted to
-1600mm from the pavement surface. It was found that this level showed great variations during the freeze thaw procedure.
In the test process, the carriage was controlled to apply 5000kg axle weight and 700kPa
tire pressure on the pavement surface. The speed of 5km/h for carriage was used in the loading procedure. For each measurement, eight loading passes were applied and all the sensor readings were collected. Some typical response curves for strain sensors and pressure cells for one axle pass are shown in Figure 4. The average peak values for these eight passes were used to quantify the structural behaviour variations for the experimental pavement. At the beginning of the test, the measurement frequency was four times a day, which was gradually reduced to once a day along with the increase of frost penetration.
(a) Asphalt layer (b) Subgrade
Figure 4 Typical response curves for strain sensors The temperature profile for the pavement structure was collected at each measurement to

6
determine the frost line position using a linear fitting method based on the two temperatures around 0℃. The freeze process stopped when the frost line reached 1.5m. In the thaw procedure, a fixed temperature of 10℃ was applied to the surface until the whole pavement structure defrosted. At the same time, the frost line was kept at 1.2-1.5m during the whole process. 4. Results and discussions 4.1 Change of environmental factors
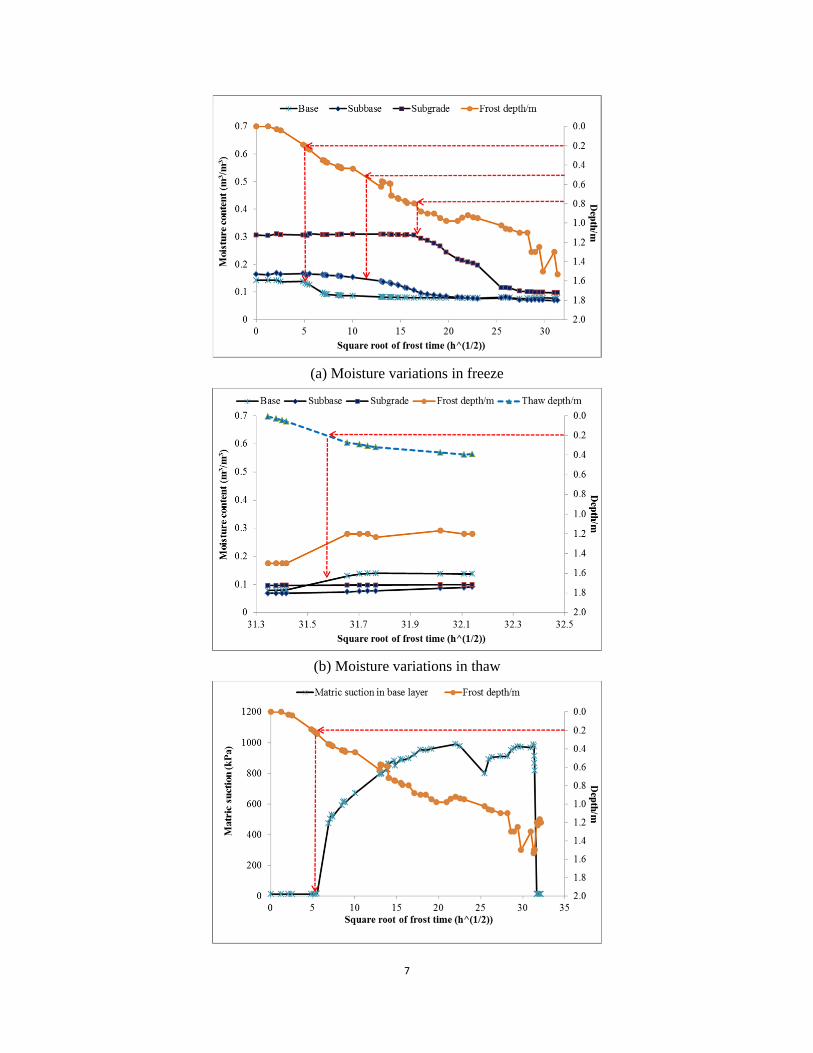
The changes of volumetric material moisture content during freeze-thaw for unbound
layers are shown in Figures 5a and 5b. In these figures, the depths of moisture sensor instrumentation are shown with red dotted lines. Furthermore, some previous studies [9] indicated that a linear relationship exists between the square root of frost time and frost depth. Thus, the frost time in the following figures is plotted as square root values.
As shown in Figure 5, it is clear that the volumetric moisture content for each layer
shows a significant reduction when this layer begins to freeze and reach a constant value after the complete frost. As to the relative thaw time, the changes of volumetric moisture content in the thaw procedure are plotted in a separate figure. In the thaw procedure, the volumetric moisture content for the base layer is found to return to the stabilized value before it freezes.
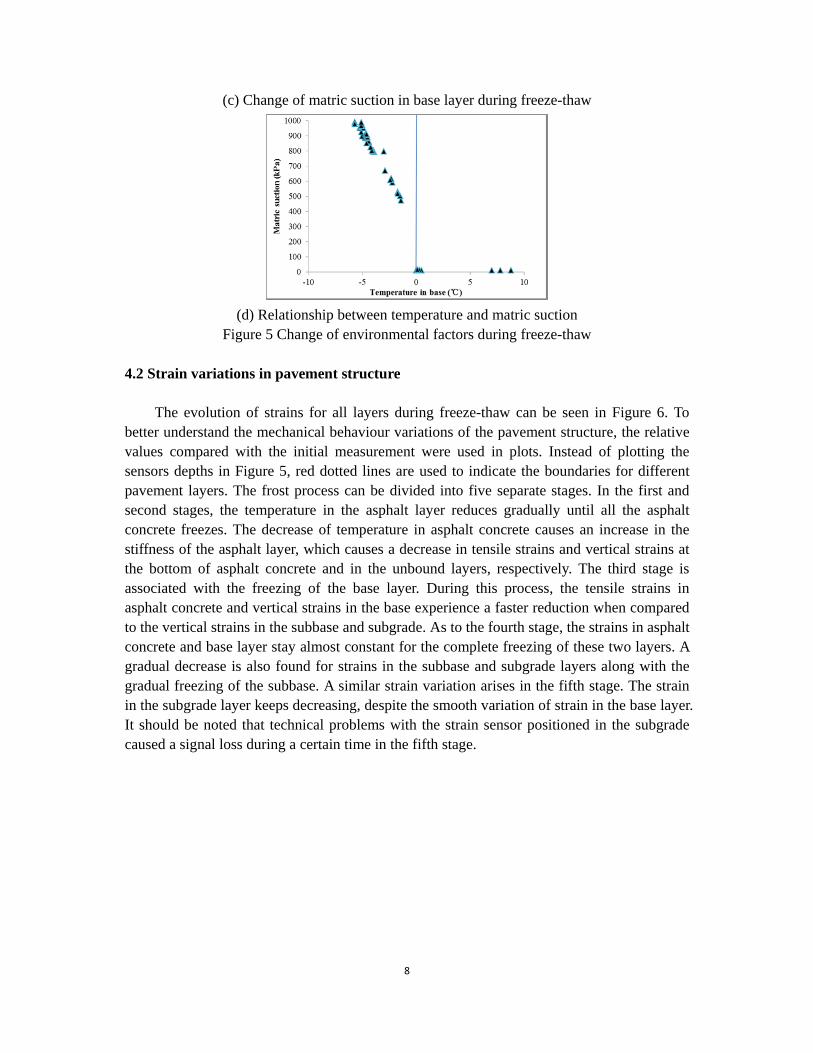
The matric suction is the negative pore water pressure that is developed in unsaturated
soils resulting from water surface tension. In the tested pavement, the Decagon sensor is used to indicate the water potential in the base layer. Ideally, larger matric suction is associated with increasing of material strength and decreasing of compressibility. Figure 5c shows the change of matric suction for base material during freeze-thaw. It can be seen that the matric suction changes significantly with the freeze and thaw of base materials. The matric suction is also found closely associated with the temperature of surrounding base materials, as plotted in Figure 5d. A linear model can be used to describe the relationship between negative temperature and matric suction.
7
(a) Moisture variations in freeze
(b) Moisture variations in thaw
8
(c) Change of matric suction in base layer during freeze-thaw
(d) Relationship between temperature and matric suction
Figure 5 Change of environmental factors during freeze-thaw 4.2 Strain variations in pavement structure
The evolution of strains for all layers during freeze-thaw can be seen in Figure 6. To
better understand the mechanical behaviour variations of the pavement structure, the relative values compared with the initial measurement were used in plots. Instead of plotting the sensors depths in Figure 5, red dotted lines are used to indicate the boundaries for different pavement layers. The frost process can be divided into five separate stages. In the first and second stages, the temperature in the asphalt layer reduces gradually until all the asphalt concrete freezes. The decrease of temperature in asphalt concrete causes an increase in the stiffness of the asphalt layer, which causes a decrease in tensile strains and vertical strains at the bottom of asphalt concrete and in the unbound layers, respectively. The third stage is associated with the freezing of the base layer. During this process, the tensile strains in asphalt concrete and vertical strains in the base experience a faster reduction when compared to the vertical strains in the subbase and subgrade. As to the fourth stage, the strains in asphalt concrete and base layer stay almost constant for the complete freezing of these two layers. A gradual decrease is also found for strains in the subbase and subgrade layers along with the gradual freezing of the subbase. A similar strain variation arises in the fifth stage. The strain in the subgrade layer keeps decreasing, despite the smooth variation of strain in the base layer. It should be noted that technical problems with the strain sensor positioned in the subgrade caused a signal loss during a certain time in the fifth stage.

9
(a) Strain variations during freezing
(b) Strain variations during thawing
Figure 6 Change of strains in pavement structure during freeze-thaw
During the thaw procedure, other than the problem with the subgrade strain sensor, all sensors have similar variation curves. The temperature increase of asphalt concrete and base up to thawing temperatures leads to a rapid recovery for all strain sensors. Therefore, the properties of the asphalt and base layers during freeze-thaw play a more significant role in the structural behaviour variations of flexible pavement. 4.3 Surface deflection variations
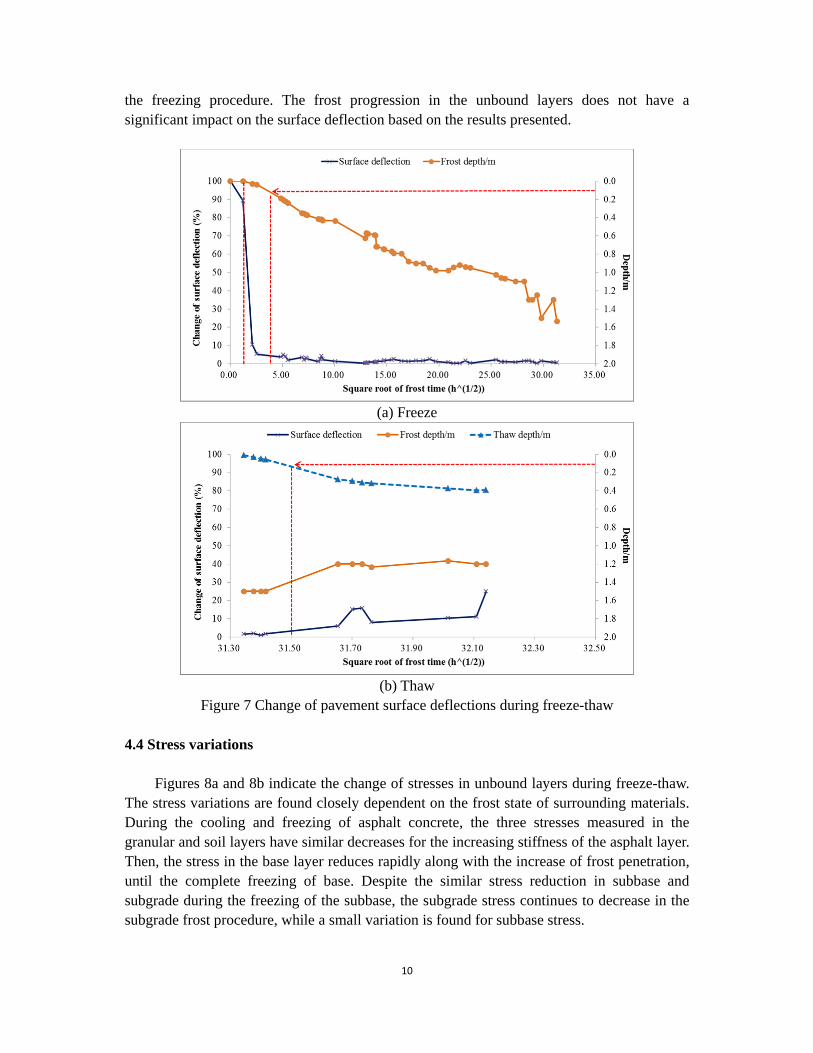
The pavement surface deflection variations during freeze-thaw are shown in Figure 7. It is found that the surface deflection is closely associated with the temperature of the asphalt layer. In the cooling process of the asphalt layer, the surface deflection reduces rapidly to less than 5% of the initial reading. However, the significant reduction recovers slowly during thawing of the asphalt layer. The surface deflection variation demonstrates that the asphalt layer is able to bear most of the traffic load and prevent the large pavement deflection during
10
the freezing procedure. The frost progression in the unbound layers does not have a significant impact on the surface deflection based on the results presented.
(a) Freeze
(b) Thaw
Figure 7 Change of pavement surface deflections during freeze-thaw 4.4 Stress variations
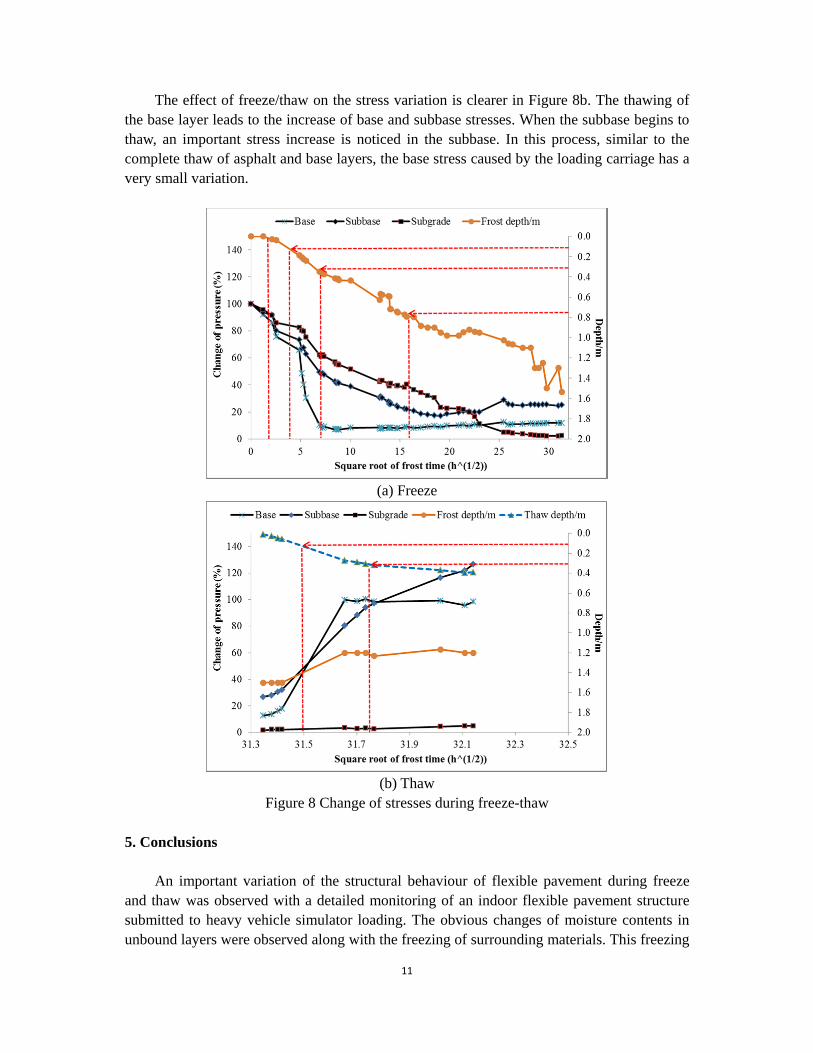
Figures 8a and 8b indicate the change of stresses in unbound layers during freeze-thaw.
The stress variations are found closely dependent on the frost state of surrounding materials. During the cooling and freezing of asphalt concrete, the three stresses measured in the granular and soil layers have similar decreases for the increasing stiffness of the asphalt layer. Then, the stress in the base layer reduces rapidly along with the increase of frost penetration, until the complete freezing of base. Despite the similar stress reduction in subbase and subgrade during the freezing of the subbase, the subgrade stress continues to decrease in the subgrade frost procedure, while a small variation is found for subbase stress.
11
The effect of freeze/thaw on the stress variation is clearer in Figure 8b. The thawing of the base layer leads to the increase of base and subbase stresses. When the subbase begins to thaw, an important stress increase is noticed in the subbase. In this process, similar to the complete thaw of asphalt and base layers, the base stress caused by the loading carriage has a very small variation.
(a) Freeze
(b) Thaw
Figure 8 Change of stresses during freeze-thaw 5. Conclusions
An important variation of the structural behaviour of flexible pavement during freeze
and thaw was observed with a detailed monitoring of an indoor flexible pavement structure submitted to heavy vehicle simulator loading. The obvious changes of moisture contents in unbound layers were observed along with the freezing of surrounding materials. This freezing
12
was also accompanied by the rapid increase of matric suction in the base layer. As to the mechanical behaviour of the pavement structure, some similar variations
during freeze and thaw for strains and stresses were found. Generally, the freezing of a given structural layer reduces the strains and stresses in the layer, as well as in the underlying layers. In addition, the downward thawing of a flexible pavement changes the mechanical responses of all the structural layers. It was also concluded that the surface deflection of flexible pavement during freeze and thaw had a good correlation with the frost state of asphalt concrete. Acknowledgements The authors want to thank Sylvain Auger and Mamadou Badiane from Laval University for their great help with the test preparation. Also thank the Ministry of Transportation of Quebec, as well as the NSERC and the financial partners of the NSERC industrial research Chair on the interaction between heavy loads-climate-pavements. References: [1] Doré, G. and Zubeck, H. 2008. Cold regions pavement engineering. McGraw-Hill, NY. [2] Salour, F. and Erlingsson, S. 2013. Investigation of a pavement structural behaviour during spring thaw using falling weight deflectometer. Road Materials and Pavement Design, 14:1, 141-158. [3] Cary, C. E. and Zapata, C. E. 2011. Resilient modulus for unsaturated unbound materials. Road Materials and Pavement Design, 12, 615-638. [4] Erlingsson, S. 2012. Rutting development in a flexible pavement structure. Road Materials and Pavement Design, 13(2), 218-234. [5] Salour, F. and Erlingsson, S. 2012. Pavement structural behaviour during spring thaw - Interpretation of FWD measurements by monitoring environmental data from county roar 126 at Torpsbruk. VTI rapport 738A. [6] Janoo, V.C. and Berg, R.L. 1991. Performance of Asphalt Concrete Airport Pavements During Thaw Weakening Periods. CRREL Report 91-7. [7] Saarenketo, T. and Aho, S. 2005. Managing Spring Thaw Weakening On Low Volume Roads. Roadscanners Report. [8] Saint-Laurent, D. 1995. Évaluation structurale de chaussées souples dans un contexte climatique nordique. Mémoire de maîtrise, Université Laval. [9] Berggren, W.P. 1943. Prediction of temperature distribution in frozen soils. Trans. AGU, Part 3, 71-77.