Embed Size (px)
Citation preview

MMoonniittoorriinngg ttrruusstt aass aann eevvaalluuaattiioonn ooff tthhee ssuucccceessss ooff ccoollllaabboorraattiivvee ppllaannnniinngg iinn aa llaannddssccaappee--lleevveell ffuueell hhaazzaarrdd rreedduuccttiioonn ttrreeaattmmeenntt pprroojjeecctt iinn tthhee BBiitttteerrrroooott VVaalllleeyy,,
MMoonnttaannaa
FFiinnaall RReeppoorrtt MMaarrcchh 22000055
UUSSDDAA FFoorreesstt SSeerrvviiccee
RRoocckkyy MMoouunnttaaiinn RReesseeaarrcchh SSttaattiioonn RRJJVVAA NNoo.. 0033--JJVV--11112222220044--333300
JJFFSSPP PPrroojjeecctt IIDD 0033--11--22--0022
AAddaamm LLiilljjeebbllaadd,, UUnniivveerrssiittyy ooff MMoonnttaannaa WWiilllliiaamm BBoorrrriiee,, UUnniivveerrssiittyy ooff MMoonnttaannaa
AAllaann WWaattssoonn,, AAllddoo LLeeooppoolldd WWiillddeerrnneessss RReesseeaarrcchh IInnssttiittuuttee


Table of Contents
Table of Contents ........................................................................................................................................ i Table of Figures.............................................................................................................................................ii Table of Text Boxes .......................................................................................................................................ii Introduction ................................................................................................................................................ 1 Background................................................................................................................................................. 2
Why do we care about Trust?................................................................................................................... 2 Necessity of civil society, cooperation, interdependence........................................................................... 5 Towards a productive and economically healthy society .......................................................................... 5 Social capital............................................................................................................................................. 6 The role of trust in enduring social relationships, social connections, and social capital ........................ 8 Distrust .................................................................................................................................................... 9 Trust and Government ........................................................................................................................... 11
Definitions of Trust .................................................................................................................................. 13 Shared norms and values........................................................................................................................ 14 Contingent Consent ............................................................................................................................... 16 Perceived Knowability ............................................................................................................................ 17 Summary ................................................................................................................................................ 18
Project Justification .................................................................................................................................. 20 Measurement of Trust ............................................................................................................................. 22
Trust Measures ...................................................................................................................................... 23 Data Collection ......................................................................................................................................... 28
Methodology ........................................................................................................................................... 28 Sampling in the Bitterroot...................................................................................................................... 29
Results........................................................................................................................................................ 31 Overall Sample characteristics (weighted) ............................................................................................. 31 Sociodemographics.................................................................................................................................. 31 Regional Background.............................................................................................................................. 33 Further Statistical Analyses. .................................................................................................................. 40
Factor Analysis. ................................................................................................................................. 40 Cluster Analysis................................................................................................................................. 43 Analysis By Trust Cluster. ................................................................................................................ 45 Summary of characteristics of trust clusters...................................................................................... 53
Discussion ................................................................................................................................................. 56 Comparison with known data................................................................................................................. 56 Segmentation .......................................................................................................................................... 56 Implications for Public Involvement ...................................................................................................... 58
Works Cited .............................................................................................................................................. 61 Appendix A: Survey Instrument ........................................................................................................... 64 Appendix B: Survey Results and Analysis ........................................................................................... 80 Appendix C: Trust Group Crosstabulation........................................................................................ 123
Cover Photo Credit: Kelly Close, Oregon State University
i

Table of Tables Table 1: Regional Characteristics, Sample Sizes, and Sample Weighting.........................................................30 Table 2 Respondent age, number of years in Ravalli County, and number of years in Montana. ................31 Table 3: Respondent place of residence, gender, education, and income.........................................................32 Table 4: Residence Location ...................................................................................................................................33 Table 5: Respondent involvement in forest issues ...............................................................................................34 Table 6a-b: Respondent's personal and economic experience with fire in the Bitterroot ...............................35 Table 7a-b: Respondent attitudes towards Bitterroot National Forest general management. .......................37 Table 8: Respondent's shared norms and values with the US Forest Service...................................................39 Table 9: Respondents' general cynicism ................................................................................................................40 Table 10: Cluster center location for trust factor scores.......................................................................................44 Table 11: Demographic and geographic characteristics of trust clusters ..........................................................45 Table 12: Geographic and other characteristics of trust level clusters...............................................................46 Table 13: Trust level groups' experience with the social and economic effects of forest fires........................47 Table 14: Trust Level Grouping Based on General Cynicism of Respondents.................................................48 Table 15: Trust level groups' of opinions of BNF general management ...........................................................49 Table 16a-e: SVS USFS Trust Questions.................................................................................................................50 Table 17a-b: Attitudes towards the Federal Government ...................................................................................52
Table of Figures Figure 1: Hypothesized causal diagram of trust ..................................................................................................19 Figure 2: Trust Dimension Factor Scores...............................................................................................................44 Figure 3a-c USFS Additive Trust Measure, Group Histograms.........................................................................51
Table of Text Boxes Box 1: Bases of support for shared norms and values .........................................................................................16 Box 2: Bases of support for contingent consent ....................................................................................................17 Box 3: Bases of support for perceived knowability..............................................................................................18 Box 4a-c: Survey Items for Trust Dimensions.......................................................................................................24 Box 5a-b: Survey Itmes for Government management, and trustworthiness of others..................................26
ii


Introduction
Following the severe forest fires in Western Montana in 2000, the Bitterroot National
Forest commissioned a social survey to help gain a representative understanding of how
residents of Ravalli County, Montana viewed the Bitterroot National Forest, and how they
would prefer that the forest were managed (Bureau of Business and Economic Research
[BBER], 2001). One proposition that arose from responses to the survey was that some
Bitterroot residents had a lack of trust of the US Forest Service. It was not clear how pervasive
this lack of trust was, and it was unclear if it was limited in scope to agency management of
fire, or rather, ranged in the broadest degree, from a general lack of trust in the US Forest
Service to a lack of trust in specific Bitterroot National Forest management actions, including
fire response.
In order to gain insight into the causes and consequences of this lack of trust, as well as
to gain a more through understanding of the extent of Ravalli County residents’ trust in the
Bitterroot National Forest, the current study was initiated. The first section of this report
explores recent scientific literature on trust, discussing why trust is important, its role in a
productive society, its role in enduring social relationships, the idea of dis-trust, and the role
that trust plays in relationships with government organizations. Definitions of trust are
summarized, and a theory of its dimensionality and complexity is presented. The next section
looks at how trust can be studied, and discusses different measures that have been used in
previous research. The next section of this report outlines the methodology used in this study,
followed by the results section, which outlines the preliminary findings of the statistical
analyses. Finally, the discussion section outlines the implications of the findings, and calls for
1—Monitoring Trust

potential management actions related to building or maintaining trust in fire and fuels
management.
Background
Why do we care about Trust?
Looking back over history, one of the most important socio-political concepts has been
trust. Trust has the potential to permeate nearly every aspect of culture. By gaining an
understanding of trust, one gains insight into the interrelationships and dependencies that
make our social systems function. Having this understanding, cultures and communities have
the potential to improve themselves and become more effective democracies at all aspects of
socio-political endeavors.
Across this nation, communities have experienced significant declines in social capital
over the course of recent decades; we seem less civically engaged, less socially active, and
despite the fact we are more tolerant than previous generations, trust each other less (Putnam,
2000). Informal personal interactions have gradually been replaced with highly structured,
formal interactions with others. Meaningful discourse is disappearing, with shallower
relationships becoming the norm. The structure and regulation required in most relationships
introduces the inefficiencies of contracts and law to keep parties honest. Relationships
however, which are built upon mutual understanding, honesty, and trust, work more fluidly
and provide a necessary lubrication for the social frictions of everyday life (Putnam, 2000). The
most pervasive of these building blocks is trust, with direct implications on the economic well-
being of a nation & its ability to compete (Fukuyama, 1995).
Monitoring Trust—2

Trust itself is difficult to define, and scholars have come to little consensus on what the
term precisely means. There is even less agreement on how to identify when trust exists, and
how to measure it (Levi, 2000). To some extent, trust is the process by which one accepts
assignment of the responsibility to work on certain tasks to other persons, groups, agencies, or
institutions (Earle and Cvetkovich, 1995). A strong argument exists, though not uncontested,
that we extend trust to others out of self-interest, and that by trusting one another, all parties
involved will mutually benefit (Hardin, 1993). People and organizations tend to react directly and
in kind to the amount of trust directed at them (Carnevale, 1995). Thus, by trusting someone,
they are more likely to trust you, and by not trusting someone, they are likely to be equally
cautious.
Many have argued that the United States is currently experiencing a period of
widespread political malaise and disengagement – levels of social capital and trust are
astonishingly low (Putnam, 2000). One only has to look as far as Dale Bosworth, the Chief of
the US Forest Service, and his response to comments about the yet-to-be enacted 2003 Healthy
Forests Initiative. Bosworth claimed that the initiative was an “opportunity to build trust,”
and that “maybe this legislation will give us a chance to show that [the Forest Service is] a
professional organization – that we do care about the land” (Devlin, 2003). Examples such as
this have become increasingly common, and may indicate that normal means of conflict
management within the political system are not functioning properly (Miller, 1974a). A
widespread lack of trust hinders relationships of all types.
When abundant, trust can exist in organizational groups ranging in size from the
smallest family to the largest nation, and has the potential to fill every void in between. Strong
relationships tend to be rooted in trust, which can spontaneously form within social groups,
3—Monitoring Trust

creating both social capital and normative reciprocity. The manner in which social
associations form within groups depends upon the degree to which they exist within
communities of shared norms and values, as well as the extent to which they can subordinate
their individual interests to those of the larger group. By deciding that cooperation is in their
long-term best-interest, organizational members voluntarily enter into contracts of
participation, be they expressed or implied, and in doing so, reduce the need for external
intervention (Fukuyama, 1995).
Trust is thought to play three key roles in interactions between people and
organizations (Carnevale, 1995). For one, trust is essential; it holds the global social fabric
together. Trust cannot be substituted with fear or authoritarianism, but rather must be based
on mutual faith. Without faith that the outcome of a transaction will be equitable, only the
foolish will participate. Second, trust is thought to play the role of truth. When mutually
trusting, parties are able to more accurately and honestly assess the extent of their
relationships. In low trust organizations, more tends to be hidden than is revealed. But, in high
trust organizations, all the variables are out on the table and everyone can work from the same
page. Individual organizations with trust-based relationships tend to be better performing and
more reality-centered than those that rely on the inefficiencies of force and intimidation. Third
and finally, trust is thought to be requisite to social survival. By accepting the truth, people do
not have reason to be defensive and can open themselves up to learning. In modern, working
society, organizations and managers that are unable to make use of the experience, know-how,
information, and intelligence of lower-ranked members are prone to failure. It is often
forgotten that organizations are, in fact, learning systems and need to be managed in a fashion
that liberates rather than restrains people’s knowledge (Carnevale, 1995)
Monitoring Trust—4

Necessity of civil society, cooperation, interdependence
Putnam (2000) found that trust and community participation go hand in hand. Those
who actively participate in their community are commonly more trusting and trustworthy
than their comparably passive neighbors. He also found the converse to be true: those who
trust others are more prone to community involvement. Regardless of one’s opinion of which
comes first, trust or civic engagement, there appears to be a definitive link between trusting
and being involved in one’s community. When we are involved in communities, we have
more control over direction, and we build relationships with other active members, further
strengthening and encouraging honest interactions.
Alternatively, in communities with low levels of civic engagement, the democratic
system tends to be severely challenged. Because some of the democratic tenets are
participation and majority rule; a democracy, therefore, cannot survive for long without the
support of a plurality of its members. If communities believe they are not being fairly
represented and become politically discouraged, there arises a greatly heightened potential for
political and social change (Miller, 1974a). Governments may rely upon force to control public
actions and sentiment, but societies that rely upon the use of force as a substitute for trust to
maintain order are likely to be less efficient, more costly, and more unpleasant (Putnam, 2000).
Towards a productive and economically healthy society
Trust plays a key role in productive and economically healthy societies, because
virtually all types of economic activity require social collaboration of one type or another. In
the economic world, people support one another because they believe they are members of a
community of mutual trust, albeit it is still a community heavily dependent on rules and
5—Monitoring Trust

regulations. Though basing the stability and prosperity of society on law, contract, and
economic rationality is necessary, it is critical that they be mediated with trust, reciprocity,
duty to community, and moral obligation (Fukuyama, 1995). While the former are based on
rational calculation, the latter are based on social practice and habit.
Communities that rely upon these shared ethical values require less extensive
regulation, fewer contractual agreements or other forceful means of ensuring honesty. An
existing moral consensus gives group members a basis for trusting one another (Fukuyama,
1995; Putnam, 2000).
The degree of collaboration and involvement needed to create social capital and a moral
community cannot be acquired through a rational investment decision. One must become
habituated to the moral norms and virtues of a trusting community. However, the community
itself must adopt norms as a whole before trust can become generalized among its members
(Fukuyama, 1995).
Social capital
There is little argument that our lives are made more productive by the social ties we
are able to establish and maintain. That is, we can get more done through the cooperation and
mutual sharing of our trusting relations with others. The connectedness between individuals,
in terms of social networks, and the normative reciprocity and trustworthiness that arise from
it is collectively referred to as social capital. There is no single way to produce social capital,
though it can be created by any number of possible mechanisms in part or all of a society.
Regardless, it has the effect of helping people resolve collective problems more easily, allows
communities to function with less internal friction, and makes people more aware of their
Monitoring Trust—6

interconnectedness (Putnam, 2000). There are two main components of social capital:
organizational capital and human capital. Organizational capital refers to the collective
knowledge people share among organizations, governments, and other individuals. Human
capital, on the other hand, refers to the unique skills and expertise possessed by individuals.
The combination of organizational and human capital determines the degree to which a
community or society can collaborate and cooperate to achieve mutual benefit. Social capital
differs from other forms of human capital since it tends to be created and transmitted through
cultural mechanisms such as religion, tradition, and historic habit (Fukuyama, 1995). Thus, it is
through active cultural mechanisms, that social capital can be nurtured and allowed to grow.
Changes in a society’s level of social capital have major implications for the nature of
the society itself. Societies with elevated levels of social capital are better able to innovate
organizationally, since the corresponding high levels of trust permit a wider variety of social
relationships to emerge. Those fraught with distrust, however, are capable of cooperation only
under a system of formal rules & regulation. The most useful kind of social capital is
frequently not one’s ability to work under the authority of a conventional community or
group, but rather one’s capacity to form new relations and to cooperate within new terms of
reference (Fukuyama, 1995).
Americans are entering into voluntary agreements of mutual trust much less frequently
than they used to (Putnam, 2000), and have been depleting what seems to be a stored fund of
social capital (Fukuyama, 1995), resulting in greater reliance on law and external moderators
as social relations dissolve (Putnam, 2000). There are many possible reasons for current
declines in social capital. Circumstantial evidence exists suggesting the downturn in social
connectedness is due to big government and the growth of the welfare state. By crowding out
7—Monitoring Trust

private initiative, it is argued, state intervention has subverted civil society. Blame for the
losses of local economic ties & increased impersonality is frequently directed at the civic
disengagement brought about by the disjoint relation between multinational corporations and
communities. While the role of big government, the welfare state, and mega-corporations
cannot be ruled out, the losses in social capital are more commonly attributed to pressures of
time and money, changes related to urban sprawl, electronic entertainment, and generational
changes (Putnam, 2000).
The role of trust in enduring social relationships, social connections, and social capital
The ability of individuals or organizations to associate with one another depends on the
degree to which they can put their own interests aside and integrate with the norms and
values of the larger community. Since shared values are requisite for trust (Fukuyama, 1995),
as mutual trust thrives, so does the rest of the exchange (Robinson, Kraatz, & Rousseau, 1994).
A healthy and vibrant civil society is required for the vitality of political & economic
institutions (Fukuyama, 1995).
As one would expect, trust is not a black-and-white characteristic; it falls upon a
continuum, with trust and distrust as polar opposites. People can not only have varying
degrees of trust in different people, but they can also have varying degrees of trust in the same
person to do different tasks (Blackburn, 1998). We may trust one auto mechanic over another
to replace our car’s transmission, but would likely trust neither auto mechanic to perform our
dental work. The types of trusting relationships people get involved with vary highly as well.
The thick relationships that develop with close friends and business partners is very different
Monitoring Trust—8

from the thin relationships that develop with people we regularly pass in the hallway, or the
cashier at the grocery store. Thick trust tends to be far stronger and more stable than the
weaker and more fleeting thin trust. Despite the fact that thin trust cannot be relied upon to
the same extent that thick trust can, Putnam (2000) believes thin trust may in fact be more
important than thick because it extends our radius of trust beyond the groups of people that we
know personally. It must be noted, however, that with declining social capital, and decreased
willingness to trust those we do not know well, comes a decreasing radius of trust and a
reduced ability to rely upon thin trust.
Distrust
Up to this point, trust has been discussed as being predominantly positive, but
normatively speaking, it is neither good nor bad; neither a virtue nor a vice. Distrust is
generally thought of to be a complement of trust, in which one either has grounds for trust or
grounds for distrust. Without a reason for distinction between trusting someone and
distrusting them (say, because you just met them), it could be said that one simply has a lack
of trust (Levi, 1998).
There are four primary reasons for distrusting rather than trusting: 1) The
circumstances of an established relationship have changed; 2) One party falsified their
situation for individual gain; 3) The potential outcome may have changed; and/or 4) The
parties did not fully understand or express their desires, intentions, and expectations (doing so
may be impossible). Distrust needs only to be based on a small portion of any of these factors
whereas to be fully trusting requires a thorough knowledge of other parties’ incentives
(Hardin, 2003). Thus, distrust comes much more easily than trust.
9—Monitoring Trust

Active distrust may, in fact, be the more appropriate descriptor in certain situations
than trust or a lack of trust (Levi, 1998), as trusting the malevolent or incompetent may prove
to be foolish or harmful (Hardin, 2000). When fundamental interests conflict, as may occur
between workers and management, or when citizens are concerned about protecting
themselves from intolerant majorities or incursions of state power, there is good reason for
parties to be wary of each other. This wariness, or distrust, may even be a contributor to
efficient organization.
The U. S. Constitution produced a lasting government organized around distrust by an
elaborate system of checks and balances (Kemmis, 1990; Levi, 1998).
“If men were angels, no government would be necessary. If angels were to
govern men, neither external or internal controls on government would be
necessary. In framing a government which is to be administered by men over
men, the great difficulty lies in this: you must first enable the government to
control the governed; and in the next place oblige it to control itself. A
dependence on the people is, no doubt, the primary control on the government
but experience has taught mankind the necessity of auxiliary precautions.”
James Madison, Federalist Paper no. 51, p. 322
Without trust, interaction can only occur under a system of formal rules & regulation.
These are inherently inefficient, as resources must be expended in order to negotiate, litigate,
and enforce them, sometimes by coercive means (Fukuyama, 1995; Kramer & Tyler, 1996).
Distrust is the motivating force behind land zoning. Parties simply do not trust one another
sufficiently to expect everybody to behave according to societal norms, and one bad apple
spoils the batch. Land use zoning is, therefore, a regulatory approach to provide a predictable
Monitoring Trust—10

framework for use and development of land. It is a clear signal by the community of what
behavior is considered acceptable and what isn’t
Trust and Government
Trust in government? The trust that we place in individuals is notably distinct from that
which we can place in government (Hardin, 1998, 1999, 2000; Putnam, 2000). Interpersonal
trusting relationships tend to be far richer and more directly reciprocal than the relationship a
citizen can have with government (Hardin, 2000). In part, this is because government is so
immense and has so many potential controllers, that it cannot specifically be trusted, and one
cannot develop a truly reciprocal relationship with it. Distinct associations are required for
trusting relations, and most times government cannot be concerned with relationships
between specific parties. Thus, one cannot speak of specifically having “trust” in government.
References to fluctuations in trust should be viewed in terms of increased or decreased
confidence that government will perform as expected, or the extent to which the government
can be considered to be trustworthy (Hardin 2000; Levi 1998). Confidence in government or in
a governmental agency can easily be based upon one’s generalizations of the institution’s
previous behavior (Hardin, 2000). The extent of confidence, obviously, will depend on the
government or agency, and can range from absolute certitude to utter cynicism (Miller 1974a).
The U. S. Government was constructed on a foundation of low trust. According to
Carnevale (1995), low trust is both the “cause and consequence of [governmental] arrangement
and management practices that strangle individual achievement and institutional
accomplishment” (p. 3). Because government agencies do not trust the judgment of public
servants, most times individual employees cannot make even minor changes that they believe
11—Monitoring Trust

would make government perform better. Government has become excessively reliant on dated
bureaucratic organizational arrangements. In this typically hierarchical organization, roles are
defined narrowly to maximize control, with ends frequently being subordinate to means
(Carnevale, 1995). Because of this, employees are restrained to specific roles, and non-
traditional forms of problem solving are discouraged. Hierarchies, however, are necessary
because not all people can be consistently trusted to behave according to normative ethics and
contribute their fair share to an institution (Fukuyama, 1995).
Government, occasionally, is central to establishing levels of trust among citizens that
would otherwise not be possible. Government can make possible a broad range of social,
political, and economic transactions that are otherwise difficult to create. Critical to doing so is
its use of coercion, rightly understood and used. Moreover, there is some reason to believe that
democratic institutions may be even better at producing generalized trust than non-democratic
institutions, in part because they are better at restricting the use of coercion to tasks that
enhance trust rather than to those that undermine it. However, depending on the nature and
personnel of government agencies, agencies may sometimes be responsible for the destruction
of interpersonal trust, either directly or by destroying the institutions that support it (Levi,
1998). Trust of the institution has additional consequence for governance: not only does it
affect the level of the public’s tolerance of the administration, but it also affects the extent to
which the public is willing to comply with governmental demands and regulations.
Destruction of trust in government may lead to widespread antagonism toward policy and
even active resistance, and may be one source of increased social distrust (Levi, 1998).
When feelings of powerlessness and normlessness accompany hostility toward political
and social leaders, the institutions of government, and the administration as a whole, simply
Monitoring Trust—12

replacing the administrators of questionable systems will have little, if any, effect on restoring
confidence in government or the political system (Miller, 1974a). To reduce or eliminate the
trust-destroying components of government bureaucracy, the government needs to be made
more flexible and adaptable to change in order to increase levels of trust and social capital.
However, the ability of institutions, to move from large hierarchies to smaller, more flexible
networks is dependent upon the degree of trust and social capital already present in broader
society (Fukuyama 1995). This makes increasing confidence in government difficult, but not
impossible, as small, incremental changes can be made. Further adding to this cycle is the fact
that in order for trust to be built, citizens must have faith in the competence of government to
do so (Levi, 1998). But simply restoring trust in authorities does not guarantee that conflicts
with government will be resolved (Tyler & Degoey, 1995). Not only must government behave
trustworthily, other citizens must as well (Levi, 1998). Without reciprocal trustworthiness, little
progress can be made towards resolving societal problems.
Trust is crucial in nearly every aspect of life. It is critical for communities, economic
productivity, and building and maintaining social connections. The preceding sections have
sought to establish how important trust is, and the role it plays in interactions with
government. With that, we will next identify what its causes and influences are, as well as how
to measure it.
Definitions of Trust
To say that one trusts something, or that one has trust in an entity, says little of the
nature of the relationship between the individual and whomever they happen to be trusting.
13—Monitoring Trust
Because the meaning of trust can be so varied, and may in fact be context specific, it is nearly
impossible to develop a single definition. Instead, we propose several dimensions that may or
may not exist in trusting relationships. Their presence or absence indicates not only the degree
of trust but also provides more specific indicators of changes in relationships that affect trust.
In general, trust is the process by which one accepts the assignment of responsibility to work
on certain tasks to other persons, groups, agencies, or institutions (Earle & Cvetkovich, 1995).
With the use of a modifier, one can clarify the scope of what they mean by trust. Suddenly
what was simply “trust” is refined to refer to political trust, social trust, interpersonal trust,
organizational trust, one of seemingly innumerable specific types of trust, or even trust at its
broadest scale: generalized trust. Classifying trust in this manner however, sets the context for
a relationship, rather than defines it. Despite this, there are a series of components that are
present in varying degrees in every trusting relationship that more fully describe it: shared
norms and values, contingent consent, and perceived knowability.
Shared norms and values
Francis Fukuyama, one of the best known commentators on trust, claims that “trust is
the expectation that arises within a community of regular, honest, and cooperative behavior,
based on commonly shared norms, on the part of other members of that community” (p. 26)
[emphasis added]. He contends that common norms can refer to complex value questions,
such as “the nature of God or justice,” but that norms can also include more tangible norms
such as professional standards or codes of behavior (1995).
Monitoring Trust—14
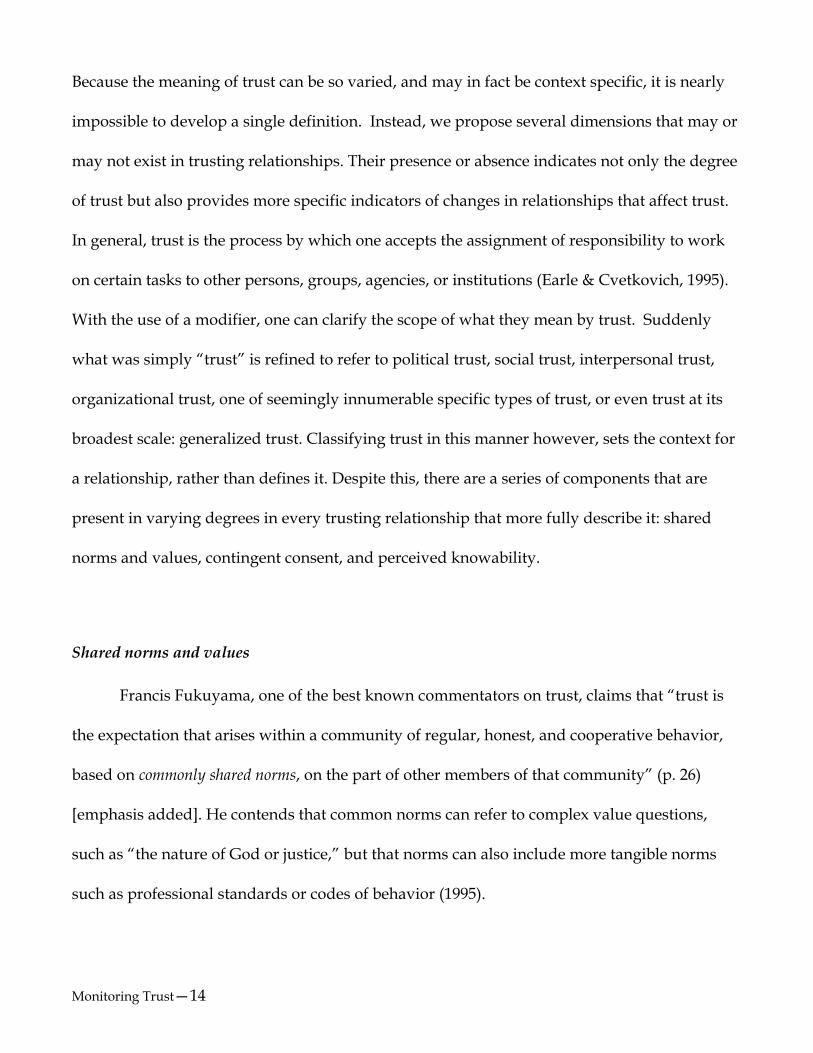
The extent to which communities have shared norms and values, and are able to place
shared goals above individual ones, is heavily mediated by the extent we can relate to others.
Formally establishing contracts and acting within one’s self interest are important ways of
relating to others, while still remaining cautious. However, an agreed upon moral standard
gives members of the group a basis for mutual trust, negating the need for extensive
contractual and legal regulation (Fukuyama, 1995). In essence, when we trust one another, and
have a true understanding of how each will act, we can operate outside of the arena of formal
rules and regulations; we trust that the other party will not act maliciously. This provides
escape from regulatory oversight, accounting and control, and leads to greater flexibility,
responsiveness and efficiency of action. Thus, to benefit from this efficiency, individuals and
organizations may invest a good deal of resources into building and strengthening trusting
relationships; they are very easy to destroy, but are quite difficult to construct (Levi, 1998).
Based on a review of the scientific literature, Box 1 shows the six dominant bases of support
identified for the shared norms and values dimension.
15—Monitoring Trust

Box 1: Bases of support for shared norms and values
Bo
Ba
Contingent
One
another on
to trust oth
parties wil
involved. C
second dim
comply wi
to be trustw
Monitoring T
x 1
ses of support for shared norms and values:
Integrity (Citrin and Muste, 1999): Honesty, morality, good character, and honor.
Worthy of Pride (Citrin and Muste, 1999): Conducting one’s self in a manner that is
respectful and highly regarded.
Compassionate and Understanding (Citrin and Muste, 1999): Sympathetic and
concerned with the welfare of others.
Agreement (Institute for Social Research, 1999): A belief that parties have parallel
objectives which can be implemented through normatively appropriate means.
Procedural Justice (Mason, House, and Martin, 1985): A fair, equitable process
developed through legitimate means.
Responsiveness (Citrin and Muste, 1999): Receptiveness and ability to adapt to meet
changing needs and circumstances.
Consent
common component of any definition of trust is that people voluntarily trust one
ly if they feel the other person is worthy of being trusted. That is, people are likely
ers only to the extent that they believe their interests will be respected, that other
l act in a trustworthy manner, and that their trust will be reciprocated by those
ollectively, these three factors are part of contingent consent, the hypothesized
ension of trust. Contingent consent refers to a citizen’s decision to voluntarily
th demands from individuals or organizations only if they perceive the other parties
orthy and are satisfied that others citizens are acting reciprocally (Levi, 1998).
rust—16

Box 2 shows the three dominant bases of support have been identified in the contingent
consent dimension:
Box 2: Bases of support for contingent consent
Bo
Ba
Perceiv
believe
acts in
and are
parties
of the m
rely up
people
parties
suppor
x 2
ses of support for contingent consent:
Trustworthy behavior (Citrin and Muste, 1999): Conducting one’s self in a manner that warrants
the trust of others.
Membership in the political community (Mason et al., 1985): Having a say or role in relevant
decision-making processes in an arena where one’s interests are valued.
Confidence (Institute for Social Research, 1999): Being able to act with faith, certainty, or
assurance.
ed Knowability
The third hypothesized dimension of trust is perceived knowability, or what people
they know about how others will act. Trust begins to form among parties when each
a manner the other expects (Fukuyama, 1995). Expectations are inherently perceptual
derived from implicit or explicit promises of future exchange or reciprocity among
(Blackburn, 1998). Each party in a relationship possesses his or her own understanding
utual obligations that define a relationship. Based on that expectation, parties begin to
on others to behave in a particular manner. In doing so, they tend to rely upon other
to do certain things, but not to do others. Unless circumstances have recently changed,
expect others to do what they’ve always done. Box 3 shows the identified bases of
t for perceived knowability.
17—Monitoring Trust

Box 3: Bases of support for perceived knowability
Sum
Firs
Seco
and
can
thos
Mon
Box 3
Bases of support for perceived knowability:
Competence (Miller, 1974): One’s ability to effectively implement their skills, knowledge, or
expertise in a given arena.
Reliability (Fukuyama, 1995): The extent to which one can be counted upon to perform a given
function, or behave in a certain manner.
Previous Experience (Fukuyama, 1995): Earlier interactions parties have with others that color
their attitudes of consistency and familiarity.
Effectiveness (Citrin and Muste, 1999): The ability of parties to successfully accomplish goals
and have an impact on a given object.
Uncertainty (Mason et al., 1985): The grades of knowability associated with engaging in a
relationship with certain parties or performing certain actions.
mary
Despite the high discrepancy in what trust is, it is composed of three common elements:
t, trust is built upon a series of shared norms and values, which provide a basis for trust.
nd, according to the theory of contingent consent, trusting others is in one’s self interest,
one should be able to expect trustworthy, reciprocal behavior from others. Third, parties
be expected to behave as they have in previous encounters and, given a choice, will trust
e they can rely upon and with whom they have had previous positive experiences.
itoring Trust—18

The following graphic, Figure 1, shows the hypothesized causal diagram of trust. Each
group of components on the left contributes to one of the three trust dimensions, which in turn
contribute to trust.
Figure 1: Hypothesized causal diagram of trust
Dimensions
Bases of Support
Shared Norms and
Values
Contingent Consent
Perceived Knowability
Integrity
Worthy of Pride
Compassion &
understanding
Agreement
Procedural
Justice
Responsiveness
Membership in
the political
community
Trustworthiness
Confidence
Competence
Reliability
Previous
Experience
Effectiveness
Uncertainty
Trust
Figure 1: Hypothesized Causal Diagram of Trust
19—Monitoring Trust

Project Justification
The Bitterroot Ecosystem Management Research Project (BEMRP) is funded by the
Rocky Mountain Research Station, but is guided by a consortium of Forest Service (RMRS)
scientists, the College of Forestry and Conservation at the University of Montana, the Forest
Service Northern Region, and the Bitterroot National Forest. BEMRP is committed to
“…understanding public values and how they change through time relative to the social
acceptability of different fuel treatment strategies.” BEMRP scientists are also interested in
identifying “social barriers to implementing ecosystem restoration and fuel treatment
activities, including distrust of government” (BEMRP Research objectives for FY 03-10/9/02).
These current objectives are driven in part by a propositions arising from the post fire
assessment for the 2000 Bitterroot Valley Fires in Montana (BBER, 2001), that there is a lack of
public trust in the agency’s ability to make fire management decisions that reflect local values.
Bitterroot Valley Residents often suggested that fire management decisions were made by
“outsiders” (e.g., the Washington office, environmental groups, out of state crew leaders, etc.)
who possessed little understanding of the relationships local people have with natural
resources there or how fire management decisions affect those relationships.
As federal agencies become more cognizant of the importance of collaboration through
all stages of resource management decision making, public trust is likely to become a long-
term indicator of success of the agency’s ability to protect or restore relationships between the
public and public lands (Machlis, Kaplan, Tuler, Bagby, and MacKendry, 2002). This project
uses a community-wide assessment of public trust in the Forest Service’s ability to make fire
and fuel treatment management decisions that consider local values in meeting public purpose
Monitoring Trust—20

mandates of public lands. This baseline assessment can serve as the foundation to measure
success of a long-term, landscape-level ecosystem management project that assesses and maps
meanings attached to the landscape, models long-term effects of fire on the landscape, and
collaborates with local citizens and conservation groups to determine fuel hazard reduction
direction in the Bitterroot Valley. The findings from this project can provide input to
collaborative planning direction for other fuel management programs specifically and federal
agency management generally, across the United States.
21—Monitoring Trust

Measurement of Trust
All forms of trust exist in relation to specific objects, and people respond differently to
different forms of trust in different circumstances. Focusing on the relationships of trust that
exist between government and communities, political trust is a complex phenomenon, and as
such, its type and measurement have been greatly debated. Political trust is not an entity unto
itself, but rather is a reflection of one’s support for a given politician, political group, process
or institution. In order to fully reflect these attitudes toward government, the reasons or bases
for trusting must also be identified (Citrin and Muste, 1999). However, little consensus exists
about crucial conceptual issues such as what political trust means specifically, or what bases of
support are most important. With this conceptual divergence, innumerable methods exist for
measuring trust in government, each rooted in its own set of assumptions (Ulbig & Alford,
2001; Citrin & Muste, 1999). Nonetheless, in order to develop our understanding of the sources
and implications of political trust, an accurate method must be chosen to measure it.
Though it is frequently done, to get a thorough understanding of trust, more is
required than simply to ask whether citizens agree or disagree with government actions, or a
few questions targeting trust in a specific agency (Davis, 1978; Earle & Cvetkovich, 1998;
Miller, 1974; Winter, Palucki, & Burkhardt, 1999). Trust is a multidimensional phenomenon
(Ganesan & Hess, 1997; Johnson, 1999; Rousseau, Sitkin, Burt, and Camerer, 1998), and should
be treated as such. In light of trust’s multi-dimensionality, attempting to measure trust
without a full understanding of its complexity provides a number of implications on the
validity of trust measures. Among these are the notions that trust may not be cognitively
accessible by survey respondents, that it may be impossible to condense into a single response,
Monitoring Trust—22

that questions are open to strategic responding, and that a one-dimensional measure of trust
may provide insufficient content validity. Therefore, it may not in fact be possible to validly
and precisely measure trust directly. Rather, it is possible to measure trust indirectly by
measuring the components in each dimension. Trust’s components, or bases of support, are
more tangible and thus more easily measured. By identifying the most relevant components,
an accurate measure of trust can be made (Citrin and Muste, 1999).
Trust Measures
Survey questions from previous trust studies (Davis, 1978; Greenberg and Williams,
1999; Institute for Social Research, 1999; Jukam, 1977; Mason, House, and Martin, 1985; Miller,
1974; Muller and Smith, 1981; Selnes, and Sallis, 2003) were matched with previously
identified bases of support in each trust dimension, and were adapted to the context of fire and
fuel management in the Bitterroot National Forest. When survey items were not available from
these sources, new survey items were proposed, to ensure all theorized bases of support were
included (see Boxes 1-3). Items were also included to measure residents’ opinions of general
management of the Bitterroot National Forest. On a larger scale, looking at the US Forest
Service in general, the Salient Values Similarity trust model developed by Earle and
Cvetkovich (1995), modified by Winter et al. (1999) and Borrie et al. (2002), was also included.
Additionally, items about the general management of the federal government (Miller, 1974),
and trustworthiness of other people in general were included (Davis, 1978). All questions are
shown in Boxes 4 a-c and 5 a-b.
23—Monitoring Trust

B
M
Box 4a: Survey Items for Shared Norms
Shared Norms and Values [Integrity] When managers of the Bitterroot National Forest speak on television, radio, in newspapers, or at public meetings
about forest fires, how often, if at all, do they tell the truth? (Muller and Jukam, 1977) Always (4) to Never (1) [Worthy of Pride] Would you say that you are proud of the way fire is managed on the Bitterroot National Forest, or that you
can’t find too many things about the fire management to be proud of? (Mason, House, and Martin , 1985) Proud of fire management (1); Can’t find too many things to be proud of (0) [Compassion & Understanding] I believe the Bitterroot National Forest staff demonstrates a general attitude of compassion
when fighting fires. (Selnes, and Sallis, 2003) Strongly agree (4) to Strongly disagree (1) [Agreement] Generally speaking how satisfied are you, if at all, with the way the Bitterroot National Forest staff deals with
fires? (Institute for Social Research, 1999) Very satisfied (4) to Very dissatisfied (1) [Agreement] Generally speaking how satisfied are you, if at all, with the way the Bitterroot National Forest staff deals with
forest fuels? (Institute for Social Research, 1999) Very satisfied (4) to Very dissatisfied (1) [Procedural Justice] How often, if at all, do you think fires on the Bitterroot National Forest are managed according to a fair
process? (Created) Always (4) to Never (1) [Responsiveness] Managers on the Bitterroot National Forest respond to the needs of local residents when fighting fires.
(Selnes, and Sallis, 2003) Strongly agree (4) to Strongly disagree (1) [Shared Norms and Values] To what extent, if at all, does the Bitterroot National Forest share your values about fire
management? (Earle and Cvetkovich, 1995) Completely (5) to Not at all (1)
ox 4a-c: Survey Items for Trust Dimensions
Box 4b: Survey Items for Contingent Consent [Members of the Political Community] How much attention, if any, have Bitterroot National Forest managers paid to what
people think when managers decide what to do about forest fires? (Mason, House, and Martin , 1985) A good deal of attention (3) to Not much attention (1) [Trustworthy] Residents of the Bitterroot Valley say that the Bitterroot National Forest staff is trustworthy when fighting fires.
(Selnes, and Sallis, 2003) Strongly agree (4) to Strongly disagree (1) [Confidence] How much, if any, confidence do you have in wildland fire fighters in general? Do you have? (Smith, 1981) Complete confidence (4) to No confidence at all (1) [Confidence] What about fire managers in the Bitterroot National Forest? Do you have? (Smith, 1981) Complete confidence (4) to No confidence at all (1) [Contingent Consent] Considering that the Bitterroot National Forest is managed on behalf of everyone, how satisfied are you,
if at all, with fire management in the Bitterroot National Forest? (Institute for Social Research, 1999) Very satisfied (4) to Very dissatisfied (1)
onitoring Trust—24

C
ex
co
Box 4c: Survey Items for Perceived Knowability
[Competence] Based on your observations and experiences what portion, if any, of the people who manage forest fires in the Bitterroot National Forest know what they are doing? (Miller, 1974)
All (4) to None (1) [Reliability] I find the Bitterroot National Forest staff to be reliable when managing fires. (Muller and Jukam, 1977) Strongly agree (4) to Strongly disagree (1) [Reliability] I find the Bitterroot National Forest staff to be reliable when managing forest fuels. (Muller and Jukam, 1977) Strongly agree (4) to Strongly disagree (1) [Previous Experience] In the past how pleased, if at all, have you been with the way fires in the Bitterroot National Forest
were managed? (Created) Very pleased (4) to Very displeased (1) [Effectiveness] In your community, how would you rate the effectiveness of Bitterroot National Forest fire managers in
dealing with fire-related issues? (Created) Excellent (4) to Poor (1) [Effectiveness] When fighting fires, do you think that the Bitterroot National Forest staff generally: (Miller, 1974) Wastes a lot of the money (3); Wastes some money (2); Doesn’t waste very much money (1) [Uncertainty] How sure, if at all, have you felt that forest fires threatening your community or your property would be put
out in time? (Created) Very sure (4) to Very unsure (1) [Uncertainty] To what extent, if at all, do you agree or disagree with the following statement: Science can settle differences of
opinion about the risks and benefits from forest fires? (Greenberg and Williams, 1999) Strongly agree (4) to Strongly disagree (1)
itrin and Muste (1999) identified several methodological guidelines for the evaluation of
isting trust scales and the construction of new ones. These guidelines were followed in the
nstruction of new survey items.
• Ensure that the attitude object (agency, institution, leader, etc.) is specified as
clearly as possible
• Evaluate the attitude object according to appropriate normative standards
• Incorporate items referring to competing systems of governance when
measuring support of a given regime
25—Monitoring Trust

Box 5a-b: Survey Itmes for Government management, and trustworthiness of others
Bo
Monitorin
x 5b: Survey Items for Trustworthiness of People in General
Would you say that most of the time people try to be helpful, or that they are mostly just looking out for themselves? Try to be helpful (1) Just look out for themselves (0) Do you think most people would try to take advantage of you if they got a chance, or would they try to be
fair? Would take advantage of you (1) Would try to be fair (0) Generally speaking, would you say that most people can be trusted, or that you can’t be too careful in dealing with
people?
Box 5a: Survey Items for Bitterroot, USFS, and Federal Government general management
General Management of the Bitterroot National Forest How satisfied are you, if at all, with the overall management of the Bitterroot National Forest? Very satisfied (4) to Very dissatisfied (1) In the past, how pleased, if at all, have you been with the way the Bitterroot National Forest in general was managed? Very pleased (4) to Very displeased (1) How much, if any, confidence do you have in managers of the Bitterroot National Forest in general? Do you have Complete confidence (4) to No confidence at all (1)? To what extent, if at all, does the Bitterroot National Forest share your values about managing the Bitterroot National
Forest in general? Completely (5) to Not at all (1)
General Management Of The USDA Forest Service
The USDA Forest Service supports my views. Supports my views (5) Opposes my views (1) The USDA Forest Service has similar goals to mine. Has similar goals to mine (5) Has different goals than mine (1) The USDA Forest Service thinks like me. Thinks like me (5) Does not think like me (1) The USDA Forest Service shares my values. Shares my values (5) Does not share my values (1) The USDA Forest Service is like me. Is like me (5) Is not like me (1)
General Management of the Federal Government Now what about the government in general? Do you think the federal government? Wastes a lot of the money (3); Wastes some money (2); Doesn’t waste very much money (1) How much of the time, if at all, do you think you can trust the government in Washington to do what is right? All of the time (5) None of the time (1)
g Trust—26

• Use a multi-format approach when constructing items to minimize the
influence of response sets inherent in yes-no formats
• Test predictions across a broad range of political theories including attitude-
behavior reactions to strengthen evidence of validity
Citrin and Muste (1999) also suggested that test-retest data be collected to ensure that
enduring attitudes are reflected, rather than fleeting emotional responses. Because of monetary
restraints, it was not possible to collect data such as these. There is, however, comparability
between some items from the 2000 post-fire assessment, as well as initial testing of potential
items for future monitoring of trust in the study area.
Bianco (2001) theorized that survey responses may be colored by previous statements
about the trustworthiness of elected officials, and believed the specific context of trust survey
questions to be important. To prevent this, question ordering must also be examined prior to
survey implementation.
27—Monitoring Trust

Data Collection
Methodology
The sample population was defined as all households with a functional telephone in
Ravalli County, Montana (That is, in and around the towns of Hamilton, Victor, Stevensville,
Darby, Sula, and Alta). A telephone survey was administered by the University of Montana’s
Bureau of Business and Economic Research (BBER) using a random-digit dial process. A Kish
table was used to randomly select respondents within households (Kish, 1949). Previous
application of this method on a multi-state project yielded a 52.4% response rate (Borrie et al.,
2002), though application of this method in the Bitterroot Valley post-fire assessment
previously yielded an 87% response rate (BBER, 2001). Community residents have shown
sincere interest in fire and fuels management, and high levels of cooperation were anticipated
for the study.
10 initial pilot-tests were conducted with graduate students and faculty at the
University of Montana College of Forestry and Conservation, as well as with researchers at the
Aldo Leopold Wilderness Research Institute, all of whom were at least generally familiar with
fire management issues on the Bitterroot National Forest. As part of further pilot-testing,
cognitive interviews were conducted by BBER with four residents of the Bitterroot Valley. The
cognitive interviews used both concurrent thinkalouds and concurrent probes in order to
investigate respondents’ thought processes when answering the survey, and to explore
potential problems with survey questions (Sudman, Bradburn, and Schwartz, 1996). After
refinement of the survey based on the results of the cognitive interviews, telephone
interviewers conducted a pilot test of the survey to approximately 100 Lolo residents to
Monitoring Trust—28

examine question wording, question order, and technical implementation of the survey. The
survey instrument is included as appendix A.
The segmentation analysis, was based on the dimensionalization of trust presented
earlier in this report, and was used to measure the relative level of trust residents had in the
US Forest Service to manage forest fuels and fires in the Bitterroot. Segments were developed
through an analysis of the identified bases of support for each dimension: shared norms and
values, contingent consent, and perceived knowability.
Sampling in the Bitterroot
The assessment following the fires of 2000 divided the Bitterroot region of Ravalli
County, Montana, into three separate sampling areas based upon hypothesized differences in
population (BBER, 2001). To assist in comparison between this survey and the earlier survey,
the boundaries were preserved. The North region is centered about Stevensville, the central
region includes Hamilton and Victor, and the South region contains Darby, Sula, and Alta. The
methodology used to estimate the statistically relevant sample sizes for each region in the 2000
post-fire assessment was based on conservative estimates of variation of the known population
sizes, with desired accuracy of ± 5% and 90% confidence. Data from the 2000 Census were
used to estimate desired sample sizes for the current project. The final sample was, thus, not
collected directly to represent the county population proportionately. Consequently, in order
to faithfully represent the population of Ravalli County, a weighting scheme was developed
based upon the following formula:
29—Monitoring Trust

⎟⎟⎠
⎞⎜⎜⎝
⎛
⎟⎟⎠
⎞⎜⎜⎝
⎛
=
s
s
p
p
r
TR
TR
W
where Wr is the weight for each region, Tp is the total population size, Ts is the total sample
size, Rs is the size of the sample from each region, and Rp is the size of the population in each
region. Weighting data are included in Table 1.
Table 1: Regional Characteristics, Sample Sizes, and Sample Weighting
Table 1: Regional Characteristics, Sample Sizes, and Sample Weighting
Sample Area
Telephone Exchanges
No. Households*
% Households
Required Sample
Size
Actual Sample
Size %
Sample Wr
North 777 4601 32.20% 355 393 34.11% 0.943866 Central 363, 375, 642, 961 8353 58.46% 367 396 34.38% 1.700583 South 349, 821 1335 9.34% 298 363 31.51% 0.296500 Total 14289 100.00% 1020 1152 100.00% 1.000000
* Based on 2000 US Census Data;
Monitoring Trust—30

Results
Overall Sample characteristics (weighted)
1690 distinct contacts were made with qualified respondents in Ravalli County.
Including those that rescheduled appointments with telephone interviewers multiple times,
but never completed a survey, slightly more than 1/4 of all attempted calls were refusals. In
addition, about 5% of all households contacted were considered “valid, but non-
interviewable” because respondents were incapable of completing the survey during the
sampling period due to illness, previously scheduled vacations, or other uncontrollable
factors. This resulted in 1164 completed surveys. Twelve completed surveys were lost in a
corrupted data file, yielding 1152 usable surveys with a final response rate of 68%.
Sociodemographics
The overall sample was almost evenly split across gender, with 48.6% male, and 51.4% female,
closely matching proportions identified in the 2000 US census for Ravalli County (49.7% and
50.2%, respectively). The age of respondents ranged from 18 to 91 years in age, with a mean
age of 51.66 years (SD = 16.81). Residents lived in Ravalli County on average for 19.17 years
(SD = 16.52), including a maximum of 91 years, and a minimum of less than one year. These
results are presented in Table 2.
Table 2 Respondent age, number of years in Ravalli County, and number of years in Montana.
Table 2: Respondent age, number of years in Ravalli County, and number of years in Montana.
Mean Median Std. Dev. Age 51.66 52.00 16.81
Years in Ravalli County 19.17 14.00 16.52 Years in Montana 26.23 21.00 20.38
31—Monitoring Trust

Education. Nearly 95% of respondents have at least a high school diploma or GED, with
more than a quarter having graduated from college, and less than 10% possessing a graduate
degree.
Income. In the sample, nearly two-thirds of households have an annual income of
between $20,000 and $75,000. Data from the 2000 US census closely mirrors this distribution,
though higher incomes were slightly over-sampled and lower incomes slightly under-
sampled, relative to census data. Data on income are presented in Table 3.
Table 3: Respondent place of residence, gender, education, and income
Table 3. Respondent place of residence, gender, education, and income.
Sample Censusa
n % n % Percentage
Differentialb
Town Stevensville 371 32.2 12279 34.1 1.9 Hamilton 602 52.3 17489 48.5 -3.8 Victor 71 6.2 2839 7.9 1.7 Darby/Sula 99 8.6 3454 9.6 1.0 Alta 9 0.8 - - - Total 1152 100.0 36061 100.0 Gender Male 559 48.6 17,951 49.8 1.2 Female 593 51.4 18,119 50.2 -1.2 Total 1152 100.0 36,070.0 100.0 Education Less than High School 62 5.5 3031 12.4 6.9 High School Grad or GED 473 41.8 7738 31.6 -10.2 Some college 279 24.7 8200 33.5 8.8 College Graduate 208 18.4 3897 15.9 -2.5 Graduate Degree 110 9.7 1631 6.7 -3.0 Total 1132 100.0 24497 100.0 Income > $100,000 75 8.1 956 6.7 -1.4 $75,000-$99,999 72 7.8 710 5.0 -2.8 $50,000-$74,999 200 21.7 2210 15.5 -6.2 $35,000-$49,999 171 18.5 2696 18.9 0.4 $20,000-$34,999 229 24.9 3809 26.7 1.8 $15,000-$19,999 60 6.5 1291 9.1 2.6 $10,000-$14,999 69 7.5 1171 8.2 0.7
< $10,000 46 5.0 1416 9.9 4.9 Total 922 100.0 14259 100.0
a Data taken from 2000 US Census. Comparisons are between survey respondents and residents of Ravalli county, or where specified, particular towns in Ravalli County. b Differential is calculated by subtracting survey percentage from census percentage. c US Census data includes Alta in the Darby and Sula county subdivisions.
Monitoring Trust—32

Regional Background
Residence. 98.3 percent of total respondents indicated that they considered Ravalli
County to be their primary place of residence. Two thirds of respondents considered
themselves to live “in town,” while the remaining considered themselves to live either “on the
edge of town,” or “outside of town.” Similarly, two-thirds consider themselves to live outside
of forested areas, while the remainder consider themselves to live on the edge of a forested
area or in a forested area. Nearly one-fifth believe they live within one-half mile of the
boundary of the Bitterroot National Forest. These results are presented in Table 4.
Table 4: Residence Location
Table 4: Residence location Item Response n %
Location of Primary Residence Outside of Ravalli County 20 1.7 In Ravalli County 1122 98.3 Total 1142 100.0
Location relative to town Outside of town 257 22.6 On the edge of town 178 15.6 In town 705 61.9 Total 1140 100.0
Location Relative to Forest Live in a forested area 132 11.6 Live on the edge of a forested area 267 23.5 Live outside a forested area 740 64.9 Total 1139 100.0
Live within 1/2 mile of BNF Boundary No 938 82.4 Yes 201 17.6 Total 1139 100.0
Regional involvement. About 20% reported having worked in a job that helped to fight
fires in the Bitterroot Valley. Less than 10% claim membership in an organization that has the
management of the Bitterroot National Forest as one of its interests. (Such organizations
include, but are not limited to the Rocky Mountain Elk Foundation, Friends of the Bitterroot,
Alliance for the Wild Rockies, and Timberworkers United. A complete list is given in
33—Monitoring Trust

Appendix B). Nearly 25% have worked for the Forest Service, or live with someone who has.
These results are reported in Table 5.
Table 5: Respondent involvement in forest issues
Table 5. Respondent involvement in forest issues
Item Response n % Have worked in a job that has helped to
fight fires in the Bitterroot Yes 202 17.6 No 947 82.4 Total 1149 100.0
Member of a group with interests in the management of the BNF Yes 100 8.8
No 1031 91.2 Total 1131 100
Self or HH member works for USFS Yes 278 24.5 No 855 75.5 Total 1133 100.0
Fire Experience. A group of questions were about Bitterroot residents’ experience with fires in
and around the Bitterroot National Forest. These results are reported in Tables 6a and 6b.
Generally, responses are not much different from those given in the 2000 post fire assessment1.
Some notable results (with comparable 2000 data in parentheses) are that:
• Nearly 90% (compared with 84% in 2000) claim to have been either somewhat
affected or very affected by smoke from Bitterroot fires
• About 15% (13%) have been told to prepare to evacuate, but not required to
• About 8% (8%) have been evacuated
• 2% (2%) have been told to evacuate, but refused to
1 The 2000 post-fire assessment asked respondents only about their experiences in the Bitterroot during the severe fire season of 2000. The current survey, however, affixed no time scale to respondents’ fire experiences in the Bitterroot. This probably accounts for the notably higher percentages in this survey when compared to the 2000 post-fire assessment
Monitoring Trust—34

Table 6a-b: Respondent's personal and economic experience with fire in the Bitterroot
TABLE 6a: Respondent's personal experience with fire in the Bitterroot. 2004 2000
Item Response n % % Have been affected by smoke from fires in the
Bitterroot* Not at all 138 12.1 - Somewhat 494 43.1 - Very 513 44.8 - Total 1145 100.0 -
Have been evacuated from your home No 1056 92.3 91.7
Yes 88 7.7 8.3 Total 1144 100.0 100
Have prepared to evacuate, but not required to No 973 85.1 87.1
Yes 171 14.9 12.9 Total 1144 100.0 100
Have been told to evacuate, but refused No 1116 97.5 97.7
Yes 28 2.5 2.3 Total 1144 100.0 100
* Scale differences prevent comparison
TABLE 6b: Some Economic Effects of Fire in the Bitterroot 2004 2000
Item Response n % % Have lost hours at work because of fires in the
Bitterroot No 984 85.7 79.7 Yes 165 14.3 20.3 Total 1149 100.0 100
Have worked more hours because of fires in the
Bitterroot No 977 85.7 81.2 Yes 164 14.3 18.8 Total 1141 100.0 100
Business or employer lost money because of
fires in the Bitterroot No 882 79.9 80.2 Yes 221 20.1 19.2 Total 1103 100.0 100
Business or employer made more money than
usual because of fires in the Bitterroot No 975 88.7 88.5 Yes 124 11.3 11.5 Total 1099 100.0 100.0
35—Monitoring Trust

Opinions of fire management on the Bitterroot National Forest. A series of questions asked
Bitterroot Residents about their opinions of fire management in the Bitterroot National Forest.
Full results are reported in Appendix B. With respect to Ravalli County, some notable results
include:
• More than 60% are either somewhat satisfied or very satisfied with how the
Bitterroot National Forest deals with fires
• More than 40% are either somewhat satisfied or very satisfied with how the
Bitterroot National Forest deals with forest fuels
• More than 60% have either quite a lot of confidence or complete confidence in
the Bitterroot National Forest’s fire managers
• More than 80% either somewhat agree or strongly agree that other residents of
the Bitterroot believe the Bitterroot National Forest staff to be trustworthy when
fighting fires
• More than half are proud of the fire management on the Bitterroot National
Forest
• 66% believe that fires on the Bitterroot National Forest are managed according to
a fair process
Opinions on the general management of the Bitterroot National Forest. A series of questions
asked Bitterroot residents about their opinions of the general management of the Bitterroot
National Forest. Full results are included in Table 7. Some notable results include:
Monitoring Trust—36

• 66% are either somewhat satisfied or very satisfied with the overall management
of the Bitterroot National Forest
• 70% are either somewhat pleased or very pleased with the way the Bitterroot
National Forest has been managed in the past
• Nearly 66% have either quite a lot of confidence or complete confidence in the
Bitterroot National Forest managers in general
• When asked whether the Bitterroot National Forest shares their values about
managing the forest, on a scale from 1 to 5 (with 1 being not at all, and 5 being
completely), almost 75% of those surveyed responded with a 3, 4, or 5.
Table 7a-b: Respondent attitudes towards Bitterroot National Forest general management.
TABLE 7a: Respondent attitudes towards Bitterroot National Forest general management. Item Response n %
How satisfied are you with the overall management of the Bitterroot National Forest? Very Dissatisfied 129 11.7
Somewhat Dissatisfied 232 21.0 Somewhat Satisfied 574 52.1 Very Satisfied 166 15.1 Total 1100 100.0
In the past, how pleased have you been with the ways the Bitterroot National Forest in
general has been managed? Very Displeased 85 7.9 Somewhat Displeased 224 20.8 Somewhat Pleased 583 54.2 Very Pleased 183 17.1 Total 1075 100.0
37—Monitoring Trust

TABLE 7b: Respondent attitudes towards Bitterroot National Forest general management. Item Response n %
How much confidence do you have in Bitterroot National Forest managers in
general? No Confidence At All 64 5.8 Not very much 335 30.8 Quite a lot 576 52.9 Complete Confidence 113 10.4 Total 1088 100.0
To what extent does the Bitterroot National Forest share your values about managing the
forest? [Not at all] 1 95 8.9 2 174 16.3 3 373 35.0 4 319 29.9 [Completely] 5 105 9.8 Total 1065 100.0
Opinions towards the Forest Service. A series of questions asked Bitterroot residents about
similarities between themselves and the Forest Service. Questions were asked on a five point
scale (with five representing complete agreement with the statement, and one representing
complete disagreement with the statement). These results are presented in Table 8.
• 66% of Ravalli county residents responded2 that the Forest Service supports their views
• 66% responded2 that the Forest Service has similar goals to them
• Slightly more than half responded2 that the Forest Service thinks like them
• More than 60% responded2 that the Forest Service shares their values
• More than 45% responded2 that the Forest Service is like them
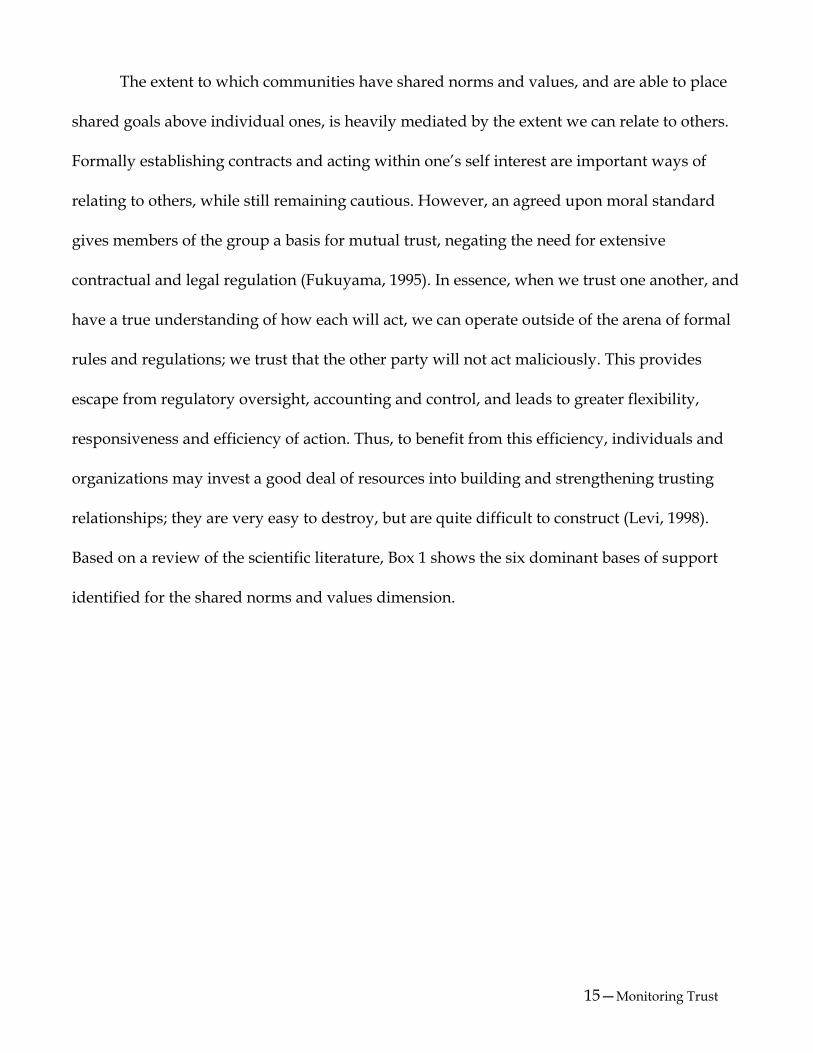
Opinions about other people. A series of questions asked Bitterroot residents about their
cynicism towards other people. Although it was not an option, on average 8% of respondents
2 Responded with a 3, 4, or 5 on the five point scale
Monitoring Trust—38

volunteered “it depends” as a response for each of the 3 questions. Results are presented in
Table 9.
• About 70% thought that most of the time people try to be helpful
• 70% thought most people would try to be fair
• Slightly more than half believe that most people can be trusted
Table 8: Respondent's shared norms and values with the US Forest Service.
TABLE 8: Respondent's shared norms and values with the US Forest Service. Item Response n %
USFS supports my views [Opposes my views] 1 153 14.6 2 198 18.8 3 367 34.9 4 250 23.8 [Supports my views] 5 83 7.9 Total 1051 100.0
USFS has similar goals to mine [Different Goals] 1 157 15.0 2 211 20.1 3 326 31.0 4 255 24.2 [Similar Goals] 5 102 9.7 Total 1051 100.0
USFS thinks like me [Does not think like me] 1 280 27.1 2 228 22.1 3 315 30.5 4 165 15.9 [Thinks like me] 5 47 4.5 Total 1035 100.0
USFS shares my values [Does not share my values] 1 188 18.0
2 222 21.2 3 312 29.8 4 216 20.6 [Shares my values] 5 107 10.3 Total 1044 100.0
USFS is like me [Is not like me] 1 329 33.0 2 210 21.1 3 275 27.6 4 136 13.7 [Is like me] 5 45 4.5 Total 995 100.0
39—Monitoring Trust

Table 9: Respondents' general cynicism
Table 9: Respondents' general cynicism Item Response n %
Most of the time, people try to be helpful/are mostly looking out for themselves Look out for themselves 272 24.2
Try to be helpful 777 69.3 Depends* 73 6.5 Total 1122 100.0
Most people would try to take advantage of you/would try to be fair Try to be fair 778 70.0
Try to take advantage of you 234 21.1
Depends* 99 8.9 Total 1111 100
Most people can be trusted/you can't be too careful in dealing with people You can't be too careful 439 39.6
Most people can be trusted 577 52 Depends* 93 8.4 Total 1109 100.0
* Volunteered
Further Statistical Analyses.
Factor Analysis.
A confirmatory factor analysis3 using generalized least squares4 was conducted to test
the extent to which 21 dependent variables focusing on the fire management of the Bitterroot
National Forest group together. Generalized least squares were used in order to give more
importance to variables with substantial shared variance than to those with substantial unique
variance.
3 For all Bitterroot National Forest fire and fuels management variables with missing values, regression analysis was used to estimate the values, treating the variable with missing data as the criterion and all other BNF fire and fuels management variables as predictors. Estimated values were distributed around the norm in a normal pattern. Using this method allows for a more accurate prediction of missing values than assigning the mean value to the missing data. It allows for more degrees of freedom and statistical power than if the case with missing data were eliminated from the analysis. 4 Unweighted data were used in scale development factor analysis and reliability analysis, because the data were not intended to represent only Ravalli County residents, but rather people in general.
Monitoring Trust—40

A single factor solution was found to best represent the facets of trust in Bitterroot
National Forest fire management. This single factor explained 51.5% of the variance, with all
communalities greater than approximately 0.40. Because a solution with only one factor was
chosen, no rotation was possible. It should be noted that based on low correlations between
one variable (Measuring perceived scientific uncertainty) and all others, question C21 was
deleted from further analyses. Detailed results from the factor analysis are presented in
Appendix B.
Following the same analytical methods, additional factor analyses were conducted to
confirm the inter-relationship of variables within theoretical dimensions of trust: shared norms
and values, contingent consent, and perceived knowability. The first hypothesized dimension,
shared norms and values, contributes to residents’ trust in the Bitterroot National Forest to the
extent that respondents believe they share common values with the Bitterroot National Forest.
The second hypothesized dimension, contingent consent, contributes to residents’ trust of the
Bitterroot National Forest through the presence of a belief they have a political voice in the
management of the Bitterroot National Forest, that other members are trustworthy, and that
their trust will be reciprocated. For the third hypothesized dimension, perceived knowability,
Bitterroot residents trust the Bitterroot National Forest if they expect that the actions of
Bitterroot National Forest managers will be reliable, effective, and competently made.
In the shared norms and values dimension, eight variables were used to measure
respondents’ perceptions of the Bitterroot National Forest’s fire and fuels management (See
Box 4a). A confirmatory factor analysis of these items yielded a single factor solution,
accounting for 55.8% of the variance.
41—Monitoring Trust

In the contingent consent dimension, five variables were used to measure respondents’
perceptions of the Bitterroot National Forest’s fire management (See Box 4a). These items
addressed whether respondents believed they held membership in the “political community”
of the Bitterroot National Forest, the extent to which they believed that the Bitterroot National
Forest was trustworthy, as well as the amount of confidence they had in them. Here, a single
factor solution explaining 61.4% of the variance emerged as the best representation of the data.
In the perceived knowability dimension, seven variables were used to measure
respondents’ perceptions of the Bitterroot National Forest (See Box 4b). These items addressed
the extent to which residents believe the Bitterroot National Forest to be competent, reliable,
and effective. In addition, it also addressed Bitterroot residents’ previous experience with fire
management in the Bitterroot National Forest, as well as the uncertainty they felt when it came
to managing fires in the Bitterroot. A single factor solution explaining 60.1% of the variance
emerged as the best representation of the data.
Thus, not only was the overall relatedness of all 20 variables used to measure trust
confirmed, but the robustness of each of the three dimensions of trust was confirmed. Further
analyses were then undertaken to check the reliability of these dimensions and the variables
used to measure them. Factor scores for each dimension were saved so these further analyses
could be conducted.
Reliability Analysis. The internal consistency of the identified trust dimensions was tested by
computing Cronbach’s alpha upon the variables in each dimension. Cronbach’s alpha
provides a consistent assessment of reliability without having to retest individual respondents,
and is a common measure of the reliability of the dimension.
Monitoring Trust—42

For the eight items in the shared norms and values dimension, the corrected item-total
correlations ranged from about 0.5 to about 0.7, indicating satisfactory correlations between
each item and the dimension as a whole. Cronbach’s alpha was 0.88, with reductions if any of
the variables are removed. This dimension is therefore found to be a consistent and reliable
measure using the previously identified items.
For the five items composing the contingent consent dimension, the corrected item-total
correlations ranged from about 0.6 to about 0.7, indicating that each item was strongly related
to the dimension. Cronbach’s alpha was .84, with reductions if variables were deleted. Thus,
all five items are retained for a reliable measure of contingent consent.
The seven items in the perceived knowability dimension had corrected item-total
correlations which ranged from about 0.6 to about 0.8, again indicating strong relationships
between the items and the dimension as a whole. Cronbach’s alpha was 0.88, with reductions
upon the deletion of any of the items. We conclude that this dimension is also found to be a
reliable measure with these seven items.
Cluster Analysis.
A K-Means cluster analysis was conducted on the three trust dimension factor scores in
order to separate respondents into groups with similar levels of trust. A three-cluster solution
with individually distinguishable clusters when plotted and similar cluster sizes was chosen as
the best fit to the data. Thus, the data were divided into groups of high trusting respondents,
moderately trusting respondents, and low trusting respondents. Increases or decreases in
number of clusters resulted in similar proportions of trusting versus distrusting respondents,
with negligible discrimination between groups and uneven cluster sizes. Factor score centers
43—Monitoring Trust

for each of the clusters are shown in table 10. It can be seen that the high trust cluster has data
points that are high on all three dimensions, and that the low trust cluster is low on all three
dimensions of trust. The moderate trust cluster is in between. A 3-dimensional scatter plot of
factor scores plotted against one another is shown in Graph 1. In the graph, it can be seen that
a distinct gap exists between medium and low trust clusters, and that there is no overlap
between high and medium trust clusters, indicating satisfactory distinction between clusters.
Table 10: Cluster center location for trust factor scores
Figure 2: Trust Dimension Factor Scores
Trust Cluster
High Trust
Moderate Trust
Low Trust
3
-3
-2
-1
0
1
2
Shared Norms and Values
2 1Perceived Knowability0 -2-1 -1
Cont ingent Consent0-2 12
Table 10: Cluster center location for trust factor scores
High Trust
Moderate Trust
Low Trust Total
Factor score for shared norms and values 0.90372 0.13168 -1.20071 Factor score for contingent consent 0.92401 0.06752 -1.14702
Factor score for perceived knowability 0.96147 0.09796 -1.21814
Number of cases 362 483 304 1149
Monitoring Trust—44

Analysis By Trust Cluster.
The following tables are the result of the crosstabulation of trust clusters with
independent variables. This allows comparison of the different trust clusters on socio-
economic variables, level of experience with forest fire, opinions towards the Bitterroot
National Forest, and so forth. In doing so, identifying characteristics of those Ravalli County
residents who do or do not trust the Bitterroot National Forest can be found. Unless indicated,
all differences were statistically significant at p≥0.05. Table 11 shows the description of clusters
for sociodemographic information. Full analyses of trust clusters are reported in Appendix C.
Table 11: Demographic and geographic characteristics of trust clusters
TABLE 11: Demographic and geographic characteristics of trust clusters Cluster
Item Low Trust Moderate
Trust High Trust Age° - - -
Sex More men Equal spilt More women
Education° - - -
Income° - - -
Years in Montana m = 31.59a,b m = 25.02a m = 24.10b
Years in Ravalli County m = 24.96a,b m = 17.70a m = 17.03b
Victor Hamilton° Stevensville
Hamilton° Hamilton° Alta
Town
Darby/Sula
Central North° North° Region South
°Not statistically different at α =.05; a,b Means significantly different at α = .05
The following table, Table 12, shows the cluster configuration for questions dealing
with general characteristics of the three clusters in regards to fire experience. Variables dealing
45—Monitoring Trust

with the location of respondents’ primary residence, as well as their membership in
organizations with interests in the management of the Bitterroot National Forest were not
found to be statistically different between the clusters5.
Table 12: Geographic and other characteristics of trust level clusters
Table 12: Geographic and other characteristics of trust level clusters
Item
Low Trust more likely
to... Moderate Trust more likely to…
High Trust more likely to…
Residence location relative to town* Live In town Live on the edge of town a
Live Outside of town a
Live in a
forested area Equal split Live outside a
forested area Residence relative to
urban/wildland interface or Live on
the edge of a forested area
Distance from BNF boundary* Within 1/2
mile aWithin 1/2 mile a Beyond 1/2 mile
Member of a group with interests in
BNF management b
Works for USFS Work for USFS
Not work for USFS
Affected by smoke Very Somewhat a Not at all a
* Significant at 0.10; a Means significantly different at α = .05; b Not significantly different
The following table, Table 13, shows the characteristics of the clusters for respondents
experience with evacuation during fires, as well as how their income was affected by fires in
the Bitterroot. The variable “summative evacuation experience” was created to generalize
respondents’ overall experience with evacuation by counting each affirmative response to the
3 evacuation questions as a 1, and summing them together. This created a 4 point scale ranging
5 The reason for the discrepancy between respondents’ residence location relative to town and relative to the wildland/urban interface is not currently known, but may be attributable to differences in respondents’ perceptions of what constitutes “in town,” “on the edge of town,” “outside of town,” “in a forested area,” “on the edge of a forested area,” and “outside of a forested area.” Additionally, given the rural agricultural nature of the region, simply living outside of town does not automatically mean someone lives in a forested area. An investigation into the accuracy of responses is currently being conducted by the University of Montana’s Bureau of Business and Economic Research and College of Forestry and Conservation.
Monitoring Trust—46

from 0 (no evacuation experience) to 3 (high evacuation experience). A similar approach was
taken with “summative effect of fire on income.” Affirmative responses to each of the four
questions dealing with the effect of fire on respondents’ income were scored as a 1, and the
variable was created by summing the responses to each question. Thus, a five point scale was
created that ranged from 0 (no effect of fire on income) to 4 (strong effect of fire on income).
Respondents in the low trust group were more likely to have had at least some social and
economic impact from fire, while those in the moderate or high trust groups tended to have
had little to no social or economic impact from forest fires.
Table 13: Trust level groups' experience with the social and economic effects of forest fires.
Table 13: Trust level groups' experience with the social and economic effects of forest fires.
Item Low Trust more
likely to... Moderate Trust more likely to...
High Trust more likely to...
Told to evacuate Be Told to evacuate
Equal split Not Told
Told to prepare to evacuate, but
not required? a
- - -
Required to evacuate, but refused Required, refused Not required Not required
Moderate Some None Summative Evacuation
Experience High
Lost hours at work Lost hours Equal split Didn't lose hours
Worked more hours a - - -
Business/employer lost money Lost money Didn't lose money
Business/ employer made more
money a - - -
Summative effect of fire on
income Moderate effect Equal split No effect
Minimal effect - - Some effect - -
Worked in a job that helped to fight fires in the Bitterroot
Worked to help fight fires
Didn't work to help fight fires a
Didn't work to help fight fires a
a Responses were not significantly different among trust groups at α = .05
47—Monitoring Trust
In order to gauge the general cynicism of respondents, three questions were asked to
measure respondents’ attitudes about other people. The questions were binary in nature and
required respondents to choose one of two possible responses. Many respondents found these
options to be restrictive and volunteered a response of “depends.” The results are show in
table 14.
Table 14: Trust Level Grouping Based on General Cynicism of Respondents
Table 14: Trust Level Grouping Based on General Cynicism of Respondents
Item Low Trust
more likely to...
Moderate Trust more likely to...
High Trust more likely
to...
Most of the time people try to be helpful/mostly look out for
themselves
Look out for themselves
*Depends (6.6%)
Try to be helpful
Most people would try to take advantage/would try to be fair Take
advantage *Depends
(9.2%) Try to be fair Most people can be trusted/you
can't be too careful in dealing with people
Can't be too careful
*Depends (8.4%)a
Most people can be trusted
Depends*a
* Volunteered. Numbers in parenthesis refer to percent of volunteered responses for each question aNot statistically different among trust groups at α = .05
This analysis provides evidence of the validity of our trust measures, since those that tended to
be most cynical were in the low trust group. Conversely, those that tended to be least cynical
were in the high trust group. Those that took the middle path tended to be in the moderate
trust group.
Several questions were asked about respondents’ opinions of the general management
of the Bitterroot National Forest. The following table, Table 15, shows the cluster distribution
for variables measuring opinions of the general management of the Bitterroot National Forest.
These results also indicate the validity of our measurement of trust since levels of satisfaction
Monitoring Trust—48

with and confidence in the Bitterroot National Forest and its managers are lower in the low
trust groups.
Table 15: Trust level groups' of opinions of BNF general management
Table 15: Trust level groups’ opinions about BNF general management
Item
Low Trust more likely to
be...
Moderate Trust more likely to
be…
High Trust more likely to
be… Very
Dissatisfied Somewhat satisfied
Very Satisfied How satisfied are you with the overall management of the BNF
Somewhat dissatisfied
Very Displeased
Somewhat pleased
Very Pleased In the past. How pleased have you been with the way the BNF in general was
managed? Somewhat Displeased
No confidence at
all
Quite a lota Quite a lotaHow much confidence do you have in BNF managers in general?
Not very much
Complete confidence
Not at all Completely To what extent does the BNF share your values about managing the forest?
aNot statistically different among trust groups at α = .05
Five questions were included that address respondents’ general attitudes towards the
US Forest Service. These questions were based on the work of Winter, Palucki, and Burkhardt
(1999). Tables 16a-e show trust cluster distribution for five statements addressing respondents’
attitudes towards the Forest Service in general. Statements were read to respondents, who then
rated their level of agreement with the statement on a scale of one to five, where one indicated
complete disagreement and five indicated complete agreement (anchors are shown in tables).
Respondents from the low trust group tended to respond with lower values (indicating higher
disagreement with the statements), while respondents from moderate and high trust groups
tended to respond with higher values (indicating greater agreement with the statements).
Members of the low trust group always had a higher percentage of responses in the complete
49—Monitoring Trust

disagreement category (1), while members of the high trust group always had a higher
percentage of moderate agreement responses (3 or 4). The high trust group never had a higher
proportion of responses in the complete agreement category (5). Numbers in bold indicate the
highest percentage for each trust group.
Table 16a-e: SVS USFS Trust Questions
Table 16a: The US Forest Service Supports My Views
Opposes my
views
Supports my
views 1 2 3 4 5 Total
Low Trust Group 47.4% 29.7% 16.4% 3.4% 3.1% 100.0% Moderate Trust Group 7.7% 23.1% 45.6% 20.9% 2.7% 100.0%
High Trust Group 2.5% 4.3% 31.3% 43.0% 18.9% 100.0% Total 17.1% 19.2% 33.1% 22.8% 7.8% 100.0%
Table 16b: The US Forest Service Has Similar Goals To Mine
Different
goals
Similar goals
1 2 3 4 5 Total Low Trust Group 45.7% 31.3% 15.5% 5.2% 2.4% 100.0%
Moderate Trust Group 8.2% 25.1% 40.3% 22.3% 4.1% 100.0% High Trust Group 2.4% 7.0% 26.8% 39.9% 23.8% 100.0%
Total 16.7% 21.2% 29.3% 23.1% 9.7% 100.0%
Table 16c: The US Forest Service Thinks Like Me
Does not think
like me
Thinks like me
1 2 3 4 5 Total Low Trust Group 65.5% 21.0% 9.3% 2.4% 1.7% 100.0%
Moderate Trust Group 22.4% 28.6% 36.6% 10.1% 2.3% 100.0% High Trust Group 8.3% 12.4% 36.2% 33.0% 10.2% 100.0%
Total 30.1% 21.6% 28.9% 14.9% 4.5% 100.0%
Table 16d: The US Forest Service Shares My Values
Does not share my
values
Shares my
values 1 2 3 4 5 Total
Low Trust Group 52.3% 27.7% 13.7% 4.2% 2.1% 100.0% Moderate Trust Group 11.5% 27.3% 36.7% 19.6% 4.8% 100.0%
High Trust Group 2.1% 10.0% 28.7% 36.3% 23.0% 100.0% Total 19.6% 21.9% 27.9% 20.7% 9.8% 100.0%
Monitoring Trust—50

Table 16e: The US Forest Service Is Like Me
Is not
like me Is like
me 1 2 3 4 5 Total
Low Trust Group 70.9% 18.6% 6.0% 1.4% 3.2% 100.0% Moderate Trust Group 27.6% 28.3% 32.3% 10.0% 1.9% 100.0%
High Trust Group 10.9% 14.5% 36.0% 26.7% 11.9% 100.0% Total 34.8% 21.4% 26.0% 12.6% 5.3% 100.0%
An additive scale of these items was created by summing all five of the five-point scales
resulting in a 20 point scale that ranged from 5 (low agreement) to 25 (high agreement).
Histograms for the additive trust measure for each trust group are shown on Figure 3a-c. The
solid line across the histograms approximate normal distributional curves, indicating
relational normality of scale response.
Figure 3a-c USFS Additive Trust Measure, Group Histograms
Figure 3a: USFS Additive Trust Measure, Low Trust Group Histograms
2524
2322
2120
1918
1716
1514
1312
1110
98
76
5
100
80
60
40
20
0
Std. Dev = 3.87 Mean = 8
N = 277.00
Score
51—Monitoring Trust

Figure 3b:USFS Additive Trust Measure, Moderate Trust Group Histogram
2524
2322
2120
1918
1716
1514
1312
1110
98
76
5
100
90
80
70
60
50
40
30
20
10
0
Std. Dev = 4.17 Mean = 13
N = 413.00
Figure 3c: USFS Additive Trust Measure, High Trust Group Histogram
2524
2322
2120
1918
1716
1514
1312
1110
98
76
5
100
90
80
70
60
50
40
30
20
10
0
Std. Dev = 4.39 Mean = 18
N = 266.00
Tables 17 a-b, show respondents’ general attitudes about the US government. Question items
were first used by Miller (1974).
Table 17a-b: Attitudes towards the Federal Government Table 17a: The Federal Government Wastes A Lot/Some/Not Much Money
Doesn't waste much
money
Wastes some
money
Wastes a lot of money Total
Low Trust 1.0% 10.3% 88.7% 100.0% Moderate Trust 1.4% 19.6% 78.9% 100.0% High Trust 4.6% 35.5% 59.9% 100.0% Total 2.2% 21.7% 76.0% 100.0%
Score
Score
Monitoring Trust—52

Table 17b: The Amount Of Time You Can Trust The Government In Washington To Do What Is Right
None of the time
All of
the time
1 2 3 4 5 Total Low Trust Group 36.6% a 34.2% 23.1% 3.7% 2.4% 100.0%
Moderate Trust Group 20.5% a 34.6% 34.0% 8.9% 2.1% 100.0% High Trust Group 15.2% 23.6% 40.9% 15.8% 4.5% 100.0%
Total 23.2% 31.2% 33.1% 9.6% 2.9% 100.0% a Not statistically different among trust groups at α = .05
All trust groups believed that the Federal government wastes a lot of money. However, as the
groups’ level of trust increased, the percent of respondents that believed the government
wasted a lot of money decreased, while the percent of those that believed the government
wastes some money increased. On a five-point scale, with one representing being able to trust
the federal government to do what is right none of the time, and five representing all of the
time, the majority in the low trust group responded with a 1 or a 2, while a plurality of high
trust group members responded with a 3. No trust group had a plurality that responded with
a 4 or 5.
Summary of characteristics of trust clusters. In general, those in the low trust cluster were more likely to be male, have lived in
Montana for around 32 years and in Ravalli County for about 25 years, and live in the
southern portion or Ravalli County. They tend to live in or on the edge of a forested area, have
worked for the US Forest Service, and have been very affected by smoke from fires in the
Bitterroot. They are likely to have previously been told to evacuate and may have refused.
Their business or employer likely lost money because of fires in Bitterroot Valley, and they
them selves are likely to have worked in a job that helped to fight fires in the Bitterroot Valley.
Low trusters are more likely to believe that people have too look out for themselves, that most
53—Monitoring Trust

people would try to take advantage of others, and that one can’t be too careful in dealing with
people. They tend to be very dissatisfied with the overall management of the Bitterroot
National Forest, and have been either very or somewhat displeased with how the Bitterroot
National Forest was managed in the past. They tend to have either little or no confidence in the
Bitterroot National Forest’s general management, and believe that the Bitterroot National
Forest does not share their values about managing the forest. They generally do not find
themselves to be in agreement with the actions of the US Forest Service in general, believe that
the Federal Government wastes a lot of money, and that the Federal Government cannot be
trusted to do what is right most of the time.
Members of the high trust group were more likely to be female, have lived in Montana
for about 24 years, in Ravalli County for about 17 years, and reside in the northern portion of
Ravalli County. They tend to live outside a forested area, and neither a member of their
household nor themselves have tended to work for the US Forest Service, and they have
tended not to have been affected by smoke from fires in the Bitterroot. High trusters are likely
to have never been told to evacuate, their employer or business did not lose money because of
Bitterroot Fires, and neither they themselves, nor one of their family members have tended to
work for the US Forest Service. They are more likely to believe that people try to be helpful
and fair, and that most people can be trusted. They tend to be very satisfied with the overall
management of the Bitterroot National Forest, have been very pleased with how it has been
managed in the past, and have either quite a lot or complete confidence in Bitterroot National
Forest Managers in general. They also tend to believe that the Bitterroot National Forest
completely shares their values about managing the forest. They tend to be in agreement with
the actions of the US Forest Service in general, and believe that the Federal government only
Monitoring Trust—54

wastes some, or doesn’t waste much money, and that the Federal Government can be trusted
to do what is right some, most, or all of the time.
55—Monitoring Trust

Discussion
Comparison with known data
Using the 2000 US Census as a baseline, this study reflected the sociodemographic
composition of Ravalli County fairly closely. The only notable discrepancies were in
education, where this survey appears to have under-sampled those with less than a high
school diploma by about 7%, over-sampled those with only a high school diploma or GED by
about 10%, and under-sampled those with only some college by about 9%.
Survey questions about respondents’ experience with fire which were asked in both this
study and the 2000 post fire assessment differed little between the surveys. The only
exceptions were that compared with this survey, in 2000 about 6% more respondents said that
they have lost hours at work because of fires in the Bitterroot than those in this study, and
about 4.5% more respondents in 2000 said that they worked more hours because of fires in the
Bitterroot.
Segmentation
Because low levels of trust are thought to negatively affect the acceptability of actions
by organizations or individuals (Putnam, 1995), residents of the Bitterroot Valley with low
levels of trust in the Bitterroot National Forest to manage forest fuels and fires are more likely
to raise concern with, or be opposed to management actions. Thus, discussion will focus most
on this segment of the population.
For some attitudes towards the Bitterroot National Forest, it is quite difficult—and
sometimes impossible—to have an effect on some respondents’ attitudes; for example,
Monitoring Trust—56

whether or not respondents are proud of how fires are managed on the Bitterroot, or how
pleased they are with how fires have been managed in the past. Attitudes such these can only
be affected over longer periods of time, though concerted organizational stability, honesty, and
transparency (Thomas, 1998).
Other attitudes, however, can be more easily affected over shorter periods of time.
These attitudes can be broken into two categories: those related to the perceived abilities of fire
managers on the Bitterroot National Forest, and those related to the relationships between fire
managers and the public. For the former category, in order to increase trust among the low
trust group, it is important for fire managers to focus on fostering confidence, competence,
effectiveness, and reliability (Thomas, 1998). All four of these items are interrelated and must
be managed for simultaneously in order to help increase the low trust group’s trust in the fire
and fuel management of the Bitterroot National Forest. Respondents distinguished strongly
between the competence of fire managers, and the competence of fire fighters, responding that
they had quite a lot of confidence in the latter, but not very much confidence in fire managers.
In order to change this, it must be ensured that the best possible management decisions are
successfully implemented, and result in the desired fire or fuel management effect time after
time.
In order to increase the low-trust group’s trust in Bitterroot National Forest fire
managers, it is important to ensure that managers pay attention to what the public thinks, that
they tell the truth, and manage fire and fuels fairly. Like the perceived ability of fire managers,
the relationship between fire managers and the public also needs to be looked at holistically.
Managers need to ensure that people are listened to and acknowledged, and that they act with
integrity and procedural justice.
57—Monitoring Trust

There is some indication that managers do meet some of the low-trust group’s needs in
these categories. Low-trust group respondents tended to somewhat agree that Bitterroot
National Forest Fire managers demonstrated a general attitude of compassion when fighting
fires, and that also respond to meet the need of local residents. But in order to increase trust
further, additional work must be focused in each of the categories.
Implications for Public Involvement
For the purpose of the landscape level fuel treatment project current being developed in
the Darby District of the Bitterroot National Forest, public involvement will be a key element
in obtaining community support. While the earlier 2000 post-fire assessment suggested some
community members lacked trust in the agency’s ability to accomplish this kind of project in a
way that considered the meanings local people attach to these places, now more accurate
understanding exists of the extent of this lack of trust. Across the Bitterroot Valley, this study
suggests about 32% of the population fits this description (low trust). But now, we also
understand that many of the characteristics associated with this group are outside of the
ability of National Forest managers to affect. The demographics, past work history and history
of being influenced by previous fires may only change with time. The agency, however, does
have the ability to search for common ground and better understand the values local people
place on areas considered for landscape level modification.
Recent and current research can be helpful in at least two ways. First, the BEMRP social
science team will work to develop a useable assessment tool to measure the basic trust
dimensions applied to this specific fuel treatment project. While past research has suggested
that those people most involved with the political and social life of a community are the most
Monitoring Trust—58

trusting, this study found low-trust members of the Bitterroot Valley more likely to live in the
community most adjacent to this fuel treatment project. We have no idea, but need to know,
how the distribution of those participating in public involvement, across the high-, moderate-,
and low-trust groups compares to that of the general population. This assessment would also
serve as a baseline measure, with options to compare distributions of pre-public involvement
participants with distributions at the time a preferred alternative is selected, and at the time
the decision is actually implemented.
Second, recent social science research in the Bitterroot Valley has been aimed at testing
methods to describe and map the meanings residents attach to the Bitterroot Front landscape.
At the broad, Bitterroot Front level, it was learned that residents attach meanings to places
they go and to places they do not go. They also attach meanings sometimes to the specific site
and sometimes to major drainages, lake basins or to other more broad aspects of the landscape.
Some meanings are very functional, related to personal enjoyment they receive from going
there or traditional or work related purposes, and others are more appreciative of natural
conditions, healthy animal populations, or watershed protection. An important part of the
public involvement process, in order to contribute to higher trust in the agency’s ability to
make decisions that consider these local values, is to present and discuss this recent research
with these community members. Additionally, continued effort is needed to obtain more site-
specific understanding of the relationship between those participating in the public
involvement and areas being considered for fuel treatments. Greater effort must also be made
to more accurately understand how alterative fuel treatment techniques, from the use of
wildland fire to the mechanical treatment of various intensities, will influence these
relationships. Currently, continued collaboration between research and management is
59—Monitoring Trust

planned to incorporate these research projects into efforts to make fuel management decisions
in the Bitterroot responsive to both national policy on reduction of fuel hazards and local
interest in accomplishment of fuel hazard reduction treatments in ways that are more sensitive
to, and even protective of, the meanings local communities attach to these public land
resources
Monitoring Trust—60

Works Cited
Bianco, W. T. (2000). The microfoundations of political trust: A proposal to the Russell Sage
Foundation. Retrieved 8/28/03 from http://polisci.la.psu.edu/faculty/Bianco/ sage_proposal_final.doc
Borrie, W. T., Christensen, N., Watson, A. E., Miller, T. A., & McCollum, D. W. (2002). Public
purpose marketing: A focus on the relationships between the public and public lands. Journal of Park and Recreation Administration. 2, 49-68.
Blackburn, S. (1998). Trust, Cooperation, and Human Psychology. In: V. Braithwaite, and M.
Levi (Eds.) Trust and Governance (pp. 29-45). New York: Russell Sage Foundation. Bureau of Business and Economic Research (BBER). (2001). Bitterroot National Forest Social
Survey. Missoula, Montana: University of Montana. Carnevale, D. G. (1995). Trustworthy government: Leadership and management strategies for
building high performance. San Francisco: Jossey-Bass Publishers. Citrin, J., Muste C. (1999). Trust in Government. In: J.P. Robinson, P.R. Shaver, and L.S.
Wrightsman (Eds.) Measures of Political Attitudes (pp 465-532). San Diego: Academic Press.
Davis, J. A. (1978). General social surveys, 1972-1978: Cumulative codebook. Chicago: National
Opinion Research Center.
Devlin, S. (2003, November 11). Bosworth preps forest bill. The Missoulian. Retrieved November 25, 2003 from http://www.missoulian.com
Earle, T. C., Cvetkovich, G. T. (1995). Social trust: Toward a cosmopolitan society. West Port, CT:
Praeger. Fukuyama, F. (1995). Trust: The social virtues and the creation of prosperity. New York: Free Press. Ganesan, S., & Hess, R. (1997). Dimensions and levels of trust: Implications for commitment to
a relationship. Marketing Letters, 8, 439-448. Greenberg, M.R., & Williams. B. (1999). Geographical dimensions and correlates of trust. Risk
Analysis, 19, 159-169. Hardin, R. (2003). Distrust. New York: Russell Sage Foundation. Manuscript submitted for
publication available at http://www.russellsage.org/publications/working_papers /defense.doc. Last visited 11/11/03.
61—Monitoring Trust

Hardin, R. (2000). The public trust. In S. J. Pharr & R. D. Putnam (Eds.), Disaffected democracies
(pp. 31-51). Princeton: Princeton University Press. Hardin, R. (1999). Do We Want Trust In Government? In Warren ME (Ed.), Democracy and
Trust. Cambridge: Cambridge University Press Hardin, R. (1998). Trust in Government. In Braithwaite V, and Levi M (Ed.), Trust and
Governance. New York: Russell Sage Foundation. Hardin, R. (1993). The street-level epistemology of trust. Politics and Society, 21, 505-529.
Institute for Social Research. (1999). 1999-2000 World Values Survey Questionnaire. Retrieved
July 7, 2003, from http://wvs.isr.umich.edu/wvs2000.doc/ Johnson, B. B., (1999). Exploring dimensionality in the orgins of hazard-related trust. Jounrnal
of Risk Research, 2, 325-354. Kemmis, D. (1990). Community and the politics of place. Norman, OK: University of Oklahoma
Press. Kish, L. (1949). A procedure for objective respondent selection within the household. Journal of
the American Statistical Association. 44, 380-387. Kramer, R. M., & Tyler T. R. (1996). Trust in organizations: Frontiers of theory and research.
Thousand Oaks: Sage Publications. Levi, M. (1998). A state of trust. In V. Braithwaite, & M. Levi (Eds.), Trust and governance (pp.
77-101). New York: Russell Sage Foundation. Levi, M. (2000). When Good Defenses Make Good Neighbors. In: C. Menard (Ed.), Institutions,
Contracts, and Organizations: Perspectives from New Institutional Economics, (pp. 137-157). Chichester, U.K.: Edward Elgar.
Madison, J. (1961). Federalist Paper No. 51. In: Hamilton, A., Madison, J., & Jay, J. (C. Rossiter,
Ed.), The Federalist Papers. New York: Mentor. (Original work published 1877-1878) Mason, W. M., House, J. S., & Martin, S. S. (1985). On the dimensions of political alienation in
America. Sociological Methodology, 15, 111-151. Machlis, G. E., Kaplan, A. B., Tuler, S. P., Bagby, K. A., & McKendry, J. E. (2002). Burning
questions: A social science research plan for federal wildland fire management. Report to the National Wildfire Coordinating Group. University of Idaho. 253p.
Monitoring Trust—62
Miller, A.H. (1974). Political issues and trust in government: 1964-1970. The American Political Science Review, 68, 951-972.
Muller, E. N., Jukam, T.O. (1977). On the meaning of political support. The American Political
Science Reviews, 71, 1561-1595. Putnam, R. D. (2000). Bowling alone: The collapse and revival of American community. New York:
Simon and Schuster. Robinson, S. L., Kraatz, M.S., & D.M. Rousseau. (1994). Changing obligations & the
psychological contract. The Academy of Management Journal, 37, 137-152. Rousseau, D. M., Sitkin, S. B., Burt, R. S., Camerer, C. (1998). Not so different after all: A cross
discipline view of trust. Academy of Management Review., 23, 393-404. Selnes, J. and Sallis, J. (2003). Promoting relationship learning. Journal of Marketing, 67, 80-95. Smith, T. W. (1981). Can we have confidence in confidence? Revisited. In D. F. Johnson (Ed.),
Measurement of subjective phenomena (pp119-189). Washington, DC: US Bureau of the Census.
Sudman, S., Bradburn, N., & Schwartz, N. (1996) Thinking about the answers: The application of
cognitive processes to survey methodology. San Francisco, CA: Jossey-Bass. Thomas, C. W. (1998). Maintaining and restoring public trust in government agencies and their
employees. Administration and Society, 30, 166-194. Tyler, T. R., & Degoey, P. (1995). Collective restraint in social dilemmas: Procedural justice and
social identification effects on support for authorities. Journal of Personality and Social Psychology, 69, 482-497.
Ulbig S. G., & Alford J. R. (2001). Can we trust the NES trust measure? Retrieved 11/26/03 from
http://courses.smsu.edu/sgu646f/conf/MPSA2001.pdf Winter, P. L., Palucki, L. J., & Burkhardt, R. L.(1999). Anticipated responses to a fee program:
The key is trust. Journal of Leisure Research, 3, 207-226.
63—Monitoring Trust

Appendix A: Survey Instrument
Monitoring Trust—64

Bitterroot National Forest Trust Study Form Approved: Final Questionnaire OMB No: 0596-0108 10 May 2004 INTRODUCTION Hello, my name is [INSERT YOUR FIRST AND LASTNAME]. I'm calling from The University of Montana (here) in Missoula. We're doing a survey to find out what residents of Ravalli County think about forest fire management in the Bitterroot National Forest on behalf of researchers at the University of Montana. First, though, I need to be sure I have dialed the right number. Is this 999-9999? In order to do the survey, I have to follow a specific selection procedure. For this survey only people aged 18 and older are to be interviewed. So of all the people living in your household, including yourself, how many are 18 years of age and older? ENTER NUMBER And how many of these persons are female? ENTER NUMBER According to the selection procedure, I need to interview ______. Is he/she available? Or is that you? READ THE FOLLOWING CONFIDENTIALITY STATEMENT TO ALL RESPONDENTS: Before we start, I want to assure you that this interview is completely confidential and voluntary. If we should come to a question you don't want to answer; just let me know and we'll go on to the next question. This interview should take about 12 minutes. I1. How old were you on your last birthday?
Years __________ IF UNDER THE AGE OF 18 TERMINATE THE INTERVIEW.
65—Monitoring Trust

PERSONAL EXPERIENCE WITH FIRE IN THE BITTERROOT The first group of questions asks about how you, personally, have been affected by fires in the Bitterroot. A1. How much have you, personally, been affected by smoke from fires in the Bitterroot? Would you say you were not at all affected, somewhat affected, or very affected by smoke from fires in the Bitterroot?
Very 3 Somewhat 2 Not at all 1 DK 8
A2. During fires in the Bitterroot, have you, personally ever been: Yes No DK
a. Evacuated from your home 1 0 8 b. Told to prepare to evacuate, but not required to 1 0 8 c. Told to evacuate but chose not to 1 0 8
A3. Some people have lost work hours or found that their businesses lost money due to fires in the Bitterroot. Other people worked more hours or found that their businesses were busier. Which of the following has ever applied to you, personally, as a result of fires in the Bitterroot?
Yes No DK a. I lost hours at work 1 0 8 b. I worked more hours 1 0 8 c. My business or employer lost money 1 0 8 d. My business or employer made more money than usual 1 0 8
Monitoring Trust—66

Bitterroot National Forest Trust Study Form Approved: Final Questionnaire OMB No: 0596-0108 10 May 2004 A4. Have you, yourself, ever worked in a job that helped to fight fires in the Bitterroot? Examples of these jobs include working on a fire crew, fire camp support staff, local law enforcement, or local emergency services.
Yes 1 No 0 DK 8
FIRE MANAGEMENT IN THE BNF The next group of questions asks about fire management in the Bitterroot National Forest. C1. Generally speaking how satisfied are you, if at all, with the way the Bitterroot National Forest staff deals with fires?
Very satisfied 4 Somewhat satisfied 3 Somewhat dissatisfied 2 Very dissatisfied 1 DK 8 C2. Generally speaking how satisfied are you, if at all, with the way the Bitterroot National Forest staff deals with forest fuels? IF NECESSARY, FOREST FUELS ARE LIVING OR DEAD PLANTS THAT ARE FOUND IN WOODED AREAS.
Very satisfied 4 Somewhat satisfied 3 Somewhat dissatisfied 2 Very dissatisfied 1 DK 8 C3. Considering that the Bitterroot National Forest is managed on behalf of everyone, how satisfied are you, if at all, with fire management in the Bitterroot National Forest?
Very satisfied 4 Somewhat satisfied 3 Somewhat dissatisfied 2 Very dissatisfied 1 DK 8
67—Monitoring Trust

C4. In the past how pleased, if at all, have you been with the way fires in the Bitterroot National Forest were managed?
Very pleased 4 Somewhat pleased 3 Somewhat displeased 2 Very displeased 1 DK 8
C5. How much, if any, confidence do you have in wildland fire fighters in general? Do you have?
Complete confidence 4 Quite a lot of confidence 3 Not very much confidence 2 No confidence at all 1 DK (9) 8
C6. What about fire managers in the Bitterroot National Forest? Do you have? IF NECESSARY, FIRE MANAGERS ARE TRAINED SPECIALISTS ENGAGED IN FIRE MANAGEMENT. EXAMPLES INCLUDE: STATE OR FEDERAL FIRE SPECIALISTS, INCIDENT COMMAND TEAMS, OR FOREST PLANNERS.
Complete confidence 4 Quite a lot of confidence 3 Not very much confidence 2 No confidence at all 1 DK 8
C7. Based on your observations and experiences what portion, if any, of the people who manage forest fires in the Bitterroot National Forest know what they are doing?
All 4 Most 3 Less than half 2 None 1
DK 8
Monitoring Trust—68

Bitterroot National Forest Trust Study Form Approved: Final Questionnaire OMB No: 0596-0108 10 May 2004 C8. In your community, how would you rate the effectiveness of Bitterroot National Forest fire managers in dealing with fire-related issues?
Excellent 4 Good 3 Fair 2 Poor 1 DK 8
C9. How sure, if at all, have you felt that forest fires threatening your community or your property would be put out in time? Very sure 4 Somewhat sure 3 Somewhat unsure 2 Very unsure 1 DK 8 C10. How much attention, if any, have Bitterroot National Forest managers paid to what people think when managers decide what to do about forest fires?
A good deal of attention 3 Some attention 2 Not much attention 1 DK 8
C11. When managers of the Bitterroot National Forest speak on television, radio, in newspapers, or at public meetings about forest fires, how often, if at all, do they tell the truth?
Always 4 Mostly 3 Less than half of the time 2 Never 1 DK 8
69—Monitoring Trust
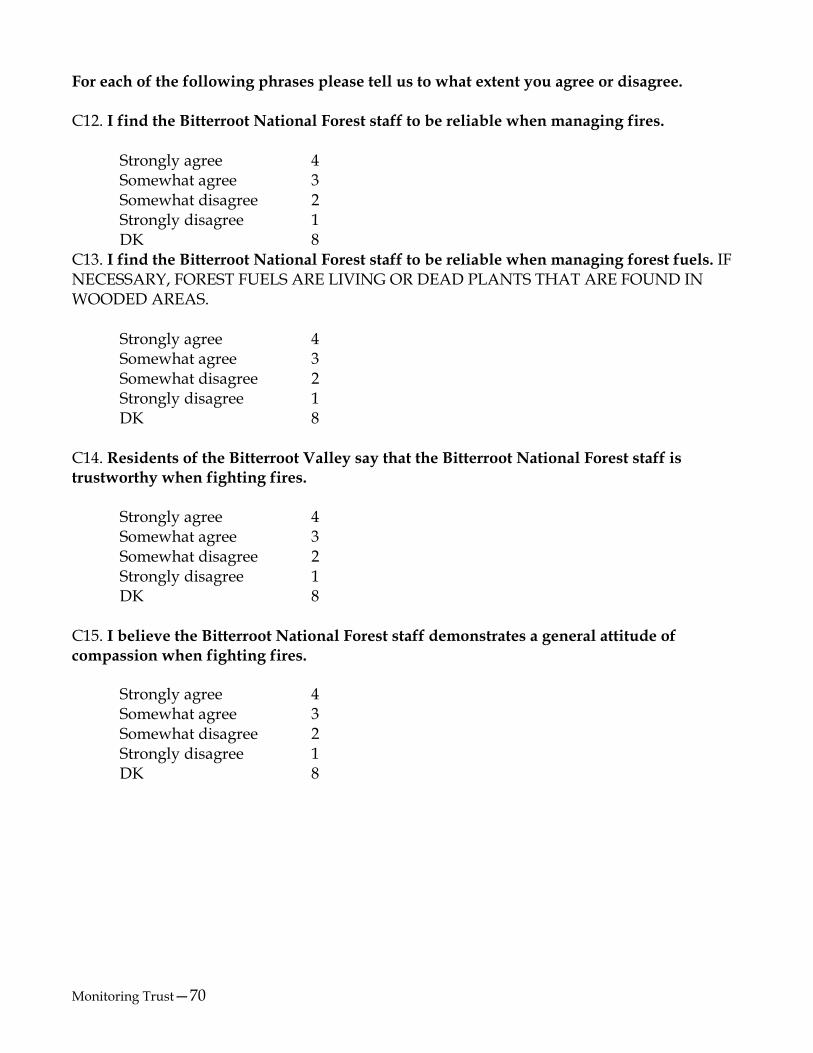
For each of the following phrases please tell us to what extent you agree or disagree. C12. I find the Bitterroot National Forest staff to be reliable when managing fires.
Strongly agree 4 Somewhat agree 3 Somewhat disagree 2 Strongly disagree 1 DK 8
C13. I find the Bitterroot National Forest staff to be reliable when managing forest fuels. IF NECESSARY, FOREST FUELS ARE LIVING OR DEAD PLANTS THAT ARE FOUND IN WOODED AREAS.
Strongly agree 4 Somewhat agree 3 Somewhat disagree 2 Strongly disagree 1 DK 8
C14. Residents of the Bitterroot Valley say that the Bitterroot National Forest staff is trustworthy when fighting fires.
Strongly agree 4 Somewhat agree 3 Somewhat disagree 2 Strongly disagree 1 DK 8
C15. I believe the Bitterroot National Forest staff demonstrates a general attitude of compassion when fighting fires.
Strongly agree 4 Somewhat agree 3 Somewhat disagree 2 Strongly disagree 1 DK 8
Monitoring Trust—70

Bitterroot National Forest Trust Study Form Approved: Final Questionnaire OMB No: 0596-0108 10 May 2004 C16. Managers on the Bitterroot National Forest respond to the needs of local residents when fighting fires.
Strongly agree 4 Somewhat agree 3 Somewhat disagree 2 Strongly disagree 1 DK 8
C17. When fighting fires, do you think that the Bitterroot National Forest staff generally:
Wastes a lot of the money 3 Wastes some money 2 Doesn’t waste very much money 1 DK 8
C18. Would you say that you are proud of the way fire is managed on the Bitterroot National Forest, or that you can’t find too many things about the fire management to be proud of? IF NECESSARY, PRIDE IN A FOOTBALL TEAM OR PRIDE IN ONE’S COUNTRY.
Proud of fire management 1 Can’t find much too many things 0 DK 8
C19. How often, if at all, do you think fires on the Bitterroot National Forest are managed according to a fair process?
Always 4 Mostly 3 Less than half of the time 2 Never 1 DK 8
71—Monitoring Trust

C20. To what extent, if at all, does the Bitterroot National Forest share your values about fire management? Please rate the extent to which the Bitterroot National Forest shares your values on a scale from one to five where one is not at all and five is completely. Completely 5 4 3 2 Not at all 1 DK 8 C21. To what extent, if at all, do you agree or disagree with the following statement: Science can settle differences of opinion about the risks and benefits from forest fires?
Strongly agree 4 Somewhat agree 3 Somewhat disagree 2 Strongly disagree 1 DK 8
Monitoring Trust—72

Bitterroot National Forest Trust Study Form Approved: Final Questionnaire OMB No: 0596-0108 10 May 2004 GENERAL MANAGEMENT OF THE BITTERROOT NATIONAL FOREST The next section changes from asking about fire management to focusing on the Bitterroot National Forest’s general management practices. D1. How satisfied are you, if at all, with the overall management of the Bitterroot National Forest?
Very satisfied 4 Somewhat satisfied 3 Somewhat dissatisfied 2 Very dissatisfied 1 DK 8 D2. In the past how pleased, if at all, have you been with the way the Bitterroot National Forest in general was managed?
Very pleased 4 Somewhat pleased 3 Somewhat displeased 2 Very displeased 1 DK 8
D3. How much, if any, confidence do you have in managers of the Bitterroot National forest in general? Do you have?
Complete confidence 4 Quite a lot of confidence 3 Not very much confidence 2 No confidence at all 1 DK (9) 8
D4. To what extent, if at all, does the Bitterroot National Forest share your values about managing the Bitterroot National Forest in general? Please rate the extent to which the Bitterroot National Forest shares your values on a scale from one to five where one is not at all and five is completely. Completely 5 4 3 2 Not at all 1 DK 8
73—Monitoring Trust

GENERAL MANAGEMENT OF THE USDA FOREST SERVICE The next group of questions asks about the USDA Forest Service and its general management practices. Please rate each of the following phrases on a scale of 1 to 5, where five means the phrase represents what you believe and one means that the phrase does not. The USDA Forest Service: E1. Supports my views.
Supports my views 5 4 3 2 Opposes my views 1 DK 8
E2. Has similar goals to mine.
Has similar goals to mine 5 4 3 2 Has different goals than mine 1 DK 8
E3. Thinks like me.
Thinks like me 5 4 3 2 Does not think like me 1
DK 8
Monitoring Trust—74

Bitterroot National Forest Trust Study Form Approved: Final Questionnaire OMB No: 0596-0108 10 May 2004 E4. Shares my values. Shares my values 5 4 3 2 Does not share my values 1 DK 8 E5. Is like me. Is like me 5 4 3 2 Is not like me 1 DK GENERAL MANAGEMENT OF THE FEDERAL GOVERNMENT The next few questions ask about the general management of the Federal Government. F1. Now what about the government in general? Do you think the federal government:
Wastes a lot of the money 3 Wastes some money 2 Doesn’t waste very much money 1 DK 8
F2. How much of the time, if at all, do you think you can trust the government in Washington to do what is right? Please rate how much of the time on a scale from 1 to 5 where one is none of the time and five is all of the time.
All of the time 5 4 3 2
None of the time 1 DK 8 [General Trust]
75—Monitoring Trust

TRUSTWORTHINESS OF PEOPLE IN GENERAL For the next group of questions we are shifting focus from asking about the federal government to asking about the trustworthiness of people in general. B1. Would you say that most of the time people try to be helpful, or that they are mostly just looking out for themselves? Try to be helpful 1 Just look out for themselves 0 DEPENDS 2 DK 8 B2. Do you think most people would try to take advantage of you if they got a chance, or would they try to be fair?
Would take advantage of you 1 Would try to be fair 0 DEPENDS 2 DK 8 B3. Generally speaking, would you say that most people can be trusted, or that you can’t be too careful in dealing with people? Most people can be trusted 1 Can’t be too careful 0 OTHER, DEPENDS 2 DK 8
Monitoring Trust—76

Bitterroot National Forest Trust Study Form Approved: Final Questionnaire OMB No: 0596-0108 10 May 2004 DEMOGRAPHICS These last few questions are for classification purposes only. G1. All together, how many years have you lived in Ravalli County?
Years __________ G2. Is this location in Ravalli County your primary residence? Yes 1 No 0 G3. All together, how many years have you lived in Montana?
Years __________ G4. What is the zip code of your primary residence?
Zip Code __________ G5. Do you live? In town 3 On the edge of town 2 Outside of town 1 DK 8 G6. Is the place you live? In a forested area 3 On the edge of a forested area 2 Outside a forested area 1 DK 8 G7. Do you live within one half mile of the boundary of the Bitterroot National Forest? READ ALL RESPONSE OPTIONS INCLUDING “NOT SURE.” Yes 1 No 0 Not sure 8
77—Monitoring Trust

G8. What is the highest degree or level of school you have completed? Grades 1-8 (elementary) 1 Grades 9-12 (some high school
but no diploma) 2 Grade 12 or GED (high school graduate) 3
College 1 year to 4 years (Some college or technical school, but no degree) 4 College 1 to 4 years (Associate degree) 5 College 4 years or more (College graduate, BA, MB, JD, MD, PhD) 6
G9. Which of the following categories best describes your total household income from all sources in the year 2003, before taxes and other deductions? This includes money from jobs, net income from business, farm or rent, pensions, dividends, interest, social security payments, and other money income received by members of this household who are 15 years of age or older. If you are self-employed or own your own business, please report your net income. 100,000 dollars or more 1 Between 50,000 and 100,000 dollars 2 Between 50,000 and 75,000 dollars 3 Between 35,000 and 50,000 dollars 4 Between 20,000 and 35,000 dollars 5 Between 15,000 and 20,000 dollars 6 Between 10,000 and 15,000 dollars 7 Under 10,000 dollars 8 DK 98 Refused 99
Monitoring Trust—78

Bitterroot National Forest Trust Study Form Approved: Final Questionnaire OMB No: 0596-0108 10 May 2004 G10. Besides this phone number, do you have other telephone numbers in your household, such as fax or data lines, a children’s or business line? Do not include cell phones.
Yes 1 GO TO G11 No 0 SKIP TO G12 This phone number is not the respondent’s 3 SKIP TO G12 DK 8 SKIP TO G12
G11. How many of these telephone numbers are connected to phones that can be answered by a person?
______ ______ RECORD EXACT NUMBER (RECORD “UNSURE/DK” AS 88)
G12. Have you or other members of your household ever worked for the USDA Forest Service? Yes 1 No 0 Others in Household 2 G13a. Could you tell me whether or not you are a member of an organization that has as one of its interests the management of the Bitterroot National Forest? Yes 1 Go to G13b No 0 Skip to G14 DK 8 Skip to G14 G13b. What is the name of that organization? G14. Do you have any comments? G15. That is all of the questions we have. Thank you very much for your assistance! G16. After interview record respondent’s gender 0 Female 1 Male
79—Monitoring Trust
Appendix B: Survey Results and Analysis
Monitoring Trust—80


123
Appendix C: Trust Group Crosstabulation